Sedona, AZ
Sedona Map
Sedona Overview
9,739
TOTAL POPULATION
4,530
MALE POPULATION
5,209
FEMALE POPULATION
86.96
MALES / 100 FEMALES
114.99
FEMALES / 100 MALES
58.7
MEDIAN AGE
2.5
AVG FAMILY SIZE
2.0
AVG HOUSEHOLD SIZE
$49,801
PER CAPITA INCOME
$83,655
AVG FAMILY INCOME
$62,901
AVG HOUSEHOLD INCOME
0.1%
WAGE / INCOME GAP [ % ]
99.9¢/ $1
WAGE / INCOME GAP [ $ ]
0.48
INEQUALITY / GINI INDEX
4,612
LABOR FORCE [ PEOPLE ]
52.5%
PERCENT IN LABOR FORCE
7.7%
UNEMPLOYMENT RATE
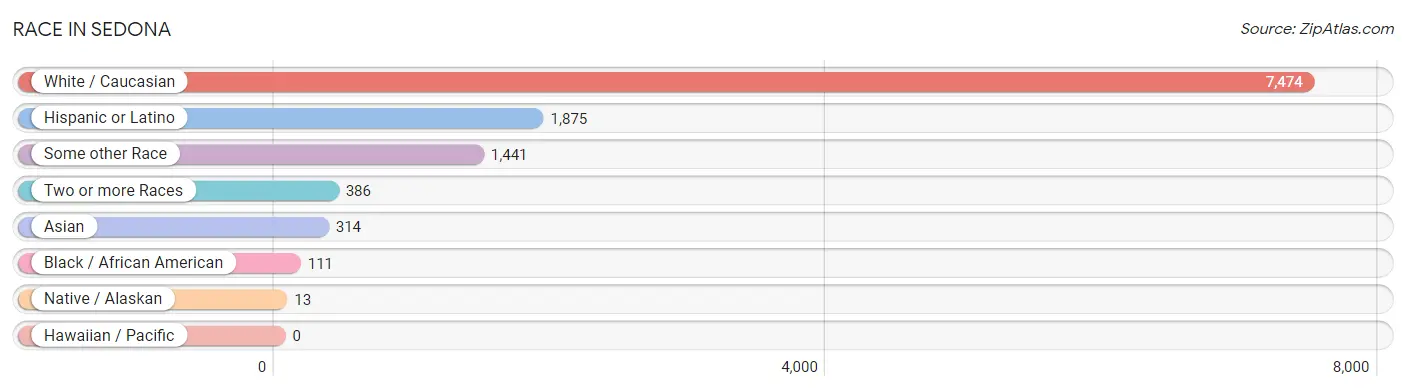
Race in Sedona
The most populous races in Sedona are White / Caucasian (7,474 | 76.7%), Hispanic or Latino (1,875 | 19.3%), and Some other Race (1,441 | 14.8%).
| Race | # Population | % Population |
| Asian | 314 | 3.2% |
| Black / African American | 111 | 1.1% |
| Hawaiian / Pacific | 0 | 0.0% |
| Hispanic or Latino | 1,875 | 19.3% |
| Native / Alaskan | 13 | 0.1% |
| White / Caucasian | 7,474 | 76.7% |
| Two or more Races | 386 | 4.0% |
| Some other Race | 1,441 | 14.8% |
| Total | 9,739 | 100.0% |
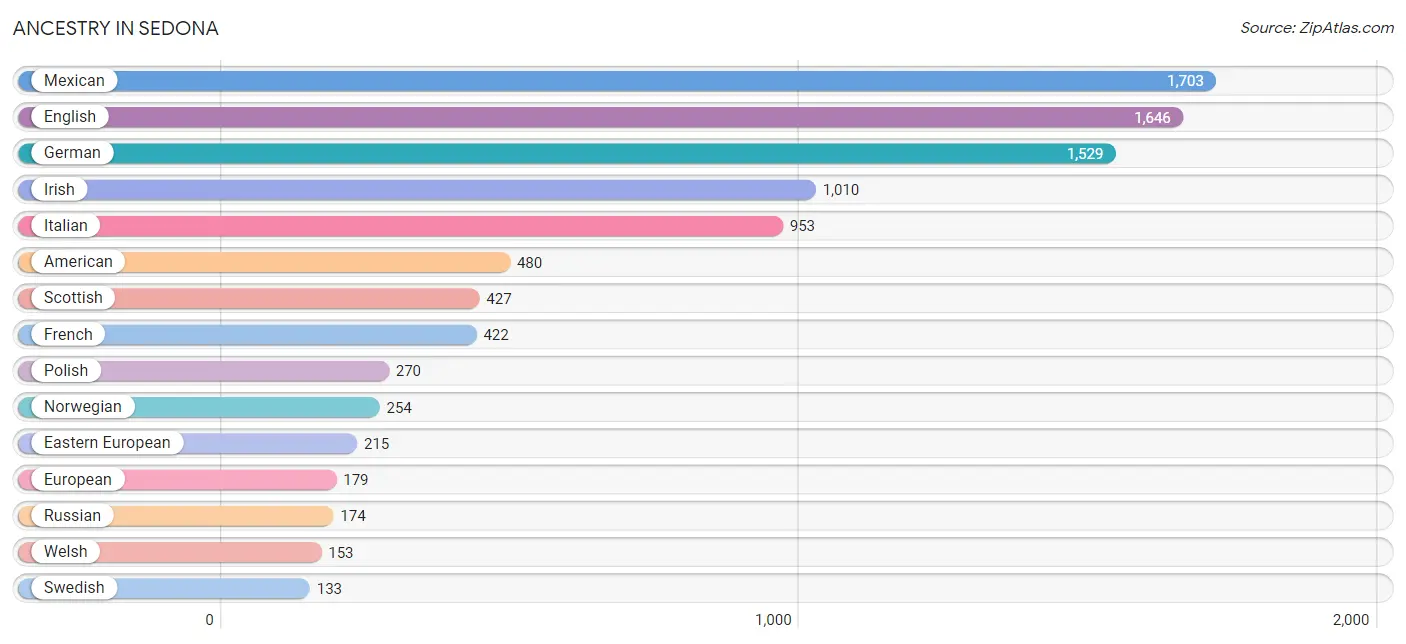
Ancestry in Sedona
The most populous ancestries reported in Sedona are Mexican (1,703 | 17.5%), English (1,646 | 16.9%), German (1,529 | 15.7%), Irish (1,010 | 10.4%), and Italian (953 | 9.8%), together accounting for 70.3% of all Sedona residents.
| Ancestry | # Population | % Population |
| African | 4 | 0.0% |
| American | 480 | 4.9% |
| Arab | 36 | 0.4% |
| Armenian | 25 | 0.3% |
| Austrian | 88 | 0.9% |
| Basque | 5 | 0.1% |
| Belgian | 21 | 0.2% |
| British | 75 | 0.8% |
| Canadian | 69 | 0.7% |
| Cherokee | 40 | 0.4% |
| Choctaw | 7 | 0.1% |
| Colombian | 30 | 0.3% |
| Cuban | 35 | 0.4% |
| Czech | 56 | 0.6% |
| Danish | 76 | 0.8% |
| Dutch | 72 | 0.7% |
| Eastern European | 215 | 2.2% |
| English | 1,646 | 16.9% |
| European | 179 | 1.8% |
| Filipino | 1 | 0.0% |
| Finnish | 13 | 0.1% |
| French | 422 | 4.3% |
| French Canadian | 110 | 1.1% |
| German | 1,529 | 15.7% |
| Greek | 110 | 1.1% |
| Hungarian | 91 | 0.9% |
| Icelander | 1 | 0.0% |
| Indian (Asian) | 123 | 1.3% |
| Irish | 1,010 | 10.4% |
| Italian | 953 | 9.8% |
| Japanese | 92 | 0.9% |
| Korean | 42 | 0.4% |
| Laotian | 10 | 0.1% |
| Lebanese | 36 | 0.4% |
| Lithuanian | 83 | 0.9% |
| Mexican | 1,703 | 17.5% |
| Northern European | 76 | 0.8% |
| Norwegian | 254 | 2.6% |
| Pakistani | 36 | 0.4% |
| Peruvian | 6 | 0.1% |
| Polish | 270 | 2.8% |
| Portuguese | 10 | 0.1% |
| Puerto Rican | 71 | 0.7% |
| Romanian | 11 | 0.1% |
| Russian | 174 | 1.8% |
| Scandinavian | 12 | 0.1% |
| Scotch-Irish | 99 | 1.0% |
| Scottish | 427 | 4.4% |
| Slavic | 1 | 0.0% |
| Slovene | 24 | 0.3% |
| South African | 8 | 0.1% |
| South American | 40 | 0.4% |
| Spaniard | 4 | 0.0% |
| Subsaharan African | 12 | 0.1% |
| Swedish | 133 | 1.4% |
| Swiss | 30 | 0.3% |
| Ukrainian | 21 | 0.2% |
| Venezuelan | 4 | 0.0% |
| Welsh | 153 | 1.6% |
| West Indian | 4 | 0.0% |
| Yaqui | 16 | 0.2% |
| Yugoslavian | 7 | 0.1% | View All 62 Rows |
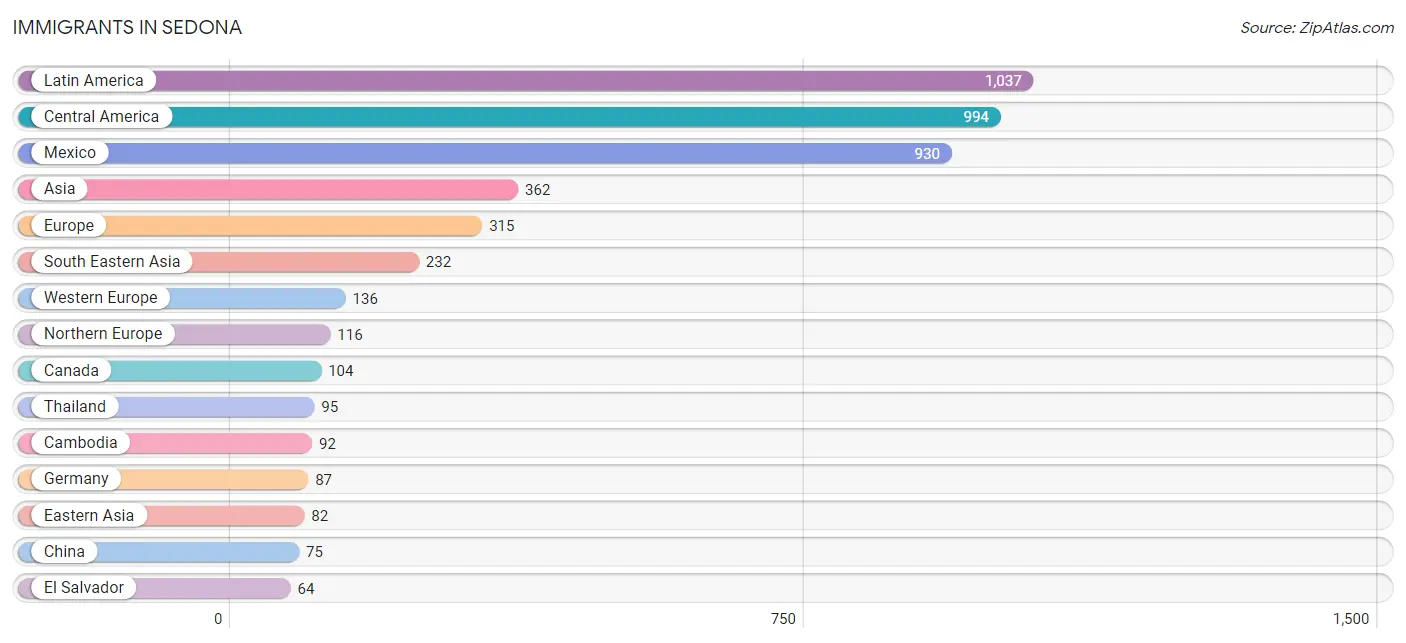
Immigrants in Sedona
The most numerous immigrant groups reported in Sedona came from Latin America (1,037 | 10.6%), Central America (994 | 10.2%), Mexico (930 | 9.6%), Asia (362 | 3.7%), and Europe (315 | 3.2%), together accounting for 37.4% of all Sedona residents.
| Immigration Origin | # Population | % Population |
| Africa | 46 | 0.5% |
| Asia | 362 | 3.7% |
| Australia | 13 | 0.1% |
| Austria | 11 | 0.1% |
| Bahamas | 11 | 0.1% |
| Brazil | 12 | 0.1% |
| Cambodia | 92 | 0.9% |
| Canada | 104 | 1.1% |
| Caribbean | 11 | 0.1% |
| Central America | 994 | 10.2% |
| China | 75 | 0.8% |
| Colombia | 7 | 0.1% |
| Denmark | 20 | 0.2% |
| Eastern Asia | 82 | 0.8% |
| Eastern Europe | 35 | 0.4% |
| El Salvador | 64 | 0.7% |
| England | 7 | 0.1% |
| Europe | 315 | 3.2% |
| France | 15 | 0.2% |
| Germany | 87 | 0.9% |
| Greece | 8 | 0.1% |
| Hungary | 12 | 0.1% |
| Indonesia | 10 | 0.1% |
| Iran | 6 | 0.1% |
| Italy | 15 | 0.2% |
| Japan | 7 | 0.1% |
| Latin America | 1,037 | 10.6% |
| Mexico | 930 | 9.6% |
| Nepal | 27 | 0.3% |
| Netherlands | 12 | 0.1% |
| Northern Europe | 116 | 1.2% |
| Norway | 10 | 0.1% |
| Oceania | 13 | 0.1% |
| Peru | 9 | 0.1% |
| Philippines | 35 | 0.4% |
| Russia | 10 | 0.1% |
| Scotland | 10 | 0.1% |
| South Africa | 46 | 0.5% |
| South America | 32 | 0.3% |
| South Central Asia | 34 | 0.4% |
| South Eastern Asia | 232 | 2.4% |
| Southern Europe | 28 | 0.3% |
| Spain | 5 | 0.1% |
| Switzerland | 11 | 0.1% |
| Syria | 14 | 0.1% |
| Taiwan | 11 | 0.1% |
| Thailand | 95 | 1.0% |
| Venezuela | 4 | 0.0% |
| Western Asia | 14 | 0.1% |
| Western Europe | 136 | 1.4% | View All 50 Rows |
Sex and Age in Sedona
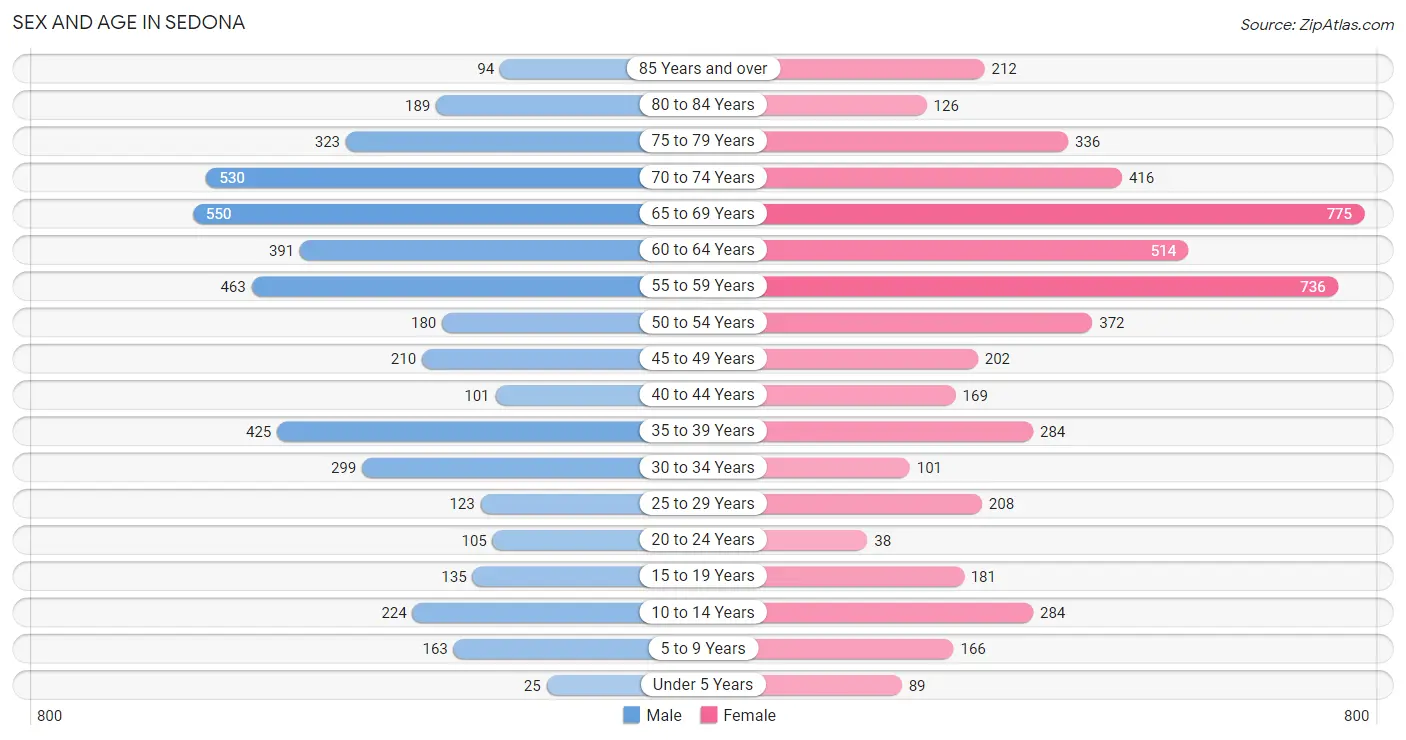
Sex and Age in Sedona
The most populous age groups in Sedona are 65 to 69 Years (550 | 12.1%) for men and 65 to 69 Years (775 | 14.9%) for women.
| Age Bracket | Male | Female |
| Under 5 Years | 25 (0.5%) | 89 (1.7%) |
| 5 to 9 Years | 163 (3.6%) | 166 (3.2%) |
| 10 to 14 Years | 224 (4.9%) | 284 (5.4%) |
| 15 to 19 Years | 135 (3.0%) | 181 (3.5%) |
| 20 to 24 Years | 105 (2.3%) | 38 (0.7%) |
| 25 to 29 Years | 123 (2.7%) | 208 (4.0%) |
| 30 to 34 Years | 299 (6.6%) | 101 (1.9%) |
| 35 to 39 Years | 425 (9.4%) | 284 (5.4%) |
| 40 to 44 Years | 101 (2.2%) | 169 (3.2%) |
| 45 to 49 Years | 210 (4.6%) | 202 (3.9%) |
| 50 to 54 Years | 180 (4.0%) | 372 (7.1%) |
| 55 to 59 Years | 463 (10.2%) | 736 (14.1%) |
| 60 to 64 Years | 391 (8.6%) | 514 (9.9%) |
| 65 to 69 Years | 550 (12.1%) | 775 (14.9%) |
| 70 to 74 Years | 530 (11.7%) | 416 (8.0%) |
| 75 to 79 Years | 323 (7.1%) | 336 (6.5%) |
| 80 to 84 Years | 189 (4.2%) | 126 (2.4%) |
| 85 Years and over | 94 (2.1%) | 212 (4.1%) |
| Total | 4,530 (100.0%) | 5,209 (100.0%) |
Families and Households in Sedona
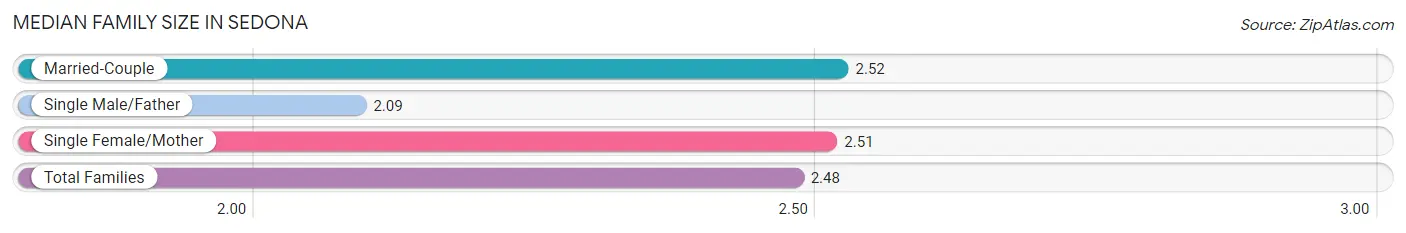
Median Family Size in Sedona
The median family size in Sedona is 2.48 persons per family, with married-couple families (2,320 | 79.1%) accounting for the largest median family size of 2.52 persons per family. On the other hand, single male/father families (286 | 9.8%) represent the smallest median family size with 2.09 persons per family.
| Family Type | # Families | Family Size |
| Married-Couple | 2,320 (79.1%) | 2.52 |
| Single Male/Father | 286 (9.8%) | 2.09 |
| Single Female/Mother | 327 (11.2%) | 2.51 |
| Total Families | 2,933 (100.0%) | 2.48 |
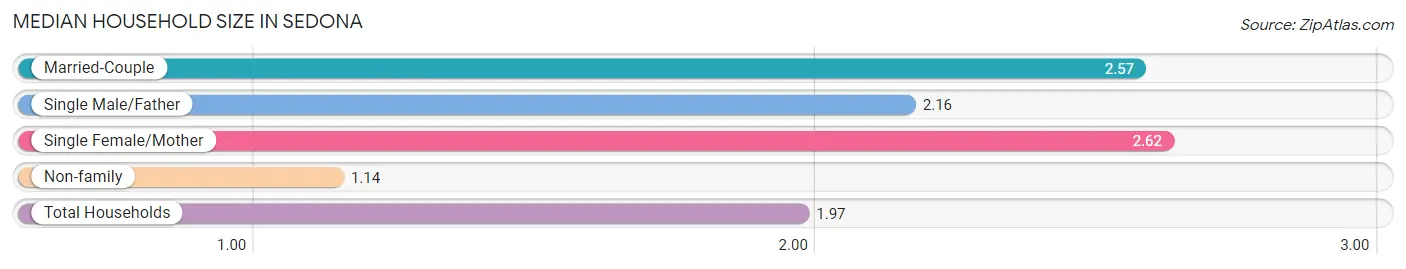
Median Household Size in Sedona
The median household size in Sedona is 1.97 persons per household, with single female/mother households (327 | 6.6%) accounting for the largest median household size of 2.62 persons per household. non-family households (2,003 | 40.6%) represent the smallest median household size with 1.14 persons per household.
| Household Type | # Households | Household Size |
| Married-Couple | 2,320 (47.0%) | 2.57 |
| Single Male/Father | 286 (5.8%) | 2.16 |
| Single Female/Mother | 327 (6.6%) | 2.62 |
| Non-family | 2,003 (40.6%) | 1.14 |
| Total Households | 4,936 (100.0%) | 1.97 |
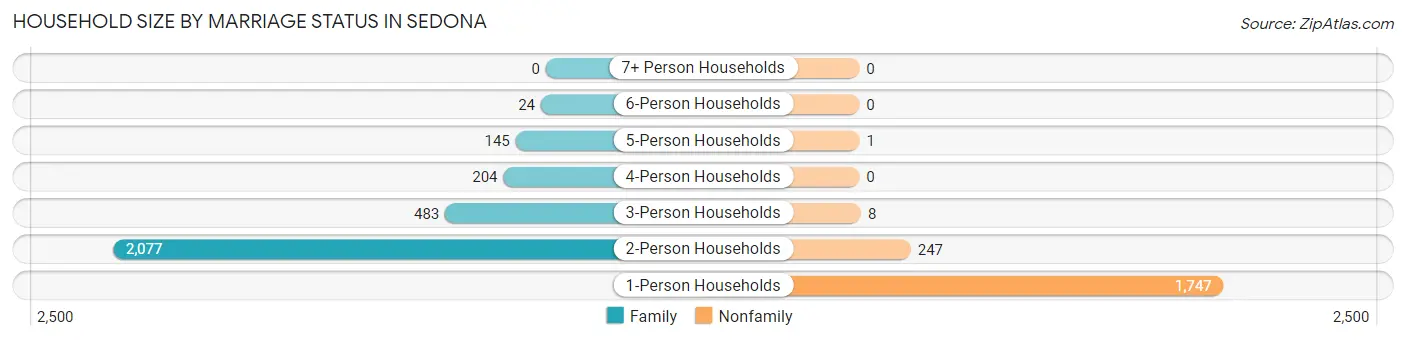
Household Size by Marriage Status in Sedona
Out of a total of 4,936 households in Sedona, 2,933 (59.4%) are family households, while 2,003 (40.6%) are nonfamily households. The most numerous type of family households are 2-person households, comprising 2,077, and the most common type of nonfamily households are 1-person households, comprising 1,747.
| Household Size | Family Households | Nonfamily Households |
| 1-Person Households | - | 1,747 (35.4%) |
| 2-Person Households | 2,077 (42.1%) | 247 (5.0%) |
| 3-Person Households | 483 (9.8%) | 8 (0.2%) |
| 4-Person Households | 204 (4.1%) | 0 (0.0%) |
| 5-Person Households | 145 (2.9%) | 1 (0.0%) |
| 6-Person Households | 24 (0.5%) | 0 (0.0%) |
| 7+ Person Households | 0 (0.0%) | 0 (0.0%) |
| Total | 2,933 (59.4%) | 2,003 (40.6%) |
Female Fertility in Sedona
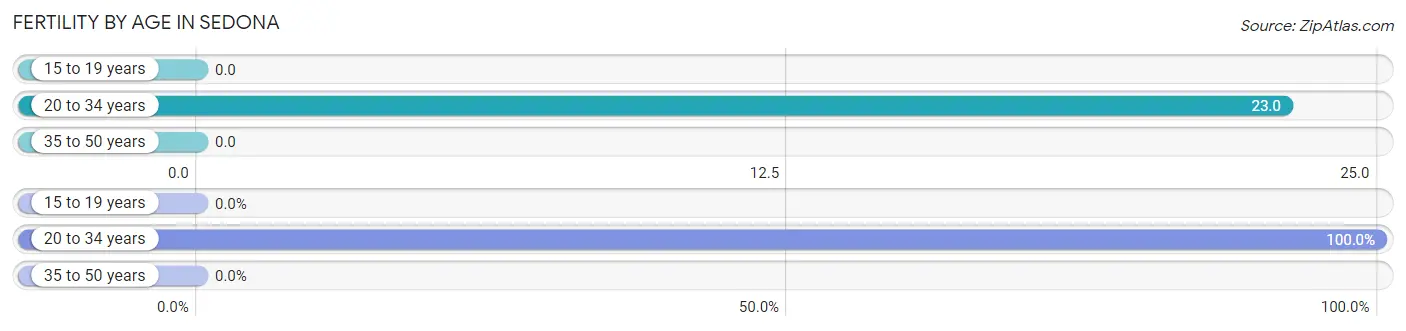
Fertility by Age in Sedona
Average fertility rate in Sedona is 6.0 births per 1,000 women. Women in the age bracket of 20 to 34 years have the highest fertility rate with 23.0 births per 1,000 women. Women in the age bracket of 20 to 34 years acount for 100.0% of all women with births.
| Age Bracket | Women with Births | Births / 1,000 Women |
| 15 to 19 years | 0 (0.0%) | 0.0 |
| 20 to 34 years | 8 (100.0%) | 23.0 |
| 35 to 50 years | 0 (0.0%) | 0.0 |
| Total | 8 (100.0%) | 6.0 |
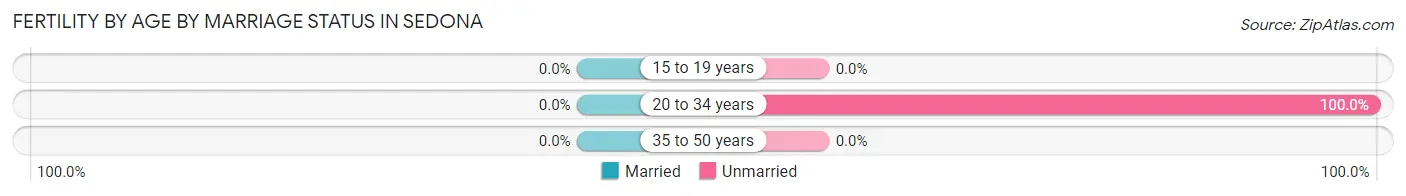
Fertility by Age by Marriage Status in Sedona
| Age Bracket | Married | Unmarried |
| 15 to 19 years | 0 (0.0%) | 0 (0.0%) |
| 20 to 34 years | 0 (0.0%) | 8 (100.0%) |
| 35 to 50 years | 0 (0.0%) | 0 (0.0%) |
| Total | 0 (0.0%) | 8 (100.0%) |
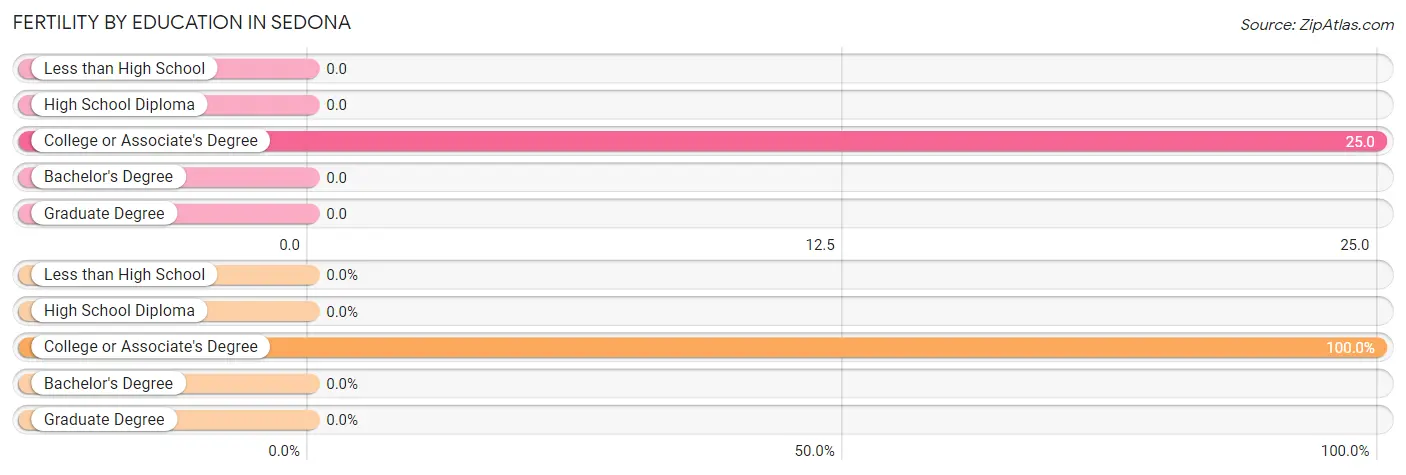
Fertility by Education in Sedona
| Educational Attainment | Women with Births | Births / 1,000 Women |
| Less than High School | 0 (0.0%) | 0.0 |
| High School Diploma | 0 (0.0%) | 0.0 |
| College or Associate's Degree | 8 (100.0%) | 25.0 |
| Bachelor's Degree | 0 (0.0%) | 0.0 |
| Graduate Degree | 0 (0.0%) | 0.0 |
| Total | 8 (100.0%) | 6.0 |
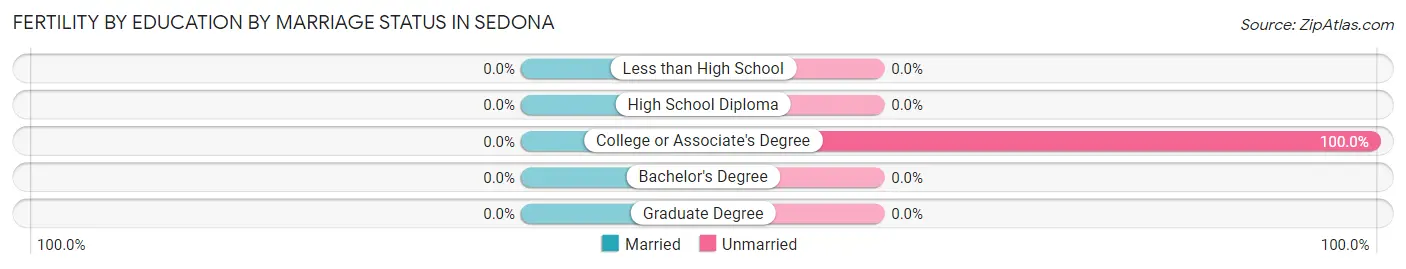
Fertility by Education by Marriage Status in Sedona
| Educational Attainment | Married | Unmarried |
| Less than High School | 0 (0.0%) | 0 (0.0%) |
| High School Diploma | 0 (0.0%) | 0 (0.0%) |
| College or Associate's Degree | 0 (0.0%) | 8 (100.0%) |
| Bachelor's Degree | 0 (0.0%) | 0 (0.0%) |
| Graduate Degree | 0 (0.0%) | 0 (0.0%) |
| Total | 0 (0.0%) | 8 (100.0%) |
Income in Sedona
Income Overview in Sedona
Per Capita Income in Sedona is $49,801, while median incomes of families and households are $83,655 and $62,901 respectively.
| Characteristic | Number | Measure |
| Per Capita Income | 9,739 | $49,801 |
| Median Family Income | 2,933 | $83,655 |
| Mean Family Income | 2,933 | $122,999 |
| Median Household Income | 4,936 | $62,901 |
| Mean Household Income | 4,936 | $97,338 |
| Income Deficit | 2,933 | $0 |
| Wage / Income Gap (%) | 9,739 | 0.06% |
| Wage / Income Gap ($) | 9,739 | 99.94¢ per $1 |
| Gini / Inequality Index | 9,739 | 0.48 |
Earnings by Sex in Sedona
Average Earnings in Sedona are $31,740, $31,738 for men and $31,758 for women, a difference of 0.1%.
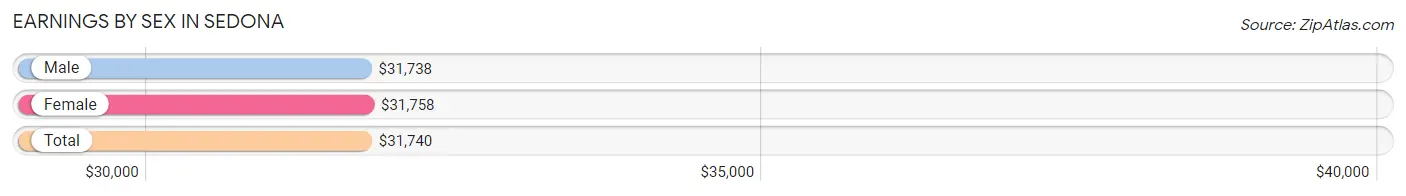
| Sex | Number | Average Earnings |
| Male | 2,493 (51.6%) | $31,738 |
| Female | 2,340 (48.4%) | $31,758 |
| Total | 4,833 (100.0%) | $31,740 |
Earnings by Sex by Income Bracket in Sedona
The most common earnings brackets in Sedona are $30,000 to $34,999 for men (546 | 21.9%) and $100,000+ for women (283 | 12.1%).
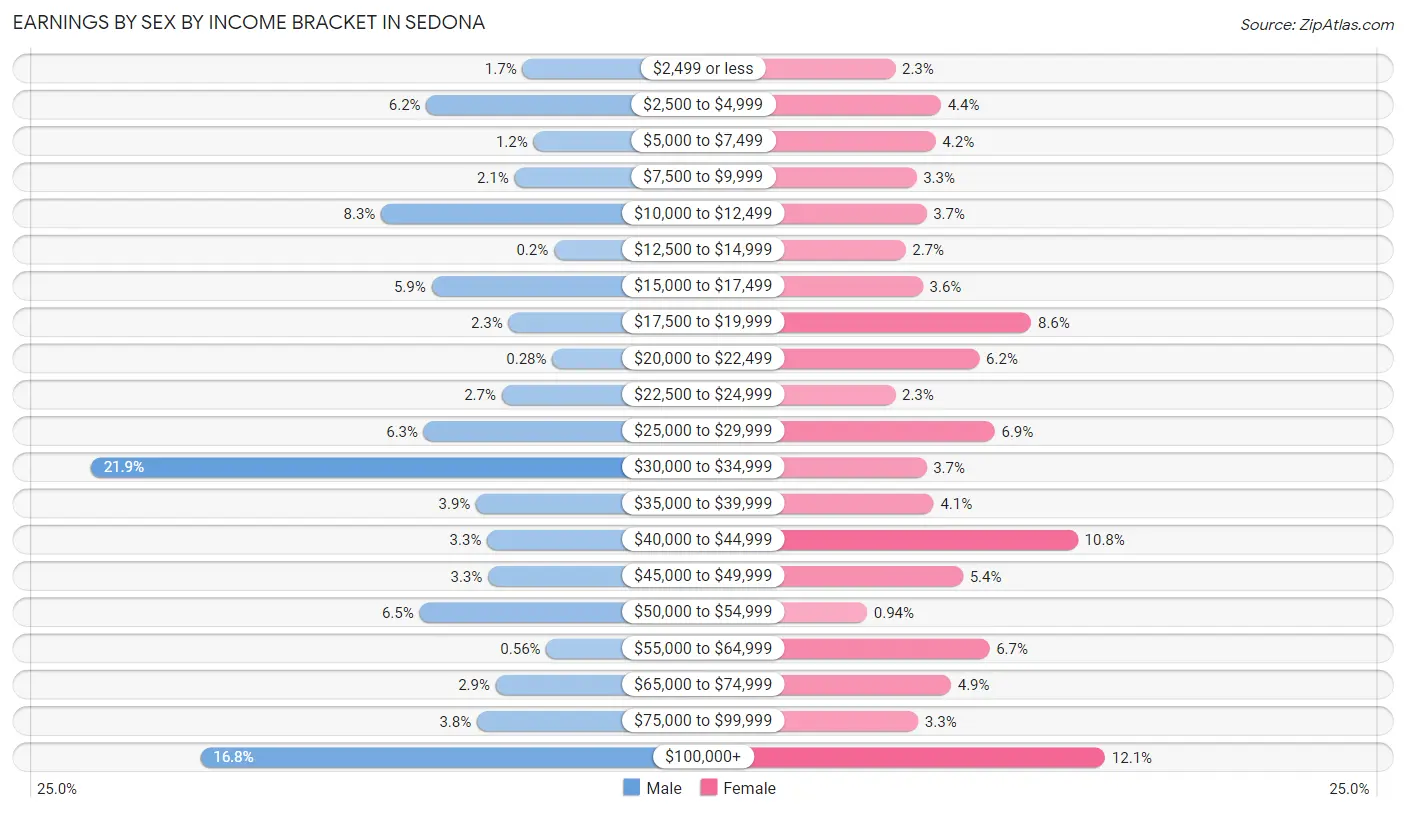
| Income | Male | Female |
| $2,499 or less | 42 (1.7%) | 53 (2.3%) |
| $2,500 to $4,999 | 154 (6.2%) | 103 (4.4%) |
| $5,000 to $7,499 | 29 (1.2%) | 97 (4.2%) |
| $7,500 to $9,999 | 51 (2.1%) | 76 (3.3%) |
| $10,000 to $12,499 | 207 (8.3%) | 87 (3.7%) |
| $12,500 to $14,999 | 5 (0.2%) | 64 (2.7%) |
| $15,000 to $17,499 | 148 (5.9%) | 83 (3.5%) |
| $17,500 to $19,999 | 58 (2.3%) | 202 (8.6%) |
| $20,000 to $22,499 | 7 (0.3%) | 145 (6.2%) |
| $22,500 to $24,999 | 66 (2.6%) | 53 (2.3%) |
| $25,000 to $29,999 | 157 (6.3%) | 162 (6.9%) |
| $30,000 to $34,999 | 546 (21.9%) | 87 (3.7%) |
| $35,000 to $39,999 | 96 (3.8%) | 95 (4.1%) |
| $40,000 to $44,999 | 83 (3.3%) | 253 (10.8%) |
| $45,000 to $49,999 | 82 (3.3%) | 127 (5.4%) |
| $50,000 to $54,999 | 162 (6.5%) | 22 (0.9%) |
| $55,000 to $64,999 | 14 (0.6%) | 156 (6.7%) |
| $65,000 to $74,999 | 73 (2.9%) | 114 (4.9%) |
| $75,000 to $99,999 | 95 (3.8%) | 78 (3.3%) |
| $100,000+ | 418 (16.8%) | 283 (12.1%) |
| Total | 2,493 (100.0%) | 2,340 (100.0%) |
Earnings by Sex by Educational Attainment in Sedona
Average earnings in Sedona are $32,295 for men and $31,991 for women, a difference of 0.9%. Men with an educational attainment of graduate degree enjoy the highest average annual earnings of $94,219, while those with less than high school education earn the least with $28,867. Women with an educational attainment of graduate degree earn the most with the average annual earnings of $41,318, while those with college or associate's degree education have the smallest earnings of $26,384.
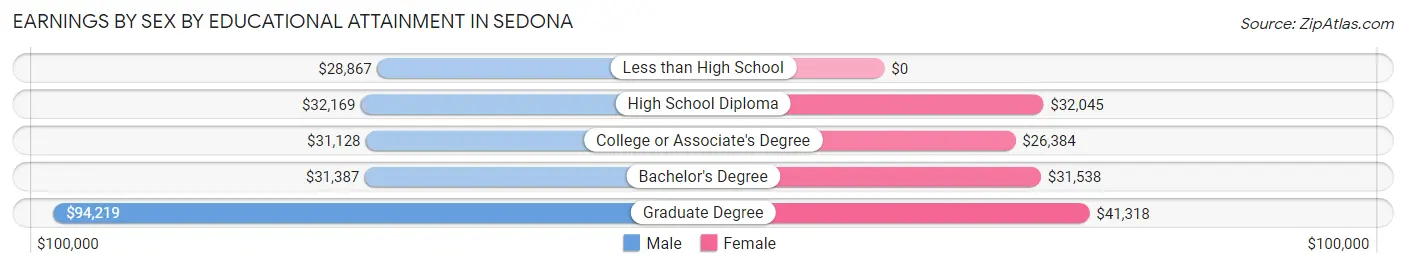
| Educational Attainment | Male Income | Female Income |
| Less than High School | $28,867 | $0 |
| High School Diploma | $32,169 | $32,045 |
| College or Associate's Degree | $31,128 | $26,384 |
| Bachelor's Degree | $31,387 | $31,538 |
| Graduate Degree | $94,219 | $41,318 |
| Total | $32,295 | $31,991 |
Family Income in Sedona
Family Income Brackets in Sedona
According to the Sedona family income data, there are 560 families falling into the $50,000 to $74,999 income range, which is the most common income bracket and makes up 19.1% of all families. Conversely, the $10,000 to $14,999 income bracket is the least frequent group with only 18 families (0.6%) belonging to this category.
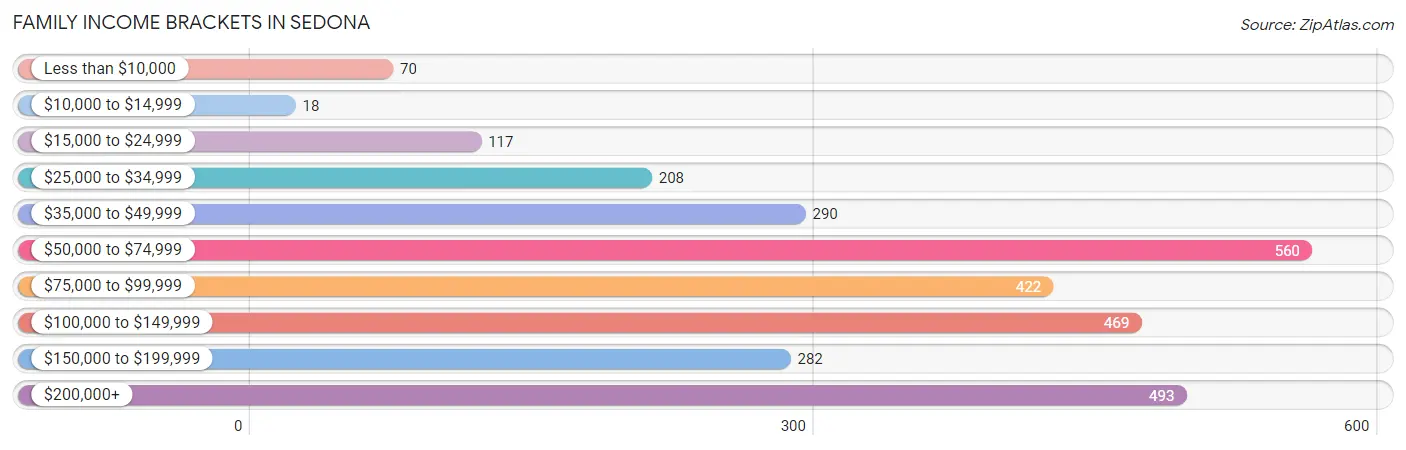
| Income Bracket | # Families | % Families |
| Less than $10,000 | 70 | 2.4% |
| $10,000 to $14,999 | 18 | 0.6% |
| $15,000 to $24,999 | 117 | 4.0% |
| $25,000 to $34,999 | 208 | 7.1% |
| $35,000 to $49,999 | 290 | 9.9% |
| $50,000 to $74,999 | 560 | 19.1% |
| $75,000 to $99,999 | 422 | 14.4% |
| $100,000 to $149,999 | 469 | 16.0% |
| $150,000 to $199,999 | 282 | 9.6% |
| $200,000+ | 493 | 16.8% |
Family Income by Famaliy Size in Sedona
4-person families (150 | 5.1%) account for the highest median family income in Sedona with $183,333 per family, while 2-person families (2,149 | 73.3%) have the highest median income of $47,914 per family member.
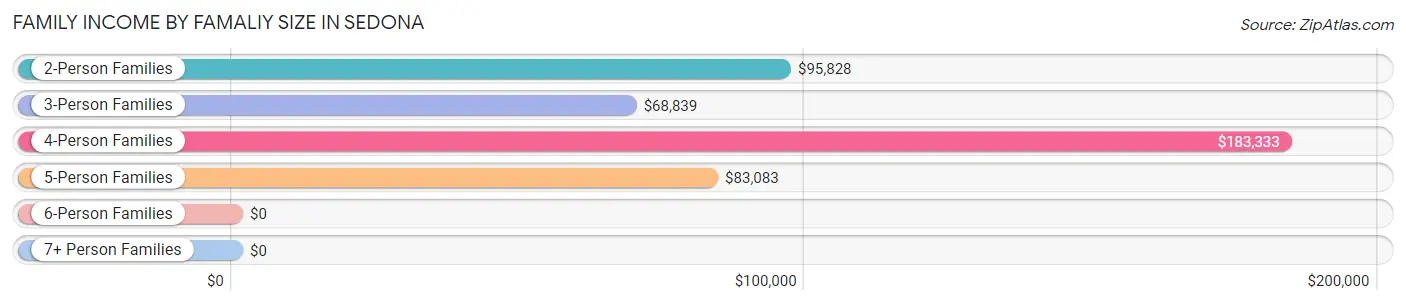
| Income Bracket | # Families | Median Income |
| 2-Person Families | 2,149 (73.3%) | $95,828 |
| 3-Person Families | 479 (16.3%) | $68,839 |
| 4-Person Families | 150 (5.1%) | $183,333 |
| 5-Person Families | 147 (5.0%) | $83,083 |
| 6-Person Families | 8 (0.3%) | $0 |
| 7+ Person Families | 0 (0.0%) | $0 |
| Total | 2,933 (100.0%) | $83,655 |
Family Income by Number of Earners in Sedona
The median family income in Sedona is $83,655, with families comprising 1 earner (1,020) having the highest median family income of $95,408, while families with no earners (698) have the lowest median family income of $72,500, accounting for 34.8% and 23.8% of families, respectively.
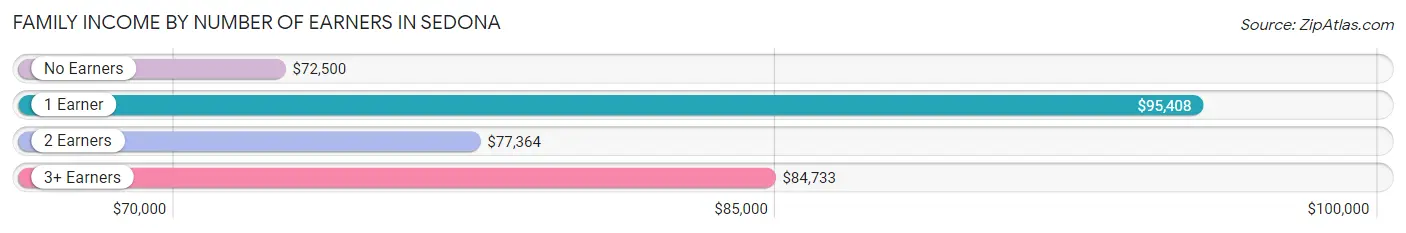
| Number of Earners | # Families | Median Income |
| No Earners | 698 (23.8%) | $72,500 |
| 1 Earner | 1,020 (34.8%) | $95,408 |
| 2 Earners | 1,071 (36.5%) | $77,364 |
| 3+ Earners | 144 (4.9%) | $84,733 |
| Total | 2,933 (100.0%) | $83,655 |
Household Income in Sedona
Household Income Brackets in Sedona
With 898 households falling in the category, the $50,000 to $74,999 income range is the most frequent in Sedona, accounting for 18.2% of all households. In contrast, only 193 households (3.9%) fall into the less than $10,000 income bracket, making it the least populous group.
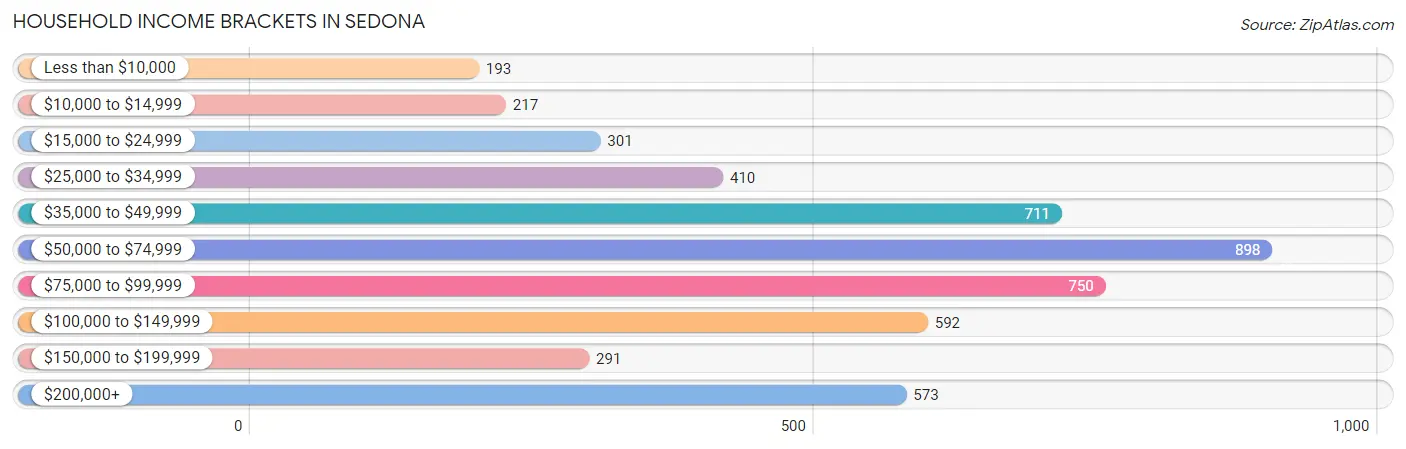
| Income Bracket | # Households | % Households |
| Less than $10,000 | 193 | 3.9% |
| $10,000 to $14,999 | 217 | 4.4% |
| $15,000 to $24,999 | 301 | 6.1% |
| $25,000 to $34,999 | 410 | 8.3% |
| $35,000 to $49,999 | 711 | 14.4% |
| $50,000 to $74,999 | 898 | 18.2% |
| $75,000 to $99,999 | 750 | 15.2% |
| $100,000 to $149,999 | 592 | 12.0% |
| $150,000 to $199,999 | 291 | 5.9% |
| $200,000+ | 573 | 11.6% |
Household Income by Householder Age in Sedona
The median household income in Sedona is $62,901, with the highest median household income of $70,958 found in the 65+ years age bracket for the primary householder. A total of 2,371 households (48.0%) fall into this category. Meanwhile, the 15 to 24 years age bracket for the primary householder has the lowest median household income of $49,808, with 48 households (1.0%) in this group.
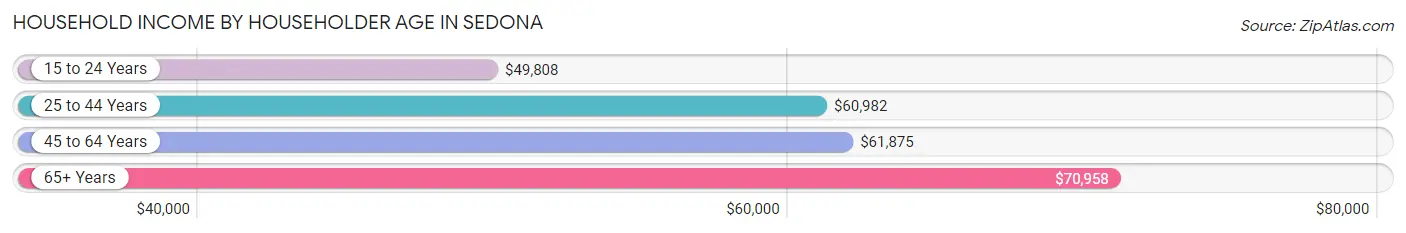
| Income Bracket | # Households | Median Income |
| 15 to 24 Years | 48 (1.0%) | $49,808 |
| 25 to 44 Years | 739 (15.0%) | $60,982 |
| 45 to 64 Years | 1,778 (36.0%) | $61,875 |
| 65+ Years | 2,371 (48.0%) | $70,958 |
| Total | 4,936 (100.0%) | $62,901 |
Poverty in Sedona
Income Below Poverty by Sex and Age in Sedona
With 9.7% poverty level for males and 12.2% for females among the residents of Sedona, 6 to 11 year old males and 5 year old females are the most vulnerable to poverty, with 42 males (18.0%) and 40 females (50.6%) in their respective age groups living below the poverty level.
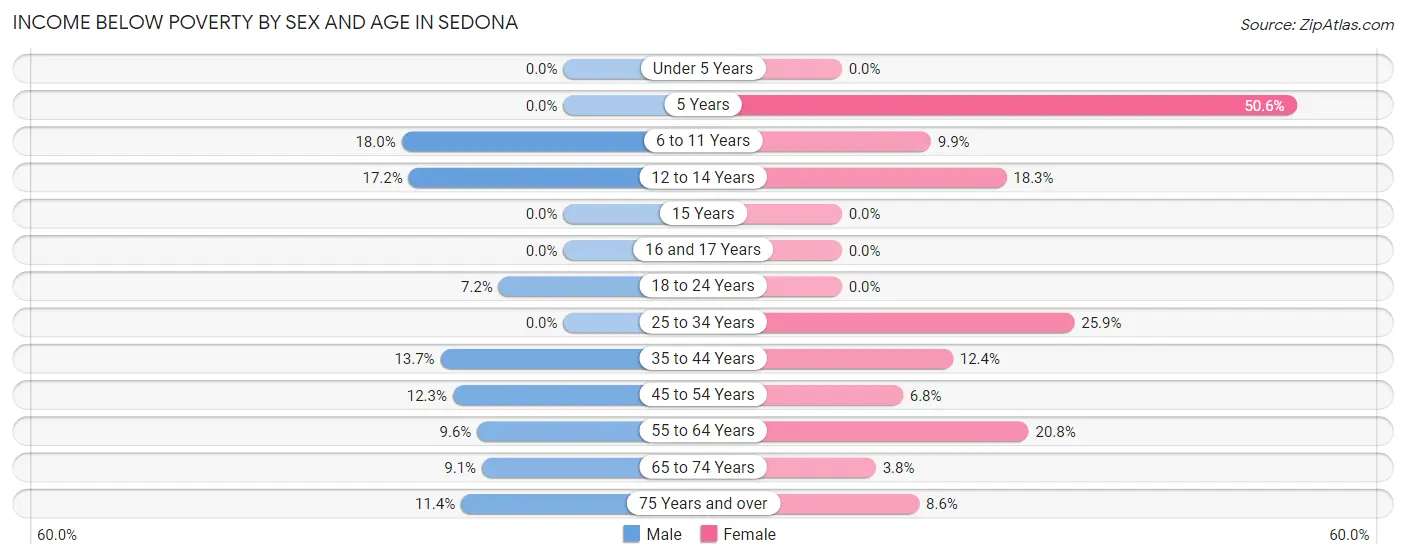
| Age Bracket | Male | Female |
| Under 5 Years | 0 (0.0%) | 0 (0.0%) |
| 5 Years | 0 (0.0%) | 40 (50.6%) |
| 6 to 11 Years | 42 (18.0%) | 13 (9.9%) |
| 12 to 14 Years | 10 (17.2%) | 44 (18.3%) |
| 15 Years | 0 (0.0%) | 0 (0.0%) |
| 16 and 17 Years | 0 (0.0%) | 0 (0.0%) |
| 18 to 24 Years | 17 (7.2%) | 0 (0.0%) |
| 25 to 34 Years | 0 (0.0%) | 80 (25.9%) |
| 35 to 44 Years | 72 (13.7%) | 56 (12.4%) |
| 45 to 54 Years | 48 (12.3%) | 39 (6.8%) |
| 55 to 64 Years | 82 (9.6%) | 260 (20.8%) |
| 65 to 74 Years | 98 (9.1%) | 45 (3.8%) |
| 75 Years and over | 69 (11.4%) | 58 (8.6%) |
| Total | 438 (9.7%) | 635 (12.2%) |
Income Above Poverty by Sex and Age in Sedona
According to the poverty statistics in Sedona, males aged under 5 years and females aged under 5 years are the age groups that are most secure financially, with 100.0% of males and 100.0% of females in these age groups living above the poverty line.
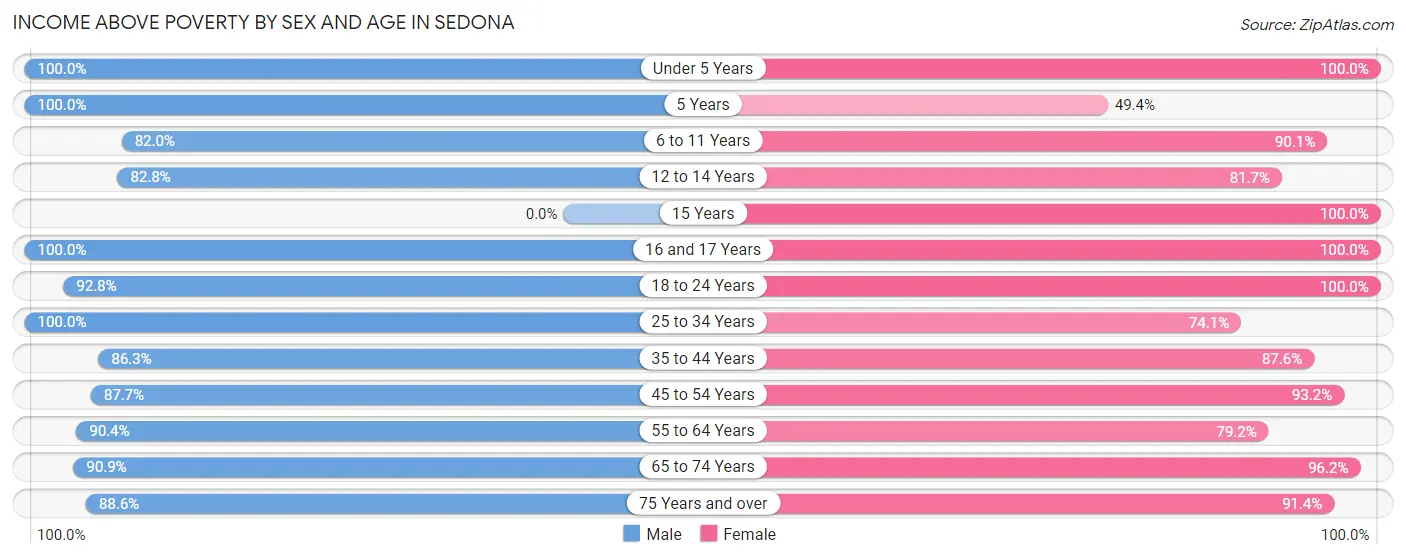
| Age Bracket | Male | Female |
| Under 5 Years | 25 (100.0%) | 89 (100.0%) |
| 5 Years | 96 (100.0%) | 39 (49.4%) |
| 6 to 11 Years | 191 (82.0%) | 118 (90.1%) |
| 12 to 14 Years | 48 (82.8%) | 196 (81.7%) |
| 15 Years | 0 (0.0%) | 3 (100.0%) |
| 16 and 17 Years | 4 (100.0%) | 140 (100.0%) |
| 18 to 24 Years | 219 (92.8%) | 76 (100.0%) |
| 25 to 34 Years | 422 (100.0%) | 229 (74.1%) |
| 35 to 44 Years | 454 (86.3%) | 397 (87.6%) |
| 45 to 54 Years | 342 (87.7%) | 535 (93.2%) |
| 55 to 64 Years | 772 (90.4%) | 990 (79.2%) |
| 65 to 74 Years | 982 (90.9%) | 1,146 (96.2%) |
| 75 Years and over | 537 (88.6%) | 616 (91.4%) |
| Total | 4,092 (90.3%) | 4,574 (87.8%) |
Income Below Poverty Among Married-Couple Families in Sedona
The poverty statistics for married-couple families in Sedona show that 6.8% or 157 of the total 2,320 families live below the poverty line. Families with 3 or 4 children have the highest poverty rate of 81.6%, comprising of 40 families. On the other hand, families with 1 or 2 children have the lowest poverty rate of 2.4%, which includes 12 families.
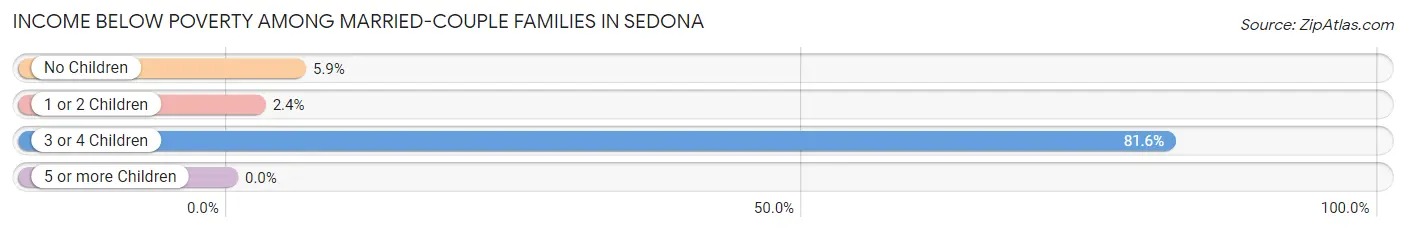
| Children | Above Poverty | Below Poverty |
| No Children | 1,669 (94.1%) | 105 (5.9%) |
| 1 or 2 Children | 485 (97.6%) | 12 (2.4%) |
| 3 or 4 Children | 9 (18.4%) | 40 (81.6%) |
| 5 or more Children | 0 (0.0%) | 0 (0.0%) |
| Total | 2,163 (93.2%) | 157 (6.8%) |
Income Below Poverty Among Single-Parent Households in Sedona
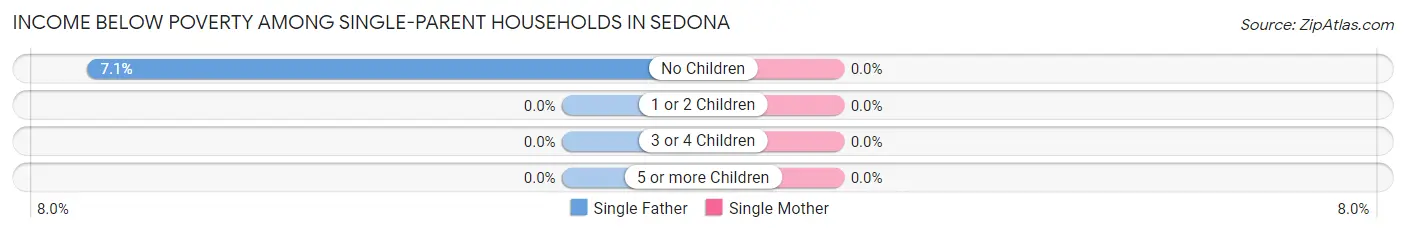
| Children | Single Father | Single Mother |
| No Children | 18 (7.1%) | 0 (0.0%) |
| 1 or 2 Children | 0 (0.0%) | 0 (0.0%) |
| 3 or 4 Children | 0 (0.0%) | 0 (0.0%) |
| 5 or more Children | 0 (0.0%) | 0 (0.0%) |
| Total | 18 (6.3%) | 0 (0.0%) |
Income Below Poverty Among Married-Couple vs Single-Parent Households in Sedona
The poverty data for Sedona shows that 157 of the married-couple family households (6.8%) and 18 of the single-parent households (2.9%) are living below the poverty level. Within the married-couple family households, those with 3 or 4 children have the highest poverty rate, with 40 households (81.6%) falling below the poverty line. Among the single-parent households, those with no children have the highest poverty rate, with 18 household (4.1%) living below poverty.
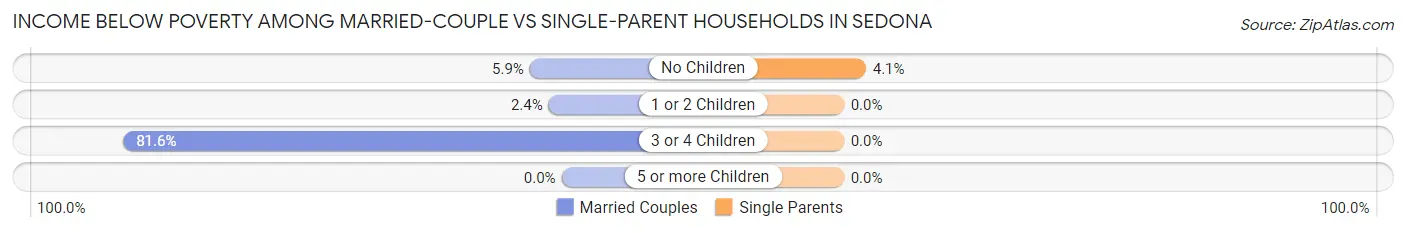
| Children | Married-Couple Families | Single-Parent Households |
| No Children | 105 (5.9%) | 18 (4.1%) |
| 1 or 2 Children | 12 (2.4%) | 0 (0.0%) |
| 3 or 4 Children | 40 (81.6%) | 0 (0.0%) |
| 5 or more Children | 0 (0.0%) | 0 (0.0%) |
| Total | 157 (6.8%) | 18 (2.9%) |
Employment Characteristics in Sedona
Employment by Class of Employer in Sedona
Among the 4,188 employed individuals in Sedona, private company employees (1,659 | 39.6%), self-employed (not incorporated) (1,302 | 31.1%), and self-employed (incorporated) (491 | 11.7%) make up the most common classes of employment.
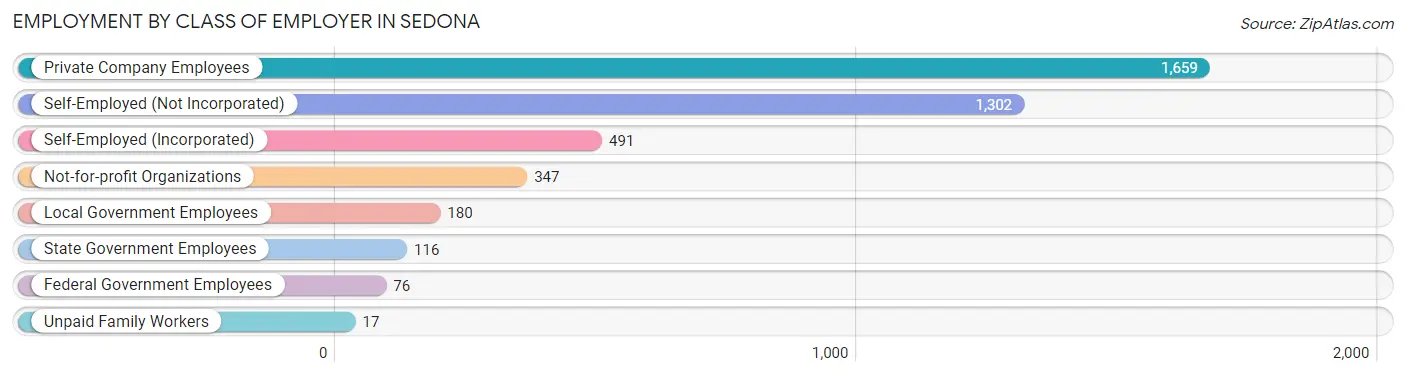
| Employer Class | # Employees | % Employees |
| Private Company Employees | 1,659 | 39.6% |
| Self-Employed (Incorporated) | 491 | 11.7% |
| Self-Employed (Not Incorporated) | 1,302 | 31.1% |
| Not-for-profit Organizations | 347 | 8.3% |
| Local Government Employees | 180 | 4.3% |
| State Government Employees | 116 | 2.8% |
| Federal Government Employees | 76 | 1.8% |
| Unpaid Family Workers | 17 | 0.4% |
| Total | 4,188 | 100.0% |
Employment Status by Age in Sedona
According to the labor force statistics for Sedona, out of the total population over 16 years of age (8,785), 52.5% or 4,612 individuals are in the labor force, with 7.7% or 355 of them unemployed. The age group with the highest labor force participation rate is 20 to 24 years, with 100.0% or 143 individuals in the labor force. Within the labor force, the 16 to 19 years age range has the highest percentage of unemployed individuals, with 81.7% or 107 of them being unemployed.
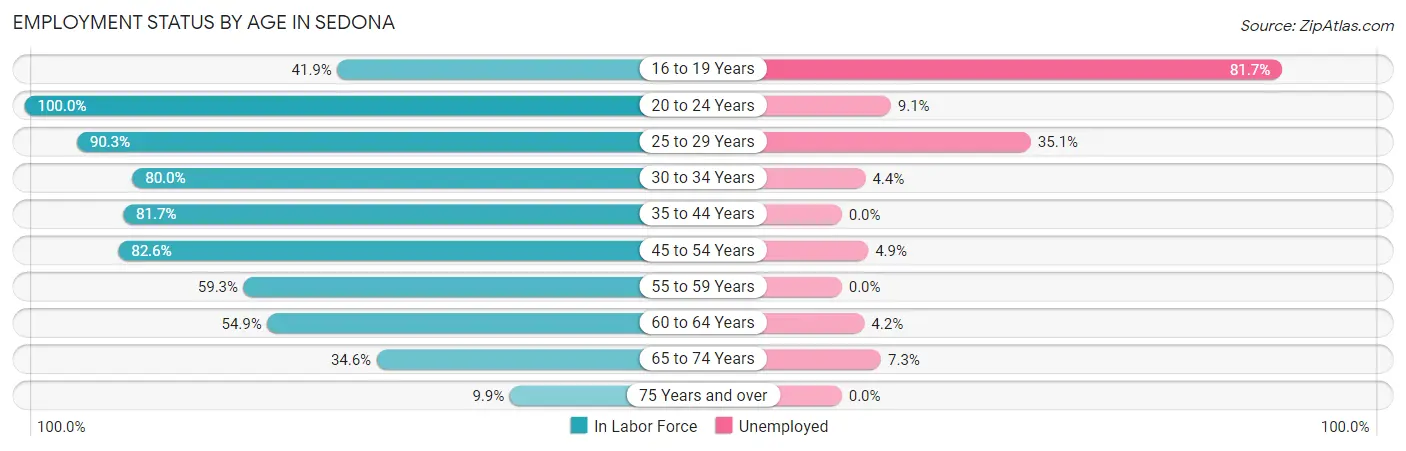
| Age Bracket | In Labor Force | Unemployed |
| 16 to 19 Years | 131 (41.9%) | 107 (81.7%) |
| 20 to 24 Years | 143 (100.0%) | 13 (9.1%) |
| 25 to 29 Years | 299 (90.3%) | 105 (35.1%) |
| 30 to 34 Years | 320 (80.0%) | 14 (4.4%) |
| 35 to 44 Years | 800 (81.7%) | 0 (0.0%) |
| 45 to 54 Years | 796 (82.6%) | 39 (4.9%) |
| 55 to 59 Years | 711 (59.3%) | 0 (0.0%) |
| 60 to 64 Years | 497 (54.9%) | 21 (4.2%) |
| 65 to 74 Years | 786 (34.6%) | 57 (7.3%) |
| 75 Years and over | 127 (9.9%) | 0 (0.0%) |
| Total | 4,612 (52.5%) | 355 (7.7%) |
Employment Status by Educational Attainment in Sedona
According to labor force statistics for Sedona, 71.6% of individuals (3,421) out of the total population between 25 and 64 years of age (4,778) are in the labor force, with 5.2% or 178 of them being unemployed. The group with the highest labor force participation rate are those with the educational attainment of high school diploma, with 81.6% or 866 individuals in the labor force. Within the labor force, individuals with less than high school education have the highest percentage of unemployment, with 22.0% or 56 of them being unemployed.
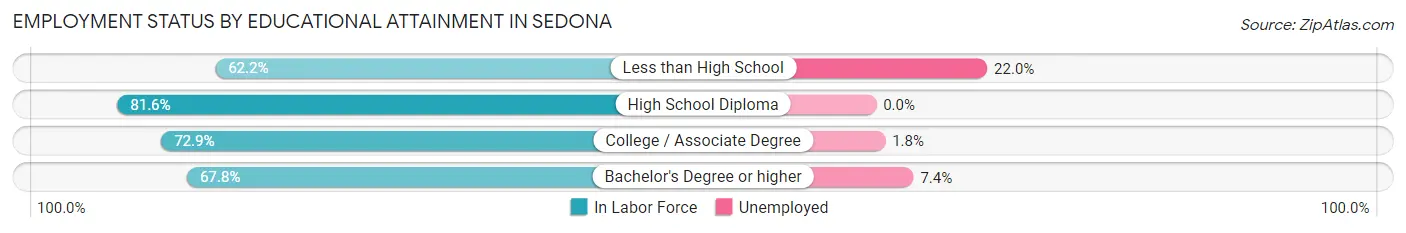
| Educational Attainment | In Labor Force | Unemployed |
| Less than High School | 255 (62.2%) | 90 (22.0%) |
| High School Diploma | 866 (81.6%) | 0 (0.0%) |
| College / Associate Degree | 849 (72.9%) | 21 (1.8%) |
| Bachelor's Degree or higher | 1,452 (67.8%) | 159 (7.4%) |
| Total | 3,421 (71.6%) | 248 (5.2%) |
Employment Occupations by Sex in Sedona
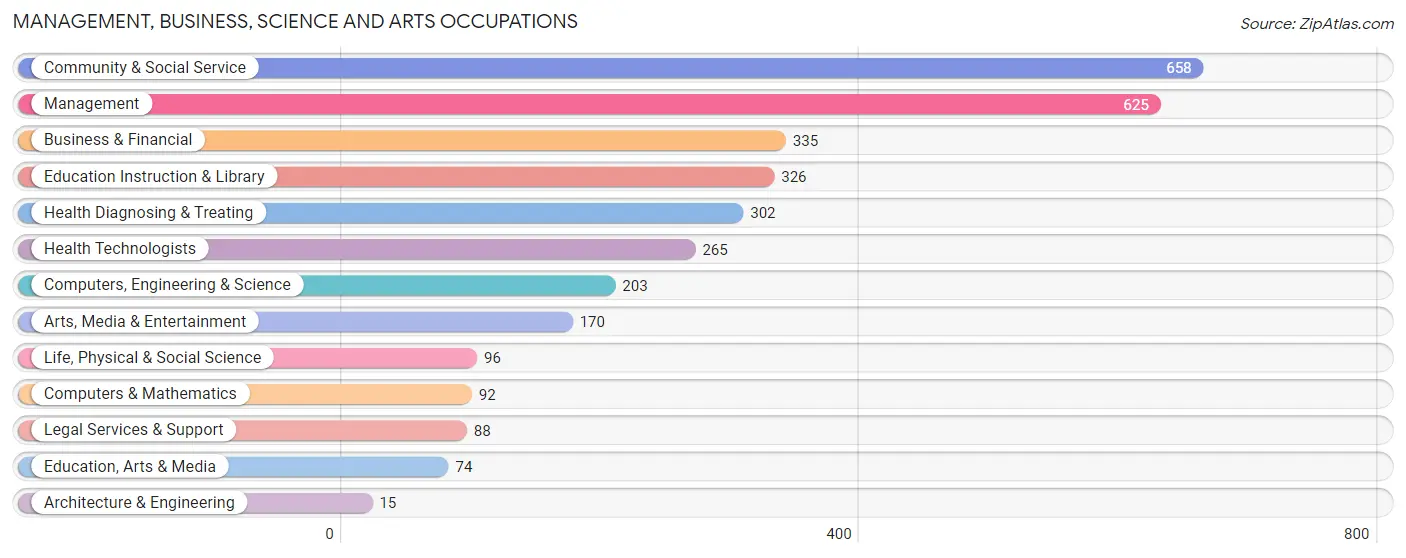
Management, Business, Science and Arts Occupations
The most common Management, Business, Science and Arts occupations in Sedona are Community & Social Service (658 | 15.5%), Management (625 | 14.7%), Business & Financial (335 | 7.9%), Education Instruction & Library (326 | 7.7%), and Health Diagnosing & Treating (302 | 7.1%).
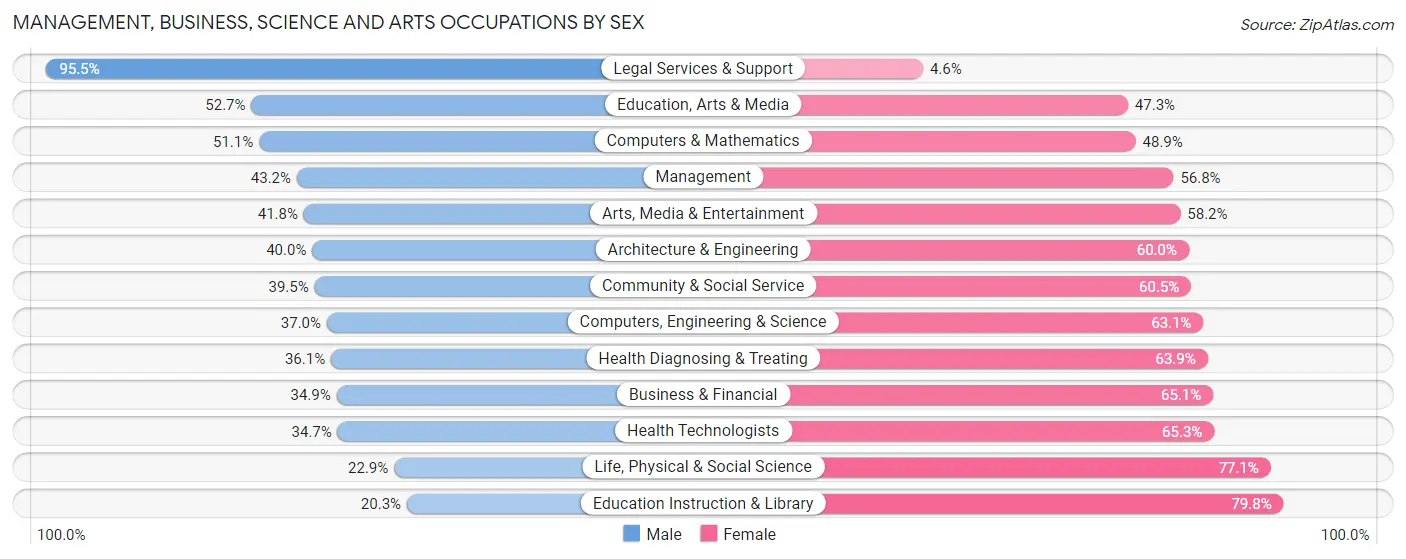
Management, Business, Science and Arts Occupations by Sex
Within the Management, Business, Science and Arts occupations in Sedona, the most male-oriented occupations are Legal Services & Support (95.5%), Education, Arts & Media (52.7%), and Computers & Mathematics (51.1%), while the most female-oriented occupations are Education Instruction & Library (79.7%), Life, Physical & Social Science (77.1%), and Health Technologists (65.3%).
| Occupation | Male | Female |
| Management | 270 (43.2%) | 355 (56.8%) |
| Business & Financial | 117 (34.9%) | 218 (65.1%) |
| Computers, Engineering & Science | 75 (36.9%) | 128 (63.0%) |
| Computers & Mathematics | 47 (51.1%) | 45 (48.9%) |
| Architecture & Engineering | 6 (40.0%) | 9 (60.0%) |
| Life, Physical & Social Science | 22 (22.9%) | 74 (77.1%) |
| Community & Social Service | 260 (39.5%) | 398 (60.5%) |
| Education, Arts & Media | 39 (52.7%) | 35 (47.3%) |
| Legal Services & Support | 84 (95.5%) | 4 (4.5%) |
| Education Instruction & Library | 66 (20.3%) | 260 (79.7%) |
| Arts, Media & Entertainment | 71 (41.8%) | 99 (58.2%) |
| Health Diagnosing & Treating | 109 (36.1%) | 193 (63.9%) |
| Health Technologists | 92 (34.7%) | 173 (65.3%) |
| Total (Category) | 831 (39.1%) | 1,292 (60.9%) |
| Total (Overall) | 2,078 (48.9%) | 2,175 (51.1%) |
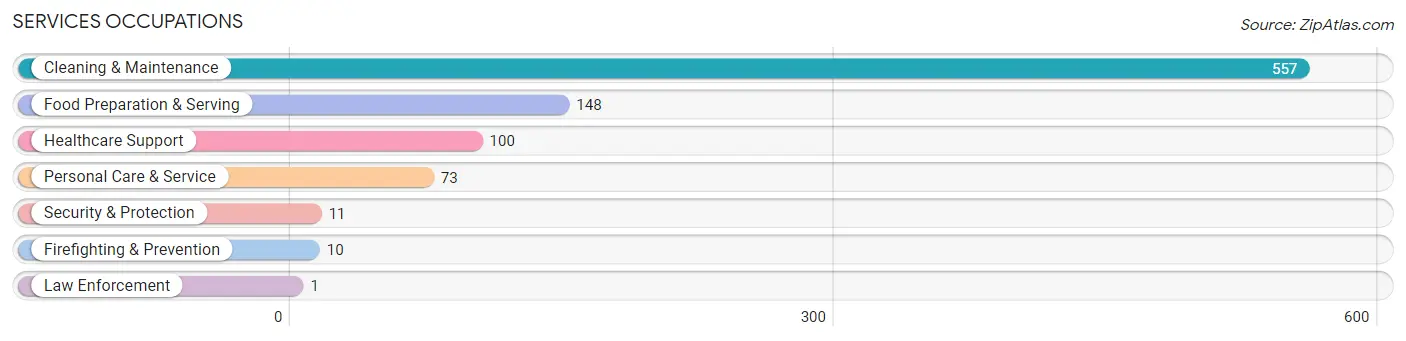
Services Occupations
The most common Services occupations in Sedona are Cleaning & Maintenance (557 | 13.1%), Food Preparation & Serving (148 | 3.5%), Healthcare Support (100 | 2.4%), Personal Care & Service (73 | 1.7%), and Security & Protection (11 | 0.3%).
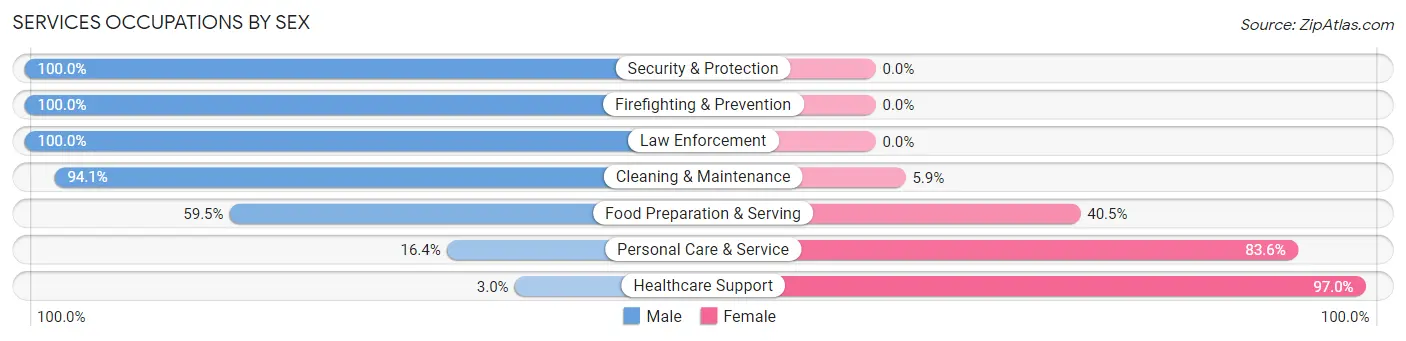
Services Occupations by Sex
Within the Services occupations in Sedona, the most male-oriented occupations are Security & Protection (100.0%), Firefighting & Prevention (100.0%), and Law Enforcement (100.0%), while the most female-oriented occupations are Healthcare Support (97.0%), Personal Care & Service (83.6%), and Food Preparation & Serving (40.5%).
| Occupation | Male | Female |
| Healthcare Support | 3 (3.0%) | 97 (97.0%) |
| Security & Protection | 11 (100.0%) | 0 (0.0%) |
| Firefighting & Prevention | 10 (100.0%) | 0 (0.0%) |
| Law Enforcement | 1 (100.0%) | 0 (0.0%) |
| Food Preparation & Serving | 88 (59.5%) | 60 (40.5%) |
| Cleaning & Maintenance | 524 (94.1%) | 33 (5.9%) |
| Personal Care & Service | 12 (16.4%) | 61 (83.6%) |
| Total (Category) | 638 (71.8%) | 251 (28.2%) |
| Total (Overall) | 2,078 (48.9%) | 2,175 (51.1%) |
Sales and Office Occupations
The most common Sales and Office occupations in Sedona are Sales & Related (426 | 10.0%), and Office & Administration (338 | 8.0%).
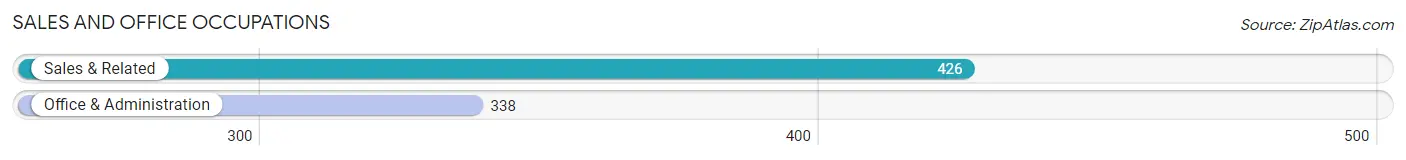
Sales and Office Occupations by Sex
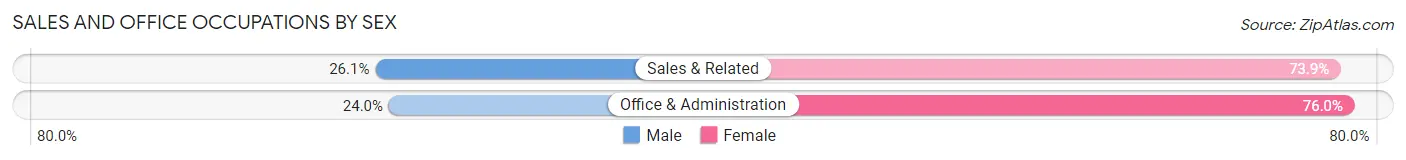
| Occupation | Male | Female |
| Sales & Related | 111 (26.1%) | 315 (73.9%) |
| Office & Administration | 81 (24.0%) | 257 (76.0%) |
| Total (Category) | 192 (25.1%) | 572 (74.9%) |
| Total (Overall) | 2,078 (48.9%) | 2,175 (51.1%) |
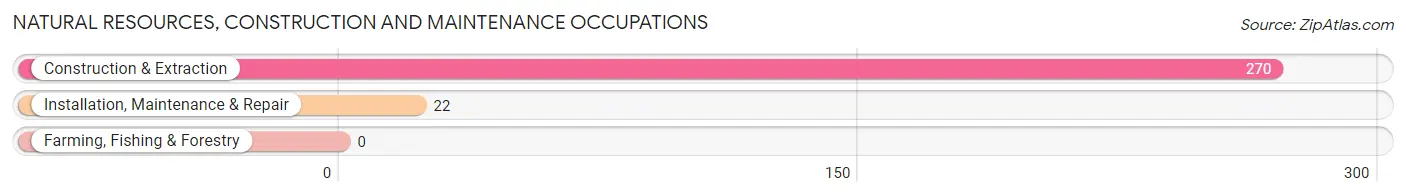
Natural Resources, Construction and Maintenance Occupations
The most common Natural Resources, Construction and Maintenance occupations in Sedona are Construction & Extraction (270 | 6.4%), and Installation, Maintenance & Repair (22 | 0.5%).
Natural Resources, Construction and Maintenance Occupations by Sex
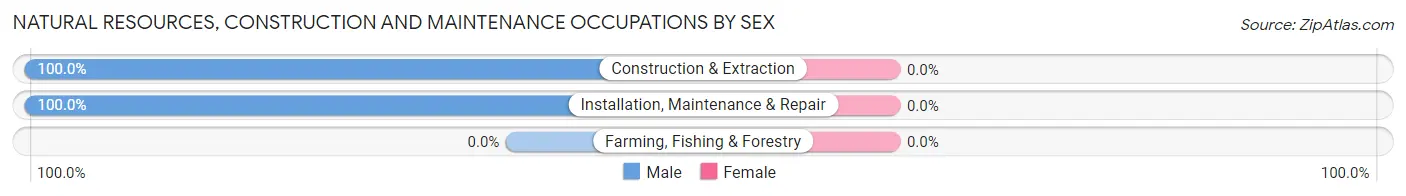
| Occupation | Male | Female |
| Farming, Fishing & Forestry | 0 (0.0%) | 0 (0.0%) |
| Construction & Extraction | 270 (100.0%) | 0 (0.0%) |
| Installation, Maintenance & Repair | 22 (100.0%) | 0 (0.0%) |
| Total (Category) | 292 (100.0%) | 0 (0.0%) |
| Total (Overall) | 2,078 (48.9%) | 2,175 (51.1%) |
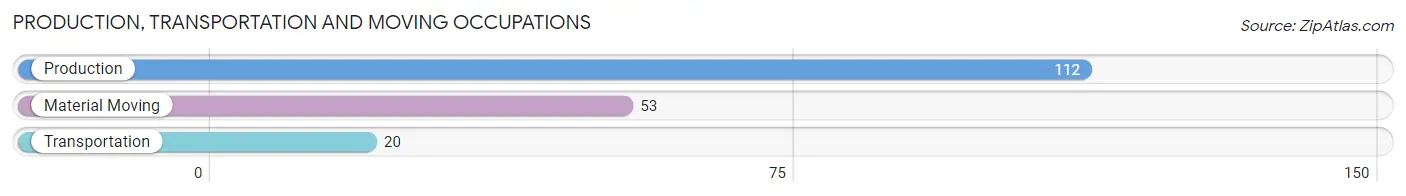
Production, Transportation and Moving Occupations
The most common Production, Transportation and Moving occupations in Sedona are Production (112 | 2.6%), Material Moving (53 | 1.3%), and Transportation (20 | 0.5%).
Production, Transportation and Moving Occupations by Sex
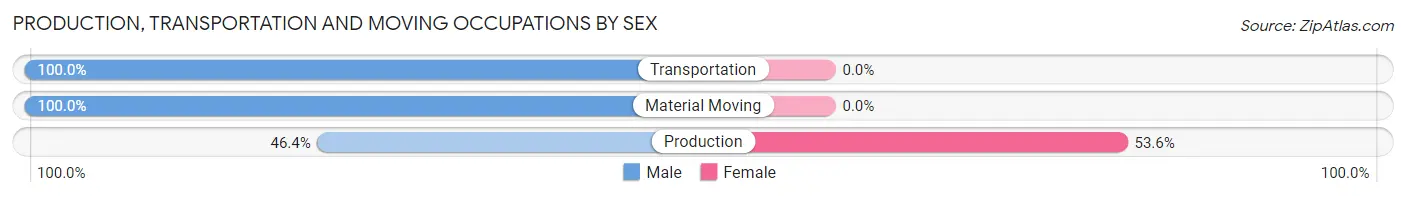
| Occupation | Male | Female |
| Production | 52 (46.4%) | 60 (53.6%) |
| Transportation | 20 (100.0%) | 0 (0.0%) |
| Material Moving | 53 (100.0%) | 0 (0.0%) |
| Total (Category) | 125 (67.6%) | 60 (32.4%) |
| Total (Overall) | 2,078 (48.9%) | 2,175 (51.1%) |
Employment Industries by Sex in Sedona
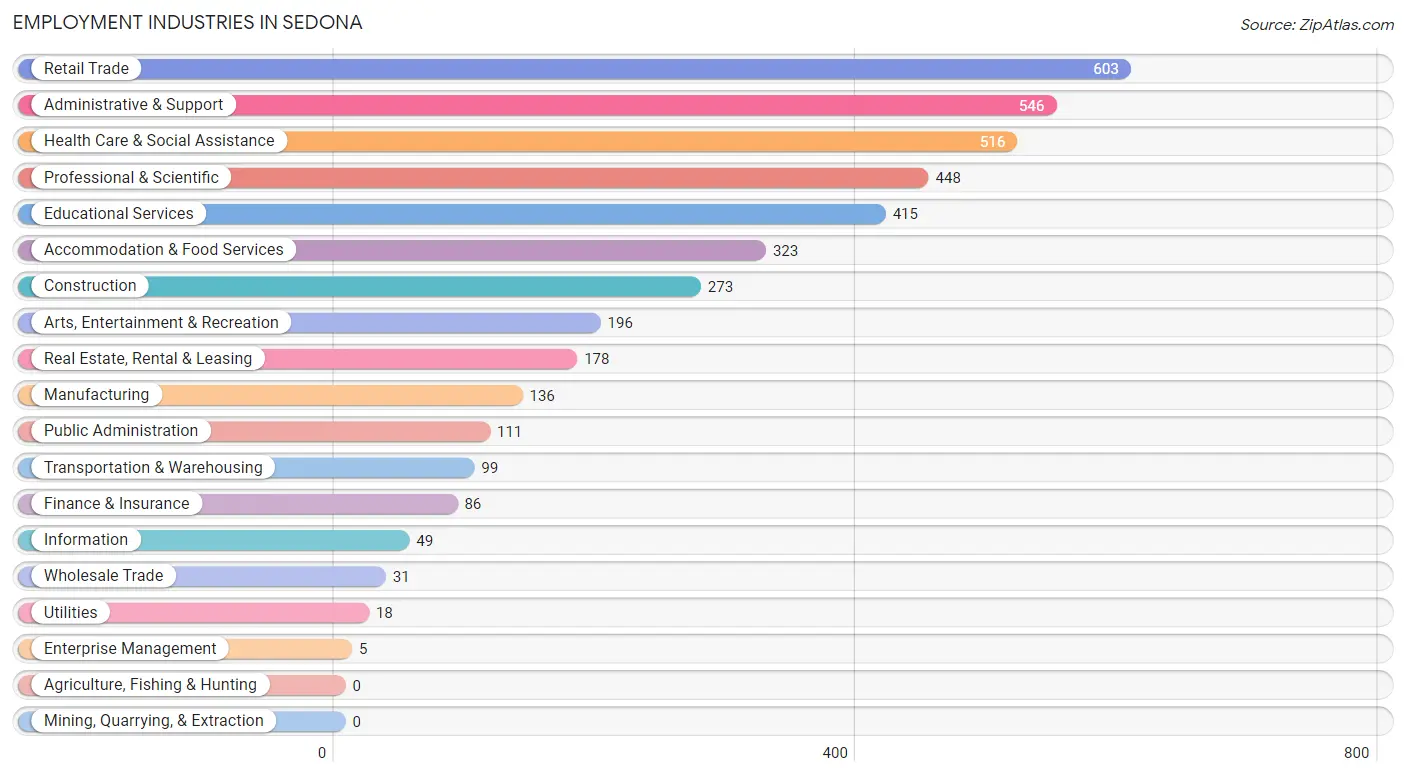
Employment Industries in Sedona
The major employment industries in Sedona include Retail Trade (603 | 14.2%), Administrative & Support (546 | 12.8%), Health Care & Social Assistance (516 | 12.1%), Professional & Scientific (448 | 10.5%), and Educational Services (415 | 9.8%).
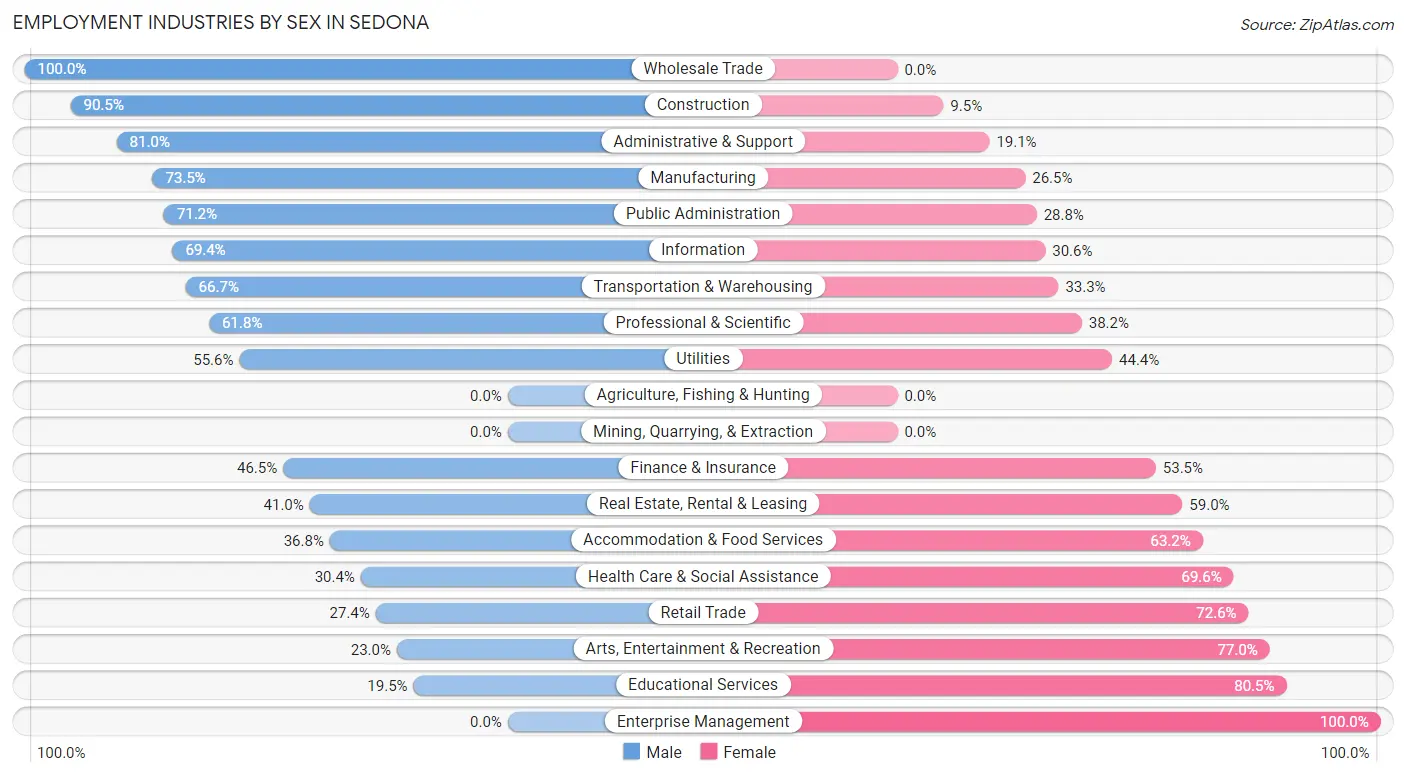
Employment Industries by Sex in Sedona
The Sedona industries that see more men than women are Wholesale Trade (100.0%), Construction (90.5%), and Administrative & Support (80.9%), whereas the industries that tend to have a higher number of women are Enterprise Management (100.0%), Educational Services (80.5%), and Arts, Entertainment & Recreation (77.0%).
| Industry | Male | Female |
| Agriculture, Fishing & Hunting | 0 (0.0%) | 0 (0.0%) |
| Mining, Quarrying, & Extraction | 0 (0.0%) | 0 (0.0%) |
| Construction | 247 (90.5%) | 26 (9.5%) |
| Manufacturing | 100 (73.5%) | 36 (26.5%) |
| Wholesale Trade | 31 (100.0%) | 0 (0.0%) |
| Retail Trade | 165 (27.4%) | 438 (72.6%) |
| Transportation & Warehousing | 66 (66.7%) | 33 (33.3%) |
| Utilities | 10 (55.6%) | 8 (44.4%) |
| Information | 34 (69.4%) | 15 (30.6%) |
| Finance & Insurance | 40 (46.5%) | 46 (53.5%) |
| Real Estate, Rental & Leasing | 73 (41.0%) | 105 (59.0%) |
| Professional & Scientific | 277 (61.8%) | 171 (38.2%) |
| Enterprise Management | 0 (0.0%) | 5 (100.0%) |
| Administrative & Support | 442 (80.9%) | 104 (19.1%) |
| Educational Services | 81 (19.5%) | 334 (80.5%) |
| Health Care & Social Assistance | 157 (30.4%) | 359 (69.6%) |
| Arts, Entertainment & Recreation | 45 (23.0%) | 151 (77.0%) |
| Accommodation & Food Services | 119 (36.8%) | 204 (63.2%) |
| Public Administration | 79 (71.2%) | 32 (28.8%) |
| Total | 2,078 (48.9%) | 2,175 (51.1%) |
Education in Sedona
School Enrollment in Sedona
The most common levels of schooling among the 1,283 students in Sedona are middle school (336 | 26.2%), elementary school (276 | 21.5%), and high school (247 | 19.3%).
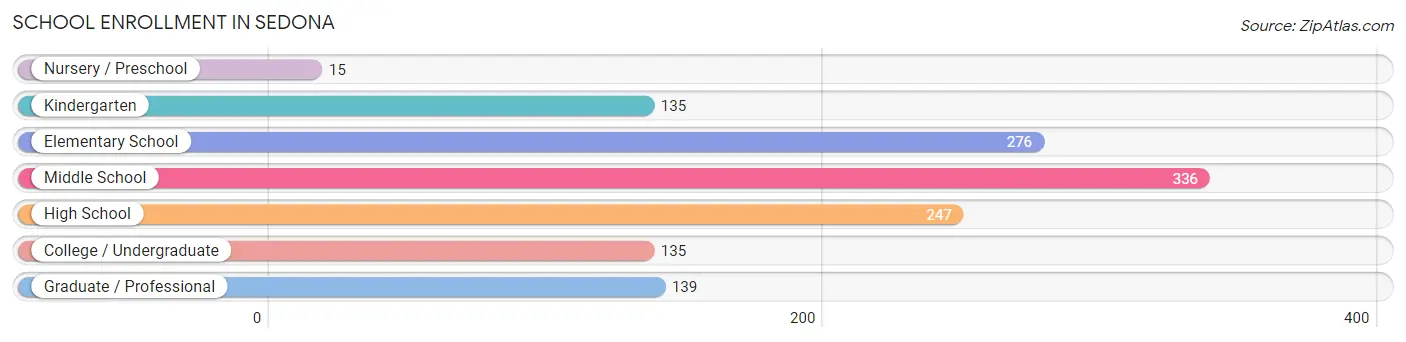
| School Level | # Students | % Students |
| Nursery / Preschool | 15 | 1.2% |
| Kindergarten | 135 | 10.5% |
| Elementary School | 276 | 21.5% |
| Middle School | 336 | 26.2% |
| High School | 247 | 19.3% |
| College / Undergraduate | 135 | 10.5% |
| Graduate / Professional | 139 | 10.8% |
| Total | 1,283 | 100.0% |
School Enrollment by Age by Funding Source in Sedona
Out of a total of 1,283 students who are enrolled in schools in Sedona, 384 (29.9%) attend a private institution, while the remaining 899 (70.1%) are enrolled in public schools. The age group of 15 to 17 year olds has the highest likelihood of being enrolled in private schools, with 135 (91.8% in the age bracket) enrolled. Conversely, the age group of 20 to 24 year olds has the lowest likelihood of being enrolled in a private school, with 43 (100.0% in the age bracket) attending a public institution.
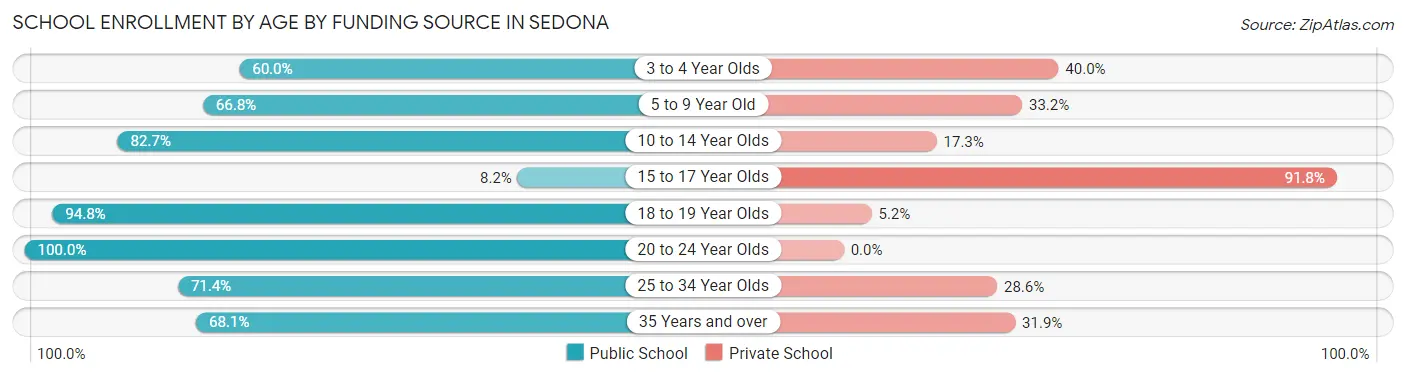
| Age Bracket | Public School | Private School |
| 3 to 4 Year Olds | 9 (60.0%) | 6 (40.0%) |
| 5 to 9 Year Old | 193 (66.8%) | 96 (33.2%) |
| 10 to 14 Year Olds | 387 (82.7%) | 81 (17.3%) |
| 15 to 17 Year Olds | 12 (8.2%) | 135 (91.8%) |
| 18 to 19 Year Olds | 128 (94.8%) | 7 (5.2%) |
| 20 to 24 Year Olds | 43 (100.0%) | 0 (0.0%) |
| 25 to 34 Year Olds | 30 (71.4%) | 12 (28.6%) |
| 35 Years and over | 98 (68.1%) | 46 (31.9%) |
| Total | 899 (70.1%) | 384 (29.9%) |
Educational Attainment by Field of Study in Sedona
Education (851 | 17.7%), social sciences (525 | 11.0%), business (504 | 10.5%), science & technology (420 | 8.8%), and bio, nature & agricultural (360 | 7.5%) are the most common fields of study among 4,794 individuals in Sedona who have obtained a bachelor's degree or higher.
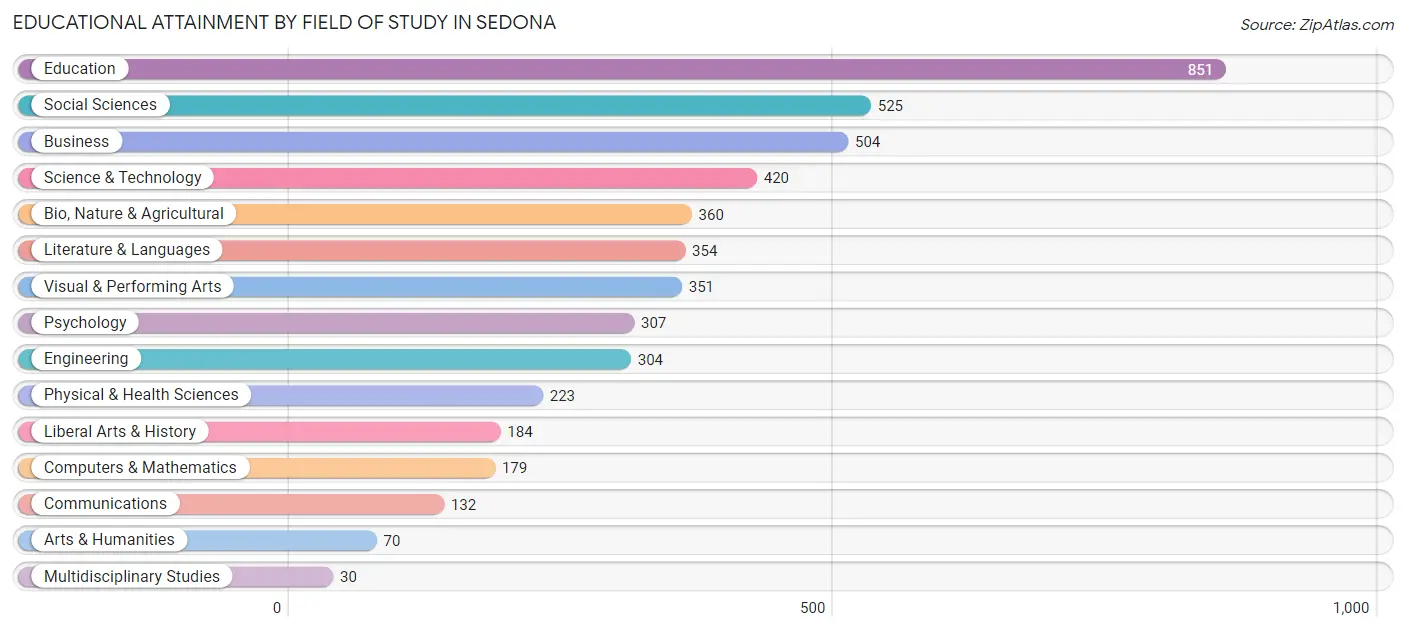
| Field of Study | # Graduates | % Graduates |
| Computers & Mathematics | 179 | 3.7% |
| Bio, Nature & Agricultural | 360 | 7.5% |
| Physical & Health Sciences | 223 | 4.6% |
| Psychology | 307 | 6.4% |
| Social Sciences | 525 | 11.0% |
| Engineering | 304 | 6.3% |
| Multidisciplinary Studies | 30 | 0.6% |
| Science & Technology | 420 | 8.8% |
| Business | 504 | 10.5% |
| Education | 851 | 17.7% |
| Literature & Languages | 354 | 7.4% |
| Liberal Arts & History | 184 | 3.8% |
| Visual & Performing Arts | 351 | 7.3% |
| Communications | 132 | 2.8% |
| Arts & Humanities | 70 | 1.5% |
| Total | 4,794 | 100.0% |
Transportation & Commute in Sedona
Vehicle Availability by Sex in Sedona
The most prevalent vehicle ownership categories in Sedona are males with 2 vehicles (1,299, accounting for 64.4%) and females with 2 vehicles (1,006, making up 60.0%).
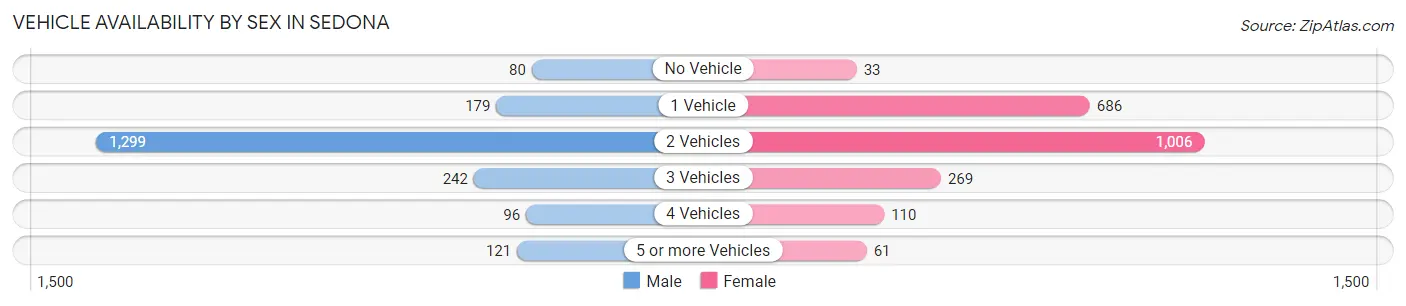
| Vehicles Available | Male | Female |
| No Vehicle | 80 (4.0%) | 33 (1.5%) |
| 1 Vehicle | 179 (8.9%) | 686 (31.7%) |
| 2 Vehicles | 1,299 (64.4%) | 1,006 (46.5%) |
| 3 Vehicles | 242 (12.0%) | 269 (12.4%) |
| 4 Vehicles | 96 (4.8%) | 110 (5.1%) |
| 5 or more Vehicles | 121 (6.0%) | 61 (2.8%) |
| Total | 2,017 (100.0%) | 2,165 (100.0%) |
Commute Time in Sedona
The most frequently occuring commute durations in Sedona are 30 to 34 minutes (553 commuters, 17.8%), 15 to 19 minutes (529 commuters, 17.1%), and 5 to 9 minutes (509 commuters, 16.4%).
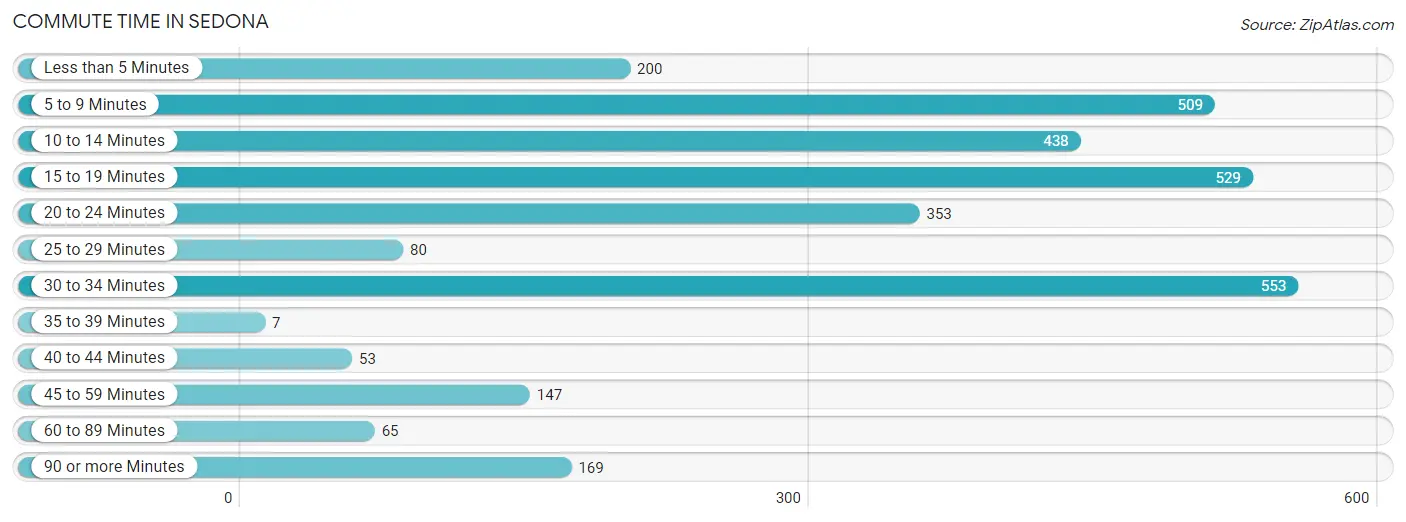
| Commute Time | # Commuters | % Commuters |
| Less than 5 Minutes | 200 | 6.5% |
| 5 to 9 Minutes | 509 | 16.4% |
| 10 to 14 Minutes | 438 | 14.1% |
| 15 to 19 Minutes | 529 | 17.1% |
| 20 to 24 Minutes | 353 | 11.4% |
| 25 to 29 Minutes | 80 | 2.6% |
| 30 to 34 Minutes | 553 | 17.8% |
| 35 to 39 Minutes | 7 | 0.2% |
| 40 to 44 Minutes | 53 | 1.7% |
| 45 to 59 Minutes | 147 | 4.7% |
| 60 to 89 Minutes | 65 | 2.1% |
| 90 or more Minutes | 169 | 5.4% |
Commute Time by Sex in Sedona
The most common commute times in Sedona are 30 to 34 minutes (483 commuters, 32.7%) for males and 15 to 19 minutes (458 commuters, 28.1%) for females.
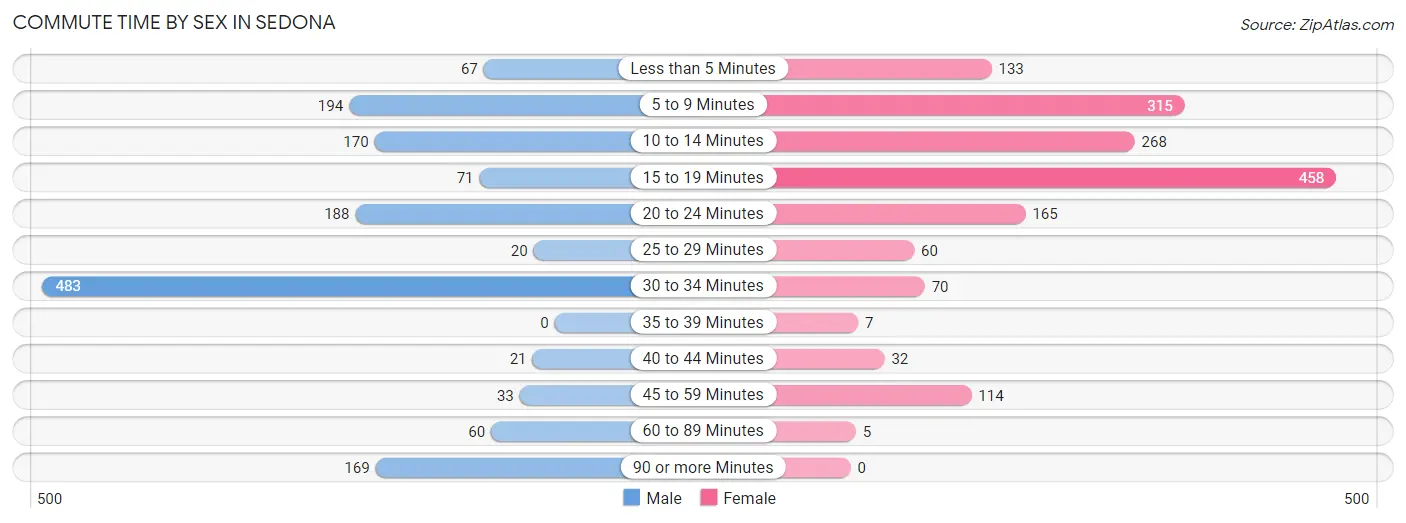
| Commute Time | Male | Female |
| Less than 5 Minutes | 67 (4.5%) | 133 (8.2%) |
| 5 to 9 Minutes | 194 (13.1%) | 315 (19.4%) |
| 10 to 14 Minutes | 170 (11.5%) | 268 (16.5%) |
| 15 to 19 Minutes | 71 (4.8%) | 458 (28.1%) |
| 20 to 24 Minutes | 188 (12.7%) | 165 (10.1%) |
| 25 to 29 Minutes | 20 (1.4%) | 60 (3.7%) |
| 30 to 34 Minutes | 483 (32.7%) | 70 (4.3%) |
| 35 to 39 Minutes | 0 (0.0%) | 7 (0.4%) |
| 40 to 44 Minutes | 21 (1.4%) | 32 (2.0%) |
| 45 to 59 Minutes | 33 (2.2%) | 114 (7.0%) |
| 60 to 89 Minutes | 60 (4.1%) | 5 (0.3%) |
| 90 or more Minutes | 169 (11.5%) | 0 (0.0%) |
Time of Departure to Work by Sex in Sedona
The most frequent times of departure to work in Sedona are 7:30 AM to 7:59 AM (501, 33.9%) for males and 12:00 PM to 3:59 PM (352, 21.6%) for females.
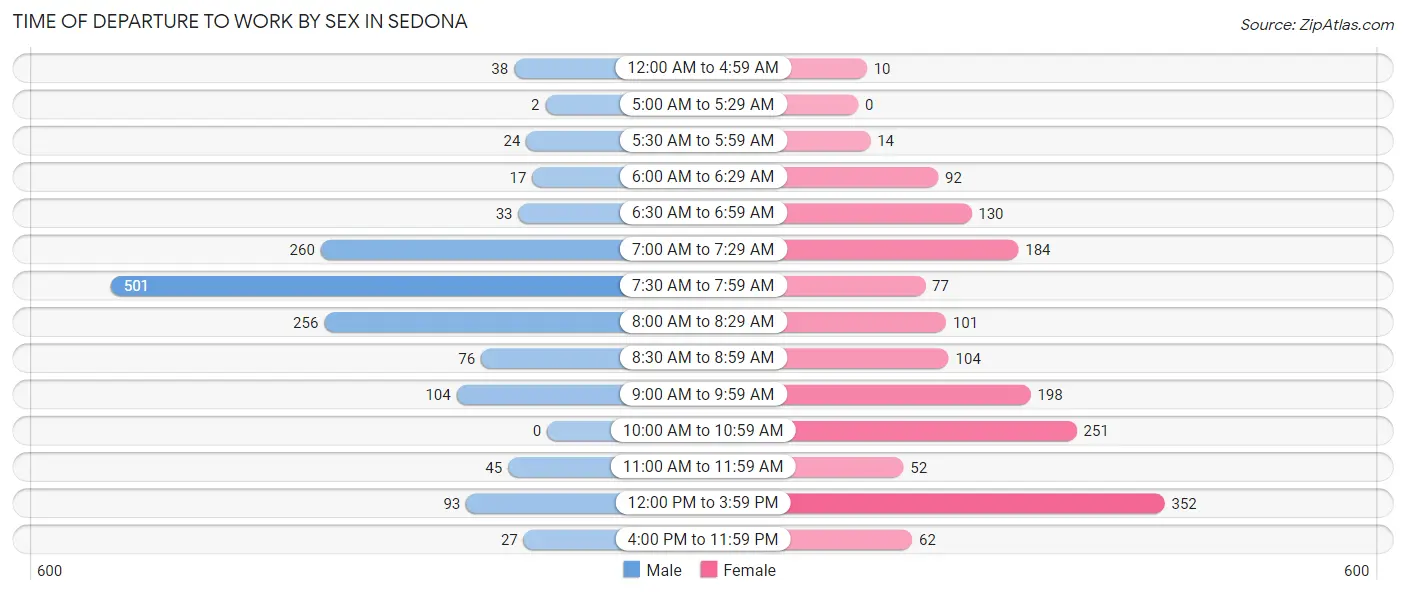
| Time of Departure | Male | Female |
| 12:00 AM to 4:59 AM | 38 (2.6%) | 10 (0.6%) |
| 5:00 AM to 5:29 AM | 2 (0.1%) | 0 (0.0%) |
| 5:30 AM to 5:59 AM | 24 (1.6%) | 14 (0.9%) |
| 6:00 AM to 6:29 AM | 17 (1.1%) | 92 (5.7%) |
| 6:30 AM to 6:59 AM | 33 (2.2%) | 130 (8.0%) |
| 7:00 AM to 7:29 AM | 260 (17.6%) | 184 (11.3%) |
| 7:30 AM to 7:59 AM | 501 (33.9%) | 77 (4.7%) |
| 8:00 AM to 8:29 AM | 256 (17.3%) | 101 (6.2%) |
| 8:30 AM to 8:59 AM | 76 (5.1%) | 104 (6.4%) |
| 9:00 AM to 9:59 AM | 104 (7.0%) | 198 (12.2%) |
| 10:00 AM to 10:59 AM | 0 (0.0%) | 251 (15.4%) |
| 11:00 AM to 11:59 AM | 45 (3.0%) | 52 (3.2%) |
| 12:00 PM to 3:59 PM | 93 (6.3%) | 352 (21.6%) |
| 4:00 PM to 11:59 PM | 27 (1.8%) | 62 (3.8%) |
| Total | 1,476 (100.0%) | 1,627 (100.0%) |
Housing Occupancy in Sedona
Occupancy by Ownership in Sedona
Of the total 4,936 dwellings in Sedona, owner-occupied units account for 3,758 (76.1%), while renter-occupied units make up 1,178 (23.9%).
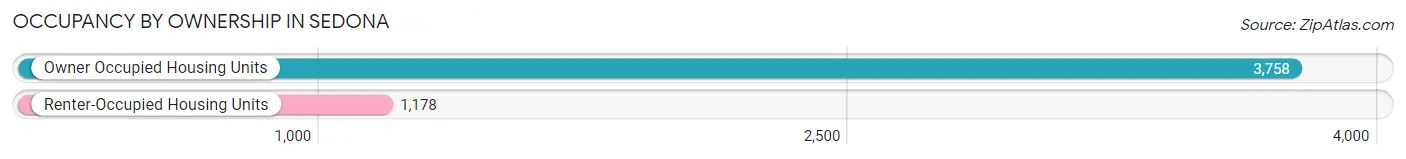
| Occupancy | # Housing Units | % Housing Units |
| Owner Occupied Housing Units | 3,758 | 76.1% |
| Renter-Occupied Housing Units | 1,178 | 23.9% |
| Total Occupied Housing Units | 4,936 | 100.0% |
Occupancy by Household Size in Sedona
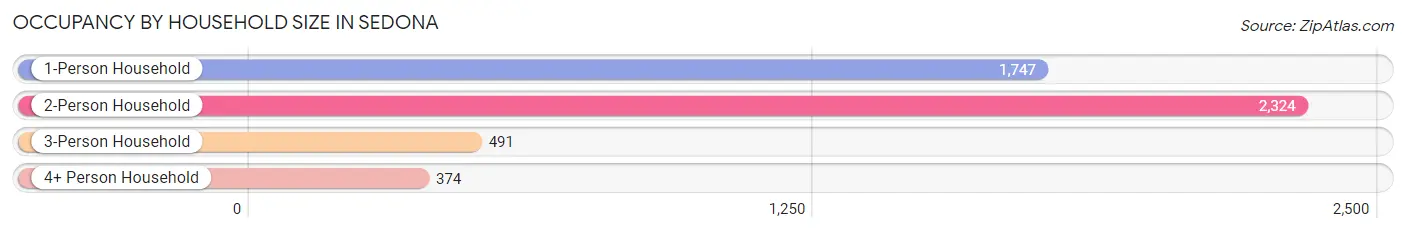
| Household Size | # Housing Units | % Housing Units |
| 1-Person Household | 1,747 | 35.4% |
| 2-Person Household | 2,324 | 47.1% |
| 3-Person Household | 491 | 10.0% |
| 4+ Person Household | 374 | 7.6% |
| Total Housing Units | 4,936 | 100.0% |
Occupancy by Ownership by Household Size in Sedona
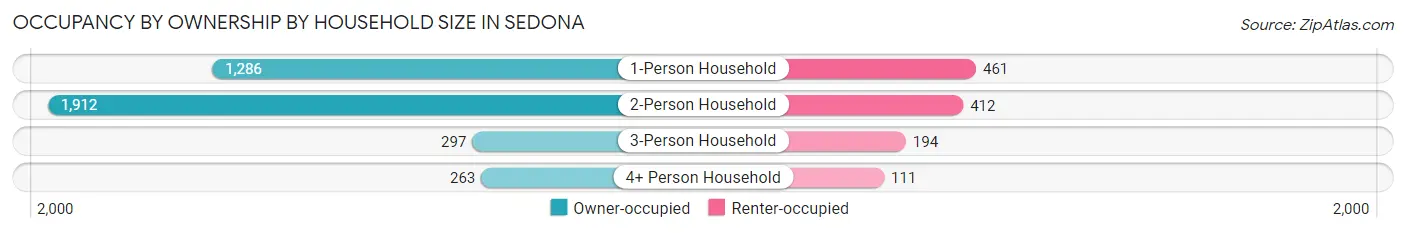
| Household Size | Owner-occupied | Renter-occupied |
| 1-Person Household | 1,286 (73.6%) | 461 (26.4%) |
| 2-Person Household | 1,912 (82.3%) | 412 (17.7%) |
| 3-Person Household | 297 (60.5%) | 194 (39.5%) |
| 4+ Person Household | 263 (70.3%) | 111 (29.7%) |
| Total Housing Units | 3,758 (76.1%) | 1,178 (23.9%) |
Occupancy by Educational Attainment in Sedona
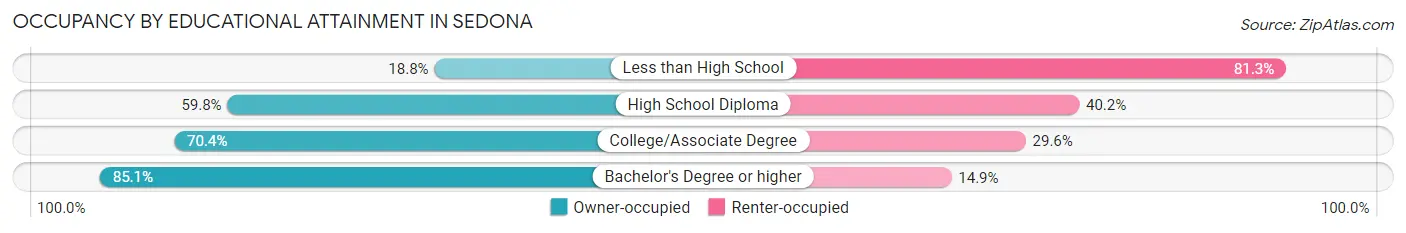
| Household Size | Owner-occupied | Renter-occupied |
| Less than High School | 30 (18.8%) | 130 (81.2%) |
| High School Diploma | 330 (59.8%) | 222 (40.2%) |
| College/Associate Degree | 938 (70.4%) | 395 (29.6%) |
| Bachelor's Degree or higher | 2,460 (85.1%) | 431 (14.9%) |
Occupancy by Age of Householder in Sedona
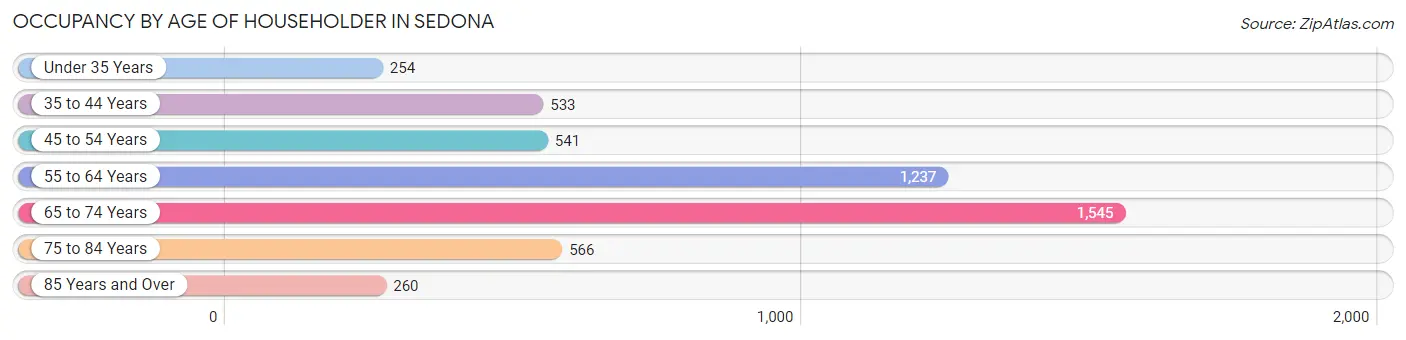
| Age Bracket | # Households | % Households |
| Under 35 Years | 254 | 5.1% |
| 35 to 44 Years | 533 | 10.8% |
| 45 to 54 Years | 541 | 11.0% |
| 55 to 64 Years | 1,237 | 25.1% |
| 65 to 74 Years | 1,545 | 31.3% |
| 75 to 84 Years | 566 | 11.5% |
| 85 Years and Over | 260 | 5.3% |
| Total | 4,936 | 100.0% |
Housing Finances in Sedona
Median Income by Occupancy in Sedona
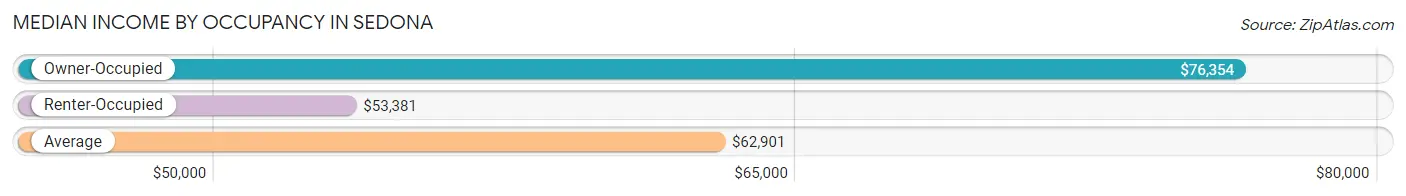
| Occupancy Type | # Households | Median Income |
| Owner-Occupied | 3,758 (76.1%) | $76,354 |
| Renter-Occupied | 1,178 (23.9%) | $53,381 |
| Average | 4,936 (100.0%) | $62,901 |
Occupancy by Householder Income Bracket in Sedona
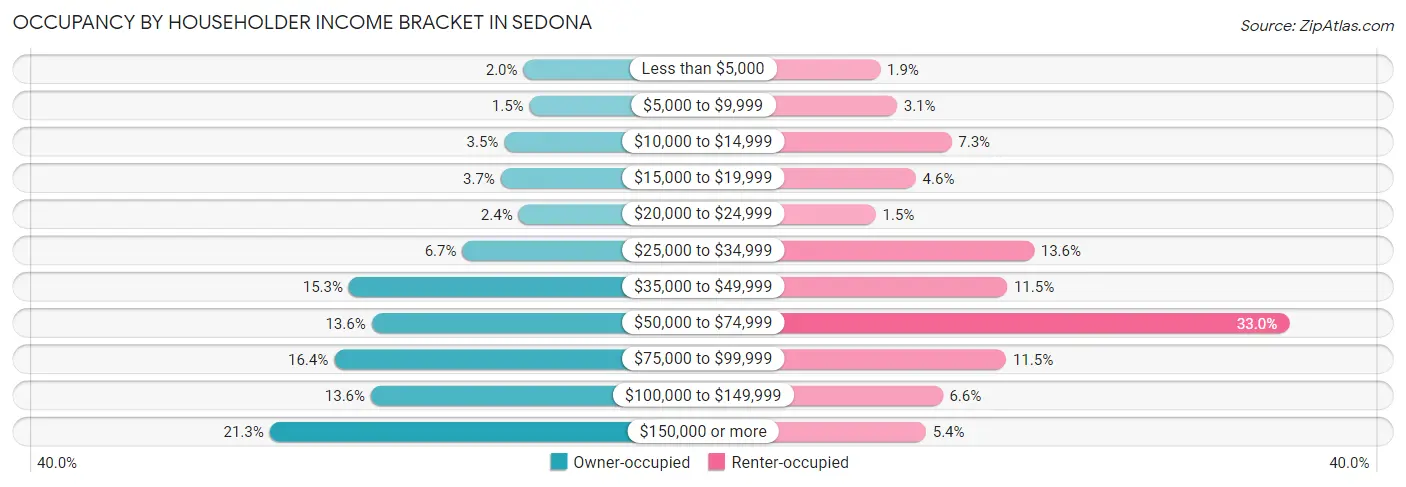
| Income Bracket | Owner-occupied | Renter-occupied |
| Less than $5,000 | 75 (2.0%) | 22 (1.9%) |
| $5,000 to $9,999 | 58 (1.5%) | 37 (3.1%) |
| $10,000 to $14,999 | 130 (3.5%) | 86 (7.3%) |
| $15,000 to $19,999 | 140 (3.7%) | 54 (4.6%) |
| $20,000 to $24,999 | 89 (2.4%) | 18 (1.5%) |
| $25,000 to $34,999 | 250 (6.7%) | 160 (13.6%) |
| $35,000 to $49,999 | 575 (15.3%) | 136 (11.5%) |
| $50,000 to $74,999 | 510 (13.6%) | 389 (33.0%) |
| $75,000 to $99,999 | 617 (16.4%) | 135 (11.5%) |
| $100,000 to $149,999 | 512 (13.6%) | 78 (6.6%) |
| $150,000 or more | 802 (21.3%) | 63 (5.3%) |
| Total | 3,758 (100.0%) | 1,178 (100.0%) |
Monthly Housing Cost Tiers in Sedona
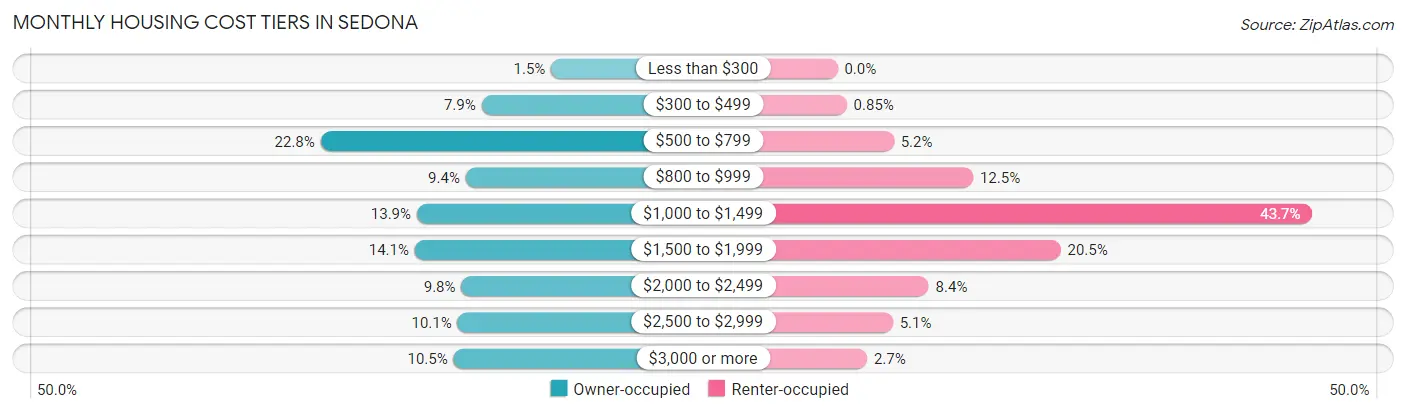
| Monthly Cost | Owner-occupied | Renter-occupied |
| Less than $300 | 57 (1.5%) | 0 (0.0%) |
| $300 to $499 | 298 (7.9%) | 10 (0.9%) |
| $500 to $799 | 855 (22.8%) | 61 (5.2%) |
| $800 to $999 | 353 (9.4%) | 147 (12.5%) |
| $1,000 to $1,499 | 522 (13.9%) | 515 (43.7%) |
| $1,500 to $1,999 | 529 (14.1%) | 242 (20.5%) |
| $2,000 to $2,499 | 368 (9.8%) | 99 (8.4%) |
| $2,500 to $2,999 | 381 (10.1%) | 60 (5.1%) |
| $3,000 or more | 395 (10.5%) | 32 (2.7%) |
| Total | 3,758 (100.0%) | 1,178 (100.0%) |
Physical Housing Characteristics in Sedona
Housing Structures in Sedona
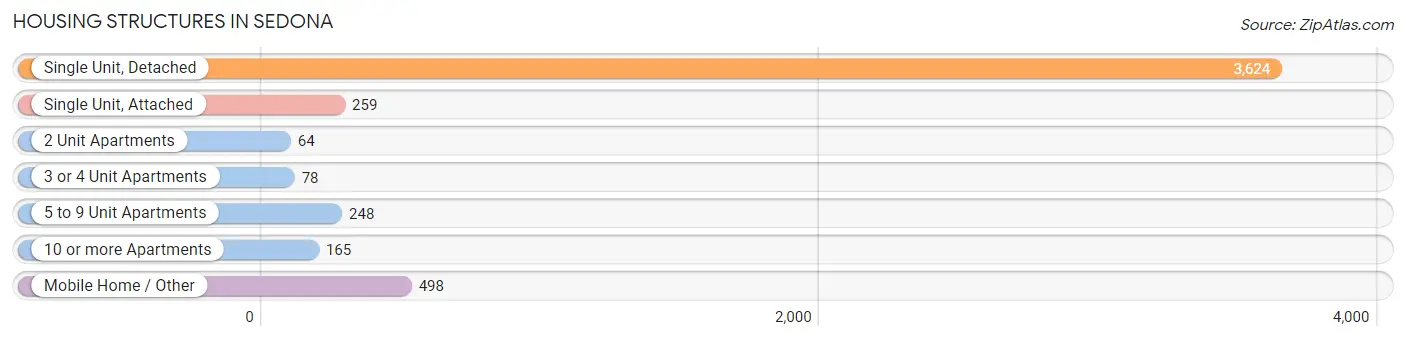
| Structure Type | # Housing Units | % Housing Units |
| Single Unit, Detached | 3,624 | 73.4% |
| Single Unit, Attached | 259 | 5.2% |
| 2 Unit Apartments | 64 | 1.3% |
| 3 or 4 Unit Apartments | 78 | 1.6% |
| 5 to 9 Unit Apartments | 248 | 5.0% |
| 10 or more Apartments | 165 | 3.3% |
| Mobile Home / Other | 498 | 10.1% |
| Total | 4,936 | 100.0% |
Housing Structures by Occupancy in Sedona
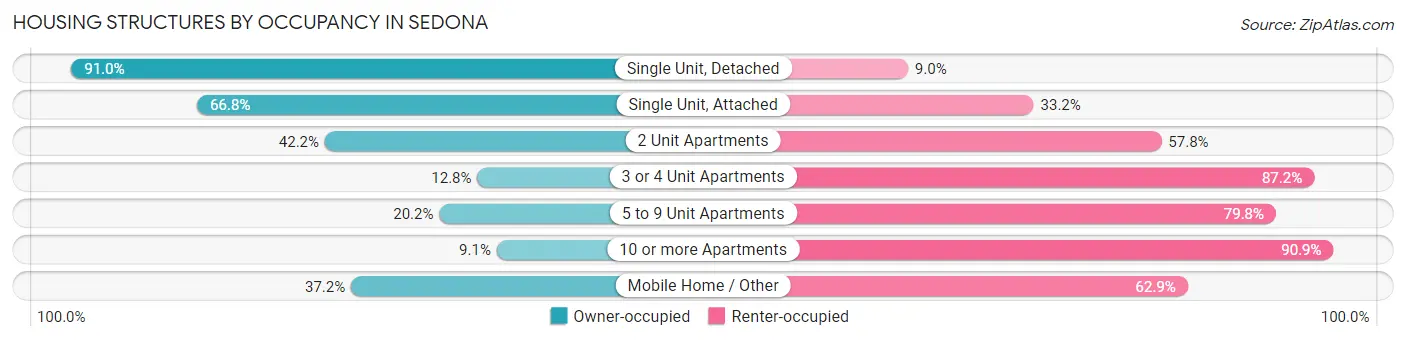
| Structure Type | Owner-occupied | Renter-occupied |
| Single Unit, Detached | 3,298 (91.0%) | 326 (9.0%) |
| Single Unit, Attached | 173 (66.8%) | 86 (33.2%) |
| 2 Unit Apartments | 27 (42.2%) | 37 (57.8%) |
| 3 or 4 Unit Apartments | 10 (12.8%) | 68 (87.2%) |
| 5 to 9 Unit Apartments | 50 (20.2%) | 198 (79.8%) |
| 10 or more Apartments | 15 (9.1%) | 150 (90.9%) |
| Mobile Home / Other | 185 (37.1%) | 313 (62.8%) |
| Total | 3,758 (76.1%) | 1,178 (23.9%) |
Housing Structures by Number of Rooms in Sedona
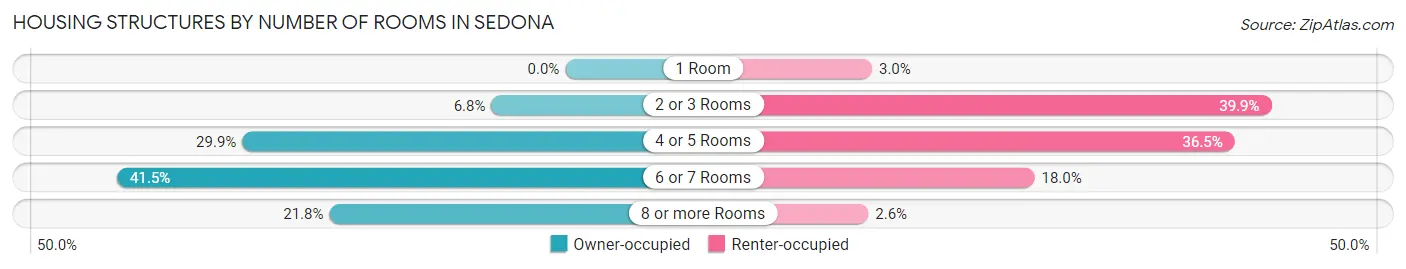
| Number of Rooms | Owner-occupied | Renter-occupied |
| 1 Room | 0 (0.0%) | 35 (3.0%) |
| 2 or 3 Rooms | 257 (6.8%) | 470 (39.9%) |
| 4 or 5 Rooms | 1,123 (29.9%) | 430 (36.5%) |
| 6 or 7 Rooms | 1,558 (41.5%) | 212 (18.0%) |
| 8 or more Rooms | 820 (21.8%) | 31 (2.6%) |
| Total | 3,758 (100.0%) | 1,178 (100.0%) |
Housing Structure by Heating Type in Sedona
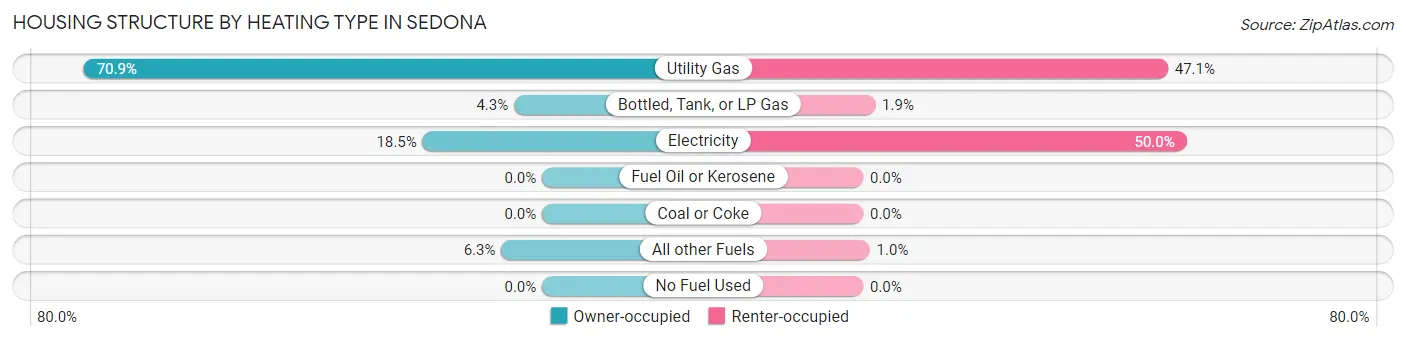
| Heating Type | Owner-occupied | Renter-occupied |
| Utility Gas | 2,663 (70.9%) | 555 (47.1%) |
| Bottled, Tank, or LP Gas | 163 (4.3%) | 22 (1.9%) |
| Electricity | 695 (18.5%) | 589 (50.0%) |
| Fuel Oil or Kerosene | 0 (0.0%) | 0 (0.0%) |
| Coal or Coke | 0 (0.0%) | 0 (0.0%) |
| All other Fuels | 237 (6.3%) | 12 (1.0%) |
| No Fuel Used | 0 (0.0%) | 0 (0.0%) |
| Total | 3,758 (100.0%) | 1,178 (100.0%) |
Household Vehicle Usage in Sedona
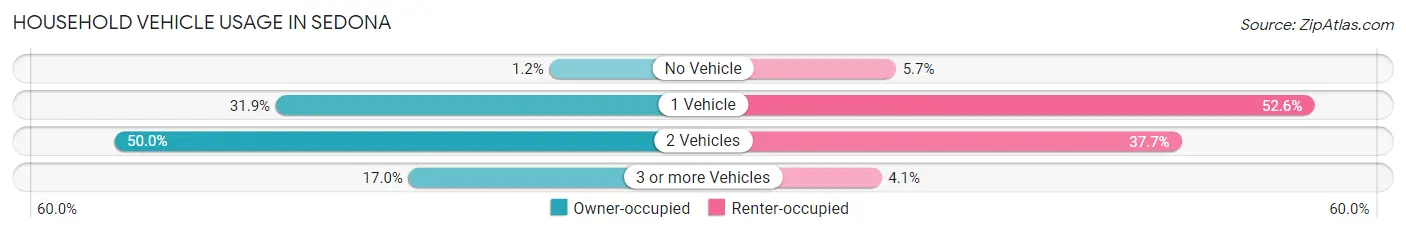
| Vehicles per Household | Owner-occupied | Renter-occupied |
| No Vehicle | 45 (1.2%) | 67 (5.7%) |
| 1 Vehicle | 1,197 (31.9%) | 619 (52.5%) |
| 2 Vehicles | 1,878 (50.0%) | 444 (37.7%) |
| 3 or more Vehicles | 638 (17.0%) | 48 (4.1%) |
| Total | 3,758 (100.0%) | 1,178 (100.0%) |
Real Estate & Mortgages in Sedona
Real Estate and Mortgage Overview in Sedona
| Characteristic | Without Mortgage | With Mortgage |
| Housing Units | 1,918 | 1,840 |
| Median Property Value | $700,200 | $618,600 |
| Median Household Income | $62,179 | $448 |
| Monthly Housing Costs | $703 | $395 |
| Real Estate Taxes | $3,368 | $74 |
Property Value by Mortgage Status in Sedona
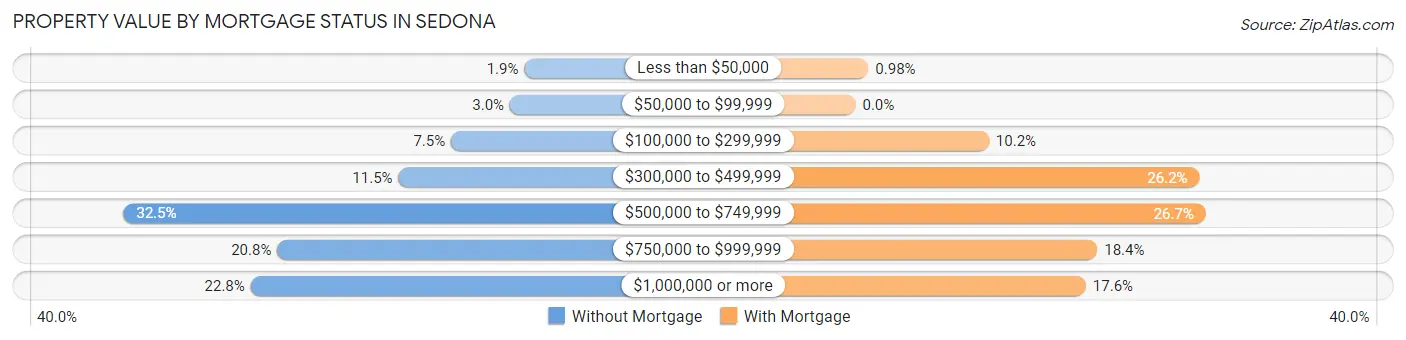
| Property Value | Without Mortgage | With Mortgage |
| Less than $50,000 | 37 (1.9%) | 18 (1.0%) |
| $50,000 to $99,999 | 58 (3.0%) | 0 (0.0%) |
| $100,000 to $299,999 | 144 (7.5%) | 187 (10.2%) |
| $300,000 to $499,999 | 221 (11.5%) | 482 (26.2%) |
| $500,000 to $749,999 | 623 (32.5%) | 491 (26.7%) |
| $750,000 to $999,999 | 398 (20.7%) | 339 (18.4%) |
| $1,000,000 or more | 437 (22.8%) | 323 (17.5%) |
| Total | 1,918 (100.0%) | 1,840 (100.0%) |
Household Income by Mortgage Status in Sedona
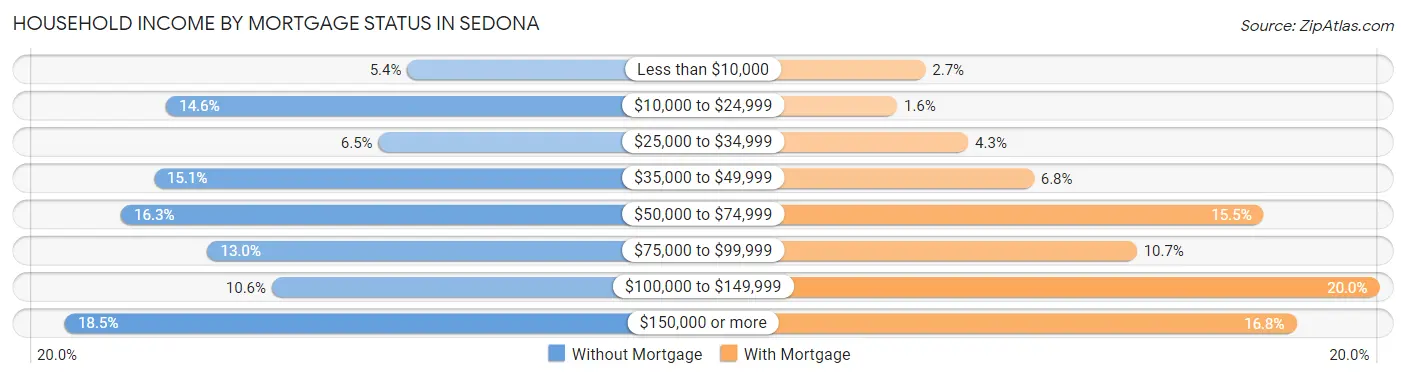
| Household Income | Without Mortgage | With Mortgage |
| Less than $10,000 | 104 (5.4%) | 49 (2.7%) |
| $10,000 to $24,999 | 280 (14.6%) | 29 (1.6%) |
| $25,000 to $34,999 | 125 (6.5%) | 79 (4.3%) |
| $35,000 to $49,999 | 289 (15.1%) | 125 (6.8%) |
| $50,000 to $74,999 | 313 (16.3%) | 286 (15.5%) |
| $75,000 to $99,999 | 250 (13.0%) | 197 (10.7%) |
| $100,000 to $149,999 | 203 (10.6%) | 367 (20.0%) |
| $150,000 or more | 354 (18.5%) | 309 (16.8%) |
| Total | 1,918 (100.0%) | 1,840 (100.0%) |
Property Value to Household Income Ratio in Sedona
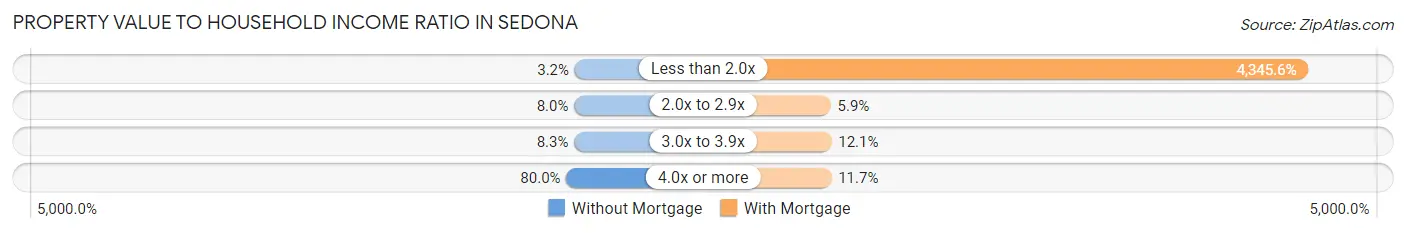
| Value-to-Income Ratio | Without Mortgage | With Mortgage |
| Less than 2.0x | 61 (3.2%) | 79,959 (4,345.6%) |
| 2.0x to 2.9x | 154 (8.0%) | 108 (5.9%) |
| 3.0x to 3.9x | 160 (8.3%) | 222 (12.1%) |
| 4.0x or more | 1,535 (80.0%) | 216 (11.7%) |
| Total | 1,918 (100.0%) | 1,840 (100.0%) |
Real Estate Taxes by Mortgage Status in Sedona
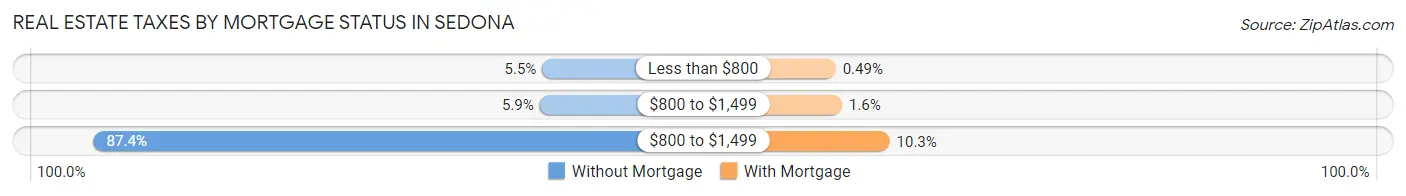
| Property Taxes | Without Mortgage | With Mortgage |
| Less than $800 | 105 (5.5%) | 9 (0.5%) |
| $800 to $1,499 | 114 (5.9%) | 30 (1.6%) |
| $800 to $1,499 | 1,676 (87.4%) | 190 (10.3%) |
| Total | 1,918 (100.0%) | 1,840 (100.0%) |
Health & Disability in Sedona
Health Insurance Coverage by Age in Sedona
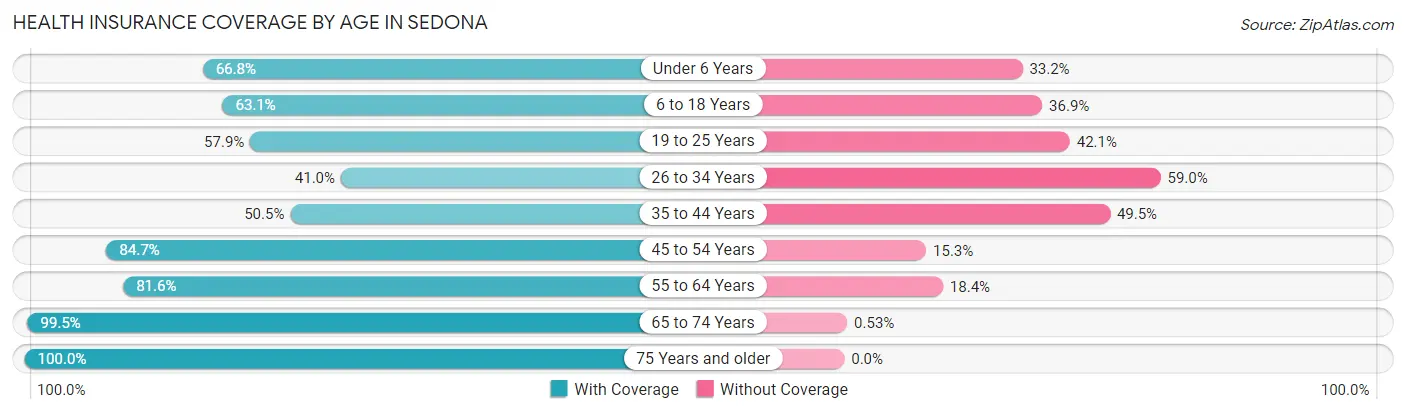
| Age Bracket | With Coverage | Without Coverage |
| Under 6 Years | 193 (66.8%) | 96 (33.2%) |
| 6 to 18 Years | 602 (63.1%) | 352 (36.9%) |
| 19 to 25 Years | 146 (57.9%) | 106 (42.1%) |
| 26 to 34 Years | 265 (41.0%) | 381 (59.0%) |
| 35 to 44 Years | 494 (50.5%) | 485 (49.5%) |
| 45 to 54 Years | 816 (84.7%) | 147 (15.3%) |
| 55 to 64 Years | 1,717 (81.6%) | 387 (18.4%) |
| 65 to 74 Years | 2,259 (99.5%) | 12 (0.5%) |
| 75 Years and older | 1,280 (100.0%) | 0 (0.0%) |
| Total | 7,772 (79.8%) | 1,966 (20.2%) |
Health Insurance Coverage by Citizenship Status in Sedona
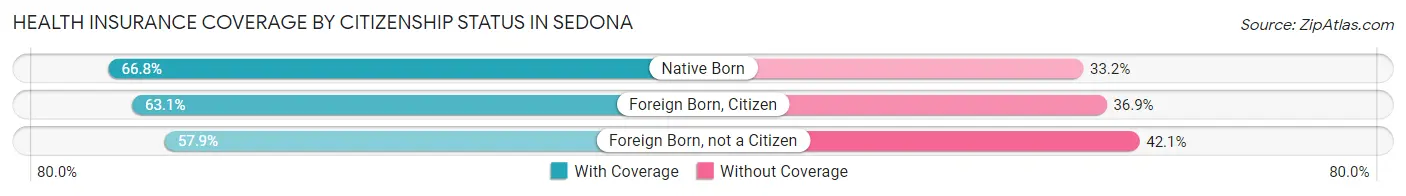
| Citizenship Status | With Coverage | Without Coverage |
| Native Born | 193 (66.8%) | 96 (33.2%) |
| Foreign Born, Citizen | 602 (63.1%) | 352 (36.9%) |
| Foreign Born, not a Citizen | 146 (57.9%) | 106 (42.1%) |
Health Insurance Coverage by Household Income in Sedona
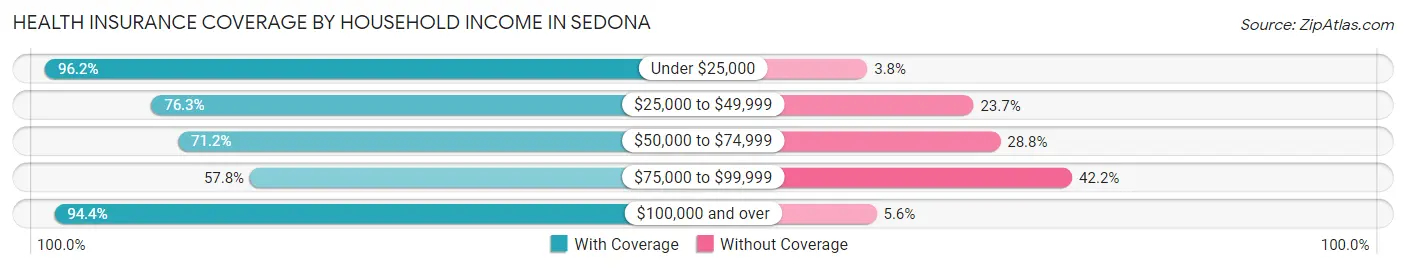
| Household Income | With Coverage | Without Coverage |
| Under $25,000 | 926 (96.2%) | 37 (3.8%) |
| $25,000 to $49,999 | 1,471 (76.3%) | 458 (23.7%) |
| $50,000 to $74,999 | 1,251 (71.2%) | 505 (28.8%) |
| $75,000 to $99,999 | 1,070 (57.8%) | 782 (42.2%) |
| $100,000 and over | 3,051 (94.4%) | 180 (5.6%) |
Public vs Private Health Insurance Coverage by Age in Sedona
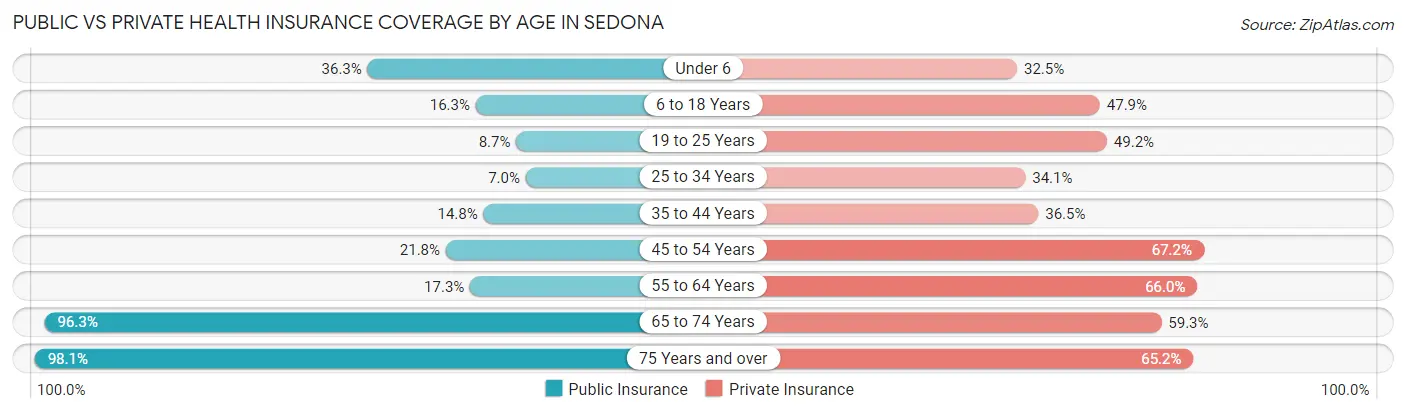
| Age Bracket | Public Insurance | Private Insurance |
| Under 6 | 105 (36.3%) | 94 (32.5%) |
| 6 to 18 Years | 155 (16.3%) | 457 (47.9%) |
| 19 to 25 Years | 22 (8.7%) | 124 (49.2%) |
| 25 to 34 Years | 45 (7.0%) | 220 (34.1%) |
| 35 to 44 Years | 145 (14.8%) | 357 (36.5%) |
| 45 to 54 Years | 210 (21.8%) | 647 (67.2%) |
| 55 to 64 Years | 364 (17.3%) | 1,388 (66.0%) |
| 65 to 74 Years | 2,187 (96.3%) | 1,347 (59.3%) |
| 75 Years and over | 1,256 (98.1%) | 835 (65.2%) |
| Total | 4,489 (46.1%) | 5,469 (56.2%) |
Disability Status by Sex by Age in Sedona
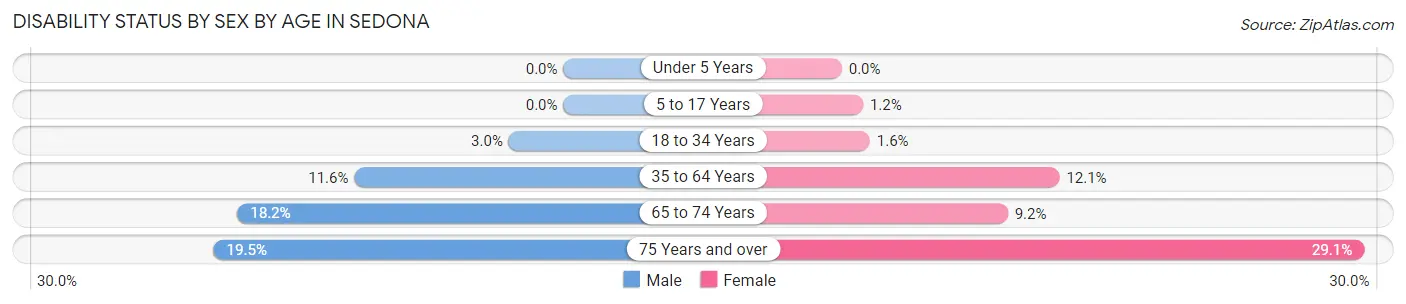
| Age Bracket | Male | Female |
| Under 5 Years | 0 (0.0%) | 0 (0.0%) |
| 5 to 17 Years | 0 (0.0%) | 7 (1.2%) |
| 18 to 34 Years | 20 (3.0%) | 6 (1.6%) |
| 35 to 64 Years | 206 (11.6%) | 276 (12.1%) |
| 65 to 74 Years | 196 (18.1%) | 110 (9.2%) |
| 75 Years and over | 118 (19.5%) | 196 (29.1%) |
Disability Class by Sex by Age in Sedona
Disability Class: Hearing Difficulty
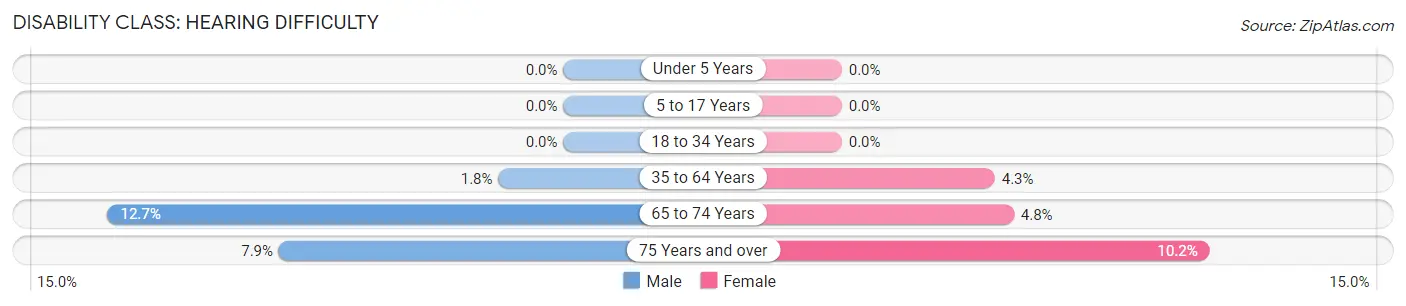
| Age Bracket | Male | Female |
| Under 5 Years | 0 (0.0%) | 0 (0.0%) |
| 5 to 17 Years | 0 (0.0%) | 0 (0.0%) |
| 18 to 34 Years | 0 (0.0%) | 0 (0.0%) |
| 35 to 64 Years | 32 (1.8%) | 97 (4.3%) |
| 65 to 74 Years | 137 (12.7%) | 57 (4.8%) |
| 75 Years and over | 48 (7.9%) | 69 (10.2%) |
Disability Class: Vision Difficulty
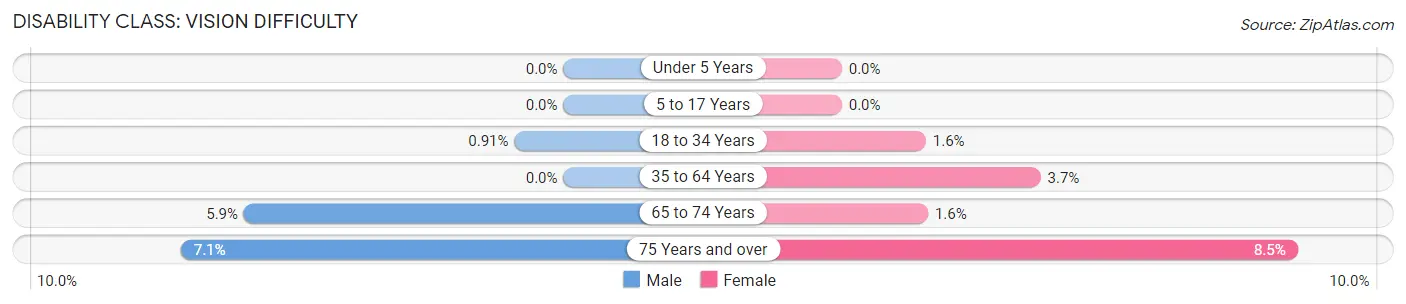
| Age Bracket | Male | Female |
| Under 5 Years | 0 (0.0%) | 0 (0.0%) |
| 5 to 17 Years | 0 (0.0%) | 0 (0.0%) |
| 18 to 34 Years | 6 (0.9%) | 6 (1.6%) |
| 35 to 64 Years | 0 (0.0%) | 84 (3.7%) |
| 65 to 74 Years | 64 (5.9%) | 19 (1.6%) |
| 75 Years and over | 43 (7.1%) | 57 (8.5%) |
Disability Class: Cognitive Difficulty
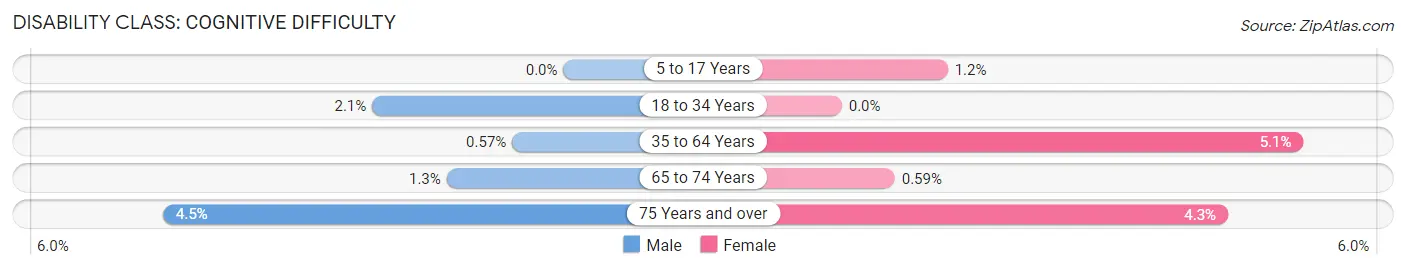
| Age Bracket | Male | Female |
| 5 to 17 Years | 0 (0.0%) | 7 (1.2%) |
| 18 to 34 Years | 14 (2.1%) | 0 (0.0%) |
| 35 to 64 Years | 10 (0.6%) | 117 (5.1%) |
| 65 to 74 Years | 14 (1.3%) | 7 (0.6%) |
| 75 Years and over | 27 (4.5%) | 29 (4.3%) |
Disability Class: Ambulatory Difficulty
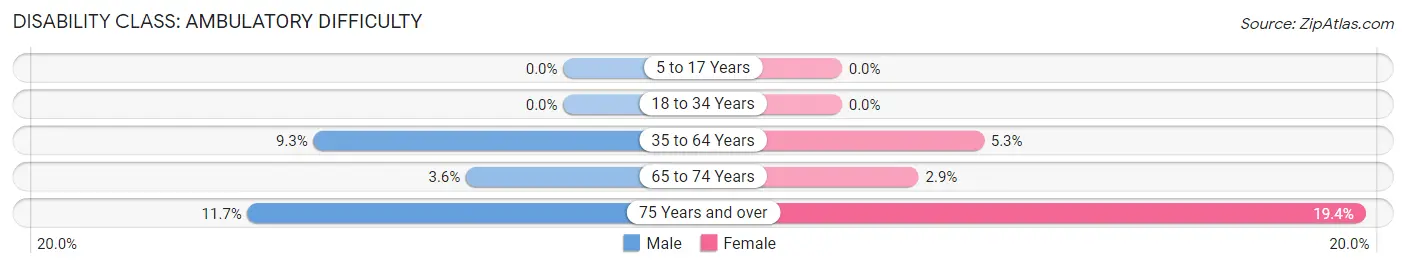
| Age Bracket | Male | Female |
| 5 to 17 Years | 0 (0.0%) | 0 (0.0%) |
| 18 to 34 Years | 0 (0.0%) | 0 (0.0%) |
| 35 to 64 Years | 164 (9.3%) | 120 (5.3%) |
| 65 to 74 Years | 39 (3.6%) | 34 (2.9%) |
| 75 Years and over | 71 (11.7%) | 131 (19.4%) |
Disability Class: Self-Care Difficulty
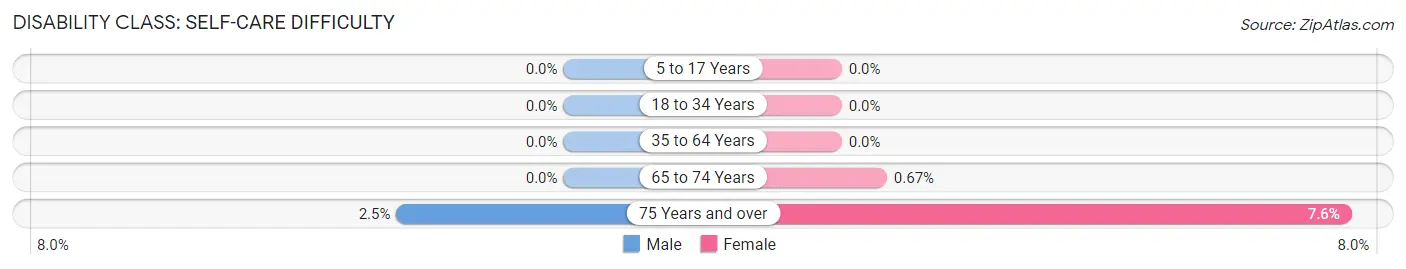
| Age Bracket | Male | Female |
| 5 to 17 Years | 0 (0.0%) | 0 (0.0%) |
| 18 to 34 Years | 0 (0.0%) | 0 (0.0%) |
| 35 to 64 Years | 0 (0.0%) | 0 (0.0%) |
| 65 to 74 Years | 0 (0.0%) | 8 (0.7%) |
| 75 Years and over | 15 (2.5%) | 51 (7.6%) |
Technology Access in Sedona
Computing Device Access in Sedona
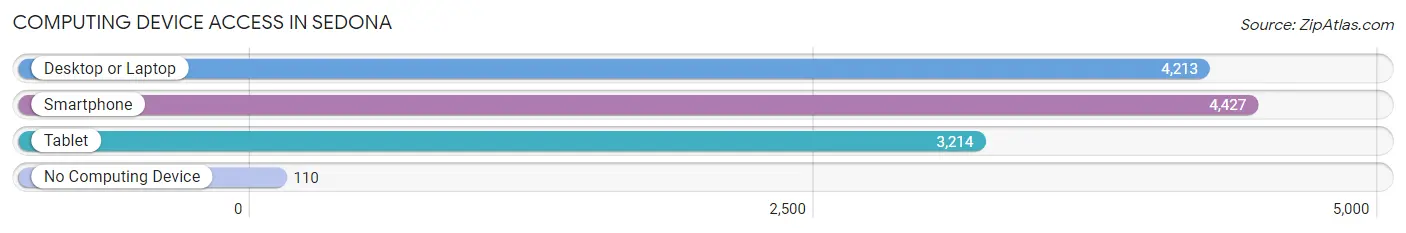
| Device Type | # Households | % Households |
| Desktop or Laptop | 4,213 | 85.4% |
| Smartphone | 4,427 | 89.7% |
| Tablet | 3,214 | 65.1% |
| No Computing Device | 110 | 2.2% |
| Total | 4,936 | 100.0% |
Internet Access in Sedona
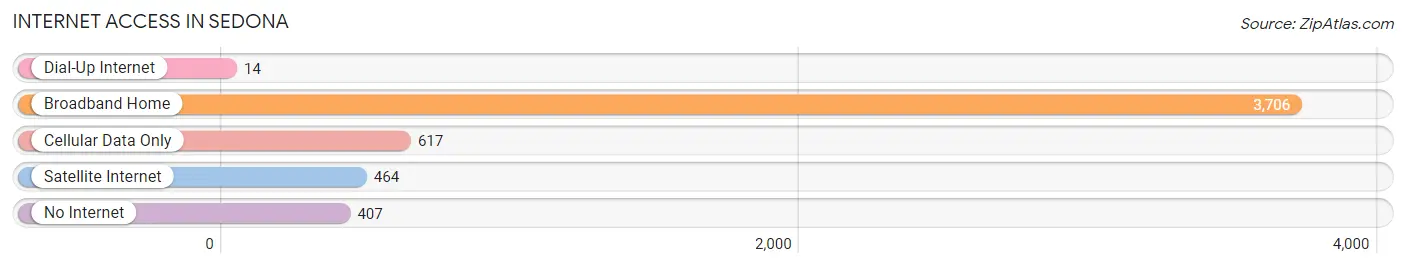
| Internet Type | # Households | % Households |
| Dial-Up Internet | 14 | 0.3% |
| Broadband Home | 3,706 | 75.1% |
| Cellular Data Only | 617 | 12.5% |
| Satellite Internet | 464 | 9.4% |
| No Internet | 407 | 8.3% |
| Total | 4,936 | 100.0% |
Sedona Summary
Sedona, Arizona is a small city located in the northern part of the state, in the heart of the Coconino National Forest. It is known for its stunning red rock formations, which have made it a popular tourist destination. The city has a population of approximately 10,000 people, and is located in Yavapai County.
History
The area that is now Sedona was first inhabited by the Sinagua people, who lived in the area from about 500 AD to 1400 AD. The Sinagua were a semi-nomadic people who lived in small villages and farmed the land. They left behind many artifacts, including pottery and petroglyphs, which can still be seen in the area today.
In the late 1800s, the area was settled by ranchers and miners. The first post office was established in 1902, and the town was officially incorporated in 1988.
Geography
Sedona is located in the northern part of Arizona, in the heart of the Coconino National Forest. It is surrounded by red rock formations, which are the result of millions of years of erosion. The city is located at an elevation of 4,500 feet, and has a mild climate with hot summers and cool winters.
Economy
The economy of Sedona is largely based on tourism. The city is a popular destination for outdoor activities such as hiking, mountain biking, and rock climbing. It is also home to many art galleries, restaurants, and shops. The city also has a thriving film industry, with many movies and television shows being filmed in the area.
Demographics
As of the 2010 census, the population of Sedona was 10,031. The racial makeup of the city was 87.3% White, 0.7% African American, 0.9% Native American, 0.9% Asian, 0.1% Pacific Islander, 8.2% from other races, and 2.0% from two or more races. Hispanic or Latino of any race were 16.2% of the population.
The median income for a household in the city was $45,813, and the median income for a family was $51,919. The per capita income for the city was $27,845. About 10.2% of families and 13.3% of the population were below the poverty line, including 17.2% of those under age 18 and 6.2% of those age 65 or over.
Conclusion
Sedona, Arizona is a small city located in the northern part of the state, in the heart of the Coconino National Forest. It is known for its stunning red rock formations, which have made it a popular tourist destination. The city has a population of approximately 10,000 people, and is largely supported by its tourism industry. The city has a diverse population, with a median income of $45,813 and a per capita income of $27,845. Sedona is a beautiful city with a rich history and culture, and is a great place to visit or live.
Common Questions
What is the Total Population of Sedona?
Total Population of Sedona is 9,739.
What is the Total Male Population of Sedona?
Total Male Population of Sedona is 4,530.
What is the Total Female Population of Sedona?
Total Female Population of Sedona is 5,209.
What is the Ratio of Males per 100 Females in Sedona?
There are 86.96 Males per 100 Females in Sedona.
What is the Ratio of Females per 100 Males in Sedona?
There are 114.99 Females per 100 Males in Sedona.
What is the Median Population Age in Sedona?
Median Population Age in Sedona is 58.7 Years.
What is the Average Family Size in Sedona
Average Family Size in Sedona is 2.5 People.
What is the Average Household Size in Sedona
Average Household Size in Sedona is 2.0 People.
What is Per Capita Income in Sedona?
Per Capita income in Sedona is $49,801.
What is the Median Family Income in Sedona?
Median Family Income in Sedona is $83,655.
What is the Median Household income in Sedona?
Median Household Income in Sedona is $62,901.
What is Income or Wage Gap in Sedona?
Income or Wage Gap in Sedona is 0.1%.
Women in Sedona earn 99.9 cents for every dollar earned by a man.
What is Inequality or Gini Index in Sedona?
Inequality or Gini Index in Sedona is 0.48.
How Large is the Labor Force in Sedona?
There are 4,612 People in the Labor Forcein in Sedona.
What is the Percentage of People in the Labor Force in Sedona?
52.5% of People are in the Labor Force in Sedona.
What is the Unemployment Rate in Sedona?
Unemployment Rate in Sedona is 7.7%.