Dollars Corner, WA
Dollars Corner Map
Dollars Corner Overview
824
TOTAL POPULATION
425
MALE POPULATION
399
FEMALE POPULATION
106.52
MALES / 100 FEMALES
93.88
FEMALES / 100 MALES
37.8
MEDIAN AGE
3.2
AVG FAMILY SIZE
2.9
AVG HOUSEHOLD SIZE
$43,853
PER CAPITA INCOME
$114,583
AVG FAMILY INCOME
$113,802
AVG HOUSEHOLD INCOME
$19,440
FAMILY INCOME DEFICIT
0.40
INEQUALITY / GINI INDEX
523
LABOR FORCE [ PEOPLE ]
73.6%
PERCENT IN LABOR FORCE
0.8%
UNEMPLOYMENT RATE
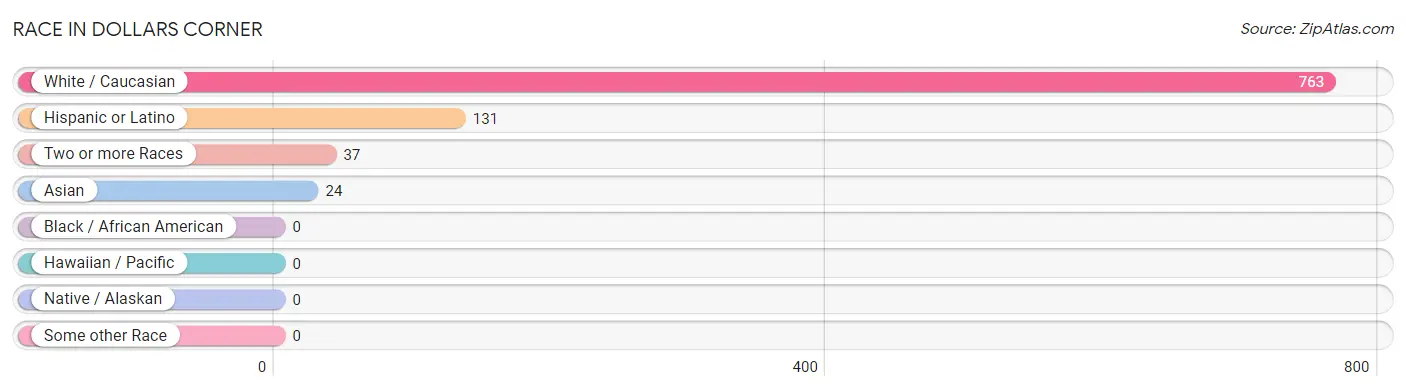
Race in Dollars Corner
The most populous races in Dollars Corner are White / Caucasian (763 | 92.6%), Hispanic or Latino (131 | 15.9%), and Two or more Races (37 | 4.5%).
| Race | # Population | % Population |
| Asian | 24 | 2.9% |
| Black / African American | 0 | 0.0% |
| Hawaiian / Pacific | 0 | 0.0% |
| Hispanic or Latino | 131 | 15.9% |
| Native / Alaskan | 0 | 0.0% |
| White / Caucasian | 763 | 92.6% |
| Two or more Races | 37 | 4.5% |
| Some other Race | 0 | 0.0% |
| Total | 824 | 100.0% |
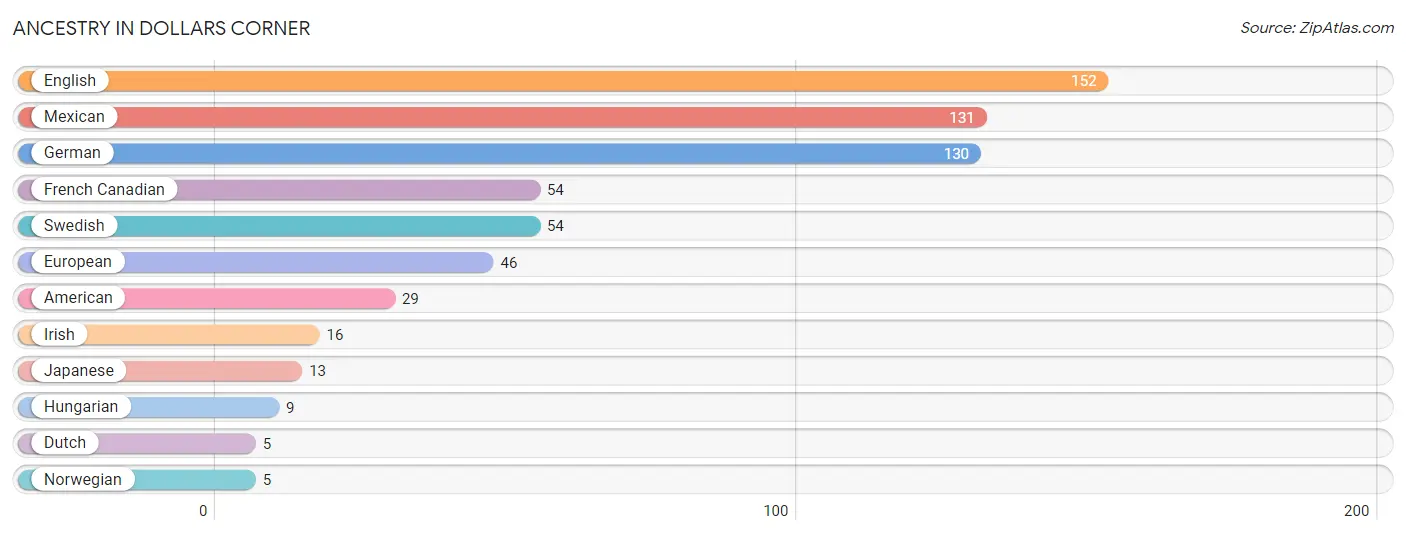
Ancestry in Dollars Corner
The most populous ancestries reported in Dollars Corner are English (152 | 18.4%), Mexican (131 | 15.9%), German (130 | 15.8%), French Canadian (54 | 6.6%), and Swedish (54 | 6.6%), together accounting for 63.2% of all Dollars Corner residents.
| Ancestry | # Population | % Population |
| American | 29 | 3.5% |
| Dutch | 5 | 0.6% |
| English | 152 | 18.4% |
| European | 46 | 5.6% |
| French Canadian | 54 | 6.6% |
| German | 130 | 15.8% |
| Hungarian | 9 | 1.1% |
| Irish | 16 | 1.9% |
| Japanese | 13 | 1.6% |
| Mexican | 131 | 15.9% |
| Norwegian | 5 | 0.6% |
| Swedish | 54 | 6.6% | View All 12 Rows |
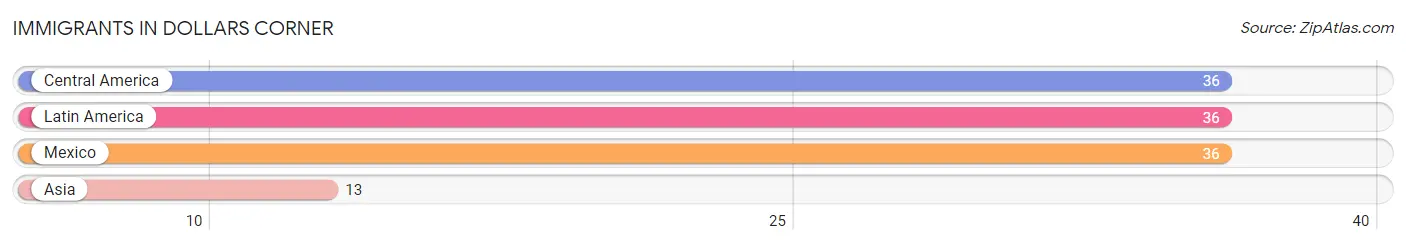
Immigrants in Dollars Corner
The most numerous immigrant groups reported in Dollars Corner came from Central America (36 | 4.4%), Latin America (36 | 4.4%), Mexico (36 | 4.4%), and Asia (13 | 1.6%), together accounting for 14.7% of all Dollars Corner residents.
| Immigration Origin | # Population | % Population |
| Asia | 13 | 1.6% |
| Central America | 36 | 4.4% |
| Latin America | 36 | 4.4% |
| Mexico | 36 | 4.4% | View All 4 Rows |
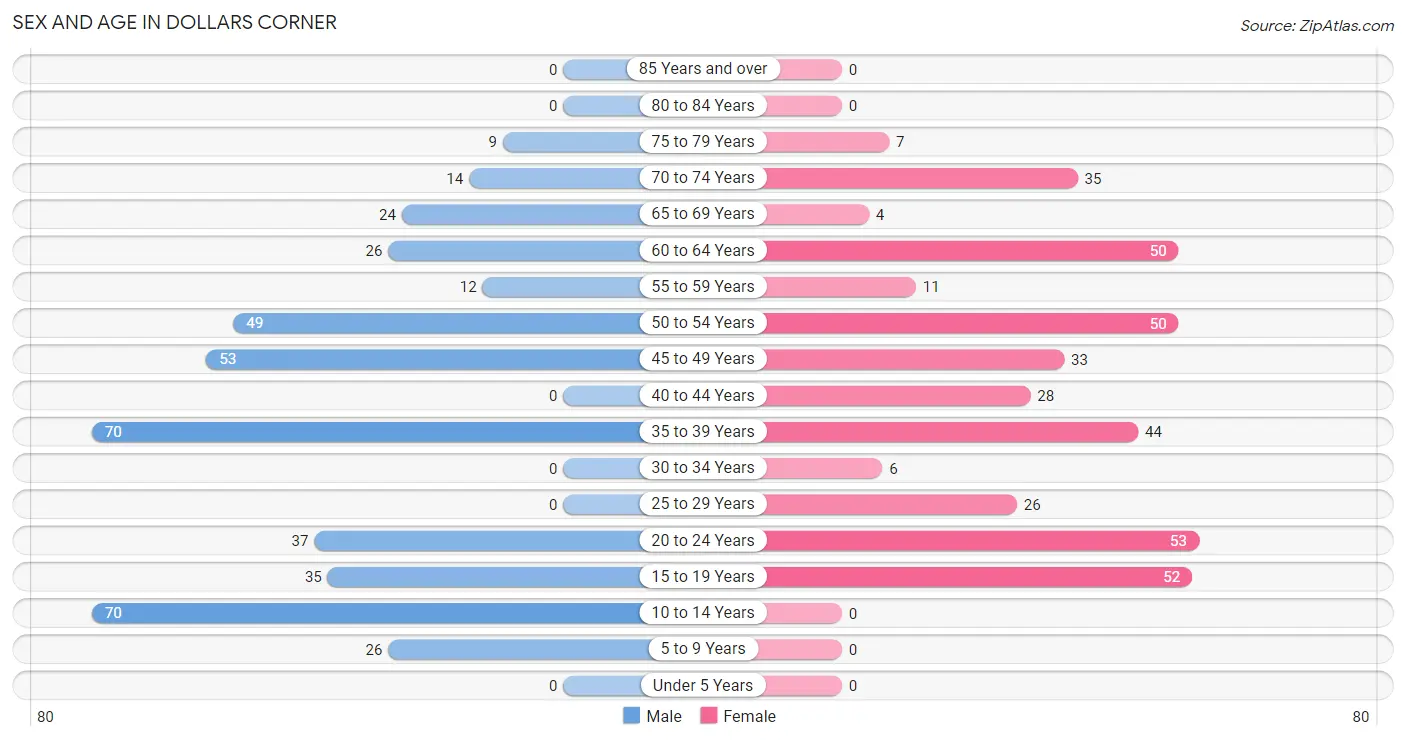
Sex and Age in Dollars Corner
Sex and Age in Dollars Corner
The most populous age groups in Dollars Corner are 10 to 14 Years (70 | 16.5%) for men and 20 to 24 Years (53 | 13.3%) for women.
| Age Bracket | Male | Female |
| Under 5 Years | 0 (0.0%) | 0 (0.0%) |
| 5 to 9 Years | 26 (6.1%) | 0 (0.0%) |
| 10 to 14 Years | 70 (16.5%) | 0 (0.0%) |
| 15 to 19 Years | 35 (8.2%) | 52 (13.0%) |
| 20 to 24 Years | 37 (8.7%) | 53 (13.3%) |
| 25 to 29 Years | 0 (0.0%) | 26 (6.5%) |
| 30 to 34 Years | 0 (0.0%) | 6 (1.5%) |
| 35 to 39 Years | 70 (16.5%) | 44 (11.0%) |
| 40 to 44 Years | 0 (0.0%) | 28 (7.0%) |
| 45 to 49 Years | 53 (12.5%) | 33 (8.3%) |
| 50 to 54 Years | 49 (11.5%) | 50 (12.5%) |
| 55 to 59 Years | 12 (2.8%) | 11 (2.8%) |
| 60 to 64 Years | 26 (6.1%) | 50 (12.5%) |
| 65 to 69 Years | 24 (5.7%) | 4 (1.0%) |
| 70 to 74 Years | 14 (3.3%) | 35 (8.8%) |
| 75 to 79 Years | 9 (2.1%) | 7 (1.8%) |
| 80 to 84 Years | 0 (0.0%) | 0 (0.0%) |
| 85 Years and over | 0 (0.0%) | 0 (0.0%) |
| Total | 425 (100.0%) | 399 (100.0%) |
Families and Households in Dollars Corner
Median Family Size in Dollars Corner
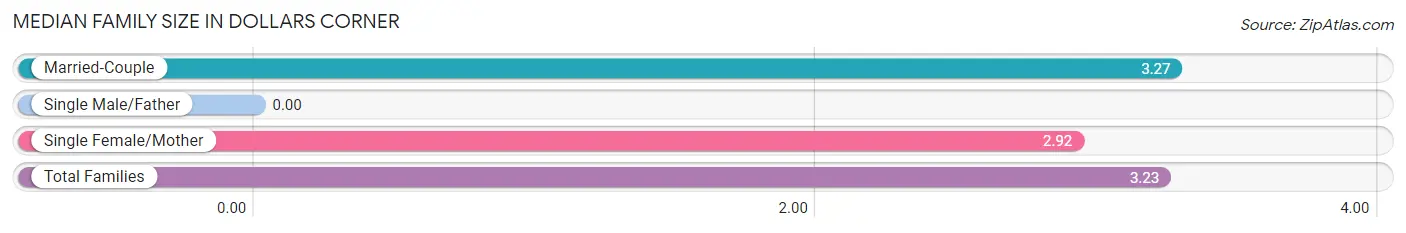
| Family Type | # Families | Family Size |
| Married-Couple | 196 (89.1%) | 3.27 |
| Single Male/Father | 0 (0.0%) | - |
| Single Female/Mother | 24 (10.9%) | 2.92 |
| Total Families | 220 (100.0%) | 3.23 |
Median Household Size in Dollars Corner
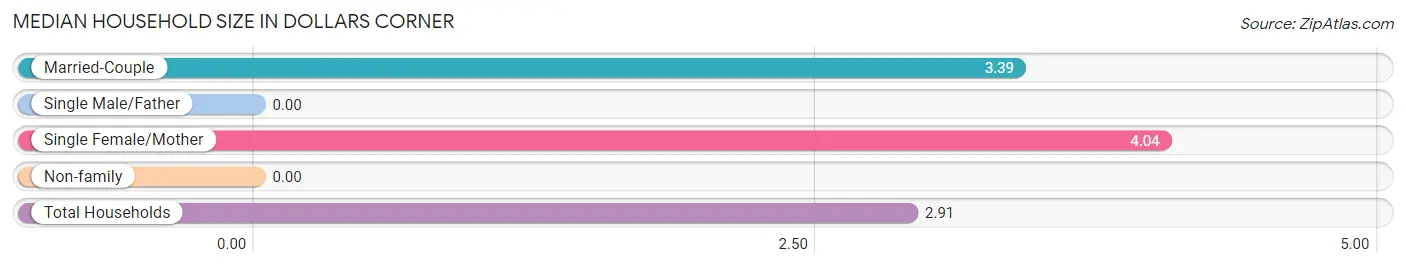
| Household Type | # Households | Household Size |
| Married-Couple | 196 (69.3%) | 3.39 |
| Single Male/Father | 0 (0.0%) | - |
| Single Female/Mother | 24 (8.5%) | 4.04 |
| Non-family | 63 (22.3%) | - |
| Total Households | 283 (100.0%) | 2.91 |
Household Size by Marriage Status in Dollars Corner
Out of a total of 283 households in Dollars Corner, 220 (77.7%) are family households, while 63 (22.3%) are nonfamily households. The most numerous type of family households are 2-person households, comprising 91, and the most common type of nonfamily households are 1-person households, comprising 63.
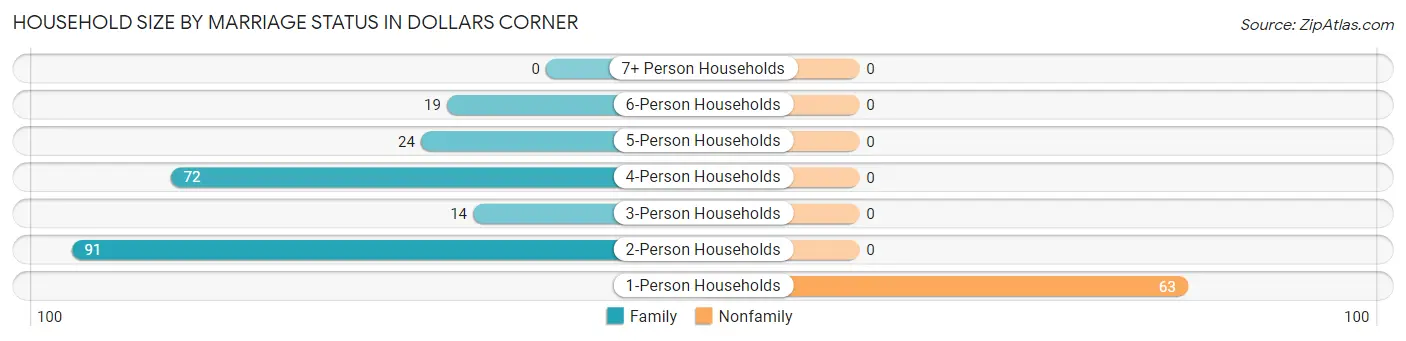
| Household Size | Family Households | Nonfamily Households |
| 1-Person Households | - | 63 (22.3%) |
| 2-Person Households | 91 (32.2%) | 0 (0.0%) |
| 3-Person Households | 14 (5.0%) | 0 (0.0%) |
| 4-Person Households | 72 (25.4%) | 0 (0.0%) |
| 5-Person Households | 24 (8.5%) | 0 (0.0%) |
| 6-Person Households | 19 (6.7%) | 0 (0.0%) |
| 7+ Person Households | 0 (0.0%) | 0 (0.0%) |
| Total | 220 (77.7%) | 63 (22.3%) |
Female Fertility in Dollars Corner
Fertility by Age in Dollars Corner
| Age Bracket | Women with Births | Births / 1,000 Women |
| 15 to 19 years | 0 (0.0%) | 0.0 |
| 20 to 34 years | 0 (0.0%) | 0.0 |
| 35 to 50 years | 0 (0.0%) | 0.0 |
| Total | 0 (0.0%) | 0.0 |
Fertility by Age by Marriage Status in Dollars Corner
| Age Bracket | Married | Unmarried |
| 15 to 19 years | 0 (0.0%) | 0 (0.0%) |
| 20 to 34 years | 0 (0.0%) | 0 (0.0%) |
| 35 to 50 years | 0 (0.0%) | 0 (0.0%) |
| Total | 0 (0.0%) | 0 (0.0%) |
Fertility by Education in Dollars Corner
| Educational Attainment | Women with Births | Births / 1,000 Women |
| Less than High School | 0 (0.0%) | 0.0 |
| High School Diploma | 0 (0.0%) | 0.0 |
| College or Associate's Degree | 0 (0.0%) | 0.0 |
| Bachelor's Degree | 0 (0.0%) | 0.0 |
| Graduate Degree | 0 (0.0%) | 0.0 |
| Total | 0 (0.0%) | 0.0 |
Fertility by Education by Marriage Status in Dollars Corner
| Educational Attainment | Married | Unmarried |
| Less than High School | 0 (0.0%) | 0 (0.0%) |
| High School Diploma | 0 (0.0%) | 0 (0.0%) |
| College or Associate's Degree | 0 (0.0%) | 0 (0.0%) |
| Bachelor's Degree | 0 (0.0%) | 0 (0.0%) |
| Graduate Degree | 0 (0.0%) | 0 (0.0%) |
| Total | 0 (0.0%) | 0 (0.0%) |
Income in Dollars Corner
Income Overview in Dollars Corner
Per Capita Income in Dollars Corner is $43,853, while median incomes of families and households are $114,583 and $113,802 respectively.
| Characteristic | Number | Measure |
| Per Capita Income | 824 | $43,853 |
| Median Family Income | 220 | $114,583 |
| Mean Family Income | 220 | $139,089 |
| Median Household Income | 283 | $113,802 |
| Mean Household Income | 283 | $126,389 |
| Income Deficit | 220 | $19,440 |
| Wage / Income Gap (%) | 824 | 0.00% |
| Wage / Income Gap ($) | 824 | 100.00¢ per $1 |
| Gini / Inequality Index | 824 | 0.40 |
Earnings by Sex in Dollars Corner
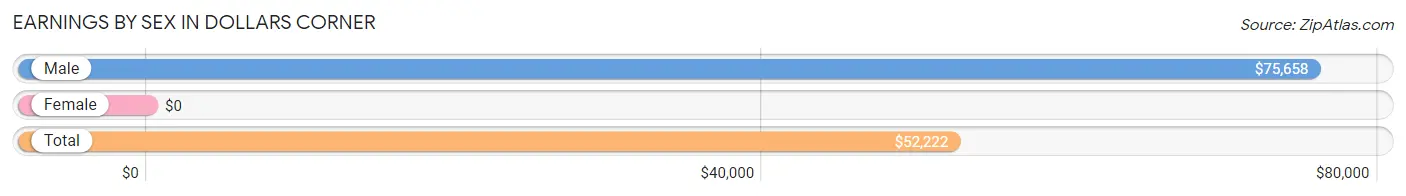
| Sex | Number | Average Earnings |
| Male | 242 (46.0%) | $75,658 |
| Female | 284 (54.0%) | $0 |
| Total | 526 (100.0%) | $52,222 |
Earnings by Sex by Income Bracket in Dollars Corner
The most common earnings brackets in Dollars Corner are $75,000 to $99,999 for men (69 | 28.5%) and $2,499 or less for women (64 | 22.5%).
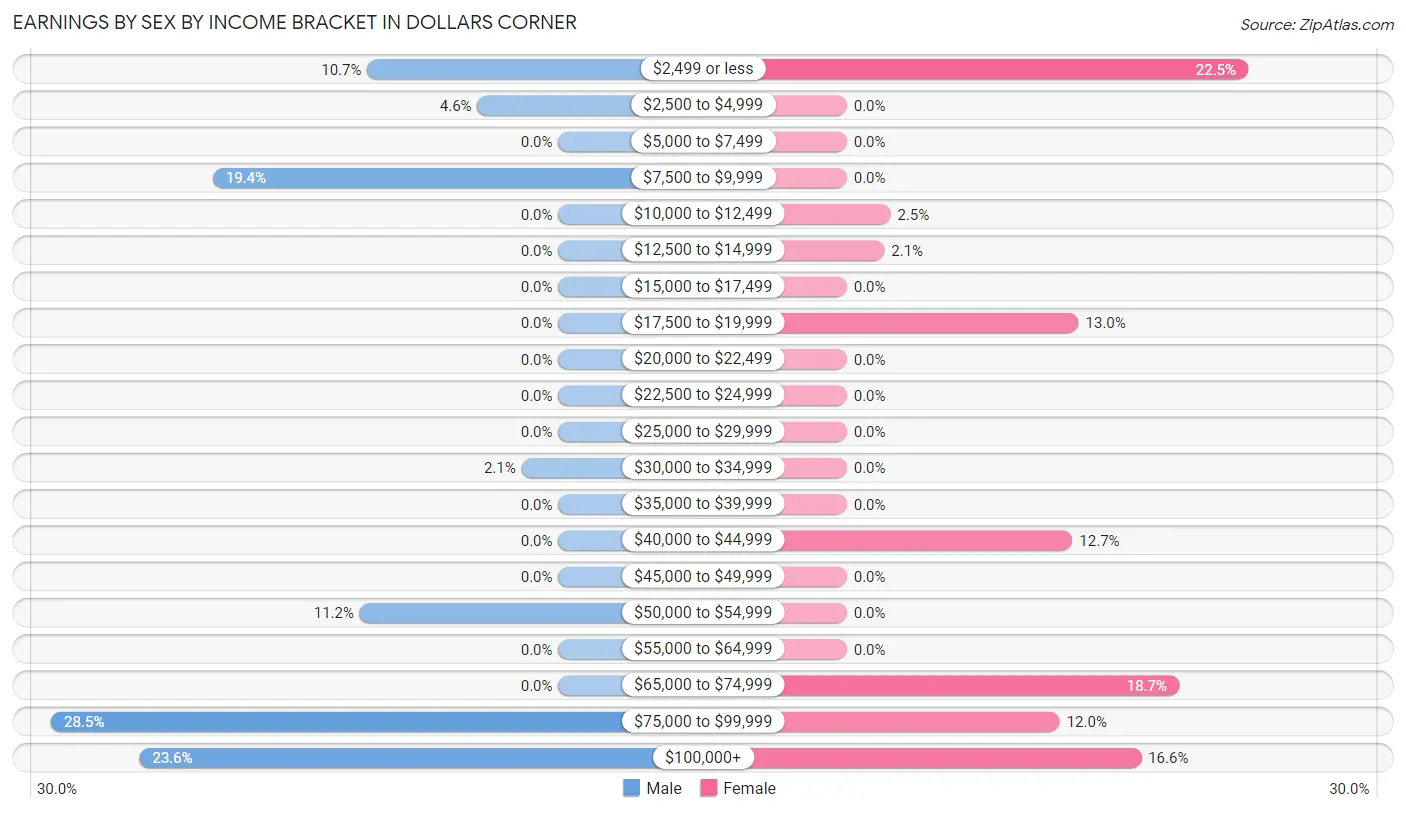
| Income | Male | Female |
| $2,499 or less | 26 (10.7%) | 64 (22.5%) |
| $2,500 to $4,999 | 11 (4.5%) | 0 (0.0%) |
| $5,000 to $7,499 | 0 (0.0%) | 0 (0.0%) |
| $7,500 to $9,999 | 47 (19.4%) | 0 (0.0%) |
| $10,000 to $12,499 | 0 (0.0%) | 7 (2.5%) |
| $12,500 to $14,999 | 0 (0.0%) | 6 (2.1%) |
| $15,000 to $17,499 | 0 (0.0%) | 0 (0.0%) |
| $17,500 to $19,999 | 0 (0.0%) | 37 (13.0%) |
| $20,000 to $22,499 | 0 (0.0%) | 0 (0.0%) |
| $22,500 to $24,999 | 0 (0.0%) | 0 (0.0%) |
| $25,000 to $29,999 | 0 (0.0%) | 0 (0.0%) |
| $30,000 to $34,999 | 5 (2.1%) | 0 (0.0%) |
| $35,000 to $39,999 | 0 (0.0%) | 0 (0.0%) |
| $40,000 to $44,999 | 0 (0.0%) | 36 (12.7%) |
| $45,000 to $49,999 | 0 (0.0%) | 0 (0.0%) |
| $50,000 to $54,999 | 27 (11.2%) | 0 (0.0%) |
| $55,000 to $64,999 | 0 (0.0%) | 0 (0.0%) |
| $65,000 to $74,999 | 0 (0.0%) | 53 (18.7%) |
| $75,000 to $99,999 | 69 (28.5%) | 34 (12.0%) |
| $100,000+ | 57 (23.5%) | 47 (16.6%) |
| Total | 242 (100.0%) | 284 (100.0%) |
Earnings by Sex by Educational Attainment in Dollars Corner
Average earnings in Dollars Corner are $82,969 for men and $73,229 for women, a difference of 11.7%. Men with an educational attainment of high school diploma enjoy the highest average annual earnings of $88,173, while those with high school diploma education earn the least with $88,173. Women with an educational attainment of bachelor's degree earn the most with the average annual earnings of $74,271, while those with high school diploma education have the smallest earnings of $67,155.
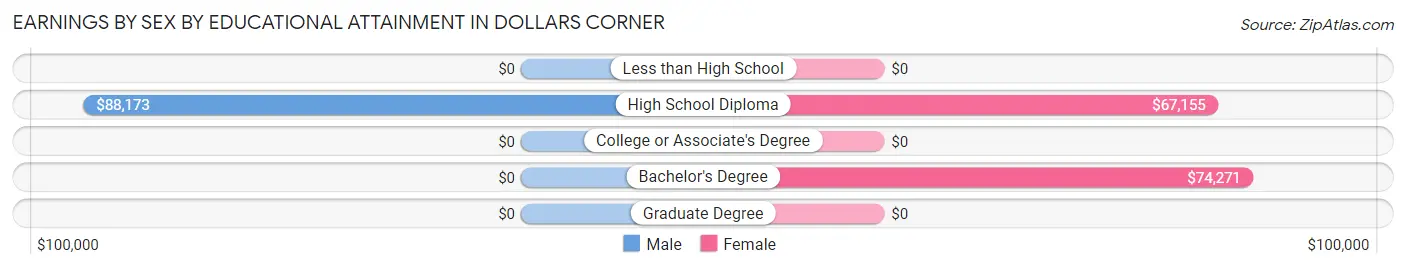
| Educational Attainment | Male Income | Female Income |
| Less than High School | - | - |
| High School Diploma | $88,173 | $67,155 |
| College or Associate's Degree | - | - |
| Bachelor's Degree | - | - |
| Graduate Degree | - | - |
| Total | $82,969 | $73,229 |
Family Income in Dollars Corner
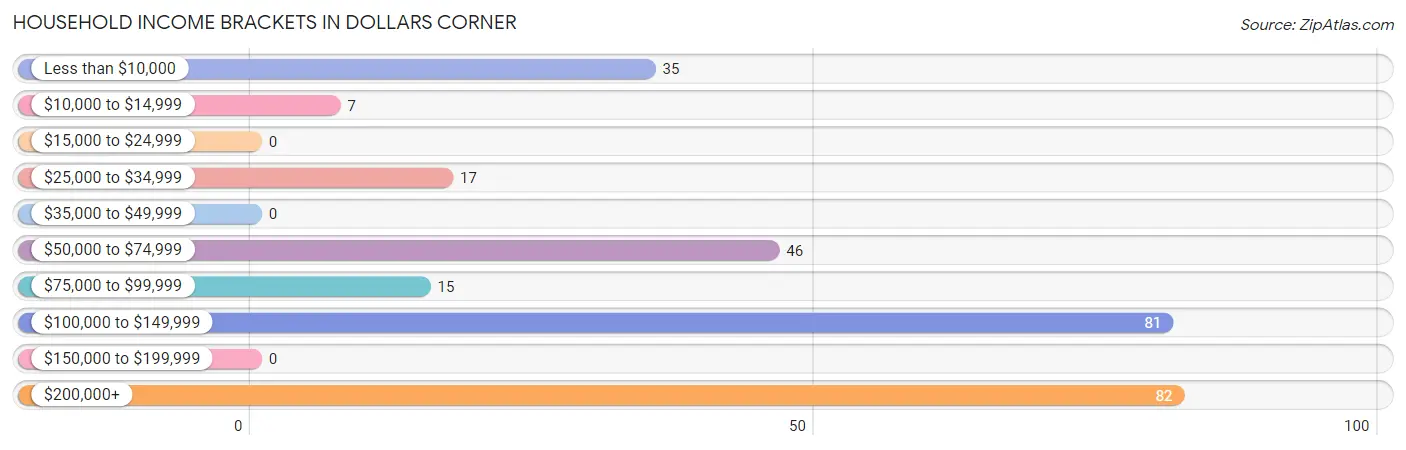
Family Income Brackets in Dollars Corner
According to the Dollars Corner family income data, there are 82 families falling into the $200,000+ income range, which is the most common income bracket and makes up 37.3% of all families.
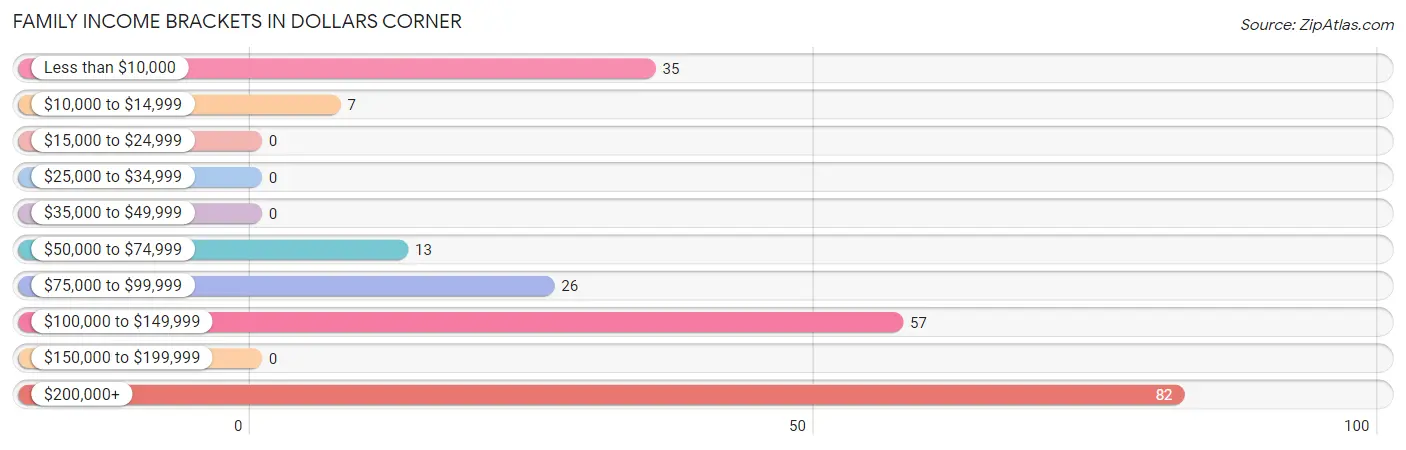
| Income Bracket | # Families | % Families |
| Less than $10,000 | 35 | 15.9% |
| $10,000 to $14,999 | 7 | 3.2% |
| $15,000 to $24,999 | 0 | 0.0% |
| $25,000 to $34,999 | 0 | 0.0% |
| $35,000 to $49,999 | 0 | 0.0% |
| $50,000 to $74,999 | 13 | 5.9% |
| $75,000 to $99,999 | 26 | 11.8% |
| $100,000 to $149,999 | 57 | 25.9% |
| $150,000 to $199,999 | 0 | 0.0% |
| $200,000+ | 82 | 37.3% |
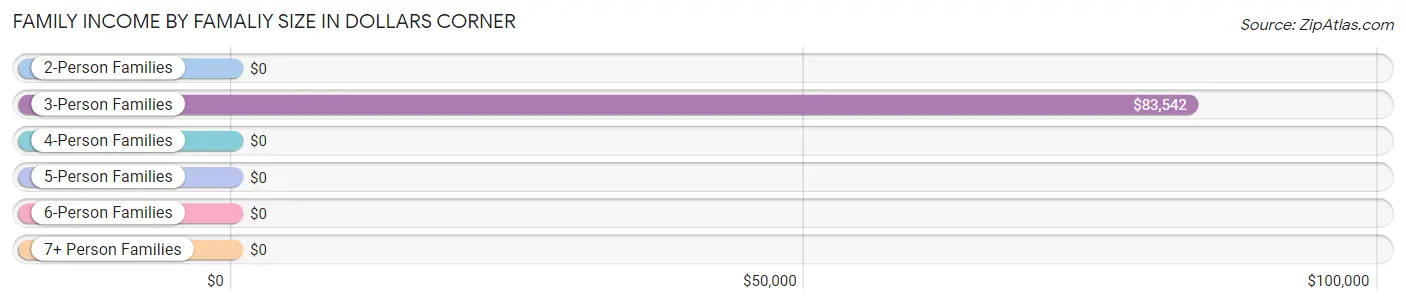
Family Income by Famaliy Size in Dollars Corner
3-person families (38 | 17.3%) account for the highest median family income in Dollars Corner with $83,542 per family, while 3-person families (38 | 17.3%) have the highest median income of $27,847 per family member.
| Income Bracket | # Families | Median Income |
| 2-Person Families | 91 (41.4%) | $0 |
| 3-Person Families | 38 (17.3%) | $83,542 |
| 4-Person Families | 72 (32.7%) | $0 |
| 5-Person Families | 0 (0.0%) | $0 |
| 6-Person Families | 19 (8.6%) | $0 |
| 7+ Person Families | 0 (0.0%) | $0 |
| Total | 220 (100.0%) | $114,583 |
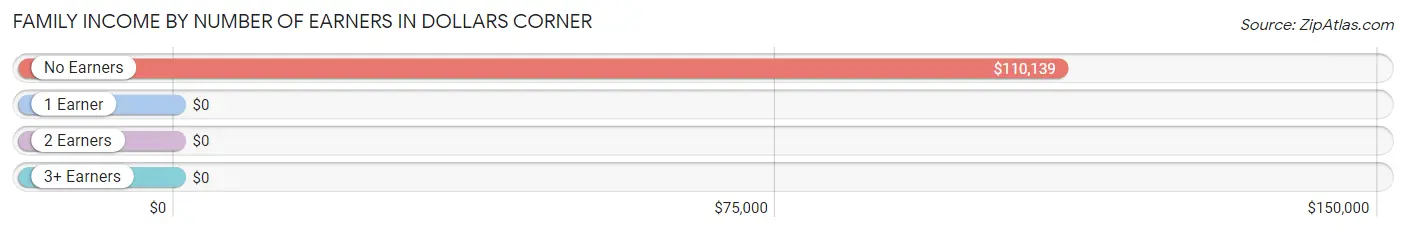
Family Income by Number of Earners in Dollars Corner
| Number of Earners | # Families | Median Income |
| No Earners | 27 (12.3%) | $110,139 |
| 1 Earner | 24 (10.9%) | $0 |
| 2 Earners | 106 (48.2%) | $0 |
| 3+ Earners | 63 (28.6%) | $0 |
| Total | 220 (100.0%) | $114,583 |
Household Income in Dollars Corner
Household Income Brackets in Dollars Corner
With 82 households falling in the category, the $200,000+ income range is the most frequent in Dollars Corner, accounting for 29.0% of all households.
| Income Bracket | # Households | % Households |
| Less than $10,000 | 35 | 12.4% |
| $10,000 to $14,999 | 7 | 2.5% |
| $15,000 to $24,999 | 0 | 0.0% |
| $25,000 to $34,999 | 17 | 6.0% |
| $35,000 to $49,999 | 0 | 0.0% |
| $50,000 to $74,999 | 46 | 16.3% |
| $75,000 to $99,999 | 15 | 5.3% |
| $100,000 to $149,999 | 81 | 28.6% |
| $150,000 to $199,999 | 0 | 0.0% |
| $200,000+ | 82 | 29.0% |
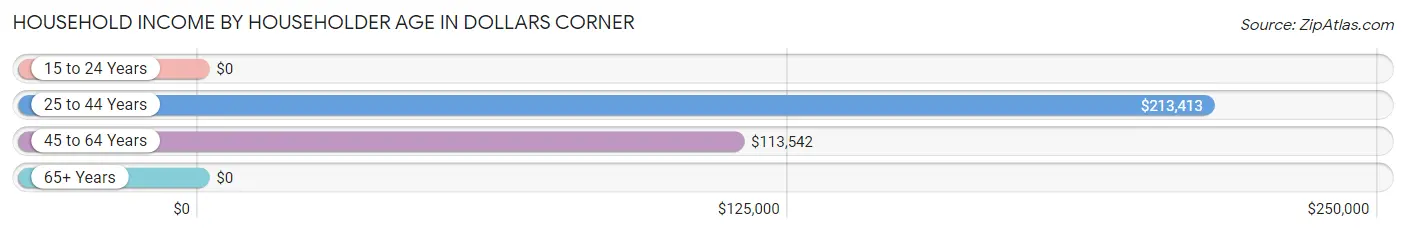
Household Income by Householder Age in Dollars Corner
The median household income in Dollars Corner is $113,802, with the highest median household income of $213,413 found in the 25 to 44 years age bracket for the primary householder. A total of 71 households (25.1%) fall into this category.
| Income Bracket | # Households | Median Income |
| 15 to 24 Years | 0 (0.0%) | $0 |
| 25 to 44 Years | 71 (25.1%) | $213,413 |
| 45 to 64 Years | 150 (53.0%) | $113,542 |
| 65+ Years | 62 (21.9%) | $0 |
| Total | 283 (100.0%) | $113,802 |
Poverty in Dollars Corner
Income Below Poverty by Sex and Age in Dollars Corner
With 26.9% poverty level for males and 16.3% for females among the residents of Dollars Corner, 65 to 74 year old males and 25 to 34 year old females are the most vulnerable to poverty, with 24 males (63.2%) and 26 females (81.2%) in their respective age groups living below the poverty level.
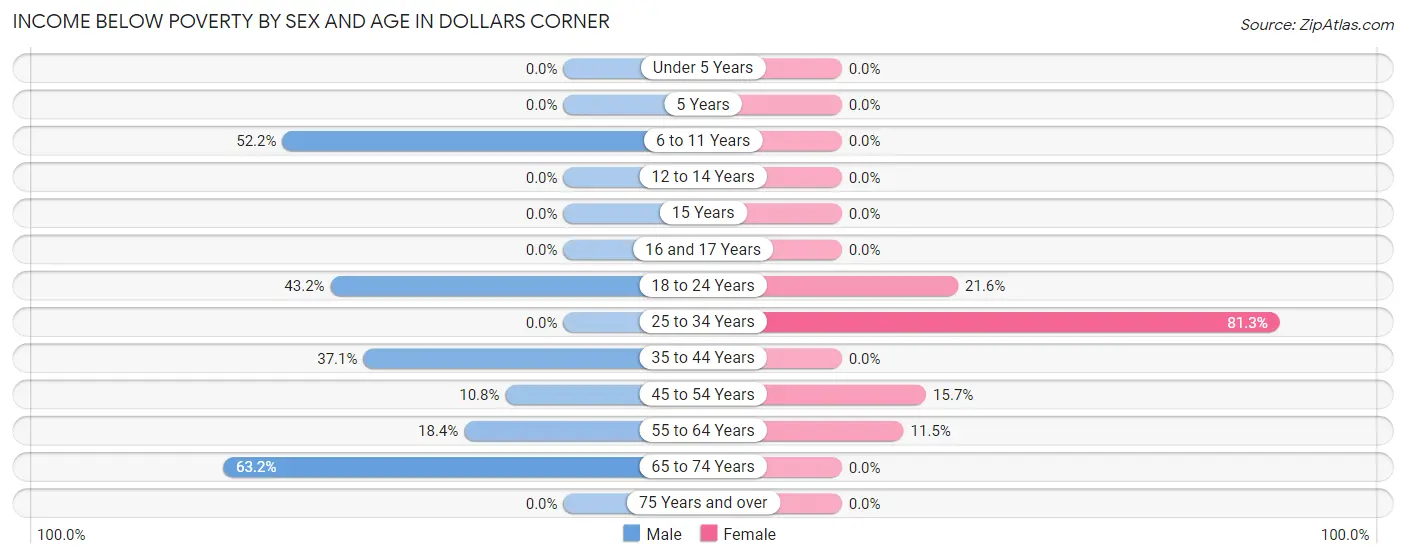
| Age Bracket | Male | Female |
| Under 5 Years | 0 (0.0%) | 0 (0.0%) |
| 5 Years | 0 (0.0%) | 0 (0.0%) |
| 6 to 11 Years | 24 (52.2%) | 0 (0.0%) |
| 12 to 14 Years | 0 (0.0%) | 0 (0.0%) |
| 15 Years | 0 (0.0%) | 0 (0.0%) |
| 16 and 17 Years | 0 (0.0%) | 0 (0.0%) |
| 18 to 24 Years | 16 (43.2%) | 19 (21.6%) |
| 25 to 34 Years | 0 (0.0%) | 26 (81.2%) |
| 35 to 44 Years | 26 (37.1%) | 0 (0.0%) |
| 45 to 54 Years | 11 (10.8%) | 13 (15.7%) |
| 55 to 64 Years | 7 (18.4%) | 7 (11.5%) |
| 65 to 74 Years | 24 (63.2%) | 0 (0.0%) |
| 75 Years and over | 0 (0.0%) | 0 (0.0%) |
| Total | 108 (26.9%) | 65 (16.3%) |
Income Above Poverty by Sex and Age in Dollars Corner
According to the poverty statistics in Dollars Corner, males aged 12 to 14 years and females aged 15 years are the age groups that are most secure financially, with 100.0% of males and 100.0% of females in these age groups living above the poverty line.
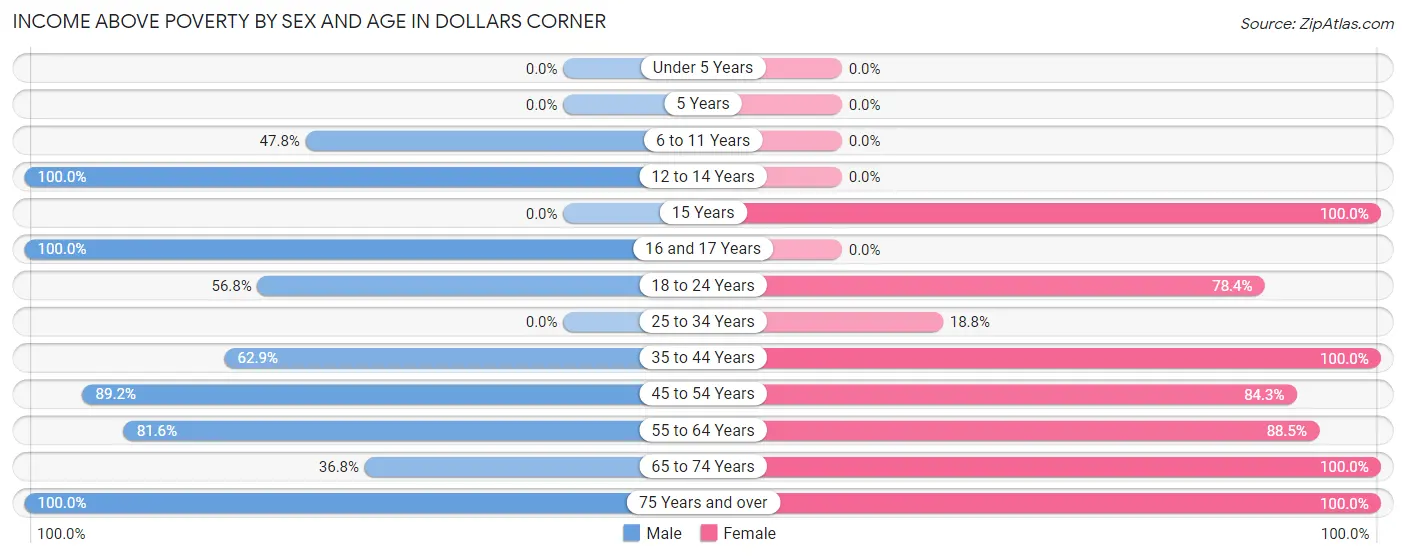
| Age Bracket | Male | Female |
| Under 5 Years | 0 (0.0%) | 0 (0.0%) |
| 5 Years | 0 (0.0%) | 0 (0.0%) |
| 6 to 11 Years | 22 (47.8%) | 0 (0.0%) |
| 12 to 14 Years | 26 (100.0%) | 0 (0.0%) |
| 15 Years | 0 (0.0%) | 17 (100.0%) |
| 16 and 17 Years | 35 (100.0%) | 0 (0.0%) |
| 18 to 24 Years | 21 (56.8%) | 69 (78.4%) |
| 25 to 34 Years | 0 (0.0%) | 6 (18.8%) |
| 35 to 44 Years | 44 (62.9%) | 72 (100.0%) |
| 45 to 54 Years | 91 (89.2%) | 70 (84.3%) |
| 55 to 64 Years | 31 (81.6%) | 54 (88.5%) |
| 65 to 74 Years | 14 (36.8%) | 39 (100.0%) |
| 75 Years and over | 9 (100.0%) | 7 (100.0%) |
| Total | 293 (73.1%) | 334 (83.7%) |
Income Below Poverty Among Married-Couple Families in Dollars Corner
The poverty statistics for married-couple families in Dollars Corner show that 21.4% or 42 of the total 196 families live below the poverty line. Families with 1 or 2 children have the highest poverty rate of 29.3%, comprising of 24 families. On the other hand, families with no children have the lowest poverty rate of 15.8%, which includes 18 families.
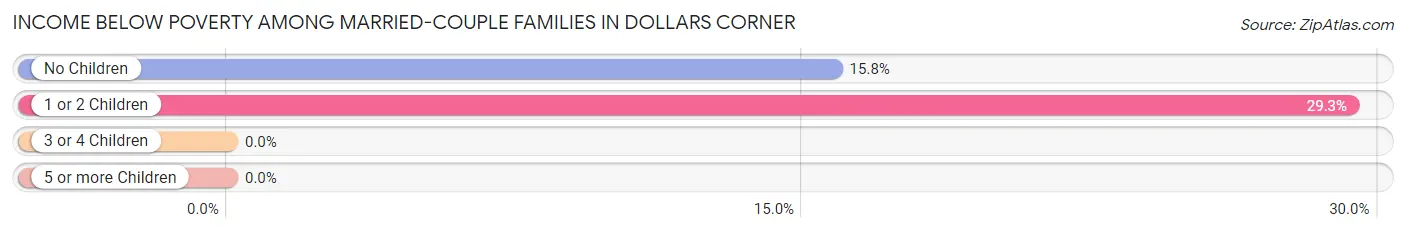
| Children | Above Poverty | Below Poverty |
| No Children | 96 (84.2%) | 18 (15.8%) |
| 1 or 2 Children | 58 (70.7%) | 24 (29.3%) |
| 3 or 4 Children | 0 (0.0%) | 0 (0.0%) |
| 5 or more Children | 0 (0.0%) | 0 (0.0%) |
| Total | 154 (78.6%) | 42 (21.4%) |
Income Below Poverty Among Single-Parent Households in Dollars Corner
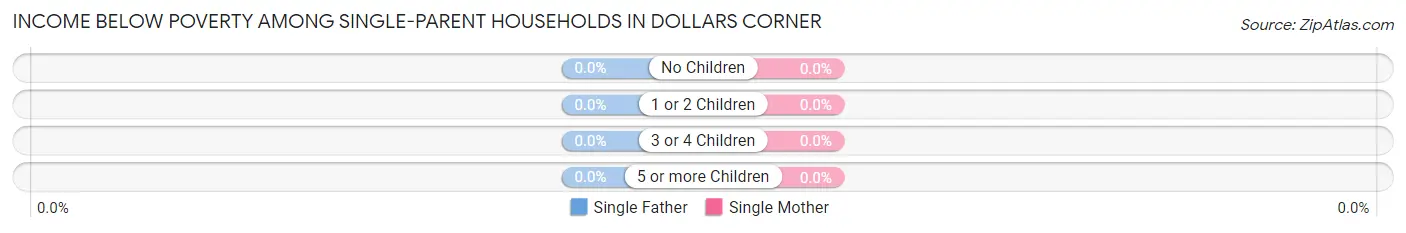
| Children | Single Father | Single Mother |
| No Children | 0 (0.0%) | 0 (0.0%) |
| 1 or 2 Children | 0 (0.0%) | 0 (0.0%) |
| 3 or 4 Children | 0 (0.0%) | 0 (0.0%) |
| 5 or more Children | 0 (0.0%) | 0 (0.0%) |
| Total | 0 (0.0%) | 0 (0.0%) |
Income Below Poverty Among Married-Couple vs Single-Parent Households in Dollars Corner
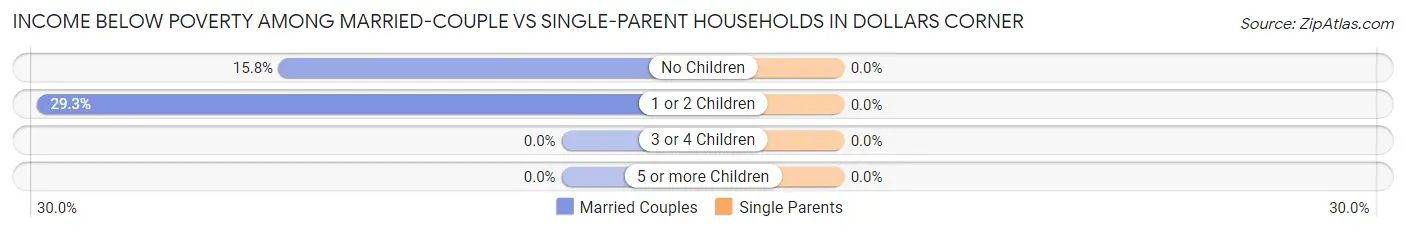
| Children | Married-Couple Families | Single-Parent Households |
| No Children | 18 (15.8%) | 0 (0.0%) |
| 1 or 2 Children | 24 (29.3%) | 0 (0.0%) |
| 3 or 4 Children | 0 (0.0%) | 0 (0.0%) |
| 5 or more Children | 0 (0.0%) | 0 (0.0%) |
| Total | 42 (21.4%) | 0 (0.0%) |
Employment Characteristics in Dollars Corner
Employment by Class of Employer in Dollars Corner
Among the 519 employed individuals in Dollars Corner, private company employees (395 | 76.1%), federal government employees (34 | 6.6%), and local government employees (27 | 5.2%) make up the most common classes of employment.
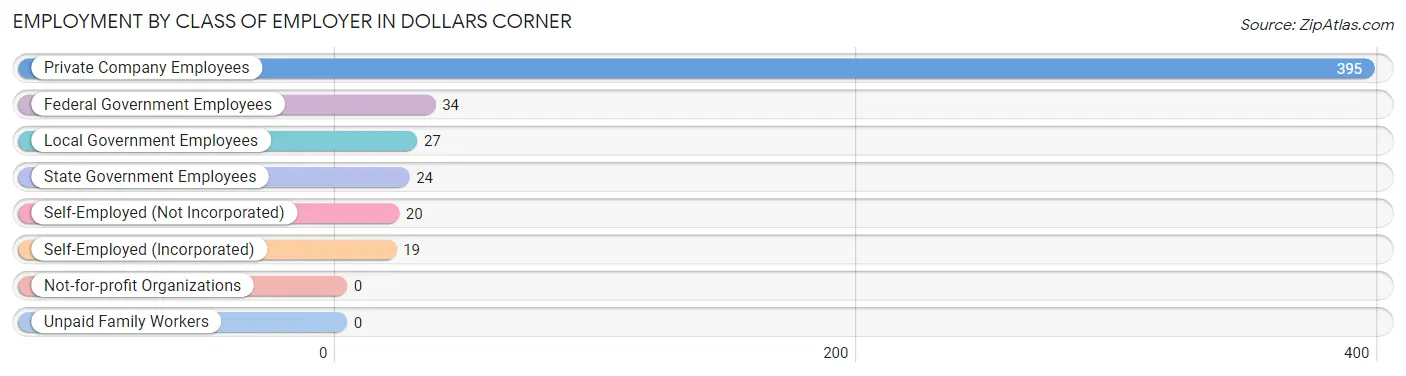
| Employer Class | # Employees | % Employees |
| Private Company Employees | 395 | 76.1% |
| Self-Employed (Incorporated) | 19 | 3.7% |
| Self-Employed (Not Incorporated) | 20 | 3.8% |
| Not-for-profit Organizations | 0 | 0.0% |
| Local Government Employees | 27 | 5.2% |
| State Government Employees | 24 | 4.6% |
| Federal Government Employees | 34 | 6.6% |
| Unpaid Family Workers | 0 | 0.0% |
| Total | 519 | 100.0% |
Employment Status by Age in Dollars Corner
According to the labor force statistics for Dollars Corner, out of the total population over 16 years of age (711), 73.6% or 523 individuals are in the labor force, with 0.8% or 4 of them unemployed. The age group with the highest labor force participation rate is 20 to 24 years, with 100.0% or 90 individuals in the labor force. Within the labor force, the 55 to 59 years age range has the highest percentage of unemployed individuals, with 25.0% or 4 of them being unemployed.
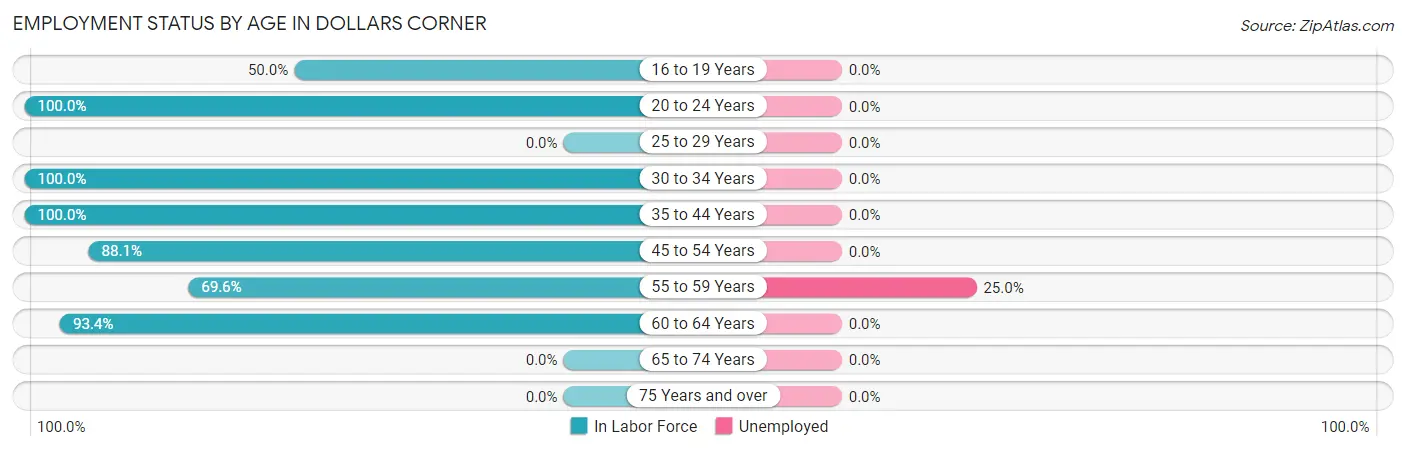
| Age Bracket | In Labor Force | Unemployed |
| 16 to 19 Years | 35 (50.0%) | 0 (0.0%) |
| 20 to 24 Years | 90 (100.0%) | 0 (0.0%) |
| 25 to 29 Years | 0 (0.0%) | 0 (0.0%) |
| 30 to 34 Years | 6 (100.0%) | 0 (0.0%) |
| 35 to 44 Years | 142 (100.0%) | 0 (0.0%) |
| 45 to 54 Years | 163 (88.1%) | 0 (0.0%) |
| 55 to 59 Years | 16 (69.6%) | 4 (25.0%) |
| 60 to 64 Years | 71 (93.4%) | 0 (0.0%) |
| 65 to 74 Years | 0 (0.0%) | 0 (0.0%) |
| 75 Years and over | 0 (0.0%) | 0 (0.0%) |
| Total | 523 (73.6%) | 4 (0.8%) |
Employment Status by Educational Attainment in Dollars Corner
According to labor force statistics for Dollars Corner, 86.9% of individuals (398) out of the total population between 25 and 64 years of age (458) are in the labor force, with 1.0% or 4 of them being unemployed. The group with the highest labor force participation rate are those with the educational attainment of bachelor's degree or higher, with 100.0% or 148 individuals in the labor force. Within the labor force, individuals with college / associate degree education have the highest percentage of unemployment, with 3.5% or 4 of them being unemployed.
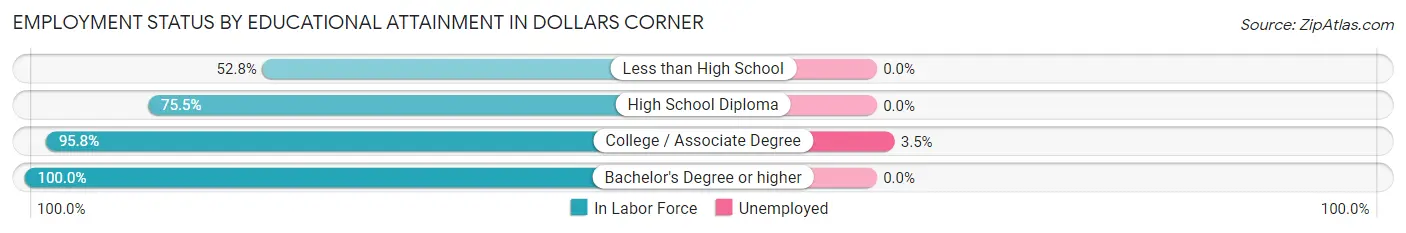
| Educational Attainment | In Labor Force | Unemployed |
| Less than High School | 19 (52.8%) | 0 (0.0%) |
| High School Diploma | 117 (75.5%) | 0 (0.0%) |
| College / Associate Degree | 114 (95.8%) | 4 (3.5%) |
| Bachelor's Degree or higher | 148 (100.0%) | 0 (0.0%) |
| Total | 398 (86.9%) | 5 (1.0%) |
Employment Occupations by Sex in Dollars Corner
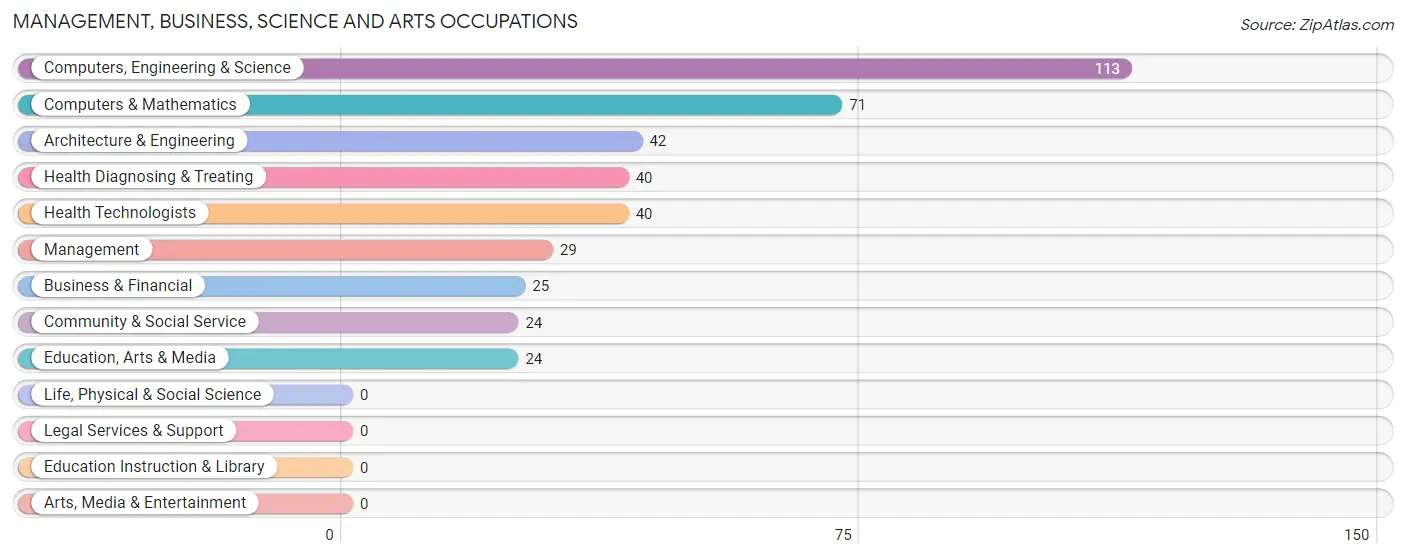
Management, Business, Science and Arts Occupations
The most common Management, Business, Science and Arts occupations in Dollars Corner are Computers, Engineering & Science (113 | 21.9%), Computers & Mathematics (71 | 13.7%), Architecture & Engineering (42 | 8.1%), Health Diagnosing & Treating (40 | 7.7%), and Health Technologists (40 | 7.7%).
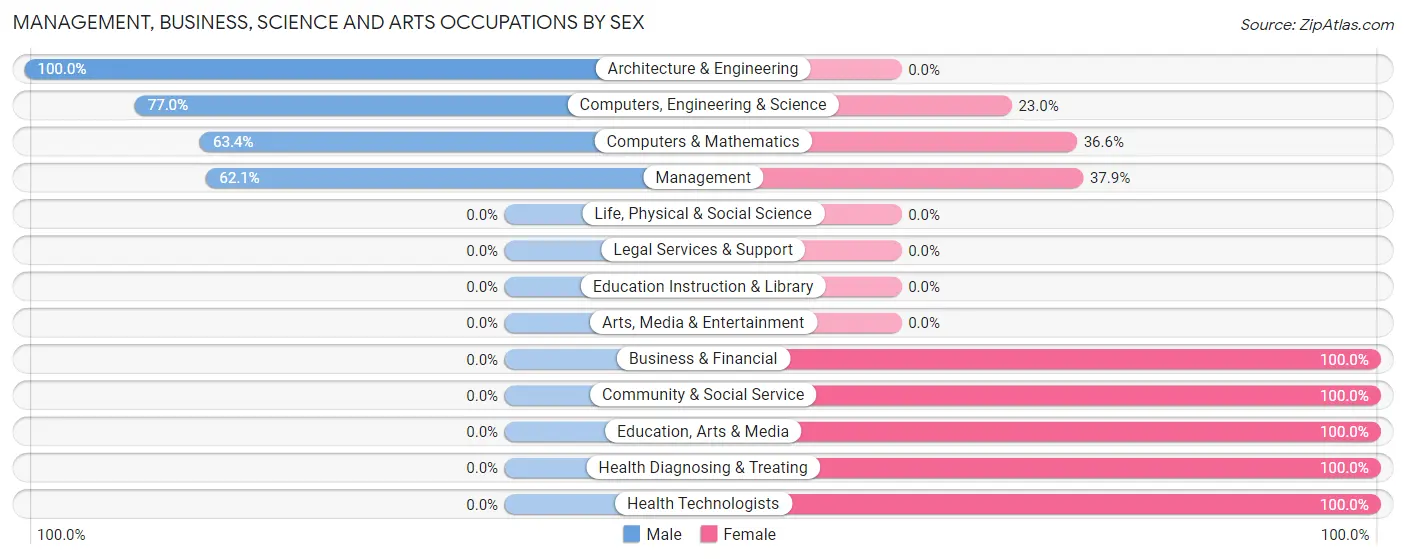
Management, Business, Science and Arts Occupations by Sex
Within the Management, Business, Science and Arts occupations in Dollars Corner, the most male-oriented occupations are Architecture & Engineering (100.0%), Computers, Engineering & Science (77.0%), and Computers & Mathematics (63.4%), while the most female-oriented occupations are Business & Financial (100.0%), Community & Social Service (100.0%), and Education, Arts & Media (100.0%).
| Occupation | Male | Female |
| Management | 18 (62.1%) | 11 (37.9%) |
| Business & Financial | 0 (0.0%) | 25 (100.0%) |
| Computers, Engineering & Science | 87 (77.0%) | 26 (23.0%) |
| Computers & Mathematics | 45 (63.4%) | 26 (36.6%) |
| Architecture & Engineering | 42 (100.0%) | 0 (0.0%) |
| Life, Physical & Social Science | 0 (0.0%) | 0 (0.0%) |
| Community & Social Service | 0 (0.0%) | 24 (100.0%) |
| Education, Arts & Media | 0 (0.0%) | 24 (100.0%) |
| Legal Services & Support | 0 (0.0%) | 0 (0.0%) |
| Education Instruction & Library | 0 (0.0%) | 0 (0.0%) |
| Arts, Media & Entertainment | 0 (0.0%) | 0 (0.0%) |
| Health Diagnosing & Treating | 0 (0.0%) | 40 (100.0%) |
| Health Technologists | 0 (0.0%) | 40 (100.0%) |
| Total (Category) | 105 (45.5%) | 126 (54.5%) |
| Total (Overall) | 242 (46.8%) | 275 (53.2%) |
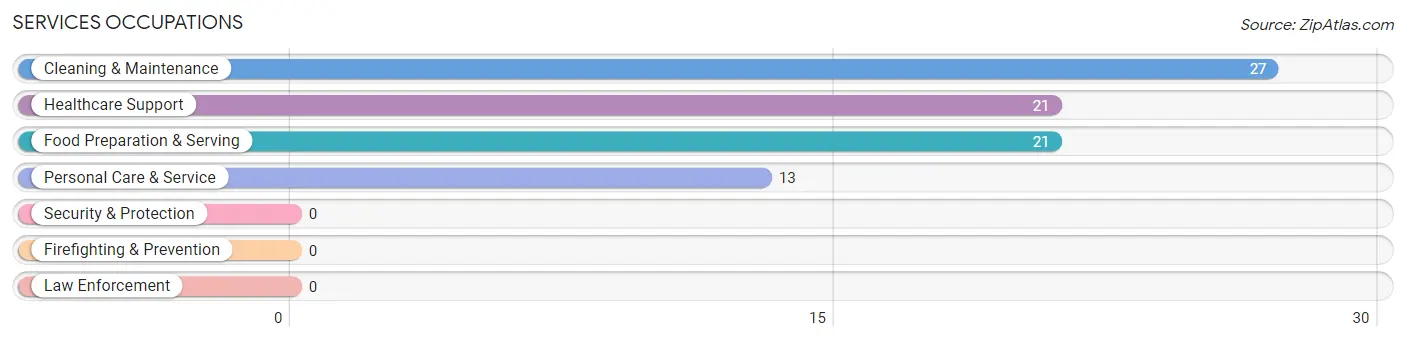
Services Occupations
The most common Services occupations in Dollars Corner are Cleaning & Maintenance (27 | 5.2%), Healthcare Support (21 | 4.1%), Food Preparation & Serving (21 | 4.1%), and Personal Care & Service (13 | 2.5%).
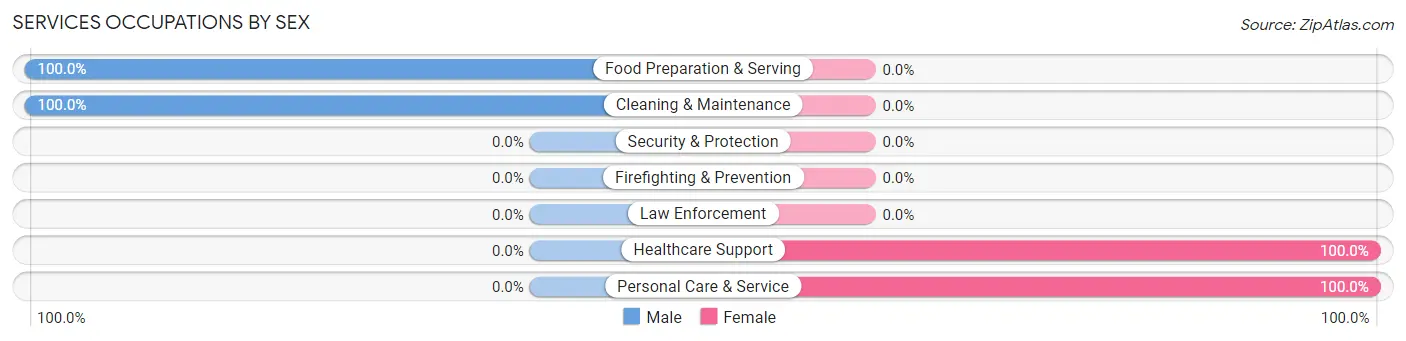
Services Occupations by Sex
Within the Services occupations in Dollars Corner, the most male-oriented occupations are Food Preparation & Serving (100.0%), and Cleaning & Maintenance (100.0%), while the most female-oriented occupations are Healthcare Support (100.0%), and Personal Care & Service (100.0%).
| Occupation | Male | Female |
| Healthcare Support | 0 (0.0%) | 21 (100.0%) |
| Security & Protection | 0 (0.0%) | 0 (0.0%) |
| Firefighting & Prevention | 0 (0.0%) | 0 (0.0%) |
| Law Enforcement | 0 (0.0%) | 0 (0.0%) |
| Food Preparation & Serving | 21 (100.0%) | 0 (0.0%) |
| Cleaning & Maintenance | 27 (100.0%) | 0 (0.0%) |
| Personal Care & Service | 0 (0.0%) | 13 (100.0%) |
| Total (Category) | 48 (58.5%) | 34 (41.5%) |
| Total (Overall) | 242 (46.8%) | 275 (53.2%) |
Sales and Office Occupations
The most common Sales and Office occupations in Dollars Corner are Sales & Related (136 | 26.3%), and Office & Administration (7 | 1.3%).
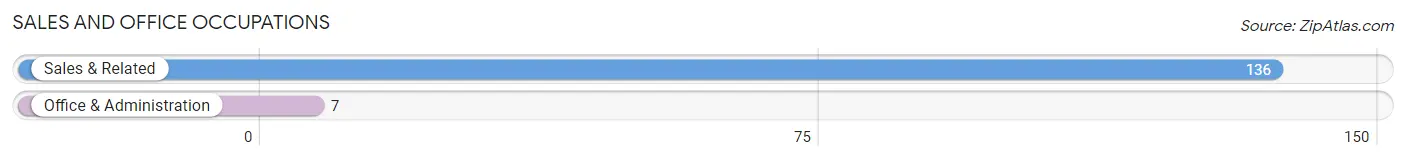
Sales and Office Occupations by Sex
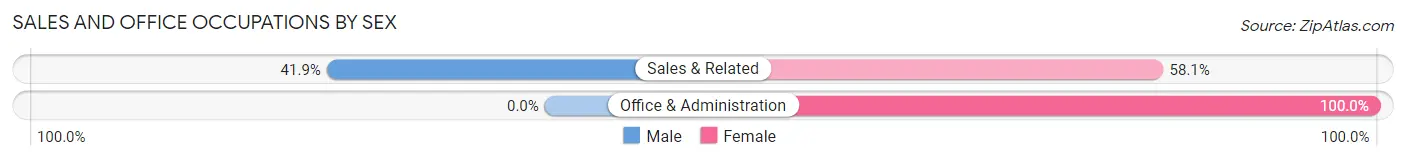
| Occupation | Male | Female |
| Sales & Related | 57 (41.9%) | 79 (58.1%) |
| Office & Administration | 0 (0.0%) | 7 (100.0%) |
| Total (Category) | 57 (39.9%) | 86 (60.1%) |
| Total (Overall) | 242 (46.8%) | 275 (53.2%) |
Natural Resources, Construction and Maintenance Occupations
The most common Natural Resources, Construction and Maintenance occupations in Dollars Corner are , and Construction & Extraction (24 | 4.6%).
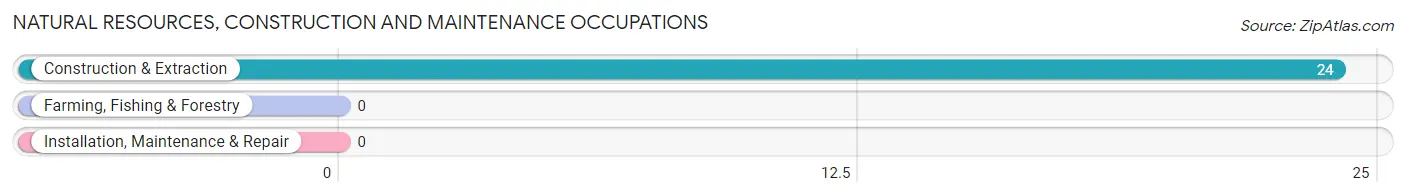
Natural Resources, Construction and Maintenance Occupations by Sex
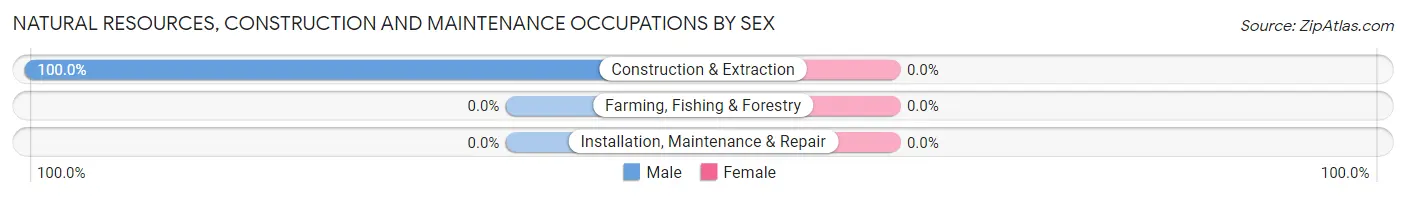
| Occupation | Male | Female |
| Farming, Fishing & Forestry | 0 (0.0%) | 0 (0.0%) |
| Construction & Extraction | 24 (100.0%) | 0 (0.0%) |
| Installation, Maintenance & Repair | 0 (0.0%) | 0 (0.0%) |
| Total (Category) | 24 (100.0%) | 0 (0.0%) |
| Total (Overall) | 242 (46.8%) | 275 (53.2%) |
Production, Transportation and Moving Occupations
The most common Production, Transportation and Moving occupations in Dollars Corner are , and Production (37 | 7.2%).
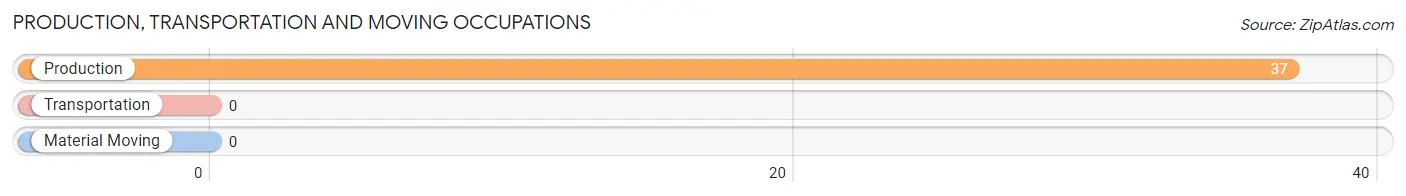
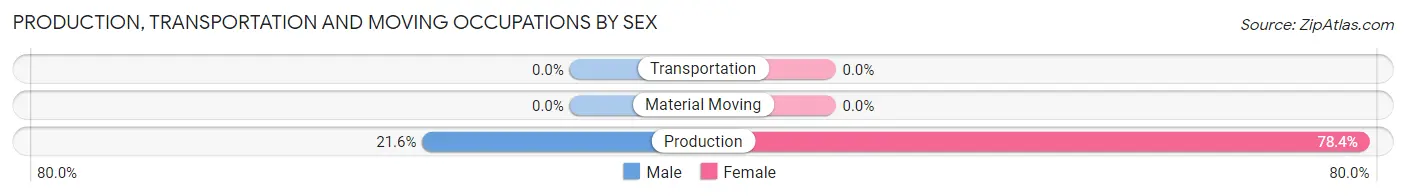
Production, Transportation and Moving Occupations by Sex
| Occupation | Male | Female |
| Production | 8 (21.6%) | 29 (78.4%) |
| Transportation | 0 (0.0%) | 0 (0.0%) |
| Material Moving | 0 (0.0%) | 0 (0.0%) |
| Total (Category) | 8 (21.6%) | 29 (78.4%) |
| Total (Overall) | 242 (46.8%) | 275 (53.2%) |
Employment Industries by Sex in Dollars Corner
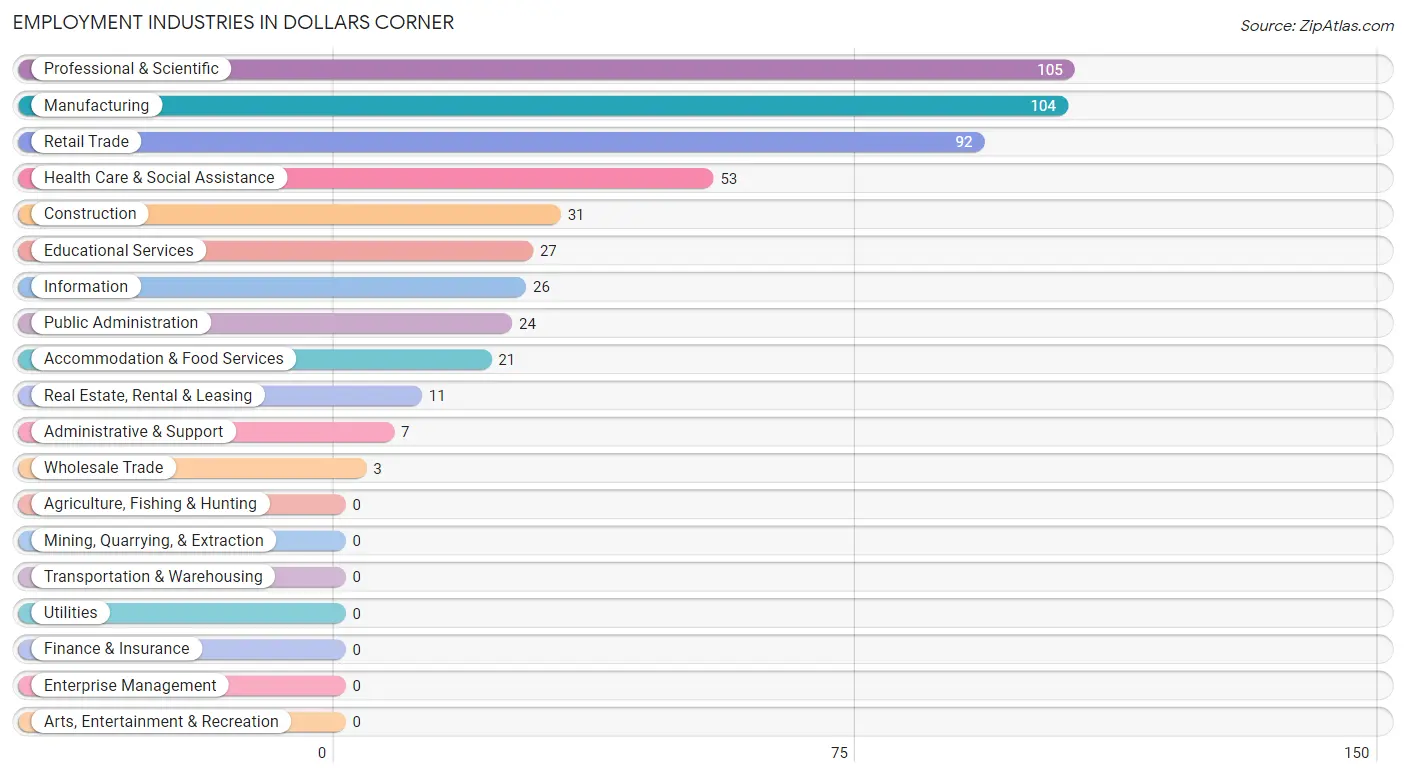
Employment Industries in Dollars Corner
The major employment industries in Dollars Corner include Professional & Scientific (105 | 20.3%), Manufacturing (104 | 20.1%), Retail Trade (92 | 17.8%), Health Care & Social Assistance (53 | 10.2%), and Construction (31 | 6.0%).
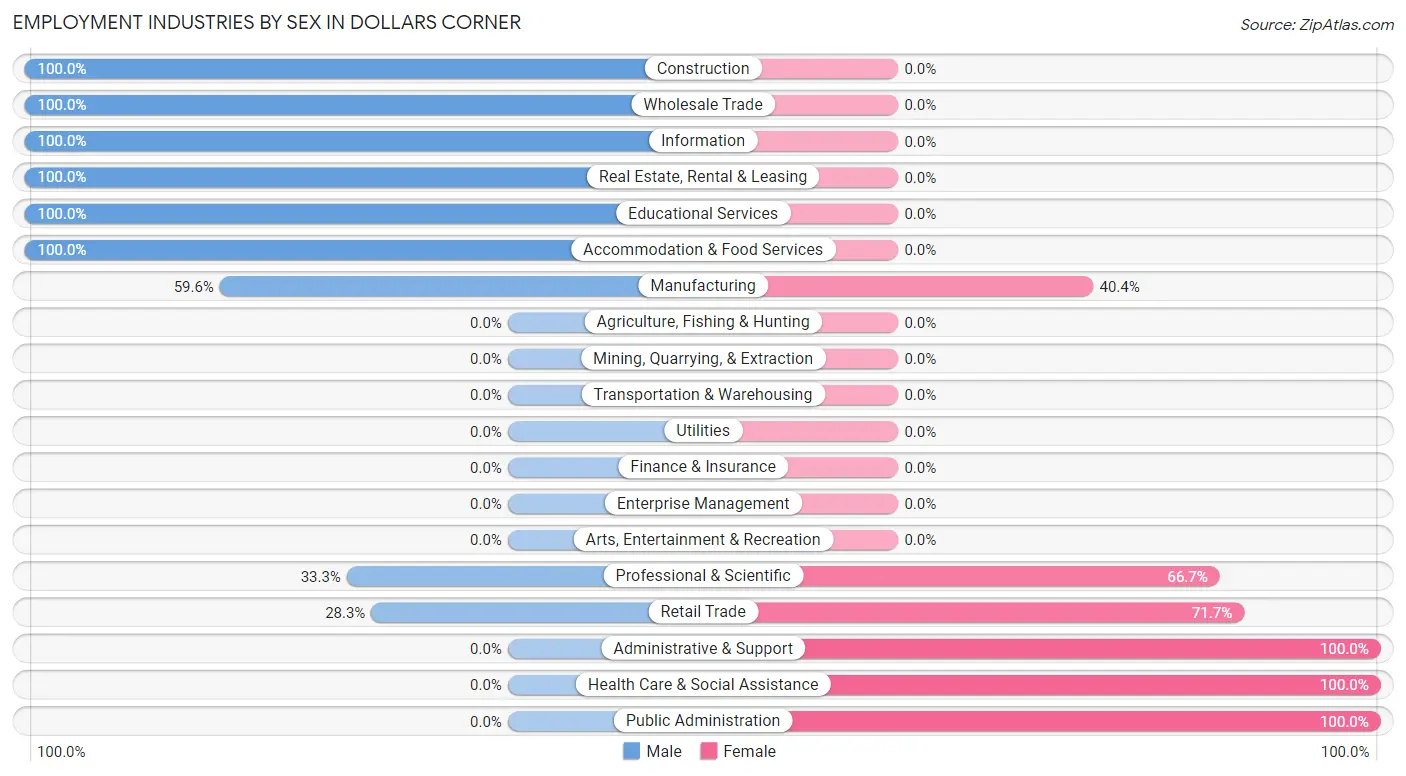
Employment Industries by Sex in Dollars Corner
The Dollars Corner industries that see more men than women are Construction (100.0%), Wholesale Trade (100.0%), and Information (100.0%), whereas the industries that tend to have a higher number of women are Administrative & Support (100.0%), Health Care & Social Assistance (100.0%), and Public Administration (100.0%).
| Industry | Male | Female |
| Agriculture, Fishing & Hunting | 0 (0.0%) | 0 (0.0%) |
| Mining, Quarrying, & Extraction | 0 (0.0%) | 0 (0.0%) |
| Construction | 31 (100.0%) | 0 (0.0%) |
| Manufacturing | 62 (59.6%) | 42 (40.4%) |
| Wholesale Trade | 3 (100.0%) | 0 (0.0%) |
| Retail Trade | 26 (28.3%) | 66 (71.7%) |
| Transportation & Warehousing | 0 (0.0%) | 0 (0.0%) |
| Utilities | 0 (0.0%) | 0 (0.0%) |
| Information | 26 (100.0%) | 0 (0.0%) |
| Finance & Insurance | 0 (0.0%) | 0 (0.0%) |
| Real Estate, Rental & Leasing | 11 (100.0%) | 0 (0.0%) |
| Professional & Scientific | 35 (33.3%) | 70 (66.7%) |
| Enterprise Management | 0 (0.0%) | 0 (0.0%) |
| Administrative & Support | 0 (0.0%) | 7 (100.0%) |
| Educational Services | 27 (100.0%) | 0 (0.0%) |
| Health Care & Social Assistance | 0 (0.0%) | 53 (100.0%) |
| Arts, Entertainment & Recreation | 0 (0.0%) | 0 (0.0%) |
| Accommodation & Food Services | 21 (100.0%) | 0 (0.0%) |
| Public Administration | 0 (0.0%) | 24 (100.0%) |
| Total | 242 (46.8%) | 275 (53.2%) |
Education in Dollars Corner
School Enrollment in Dollars Corner
The most common levels of schooling among the 239 students in Dollars Corner are college / undergraduate (93 | 38.9%), middle school (70 | 29.3%), and high school (52 | 21.8%).
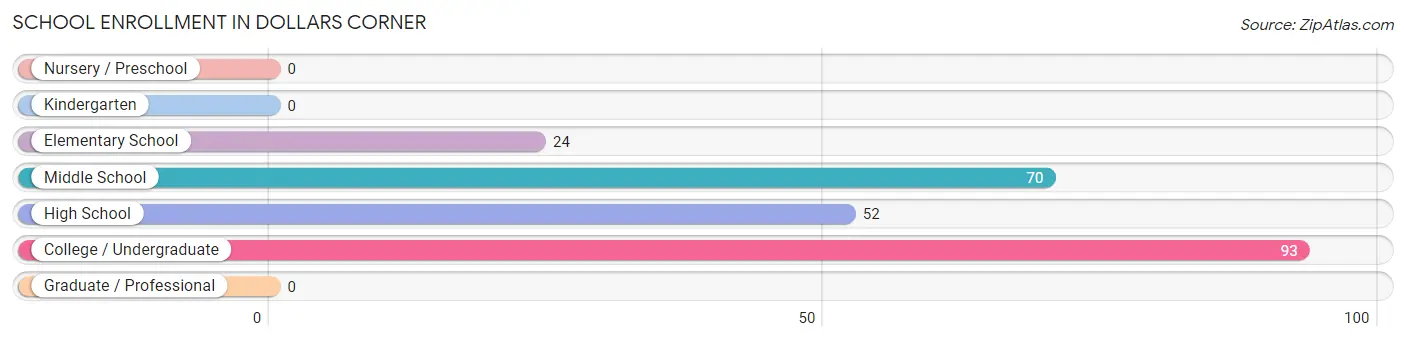
| School Level | # Students | % Students |
| Nursery / Preschool | 0 | 0.0% |
| Kindergarten | 0 | 0.0% |
| Elementary School | 24 | 10.0% |
| Middle School | 70 | 29.3% |
| High School | 52 | 21.8% |
| College / Undergraduate | 93 | 38.9% |
| Graduate / Professional | 0 | 0.0% |
| Total | 239 | 100.0% |
School Enrollment by Age by Funding Source in Dollars Corner
Out of a total of 239 students who are enrolled in schools in Dollars Corner, 32 (13.4%) attend a private institution, while the remaining 207 (86.6%) are enrolled in public schools. The age group of 20 to 24 year olds has the highest likelihood of being enrolled in private schools, with 32 (100.0% in the age bracket) enrolled. Conversely, the age group of 5 to 9 year old has the lowest likelihood of being enrolled in a private school, with 24 (100.0% in the age bracket) attending a public institution.
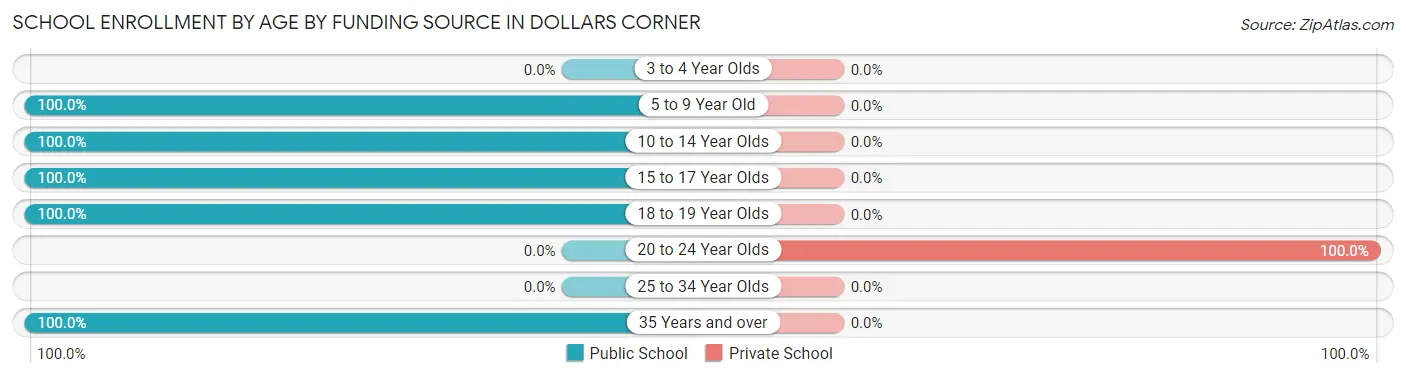
| Age Bracket | Public School | Private School |
| 3 to 4 Year Olds | 0 (0.0%) | 0 (0.0%) |
| 5 to 9 Year Old | 24 (100.0%) | 0 (0.0%) |
| 10 to 14 Year Olds | 70 (100.0%) | 0 (0.0%) |
| 15 to 17 Year Olds | 52 (100.0%) | 0 (0.0%) |
| 18 to 19 Year Olds | 35 (100.0%) | 0 (0.0%) |
| 20 to 24 Year Olds | 0 (0.0%) | 32 (100.0%) |
| 25 to 34 Year Olds | 0 (0.0%) | 0 (0.0%) |
| 35 Years and over | 26 (100.0%) | 0 (0.0%) |
| Total | 207 (86.6%) | 32 (13.4%) |
Educational Attainment by Field of Study in Dollars Corner
Engineering (44 | 22.6%), bio, nature & agricultural (37 | 19.0%), computers & mathematics (24 | 12.3%), science & technology (24 | 12.3%), and arts & humanities (24 | 12.3%) are the most common fields of study among 195 individuals in Dollars Corner who have obtained a bachelor's degree or higher.
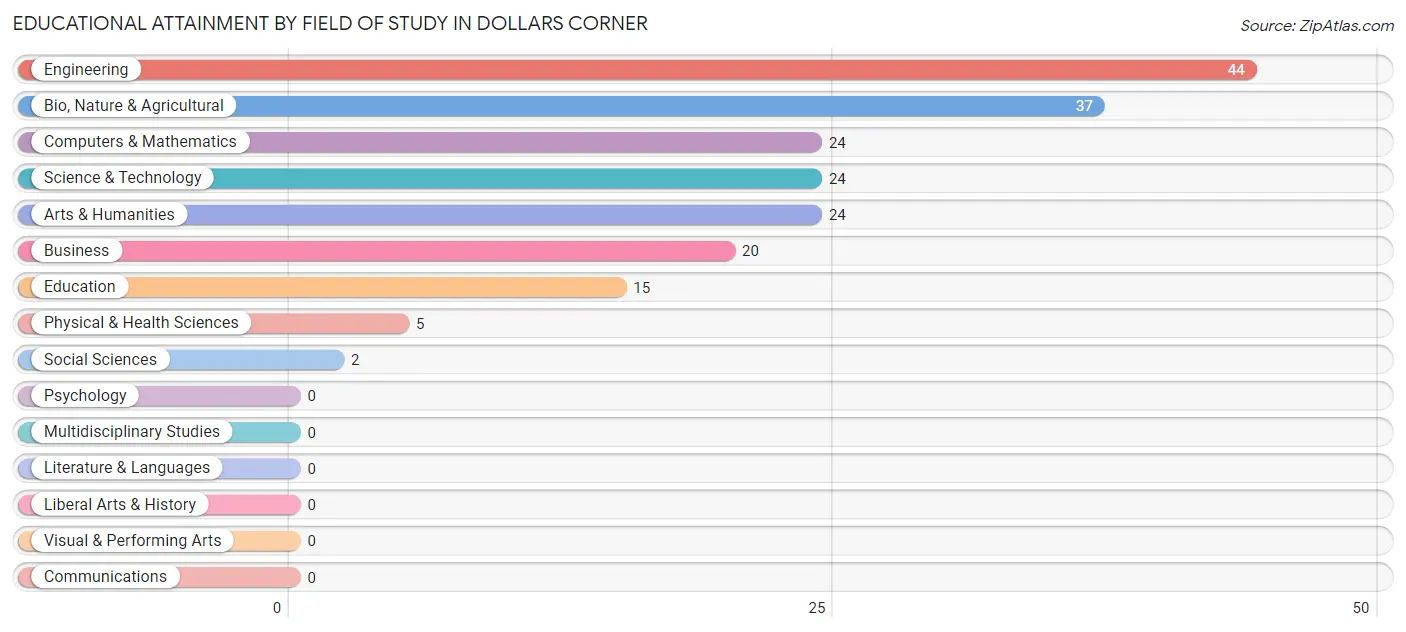
| Field of Study | # Graduates | % Graduates |
| Computers & Mathematics | 24 | 12.3% |
| Bio, Nature & Agricultural | 37 | 19.0% |
| Physical & Health Sciences | 5 | 2.6% |
| Psychology | 0 | 0.0% |
| Social Sciences | 2 | 1.0% |
| Engineering | 44 | 22.6% |
| Multidisciplinary Studies | 0 | 0.0% |
| Science & Technology | 24 | 12.3% |
| Business | 20 | 10.3% |
| Education | 15 | 7.7% |
| Literature & Languages | 0 | 0.0% |
| Liberal Arts & History | 0 | 0.0% |
| Visual & Performing Arts | 0 | 0.0% |
| Communications | 0 | 0.0% |
| Arts & Humanities | 24 | 12.3% |
| Total | 195 | 100.0% |
Transportation & Commute in Dollars Corner
Vehicle Availability by Sex in Dollars Corner
The most prevalent vehicle ownership categories in Dollars Corner are males with 4 vehicles (102, accounting for 42.1%) and females with 4 vehicles (120, making up 36.8%).
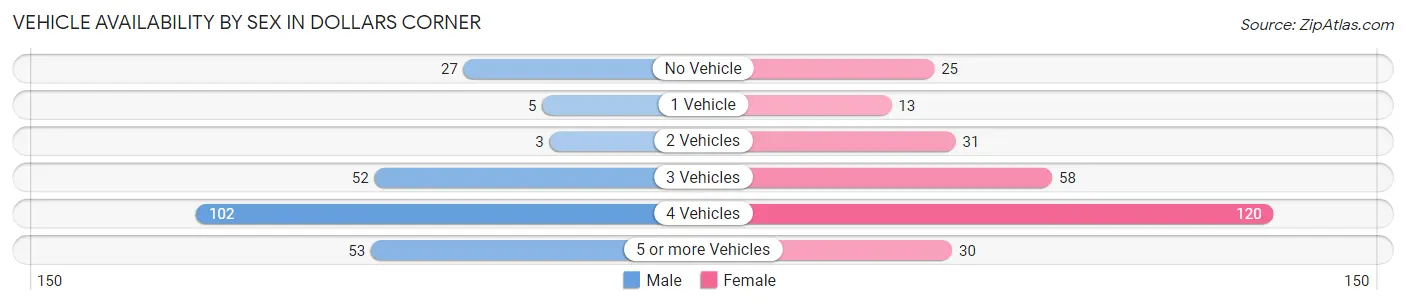
| Vehicles Available | Male | Female |
| No Vehicle | 27 (11.2%) | 25 (9.0%) |
| 1 Vehicle | 5 (2.1%) | 13 (4.7%) |
| 2 Vehicles | 3 (1.2%) | 31 (11.2%) |
| 3 Vehicles | 52 (21.5%) | 58 (20.9%) |
| 4 Vehicles | 102 (42.1%) | 120 (43.3%) |
| 5 or more Vehicles | 53 (21.9%) | 30 (10.8%) |
| Total | 242 (100.0%) | 277 (100.0%) |
Commute Time in Dollars Corner
The most frequently occuring commute durations in Dollars Corner are 20 to 24 minutes (88 commuters, 20.4%), 30 to 34 minutes (65 commuters, 15.1%), and 60 to 89 minutes (56 commuters, 13.0%).
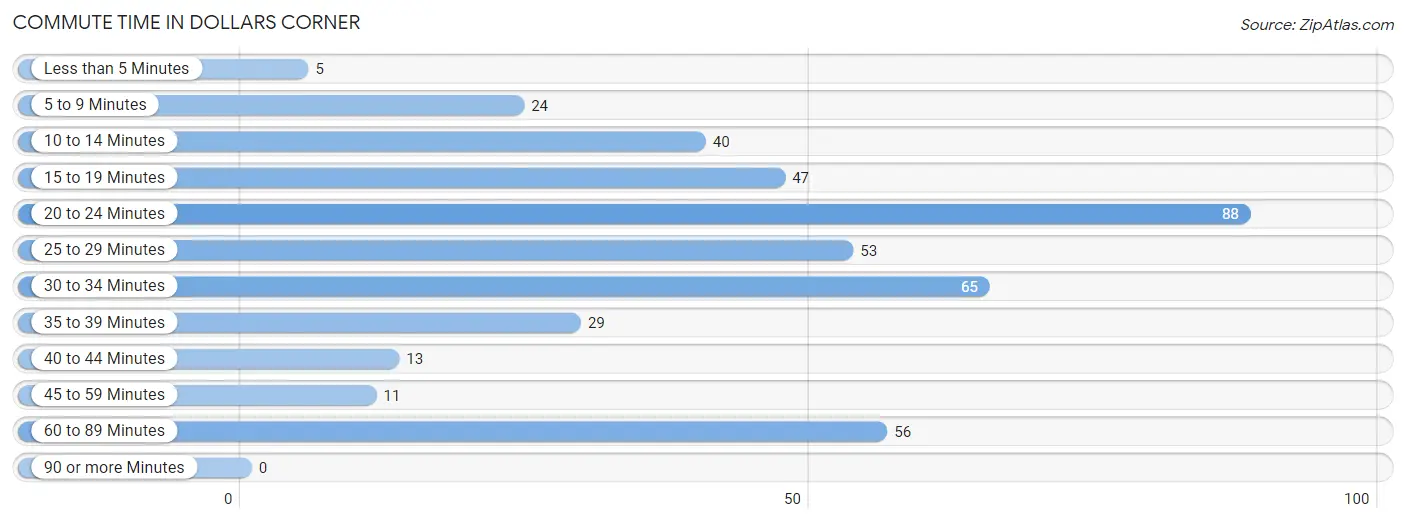
| Commute Time | # Commuters | % Commuters |
| Less than 5 Minutes | 5 | 1.2% |
| 5 to 9 Minutes | 24 | 5.6% |
| 10 to 14 Minutes | 40 | 9.3% |
| 15 to 19 Minutes | 47 | 10.9% |
| 20 to 24 Minutes | 88 | 20.4% |
| 25 to 29 Minutes | 53 | 12.3% |
| 30 to 34 Minutes | 65 | 15.1% |
| 35 to 39 Minutes | 29 | 6.7% |
| 40 to 44 Minutes | 13 | 3.0% |
| 45 to 59 Minutes | 11 | 2.5% |
| 60 to 89 Minutes | 56 | 13.0% |
| 90 or more Minutes | 0 | 0.0% |
Commute Time by Sex in Dollars Corner
The most common commute times in Dollars Corner are 20 to 24 minutes (54 commuters, 26.3%) for males and 30 to 34 minutes (65 commuters, 28.8%) for females.
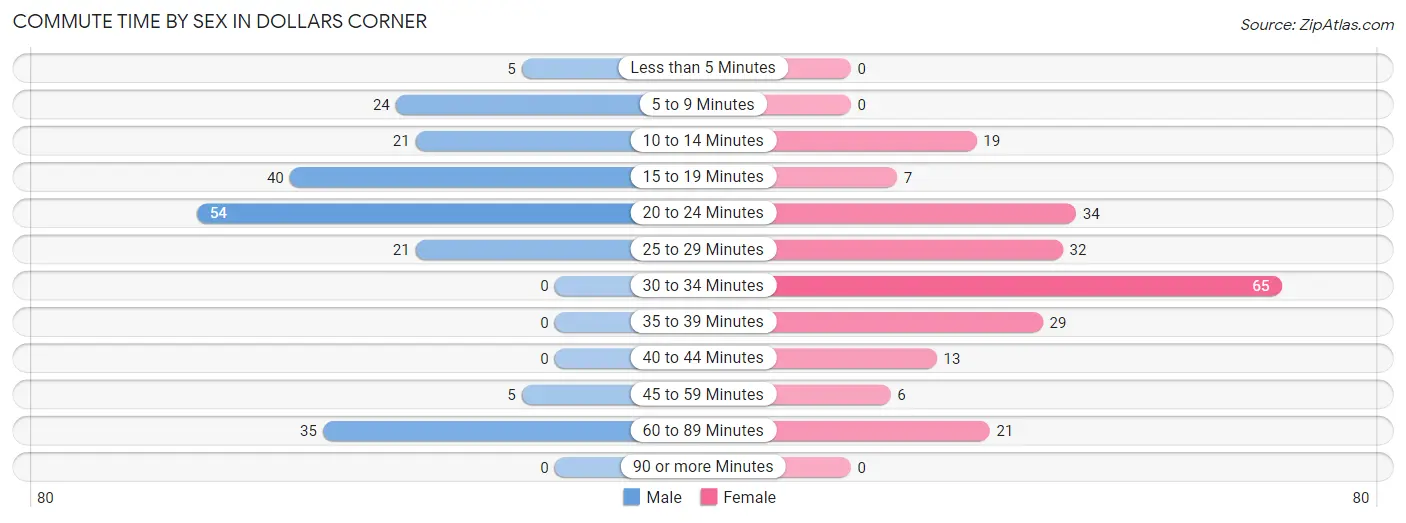
| Commute Time | Male | Female |
| Less than 5 Minutes | 5 (2.4%) | 0 (0.0%) |
| 5 to 9 Minutes | 24 (11.7%) | 0 (0.0%) |
| 10 to 14 Minutes | 21 (10.2%) | 19 (8.4%) |
| 15 to 19 Minutes | 40 (19.5%) | 7 (3.1%) |
| 20 to 24 Minutes | 54 (26.3%) | 34 (15.0%) |
| 25 to 29 Minutes | 21 (10.2%) | 32 (14.2%) |
| 30 to 34 Minutes | 0 (0.0%) | 65 (28.8%) |
| 35 to 39 Minutes | 0 (0.0%) | 29 (12.8%) |
| 40 to 44 Minutes | 0 (0.0%) | 13 (5.8%) |
| 45 to 59 Minutes | 5 (2.4%) | 6 (2.6%) |
| 60 to 89 Minutes | 35 (17.1%) | 21 (9.3%) |
| 90 or more Minutes | 0 (0.0%) | 0 (0.0%) |
Time of Departure to Work by Sex in Dollars Corner
The most frequent times of departure to work in Dollars Corner are 6:00 AM to 6:29 AM (47, 22.9%) for males and 7:30 AM to 7:59 AM (64, 28.3%) for females.
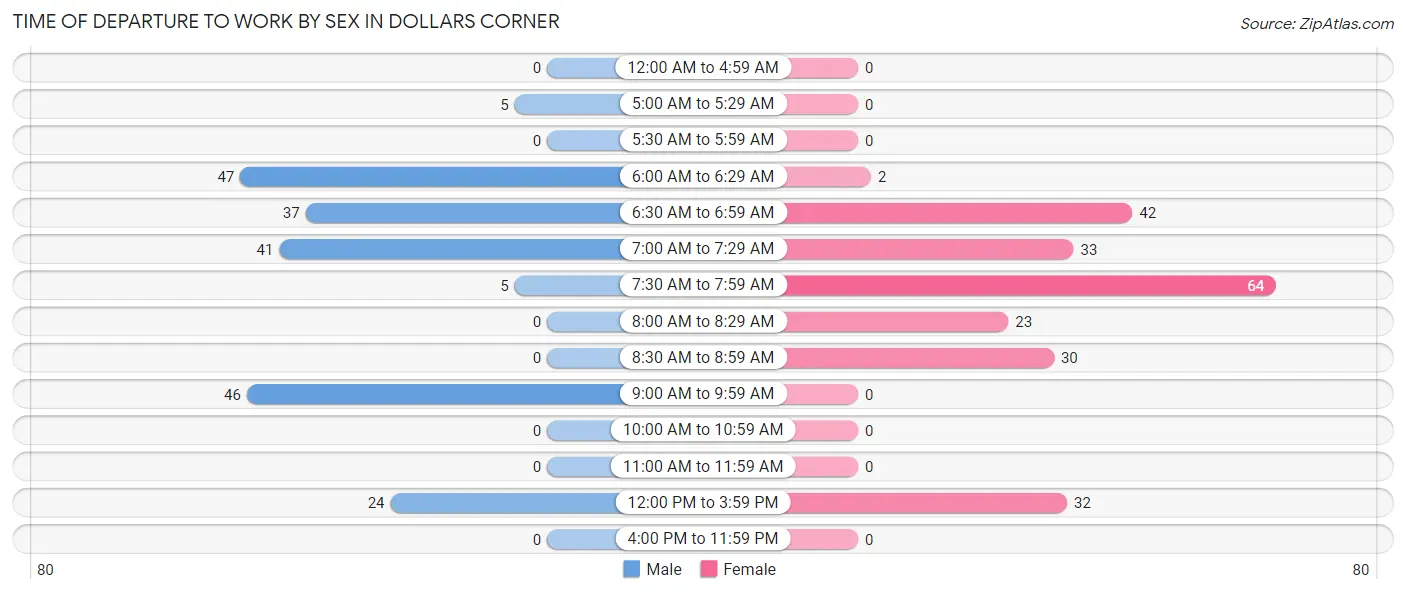
| Time of Departure | Male | Female |
| 12:00 AM to 4:59 AM | 0 (0.0%) | 0 (0.0%) |
| 5:00 AM to 5:29 AM | 5 (2.4%) | 0 (0.0%) |
| 5:30 AM to 5:59 AM | 0 (0.0%) | 0 (0.0%) |
| 6:00 AM to 6:29 AM | 47 (22.9%) | 2 (0.9%) |
| 6:30 AM to 6:59 AM | 37 (18.0%) | 42 (18.6%) |
| 7:00 AM to 7:29 AM | 41 (20.0%) | 33 (14.6%) |
| 7:30 AM to 7:59 AM | 5 (2.4%) | 64 (28.3%) |
| 8:00 AM to 8:29 AM | 0 (0.0%) | 23 (10.2%) |
| 8:30 AM to 8:59 AM | 0 (0.0%) | 30 (13.3%) |
| 9:00 AM to 9:59 AM | 46 (22.4%) | 0 (0.0%) |
| 10:00 AM to 10:59 AM | 0 (0.0%) | 0 (0.0%) |
| 11:00 AM to 11:59 AM | 0 (0.0%) | 0 (0.0%) |
| 12:00 PM to 3:59 PM | 24 (11.7%) | 32 (14.2%) |
| 4:00 PM to 11:59 PM | 0 (0.0%) | 0 (0.0%) |
| Total | 205 (100.0%) | 226 (100.0%) |
Housing Occupancy in Dollars Corner
Occupancy by Ownership in Dollars Corner
Of the total 283 dwellings in Dollars Corner, owner-occupied units account for 265 (93.6%), while renter-occupied units make up 18 (6.4%).
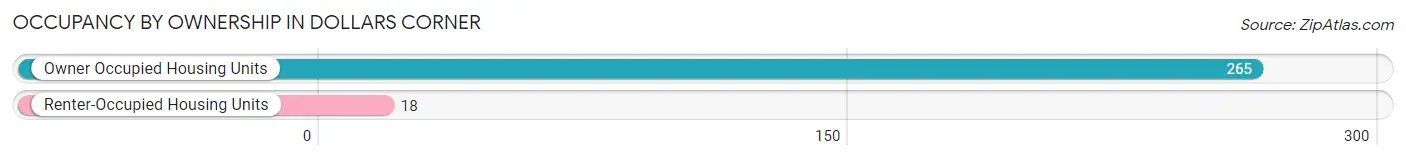
| Occupancy | # Housing Units | % Housing Units |
| Owner Occupied Housing Units | 265 | 93.6% |
| Renter-Occupied Housing Units | 18 | 6.4% |
| Total Occupied Housing Units | 283 | 100.0% |
Occupancy by Household Size in Dollars Corner
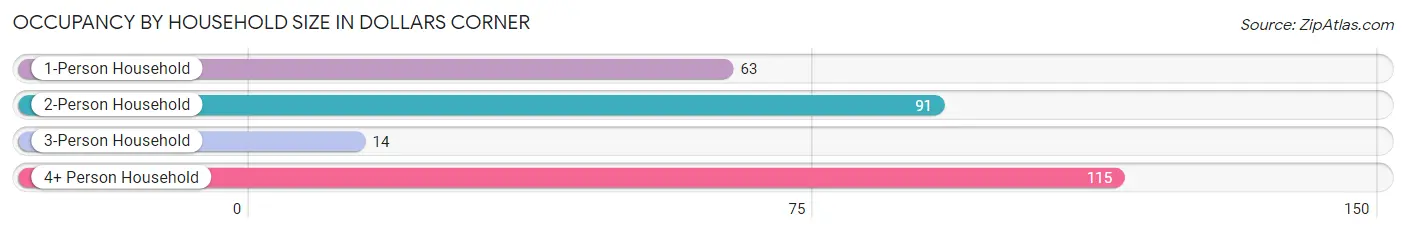
| Household Size | # Housing Units | % Housing Units |
| 1-Person Household | 63 | 22.3% |
| 2-Person Household | 91 | 32.2% |
| 3-Person Household | 14 | 5.0% |
| 4+ Person Household | 115 | 40.6% |
| Total Housing Units | 283 | 100.0% |
Occupancy by Ownership by Household Size in Dollars Corner
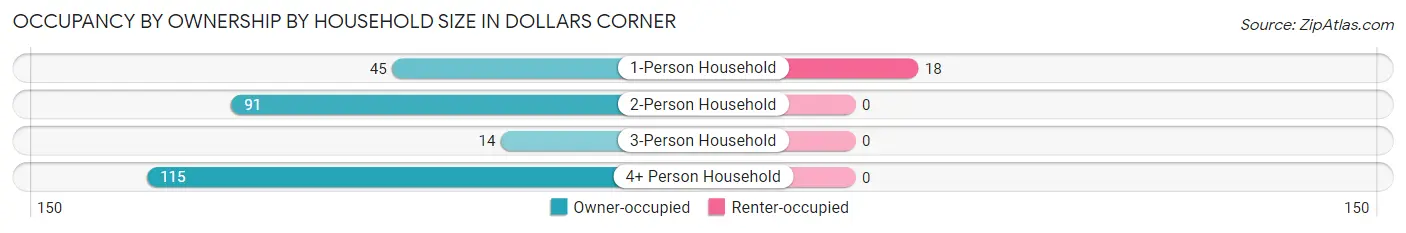
| Household Size | Owner-occupied | Renter-occupied |
| 1-Person Household | 45 (71.4%) | 18 (28.6%) |
| 2-Person Household | 91 (100.0%) | 0 (0.0%) |
| 3-Person Household | 14 (100.0%) | 0 (0.0%) |
| 4+ Person Household | 115 (100.0%) | 0 (0.0%) |
| Total Housing Units | 265 (93.6%) | 18 (6.4%) |
Occupancy by Educational Attainment in Dollars Corner
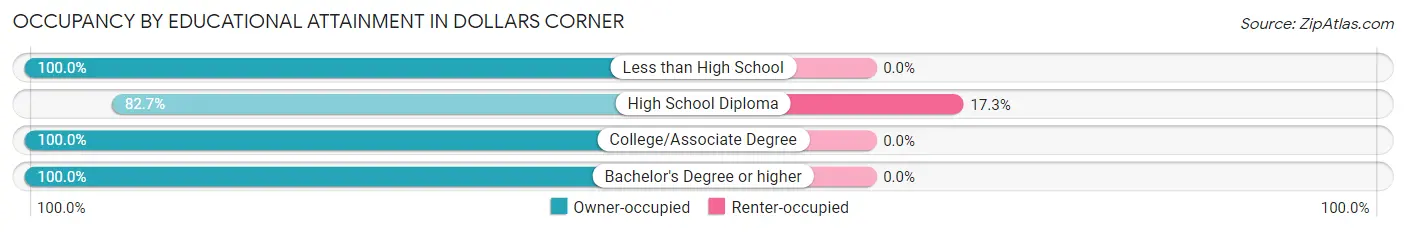
| Household Size | Owner-occupied | Renter-occupied |
| Less than High School | 19 (100.0%) | 0 (0.0%) |
| High School Diploma | 86 (82.7%) | 18 (17.3%) |
| College/Associate Degree | 56 (100.0%) | 0 (0.0%) |
| Bachelor's Degree or higher | 104 (100.0%) | 0 (0.0%) |
Occupancy by Age of Householder in Dollars Corner
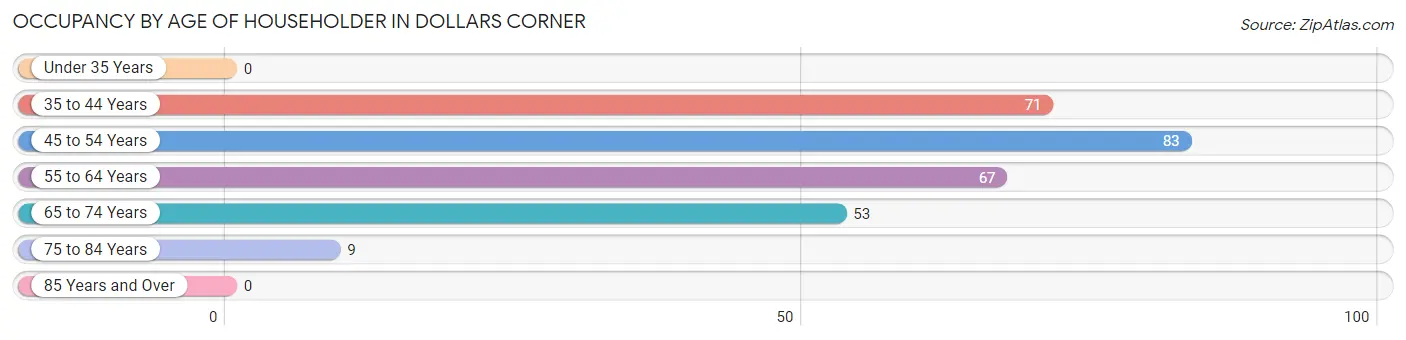
| Age Bracket | # Households | % Households |
| Under 35 Years | 0 | 0.0% |
| 35 to 44 Years | 71 | 25.1% |
| 45 to 54 Years | 83 | 29.3% |
| 55 to 64 Years | 67 | 23.7% |
| 65 to 74 Years | 53 | 18.7% |
| 75 to 84 Years | 9 | 3.2% |
| 85 Years and Over | 0 | 0.0% |
| Total | 283 | 100.0% |
Housing Finances in Dollars Corner
Median Income by Occupancy in Dollars Corner
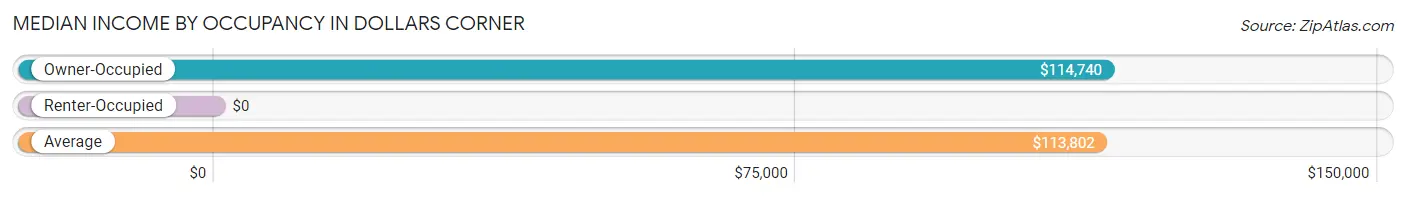
| Occupancy Type | # Households | Median Income |
| Owner-Occupied | 265 (93.6%) | $114,740 |
| Renter-Occupied | 18 (6.4%) | $0 |
| Average | 283 (100.0%) | $113,802 |
Occupancy by Householder Income Bracket in Dollars Corner
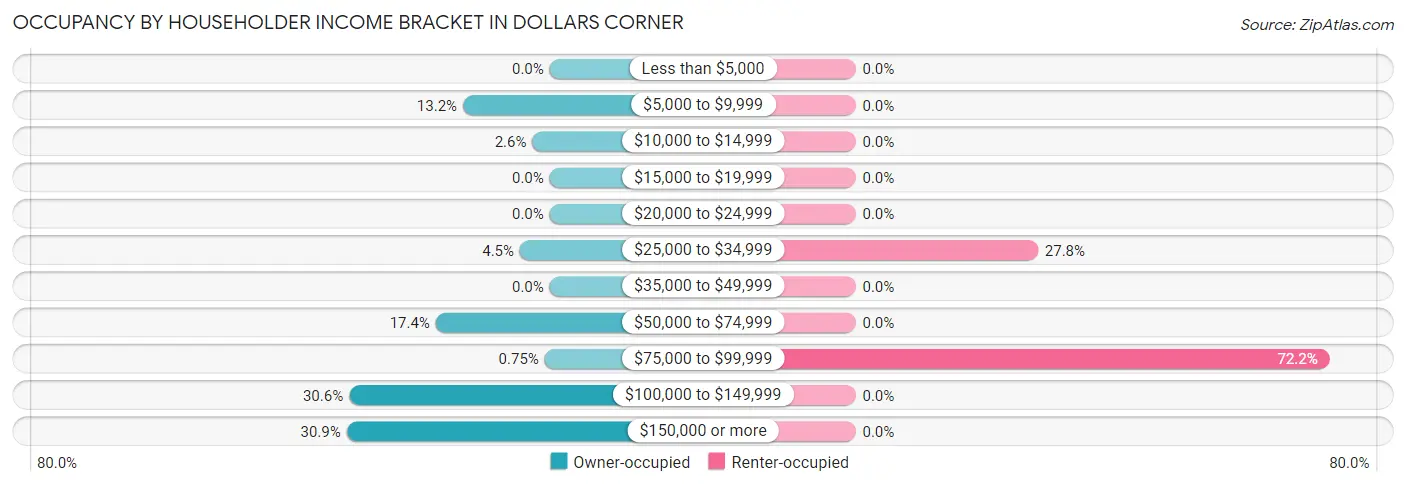
| Income Bracket | Owner-occupied | Renter-occupied |
| Less than $5,000 | 0 (0.0%) | 0 (0.0%) |
| $5,000 to $9,999 | 35 (13.2%) | 0 (0.0%) |
| $10,000 to $14,999 | 7 (2.6%) | 0 (0.0%) |
| $15,000 to $19,999 | 0 (0.0%) | 0 (0.0%) |
| $20,000 to $24,999 | 0 (0.0%) | 0 (0.0%) |
| $25,000 to $34,999 | 12 (4.5%) | 5 (27.8%) |
| $35,000 to $49,999 | 0 (0.0%) | 0 (0.0%) |
| $50,000 to $74,999 | 46 (17.4%) | 0 (0.0%) |
| $75,000 to $99,999 | 2 (0.7%) | 13 (72.2%) |
| $100,000 to $149,999 | 81 (30.6%) | 0 (0.0%) |
| $150,000 or more | 82 (30.9%) | 0 (0.0%) |
| Total | 265 (100.0%) | 18 (100.0%) |
Monthly Housing Cost Tiers in Dollars Corner
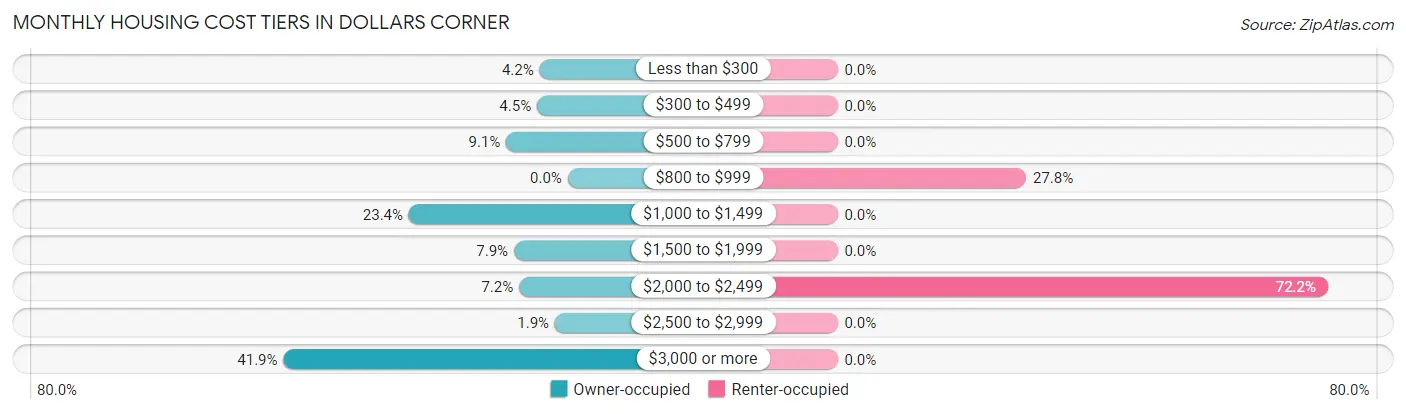
| Monthly Cost | Owner-occupied | Renter-occupied |
| Less than $300 | 11 (4.2%) | 0 (0.0%) |
| $300 to $499 | 12 (4.5%) | 0 (0.0%) |
| $500 to $799 | 24 (9.1%) | 0 (0.0%) |
| $800 to $999 | 0 (0.0%) | 5 (27.8%) |
| $1,000 to $1,499 | 62 (23.4%) | 0 (0.0%) |
| $1,500 to $1,999 | 21 (7.9%) | 0 (0.0%) |
| $2,000 to $2,499 | 19 (7.2%) | 13 (72.2%) |
| $2,500 to $2,999 | 5 (1.9%) | 0 (0.0%) |
| $3,000 or more | 111 (41.9%) | 0 (0.0%) |
| Total | 265 (100.0%) | 18 (100.0%) |
Physical Housing Characteristics in Dollars Corner
Housing Structures in Dollars Corner
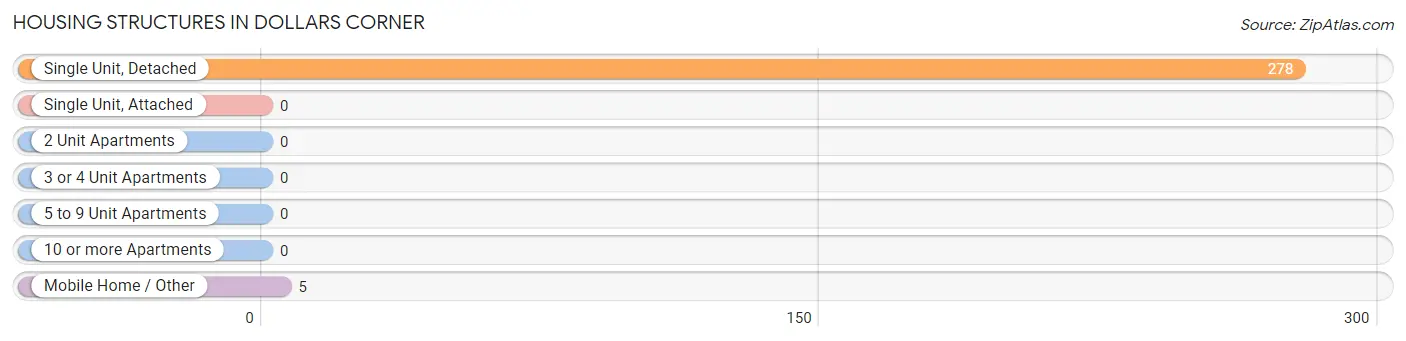
| Structure Type | # Housing Units | % Housing Units |
| Single Unit, Detached | 278 | 98.2% |
| Single Unit, Attached | 0 | 0.0% |
| 2 Unit Apartments | 0 | 0.0% |
| 3 or 4 Unit Apartments | 0 | 0.0% |
| 5 to 9 Unit Apartments | 0 | 0.0% |
| 10 or more Apartments | 0 | 0.0% |
| Mobile Home / Other | 5 | 1.8% |
| Total | 283 | 100.0% |
Housing Structures by Occupancy in Dollars Corner
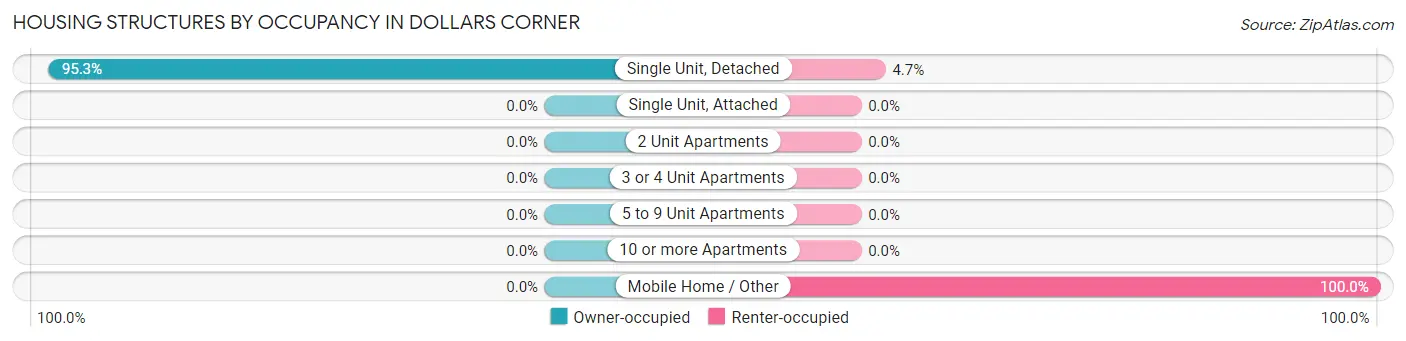
| Structure Type | Owner-occupied | Renter-occupied |
| Single Unit, Detached | 265 (95.3%) | 13 (4.7%) |
| Single Unit, Attached | 0 (0.0%) | 0 (0.0%) |
| 2 Unit Apartments | 0 (0.0%) | 0 (0.0%) |
| 3 or 4 Unit Apartments | 0 (0.0%) | 0 (0.0%) |
| 5 to 9 Unit Apartments | 0 (0.0%) | 0 (0.0%) |
| 10 or more Apartments | 0 (0.0%) | 0 (0.0%) |
| Mobile Home / Other | 0 (0.0%) | 5 (100.0%) |
| Total | 265 (93.6%) | 18 (6.4%) |
Housing Structures by Number of Rooms in Dollars Corner
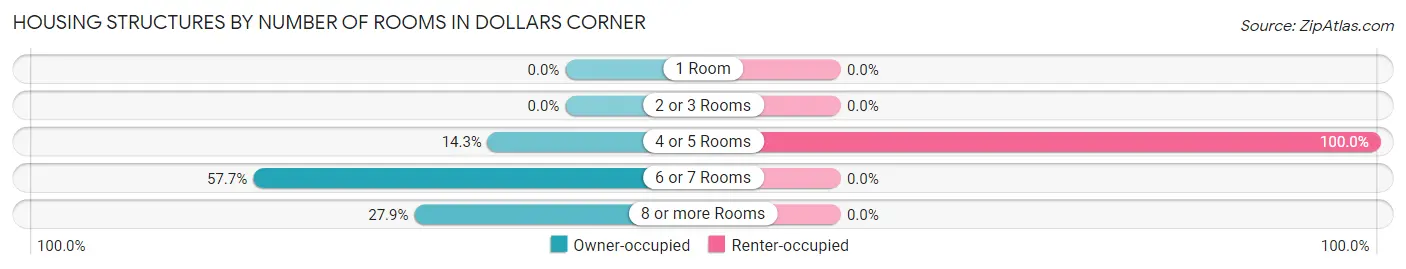
| Number of Rooms | Owner-occupied | Renter-occupied |
| 1 Room | 0 (0.0%) | 0 (0.0%) |
| 2 or 3 Rooms | 0 (0.0%) | 0 (0.0%) |
| 4 or 5 Rooms | 38 (14.3%) | 18 (100.0%) |
| 6 or 7 Rooms | 153 (57.7%) | 0 (0.0%) |
| 8 or more Rooms | 74 (27.9%) | 0 (0.0%) |
| Total | 265 (100.0%) | 18 (100.0%) |
Housing Structure by Heating Type in Dollars Corner
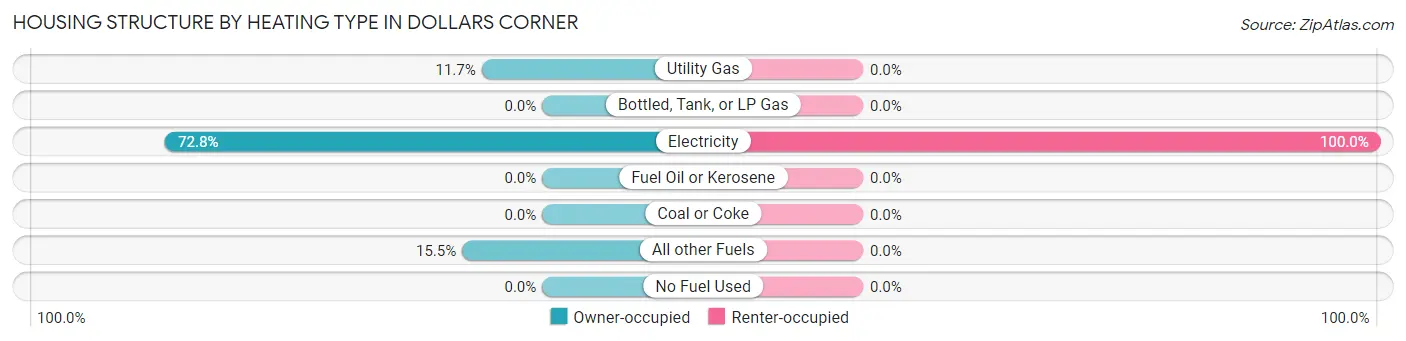
| Heating Type | Owner-occupied | Renter-occupied |
| Utility Gas | 31 (11.7%) | 0 (0.0%) |
| Bottled, Tank, or LP Gas | 0 (0.0%) | 0 (0.0%) |
| Electricity | 193 (72.8%) | 18 (100.0%) |
| Fuel Oil or Kerosene | 0 (0.0%) | 0 (0.0%) |
| Coal or Coke | 0 (0.0%) | 0 (0.0%) |
| All other Fuels | 41 (15.5%) | 0 (0.0%) |
| No Fuel Used | 0 (0.0%) | 0 (0.0%) |
| Total | 265 (100.0%) | 18 (100.0%) |
Household Vehicle Usage in Dollars Corner
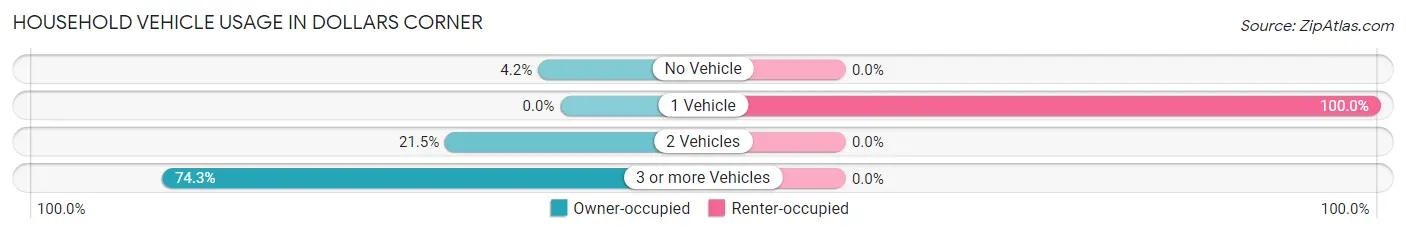
| Vehicles per Household | Owner-occupied | Renter-occupied |
| No Vehicle | 11 (4.2%) | 0 (0.0%) |
| 1 Vehicle | 0 (0.0%) | 18 (100.0%) |
| 2 Vehicles | 57 (21.5%) | 0 (0.0%) |
| 3 or more Vehicles | 197 (74.3%) | 0 (0.0%) |
| Total | 265 (100.0%) | 18 (100.0%) |
Real Estate & Mortgages in Dollars Corner
Real Estate and Mortgage Overview in Dollars Corner
| Characteristic | Without Mortgage | With Mortgage |
| Housing Units | 56 | 209 |
| Median Property Value | $381,000 | $524,400 |
| Median Household Income | - | - |
| Monthly Housing Costs | $556 | $111 |
| Real Estate Taxes | $3,810 | $0 |
Property Value by Mortgage Status in Dollars Corner
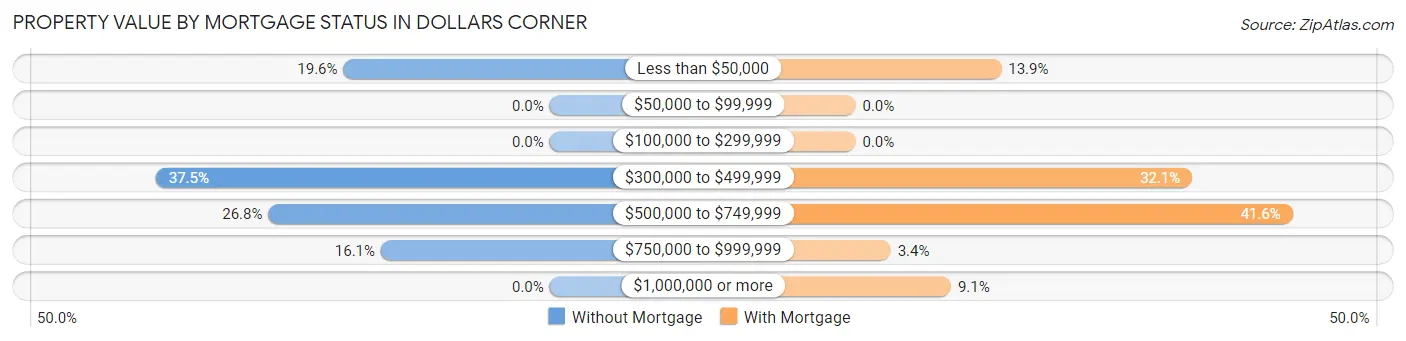
| Property Value | Without Mortgage | With Mortgage |
| Less than $50,000 | 11 (19.6%) | 29 (13.9%) |
| $50,000 to $99,999 | 0 (0.0%) | 0 (0.0%) |
| $100,000 to $299,999 | 0 (0.0%) | 0 (0.0%) |
| $300,000 to $499,999 | 21 (37.5%) | 67 (32.1%) |
| $500,000 to $749,999 | 15 (26.8%) | 87 (41.6%) |
| $750,000 to $999,999 | 9 (16.1%) | 7 (3.4%) |
| $1,000,000 or more | 0 (0.0%) | 19 (9.1%) |
| Total | 56 (100.0%) | 209 (100.0%) |
Household Income by Mortgage Status in Dollars Corner
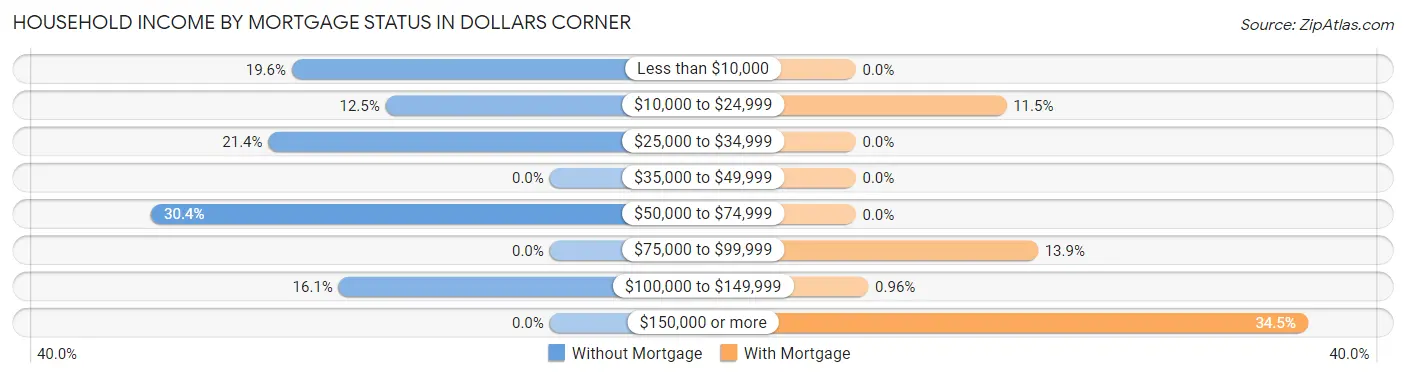
| Household Income | Without Mortgage | With Mortgage |
| Less than $10,000 | 11 (19.6%) | 0 (0.0%) |
| $10,000 to $24,999 | 7 (12.5%) | 24 (11.5%) |
| $25,000 to $34,999 | 12 (21.4%) | 0 (0.0%) |
| $35,000 to $49,999 | 0 (0.0%) | 0 (0.0%) |
| $50,000 to $74,999 | 17 (30.4%) | 0 (0.0%) |
| $75,000 to $99,999 | 0 (0.0%) | 29 (13.9%) |
| $100,000 to $149,999 | 9 (16.1%) | 2 (1.0%) |
| $150,000 or more | 0 (0.0%) | 72 (34.4%) |
| Total | 56 (100.0%) | 209 (100.0%) |
Property Value to Household Income Ratio in Dollars Corner
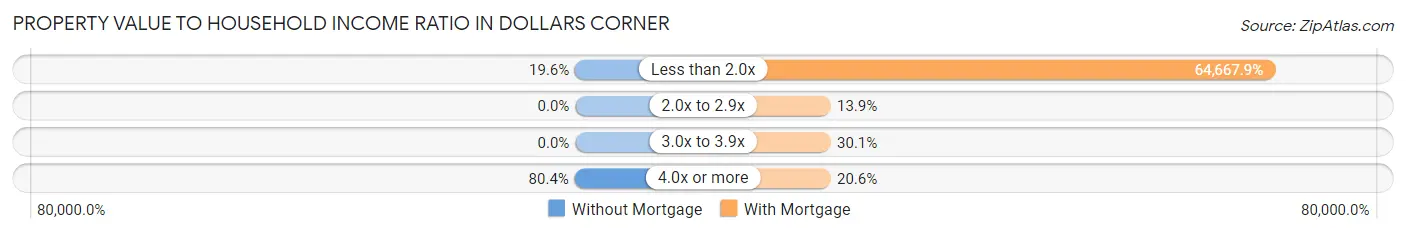
| Value-to-Income Ratio | Without Mortgage | With Mortgage |
| Less than 2.0x | 11 (19.6%) | 135,156 (64,667.9%) |
| 2.0x to 2.9x | 0 (0.0%) | 29 (13.9%) |
| 3.0x to 3.9x | 0 (0.0%) | 63 (30.1%) |
| 4.0x or more | 45 (80.4%) | 43 (20.6%) |
| Total | 56 (100.0%) | 209 (100.0%) |
Real Estate Taxes by Mortgage Status in Dollars Corner
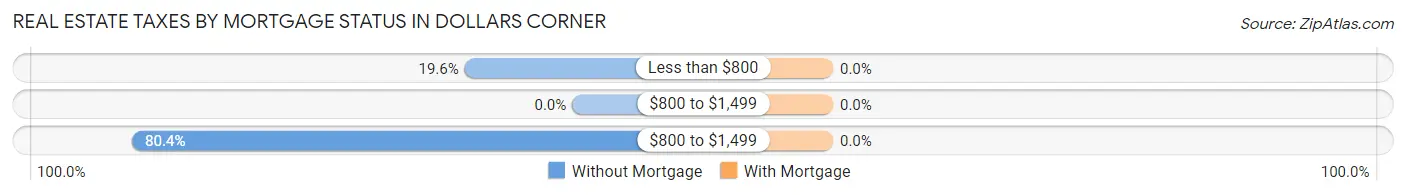
| Property Taxes | Without Mortgage | With Mortgage |
| Less than $800 | 11 (19.6%) | 0 (0.0%) |
| $800 to $1,499 | 0 (0.0%) | 0 (0.0%) |
| $800 to $1,499 | 45 (80.4%) | 0 (0.0%) |
| Total | 56 (100.0%) | 209 (100.0%) |
Health & Disability in Dollars Corner
Health Insurance Coverage by Age in Dollars Corner
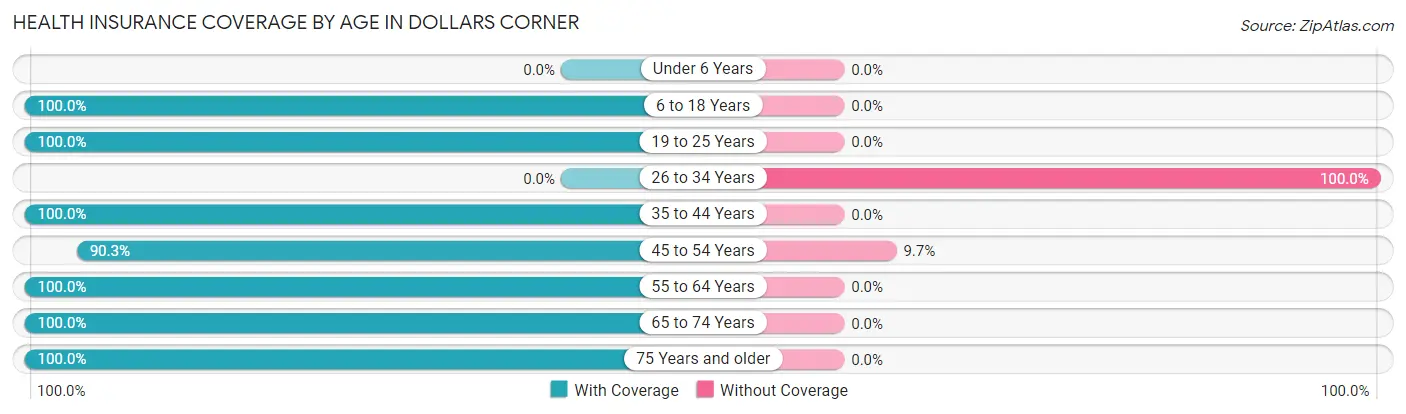
| Age Bracket | With Coverage | Without Coverage |
| Under 6 Years | 0 (0.0%) | 0 (0.0%) |
| 6 to 18 Years | 155 (100.0%) | 0 (0.0%) |
| 19 to 25 Years | 118 (100.0%) | 0 (0.0%) |
| 26 to 34 Years | 0 (0.0%) | 32 (100.0%) |
| 35 to 44 Years | 140 (100.0%) | 0 (0.0%) |
| 45 to 54 Years | 167 (90.3%) | 18 (9.7%) |
| 55 to 64 Years | 99 (100.0%) | 0 (0.0%) |
| 65 to 74 Years | 77 (100.0%) | 0 (0.0%) |
| 75 Years and older | 16 (100.0%) | 0 (0.0%) |
| Total | 772 (93.9%) | 50 (6.1%) |
Health Insurance Coverage by Citizenship Status in Dollars Corner
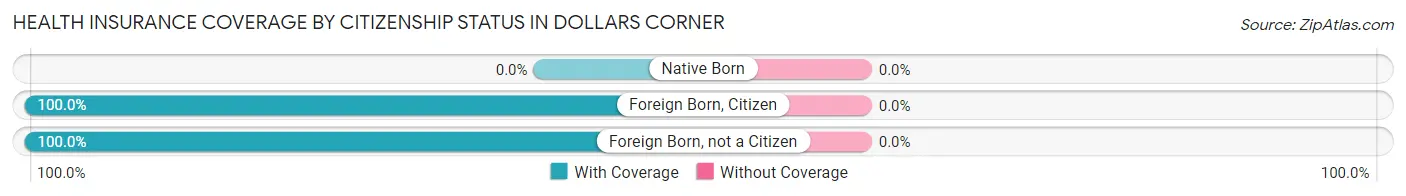
| Citizenship Status | With Coverage | Without Coverage |
| Native Born | 0 (0.0%) | 0 (0.0%) |
| Foreign Born, Citizen | 155 (100.0%) | 0 (0.0%) |
| Foreign Born, not a Citizen | 118 (100.0%) | 0 (0.0%) |
Health Insurance Coverage by Household Income in Dollars Corner
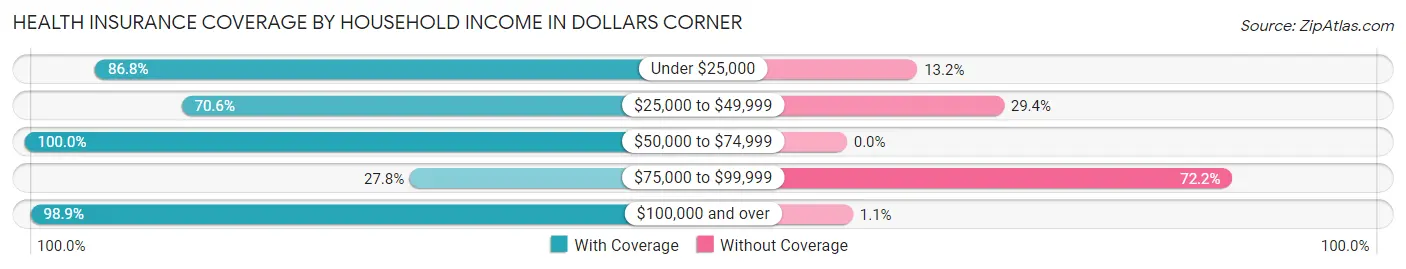
| Household Income | With Coverage | Without Coverage |
| Under $25,000 | 171 (86.8%) | 26 (13.2%) |
| $25,000 to $49,999 | 12 (70.6%) | 5 (29.4%) |
| $50,000 to $74,999 | 60 (100.0%) | 0 (0.0%) |
| $75,000 to $99,999 | 5 (27.8%) | 13 (72.2%) |
| $100,000 and over | 524 (98.9%) | 6 (1.1%) |
Public vs Private Health Insurance Coverage by Age in Dollars Corner
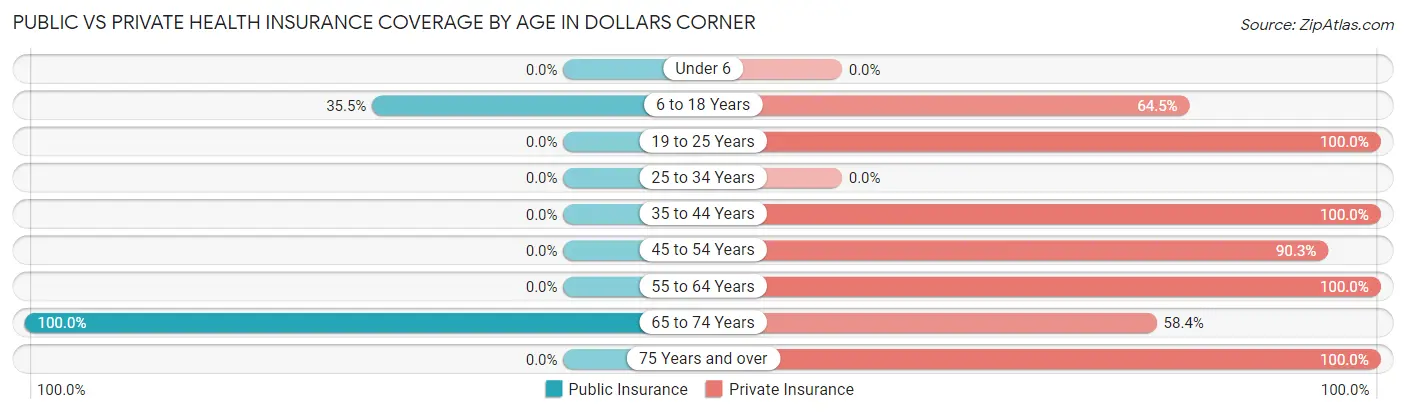
| Age Bracket | Public Insurance | Private Insurance |
| Under 6 | 0 (0.0%) | 0 (0.0%) |
| 6 to 18 Years | 55 (35.5%) | 100 (64.5%) |
| 19 to 25 Years | 0 (0.0%) | 118 (100.0%) |
| 25 to 34 Years | 0 (0.0%) | 0 (0.0%) |
| 35 to 44 Years | 0 (0.0%) | 140 (100.0%) |
| 45 to 54 Years | 0 (0.0%) | 167 (90.3%) |
| 55 to 64 Years | 0 (0.0%) | 99 (100.0%) |
| 65 to 74 Years | 77 (100.0%) | 45 (58.4%) |
| 75 Years and over | 0 (0.0%) | 16 (100.0%) |
| Total | 132 (16.1%) | 685 (83.3%) |
Disability Status by Sex by Age in Dollars Corner
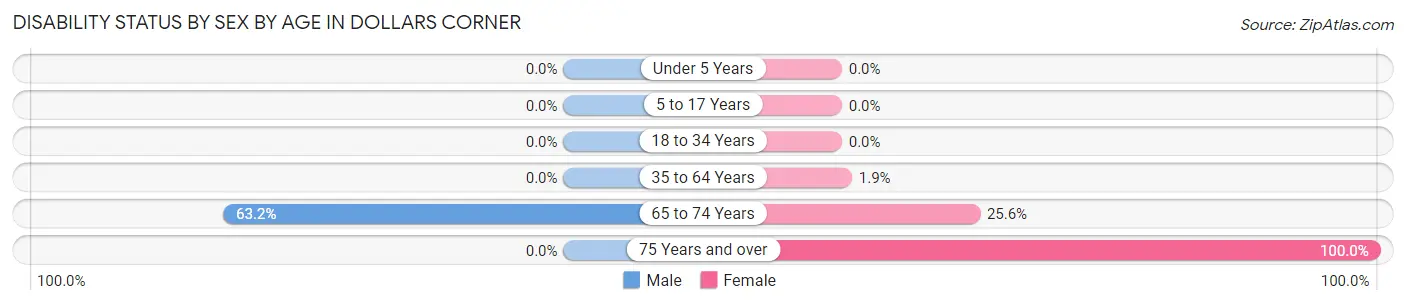
| Age Bracket | Male | Female |
| Under 5 Years | 0 (0.0%) | 0 (0.0%) |
| 5 to 17 Years | 0 (0.0%) | 0 (0.0%) |
| 18 to 34 Years | 0 (0.0%) | 0 (0.0%) |
| 35 to 64 Years | 0 (0.0%) | 4 (1.9%) |
| 65 to 74 Years | 24 (63.2%) | 10 (25.6%) |
| 75 Years and over | 0 (0.0%) | 7 (100.0%) |
Disability Class by Sex by Age in Dollars Corner
Disability Class: Hearing Difficulty
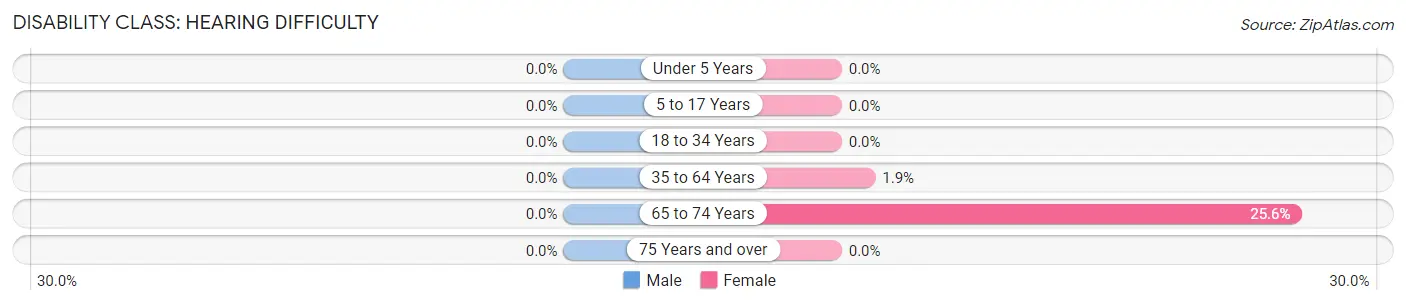
| Age Bracket | Male | Female |
| Under 5 Years | 0 (0.0%) | 0 (0.0%) |
| 5 to 17 Years | 0 (0.0%) | 0 (0.0%) |
| 18 to 34 Years | 0 (0.0%) | 0 (0.0%) |
| 35 to 64 Years | 0 (0.0%) | 4 (1.9%) |
| 65 to 74 Years | 0 (0.0%) | 10 (25.6%) |
| 75 Years and over | 0 (0.0%) | 0 (0.0%) |
Disability Class: Vision Difficulty
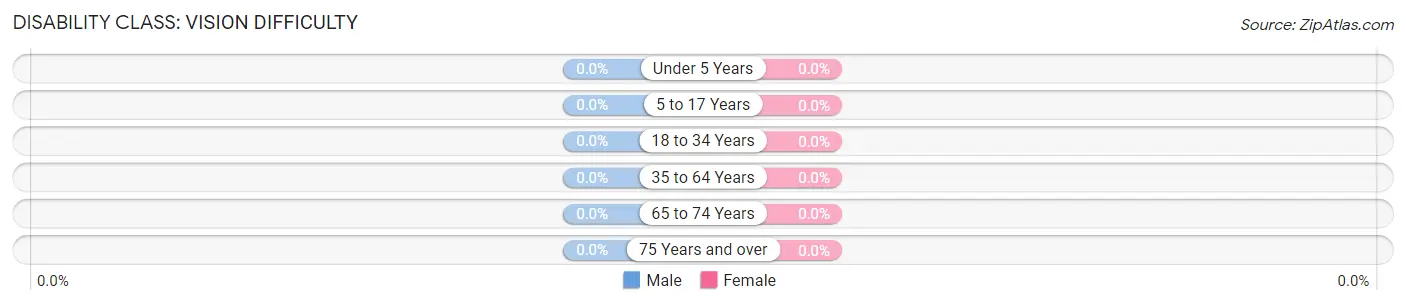
| Age Bracket | Male | Female |
| Under 5 Years | 0 (0.0%) | 0 (0.0%) |
| 5 to 17 Years | 0 (0.0%) | 0 (0.0%) |
| 18 to 34 Years | 0 (0.0%) | 0 (0.0%) |
| 35 to 64 Years | 0 (0.0%) | 0 (0.0%) |
| 65 to 74 Years | 0 (0.0%) | 0 (0.0%) |
| 75 Years and over | 0 (0.0%) | 0 (0.0%) |
Disability Class: Cognitive Difficulty
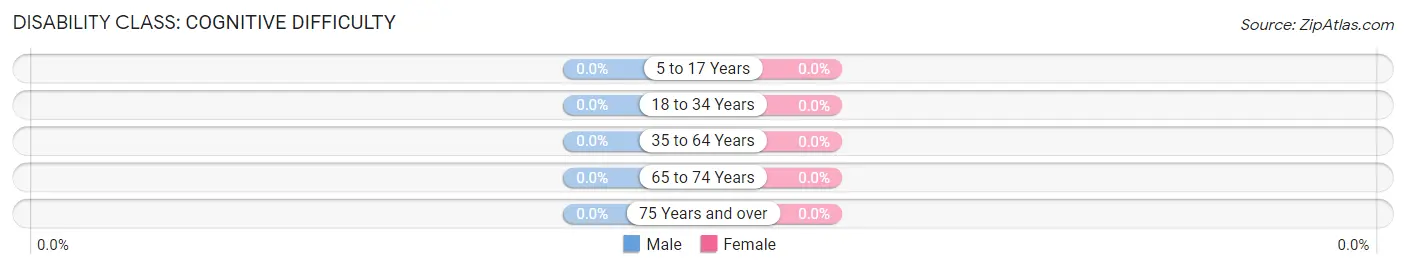
| Age Bracket | Male | Female |
| 5 to 17 Years | 0 (0.0%) | 0 (0.0%) |
| 18 to 34 Years | 0 (0.0%) | 0 (0.0%) |
| 35 to 64 Years | 0 (0.0%) | 0 (0.0%) |
| 65 to 74 Years | 0 (0.0%) | 0 (0.0%) |
| 75 Years and over | 0 (0.0%) | 0 (0.0%) |
Disability Class: Ambulatory Difficulty
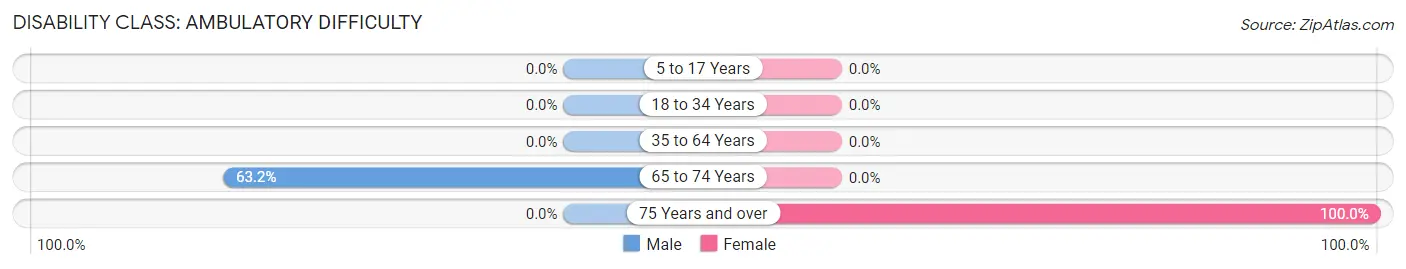
| Age Bracket | Male | Female |
| 5 to 17 Years | 0 (0.0%) | 0 (0.0%) |
| 18 to 34 Years | 0 (0.0%) | 0 (0.0%) |
| 35 to 64 Years | 0 (0.0%) | 0 (0.0%) |
| 65 to 74 Years | 24 (63.2%) | 0 (0.0%) |
| 75 Years and over | 0 (0.0%) | 7 (100.0%) |
Disability Class: Self-Care Difficulty
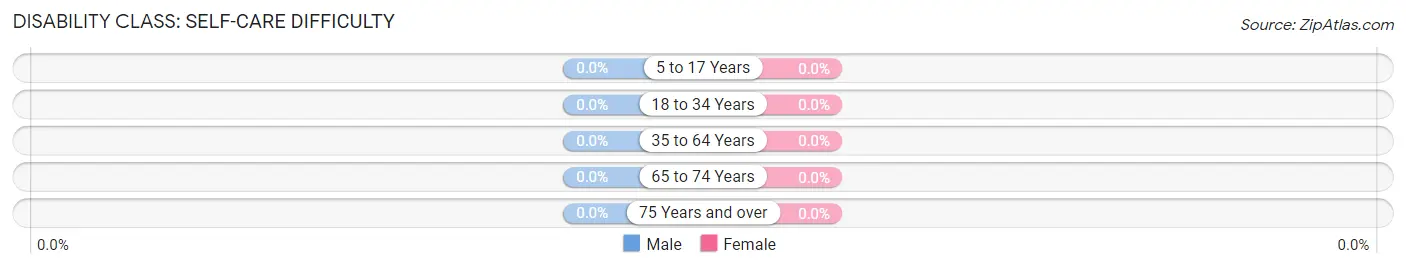
| Age Bracket | Male | Female |
| 5 to 17 Years | 0 (0.0%) | 0 (0.0%) |
| 18 to 34 Years | 0 (0.0%) | 0 (0.0%) |
| 35 to 64 Years | 0 (0.0%) | 0 (0.0%) |
| 65 to 74 Years | 0 (0.0%) | 0 (0.0%) |
| 75 Years and over | 0 (0.0%) | 0 (0.0%) |
Technology Access in Dollars Corner
Computing Device Access in Dollars Corner
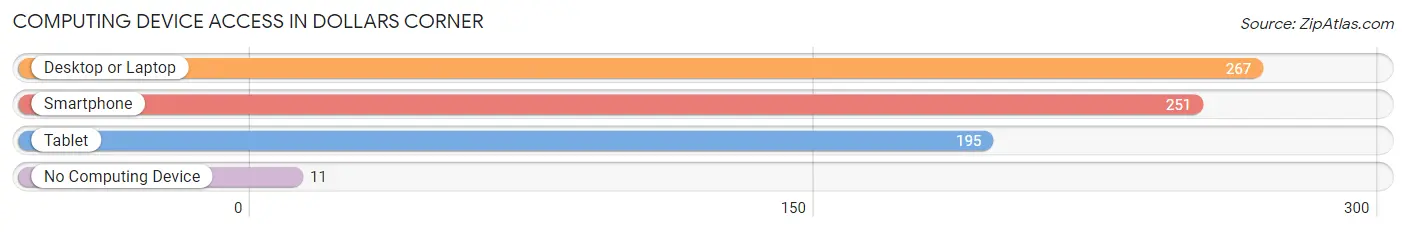
| Device Type | # Households | % Households |
| Desktop or Laptop | 267 | 94.4% |
| Smartphone | 251 | 88.7% |
| Tablet | 195 | 68.9% |
| No Computing Device | 11 | 3.9% |
| Total | 283 | 100.0% |
Internet Access in Dollars Corner
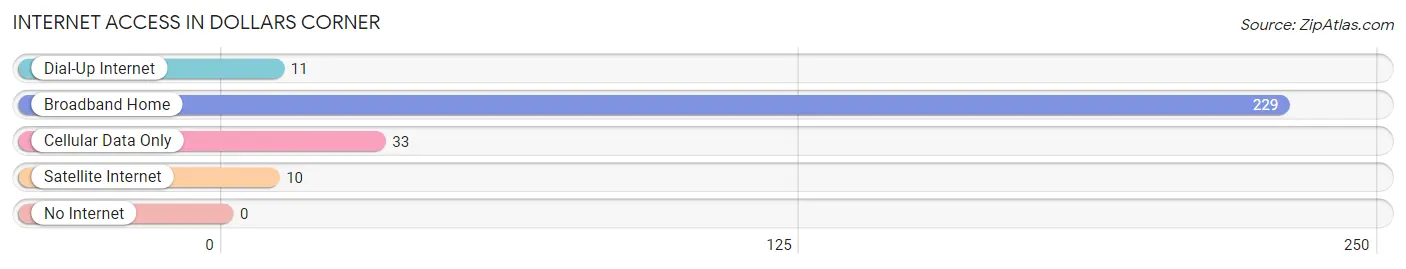
| Internet Type | # Households | % Households |
| Dial-Up Internet | 11 | 3.9% |
| Broadband Home | 229 | 80.9% |
| Cellular Data Only | 33 | 11.7% |
| Satellite Internet | 10 | 3.5% |
| No Internet | 0 | 0.0% |
| Total | 283 | 100.0% |
Dollars Corner Summary
Dollars Corner is a small unincorporated community located in Clark County, Washington, United States. It is situated in the foothills of the Cascade Mountains, approximately 20 miles northeast of Vancouver. The community is named after the Dollar family, who settled in the area in the late 1800s.
History
The area now known as Dollars Corner was first inhabited by the Chinook and Klickitat tribes. The first Euro-American settlers arrived in the area in the late 1800s, and the Dollar family was among the first to settle in the area. The family established a homestead and began farming the land. The community was officially established in the early 1900s, and the Dollar family continued to be a major influence in the area.
In the early 1900s, the area was primarily agricultural, with the Dollar family growing a variety of crops, including wheat, oats, and hay. The family also raised livestock, including cattle, horses, and pigs. In the 1920s, the area began to experience a population boom, as more people moved to the area to take advantage of the fertile land and the abundance of natural resources.
In the 1950s, the area began to experience a shift from an agricultural economy to a more industrial one. The Dollar family sold their land to developers, who built a number of factories and warehouses in the area. This shift in the economy brought more jobs to the area, and the population continued to grow.
Geography
Dollars Corner is located in the foothills of the Cascade Mountains, approximately 20 miles northeast of Vancouver. The area is characterized by rolling hills, dense forests, and numerous creeks and streams. The climate is mild, with temperatures ranging from the mid-30s in the winter to the mid-80s in the summer.
Economy
The economy of Dollars Corner is primarily based on manufacturing and warehousing. The area is home to a number of factories and warehouses, which employ a large number of people. In addition, the area is home to a number of small businesses, including restaurants, retail stores, and service providers.
Demographics
As of the 2010 census, the population of Dollars Corner was 2,845. The population is primarily white (90.3%), with a small percentage of African Americans (2.2%), Asians (2.1%), and Hispanics (2.0%). The median household income is $50,945, and the median age is 37.
Conclusion
Dollars Corner is a small unincorporated community located in Clark County, Washington. The area was first settled by the Dollar family in the late 1800s, and the area has since experienced a shift from an agricultural economy to a more industrial one. The population of Dollars Corner is primarily white, with a median household income of $50,945 and a median age of 37. The area is characterized by rolling hills, dense forests, and numerous creeks and streams. The economy of Dollars Corner is primarily based on manufacturing and warehousing, and the area is home to a number of small businesses.
Common Questions
What is the Total Population of Dollars Corner?
Total Population of Dollars Corner is 824.
What is the Total Male Population of Dollars Corner?
Total Male Population of Dollars Corner is 425.
What is the Total Female Population of Dollars Corner?
Total Female Population of Dollars Corner is 399.
What is the Ratio of Males per 100 Females in Dollars Corner?
There are 106.52 Males per 100 Females in Dollars Corner.
What is the Ratio of Females per 100 Males in Dollars Corner?
There are 93.88 Females per 100 Males in Dollars Corner.
What is the Median Population Age in Dollars Corner?
Median Population Age in Dollars Corner is 37.8 Years.
What is the Average Family Size in Dollars Corner
Average Family Size in Dollars Corner is 3.2 People.
What is the Average Household Size in Dollars Corner
Average Household Size in Dollars Corner is 2.9 People.
What is Per Capita Income in Dollars Corner?
Per Capita income in Dollars Corner is $43,853.
What is the Median Family Income in Dollars Corner?
Median Family Income in Dollars Corner is $114,583.
What is the Median Household income in Dollars Corner?
Median Household Income in Dollars Corner is $113,802.
What is Family Income Deficit in Dollars Corner?
Family Income Deficit in Dollars Corner is $19,440.
Families that are below poverty line in Dollars Corner earn $19,440 less on average than the poverty threshold level.
What is Inequality or Gini Index in Dollars Corner?
Inequality or Gini Index in Dollars Corner is 0.40.
How Large is the Labor Force in Dollars Corner?
There are 523 People in the Labor Forcein in Dollars Corner.
What is the Percentage of People in the Labor Force in Dollars Corner?
73.6% of People are in the Labor Force in Dollars Corner.
What is the Unemployment Rate in Dollars Corner?
Unemployment Rate in Dollars Corner is 0.8%.