Ryderwood, WA
Ryderwood Map
Ryderwood Overview
425
TOTAL POPULATION
175
MALE POPULATION
250
FEMALE POPULATION
70.00
MALES / 100 FEMALES
142.86
FEMALES / 100 MALES
72.2
MEDIAN AGE
2.1
AVG FAMILY SIZE
1.7
AVG HOUSEHOLD SIZE
$30,694
PER CAPITA INCOME
$64,250
AVG FAMILY INCOME
$41,250
AVG HOUSEHOLD INCOME
88.3%
WAGE / INCOME GAP [ % ]
11.7¢/ $1
WAGE / INCOME GAP [ $ ]
0.33
INEQUALITY / GINI INDEX
59
LABOR FORCE [ PEOPLE ]
13.9%
PERCENT IN LABOR FORCE
Ryderwood Zip Codes
Ryderwood Area Codes
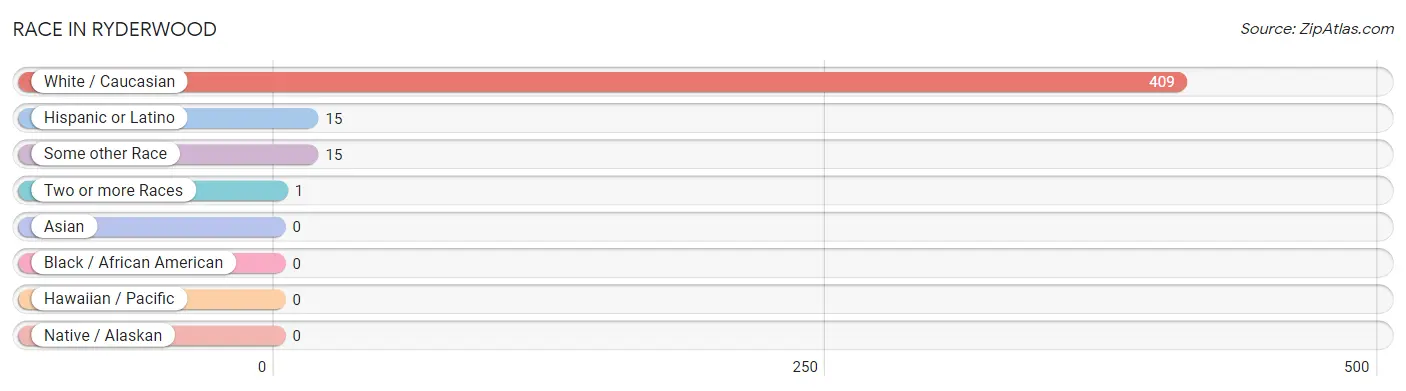
Race in Ryderwood
The most populous races in Ryderwood are White / Caucasian (409 | 96.2%), Hispanic or Latino (15 | 3.5%), and Some other Race (15 | 3.5%).
| Race | # Population | % Population |
| Asian | 0 | 0.0% |
| Black / African American | 0 | 0.0% |
| Hawaiian / Pacific | 0 | 0.0% |
| Hispanic or Latino | 15 | 3.5% |
| Native / Alaskan | 0 | 0.0% |
| White / Caucasian | 409 | 96.2% |
| Two or more Races | 1 | 0.2% |
| Some other Race | 15 | 3.5% |
| Total | 425 | 100.0% |
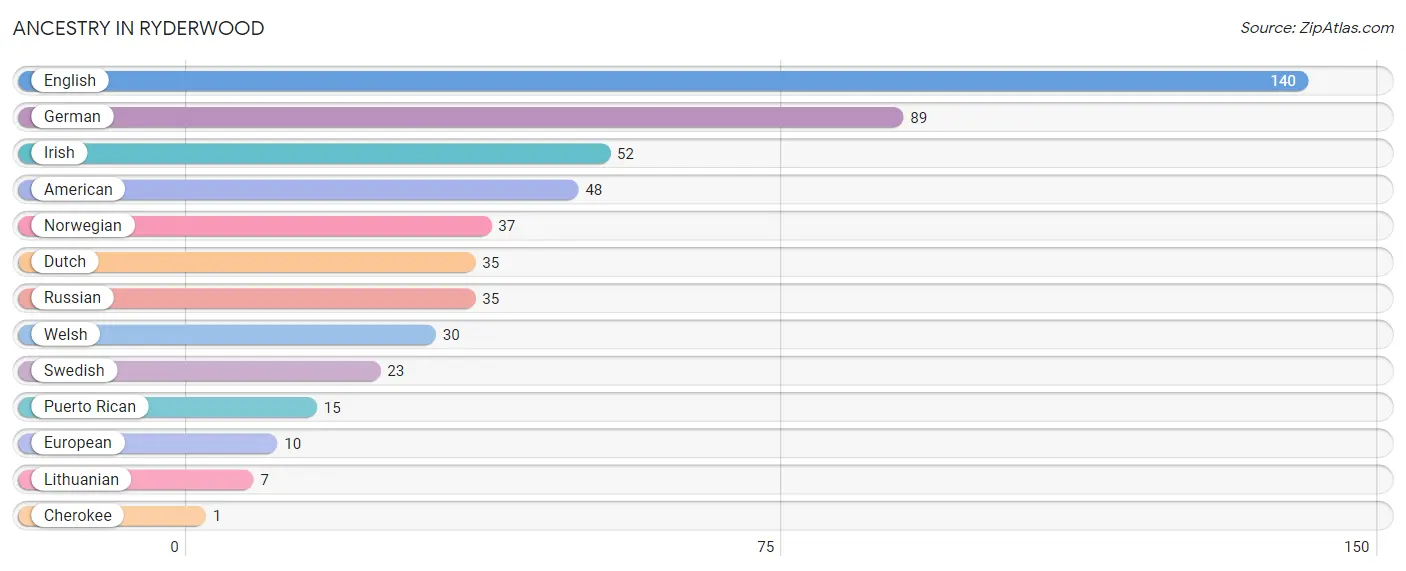
Ancestry in Ryderwood
The most populous ancestries reported in Ryderwood are English (140 | 32.9%), German (89 | 20.9%), Irish (52 | 12.2%), American (48 | 11.3%), and Norwegian (37 | 8.7%), together accounting for 86.1% of all Ryderwood residents.
| Ancestry | # Population | % Population |
| American | 48 | 11.3% |
| Cherokee | 1 | 0.2% |
| Dutch | 35 | 8.2% |
| English | 140 | 32.9% |
| European | 10 | 2.4% |
| German | 89 | 20.9% |
| Irish | 52 | 12.2% |
| Lithuanian | 7 | 1.7% |
| Norwegian | 37 | 8.7% |
| Puerto Rican | 15 | 3.5% |
| Russian | 35 | 8.2% |
| Swedish | 23 | 5.4% |
| Welsh | 30 | 7.1% | View All 13 Rows |
Immigrants in Ryderwood

| Immigration Origin | # Population | % Population | View All 0 Rows |
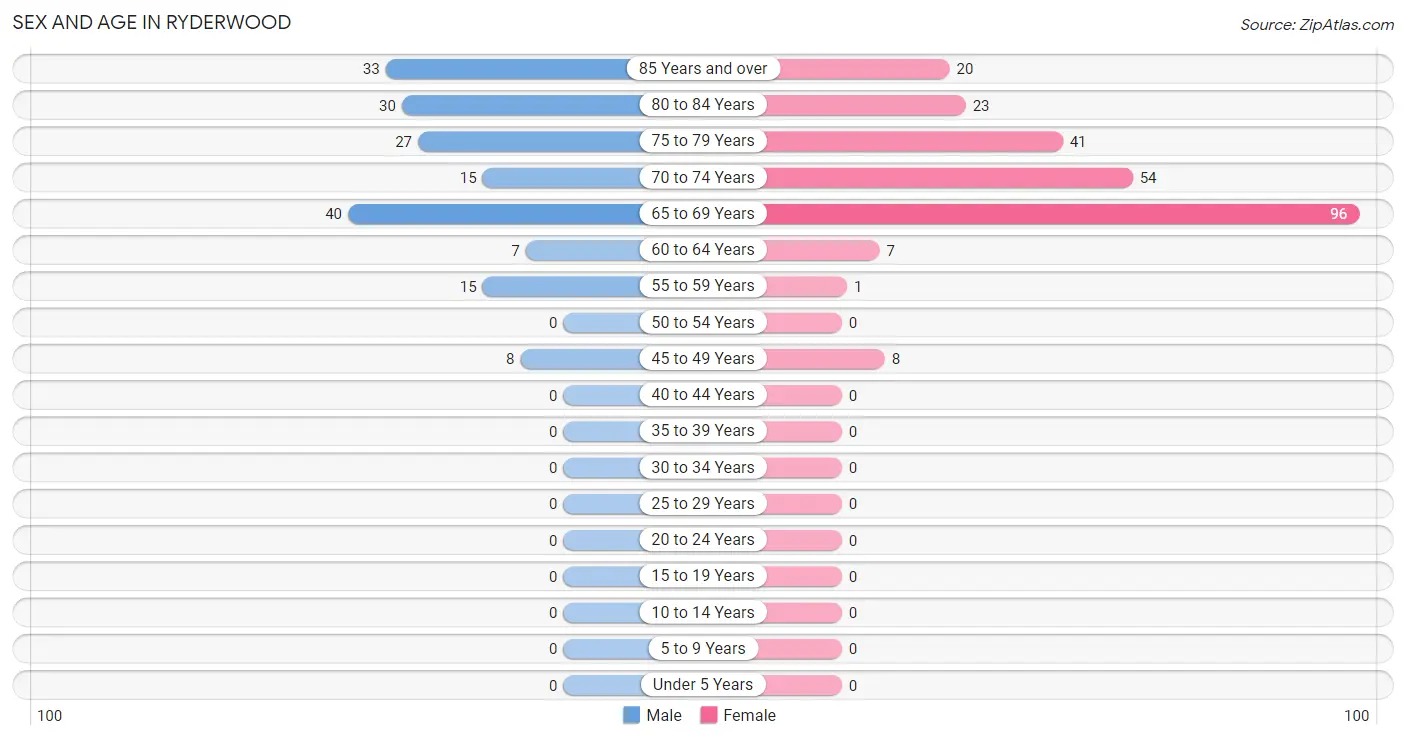
Sex and Age in Ryderwood
Sex and Age in Ryderwood
The most populous age groups in Ryderwood are 65 to 69 Years (40 | 22.9%) for men and 65 to 69 Years (96 | 38.4%) for women.
| Age Bracket | Male | Female |
| Under 5 Years | 0 (0.0%) | 0 (0.0%) |
| 5 to 9 Years | 0 (0.0%) | 0 (0.0%) |
| 10 to 14 Years | 0 (0.0%) | 0 (0.0%) |
| 15 to 19 Years | 0 (0.0%) | 0 (0.0%) |
| 20 to 24 Years | 0 (0.0%) | 0 (0.0%) |
| 25 to 29 Years | 0 (0.0%) | 0 (0.0%) |
| 30 to 34 Years | 0 (0.0%) | 0 (0.0%) |
| 35 to 39 Years | 0 (0.0%) | 0 (0.0%) |
| 40 to 44 Years | 0 (0.0%) | 0 (0.0%) |
| 45 to 49 Years | 8 (4.6%) | 8 (3.2%) |
| 50 to 54 Years | 0 (0.0%) | 0 (0.0%) |
| 55 to 59 Years | 15 (8.6%) | 1 (0.4%) |
| 60 to 64 Years | 7 (4.0%) | 7 (2.8%) |
| 65 to 69 Years | 40 (22.9%) | 96 (38.4%) |
| 70 to 74 Years | 15 (8.6%) | 54 (21.6%) |
| 75 to 79 Years | 27 (15.4%) | 41 (16.4%) |
| 80 to 84 Years | 30 (17.1%) | 23 (9.2%) |
| 85 Years and over | 33 (18.9%) | 20 (8.0%) |
| Total | 175 (100.0%) | 250 (100.0%) |
Families and Households in Ryderwood
Median Family Size in Ryderwood
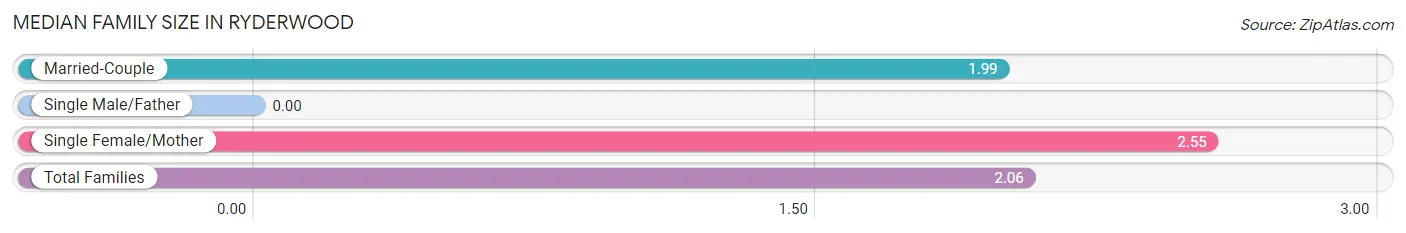
| Family Type | # Families | Family Size |
| Married-Couple | 144 (87.8%) | 1.99 |
| Single Male/Father | 0 (0.0%) | - |
| Single Female/Mother | 20 (12.2%) | 2.55 |
| Total Families | 164 (100.0%) | 2.06 |
Median Household Size in Ryderwood
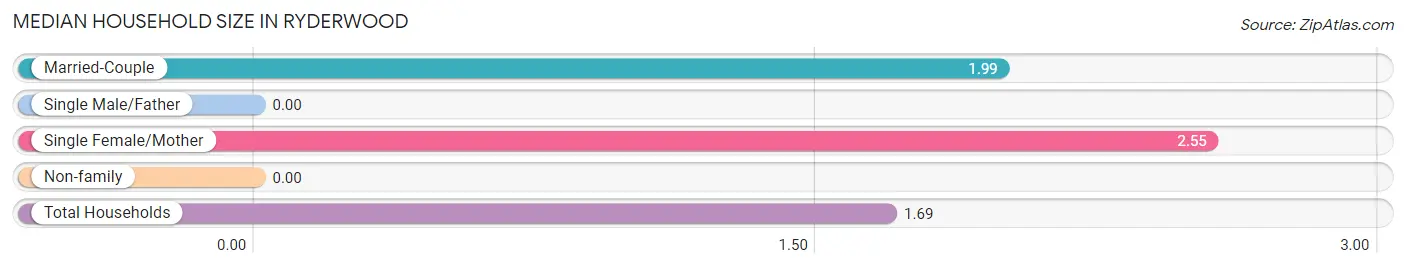
| Household Type | # Households | Household Size |
| Married-Couple | 144 (57.4%) | 1.99 |
| Single Male/Father | 0 (0.0%) | - |
| Single Female/Mother | 20 (8.0%) | 2.55 |
| Non-family | 87 (34.7%) | - |
| Total Households | 251 (100.0%) | 1.69 |
Household Size by Marriage Status in Ryderwood
Out of a total of 251 households in Ryderwood, 164 (65.3%) are family households, while 87 (34.7%) are nonfamily households. The most numerous type of family households are 2-person households, comprising 156, and the most common type of nonfamily households are 1-person households, comprising 87.
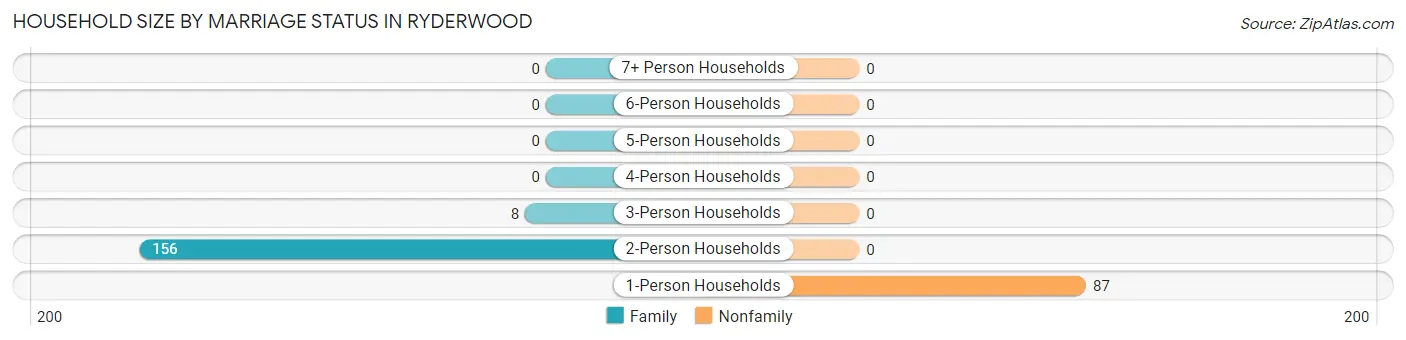
| Household Size | Family Households | Nonfamily Households |
| 1-Person Households | - | 87 (34.7%) |
| 2-Person Households | 156 (62.2%) | 0 (0.0%) |
| 3-Person Households | 8 (3.2%) | 0 (0.0%) |
| 4-Person Households | 0 (0.0%) | 0 (0.0%) |
| 5-Person Households | 0 (0.0%) | 0 (0.0%) |
| 6-Person Households | 0 (0.0%) | 0 (0.0%) |
| 7+ Person Households | 0 (0.0%) | 0 (0.0%) |
| Total | 164 (65.3%) | 87 (34.7%) |
Female Fertility in Ryderwood
Fertility by Age in Ryderwood
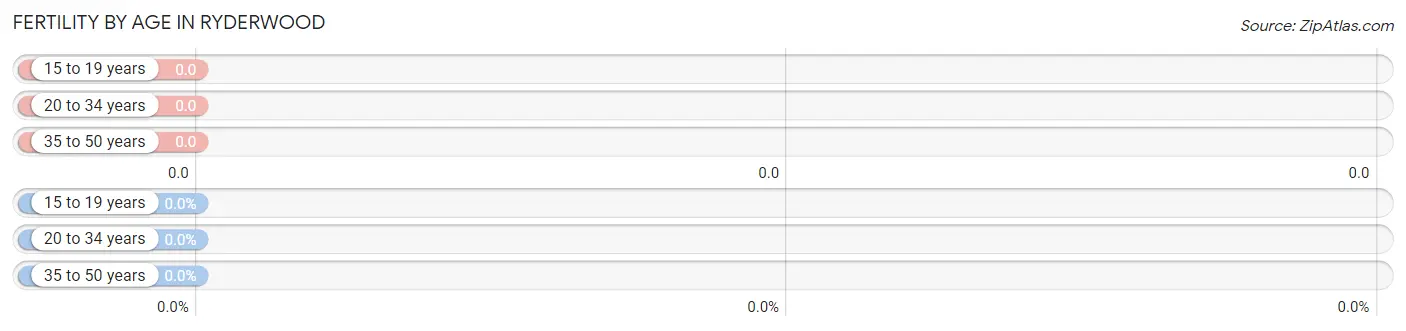
| Age Bracket | Women with Births | Births / 1,000 Women |
| 15 to 19 years | 0 (0.0%) | 0.0 |
| 20 to 34 years | 0 (0.0%) | 0.0 |
| 35 to 50 years | 0 (0.0%) | 0.0 |
| Total | 0 (0.0%) | 0.0 |
Fertility by Age by Marriage Status in Ryderwood
| Age Bracket | Married | Unmarried |
| 15 to 19 years | 0 (0.0%) | 0 (0.0%) |
| 20 to 34 years | 0 (0.0%) | 0 (0.0%) |
| 35 to 50 years | 0 (0.0%) | 0 (0.0%) |
| Total | 0 (0.0%) | 0 (0.0%) |
Fertility by Education in Ryderwood
| Educational Attainment | Women with Births | Births / 1,000 Women |
| Less than High School | 0 (0.0%) | 0.0 |
| High School Diploma | 0 (0.0%) | 0.0 |
| College or Associate's Degree | 0 (0.0%) | 0.0 |
| Bachelor's Degree | 0 (0.0%) | 0.0 |
| Graduate Degree | 0 (0.0%) | 0.0 |
| Total | 0 (0.0%) | 0.0 |
Fertility by Education by Marriage Status in Ryderwood
| Educational Attainment | Married | Unmarried |
| Less than High School | 0 (0.0%) | 0 (0.0%) |
| High School Diploma | 0 (0.0%) | 0 (0.0%) |
| College or Associate's Degree | 0 (0.0%) | 0 (0.0%) |
| Bachelor's Degree | 0 (0.0%) | 0 (0.0%) |
| Graduate Degree | 0 (0.0%) | 0 (0.0%) |
| Total | 0 (0.0%) | 0 (0.0%) |
Income in Ryderwood
Income Overview in Ryderwood
Per Capita Income in Ryderwood is $30,694, while median incomes of families and households are $64,250 and $41,250 respectively.
| Characteristic | Number | Measure |
| Per Capita Income | 425 | $30,694 |
| Median Family Income | 164 | $64,250 |
| Mean Family Income | 164 | $65,037 |
| Median Household Income | 251 | $41,250 |
| Mean Household Income | 251 | $51,400 |
| Income Deficit | 164 | $0 |
| Wage / Income Gap (%) | 425 | 88.32% |
| Wage / Income Gap ($) | 425 | 11.68¢ per $1 |
| Gini / Inequality Index | 425 | 0.33 |
Earnings by Sex in Ryderwood
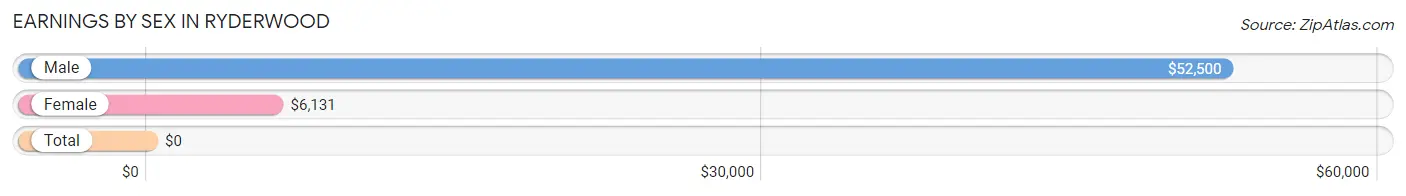
| Sex | Number | Average Earnings |
| Male | 30 (44.8%) | $52,500 |
| Female | 37 (55.2%) | $6,131 |
| Total | 67 (100.0%) | $0 |
Earnings by Sex by Income Bracket in Ryderwood
The most common earnings brackets in Ryderwood are $50,000 to $54,999 for men (23 | 76.7%) and $5,000 to $7,499 for women (21 | 56.8%).
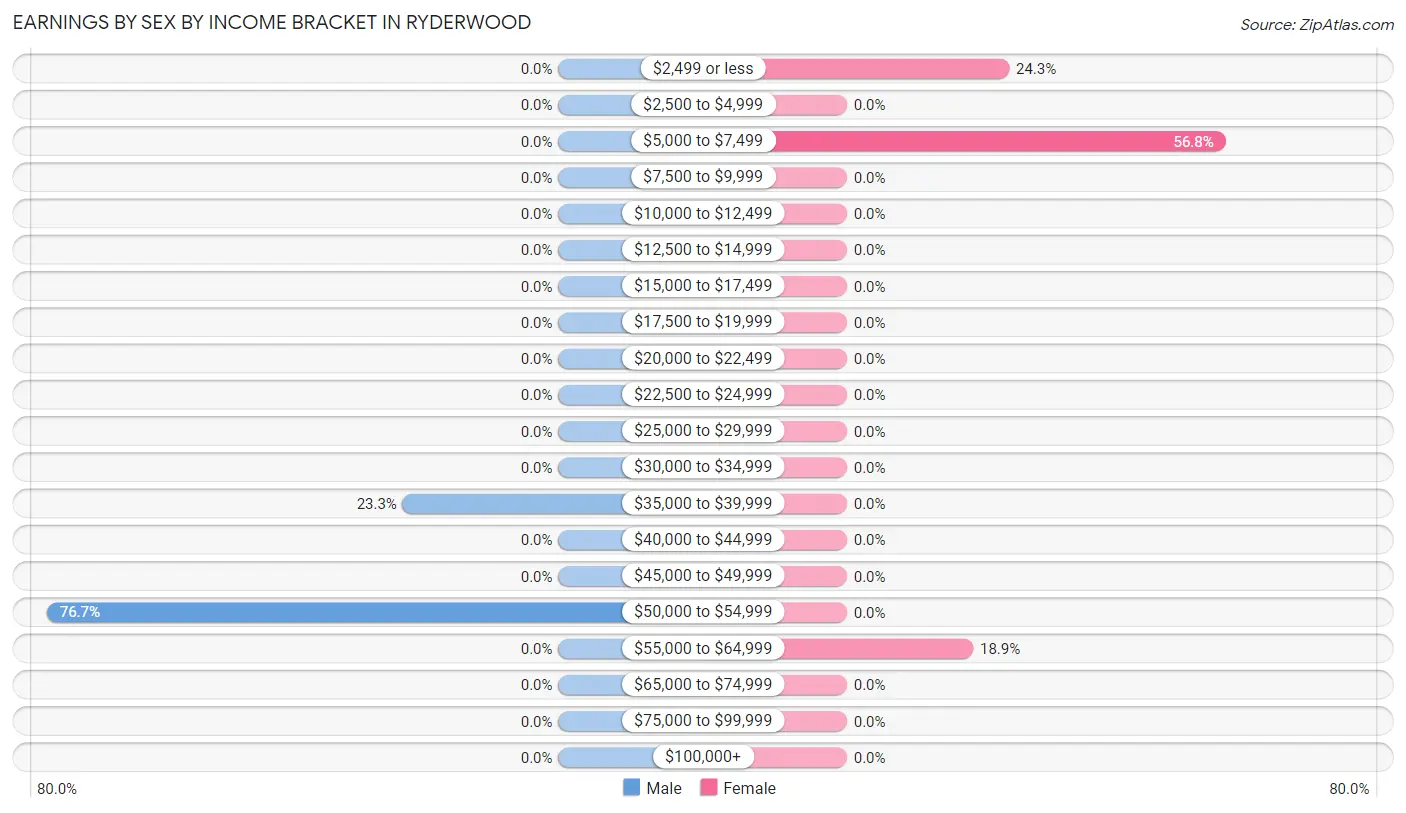
| Income | Male | Female |
| $2,499 or less | 0 (0.0%) | 9 (24.3%) |
| $2,500 to $4,999 | 0 (0.0%) | 0 (0.0%) |
| $5,000 to $7,499 | 0 (0.0%) | 21 (56.8%) |
| $7,500 to $9,999 | 0 (0.0%) | 0 (0.0%) |
| $10,000 to $12,499 | 0 (0.0%) | 0 (0.0%) |
| $12,500 to $14,999 | 0 (0.0%) | 0 (0.0%) |
| $15,000 to $17,499 | 0 (0.0%) | 0 (0.0%) |
| $17,500 to $19,999 | 0 (0.0%) | 0 (0.0%) |
| $20,000 to $22,499 | 0 (0.0%) | 0 (0.0%) |
| $22,500 to $24,999 | 0 (0.0%) | 0 (0.0%) |
| $25,000 to $29,999 | 0 (0.0%) | 0 (0.0%) |
| $30,000 to $34,999 | 0 (0.0%) | 0 (0.0%) |
| $35,000 to $39,999 | 7 (23.3%) | 0 (0.0%) |
| $40,000 to $44,999 | 0 (0.0%) | 0 (0.0%) |
| $45,000 to $49,999 | 0 (0.0%) | 0 (0.0%) |
| $50,000 to $54,999 | 23 (76.7%) | 0 (0.0%) |
| $55,000 to $64,999 | 0 (0.0%) | 7 (18.9%) |
| $65,000 to $74,999 | 0 (0.0%) | 0 (0.0%) |
| $75,000 to $99,999 | 0 (0.0%) | 0 (0.0%) |
| $100,000+ | 0 (0.0%) | 0 (0.0%) |
| Total | 30 (100.0%) | 37 (100.0%) |
Earnings by Sex by Educational Attainment in Ryderwood
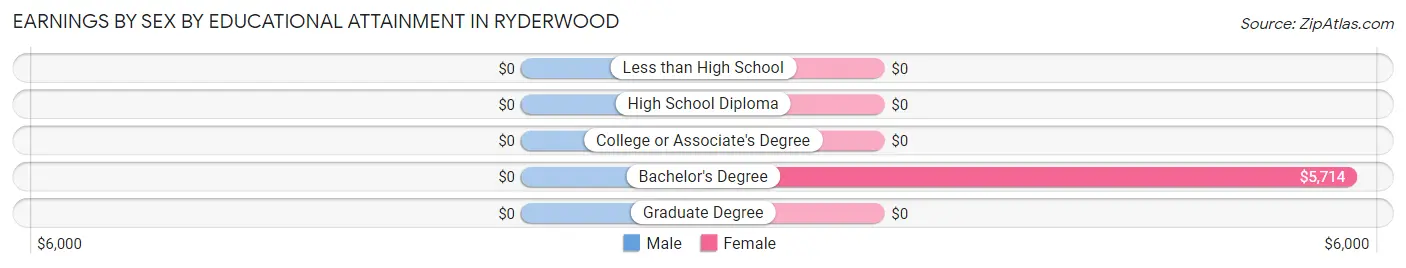
| Educational Attainment | Male Income | Female Income |
| Less than High School | - | - |
| High School Diploma | - | - |
| College or Associate's Degree | - | - |
| Bachelor's Degree | - | - |
| Graduate Degree | - | - |
| Total | $52,500 | $6,131 |
Family Income in Ryderwood
Family Income Brackets in Ryderwood
According to the Ryderwood family income data, there are 64 families falling into the $75,000 to $99,999 income range, which is the most common income bracket and makes up 39.0% of all families.
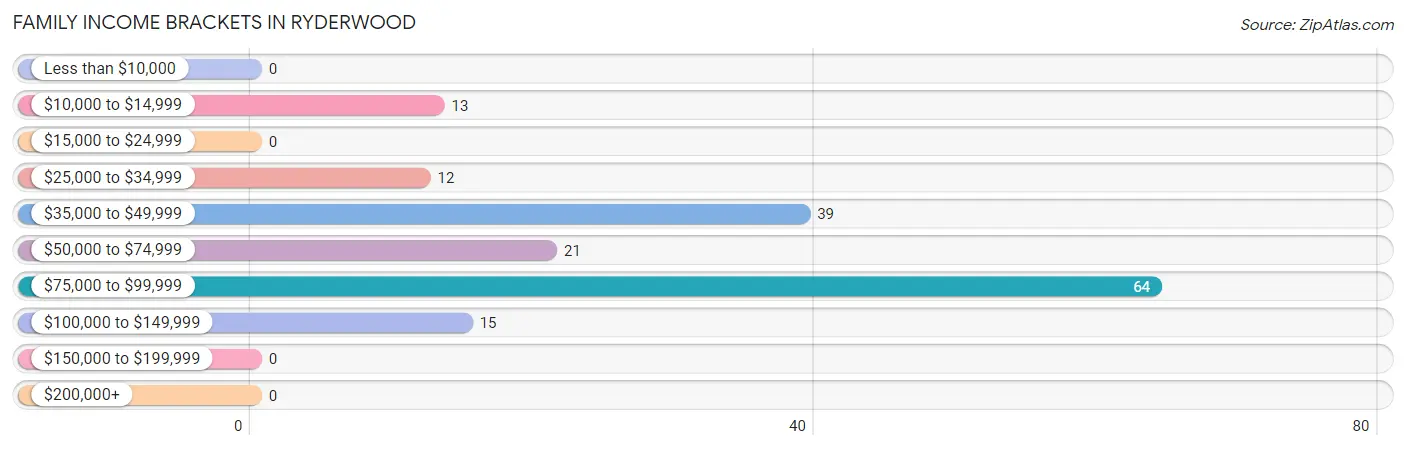
| Income Bracket | # Families | % Families |
| Less than $10,000 | 0 | 0.0% |
| $10,000 to $14,999 | 13 | 7.9% |
| $15,000 to $24,999 | 0 | 0.0% |
| $25,000 to $34,999 | 12 | 7.3% |
| $35,000 to $49,999 | 39 | 23.8% |
| $50,000 to $74,999 | 21 | 12.8% |
| $75,000 to $99,999 | 64 | 39.0% |
| $100,000 to $149,999 | 15 | 9.1% |
| $150,000 to $199,999 | 0 | 0.0% |
| $200,000+ | 0 | 0.0% |
Family Income by Famaliy Size in Ryderwood
2-person families (156 | 95.1%) account for the highest median family income in Ryderwood with $63,250 per family, while 2-person families (156 | 95.1%) have the highest median income of $31,625 per family member.
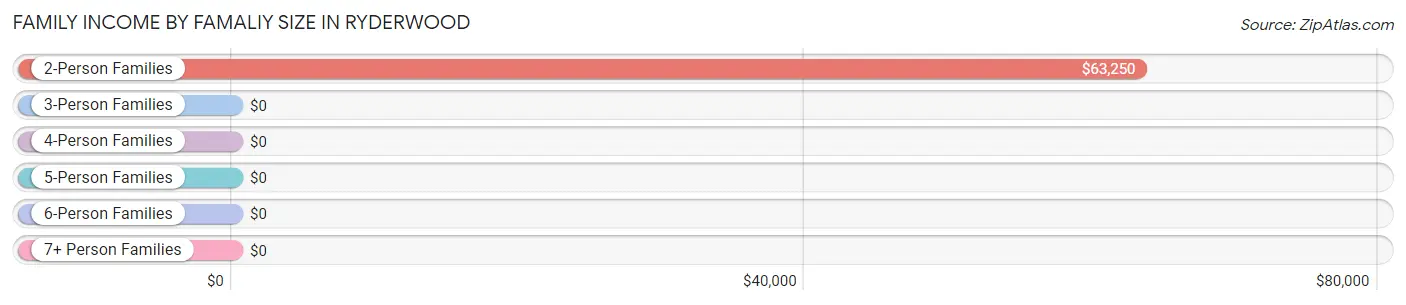
| Income Bracket | # Families | Median Income |
| 2-Person Families | 156 (95.1%) | $63,250 |
| 3-Person Families | 8 (4.9%) | $0 |
| 4-Person Families | 0 (0.0%) | $0 |
| 5-Person Families | 0 (0.0%) | $0 |
| 6-Person Families | 0 (0.0%) | $0 |
| 7+ Person Families | 0 (0.0%) | $0 |
| Total | 164 (100.0%) | $64,250 |
Family Income by Number of Earners in Ryderwood
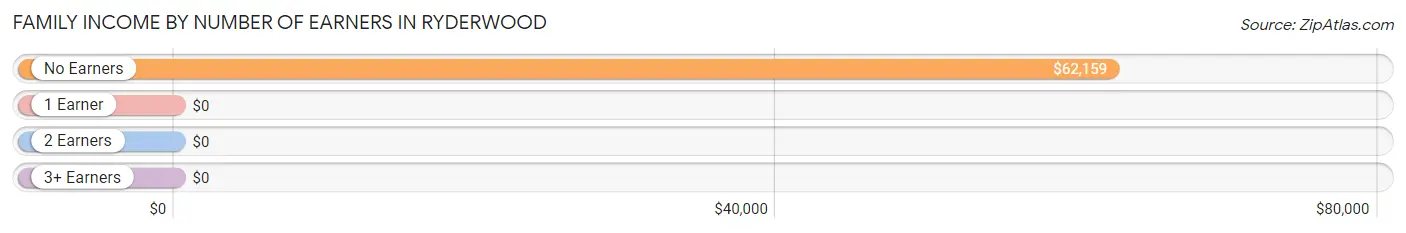
| Number of Earners | # Families | Median Income |
| No Earners | 121 (73.8%) | $62,159 |
| 1 Earner | 28 (17.1%) | $0 |
| 2 Earners | 15 (9.1%) | $0 |
| 3+ Earners | 0 (0.0%) | $0 |
| Total | 164 (100.0%) | $64,250 |
Household Income in Ryderwood
Household Income Brackets in Ryderwood
With 64 households falling in the category, the $75,000 to $99,999 income range is the most frequent in Ryderwood, accounting for 25.5% of all households.
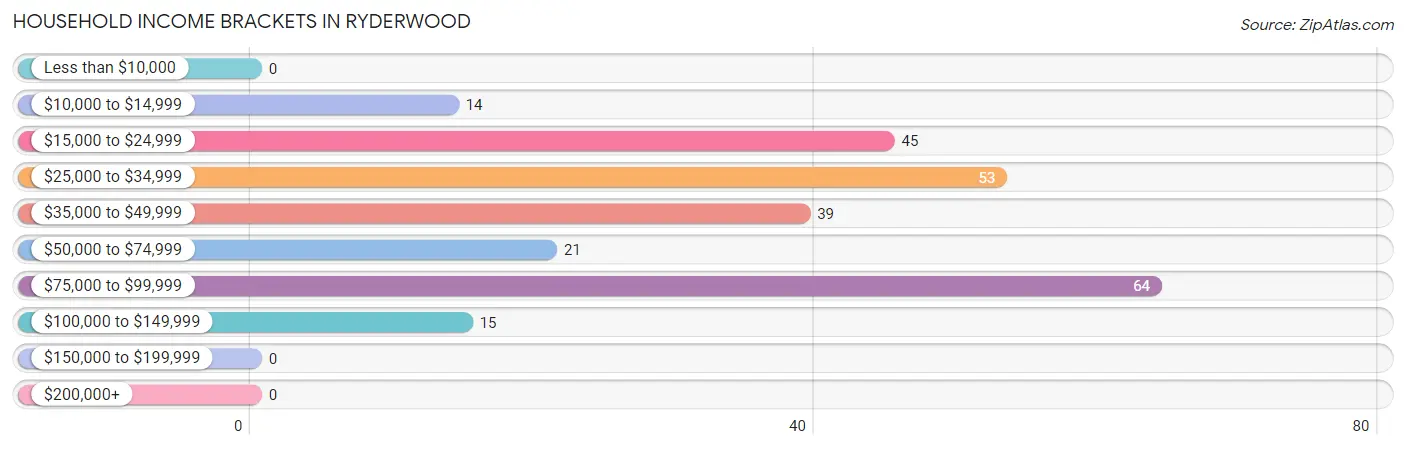
| Income Bracket | # Households | % Households |
| Less than $10,000 | 0 | 0.0% |
| $10,000 to $14,999 | 14 | 5.6% |
| $15,000 to $24,999 | 45 | 17.9% |
| $25,000 to $34,999 | 53 | 21.1% |
| $35,000 to $49,999 | 39 | 15.5% |
| $50,000 to $74,999 | 21 | 8.4% |
| $75,000 to $99,999 | 64 | 25.5% |
| $100,000 to $149,999 | 15 | 6.0% |
| $150,000 to $199,999 | 0 | 0.0% |
| $200,000+ | 0 | 0.0% |
Household Income by Householder Age in Ryderwood
The median household income in Ryderwood is $41,250, with the highest median household income of $40,972 found in the 65+ years age bracket for the primary householder. A total of 243 households (96.8%) fall into this category.
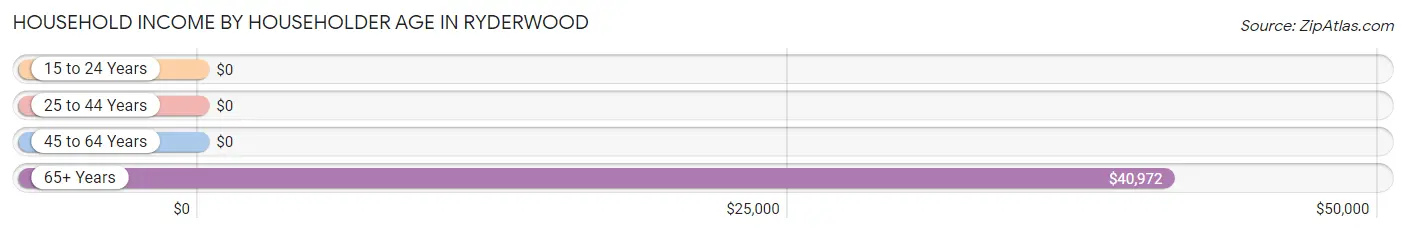
| Income Bracket | # Households | Median Income |
| 15 to 24 Years | 0 (0.0%) | $0 |
| 25 to 44 Years | 0 (0.0%) | $0 |
| 45 to 64 Years | 8 (3.2%) | $0 |
| 65+ Years | 243 (96.8%) | $40,972 |
| Total | 251 (100.0%) | $41,250 |
Poverty in Ryderwood
Income Below Poverty by Sex and Age in Ryderwood
With 7.4% poverty level for males and 5.6% for females among the residents of Ryderwood, 75 year old and over males and 55 to 64 year old females are the most vulnerable to poverty, with 13 males (14.4%) and 1 females (12.5%) in their respective age groups living below the poverty level.
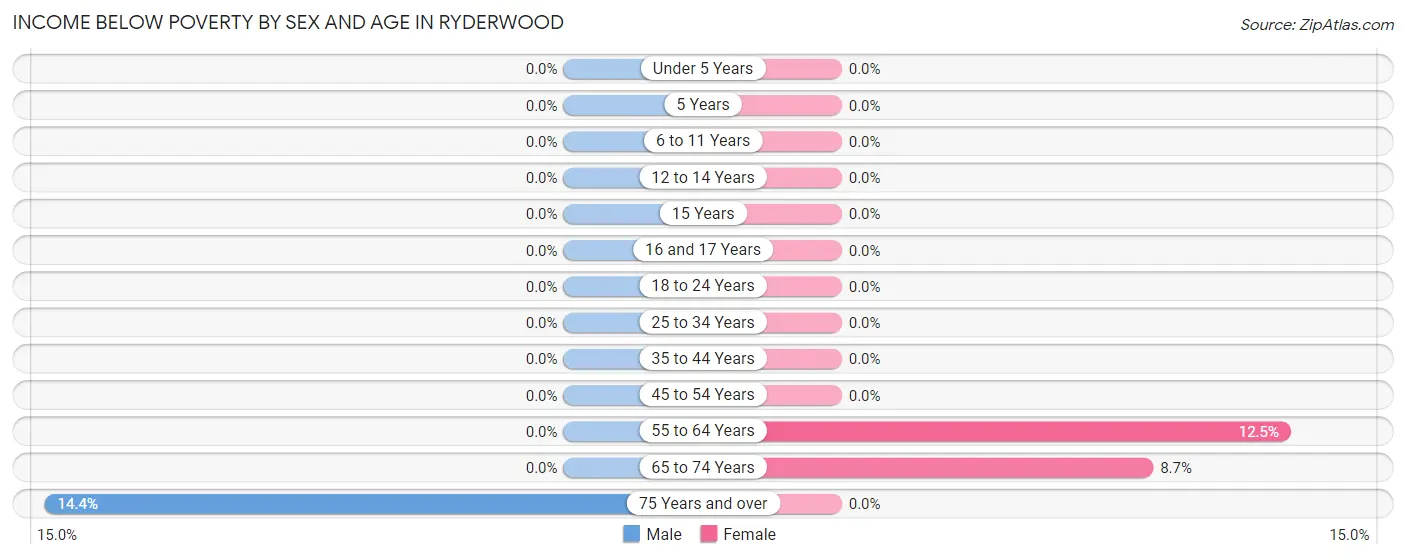
| Age Bracket | Male | Female |
| Under 5 Years | 0 (0.0%) | 0 (0.0%) |
| 5 Years | 0 (0.0%) | 0 (0.0%) |
| 6 to 11 Years | 0 (0.0%) | 0 (0.0%) |
| 12 to 14 Years | 0 (0.0%) | 0 (0.0%) |
| 15 Years | 0 (0.0%) | 0 (0.0%) |
| 16 and 17 Years | 0 (0.0%) | 0 (0.0%) |
| 18 to 24 Years | 0 (0.0%) | 0 (0.0%) |
| 25 to 34 Years | 0 (0.0%) | 0 (0.0%) |
| 35 to 44 Years | 0 (0.0%) | 0 (0.0%) |
| 45 to 54 Years | 0 (0.0%) | 0 (0.0%) |
| 55 to 64 Years | 0 (0.0%) | 1 (12.5%) |
| 65 to 74 Years | 0 (0.0%) | 13 (8.7%) |
| 75 Years and over | 13 (14.4%) | 0 (0.0%) |
| Total | 13 (7.4%) | 14 (5.6%) |
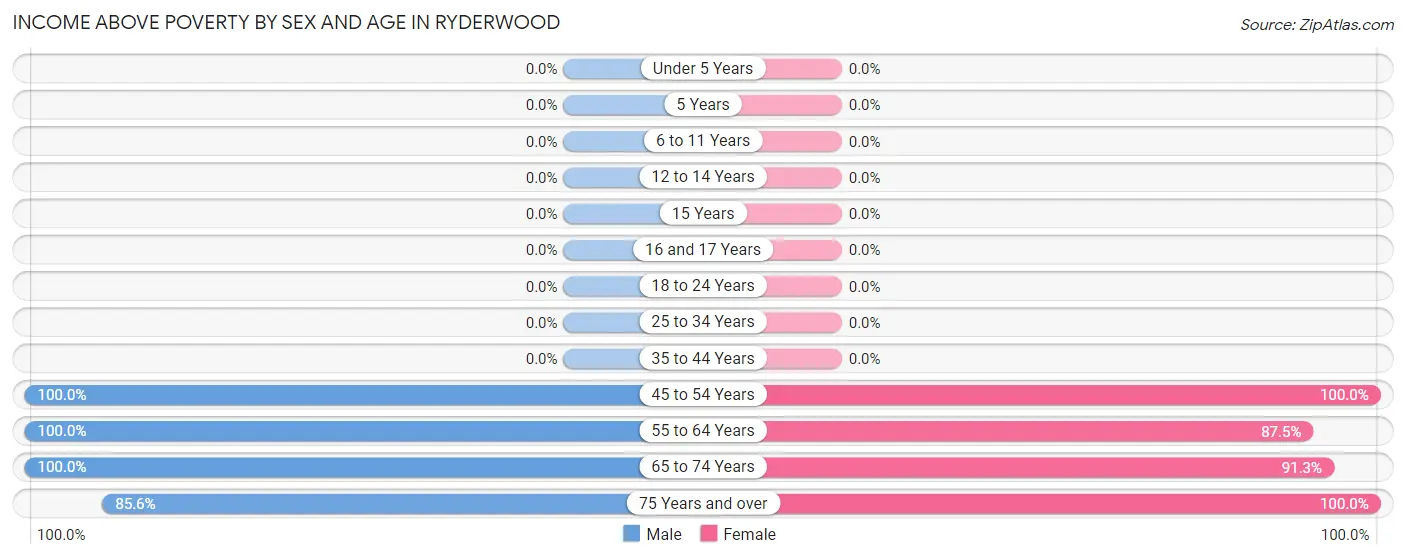
Income Above Poverty by Sex and Age in Ryderwood
According to the poverty statistics in Ryderwood, males aged 45 to 54 years and females aged 45 to 54 years are the age groups that are most secure financially, with 100.0% of males and 100.0% of females in these age groups living above the poverty line.
| Age Bracket | Male | Female |
| Under 5 Years | 0 (0.0%) | 0 (0.0%) |
| 5 Years | 0 (0.0%) | 0 (0.0%) |
| 6 to 11 Years | 0 (0.0%) | 0 (0.0%) |
| 12 to 14 Years | 0 (0.0%) | 0 (0.0%) |
| 15 Years | 0 (0.0%) | 0 (0.0%) |
| 16 and 17 Years | 0 (0.0%) | 0 (0.0%) |
| 18 to 24 Years | 0 (0.0%) | 0 (0.0%) |
| 25 to 34 Years | 0 (0.0%) | 0 (0.0%) |
| 35 to 44 Years | 0 (0.0%) | 0 (0.0%) |
| 45 to 54 Years | 8 (100.0%) | 8 (100.0%) |
| 55 to 64 Years | 22 (100.0%) | 7 (87.5%) |
| 65 to 74 Years | 55 (100.0%) | 137 (91.3%) |
| 75 Years and over | 77 (85.6%) | 84 (100.0%) |
| Total | 162 (92.6%) | 236 (94.4%) |
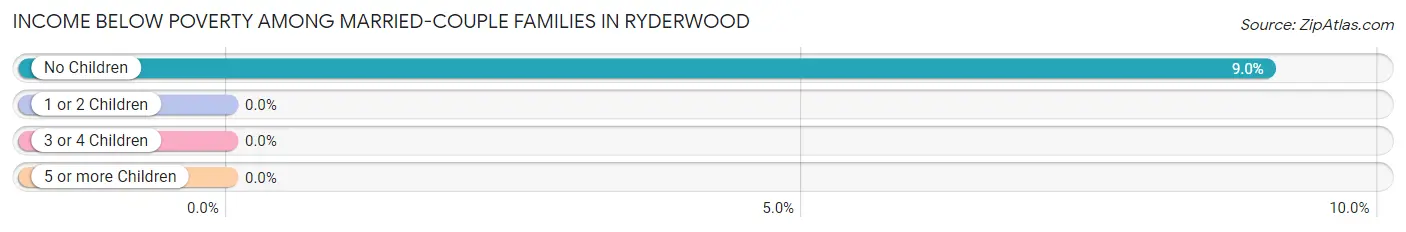
Income Below Poverty Among Married-Couple Families in Ryderwood
The poverty statistics for married-couple families in Ryderwood show that 9.0% or 13 of the total 144 families live below the poverty line. Families with no children have the highest poverty rate of 9.0%, comprising of 13 families. On the other hand, families with no children have the lowest poverty rate of 9.0%, which includes 13 families.
| Children | Above Poverty | Below Poverty |
| No Children | 131 (91.0%) | 13 (9.0%) |
| 1 or 2 Children | 0 (0.0%) | 0 (0.0%) |
| 3 or 4 Children | 0 (0.0%) | 0 (0.0%) |
| 5 or more Children | 0 (0.0%) | 0 (0.0%) |
| Total | 131 (91.0%) | 13 (9.0%) |
Income Below Poverty Among Single-Parent Households in Ryderwood
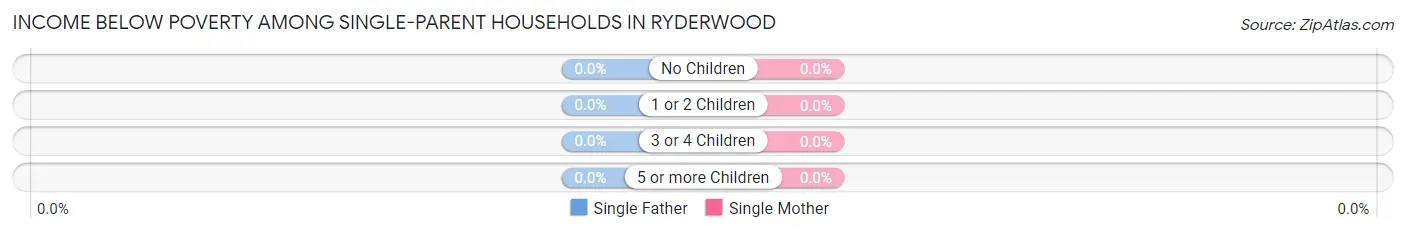
| Children | Single Father | Single Mother |
| No Children | 0 (0.0%) | 0 (0.0%) |
| 1 or 2 Children | 0 (0.0%) | 0 (0.0%) |
| 3 or 4 Children | 0 (0.0%) | 0 (0.0%) |
| 5 or more Children | 0 (0.0%) | 0 (0.0%) |
| Total | 0 (0.0%) | 0 (0.0%) |
Income Below Poverty Among Married-Couple vs Single-Parent Households in Ryderwood
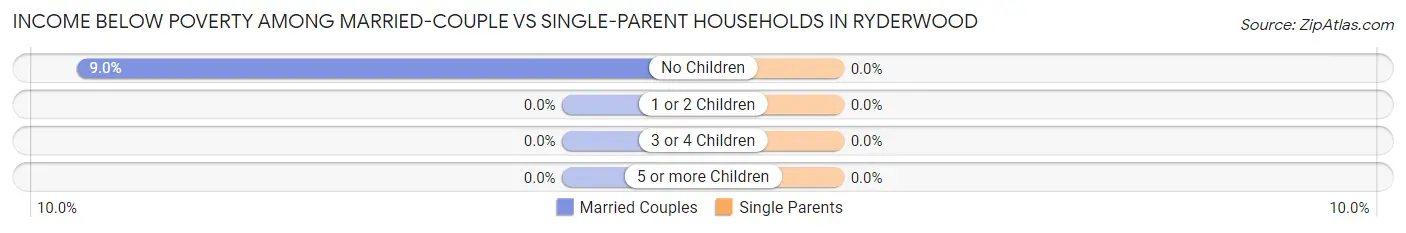
| Children | Married-Couple Families | Single-Parent Households |
| No Children | 13 (9.0%) | 0 (0.0%) |
| 1 or 2 Children | 0 (0.0%) | 0 (0.0%) |
| 3 or 4 Children | 0 (0.0%) | 0 (0.0%) |
| 5 or more Children | 0 (0.0%) | 0 (0.0%) |
| Total | 13 (9.0%) | 0 (0.0%) |
Employment Characteristics in Ryderwood
Employment by Class of Employer in Ryderwood
Among the 59 employed individuals in Ryderwood, private company employees (52 | 88.1%), and self-employed (not incorporated) (7 | 11.9%) make up the most common classes of employment.
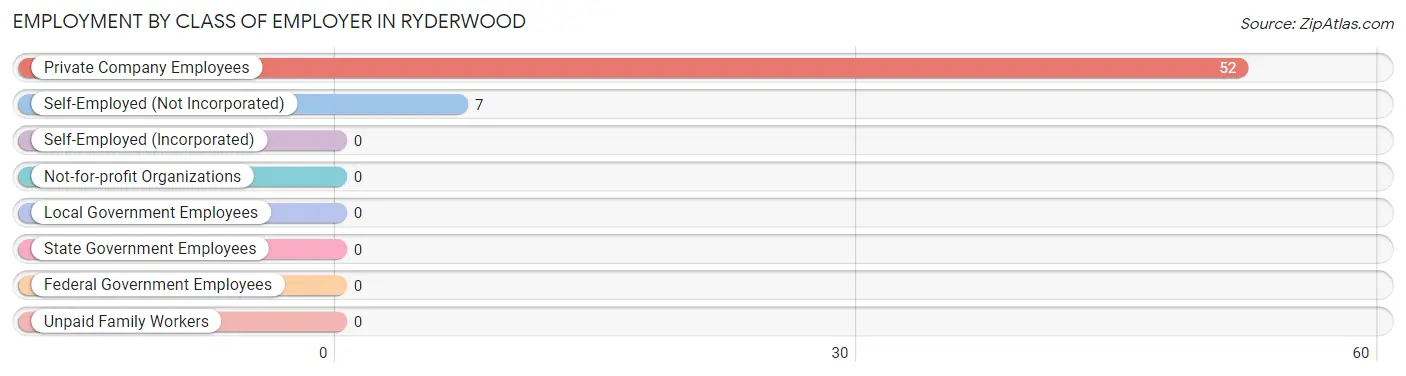
| Employer Class | # Employees | % Employees |
| Private Company Employees | 52 | 88.1% |
| Self-Employed (Incorporated) | 0 | 0.0% |
| Self-Employed (Not Incorporated) | 7 | 11.9% |
| Not-for-profit Organizations | 0 | 0.0% |
| Local Government Employees | 0 | 0.0% |
| State Government Employees | 0 | 0.0% |
| Federal Government Employees | 0 | 0.0% |
| Unpaid Family Workers | 0 | 0.0% |
| Total | 59 | 100.0% |
Employment Status by Age in Ryderwood
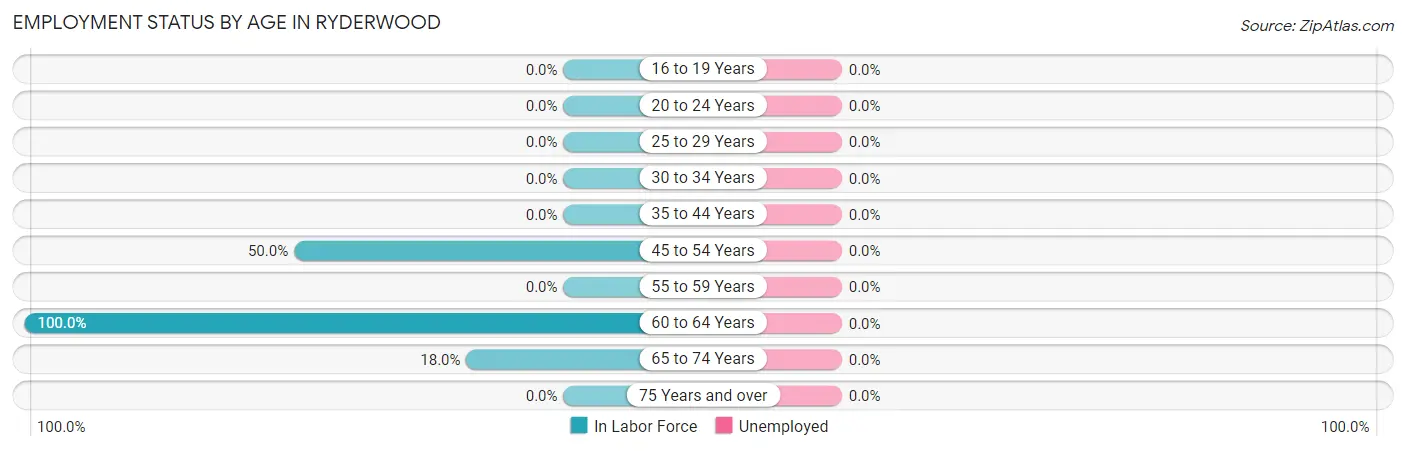
| Age Bracket | In Labor Force | Unemployed |
| 16 to 19 Years | 0 (0.0%) | 0 (0.0%) |
| 20 to 24 Years | 0 (0.0%) | 0 (0.0%) |
| 25 to 29 Years | 0 (0.0%) | 0 (0.0%) |
| 30 to 34 Years | 0 (0.0%) | 0 (0.0%) |
| 35 to 44 Years | 0 (0.0%) | 0 (0.0%) |
| 45 to 54 Years | 8 (50.0%) | 0 (0.0%) |
| 55 to 59 Years | 0 (0.0%) | 0 (0.0%) |
| 60 to 64 Years | 14 (100.0%) | 0 (0.0%) |
| 65 to 74 Years | 37 (18.0%) | 0 (0.0%) |
| 75 Years and over | 0 (0.0%) | 0 (0.0%) |
| Total | 59 (13.9%) | 0 (0.0%) |
Employment Status by Educational Attainment in Ryderwood
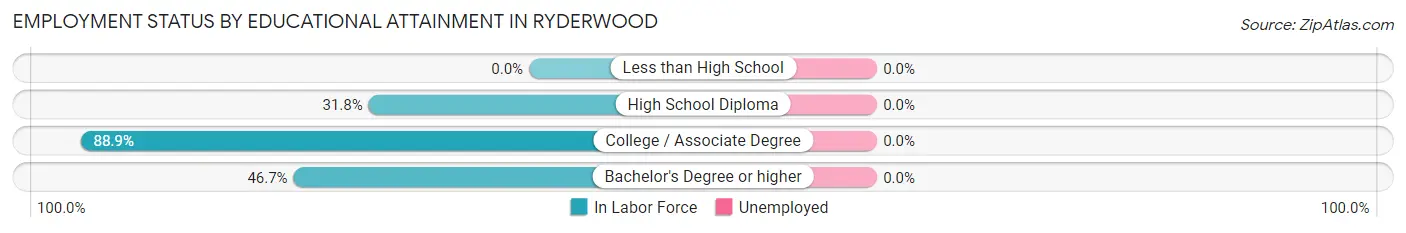
| Educational Attainment | In Labor Force | Unemployed |
| Less than High School | 0 (0.0%) | 0 (0.0%) |
| High School Diploma | 7 (31.8%) | 0 (0.0%) |
| College / Associate Degree | 8 (88.9%) | 0 (0.0%) |
| Bachelor's Degree or higher | 7 (46.7%) | 0 (0.0%) |
| Total | 22 (47.8%) | 0 (0.0%) |
Employment Occupations by Sex in Ryderwood
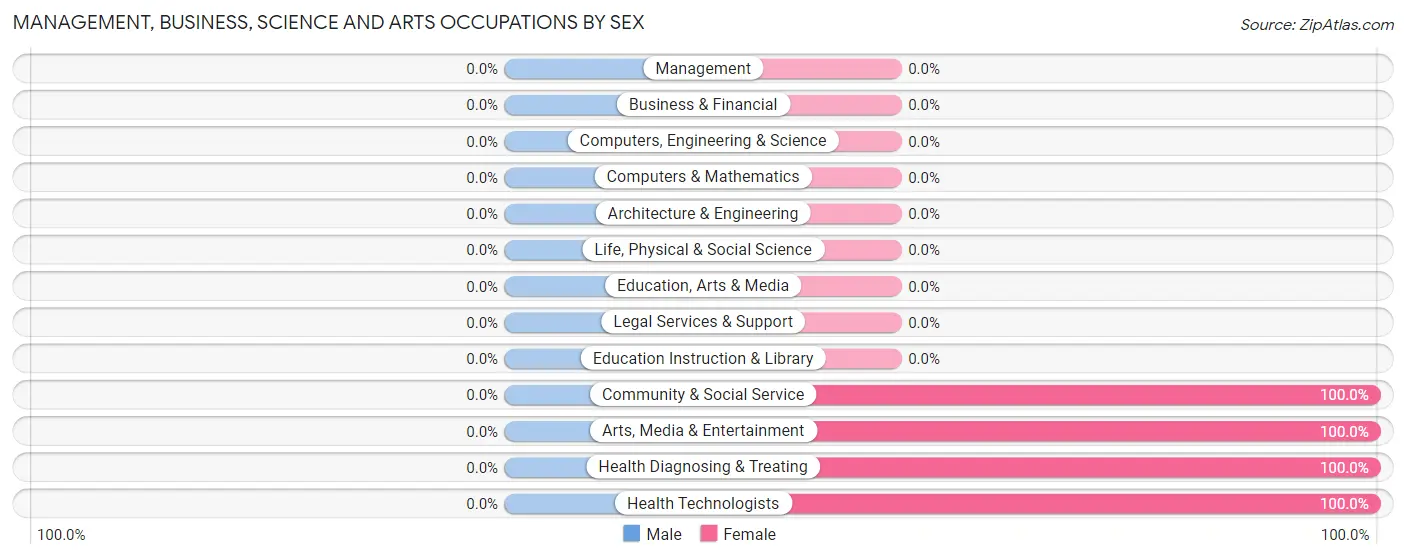
Management, Business, Science and Arts Occupations
The most common Management, Business, Science and Arts occupations in Ryderwood are Health Diagnosing & Treating (13 | 22.0%), Health Technologists (13 | 22.0%), Community & Social Service (9 | 15.2%), and Arts, Media & Entertainment (9 | 15.2%).
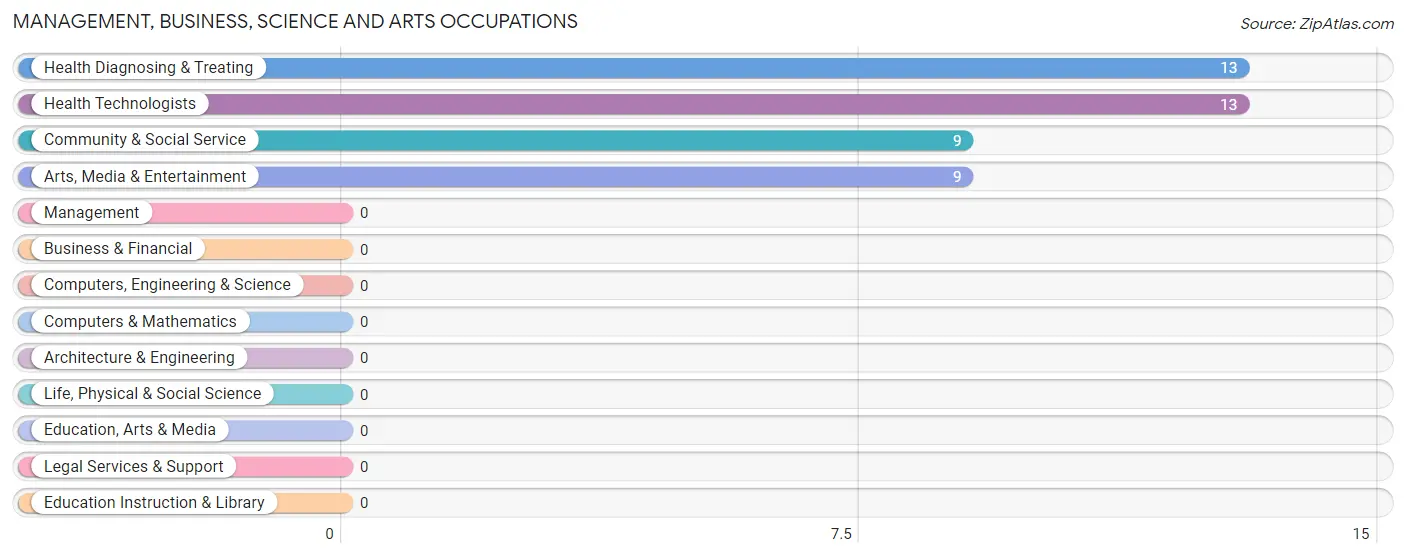
Management, Business, Science and Arts Occupations by Sex
| Occupation | Male | Female |
| Management | 0 (0.0%) | 0 (0.0%) |
| Business & Financial | 0 (0.0%) | 0 (0.0%) |
| Computers, Engineering & Science | 0 (0.0%) | 0 (0.0%) |
| Computers & Mathematics | 0 (0.0%) | 0 (0.0%) |
| Architecture & Engineering | 0 (0.0%) | 0 (0.0%) |
| Life, Physical & Social Science | 0 (0.0%) | 0 (0.0%) |
| Community & Social Service | 0 (0.0%) | 9 (100.0%) |
| Education, Arts & Media | 0 (0.0%) | 0 (0.0%) |
| Legal Services & Support | 0 (0.0%) | 0 (0.0%) |
| Education Instruction & Library | 0 (0.0%) | 0 (0.0%) |
| Arts, Media & Entertainment | 0 (0.0%) | 9 (100.0%) |
| Health Diagnosing & Treating | 0 (0.0%) | 13 (100.0%) |
| Health Technologists | 0 (0.0%) | 13 (100.0%) |
| Total (Category) | 0 (0.0%) | 22 (100.0%) |
| Total (Overall) | 30 (50.8%) | 29 (49.1%) |
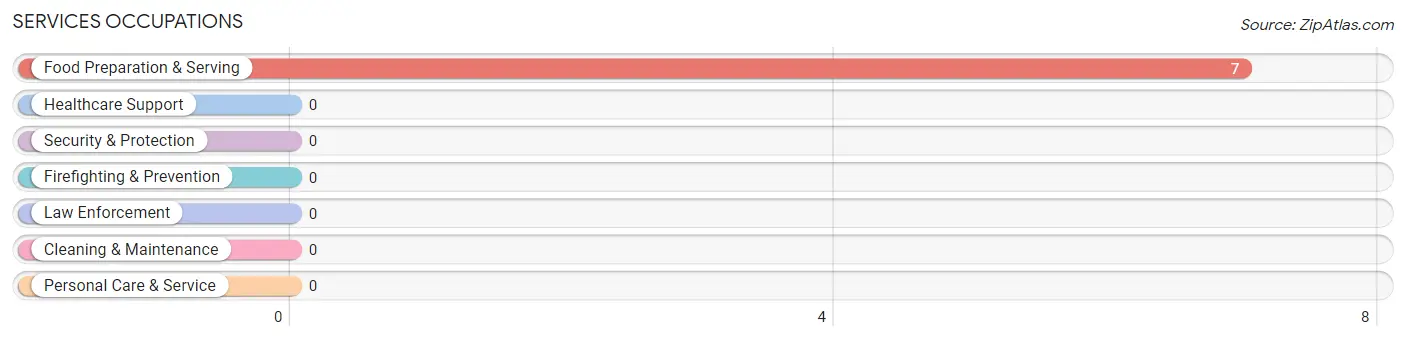
Services Occupations
The most common Services occupations in Ryderwood are , and Food Preparation & Serving (7 | 11.9%).
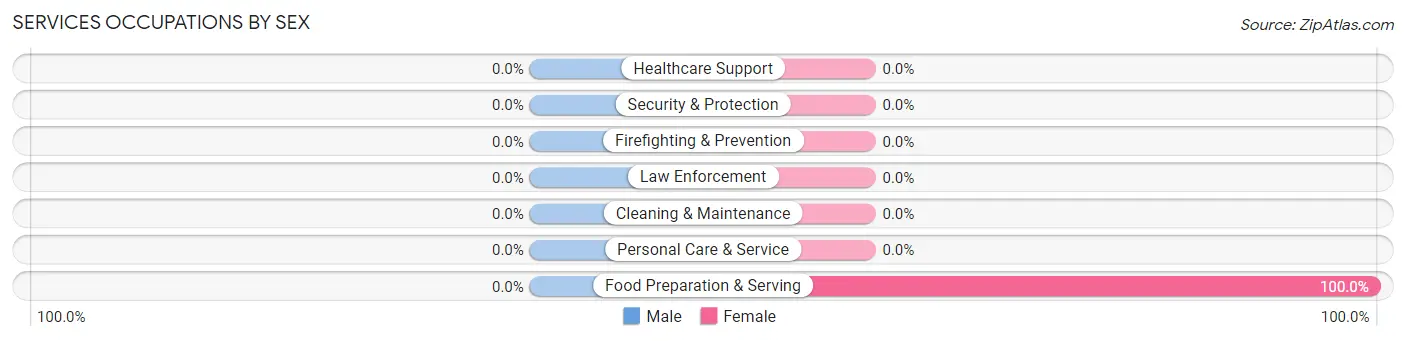
Services Occupations by Sex
| Occupation | Male | Female |
| Healthcare Support | 0 (0.0%) | 0 (0.0%) |
| Security & Protection | 0 (0.0%) | 0 (0.0%) |
| Firefighting & Prevention | 0 (0.0%) | 0 (0.0%) |
| Law Enforcement | 0 (0.0%) | 0 (0.0%) |
| Food Preparation & Serving | 0 (0.0%) | 7 (100.0%) |
| Cleaning & Maintenance | 0 (0.0%) | 0 (0.0%) |
| Personal Care & Service | 0 (0.0%) | 0 (0.0%) |
| Total (Category) | 0 (0.0%) | 7 (100.0%) |
| Total (Overall) | 30 (50.8%) | 29 (49.1%) |
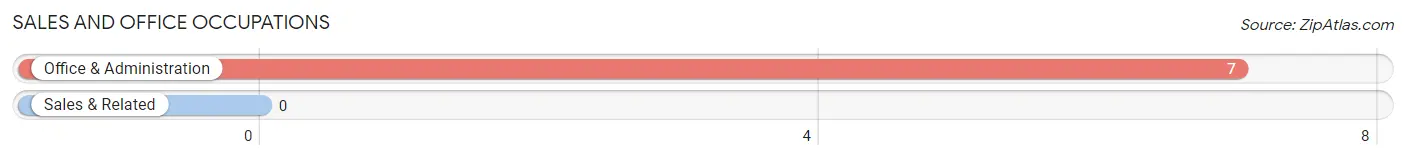
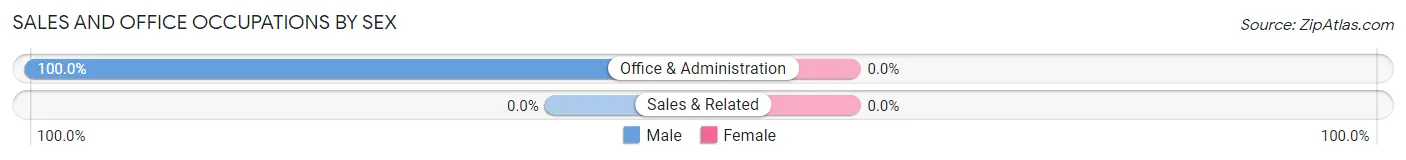
Sales and Office Occupations
The most common Sales and Office occupations in Ryderwood are , and Office & Administration (7 | 11.9%).
Sales and Office Occupations by Sex
| Occupation | Male | Female |
| Sales & Related | 0 (0.0%) | 0 (0.0%) |
| Office & Administration | 7 (100.0%) | 0 (0.0%) |
| Total (Category) | 7 (100.0%) | 0 (0.0%) |
| Total (Overall) | 30 (50.8%) | 29 (49.1%) |
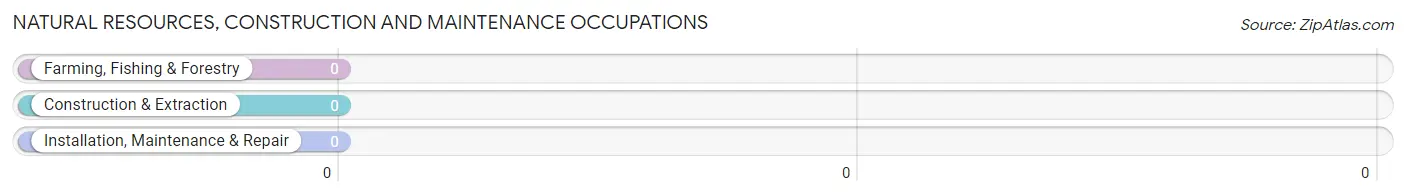
Natural Resources, Construction and Maintenance Occupations
Natural Resources, Construction and Maintenance Occupations by Sex
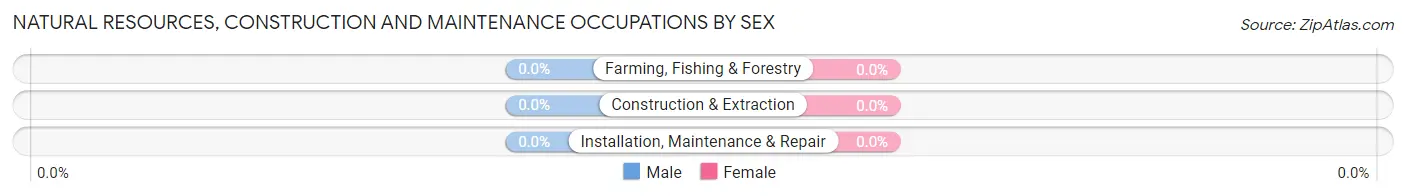
| Occupation | Male | Female |
| Farming, Fishing & Forestry | 0 (0.0%) | 0 (0.0%) |
| Construction & Extraction | 0 (0.0%) | 0 (0.0%) |
| Installation, Maintenance & Repair | 0 (0.0%) | 0 (0.0%) |
| Total (Category) | 0 (0.0%) | 0 (0.0%) |
| Total (Overall) | 30 (50.8%) | 29 (49.1%) |
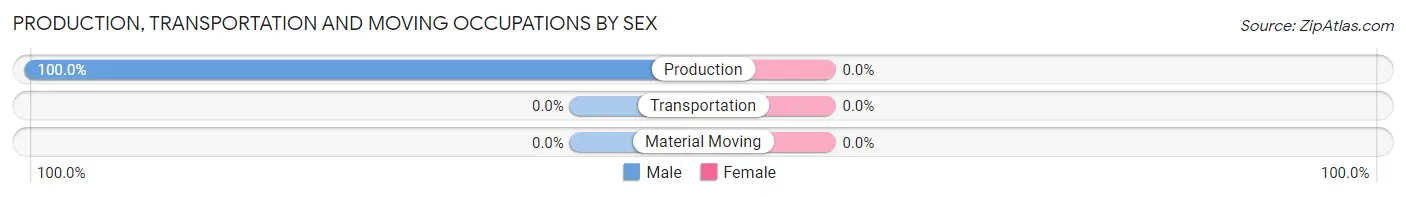
Production, Transportation and Moving Occupations
The most common Production, Transportation and Moving occupations in Ryderwood are , and Production (23 | 39.0%).
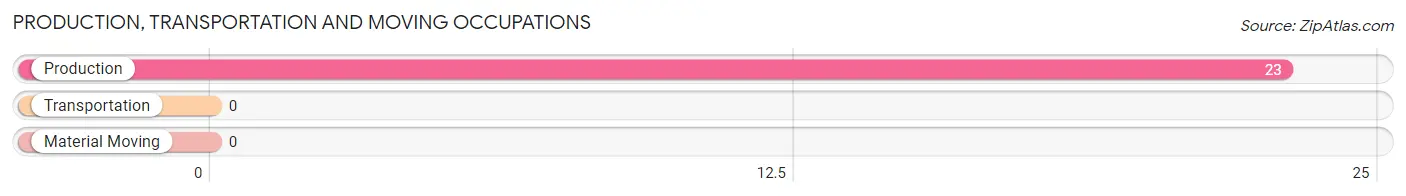
Production, Transportation and Moving Occupations by Sex
| Occupation | Male | Female |
| Production | 23 (100.0%) | 0 (0.0%) |
| Transportation | 0 (0.0%) | 0 (0.0%) |
| Material Moving | 0 (0.0%) | 0 (0.0%) |
| Total (Category) | 23 (100.0%) | 0 (0.0%) |
| Total (Overall) | 30 (50.8%) | 29 (49.1%) |
Employment Industries by Sex in Ryderwood
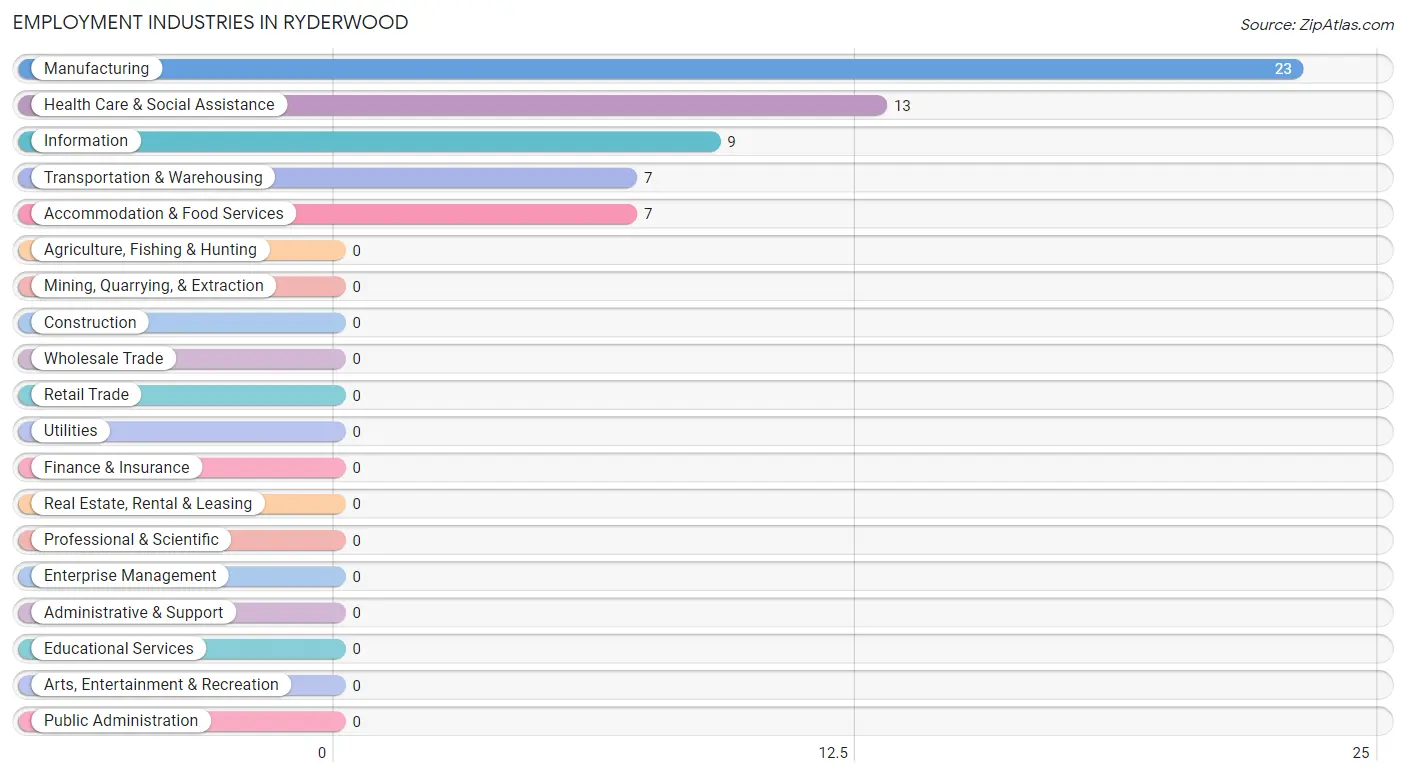
Employment Industries in Ryderwood
The major employment industries in Ryderwood include Manufacturing (23 | 39.0%), Health Care & Social Assistance (13 | 22.0%), Information (9 | 15.2%), Transportation & Warehousing (7 | 11.9%), and Accommodation & Food Services (7 | 11.9%).
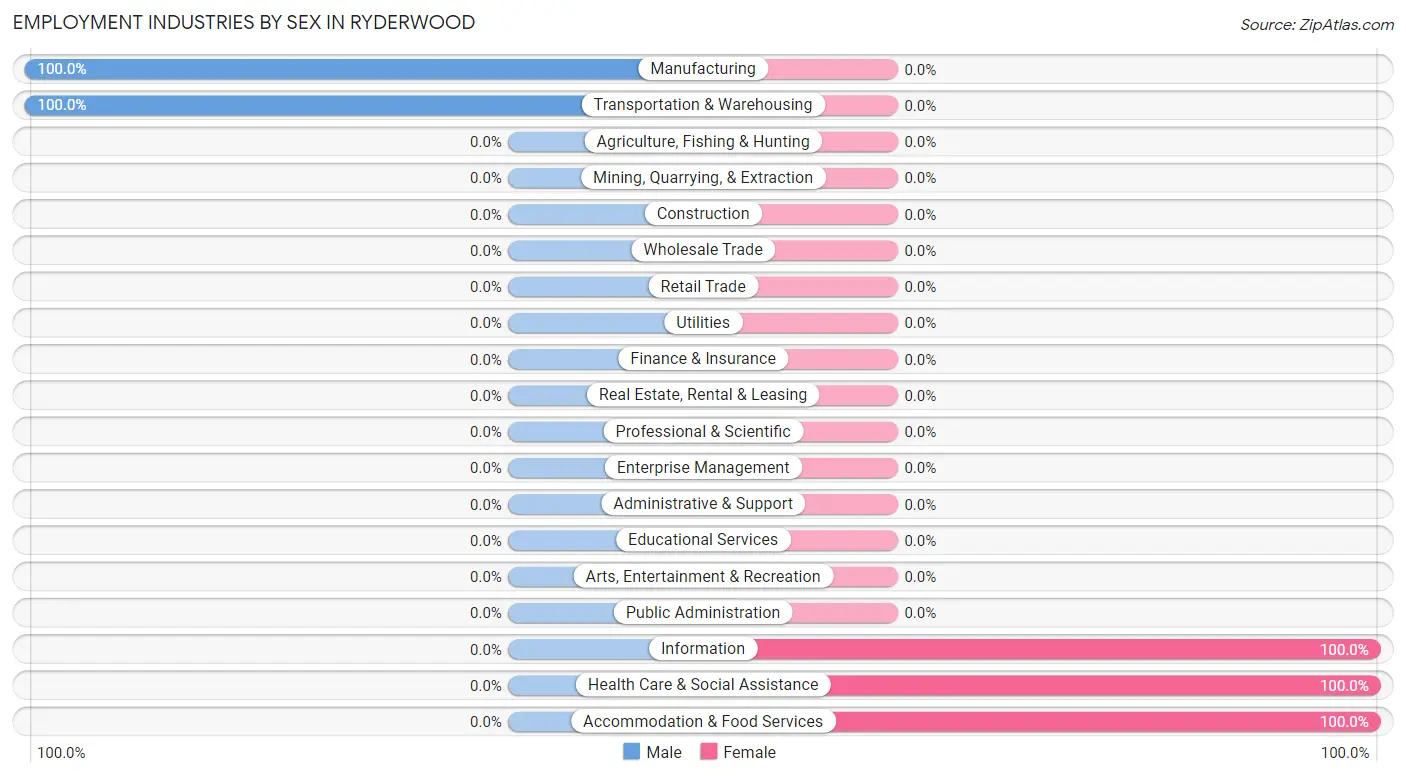
Employment Industries by Sex in Ryderwood
The Ryderwood industries that see more men than women are Manufacturing (100.0%), and Transportation & Warehousing (100.0%), whereas the industries that tend to have a higher number of women are Information (100.0%), Health Care & Social Assistance (100.0%), and Accommodation & Food Services (100.0%).
| Industry | Male | Female |
| Agriculture, Fishing & Hunting | 0 (0.0%) | 0 (0.0%) |
| Mining, Quarrying, & Extraction | 0 (0.0%) | 0 (0.0%) |
| Construction | 0 (0.0%) | 0 (0.0%) |
| Manufacturing | 23 (100.0%) | 0 (0.0%) |
| Wholesale Trade | 0 (0.0%) | 0 (0.0%) |
| Retail Trade | 0 (0.0%) | 0 (0.0%) |
| Transportation & Warehousing | 7 (100.0%) | 0 (0.0%) |
| Utilities | 0 (0.0%) | 0 (0.0%) |
| Information | 0 (0.0%) | 9 (100.0%) |
| Finance & Insurance | 0 (0.0%) | 0 (0.0%) |
| Real Estate, Rental & Leasing | 0 (0.0%) | 0 (0.0%) |
| Professional & Scientific | 0 (0.0%) | 0 (0.0%) |
| Enterprise Management | 0 (0.0%) | 0 (0.0%) |
| Administrative & Support | 0 (0.0%) | 0 (0.0%) |
| Educational Services | 0 (0.0%) | 0 (0.0%) |
| Health Care & Social Assistance | 0 (0.0%) | 13 (100.0%) |
| Arts, Entertainment & Recreation | 0 (0.0%) | 0 (0.0%) |
| Accommodation & Food Services | 0 (0.0%) | 7 (100.0%) |
| Public Administration | 0 (0.0%) | 0 (0.0%) |
| Total | 30 (50.8%) | 29 (49.1%) |
Education in Ryderwood
School Enrollment in Ryderwood
| School Level | # Students | % Students |
| Nursery / Preschool | 0 | 0.0% |
| Kindergarten | 0 | 0.0% |
| Elementary School | 0 | 0.0% |
| Middle School | 0 | 0.0% |
| High School | 0 | 0.0% |
| College / Undergraduate | 0 | 0.0% |
| Graduate / Professional | 0 | 0.0% |
| Total | 0 | 0.0% |
School Enrollment by Age by Funding Source in Ryderwood
| Age Bracket | Public School | Private School |
| 3 to 4 Year Olds | 0 (0.0%) | 0 (0.0%) |
| 5 to 9 Year Old | 0 (0.0%) | 0 (0.0%) |
| 10 to 14 Year Olds | 0 (0.0%) | 0 (0.0%) |
| 15 to 17 Year Olds | 0 (0.0%) | 0 (0.0%) |
| 18 to 19 Year Olds | 0 (0.0%) | 0 (0.0%) |
| 20 to 24 Year Olds | 0 (0.0%) | 0 (0.0%) |
| 25 to 34 Year Olds | 0 (0.0%) | 0 (0.0%) |
| 35 Years and over | 0 (0.0%) | 0 (0.0%) |
| Total | 0 (0.0%) | 0 (0.0%) |
Educational Attainment by Field of Study in Ryderwood
Bio, nature & agricultural (30 | 23.8%), physical & health sciences (26 | 20.6%), liberal arts & history (20 | 15.9%), psychology (17 | 13.5%), and computers & mathematics (11 | 8.7%) are the most common fields of study among 126 individuals in Ryderwood who have obtained a bachelor's degree or higher.
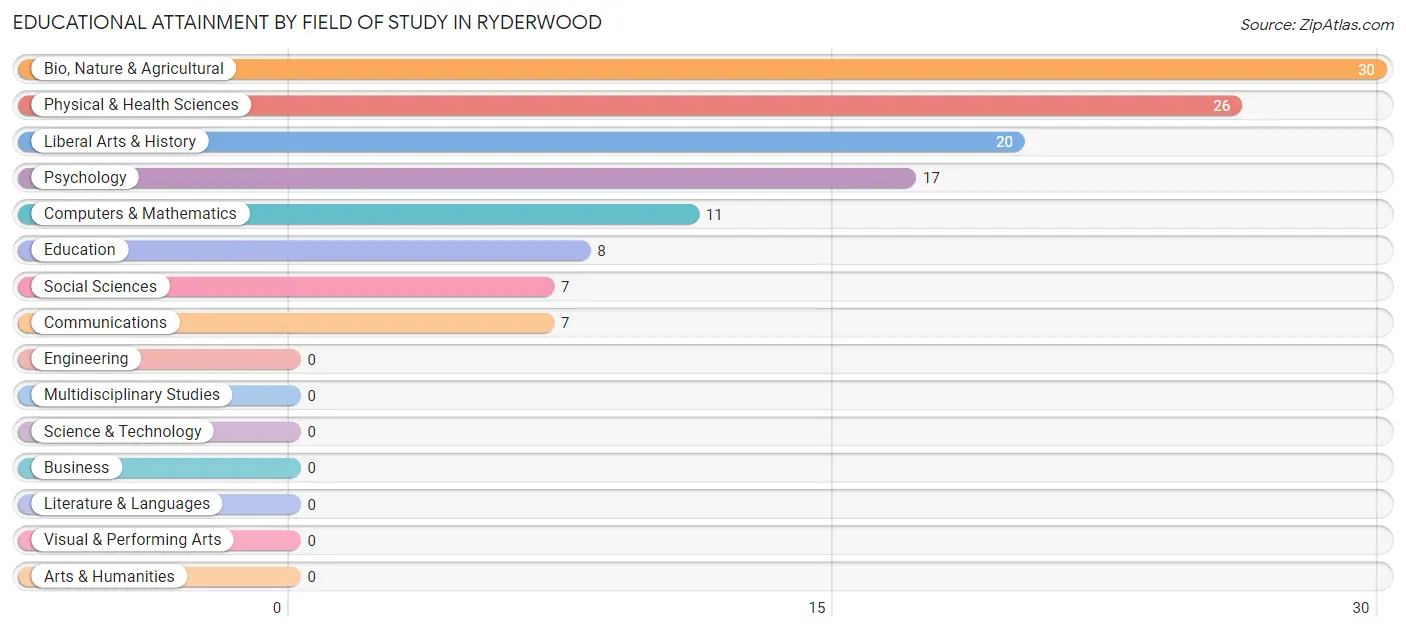
| Field of Study | # Graduates | % Graduates |
| Computers & Mathematics | 11 | 8.7% |
| Bio, Nature & Agricultural | 30 | 23.8% |
| Physical & Health Sciences | 26 | 20.6% |
| Psychology | 17 | 13.5% |
| Social Sciences | 7 | 5.6% |
| Engineering | 0 | 0.0% |
| Multidisciplinary Studies | 0 | 0.0% |
| Science & Technology | 0 | 0.0% |
| Business | 0 | 0.0% |
| Education | 8 | 6.4% |
| Literature & Languages | 0 | 0.0% |
| Liberal Arts & History | 20 | 15.9% |
| Visual & Performing Arts | 0 | 0.0% |
| Communications | 7 | 5.6% |
| Arts & Humanities | 0 | 0.0% |
| Total | 126 | 100.0% |
Transportation & Commute in Ryderwood
Vehicle Availability by Sex in Ryderwood
The most prevalent vehicle ownership categories in Ryderwood are males with 2 vehicles (30, accounting for 100.0%) and females with 2 vehicles (7, making up 103.4%).
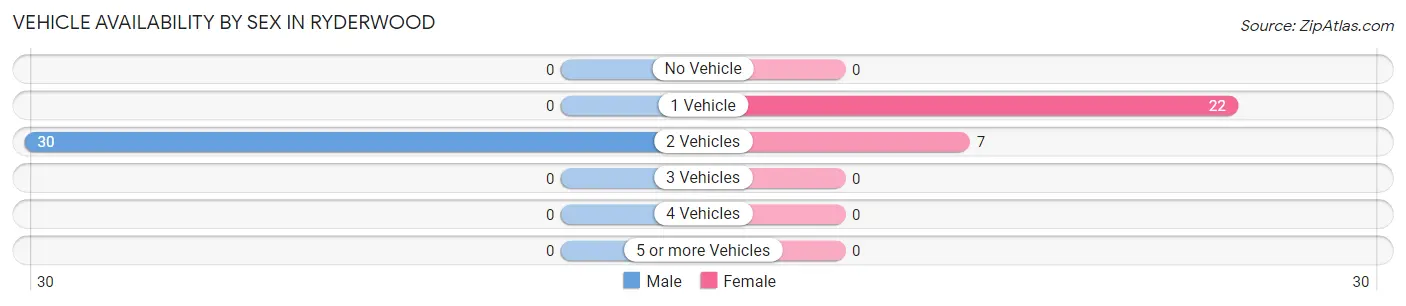
| Vehicles Available | Male | Female |
| No Vehicle | 0 (0.0%) | 0 (0.0%) |
| 1 Vehicle | 0 (0.0%) | 22 (75.9%) |
| 2 Vehicles | 30 (100.0%) | 7 (24.1%) |
| 3 Vehicles | 0 (0.0%) | 0 (0.0%) |
| 4 Vehicles | 0 (0.0%) | 0 (0.0%) |
| 5 or more Vehicles | 0 (0.0%) | 0 (0.0%) |
| Total | 30 (100.0%) | 29 (100.0%) |
Commute Time in Ryderwood
The most frequently occuring commute durations in Ryderwood are 15 to 19 minutes (15 commuters, 30.0%), 35 to 39 minutes (14 commuters, 28.0%), and 25 to 29 minutes (13 commuters, 26.0%).
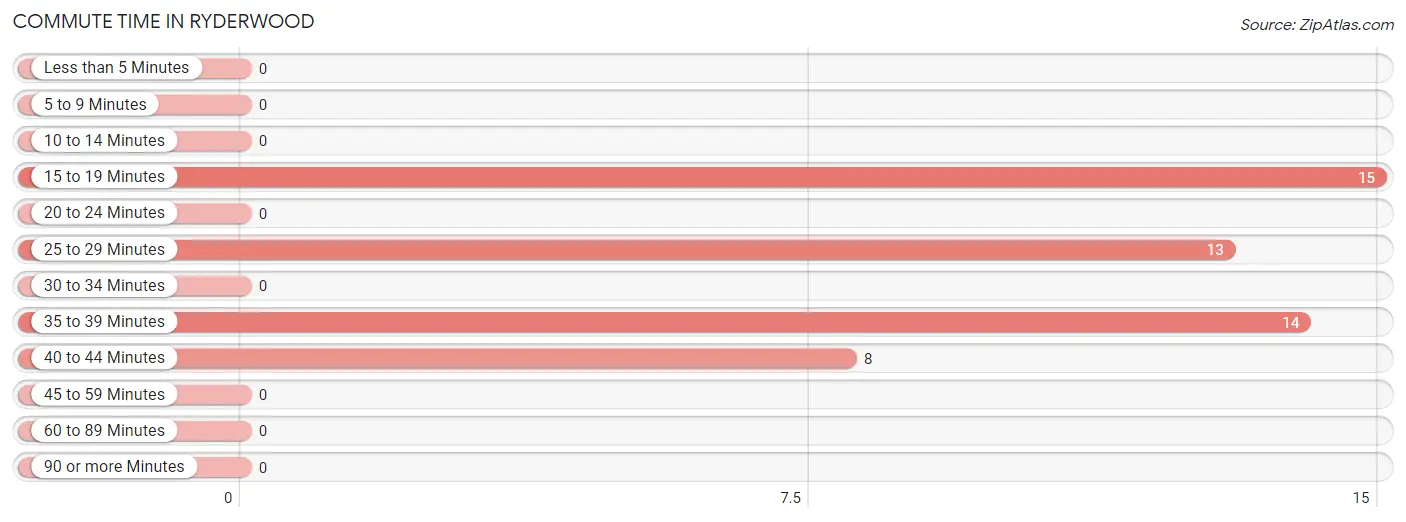
| Commute Time | # Commuters | % Commuters |
| Less than 5 Minutes | 0 | 0.0% |
| 5 to 9 Minutes | 0 | 0.0% |
| 10 to 14 Minutes | 0 | 0.0% |
| 15 to 19 Minutes | 15 | 30.0% |
| 20 to 24 Minutes | 0 | 0.0% |
| 25 to 29 Minutes | 13 | 26.0% |
| 30 to 34 Minutes | 0 | 0.0% |
| 35 to 39 Minutes | 14 | 28.0% |
| 40 to 44 Minutes | 8 | 16.0% |
| 45 to 59 Minutes | 0 | 0.0% |
| 60 to 89 Minutes | 0 | 0.0% |
| 90 or more Minutes | 0 | 0.0% |
Commute Time by Sex in Ryderwood
The most common commute times in Ryderwood are 15 to 19 minutes (15 commuters, 50.0%) for males and 25 to 29 minutes (13 commuters, 65.0%) for females.
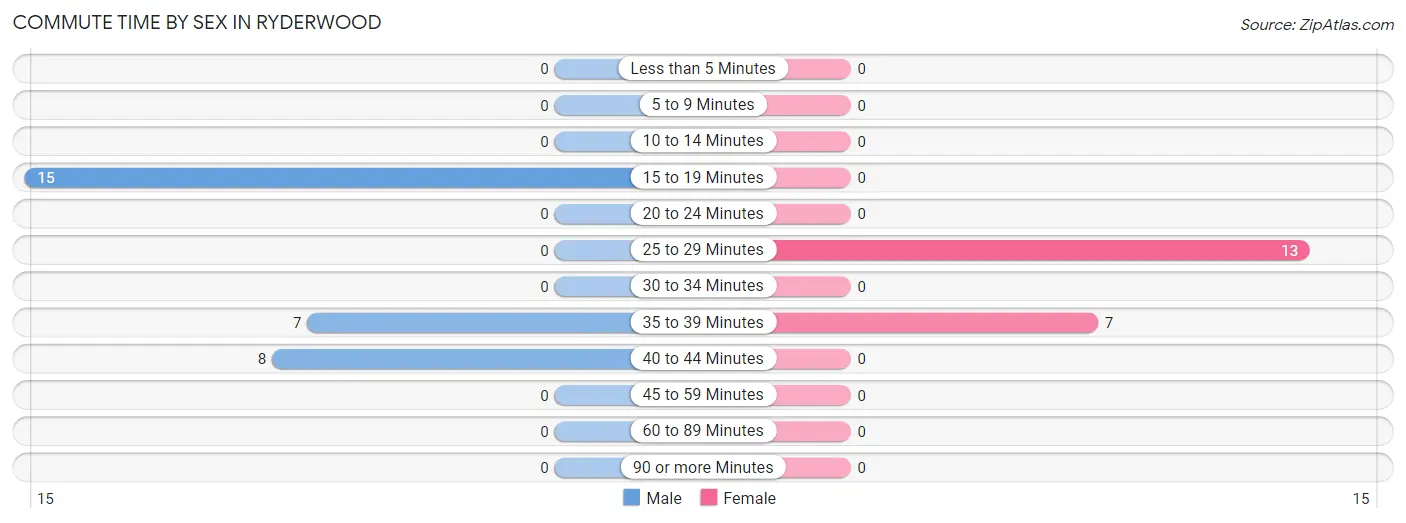
| Commute Time | Male | Female |
| Less than 5 Minutes | 0 (0.0%) | 0 (0.0%) |
| 5 to 9 Minutes | 0 (0.0%) | 0 (0.0%) |
| 10 to 14 Minutes | 0 (0.0%) | 0 (0.0%) |
| 15 to 19 Minutes | 15 (50.0%) | 0 (0.0%) |
| 20 to 24 Minutes | 0 (0.0%) | 0 (0.0%) |
| 25 to 29 Minutes | 0 (0.0%) | 13 (65.0%) |
| 30 to 34 Minutes | 0 (0.0%) | 0 (0.0%) |
| 35 to 39 Minutes | 7 (23.3%) | 7 (35.0%) |
| 40 to 44 Minutes | 8 (26.7%) | 0 (0.0%) |
| 45 to 59 Minutes | 0 (0.0%) | 0 (0.0%) |
| 60 to 89 Minutes | 0 (0.0%) | 0 (0.0%) |
| 90 or more Minutes | 0 (0.0%) | 0 (0.0%) |
Time of Departure to Work by Sex in Ryderwood
The most frequent times of departure to work in Ryderwood are 6:30 AM to 6:59 AM (15, 50.0%) for males and 7:30 AM to 7:59 AM (13, 65.0%) for females.
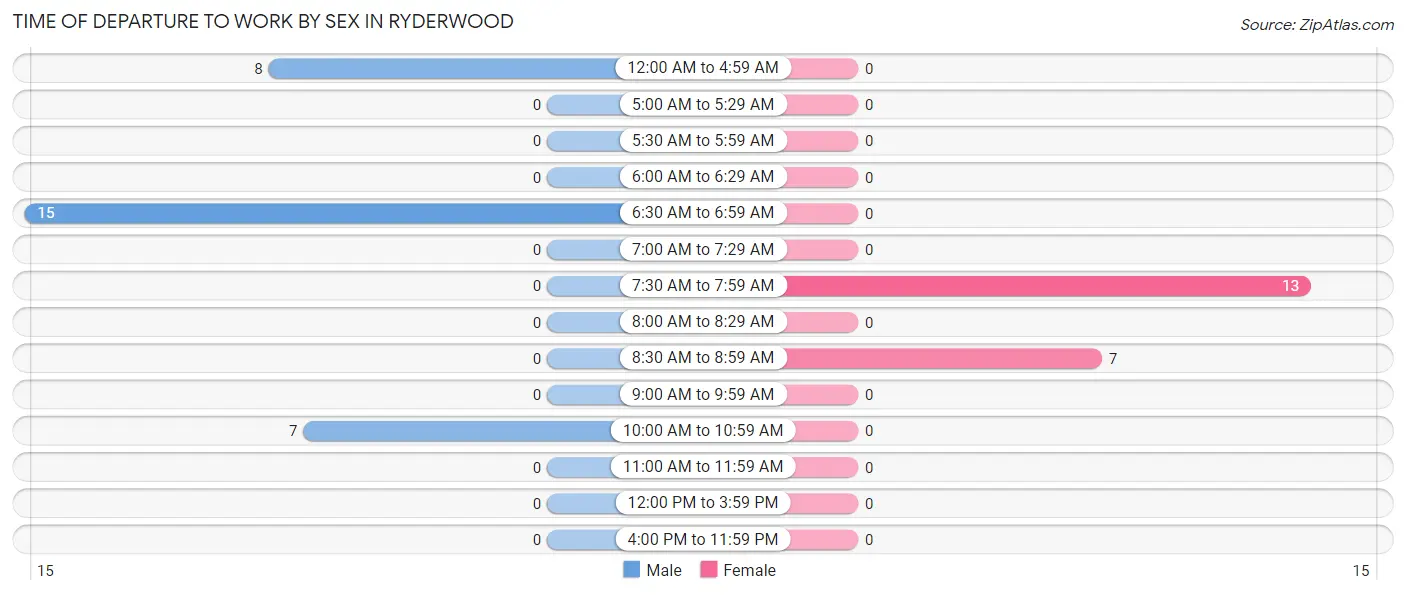
| Time of Departure | Male | Female |
| 12:00 AM to 4:59 AM | 8 (26.7%) | 0 (0.0%) |
| 5:00 AM to 5:29 AM | 0 (0.0%) | 0 (0.0%) |
| 5:30 AM to 5:59 AM | 0 (0.0%) | 0 (0.0%) |
| 6:00 AM to 6:29 AM | 0 (0.0%) | 0 (0.0%) |
| 6:30 AM to 6:59 AM | 15 (50.0%) | 0 (0.0%) |
| 7:00 AM to 7:29 AM | 0 (0.0%) | 0 (0.0%) |
| 7:30 AM to 7:59 AM | 0 (0.0%) | 13 (65.0%) |
| 8:00 AM to 8:29 AM | 0 (0.0%) | 0 (0.0%) |
| 8:30 AM to 8:59 AM | 0 (0.0%) | 7 (35.0%) |
| 9:00 AM to 9:59 AM | 0 (0.0%) | 0 (0.0%) |
| 10:00 AM to 10:59 AM | 7 (23.3%) | 0 (0.0%) |
| 11:00 AM to 11:59 AM | 0 (0.0%) | 0 (0.0%) |
| 12:00 PM to 3:59 PM | 0 (0.0%) | 0 (0.0%) |
| 4:00 PM to 11:59 PM | 0 (0.0%) | 0 (0.0%) |
| Total | 30 (100.0%) | 20 (100.0%) |
Housing Occupancy in Ryderwood
Occupancy by Ownership in Ryderwood
Of the total 251 dwellings in Ryderwood, owner-occupied units account for 251 (100.0%), while renter-occupied units make up 0 (0.0%).
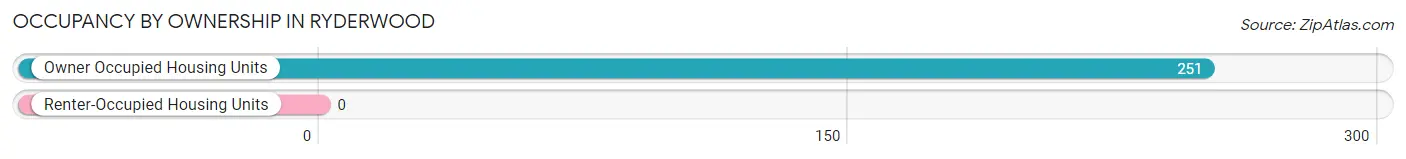
| Occupancy | # Housing Units | % Housing Units |
| Owner Occupied Housing Units | 251 | 100.0% |
| Renter-Occupied Housing Units | 0 | 0.0% |
| Total Occupied Housing Units | 251 | 100.0% |
Occupancy by Household Size in Ryderwood
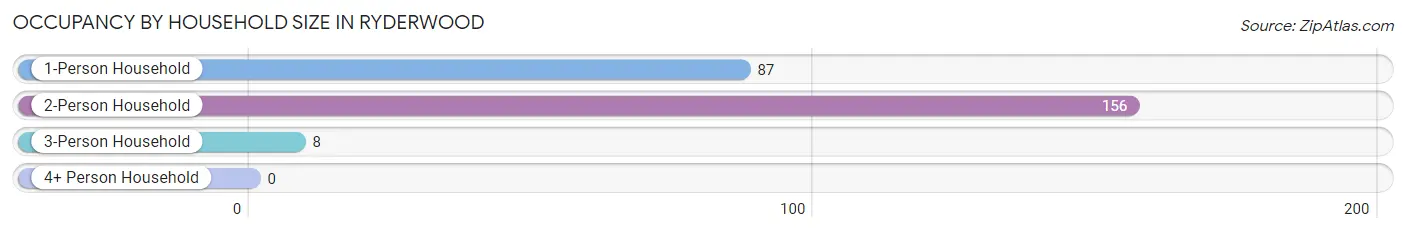
| Household Size | # Housing Units | % Housing Units |
| 1-Person Household | 87 | 34.7% |
| 2-Person Household | 156 | 62.2% |
| 3-Person Household | 8 | 3.2% |
| 4+ Person Household | 0 | 0.0% |
| Total Housing Units | 251 | 100.0% |
Occupancy by Ownership by Household Size in Ryderwood
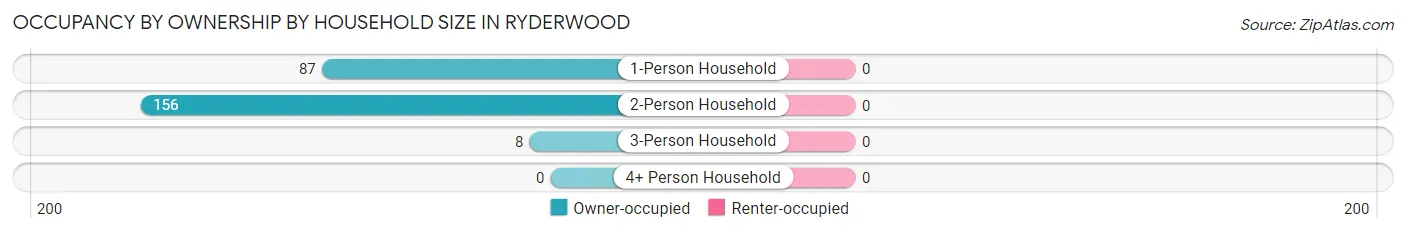
| Household Size | Owner-occupied | Renter-occupied |
| 1-Person Household | 87 (100.0%) | 0 (0.0%) |
| 2-Person Household | 156 (100.0%) | 0 (0.0%) |
| 3-Person Household | 8 (100.0%) | 0 (0.0%) |
| 4+ Person Household | 0 (0.0%) | 0 (0.0%) |
| Total Housing Units | 251 (100.0%) | 0 (0.0%) |
Occupancy by Educational Attainment in Ryderwood
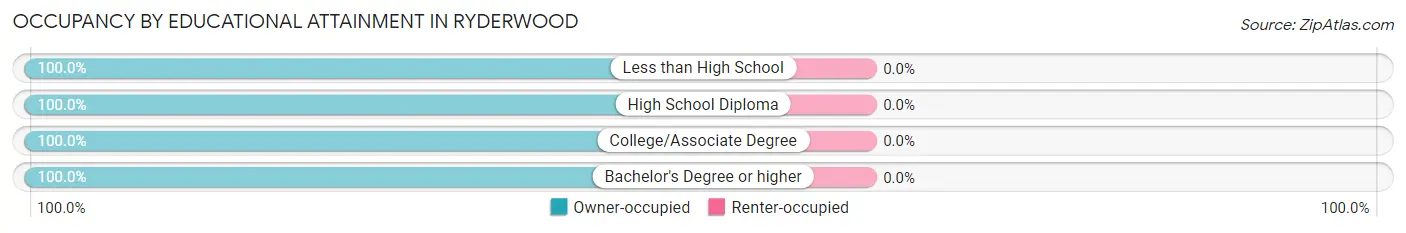
| Household Size | Owner-occupied | Renter-occupied |
| Less than High School | 57 (100.0%) | 0 (0.0%) |
| High School Diploma | 10 (100.0%) | 0 (0.0%) |
| College/Associate Degree | 127 (100.0%) | 0 (0.0%) |
| Bachelor's Degree or higher | 57 (100.0%) | 0 (0.0%) |
Occupancy by Age of Householder in Ryderwood
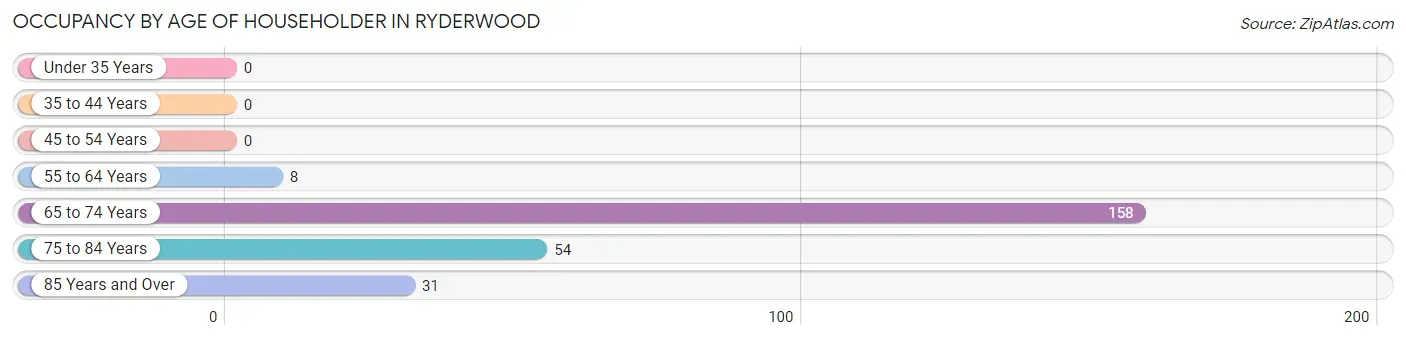
| Age Bracket | # Households | % Households |
| Under 35 Years | 0 | 0.0% |
| 35 to 44 Years | 0 | 0.0% |
| 45 to 54 Years | 0 | 0.0% |
| 55 to 64 Years | 8 | 3.2% |
| 65 to 74 Years | 158 | 62.9% |
| 75 to 84 Years | 54 | 21.5% |
| 85 Years and Over | 31 | 12.3% |
| Total | 251 | 100.0% |
Housing Finances in Ryderwood
Median Income by Occupancy in Ryderwood
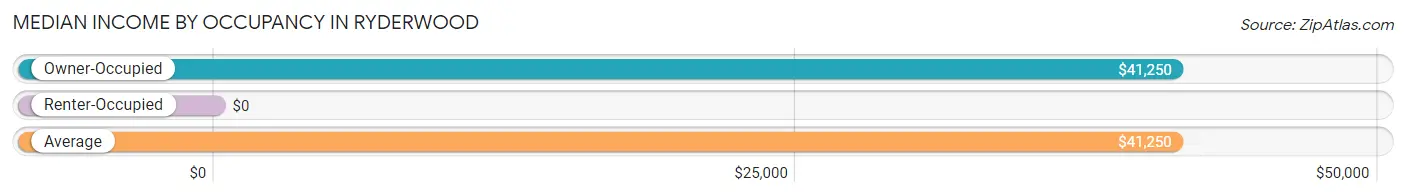
| Occupancy Type | # Households | Median Income |
| Owner-Occupied | 251 (100.0%) | $41,250 |
| Renter-Occupied | 0 (0.0%) | $0 |
| Average | 251 (100.0%) | $41,250 |
Occupancy by Householder Income Bracket in Ryderwood
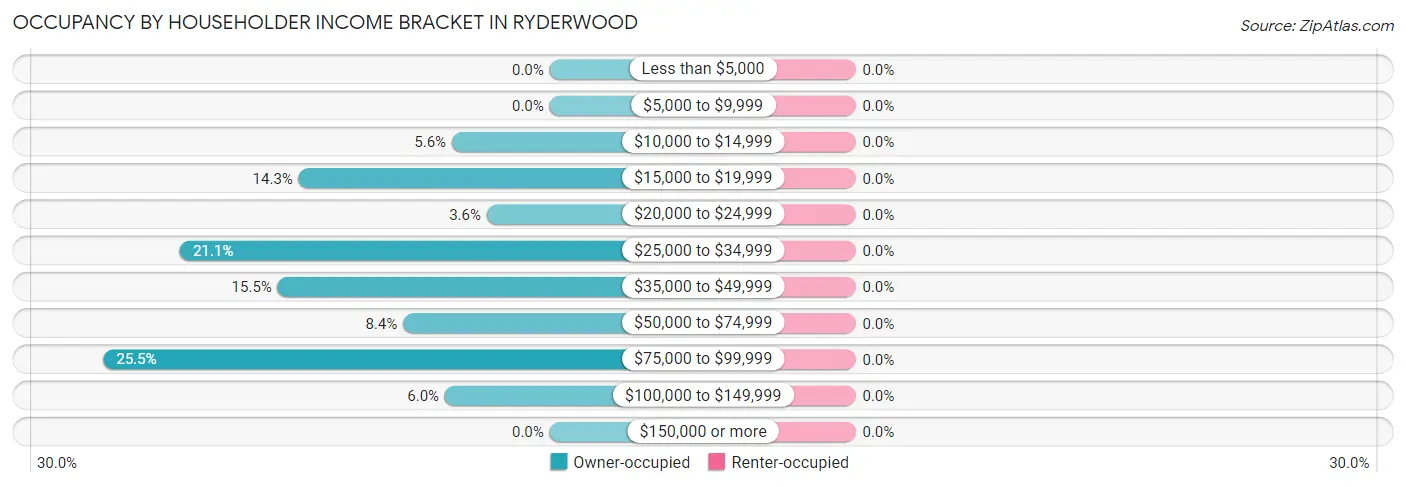
| Income Bracket | Owner-occupied | Renter-occupied |
| Less than $5,000 | 0 (0.0%) | 0 (0.0%) |
| $5,000 to $9,999 | 0 (0.0%) | 0 (0.0%) |
| $10,000 to $14,999 | 14 (5.6%) | 0 (0.0%) |
| $15,000 to $19,999 | 36 (14.3%) | 0 (0.0%) |
| $20,000 to $24,999 | 9 (3.6%) | 0 (0.0%) |
| $25,000 to $34,999 | 53 (21.1%) | 0 (0.0%) |
| $35,000 to $49,999 | 39 (15.5%) | 0 (0.0%) |
| $50,000 to $74,999 | 21 (8.4%) | 0 (0.0%) |
| $75,000 to $99,999 | 64 (25.5%) | 0 (0.0%) |
| $100,000 to $149,999 | 15 (6.0%) | 0 (0.0%) |
| $150,000 or more | 0 (0.0%) | 0 (0.0%) |
| Total | 251 (100.0%) | 0 (0.0%) |
Monthly Housing Cost Tiers in Ryderwood
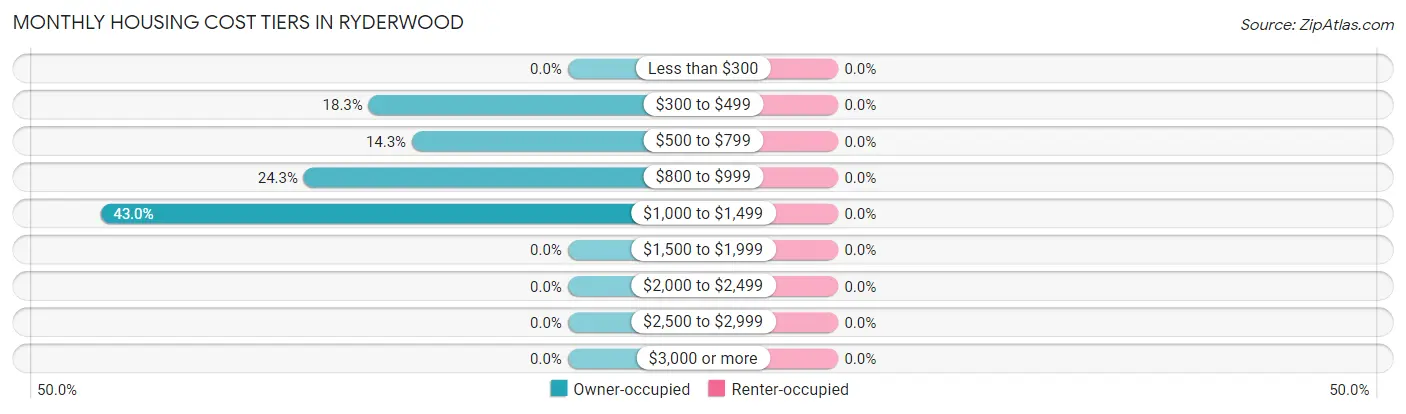
| Monthly Cost | Owner-occupied | Renter-occupied |
| Less than $300 | 0 (0.0%) | 0 (0.0%) |
| $300 to $499 | 46 (18.3%) | 0 (0.0%) |
| $500 to $799 | 36 (14.3%) | 0 (0.0%) |
| $800 to $999 | 61 (24.3%) | 0 (0.0%) |
| $1,000 to $1,499 | 108 (43.0%) | 0 (0.0%) |
| $1,500 to $1,999 | 0 (0.0%) | 0 (0.0%) |
| $2,000 to $2,499 | 0 (0.0%) | 0 (0.0%) |
| $2,500 to $2,999 | 0 (0.0%) | 0 (0.0%) |
| $3,000 or more | 0 (0.0%) | 0 (0.0%) |
| Total | 251 (100.0%) | 0 (0.0%) |
Physical Housing Characteristics in Ryderwood
Housing Structures in Ryderwood
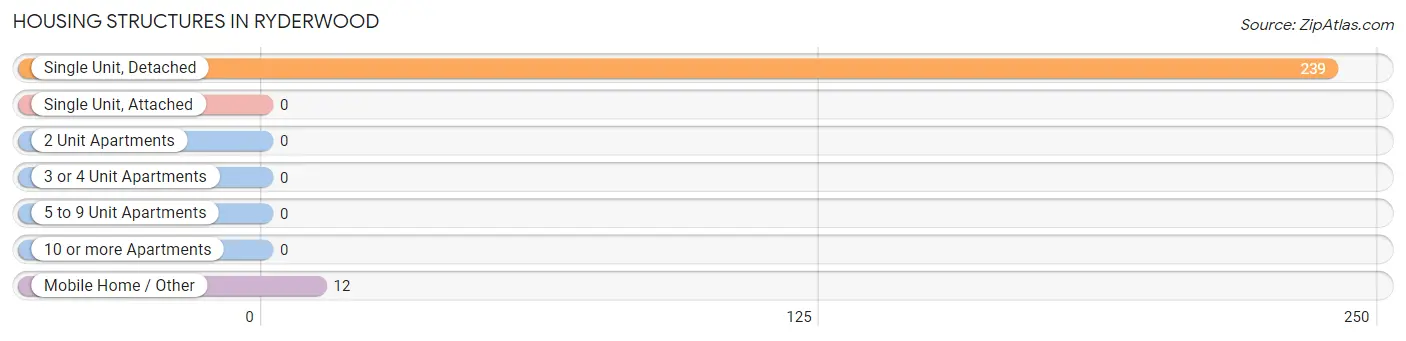
| Structure Type | # Housing Units | % Housing Units |
| Single Unit, Detached | 239 | 95.2% |
| Single Unit, Attached | 0 | 0.0% |
| 2 Unit Apartments | 0 | 0.0% |
| 3 or 4 Unit Apartments | 0 | 0.0% |
| 5 to 9 Unit Apartments | 0 | 0.0% |
| 10 or more Apartments | 0 | 0.0% |
| Mobile Home / Other | 12 | 4.8% |
| Total | 251 | 100.0% |
Housing Structures by Occupancy in Ryderwood
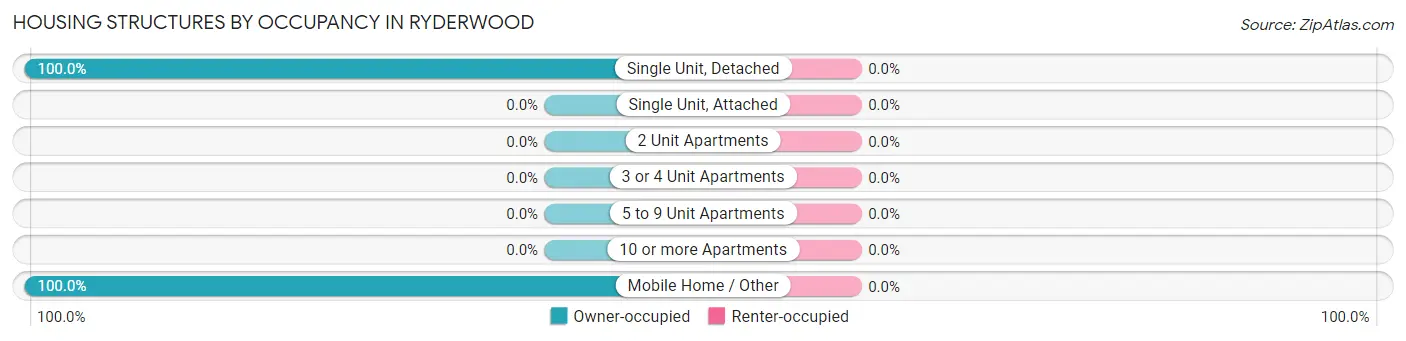
| Structure Type | Owner-occupied | Renter-occupied |
| Single Unit, Detached | 239 (100.0%) | 0 (0.0%) |
| Single Unit, Attached | 0 (0.0%) | 0 (0.0%) |
| 2 Unit Apartments | 0 (0.0%) | 0 (0.0%) |
| 3 or 4 Unit Apartments | 0 (0.0%) | 0 (0.0%) |
| 5 to 9 Unit Apartments | 0 (0.0%) | 0 (0.0%) |
| 10 or more Apartments | 0 (0.0%) | 0 (0.0%) |
| Mobile Home / Other | 12 (100.0%) | 0 (0.0%) |
| Total | 251 (100.0%) | 0 (0.0%) |
Housing Structures by Number of Rooms in Ryderwood
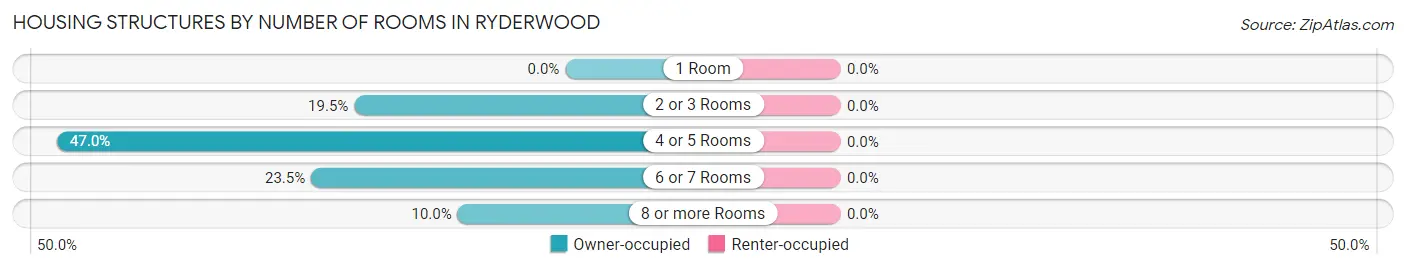
| Number of Rooms | Owner-occupied | Renter-occupied |
| 1 Room | 0 (0.0%) | 0 (0.0%) |
| 2 or 3 Rooms | 49 (19.5%) | 0 (0.0%) |
| 4 or 5 Rooms | 118 (47.0%) | 0 (0.0%) |
| 6 or 7 Rooms | 59 (23.5%) | 0 (0.0%) |
| 8 or more Rooms | 25 (10.0%) | 0 (0.0%) |
| Total | 251 (100.0%) | 0 (0.0%) |
Housing Structure by Heating Type in Ryderwood
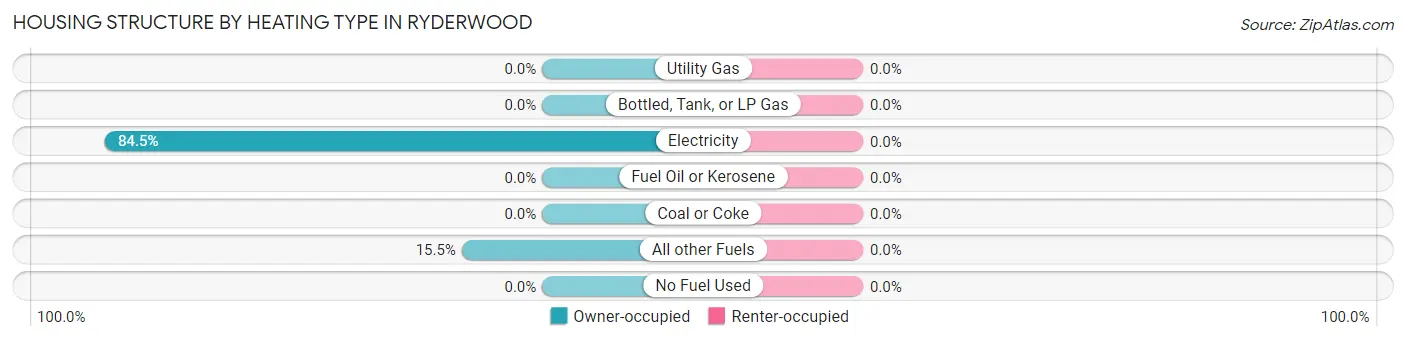
| Heating Type | Owner-occupied | Renter-occupied |
| Utility Gas | 0 (0.0%) | 0 (0.0%) |
| Bottled, Tank, or LP Gas | 0 (0.0%) | 0 (0.0%) |
| Electricity | 212 (84.5%) | 0 (0.0%) |
| Fuel Oil or Kerosene | 0 (0.0%) | 0 (0.0%) |
| Coal or Coke | 0 (0.0%) | 0 (0.0%) |
| All other Fuels | 39 (15.5%) | 0 (0.0%) |
| No Fuel Used | 0 (0.0%) | 0 (0.0%) |
| Total | 251 (100.0%) | 0 (0.0%) |
Household Vehicle Usage in Ryderwood
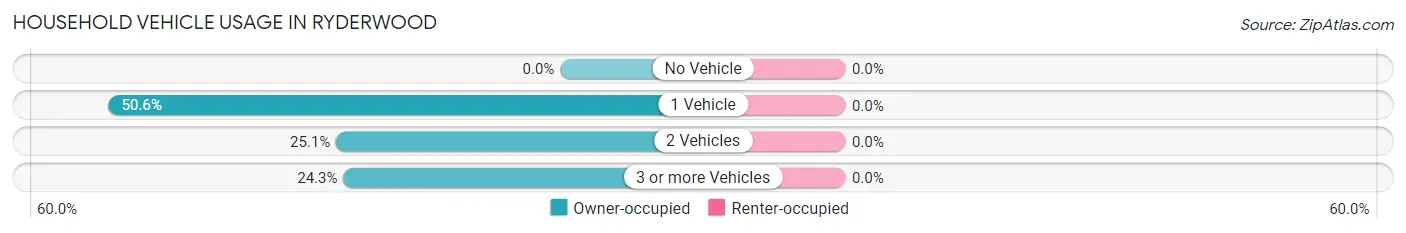
| Vehicles per Household | Owner-occupied | Renter-occupied |
| No Vehicle | 0 (0.0%) | 0 (0.0%) |
| 1 Vehicle | 127 (50.6%) | 0 (0.0%) |
| 2 Vehicles | 63 (25.1%) | 0 (0.0%) |
| 3 or more Vehicles | 61 (24.3%) | 0 (0.0%) |
| Total | 251 (100.0%) | 0 (0.0%) |
Real Estate & Mortgages in Ryderwood
Real Estate and Mortgage Overview in Ryderwood
| Characteristic | Without Mortgage | With Mortgage |
| Housing Units | 33 | 218 |
| Median Property Value | $225,000 | $165,600 |
| Median Household Income | $61,023 | $0 |
| Monthly Housing Costs | $425 | $0 |
| Real Estate Taxes | $2,250 | $0 |
Property Value by Mortgage Status in Ryderwood
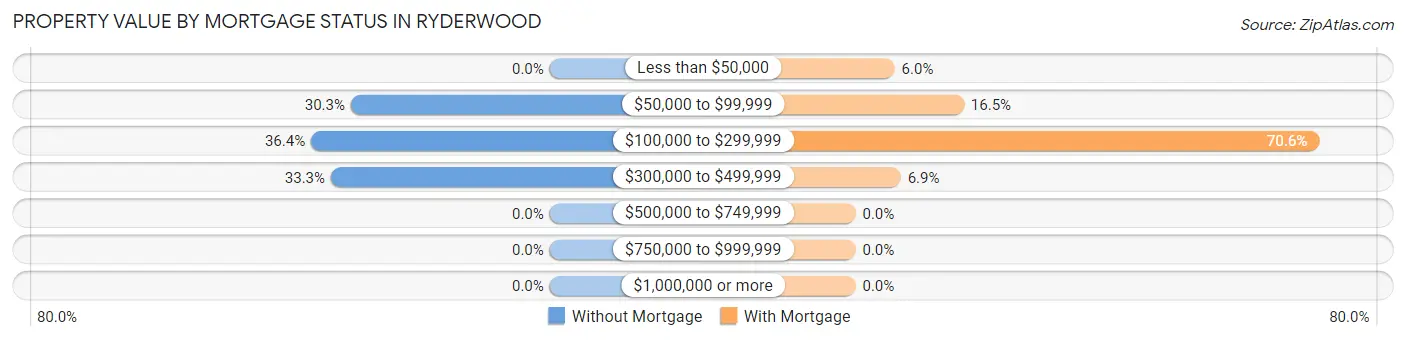
| Property Value | Without Mortgage | With Mortgage |
| Less than $50,000 | 0 (0.0%) | 13 (6.0%) |
| $50,000 to $99,999 | 10 (30.3%) | 36 (16.5%) |
| $100,000 to $299,999 | 12 (36.4%) | 154 (70.6%) |
| $300,000 to $499,999 | 11 (33.3%) | 15 (6.9%) |
| $500,000 to $749,999 | 0 (0.0%) | 0 (0.0%) |
| $750,000 to $999,999 | 0 (0.0%) | 0 (0.0%) |
| $1,000,000 or more | 0 (0.0%) | 0 (0.0%) |
| Total | 33 (100.0%) | 218 (100.0%) |
Household Income by Mortgage Status in Ryderwood
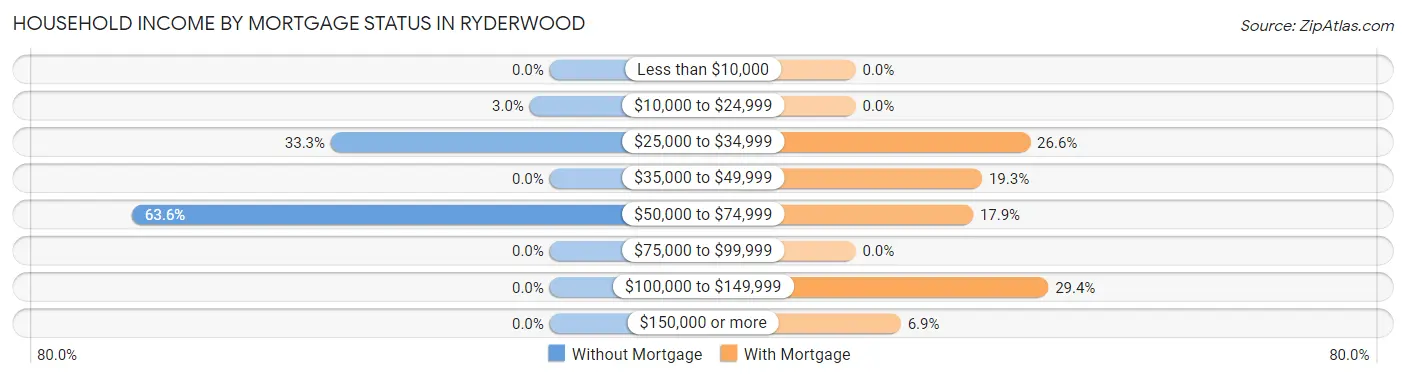
| Household Income | Without Mortgage | With Mortgage |
| Less than $10,000 | 0 (0.0%) | 0 (0.0%) |
| $10,000 to $24,999 | 1 (3.0%) | 0 (0.0%) |
| $25,000 to $34,999 | 11 (33.3%) | 58 (26.6%) |
| $35,000 to $49,999 | 0 (0.0%) | 42 (19.3%) |
| $50,000 to $74,999 | 21 (63.6%) | 39 (17.9%) |
| $75,000 to $99,999 | 0 (0.0%) | 0 (0.0%) |
| $100,000 to $149,999 | 0 (0.0%) | 64 (29.4%) |
| $150,000 or more | 0 (0.0%) | 15 (6.9%) |
| Total | 33 (100.0%) | 218 (100.0%) |
Property Value to Household Income Ratio in Ryderwood
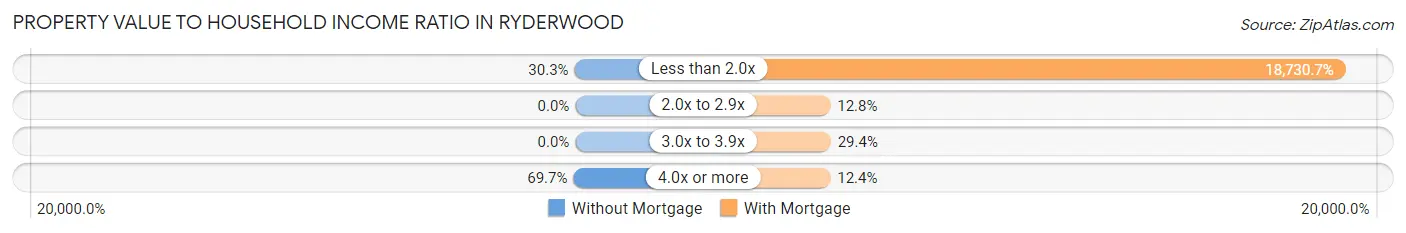
| Value-to-Income Ratio | Without Mortgage | With Mortgage |
| Less than 2.0x | 10 (30.3%) | 40,833 (18,730.7%) |
| 2.0x to 2.9x | 0 (0.0%) | 28 (12.8%) |
| 3.0x to 3.9x | 0 (0.0%) | 64 (29.4%) |
| 4.0x or more | 23 (69.7%) | 27 (12.4%) |
| Total | 33 (100.0%) | 218 (100.0%) |
Real Estate Taxes by Mortgage Status in Ryderwood
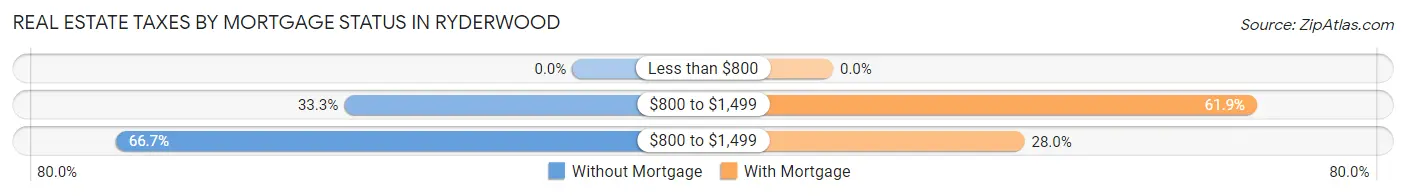
| Property Taxes | Without Mortgage | With Mortgage |
| Less than $800 | 0 (0.0%) | 0 (0.0%) |
| $800 to $1,499 | 11 (33.3%) | 135 (61.9%) |
| $800 to $1,499 | 22 (66.7%) | 61 (28.0%) |
| Total | 33 (100.0%) | 218 (100.0%) |
Health & Disability in Ryderwood
Health Insurance Coverage by Age in Ryderwood
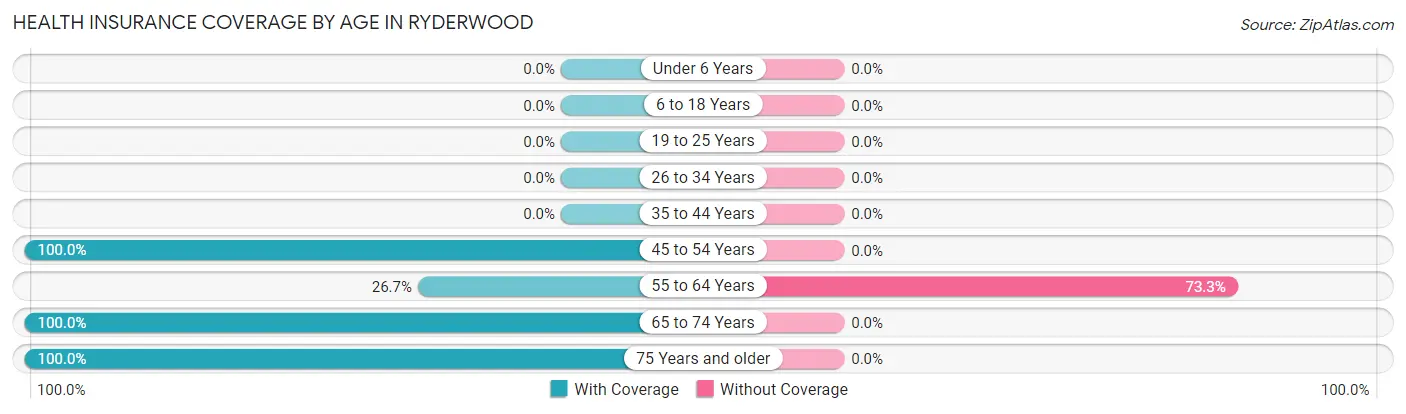
| Age Bracket | With Coverage | Without Coverage |
| Under 6 Years | 0 (0.0%) | 0 (0.0%) |
| 6 to 18 Years | 0 (0.0%) | 0 (0.0%) |
| 19 to 25 Years | 0 (0.0%) | 0 (0.0%) |
| 26 to 34 Years | 0 (0.0%) | 0 (0.0%) |
| 35 to 44 Years | 0 (0.0%) | 0 (0.0%) |
| 45 to 54 Years | 16 (100.0%) | 0 (0.0%) |
| 55 to 64 Years | 8 (26.7%) | 22 (73.3%) |
| 65 to 74 Years | 205 (100.0%) | 0 (0.0%) |
| 75 Years and older | 174 (100.0%) | 0 (0.0%) |
| Total | 403 (94.8%) | 22 (5.2%) |
Health Insurance Coverage by Citizenship Status in Ryderwood
| Citizenship Status | With Coverage | Without Coverage |
| Native Born | 0 (0.0%) | 0 (0.0%) |
| Foreign Born, Citizen | 0 (0.0%) | 0 (0.0%) |
| Foreign Born, not a Citizen | 0 (0.0%) | 0 (0.0%) |
Health Insurance Coverage by Household Income in Ryderwood
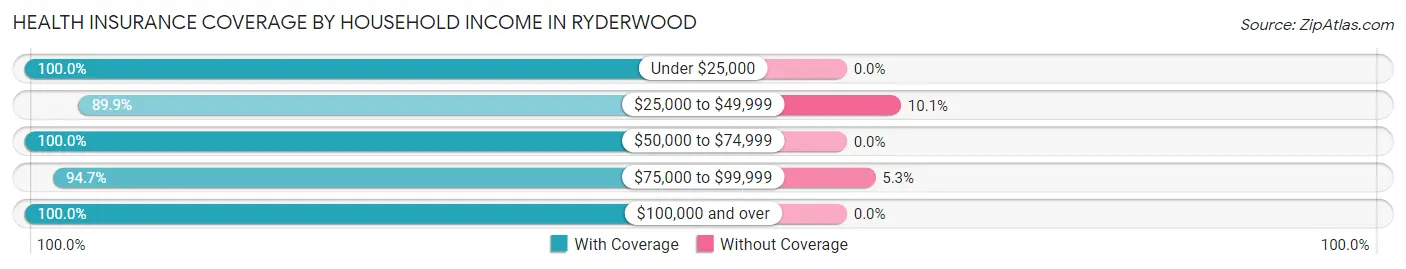
| Household Income | With Coverage | Without Coverage |
| Under $25,000 | 72 (100.0%) | 0 (0.0%) |
| $25,000 to $49,999 | 133 (89.9%) | 15 (10.1%) |
| $50,000 to $74,999 | 47 (100.0%) | 0 (0.0%) |
| $75,000 to $99,999 | 124 (94.7%) | 7 (5.3%) |
| $100,000 and over | 27 (100.0%) | 0 (0.0%) |
Public vs Private Health Insurance Coverage by Age in Ryderwood
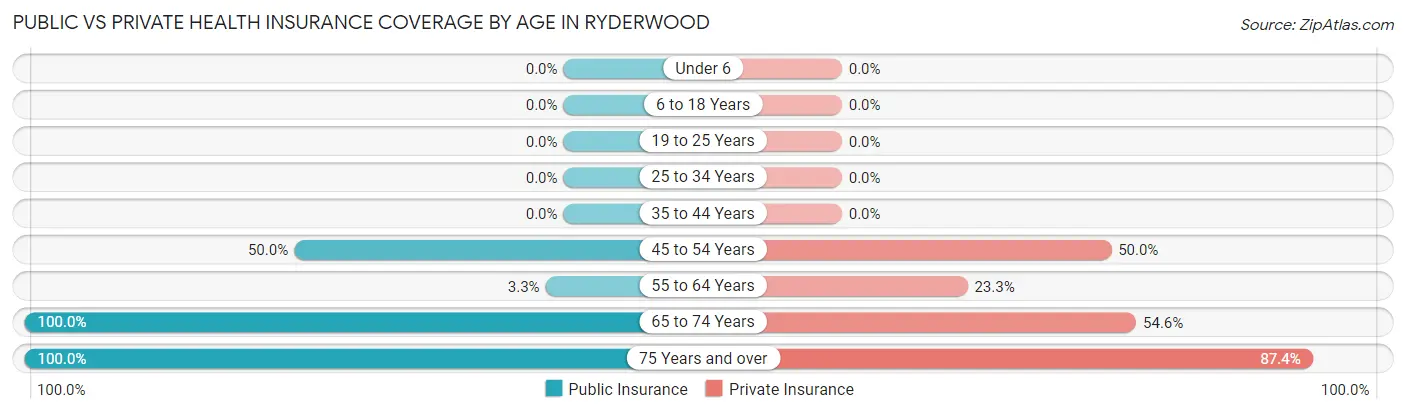
| Age Bracket | Public Insurance | Private Insurance |
| Under 6 | 0 (0.0%) | 0 (0.0%) |
| 6 to 18 Years | 0 (0.0%) | 0 (0.0%) |
| 19 to 25 Years | 0 (0.0%) | 0 (0.0%) |
| 25 to 34 Years | 0 (0.0%) | 0 (0.0%) |
| 35 to 44 Years | 0 (0.0%) | 0 (0.0%) |
| 45 to 54 Years | 8 (50.0%) | 8 (50.0%) |
| 55 to 64 Years | 1 (3.3%) | 7 (23.3%) |
| 65 to 74 Years | 205 (100.0%) | 112 (54.6%) |
| 75 Years and over | 174 (100.0%) | 152 (87.4%) |
| Total | 388 (91.3%) | 279 (65.6%) |
Disability Status by Sex by Age in Ryderwood
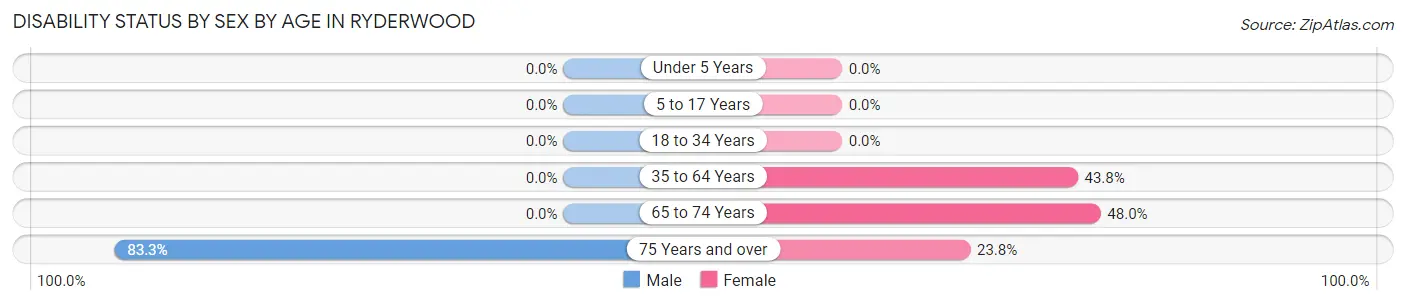
| Age Bracket | Male | Female |
| Under 5 Years | 0 (0.0%) | 0 (0.0%) |
| 5 to 17 Years | 0 (0.0%) | 0 (0.0%) |
| 18 to 34 Years | 0 (0.0%) | 0 (0.0%) |
| 35 to 64 Years | 0 (0.0%) | 7 (43.8%) |
| 65 to 74 Years | 0 (0.0%) | 72 (48.0%) |
| 75 Years and over | 75 (83.3%) | 20 (23.8%) |
Disability Class by Sex by Age in Ryderwood
Disability Class: Hearing Difficulty
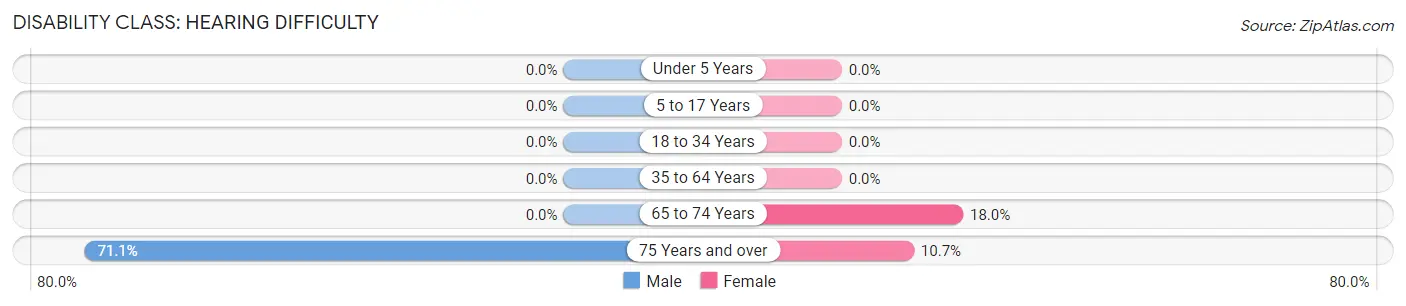
| Age Bracket | Male | Female |
| Under 5 Years | 0 (0.0%) | 0 (0.0%) |
| 5 to 17 Years | 0 (0.0%) | 0 (0.0%) |
| 18 to 34 Years | 0 (0.0%) | 0 (0.0%) |
| 35 to 64 Years | 0 (0.0%) | 0 (0.0%) |
| 65 to 74 Years | 0 (0.0%) | 27 (18.0%) |
| 75 Years and over | 64 (71.1%) | 9 (10.7%) |
Disability Class: Vision Difficulty
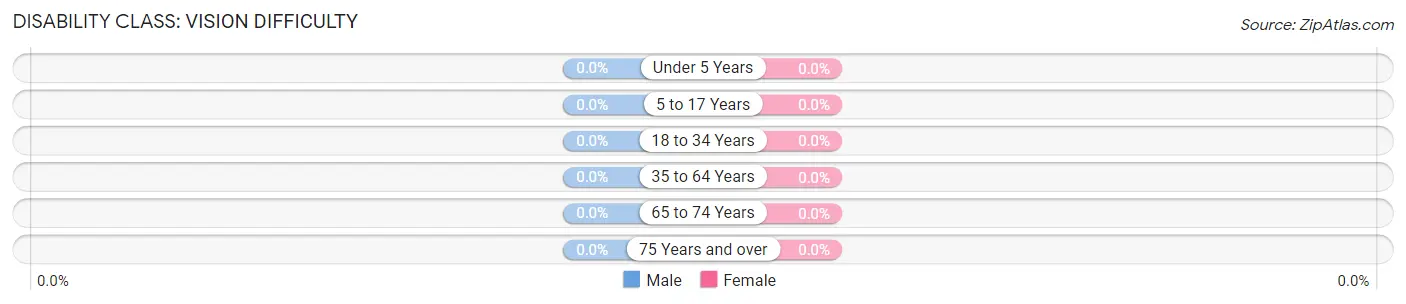
| Age Bracket | Male | Female |
| Under 5 Years | 0 (0.0%) | 0 (0.0%) |
| 5 to 17 Years | 0 (0.0%) | 0 (0.0%) |
| 18 to 34 Years | 0 (0.0%) | 0 (0.0%) |
| 35 to 64 Years | 0 (0.0%) | 0 (0.0%) |
| 65 to 74 Years | 0 (0.0%) | 0 (0.0%) |
| 75 Years and over | 0 (0.0%) | 0 (0.0%) |
Disability Class: Cognitive Difficulty
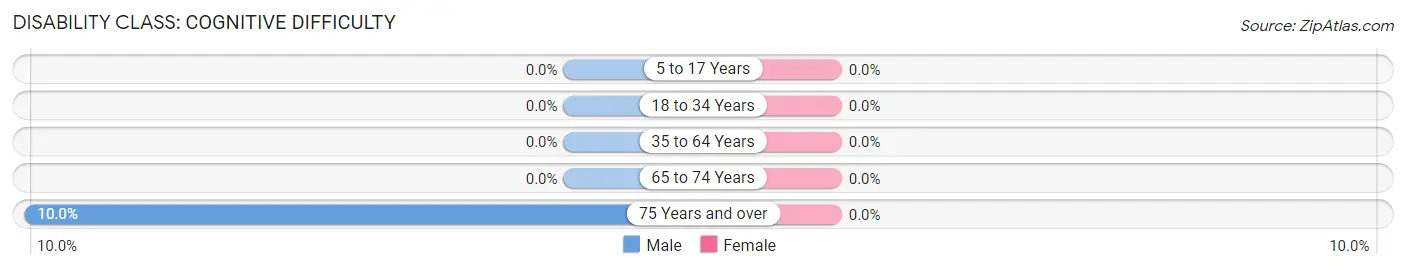
| Age Bracket | Male | Female |
| 5 to 17 Years | 0 (0.0%) | 0 (0.0%) |
| 18 to 34 Years | 0 (0.0%) | 0 (0.0%) |
| 35 to 64 Years | 0 (0.0%) | 0 (0.0%) |
| 65 to 74 Years | 0 (0.0%) | 0 (0.0%) |
| 75 Years and over | 9 (10.0%) | 0 (0.0%) |
Disability Class: Ambulatory Difficulty
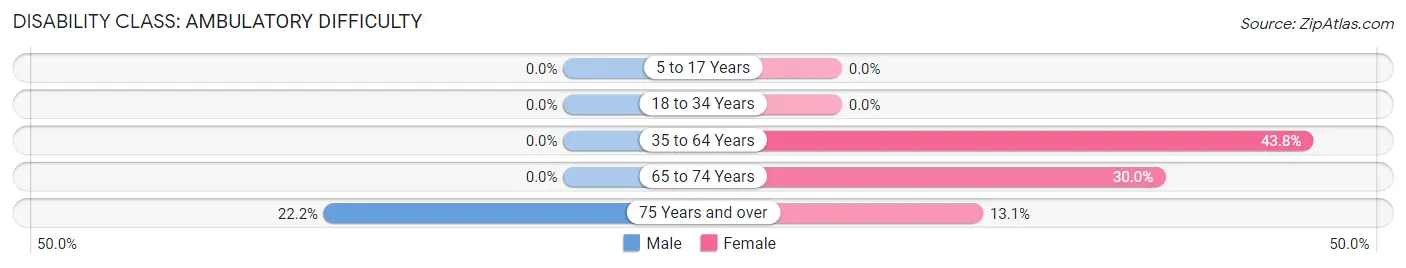
| Age Bracket | Male | Female |
| 5 to 17 Years | 0 (0.0%) | 0 (0.0%) |
| 18 to 34 Years | 0 (0.0%) | 0 (0.0%) |
| 35 to 64 Years | 0 (0.0%) | 7 (43.8%) |
| 65 to 74 Years | 0 (0.0%) | 45 (30.0%) |
| 75 Years and over | 20 (22.2%) | 11 (13.1%) |
Disability Class: Self-Care Difficulty
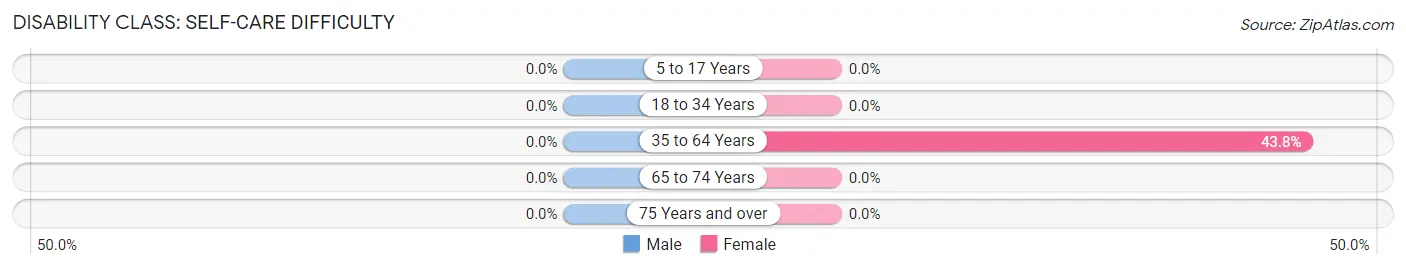
| Age Bracket | Male | Female |
| 5 to 17 Years | 0 (0.0%) | 0 (0.0%) |
| 18 to 34 Years | 0 (0.0%) | 0 (0.0%) |
| 35 to 64 Years | 0 (0.0%) | 7 (43.8%) |
| 65 to 74 Years | 0 (0.0%) | 0 (0.0%) |
| 75 Years and over | 0 (0.0%) | 0 (0.0%) |
Technology Access in Ryderwood
Computing Device Access in Ryderwood
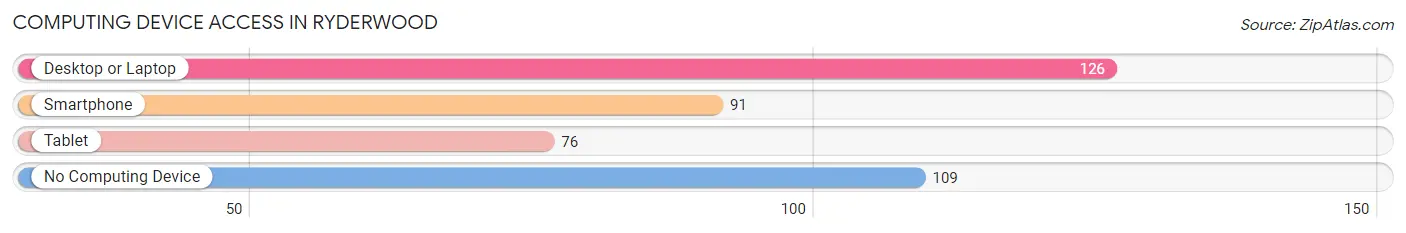
| Device Type | # Households | % Households |
| Desktop or Laptop | 126 | 50.2% |
| Smartphone | 91 | 36.2% |
| Tablet | 76 | 30.3% |
| No Computing Device | 109 | 43.4% |
| Total | 251 | 100.0% |
Internet Access in Ryderwood
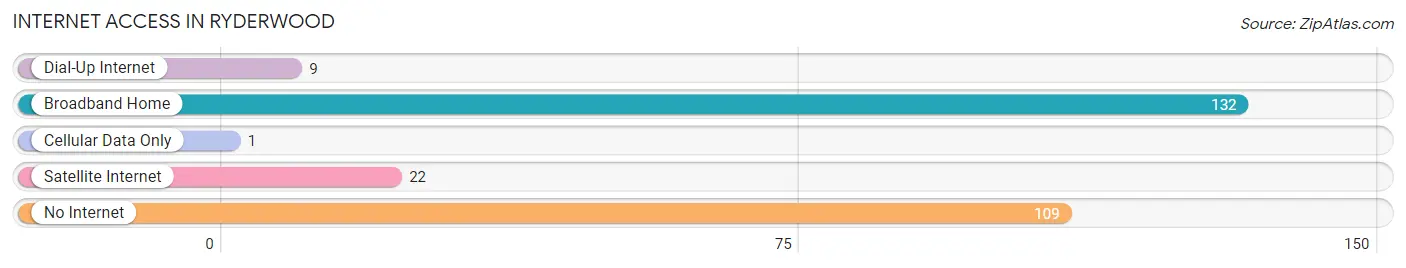
| Internet Type | # Households | % Households |
| Dial-Up Internet | 9 | 3.6% |
| Broadband Home | 132 | 52.6% |
| Cellular Data Only | 1 | 0.4% |
| Satellite Internet | 22 | 8.8% |
| No Internet | 109 | 43.4% |
| Total | 251 | 100.0% |
Ryderwood Summary
Ryderwood is a small unincorporated community located in Cowlitz County, Washington, United States. It is situated on the banks of the Columbia River, approximately 20 miles east of Longview. The population of Ryderwood was estimated to be around 500 in 2020.
History
Ryderwood was founded in the early 1900s by the Ryder family, who had moved to the area from Wisconsin. The family purchased a large tract of land and began to develop it into a small community. The town was named after the Ryder family, and the first post office was established in 1909.
The town grew slowly over the years, and by the 1950s it had become a popular tourist destination. The town was known for its picturesque views of the Columbia River, and it was a popular spot for fishing and camping.
In the late 1960s, Ryderwood began to decline as the timber industry in the area began to decline. The town was hit hard by the recession of the 1970s, and many of the businesses in the town closed.
Geography
Ryderwood is located in Cowlitz County, Washington, on the banks of the Columbia River. The town is situated at an elevation of approximately 200 feet above sea level. The town is surrounded by forests and mountains, and the climate is mild and temperate.
The town is located approximately 20 miles east of Longview, and is accessible by car via Highway 4. The nearest major airport is Portland International Airport, which is located approximately 90 miles away.
Economy
The economy of Ryderwood is largely based on tourism. The town is a popular destination for fishing, camping, and other outdoor activities. There are also several small businesses in the town, including a grocery store, a hardware store, and a few restaurants.
Demographics
As of the 2020 census, the population of Ryderwood was estimated to be around 500. The racial makeup of the town was 94.2% White, 0.8% African American, 0.4% Native American, 0.4% Asian, 0.2% Pacific Islander, and 3.8% from other races. The median household income in Ryderwood was $41,250, and the median age was 44.
Conclusion
Ryderwood is a small unincorporated community located in Cowlitz County, Washington. It was founded in the early 1900s by the Ryder family, and has since become a popular tourist destination. The town is surrounded by forests and mountains, and the economy is largely based on tourism. The population of Ryderwood was estimated to be around 500 in 2020, and the median household income was $41,250.
Common Questions
What is the Total Population of Ryderwood?
Total Population of Ryderwood is 425.
What is the Total Male Population of Ryderwood?
Total Male Population of Ryderwood is 175.
What is the Total Female Population of Ryderwood?
Total Female Population of Ryderwood is 250.
What is the Ratio of Males per 100 Females in Ryderwood?
There are 70.00 Males per 100 Females in Ryderwood.
What is the Ratio of Females per 100 Males in Ryderwood?
There are 142.86 Females per 100 Males in Ryderwood.
What is the Median Population Age in Ryderwood?
Median Population Age in Ryderwood is 72.2 Years.
What is the Average Family Size in Ryderwood
Average Family Size in Ryderwood is 2.1 People.
What is the Average Household Size in Ryderwood
Average Household Size in Ryderwood is 1.7 People.
What is Per Capita Income in Ryderwood?
Per Capita income in Ryderwood is $30,694.
What is the Median Family Income in Ryderwood?
Median Family Income in Ryderwood is $64,250.
What is the Median Household income in Ryderwood?
Median Household Income in Ryderwood is $41,250.
What is Income or Wage Gap in Ryderwood?
Income or Wage Gap in Ryderwood is 88.3%.
Women in Ryderwood earn 11.7 cents for every dollar earned by a man.
What is Inequality or Gini Index in Ryderwood?
Inequality or Gini Index in Ryderwood is 0.33.
How Large is the Labor Force in Ryderwood?
There are 59 People in the Labor Forcein in Ryderwood.
What is the Percentage of People in the Labor Force in Ryderwood?
13.9% of People are in the Labor Force in Ryderwood.