Beaux Arts Village, WA
Beaux Arts Village Map
Beaux Arts Village Overview
258
TOTAL POPULATION
128
MALE POPULATION
130
FEMALE POPULATION
98.46
MALES / 100 FEMALES
101.56
FEMALES / 100 MALES
53.0
MEDIAN AGE
2.9
AVG FAMILY SIZE
2.7
AVG HOUSEHOLD SIZE
$126,204
PER CAPITA INCOME
$250,001
AVG FAMILY INCOME
$250,001
AVG HOUSEHOLD INCOME
63.9%
WAGE / INCOME GAP [ % ]
36.1¢/ $1
WAGE / INCOME GAP [ $ ]
0.45
INEQUALITY / GINI INDEX
146
LABOR FORCE [ PEOPLE ]
64.0%
PERCENT IN LABOR FORCE
5.5%
UNEMPLOYMENT RATE
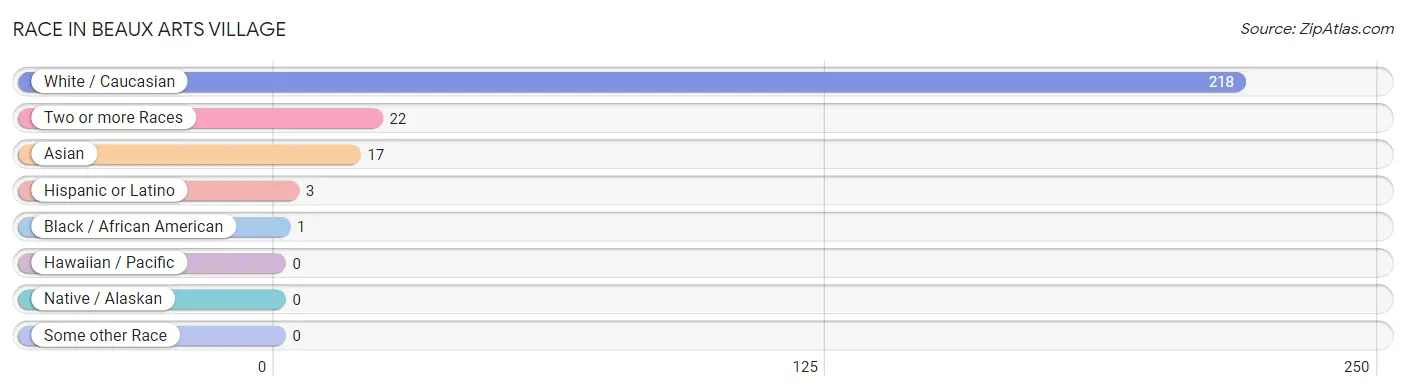
Race in Beaux Arts Village
The most populous races in Beaux Arts Village are White / Caucasian (218 | 84.5%), Two or more Races (22 | 8.5%), and Asian (17 | 6.6%).
| Race | # Population | % Population |
| Asian | 17 | 6.6% |
| Black / African American | 1 | 0.4% |
| Hawaiian / Pacific | 0 | 0.0% |
| Hispanic or Latino | 3 | 1.2% |
| Native / Alaskan | 0 | 0.0% |
| White / Caucasian | 218 | 84.5% |
| Two or more Races | 22 | 8.5% |
| Some other Race | 0 | 0.0% |
| Total | 258 | 100.0% |
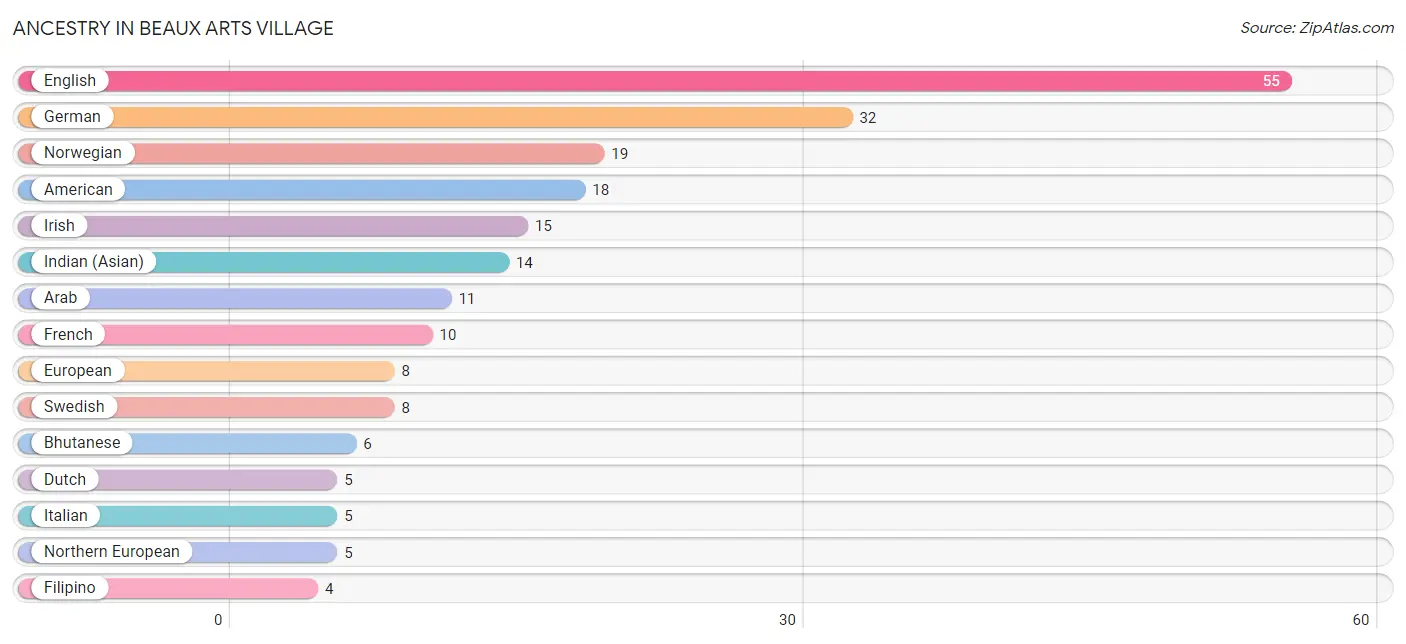
Ancestry in Beaux Arts Village
The most populous ancestries reported in Beaux Arts Village are English (55 | 21.3%), German (32 | 12.4%), Norwegian (19 | 7.4%), American (18 | 7.0%), and Irish (15 | 5.8%), together accounting for 53.9% of all Beaux Arts Village residents.
| Ancestry | # Population | % Population |
| American | 18 | 7.0% |
| Apache | 2 | 0.8% |
| Arab | 11 | 4.3% |
| Austrian | 3 | 1.2% |
| Bhutanese | 6 | 2.3% |
| Croatian | 2 | 0.8% |
| Danish | 3 | 1.2% |
| Dutch | 5 | 1.9% |
| Eastern European | 1 | 0.4% |
| Egyptian | 2 | 0.8% |
| English | 55 | 21.3% |
| Ethiopian | 1 | 0.4% |
| European | 8 | 3.1% |
| Filipino | 4 | 1.5% |
| Finnish | 3 | 1.2% |
| French | 10 | 3.9% |
| German | 32 | 12.4% |
| Hungarian | 1 | 0.4% |
| Icelander | 1 | 0.4% |
| Indian (Asian) | 14 | 5.4% |
| Irish | 15 | 5.8% |
| Italian | 5 | 1.9% |
| Korean | 3 | 1.2% |
| Lebanese | 4 | 1.5% |
| Mexican | 2 | 0.8% |
| Native Hawaiian | 1 | 0.4% |
| Northern European | 5 | 1.9% |
| Norwegian | 19 | 7.4% |
| Okinawan | 1 | 0.4% |
| Polish | 1 | 0.4% |
| Scandinavian | 1 | 0.4% |
| Scotch-Irish | 1 | 0.4% |
| Scottish | 3 | 1.2% |
| South African | 2 | 0.8% |
| Spaniard | 1 | 0.4% |
| Subsaharan African | 3 | 1.2% |
| Swedish | 8 | 3.1% |
| Swiss | 1 | 0.4% |
| Syrian | 4 | 1.5% |
| Welsh | 3 | 1.2% | View All 40 Rows |
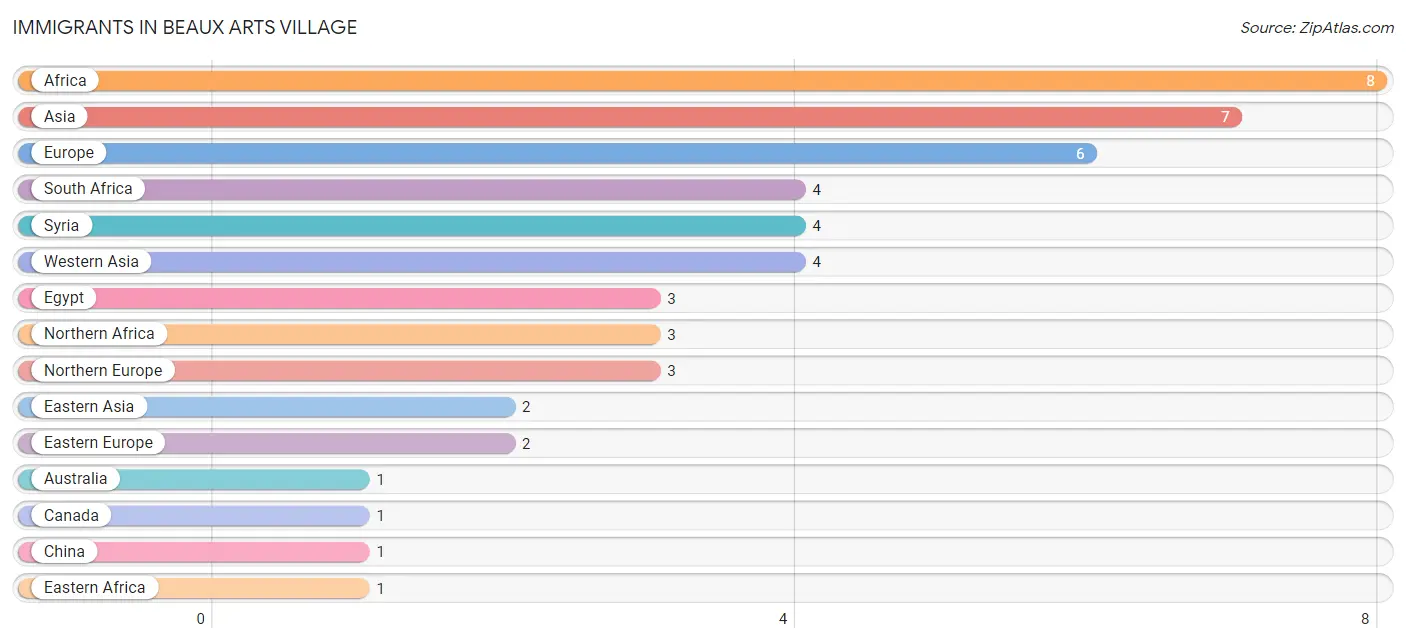
Immigrants in Beaux Arts Village
The most numerous immigrant groups reported in Beaux Arts Village came from Africa (8 | 3.1%), Asia (7 | 2.7%), Europe (6 | 2.3%), South Africa (4 | 1.5%), and Syria (4 | 1.5%), together accounting for 11.2% of all Beaux Arts Village residents.
| Immigration Origin | # Population | % Population |
| Africa | 8 | 3.1% |
| Asia | 7 | 2.7% |
| Australia | 1 | 0.4% |
| Canada | 1 | 0.4% |
| China | 1 | 0.4% |
| Eastern Africa | 1 | 0.4% |
| Eastern Asia | 2 | 0.8% |
| Eastern Europe | 2 | 0.8% |
| Egypt | 3 | 1.2% |
| Ethiopia | 1 | 0.4% |
| Europe | 6 | 2.3% |
| Hong Kong | 1 | 0.4% |
| Japan | 1 | 0.4% |
| Northern Africa | 3 | 1.2% |
| Northern Europe | 3 | 1.2% |
| Oceania | 1 | 0.4% |
| Poland | 1 | 0.4% |
| Russia | 1 | 0.4% |
| Singapore | 1 | 0.4% |
| South Africa | 4 | 1.5% |
| South Eastern Asia | 1 | 0.4% |
| Switzerland | 1 | 0.4% |
| Syria | 4 | 1.5% |
| Western Asia | 4 | 1.5% |
| Western Europe | 1 | 0.4% | View All 25 Rows |
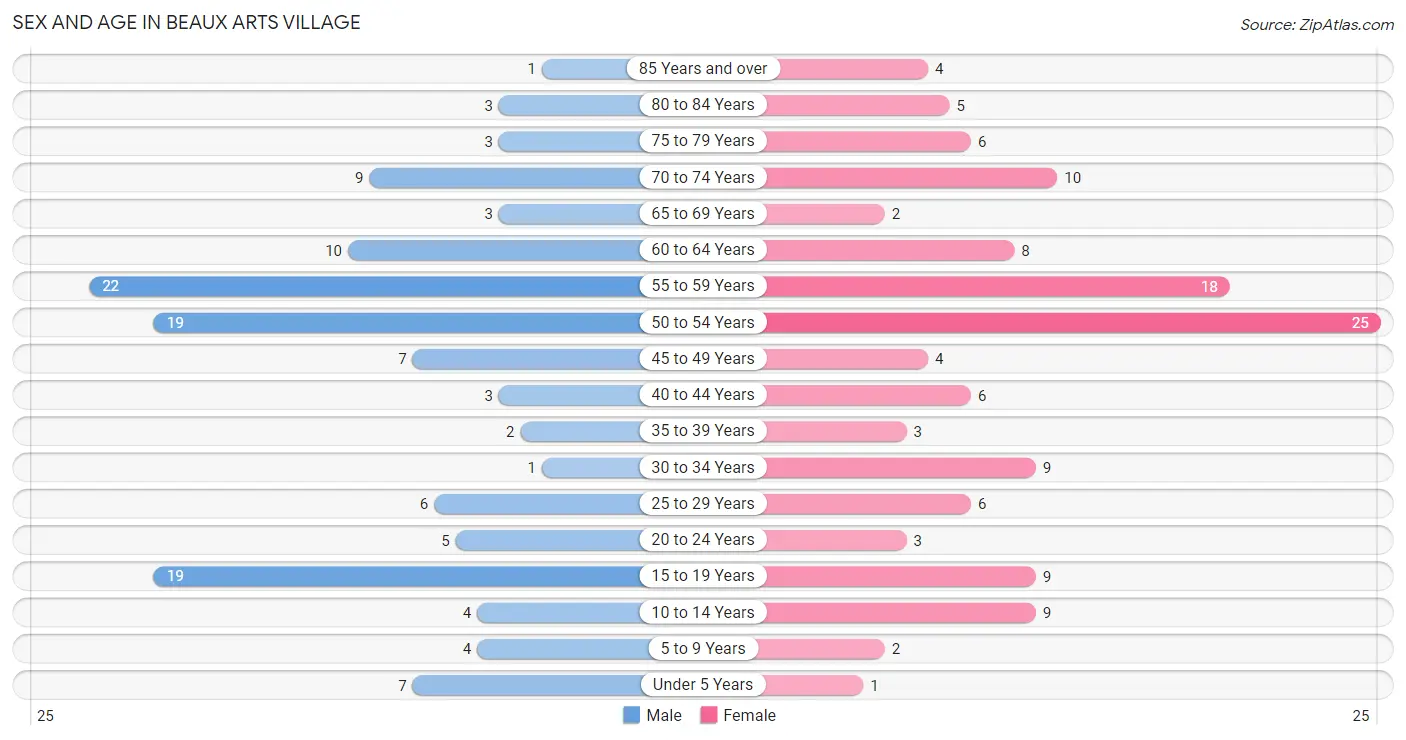
Sex and Age in Beaux Arts Village
Sex and Age in Beaux Arts Village
The most populous age groups in Beaux Arts Village are 55 to 59 Years (22 | 17.2%) for men and 50 to 54 Years (25 | 19.2%) for women.
| Age Bracket | Male | Female |
| Under 5 Years | 7 (5.5%) | 1 (0.8%) |
| 5 to 9 Years | 4 (3.1%) | 2 (1.5%) |
| 10 to 14 Years | 4 (3.1%) | 9 (6.9%) |
| 15 to 19 Years | 19 (14.8%) | 9 (6.9%) |
| 20 to 24 Years | 5 (3.9%) | 3 (2.3%) |
| 25 to 29 Years | 6 (4.7%) | 6 (4.6%) |
| 30 to 34 Years | 1 (0.8%) | 9 (6.9%) |
| 35 to 39 Years | 2 (1.6%) | 3 (2.3%) |
| 40 to 44 Years | 3 (2.3%) | 6 (4.6%) |
| 45 to 49 Years | 7 (5.5%) | 4 (3.1%) |
| 50 to 54 Years | 19 (14.8%) | 25 (19.2%) |
| 55 to 59 Years | 22 (17.2%) | 18 (13.9%) |
| 60 to 64 Years | 10 (7.8%) | 8 (6.1%) |
| 65 to 69 Years | 3 (2.3%) | 2 (1.5%) |
| 70 to 74 Years | 9 (7.0%) | 10 (7.7%) |
| 75 to 79 Years | 3 (2.3%) | 6 (4.6%) |
| 80 to 84 Years | 3 (2.3%) | 5 (3.8%) |
| 85 Years and over | 1 (0.8%) | 4 (3.1%) |
| Total | 128 (100.0%) | 130 (100.0%) |
Families and Households in Beaux Arts Village
Median Family Size in Beaux Arts Village
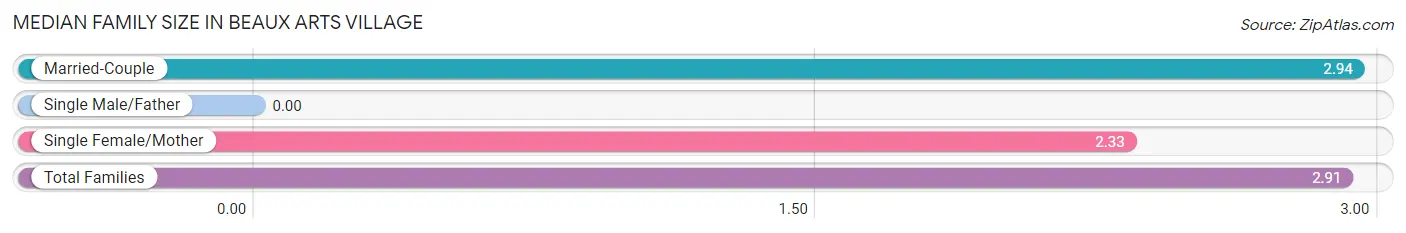
| Family Type | # Families | Family Size |
| Married-Couple | 78 (96.3%) | 2.94 |
| Single Male/Father | 0 (0.0%) | - |
| Single Female/Mother | 3 (3.7%) | 2.33 |
| Total Families | 81 (100.0%) | 2.91 |
Median Household Size in Beaux Arts Village
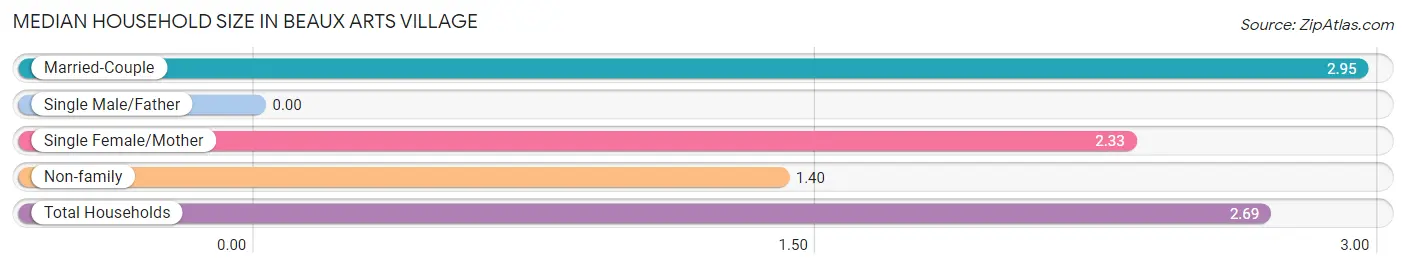
| Household Type | # Households | Household Size |
| Married-Couple | 78 (81.2%) | 2.95 |
| Single Male/Father | 0 (0.0%) | - |
| Single Female/Mother | 3 (3.1%) | 2.33 |
| Non-family | 15 (15.6%) | 1.40 |
| Total Households | 96 (100.0%) | 2.69 |
Household Size by Marriage Status in Beaux Arts Village
Out of a total of 96 households in Beaux Arts Village, 81 (84.4%) are family households, while 15 (15.6%) are nonfamily households. The most numerous type of family households are 3-person households, comprising 33, and the most common type of nonfamily households are 1-person households, comprising 12.
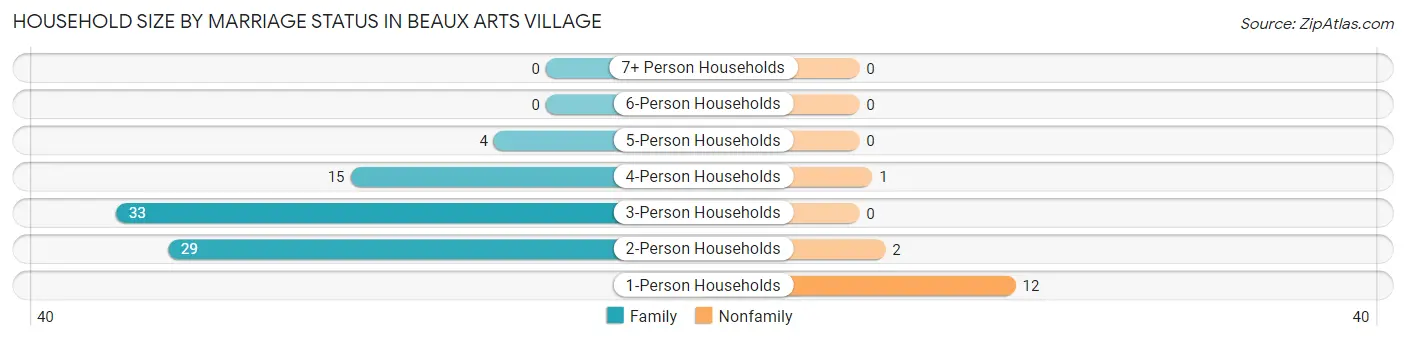
| Household Size | Family Households | Nonfamily Households |
| 1-Person Households | - | 12 (12.5%) |
| 2-Person Households | 29 (30.2%) | 2 (2.1%) |
| 3-Person Households | 33 (34.4%) | 0 (0.0%) |
| 4-Person Households | 15 (15.6%) | 1 (1.0%) |
| 5-Person Households | 4 (4.2%) | 0 (0.0%) |
| 6-Person Households | 0 (0.0%) | 0 (0.0%) |
| 7+ Person Households | 0 (0.0%) | 0 (0.0%) |
| Total | 81 (84.4%) | 15 (15.6%) |
Female Fertility in Beaux Arts Village
Fertility by Age in Beaux Arts Village
Average fertility rate in Beaux Arts Village is 48.0 births per 1,000 women. Women in the age bracket of 35 to 50 years have the highest fertility rate with 133.0 births per 1,000 women. Women in the age bracket of 35 to 50 years acount for 100.0% of all women with births.
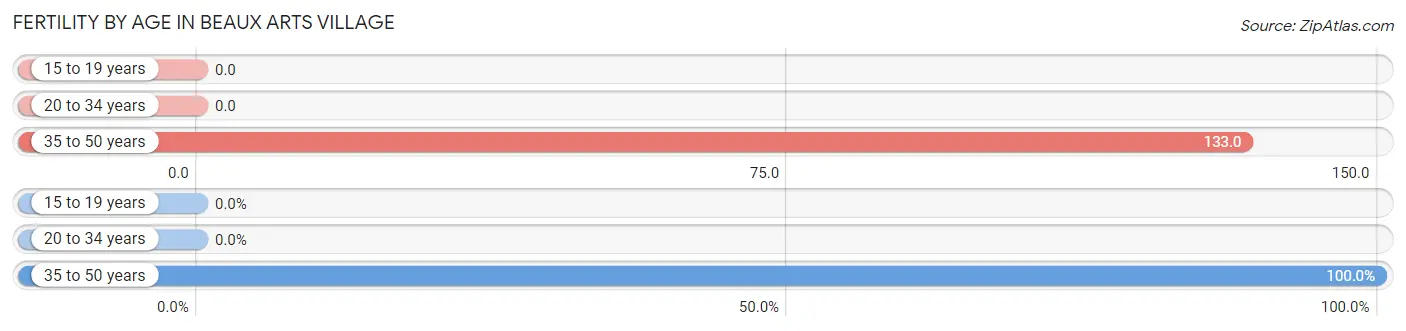
| Age Bracket | Women with Births | Births / 1,000 Women |
| 15 to 19 years | 0 (0.0%) | 0.0 |
| 20 to 34 years | 0 (0.0%) | 0.0 |
| 35 to 50 years | 2 (100.0%) | 133.0 |
| Total | 2 (100.0%) | 48.0 |
Fertility by Age by Marriage Status in Beaux Arts Village
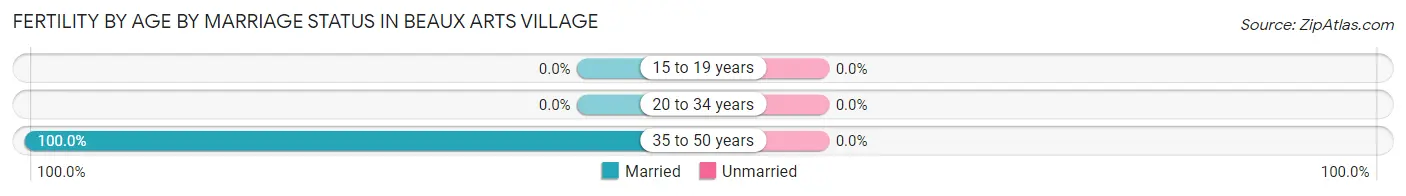
| Age Bracket | Married | Unmarried |
| 15 to 19 years | 0 (0.0%) | 0 (0.0%) |
| 20 to 34 years | 0 (0.0%) | 0 (0.0%) |
| 35 to 50 years | 2 (100.0%) | 0 (0.0%) |
| Total | 2 (100.0%) | 0 (0.0%) |
Fertility by Education in Beaux Arts Village
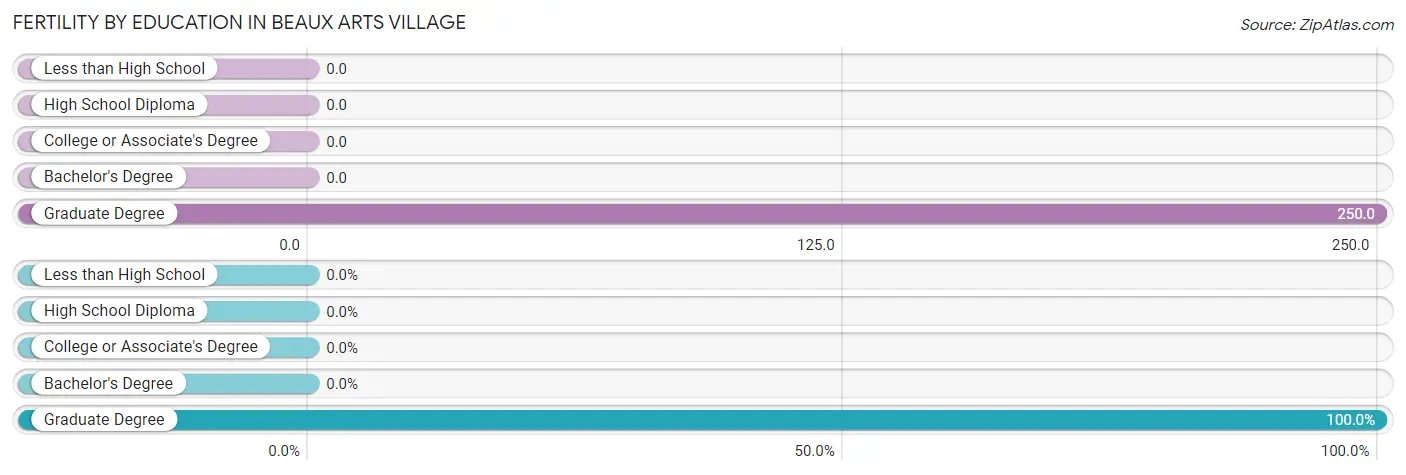
| Educational Attainment | Women with Births | Births / 1,000 Women |
| Less than High School | 0 (0.0%) | 0.0 |
| High School Diploma | 0 (0.0%) | 0.0 |
| College or Associate's Degree | 0 (0.0%) | 0.0 |
| Bachelor's Degree | 0 (0.0%) | 0.0 |
| Graduate Degree | 2 (100.0%) | 250.0 |
| Total | 2 (100.0%) | 48.0 |
Fertility by Education by Marriage Status in Beaux Arts Village
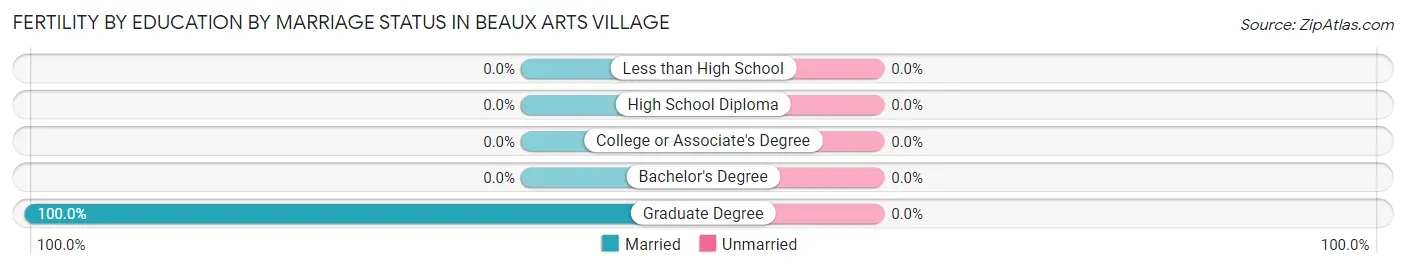
| Educational Attainment | Married | Unmarried |
| Less than High School | 0 (0.0%) | 0 (0.0%) |
| High School Diploma | 0 (0.0%) | 0 (0.0%) |
| College or Associate's Degree | 0 (0.0%) | 0 (0.0%) |
| Bachelor's Degree | 0 (0.0%) | 0 (0.0%) |
| Graduate Degree | 2 (100.0%) | 0 (0.0%) |
| Total | 2 (100.0%) | 0 (0.0%) |
Income in Beaux Arts Village
Income Overview in Beaux Arts Village
Per Capita Income in Beaux Arts Village is $126,204, while median incomes of families and households are $250,001 and $250,001 respectively.
| Characteristic | Number | Measure |
| Per Capita Income | 258 | $126,204 |
| Median Family Income | 81 | $250,001 |
| Mean Family Income | 81 | $406,635 |
| Median Household Income | 96 | $250,001 |
| Mean Household Income | 96 | $353,489 |
| Income Deficit | 81 | $0 |
| Wage / Income Gap (%) | 258 | 63.91% |
| Wage / Income Gap ($) | 258 | 36.09¢ per $1 |
| Gini / Inequality Index | 258 | 0.45 |
Earnings by Sex in Beaux Arts Village
Average Earnings in Beaux Arts Village are $95,625, $166,250 for men and $60,000 for women, a difference of 63.9%.
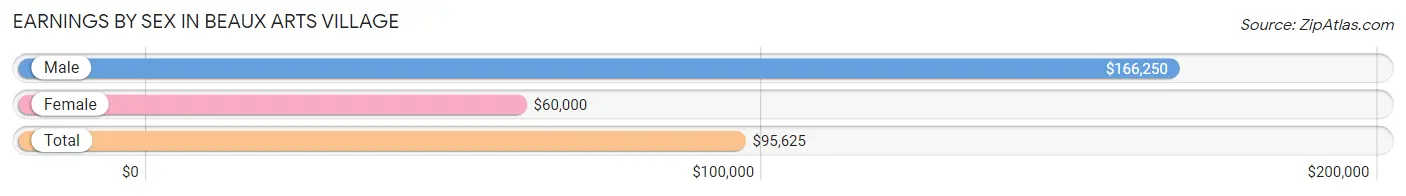
| Sex | Number | Average Earnings |
| Male | 83 (53.5%) | $166,250 |
| Female | 72 (46.5%) | $60,000 |
| Total | 155 (100.0%) | $95,625 |
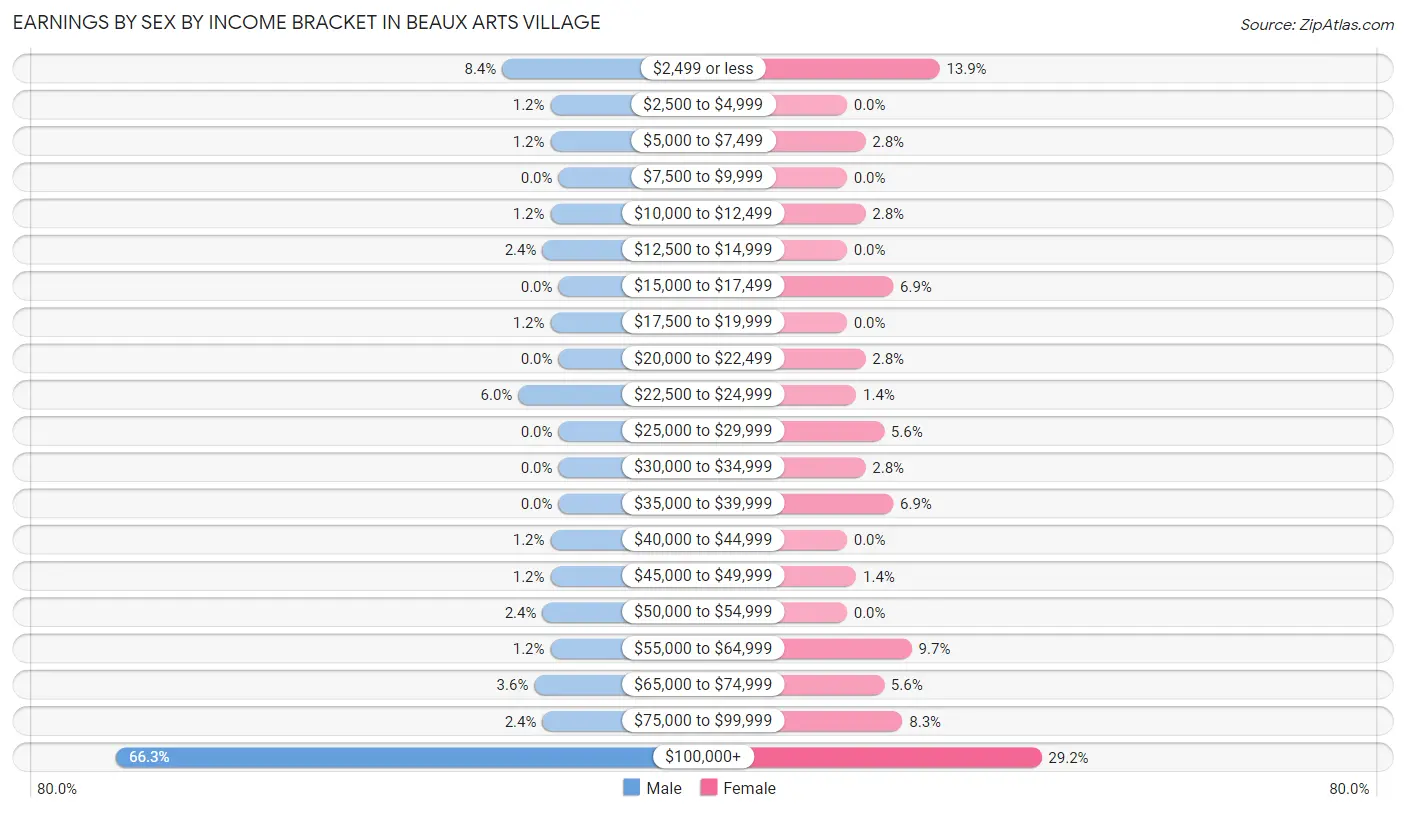
Earnings by Sex by Income Bracket in Beaux Arts Village
The most common earnings brackets in Beaux Arts Village are $100,000+ for men (55 | 66.3%) and $100,000+ for women (21 | 29.2%).
| Income | Male | Female |
| $2,499 or less | 7 (8.4%) | 10 (13.9%) |
| $2,500 to $4,999 | 1 (1.2%) | 0 (0.0%) |
| $5,000 to $7,499 | 1 (1.2%) | 2 (2.8%) |
| $7,500 to $9,999 | 0 (0.0%) | 0 (0.0%) |
| $10,000 to $12,499 | 1 (1.2%) | 2 (2.8%) |
| $12,500 to $14,999 | 2 (2.4%) | 0 (0.0%) |
| $15,000 to $17,499 | 0 (0.0%) | 5 (6.9%) |
| $17,500 to $19,999 | 1 (1.2%) | 0 (0.0%) |
| $20,000 to $22,499 | 0 (0.0%) | 2 (2.8%) |
| $22,500 to $24,999 | 5 (6.0%) | 1 (1.4%) |
| $25,000 to $29,999 | 0 (0.0%) | 4 (5.6%) |
| $30,000 to $34,999 | 0 (0.0%) | 2 (2.8%) |
| $35,000 to $39,999 | 0 (0.0%) | 5 (6.9%) |
| $40,000 to $44,999 | 1 (1.2%) | 0 (0.0%) |
| $45,000 to $49,999 | 1 (1.2%) | 1 (1.4%) |
| $50,000 to $54,999 | 2 (2.4%) | 0 (0.0%) |
| $55,000 to $64,999 | 1 (1.2%) | 7 (9.7%) |
| $65,000 to $74,999 | 3 (3.6%) | 4 (5.6%) |
| $75,000 to $99,999 | 2 (2.4%) | 6 (8.3%) |
| $100,000+ | 55 (66.3%) | 21 (29.2%) |
| Total | 83 (100.0%) | 72 (100.0%) |
Earnings by Sex by Educational Attainment in Beaux Arts Village
Average earnings in Beaux Arts Village are $231,250 for men and $62,250 for women, a difference of 73.1%. Men with an educational attainment of graduate degree enjoy the highest average annual earnings of $250,001, while those with bachelor's degree education earn the least with $227,500. Women with an educational attainment of bachelor's degree earn the most with the average annual earnings of $66,875, while those with college or associate's degree education have the smallest earnings of $38,125.
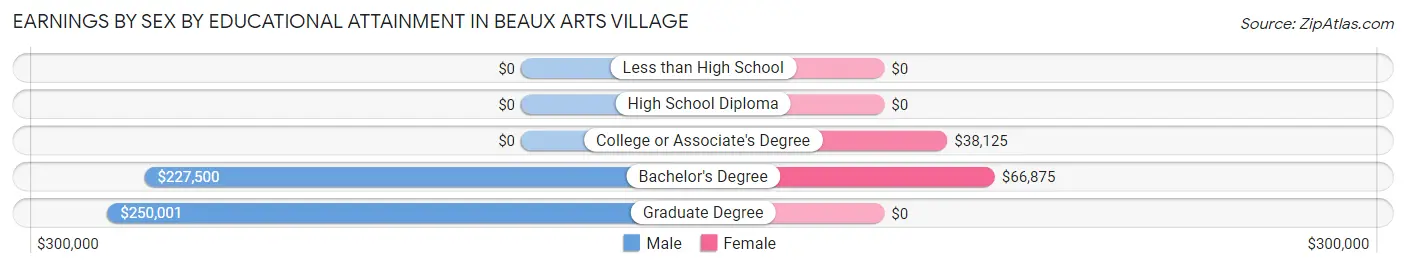
| Educational Attainment | Male Income | Female Income |
| Less than High School | - | - |
| High School Diploma | - | - |
| College or Associate's Degree | - | - |
| Bachelor's Degree | $227,500 | $66,875 |
| Graduate Degree | $250,001 | $0 |
| Total | $231,250 | $62,250 |
Family Income in Beaux Arts Village
Family Income Brackets in Beaux Arts Village
According to the Beaux Arts Village family income data, there are 56 families falling into the $200,000+ income range, which is the most common income bracket and makes up 69.1% of all families.
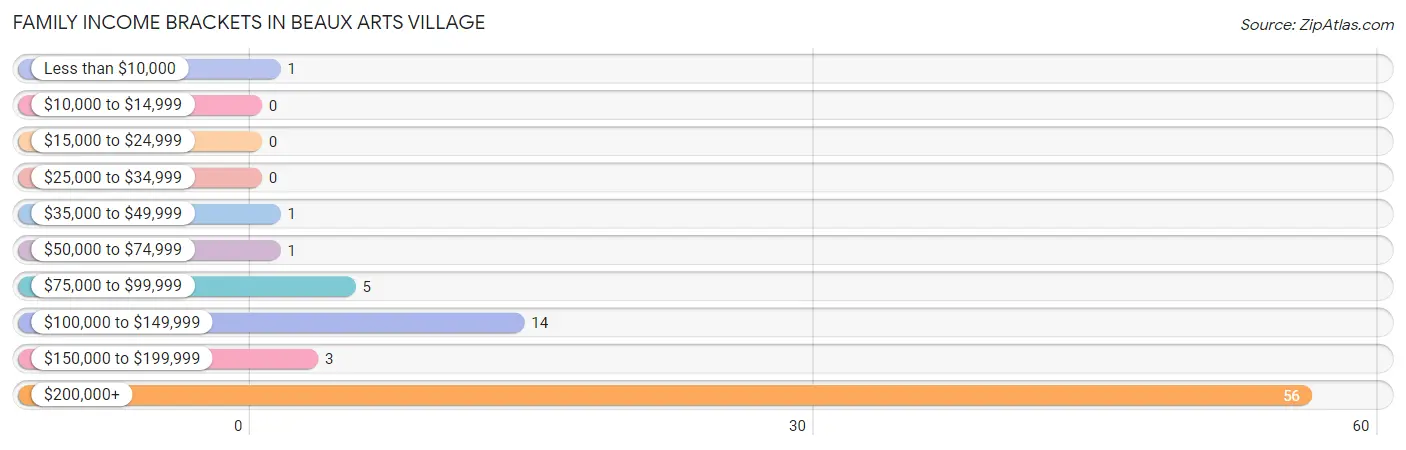
| Income Bracket | # Families | % Families |
| Less than $10,000 | 1 | 1.2% |
| $10,000 to $14,999 | 0 | 0.0% |
| $15,000 to $24,999 | 0 | 0.0% |
| $25,000 to $34,999 | 0 | 0.0% |
| $35,000 to $49,999 | 1 | 1.2% |
| $50,000 to $74,999 | 1 | 1.2% |
| $75,000 to $99,999 | 5 | 6.2% |
| $100,000 to $149,999 | 14 | 17.3% |
| $150,000 to $199,999 | 3 | 3.7% |
| $200,000+ | 56 | 69.1% |
Family Income by Famaliy Size in Beaux Arts Village
2-person families (29 | 35.8%) account for the highest median family income in Beaux Arts Village with $250,001 per family, while 2-person families (29 | 35.8%) have the highest median income of $125,000 per family member.
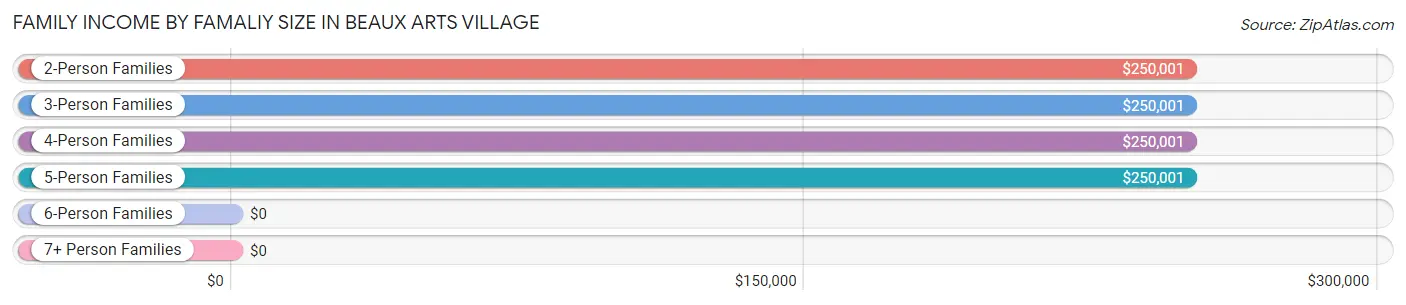
| Income Bracket | # Families | Median Income |
| 2-Person Families | 29 (35.8%) | $250,001 |
| 3-Person Families | 34 (42.0%) | $250,001 |
| 4-Person Families | 14 (17.3%) | $250,001 |
| 5-Person Families | 4 (4.9%) | $250,001 |
| 6-Person Families | 0 (0.0%) | $0 |
| 7+ Person Families | 0 (0.0%) | $0 |
| Total | 81 (100.0%) | $250,001 |
Family Income by Number of Earners in Beaux Arts Village
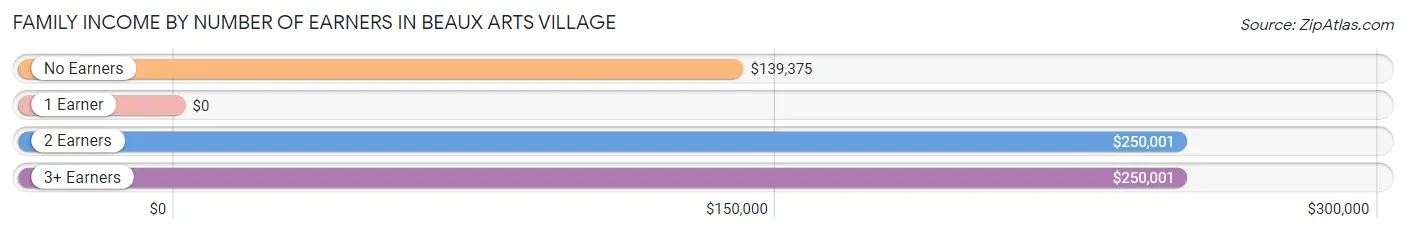
| Number of Earners | # Families | Median Income |
| No Earners | 13 (16.1%) | $139,375 |
| 1 Earner | 10 (12.3%) | $0 |
| 2 Earners | 40 (49.4%) | $250,001 |
| 3+ Earners | 18 (22.2%) | $250,001 |
| Total | 81 (100.0%) | $250,001 |
Household Income in Beaux Arts Village
Household Income Brackets in Beaux Arts Village
With 56 households falling in the category, the $200,000+ income range is the most frequent in Beaux Arts Village, accounting for 58.3% of all households.
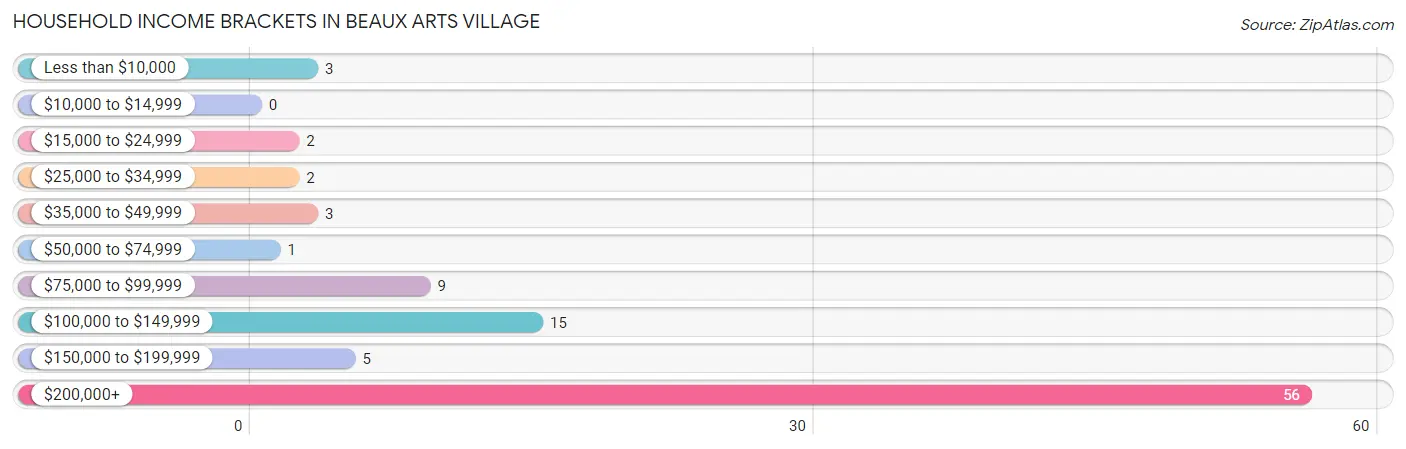
| Income Bracket | # Households | % Households |
| Less than $10,000 | 3 | 3.1% |
| $10,000 to $14,999 | 0 | 0.0% |
| $15,000 to $24,999 | 2 | 2.1% |
| $25,000 to $34,999 | 2 | 2.1% |
| $35,000 to $49,999 | 3 | 3.1% |
| $50,000 to $74,999 | 1 | 1.0% |
| $75,000 to $99,999 | 9 | 9.4% |
| $100,000 to $149,999 | 15 | 15.6% |
| $150,000 to $199,999 | 5 | 5.2% |
| $200,000+ | 56 | 58.3% |
Household Income by Householder Age in Beaux Arts Village
The median household income in Beaux Arts Village is $250,001, with the highest median household income of $250,001 found in the 25 to 44 years age bracket for the primary householder. A total of 10 households (10.4%) fall into this category.
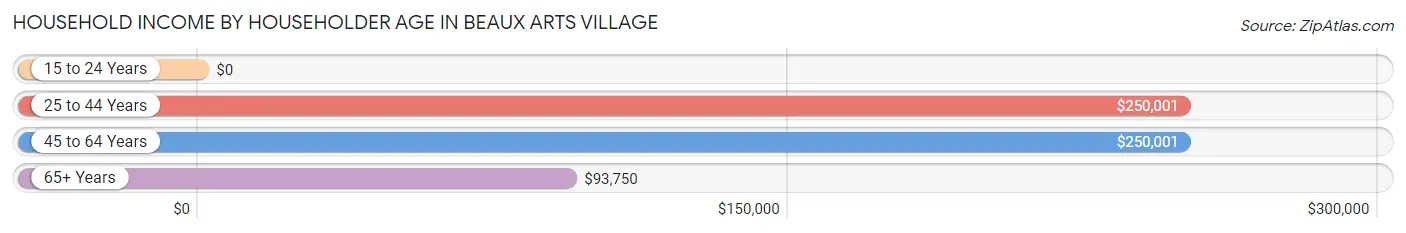
| Income Bracket | # Households | Median Income |
| 15 to 24 Years | 0 (0.0%) | $0 |
| 25 to 44 Years | 10 (10.4%) | $250,001 |
| 45 to 64 Years | 57 (59.4%) | $250,001 |
| 65+ Years | 29 (30.2%) | $93,750 |
| Total | 96 (100.0%) | $250,001 |
Poverty in Beaux Arts Village
Income Below Poverty by Sex and Age in Beaux Arts Village
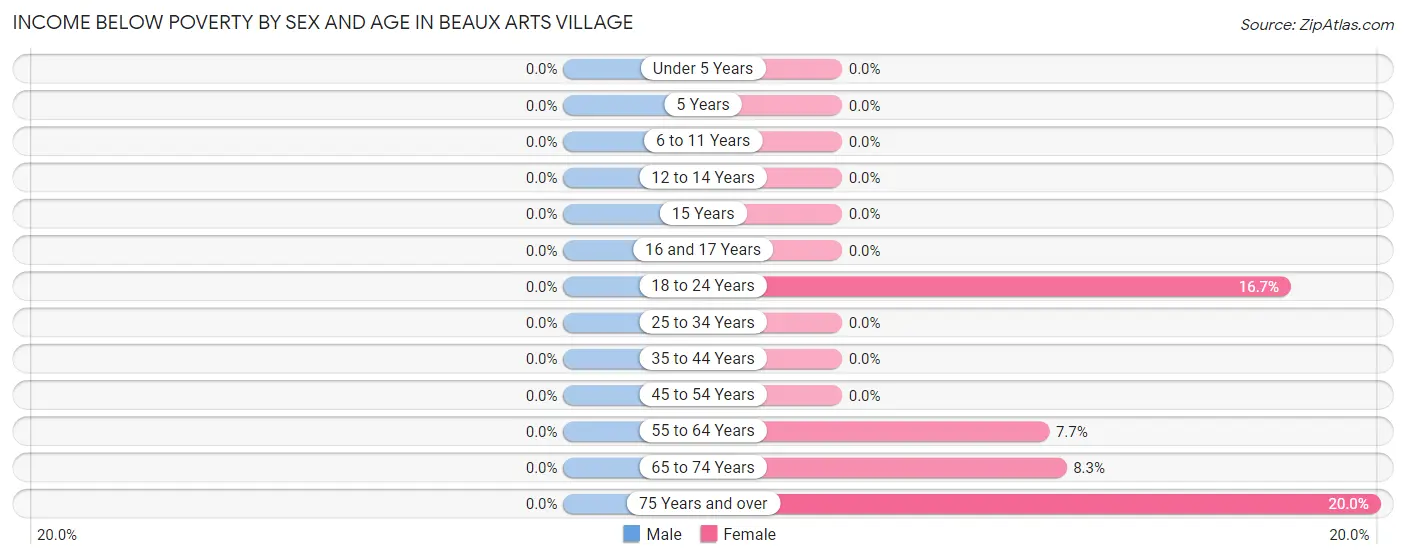
| Age Bracket | Male | Female |
| Under 5 Years | 0 (0.0%) | 0 (0.0%) |
| 5 Years | 0 (0.0%) | 0 (0.0%) |
| 6 to 11 Years | 0 (0.0%) | 0 (0.0%) |
| 12 to 14 Years | 0 (0.0%) | 0 (0.0%) |
| 15 Years | 0 (0.0%) | 0 (0.0%) |
| 16 and 17 Years | 0 (0.0%) | 0 (0.0%) |
| 18 to 24 Years | 0 (0.0%) | 1 (16.7%) |
| 25 to 34 Years | 0 (0.0%) | 0 (0.0%) |
| 35 to 44 Years | 0 (0.0%) | 0 (0.0%) |
| 45 to 54 Years | 0 (0.0%) | 0 (0.0%) |
| 55 to 64 Years | 0 (0.0%) | 2 (7.7%) |
| 65 to 74 Years | 0 (0.0%) | 1 (8.3%) |
| 75 Years and over | 0 (0.0%) | 3 (20.0%) |
| Total | 0 (0.0%) | 7 (5.4%) |
Income Above Poverty by Sex and Age in Beaux Arts Village
According to the poverty statistics in Beaux Arts Village, males aged under 5 years and females aged under 5 years are the age groups that are most secure financially, with 100.0% of males and 100.0% of females in these age groups living above the poverty line.
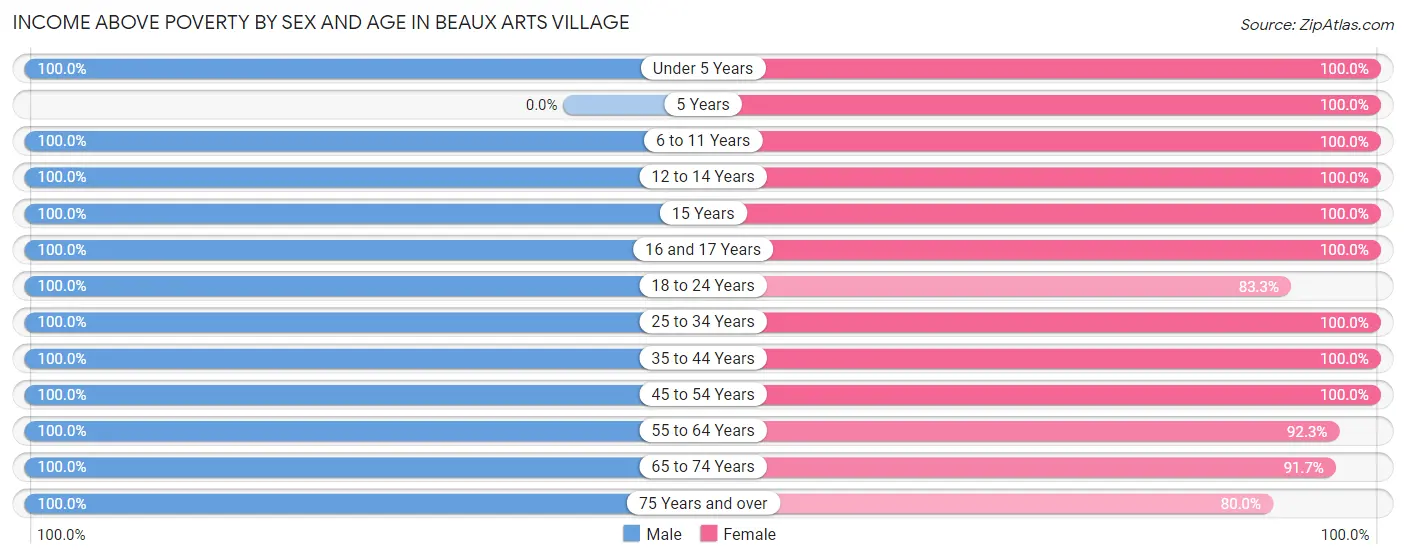
| Age Bracket | Male | Female |
| Under 5 Years | 7 (100.0%) | 1 (100.0%) |
| 5 Years | 0 (0.0%) | 1 (100.0%) |
| 6 to 11 Years | 5 (100.0%) | 2 (100.0%) |
| 12 to 14 Years | 3 (100.0%) | 8 (100.0%) |
| 15 Years | 1 (100.0%) | 2 (100.0%) |
| 16 and 17 Years | 13 (100.0%) | 4 (100.0%) |
| 18 to 24 Years | 10 (100.0%) | 5 (83.3%) |
| 25 to 34 Years | 7 (100.0%) | 15 (100.0%) |
| 35 to 44 Years | 5 (100.0%) | 9 (100.0%) |
| 45 to 54 Years | 26 (100.0%) | 29 (100.0%) |
| 55 to 64 Years | 32 (100.0%) | 24 (92.3%) |
| 65 to 74 Years | 12 (100.0%) | 11 (91.7%) |
| 75 Years and over | 7 (100.0%) | 12 (80.0%) |
| Total | 128 (100.0%) | 123 (94.6%) |
Income Below Poverty Among Married-Couple Families in Beaux Arts Village
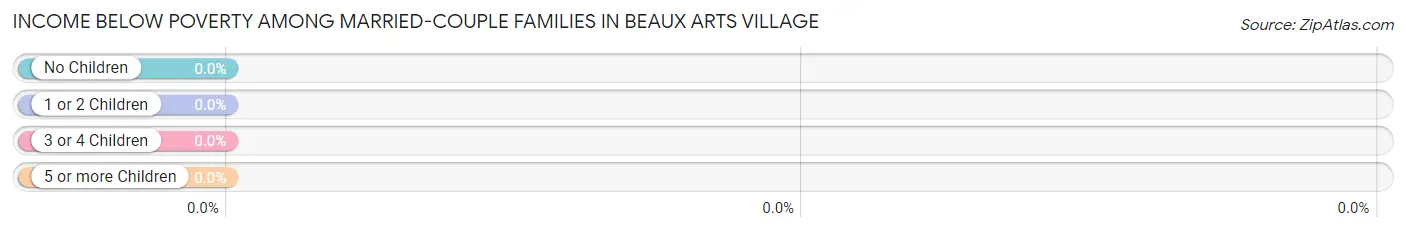
| Children | Above Poverty | Below Poverty |
| No Children | 44 (100.0%) | 0 (0.0%) |
| 1 or 2 Children | 32 (100.0%) | 0 (0.0%) |
| 3 or 4 Children | 2 (100.0%) | 0 (0.0%) |
| 5 or more Children | 0 (0.0%) | 0 (0.0%) |
| Total | 78 (100.0%) | 0 (0.0%) |
Income Below Poverty Among Single-Parent Households in Beaux Arts Village
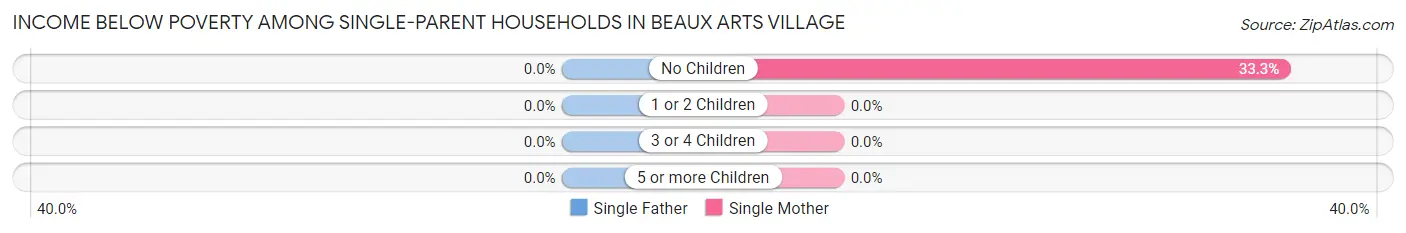
| Children | Single Father | Single Mother |
| No Children | 0 (0.0%) | 1 (33.3%) |
| 1 or 2 Children | 0 (0.0%) | 0 (0.0%) |
| 3 or 4 Children | 0 (0.0%) | 0 (0.0%) |
| 5 or more Children | 0 (0.0%) | 0 (0.0%) |
| Total | 0 (0.0%) | 1 (33.3%) |
Income Below Poverty Among Married-Couple vs Single-Parent Households in Beaux Arts Village
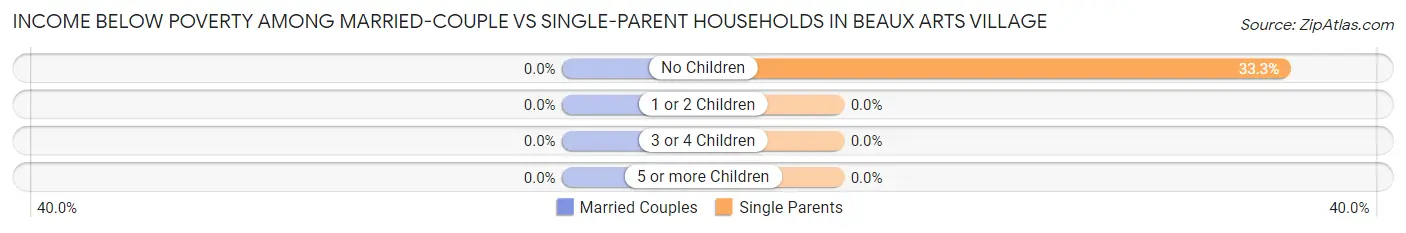
| Children | Married-Couple Families | Single-Parent Households |
| No Children | 0 (0.0%) | 1 (33.3%) |
| 1 or 2 Children | 0 (0.0%) | 0 (0.0%) |
| 3 or 4 Children | 0 (0.0%) | 0 (0.0%) |
| 5 or more Children | 0 (0.0%) | 0 (0.0%) |
| Total | 0 (0.0%) | 1 (33.3%) |
Employment Characteristics in Beaux Arts Village
Employment by Class of Employer in Beaux Arts Village
Among the 138 employed individuals in Beaux Arts Village, private company employees (74 | 53.6%), self-employed (incorporated) (20 | 14.5%), and not-for-profit organizations (19 | 13.8%) make up the most common classes of employment.
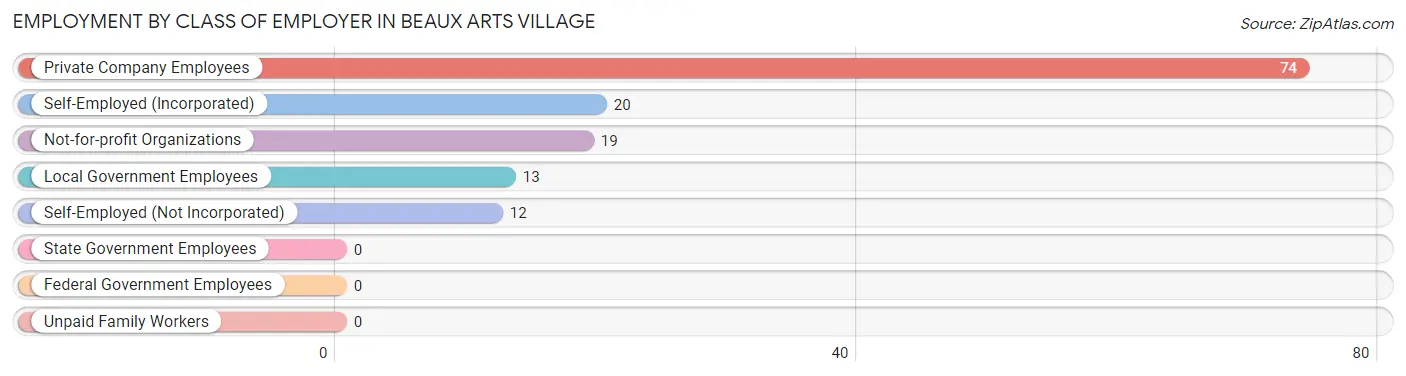
| Employer Class | # Employees | % Employees |
| Private Company Employees | 74 | 53.6% |
| Self-Employed (Incorporated) | 20 | 14.5% |
| Self-Employed (Not Incorporated) | 12 | 8.7% |
| Not-for-profit Organizations | 19 | 13.8% |
| Local Government Employees | 13 | 9.4% |
| State Government Employees | 0 | 0.0% |
| Federal Government Employees | 0 | 0.0% |
| Unpaid Family Workers | 0 | 0.0% |
| Total | 138 | 100.0% |
Employment Status by Age in Beaux Arts Village
According to the labor force statistics for Beaux Arts Village, out of the total population over 16 years of age (228), 64.0% or 146 individuals are in the labor force, with 5.5% or 8 of them unemployed. The age group with the highest labor force participation rate is 25 to 29 years, with 91.7% or 11 individuals in the labor force. Within the labor force, the 25 to 29 years age range has the highest percentage of unemployed individuals, with 45.5% or 5 of them being unemployed.
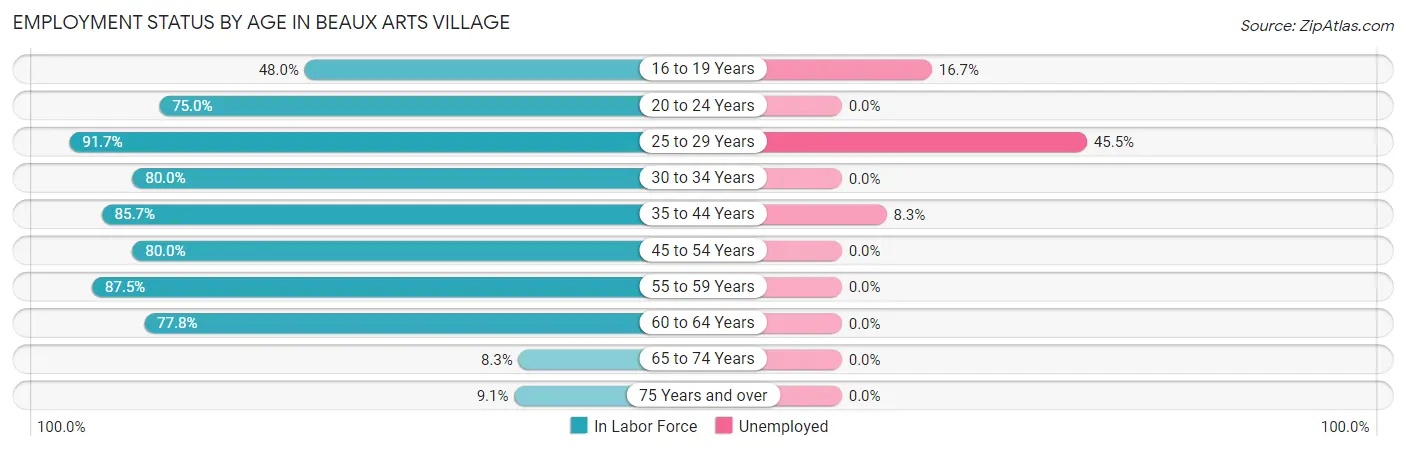
| Age Bracket | In Labor Force | Unemployed |
| 16 to 19 Years | 12 (48.0%) | 2 (16.7%) |
| 20 to 24 Years | 6 (75.0%) | 0 (0.0%) |
| 25 to 29 Years | 11 (91.7%) | 5 (45.5%) |
| 30 to 34 Years | 8 (80.0%) | 0 (0.0%) |
| 35 to 44 Years | 12 (85.7%) | 1 (8.3%) |
| 45 to 54 Years | 44 (80.0%) | 0 (0.0%) |
| 55 to 59 Years | 35 (87.5%) | 0 (0.0%) |
| 60 to 64 Years | 14 (77.8%) | 0 (0.0%) |
| 65 to 74 Years | 2 (8.3%) | 0 (0.0%) |
| 75 Years and over | 2 (9.1%) | 0 (0.0%) |
| Total | 146 (64.0%) | 8 (5.5%) |
Employment Status by Educational Attainment in Beaux Arts Village
According to labor force statistics for Beaux Arts Village, 83.2% of individuals (124) out of the total population between 25 and 64 years of age (149) are in the labor force, with 4.8% or 6 of them being unemployed. The group with the highest labor force participation rate are those with the educational attainment of high school diploma, with 100.0% or 6 individuals in the labor force. Within the labor force, individuals with bachelor's degree or higher education have the highest percentage of unemployment, with 5.6% or 6 of them being unemployed.
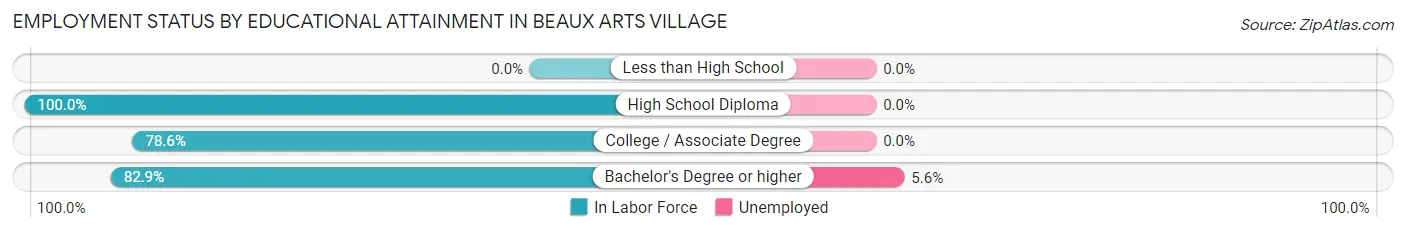
| Educational Attainment | In Labor Force | Unemployed |
| Less than High School | 0 (0.0%) | 0 (0.0%) |
| High School Diploma | 6 (100.0%) | 0 (0.0%) |
| College / Associate Degree | 11 (78.6%) | 0 (0.0%) |
| Bachelor's Degree or higher | 107 (82.9%) | 7 (5.6%) |
| Total | 124 (83.2%) | 7 (4.8%) |
Employment Occupations by Sex in Beaux Arts Village
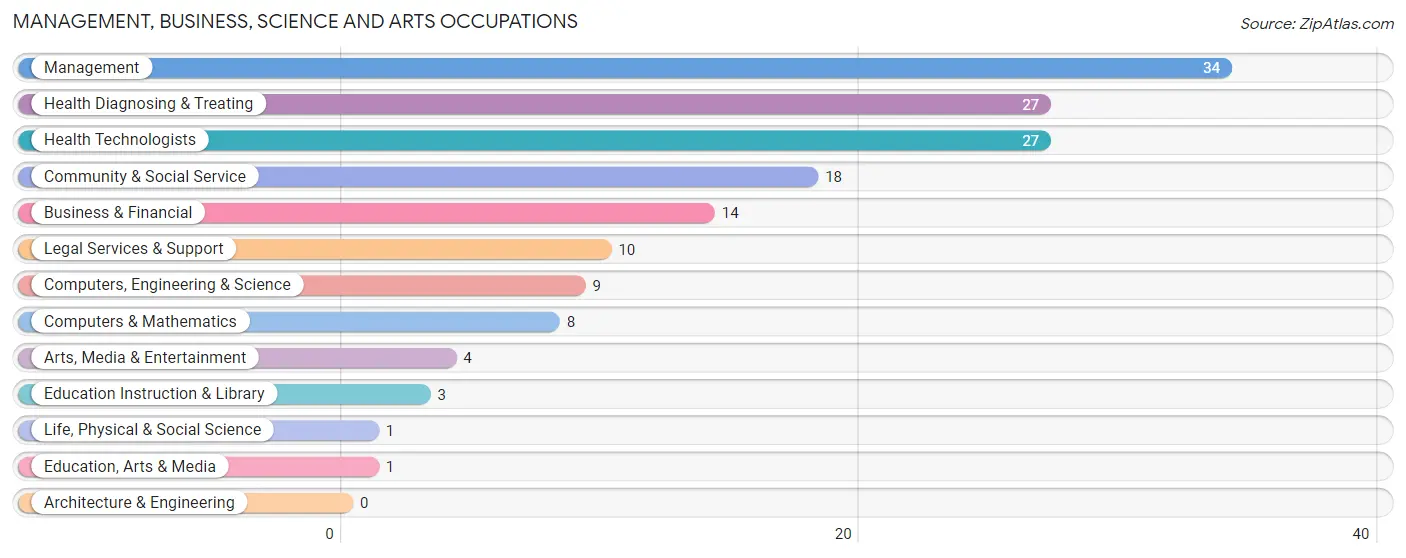
Management, Business, Science and Arts Occupations
The most common Management, Business, Science and Arts occupations in Beaux Arts Village are Management (34 | 24.6%), Health Diagnosing & Treating (27 | 19.6%), Health Technologists (27 | 19.6%), Community & Social Service (18 | 13.0%), and Business & Financial (14 | 10.1%).
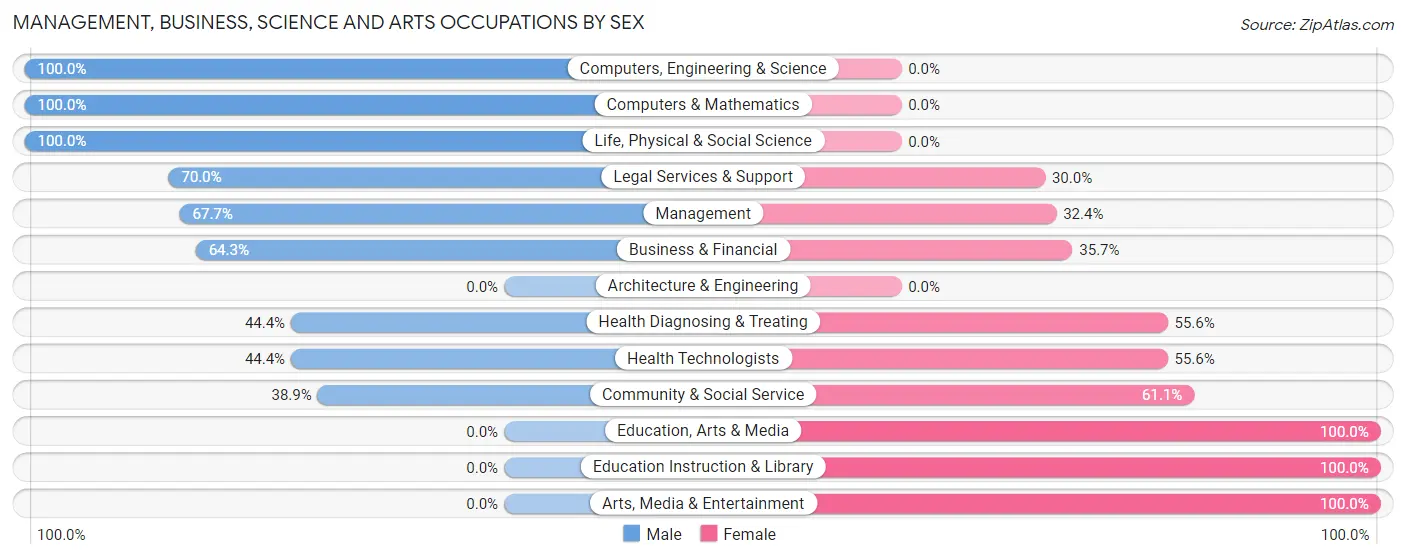
Management, Business, Science and Arts Occupations by Sex
Within the Management, Business, Science and Arts occupations in Beaux Arts Village, the most male-oriented occupations are Computers, Engineering & Science (100.0%), Computers & Mathematics (100.0%), and Life, Physical & Social Science (100.0%), while the most female-oriented occupations are Education, Arts & Media (100.0%), Education Instruction & Library (100.0%), and Arts, Media & Entertainment (100.0%).
| Occupation | Male | Female |
| Management | 23 (67.6%) | 11 (32.4%) |
| Business & Financial | 9 (64.3%) | 5 (35.7%) |
| Computers, Engineering & Science | 9 (100.0%) | 0 (0.0%) |
| Computers & Mathematics | 8 (100.0%) | 0 (0.0%) |
| Architecture & Engineering | 0 (0.0%) | 0 (0.0%) |
| Life, Physical & Social Science | 1 (100.0%) | 0 (0.0%) |
| Community & Social Service | 7 (38.9%) | 11 (61.1%) |
| Education, Arts & Media | 0 (0.0%) | 1 (100.0%) |
| Legal Services & Support | 7 (70.0%) | 3 (30.0%) |
| Education Instruction & Library | 0 (0.0%) | 3 (100.0%) |
| Arts, Media & Entertainment | 0 (0.0%) | 4 (100.0%) |
| Health Diagnosing & Treating | 12 (44.4%) | 15 (55.6%) |
| Health Technologists | 12 (44.4%) | 15 (55.6%) |
| Total (Category) | 60 (58.8%) | 42 (41.2%) |
| Total (Overall) | 79 (57.3%) | 59 (42.7%) |
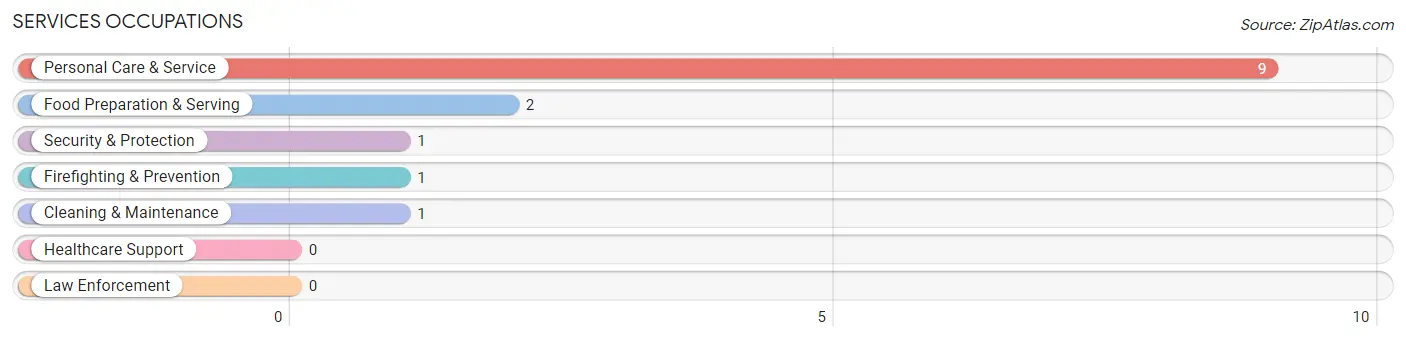
Services Occupations
The most common Services occupations in Beaux Arts Village are Personal Care & Service (9 | 6.5%), Food Preparation & Serving (2 | 1.5%), Security & Protection (1 | 0.7%), Firefighting & Prevention (1 | 0.7%), and Cleaning & Maintenance (1 | 0.7%).
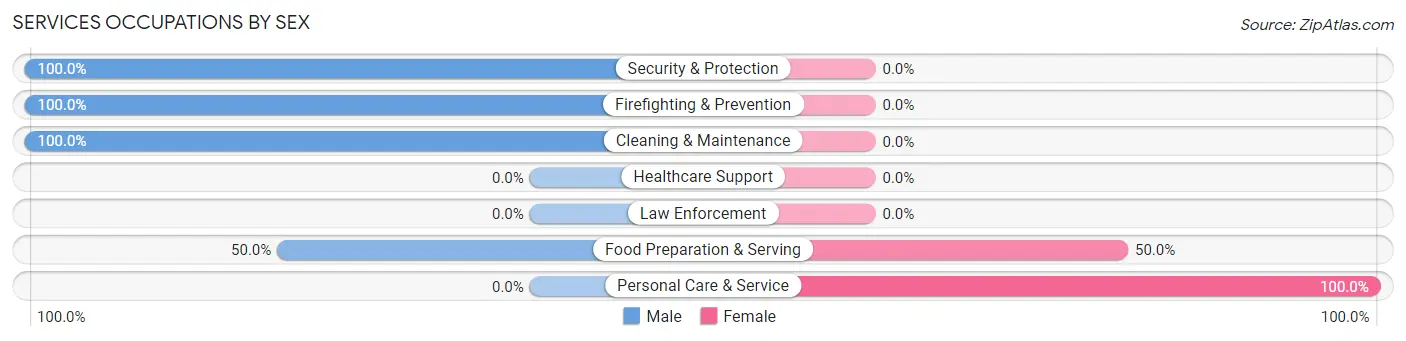
Services Occupations by Sex
Within the Services occupations in Beaux Arts Village, the most male-oriented occupations are Security & Protection (100.0%), Firefighting & Prevention (100.0%), and Cleaning & Maintenance (100.0%), while the most female-oriented occupations are Personal Care & Service (100.0%), and Food Preparation & Serving (50.0%).
| Occupation | Male | Female |
| Healthcare Support | 0 (0.0%) | 0 (0.0%) |
| Security & Protection | 1 (100.0%) | 0 (0.0%) |
| Firefighting & Prevention | 1 (100.0%) | 0 (0.0%) |
| Law Enforcement | 0 (0.0%) | 0 (0.0%) |
| Food Preparation & Serving | 1 (50.0%) | 1 (50.0%) |
| Cleaning & Maintenance | 1 (100.0%) | 0 (0.0%) |
| Personal Care & Service | 0 (0.0%) | 9 (100.0%) |
| Total (Category) | 3 (23.1%) | 10 (76.9%) |
| Total (Overall) | 79 (57.3%) | 59 (42.7%) |
Sales and Office Occupations
The most common Sales and Office occupations in Beaux Arts Village are Sales & Related (12 | 8.7%), and Office & Administration (5 | 3.6%).

Sales and Office Occupations by Sex
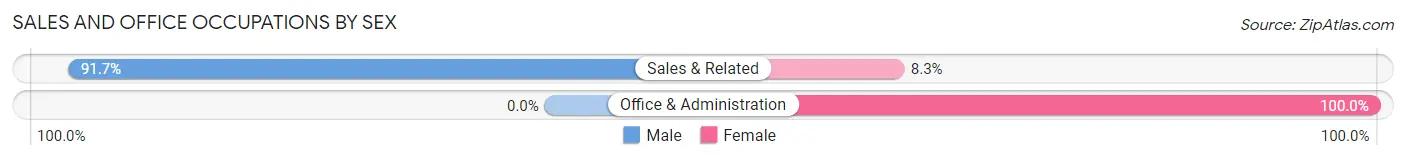
| Occupation | Male | Female |
| Sales & Related | 11 (91.7%) | 1 (8.3%) |
| Office & Administration | 0 (0.0%) | 5 (100.0%) |
| Total (Category) | 11 (64.7%) | 6 (35.3%) |
| Total (Overall) | 79 (57.3%) | 59 (42.7%) |
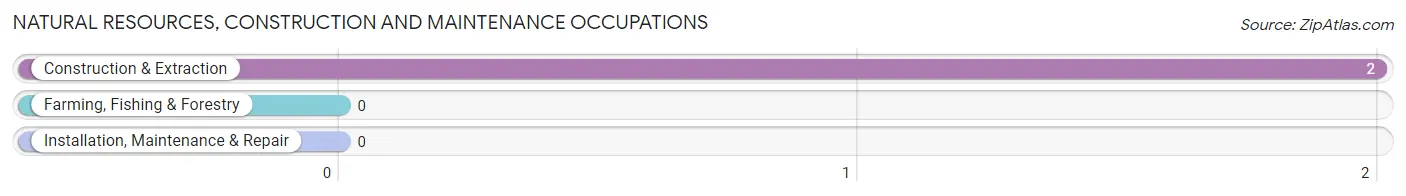
Natural Resources, Construction and Maintenance Occupations
The most common Natural Resources, Construction and Maintenance occupations in Beaux Arts Village are , and Construction & Extraction (2 | 1.5%).
Natural Resources, Construction and Maintenance Occupations by Sex
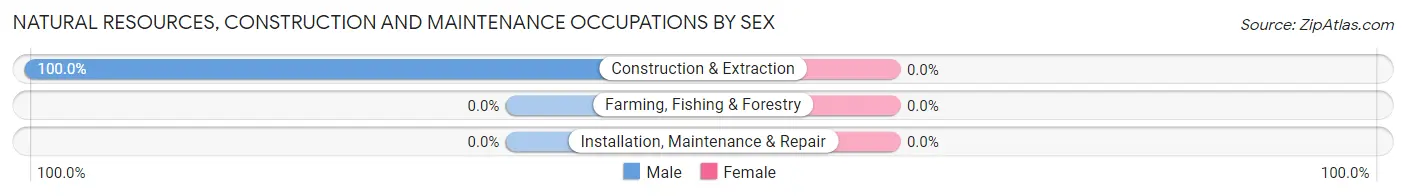
| Occupation | Male | Female |
| Farming, Fishing & Forestry | 0 (0.0%) | 0 (0.0%) |
| Construction & Extraction | 2 (100.0%) | 0 (0.0%) |
| Installation, Maintenance & Repair | 0 (0.0%) | 0 (0.0%) |
| Total (Category) | 2 (100.0%) | 0 (0.0%) |
| Total (Overall) | 79 (57.3%) | 59 (42.7%) |
Production, Transportation and Moving Occupations
The most common Production, Transportation and Moving occupations in Beaux Arts Village are Material Moving (3 | 2.2%), and Transportation (1 | 0.7%).
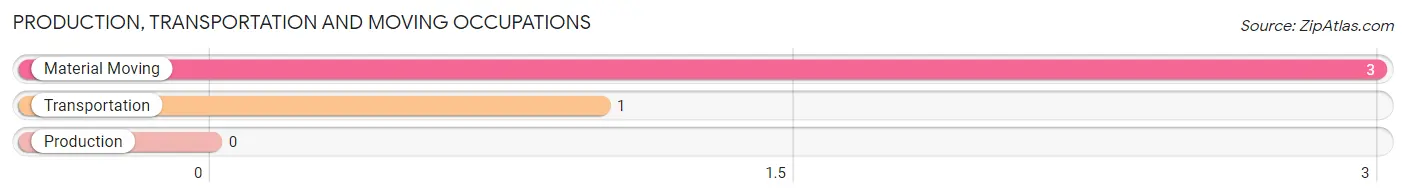
Production, Transportation and Moving Occupations by Sex
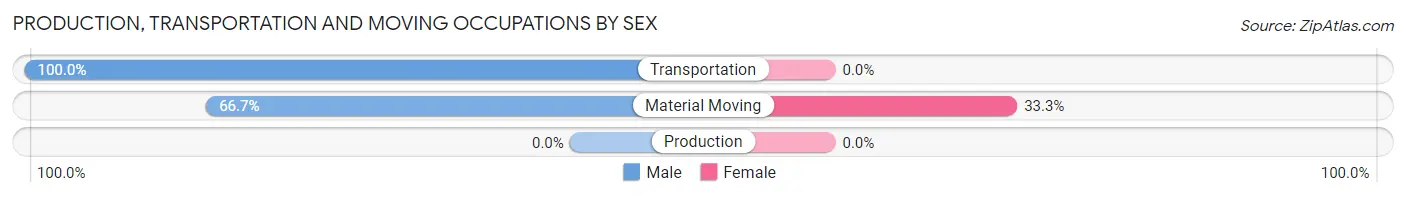
| Occupation | Male | Female |
| Production | 0 (0.0%) | 0 (0.0%) |
| Transportation | 1 (100.0%) | 0 (0.0%) |
| Material Moving | 2 (66.7%) | 1 (33.3%) |
| Total (Category) | 3 (75.0%) | 1 (25.0%) |
| Total (Overall) | 79 (57.3%) | 59 (42.7%) |
Employment Industries by Sex in Beaux Arts Village
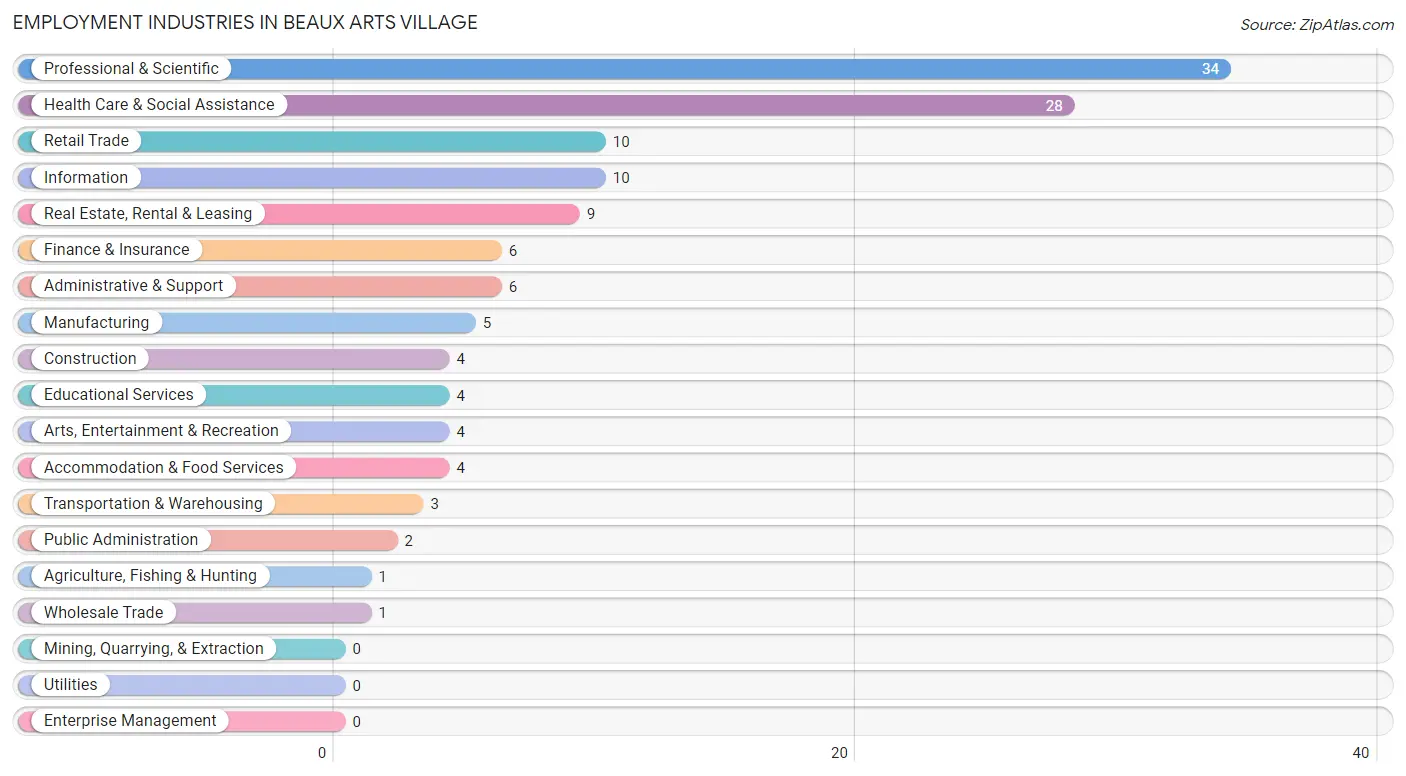
Employment Industries in Beaux Arts Village
The major employment industries in Beaux Arts Village include Professional & Scientific (34 | 24.6%), Health Care & Social Assistance (28 | 20.3%), Retail Trade (10 | 7.2%), Information (10 | 7.2%), and Real Estate, Rental & Leasing (9 | 6.5%).
Employment Industries by Sex in Beaux Arts Village
The Beaux Arts Village industries that see more men than women are Agriculture, Fishing & Hunting (100.0%), Construction (100.0%), and Information (100.0%), whereas the industries that tend to have a higher number of women are Wholesale Trade (100.0%), Educational Services (75.0%), and Arts, Entertainment & Recreation (75.0%).
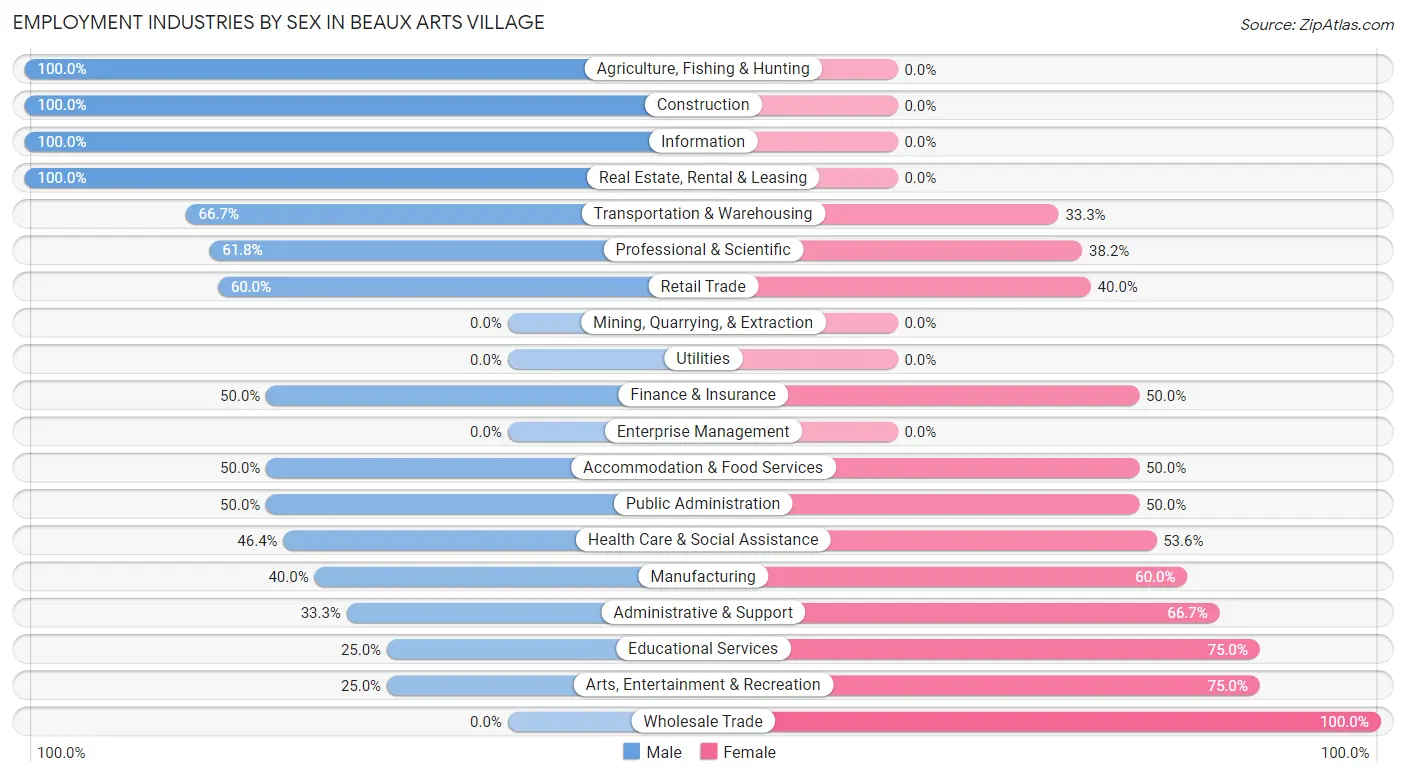
| Industry | Male | Female |
| Agriculture, Fishing & Hunting | 1 (100.0%) | 0 (0.0%) |
| Mining, Quarrying, & Extraction | 0 (0.0%) | 0 (0.0%) |
| Construction | 4 (100.0%) | 0 (0.0%) |
| Manufacturing | 2 (40.0%) | 3 (60.0%) |
| Wholesale Trade | 0 (0.0%) | 1 (100.0%) |
| Retail Trade | 6 (60.0%) | 4 (40.0%) |
| Transportation & Warehousing | 2 (66.7%) | 1 (33.3%) |
| Utilities | 0 (0.0%) | 0 (0.0%) |
| Information | 10 (100.0%) | 0 (0.0%) |
| Finance & Insurance | 3 (50.0%) | 3 (50.0%) |
| Real Estate, Rental & Leasing | 9 (100.0%) | 0 (0.0%) |
| Professional & Scientific | 21 (61.8%) | 13 (38.2%) |
| Enterprise Management | 0 (0.0%) | 0 (0.0%) |
| Administrative & Support | 2 (33.3%) | 4 (66.7%) |
| Educational Services | 1 (25.0%) | 3 (75.0%) |
| Health Care & Social Assistance | 13 (46.4%) | 15 (53.6%) |
| Arts, Entertainment & Recreation | 1 (25.0%) | 3 (75.0%) |
| Accommodation & Food Services | 2 (50.0%) | 2 (50.0%) |
| Public Administration | 1 (50.0%) | 1 (50.0%) |
| Total | 79 (57.3%) | 59 (42.7%) |
Education in Beaux Arts Village
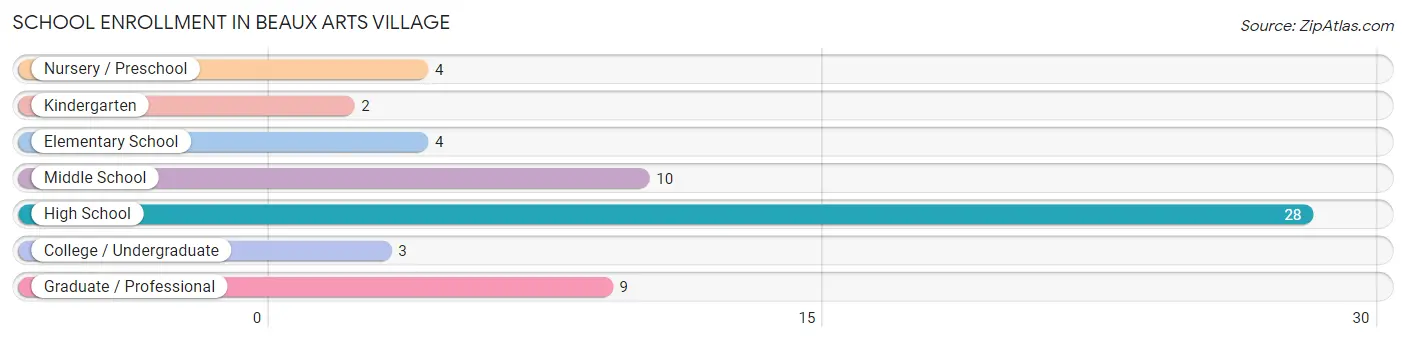
School Enrollment in Beaux Arts Village
The most common levels of schooling among the 60 students in Beaux Arts Village are high school (28 | 46.7%), middle school (10 | 16.7%), and graduate / professional (9 | 15.0%).
| School Level | # Students | % Students |
| Nursery / Preschool | 4 | 6.7% |
| Kindergarten | 2 | 3.3% |
| Elementary School | 4 | 6.7% |
| Middle School | 10 | 16.7% |
| High School | 28 | 46.7% |
| College / Undergraduate | 3 | 5.0% |
| Graduate / Professional | 9 | 15.0% |
| Total | 60 | 100.0% |
School Enrollment by Age by Funding Source in Beaux Arts Village
Out of a total of 60 students who are enrolled in schools in Beaux Arts Village, 16 (26.7%) attend a private institution, while the remaining 44 (73.3%) are enrolled in public schools. The age group of 20 to 24 year olds has the highest likelihood of being enrolled in private schools, with 2 (100.0% in the age bracket) enrolled. Conversely, the age group of 25 to 34 year olds has the lowest likelihood of being enrolled in a private school, with 7 (100.0% in the age bracket) attending a public institution.
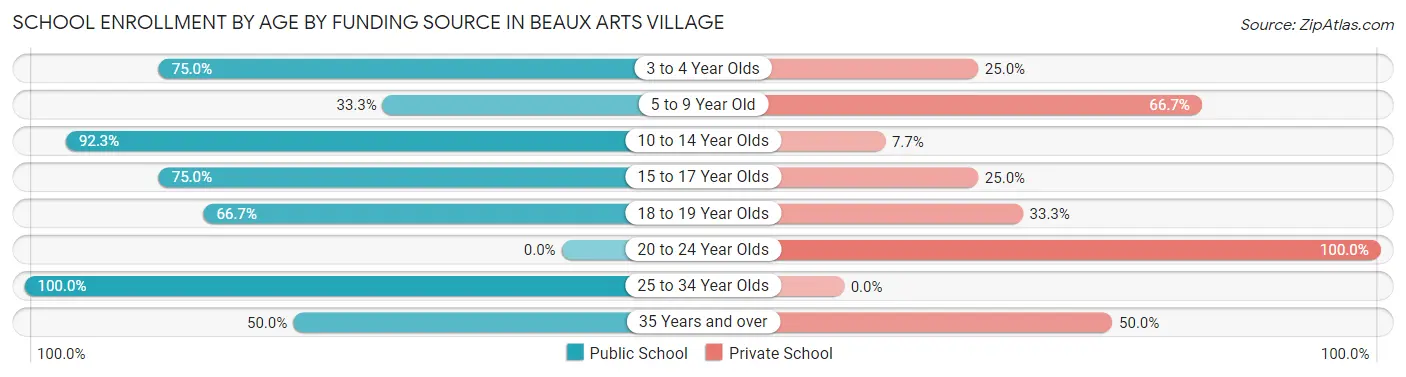
| Age Bracket | Public School | Private School |
| 3 to 4 Year Olds | 3 (75.0%) | 1 (25.0%) |
| 5 to 9 Year Old | 2 (33.3%) | 4 (66.7%) |
| 10 to 14 Year Olds | 12 (92.3%) | 1 (7.7%) |
| 15 to 17 Year Olds | 15 (75.0%) | 5 (25.0%) |
| 18 to 19 Year Olds | 4 (66.7%) | 2 (33.3%) |
| 20 to 24 Year Olds | 0 (0.0%) | 2 (100.0%) |
| 25 to 34 Year Olds | 7 (100.0%) | 0 (0.0%) |
| 35 Years and over | 1 (50.0%) | 1 (50.0%) |
| Total | 44 (73.3%) | 16 (26.7%) |
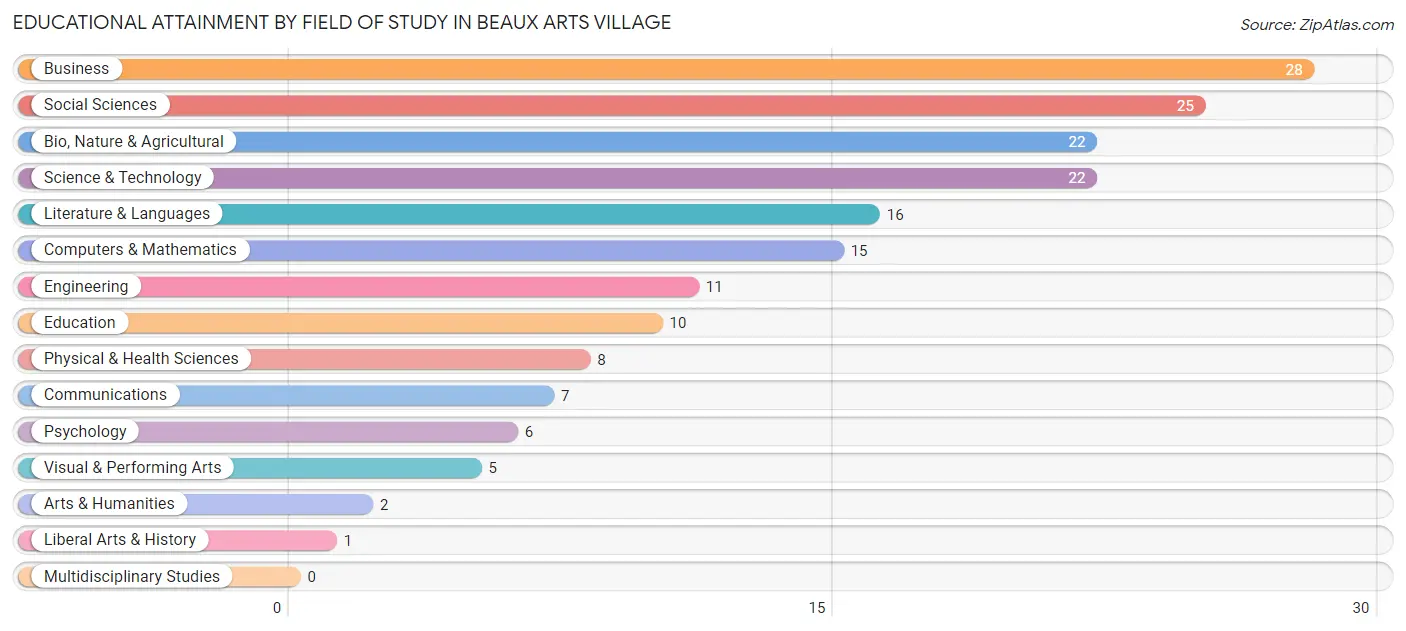
Educational Attainment by Field of Study in Beaux Arts Village
Business (28 | 15.7%), social sciences (25 | 14.0%), bio, nature & agricultural (22 | 12.4%), science & technology (22 | 12.4%), and literature & languages (16 | 9.0%) are the most common fields of study among 178 individuals in Beaux Arts Village who have obtained a bachelor's degree or higher.
| Field of Study | # Graduates | % Graduates |
| Computers & Mathematics | 15 | 8.4% |
| Bio, Nature & Agricultural | 22 | 12.4% |
| Physical & Health Sciences | 8 | 4.5% |
| Psychology | 6 | 3.4% |
| Social Sciences | 25 | 14.0% |
| Engineering | 11 | 6.2% |
| Multidisciplinary Studies | 0 | 0.0% |
| Science & Technology | 22 | 12.4% |
| Business | 28 | 15.7% |
| Education | 10 | 5.6% |
| Literature & Languages | 16 | 9.0% |
| Liberal Arts & History | 1 | 0.6% |
| Visual & Performing Arts | 5 | 2.8% |
| Communications | 7 | 3.9% |
| Arts & Humanities | 2 | 1.1% |
| Total | 178 | 100.0% |
Transportation & Commute in Beaux Arts Village
Vehicle Availability by Sex in Beaux Arts Village
The most prevalent vehicle ownership categories in Beaux Arts Village are males with 3 vehicles (44, accounting for 55.7%) and females with 3 vehicles (37, making up 74.6%).
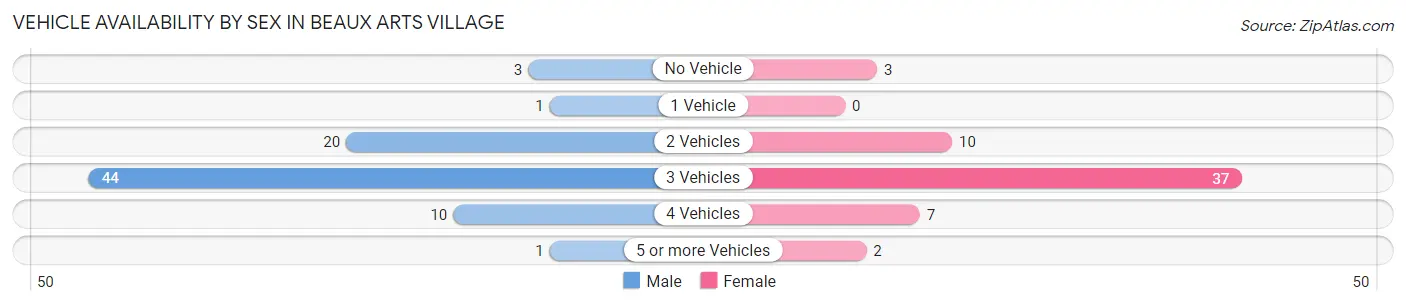
| Vehicles Available | Male | Female |
| No Vehicle | 3 (3.8%) | 3 (5.1%) |
| 1 Vehicle | 1 (1.3%) | 0 (0.0%) |
| 2 Vehicles | 20 (25.3%) | 10 (17.0%) |
| 3 Vehicles | 44 (55.7%) | 37 (62.7%) |
| 4 Vehicles | 10 (12.7%) | 7 (11.9%) |
| 5 or more Vehicles | 1 (1.3%) | 2 (3.4%) |
| Total | 79 (100.0%) | 59 (100.0%) |
Commute Time in Beaux Arts Village
The most frequently occuring commute durations in Beaux Arts Village are 30 to 34 minutes (19 commuters, 17.9%), 10 to 14 minutes (18 commuters, 17.0%), and 20 to 24 minutes (18 commuters, 17.0%).
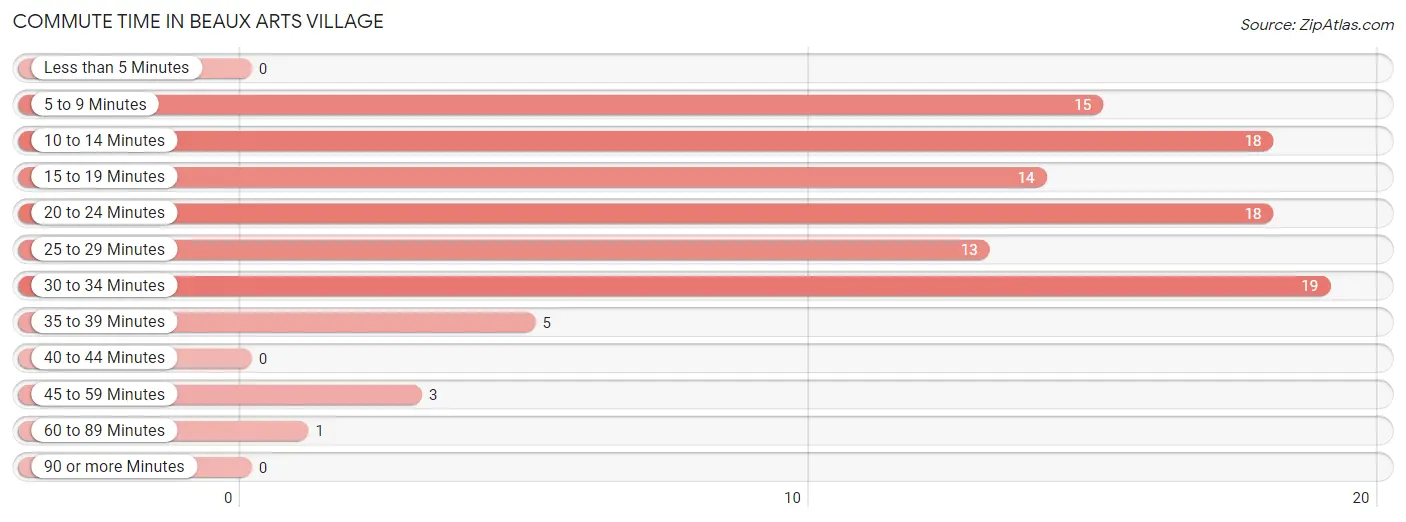
| Commute Time | # Commuters | % Commuters |
| Less than 5 Minutes | 0 | 0.0% |
| 5 to 9 Minutes | 15 | 14.1% |
| 10 to 14 Minutes | 18 | 17.0% |
| 15 to 19 Minutes | 14 | 13.2% |
| 20 to 24 Minutes | 18 | 17.0% |
| 25 to 29 Minutes | 13 | 12.3% |
| 30 to 34 Minutes | 19 | 17.9% |
| 35 to 39 Minutes | 5 | 4.7% |
| 40 to 44 Minutes | 0 | 0.0% |
| 45 to 59 Minutes | 3 | 2.8% |
| 60 to 89 Minutes | 1 | 0.9% |
| 90 or more Minutes | 0 | 0.0% |
Commute Time by Sex in Beaux Arts Village
The most common commute times in Beaux Arts Village are 20 to 24 minutes (16 commuters, 26.2%) for males and 30 to 34 minutes (14 commuters, 31.1%) for females.
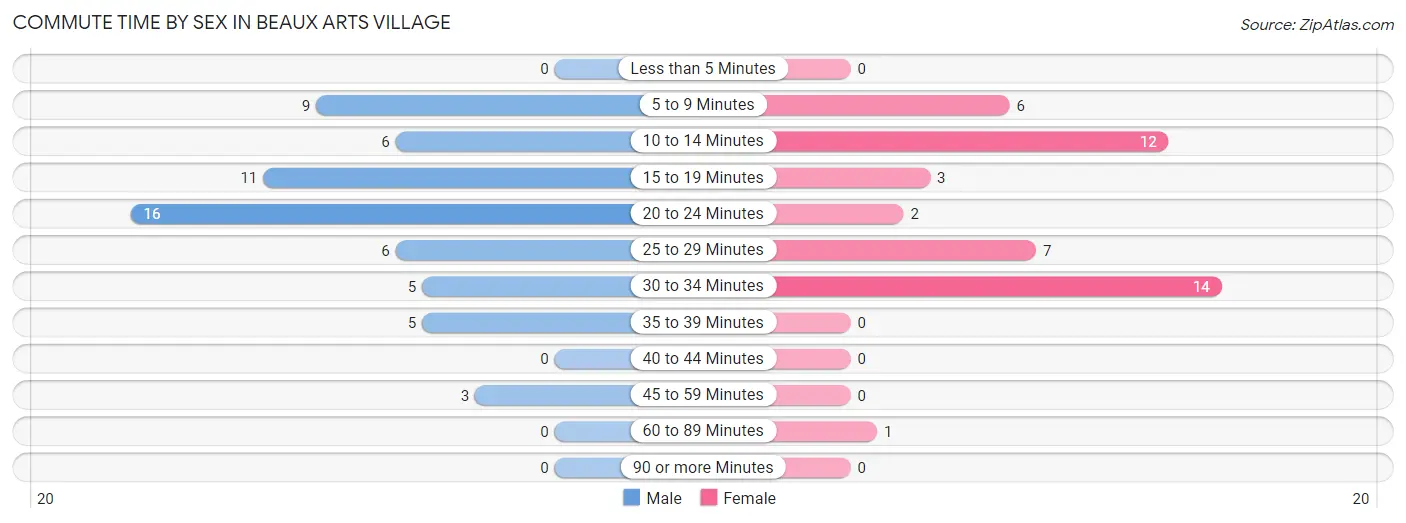
| Commute Time | Male | Female |
| Less than 5 Minutes | 0 (0.0%) | 0 (0.0%) |
| 5 to 9 Minutes | 9 (14.7%) | 6 (13.3%) |
| 10 to 14 Minutes | 6 (9.8%) | 12 (26.7%) |
| 15 to 19 Minutes | 11 (18.0%) | 3 (6.7%) |
| 20 to 24 Minutes | 16 (26.2%) | 2 (4.4%) |
| 25 to 29 Minutes | 6 (9.8%) | 7 (15.6%) |
| 30 to 34 Minutes | 5 (8.2%) | 14 (31.1%) |
| 35 to 39 Minutes | 5 (8.2%) | 0 (0.0%) |
| 40 to 44 Minutes | 0 (0.0%) | 0 (0.0%) |
| 45 to 59 Minutes | 3 (4.9%) | 0 (0.0%) |
| 60 to 89 Minutes | 0 (0.0%) | 1 (2.2%) |
| 90 or more Minutes | 0 (0.0%) | 0 (0.0%) |
Time of Departure to Work by Sex in Beaux Arts Village
The most frequent times of departure to work in Beaux Arts Village are 8:00 AM to 8:29 AM (20, 32.8%) for males and 9:00 AM to 9:59 AM (15, 33.3%) for females.
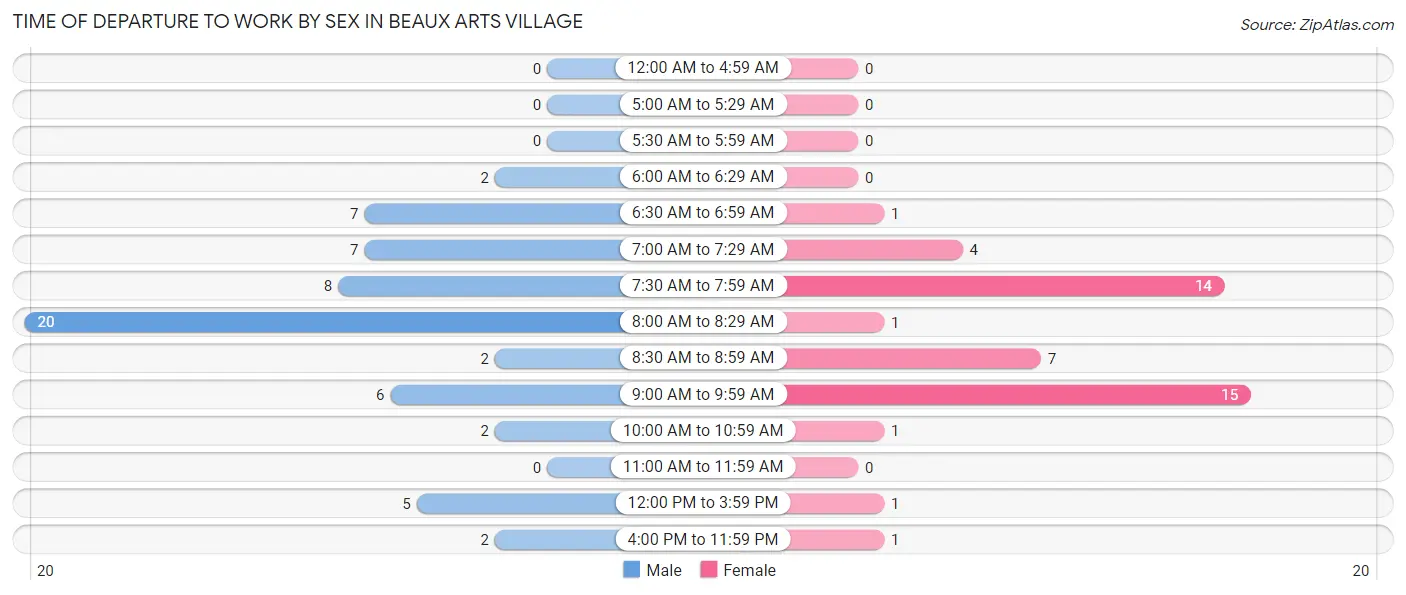
| Time of Departure | Male | Female |
| 12:00 AM to 4:59 AM | 0 (0.0%) | 0 (0.0%) |
| 5:00 AM to 5:29 AM | 0 (0.0%) | 0 (0.0%) |
| 5:30 AM to 5:59 AM | 0 (0.0%) | 0 (0.0%) |
| 6:00 AM to 6:29 AM | 2 (3.3%) | 0 (0.0%) |
| 6:30 AM to 6:59 AM | 7 (11.5%) | 1 (2.2%) |
| 7:00 AM to 7:29 AM | 7 (11.5%) | 4 (8.9%) |
| 7:30 AM to 7:59 AM | 8 (13.1%) | 14 (31.1%) |
| 8:00 AM to 8:29 AM | 20 (32.8%) | 1 (2.2%) |
| 8:30 AM to 8:59 AM | 2 (3.3%) | 7 (15.6%) |
| 9:00 AM to 9:59 AM | 6 (9.8%) | 15 (33.3%) |
| 10:00 AM to 10:59 AM | 2 (3.3%) | 1 (2.2%) |
| 11:00 AM to 11:59 AM | 0 (0.0%) | 0 (0.0%) |
| 12:00 PM to 3:59 PM | 5 (8.2%) | 1 (2.2%) |
| 4:00 PM to 11:59 PM | 2 (3.3%) | 1 (2.2%) |
| Total | 61 (100.0%) | 45 (100.0%) |
Housing Occupancy in Beaux Arts Village
Occupancy by Ownership in Beaux Arts Village
Of the total 96 dwellings in Beaux Arts Village, owner-occupied units account for 89 (92.7%), while renter-occupied units make up 7 (7.3%).
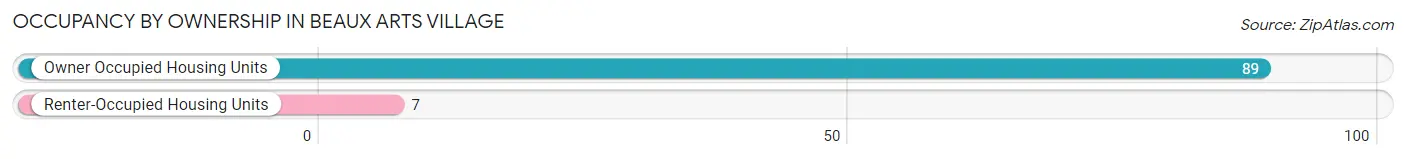
| Occupancy | # Housing Units | % Housing Units |
| Owner Occupied Housing Units | 89 | 92.7% |
| Renter-Occupied Housing Units | 7 | 7.3% |
| Total Occupied Housing Units | 96 | 100.0% |
Occupancy by Household Size in Beaux Arts Village
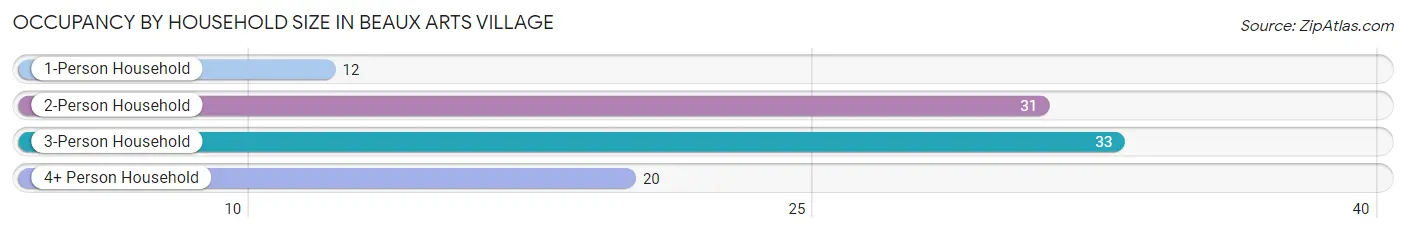
| Household Size | # Housing Units | % Housing Units |
| 1-Person Household | 12 | 12.5% |
| 2-Person Household | 31 | 32.3% |
| 3-Person Household | 33 | 34.4% |
| 4+ Person Household | 20 | 20.8% |
| Total Housing Units | 96 | 100.0% |
Occupancy by Ownership by Household Size in Beaux Arts Village
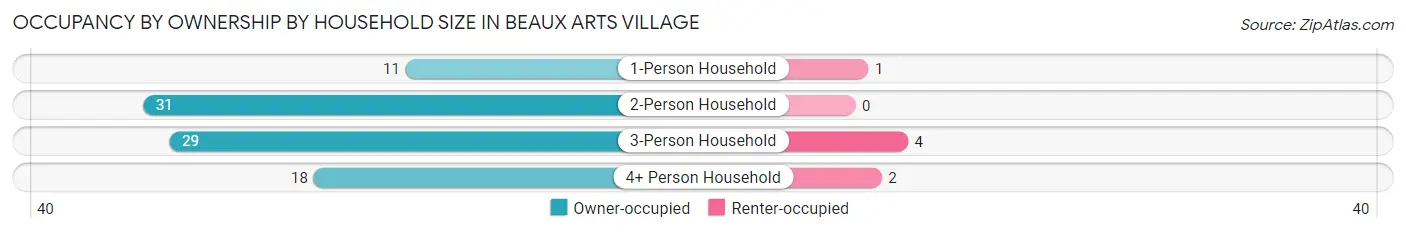
| Household Size | Owner-occupied | Renter-occupied |
| 1-Person Household | 11 (91.7%) | 1 (8.3%) |
| 2-Person Household | 31 (100.0%) | 0 (0.0%) |
| 3-Person Household | 29 (87.9%) | 4 (12.1%) |
| 4+ Person Household | 18 (90.0%) | 2 (10.0%) |
| Total Housing Units | 89 (92.7%) | 7 (7.3%) |
Occupancy by Educational Attainment in Beaux Arts Village
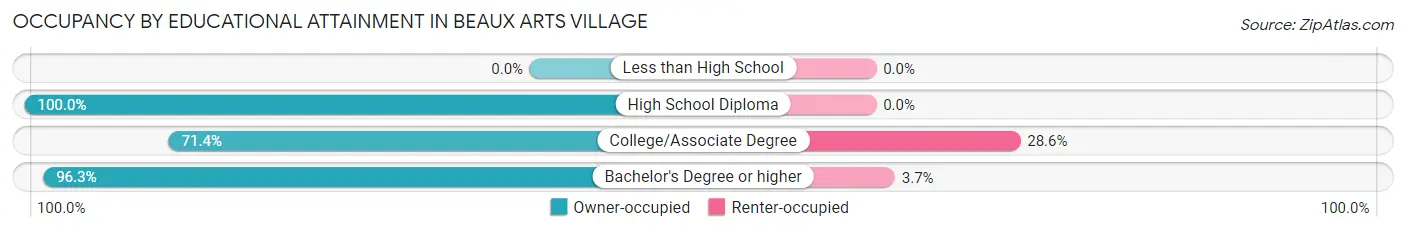
| Household Size | Owner-occupied | Renter-occupied |
| Less than High School | 0 (0.0%) | 0 (0.0%) |
| High School Diploma | 1 (100.0%) | 0 (0.0%) |
| College/Associate Degree | 10 (71.4%) | 4 (28.6%) |
| Bachelor's Degree or higher | 78 (96.3%) | 3 (3.7%) |
Occupancy by Age of Householder in Beaux Arts Village
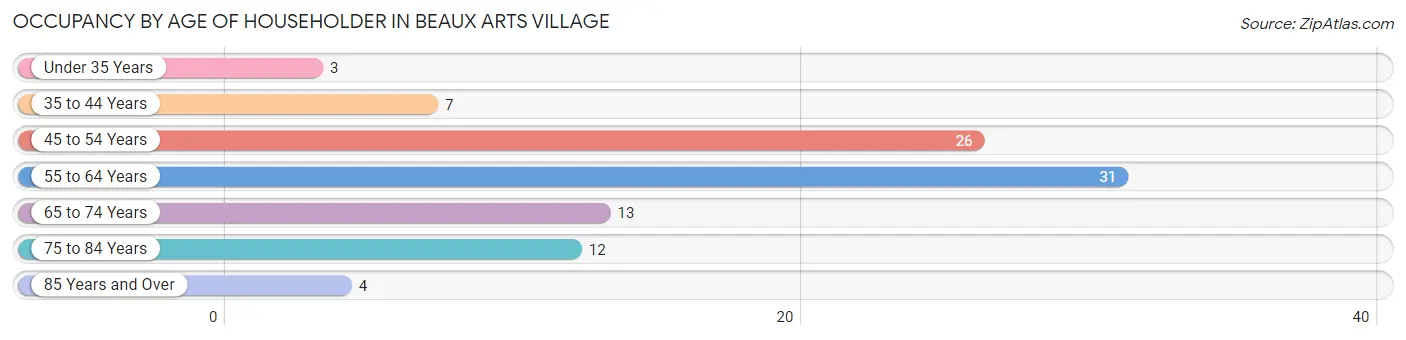
| Age Bracket | # Households | % Households |
| Under 35 Years | 3 | 3.1% |
| 35 to 44 Years | 7 | 7.3% |
| 45 to 54 Years | 26 | 27.1% |
| 55 to 64 Years | 31 | 32.3% |
| 65 to 74 Years | 13 | 13.5% |
| 75 to 84 Years | 12 | 12.5% |
| 85 Years and Over | 4 | 4.2% |
| Total | 96 | 100.0% |
Housing Finances in Beaux Arts Village
Median Income by Occupancy in Beaux Arts Village
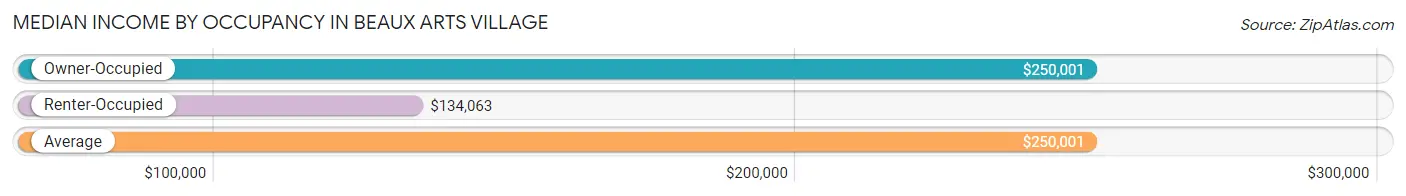
| Occupancy Type | # Households | Median Income |
| Owner-Occupied | 89 (92.7%) | $250,001 |
| Renter-Occupied | 7 (7.3%) | $134,063 |
| Average | 96 (100.0%) | $250,001 |
Occupancy by Householder Income Bracket in Beaux Arts Village
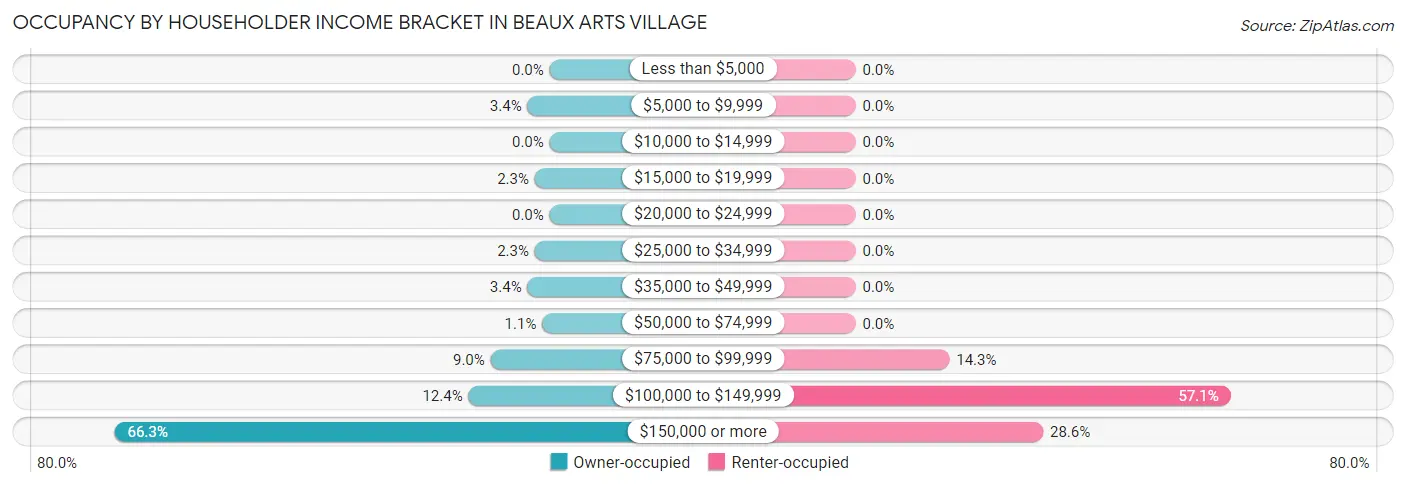
| Income Bracket | Owner-occupied | Renter-occupied |
| Less than $5,000 | 0 (0.0%) | 0 (0.0%) |
| $5,000 to $9,999 | 3 (3.4%) | 0 (0.0%) |
| $10,000 to $14,999 | 0 (0.0%) | 0 (0.0%) |
| $15,000 to $19,999 | 2 (2.2%) | 0 (0.0%) |
| $20,000 to $24,999 | 0 (0.0%) | 0 (0.0%) |
| $25,000 to $34,999 | 2 (2.2%) | 0 (0.0%) |
| $35,000 to $49,999 | 3 (3.4%) | 0 (0.0%) |
| $50,000 to $74,999 | 1 (1.1%) | 0 (0.0%) |
| $75,000 to $99,999 | 8 (9.0%) | 1 (14.3%) |
| $100,000 to $149,999 | 11 (12.4%) | 4 (57.1%) |
| $150,000 or more | 59 (66.3%) | 2 (28.6%) |
| Total | 89 (100.0%) | 7 (100.0%) |
Monthly Housing Cost Tiers in Beaux Arts Village
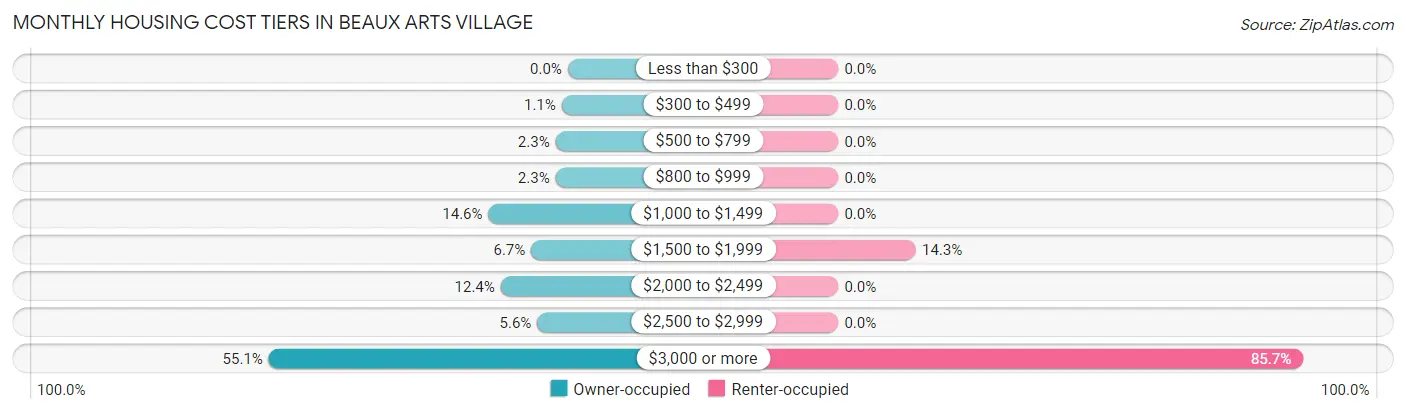
| Monthly Cost | Owner-occupied | Renter-occupied |
| Less than $300 | 0 (0.0%) | 0 (0.0%) |
| $300 to $499 | 1 (1.1%) | 0 (0.0%) |
| $500 to $799 | 2 (2.2%) | 0 (0.0%) |
| $800 to $999 | 2 (2.2%) | 0 (0.0%) |
| $1,000 to $1,499 | 13 (14.6%) | 0 (0.0%) |
| $1,500 to $1,999 | 6 (6.7%) | 1 (14.3%) |
| $2,000 to $2,499 | 11 (12.4%) | 0 (0.0%) |
| $2,500 to $2,999 | 5 (5.6%) | 0 (0.0%) |
| $3,000 or more | 49 (55.1%) | 6 (85.7%) |
| Total | 89 (100.0%) | 7 (100.0%) |
Physical Housing Characteristics in Beaux Arts Village
Housing Structures in Beaux Arts Village
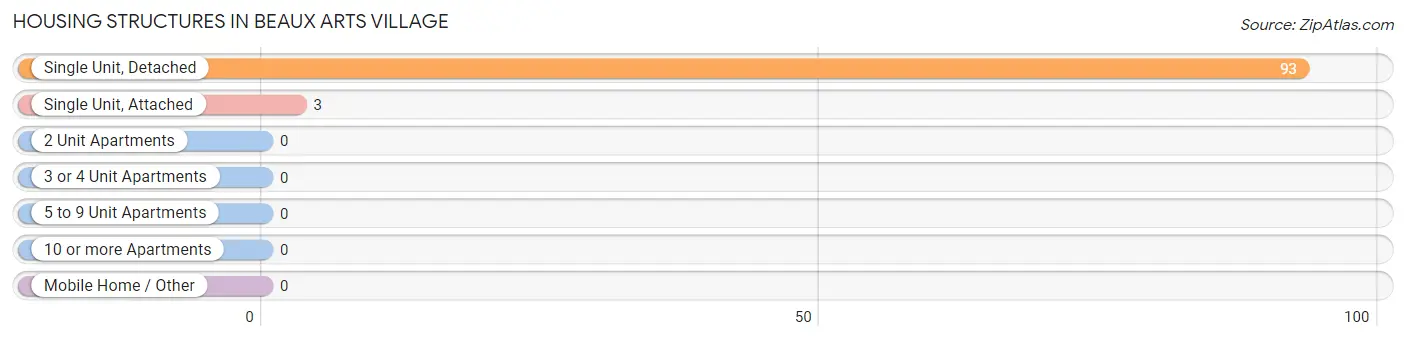
| Structure Type | # Housing Units | % Housing Units |
| Single Unit, Detached | 93 | 96.9% |
| Single Unit, Attached | 3 | 3.1% |
| 2 Unit Apartments | 0 | 0.0% |
| 3 or 4 Unit Apartments | 0 | 0.0% |
| 5 to 9 Unit Apartments | 0 | 0.0% |
| 10 or more Apartments | 0 | 0.0% |
| Mobile Home / Other | 0 | 0.0% |
| Total | 96 | 100.0% |
Housing Structures by Occupancy in Beaux Arts Village
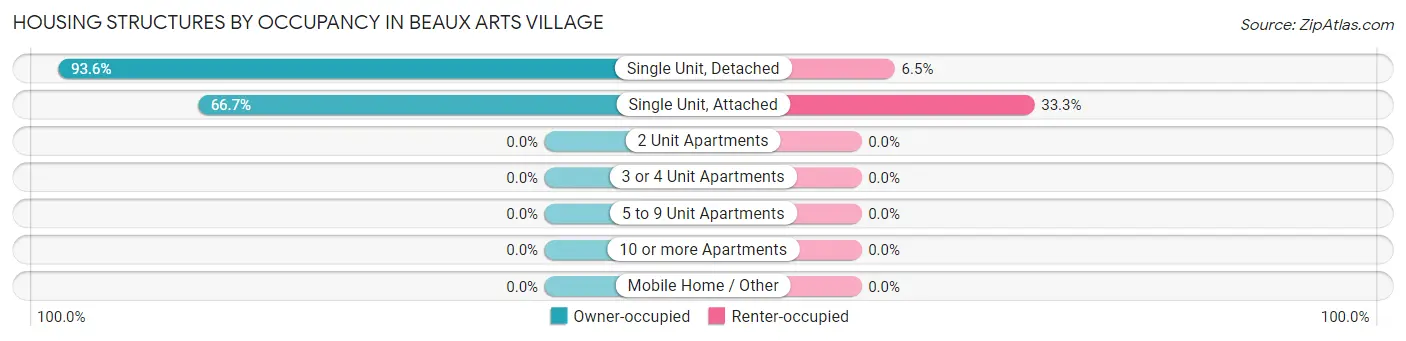
| Structure Type | Owner-occupied | Renter-occupied |
| Single Unit, Detached | 87 (93.5%) | 6 (6.5%) |
| Single Unit, Attached | 2 (66.7%) | 1 (33.3%) |
| 2 Unit Apartments | 0 (0.0%) | 0 (0.0%) |
| 3 or 4 Unit Apartments | 0 (0.0%) | 0 (0.0%) |
| 5 to 9 Unit Apartments | 0 (0.0%) | 0 (0.0%) |
| 10 or more Apartments | 0 (0.0%) | 0 (0.0%) |
| Mobile Home / Other | 0 (0.0%) | 0 (0.0%) |
| Total | 89 (92.7%) | 7 (7.3%) |
Housing Structures by Number of Rooms in Beaux Arts Village
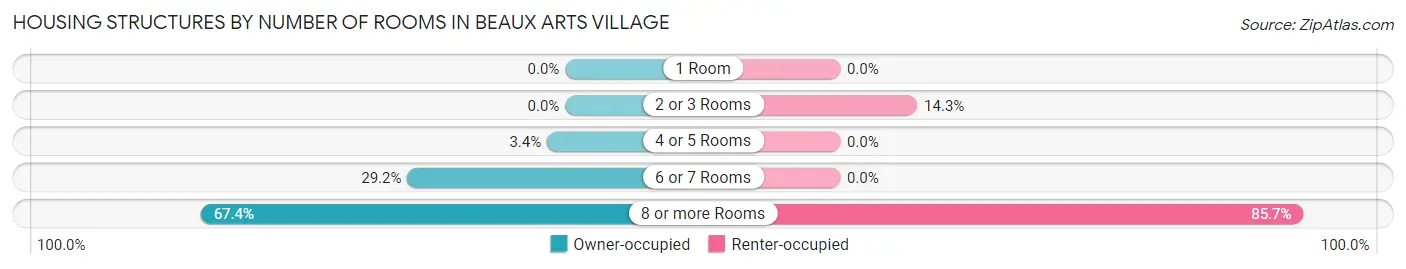
| Number of Rooms | Owner-occupied | Renter-occupied |
| 1 Room | 0 (0.0%) | 0 (0.0%) |
| 2 or 3 Rooms | 0 (0.0%) | 1 (14.3%) |
| 4 or 5 Rooms | 3 (3.4%) | 0 (0.0%) |
| 6 or 7 Rooms | 26 (29.2%) | 0 (0.0%) |
| 8 or more Rooms | 60 (67.4%) | 6 (85.7%) |
| Total | 89 (100.0%) | 7 (100.0%) |
Housing Structure by Heating Type in Beaux Arts Village
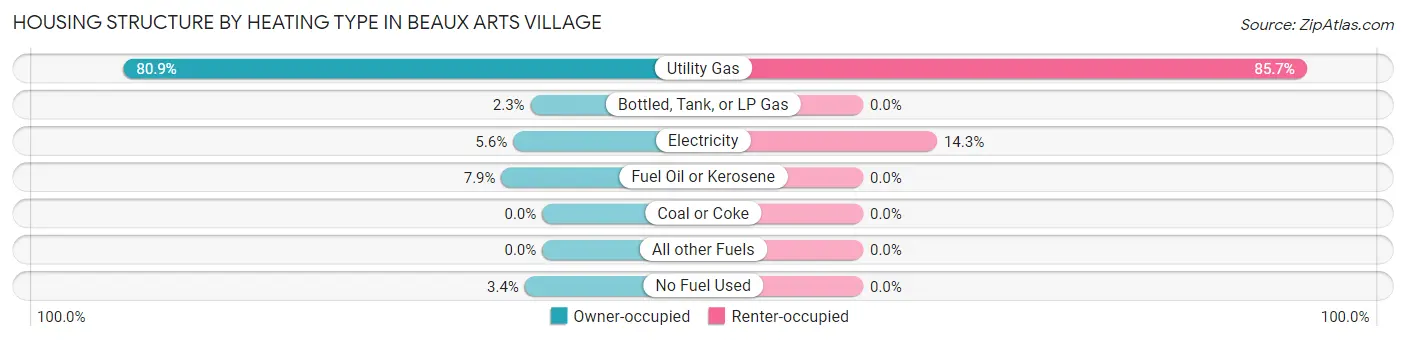
| Heating Type | Owner-occupied | Renter-occupied |
| Utility Gas | 72 (80.9%) | 6 (85.7%) |
| Bottled, Tank, or LP Gas | 2 (2.2%) | 0 (0.0%) |
| Electricity | 5 (5.6%) | 1 (14.3%) |
| Fuel Oil or Kerosene | 7 (7.9%) | 0 (0.0%) |
| Coal or Coke | 0 (0.0%) | 0 (0.0%) |
| All other Fuels | 0 (0.0%) | 0 (0.0%) |
| No Fuel Used | 3 (3.4%) | 0 (0.0%) |
| Total | 89 (100.0%) | 7 (100.0%) |
Household Vehicle Usage in Beaux Arts Village
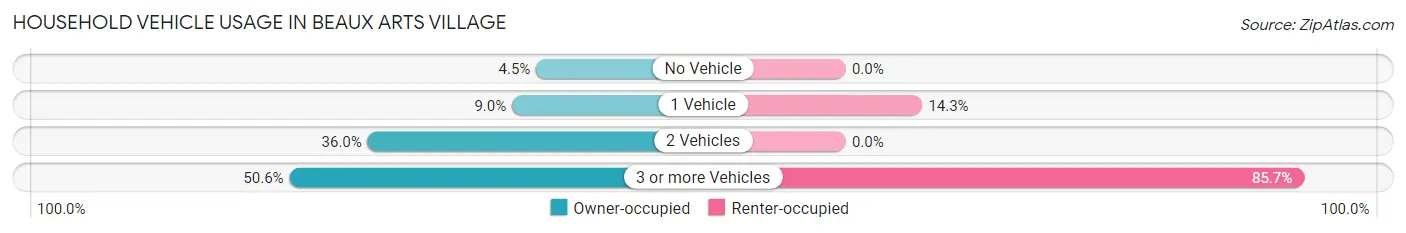
| Vehicles per Household | Owner-occupied | Renter-occupied |
| No Vehicle | 4 (4.5%) | 0 (0.0%) |
| 1 Vehicle | 8 (9.0%) | 1 (14.3%) |
| 2 Vehicles | 32 (36.0%) | 0 (0.0%) |
| 3 or more Vehicles | 45 (50.6%) | 6 (85.7%) |
| Total | 89 (100.0%) | 7 (100.0%) |
Real Estate & Mortgages in Beaux Arts Village
Real Estate and Mortgage Overview in Beaux Arts Village
| Characteristic | Without Mortgage | With Mortgage |
| Housing Units | 31 | 58 |
| Median Property Value | $1,791,700 | $2,000,001 |
| Median Household Income | - | - |
| Monthly Housing Costs | $1,417 | $49 |
| Real Estate Taxes | $10,001 | $1 |
Property Value by Mortgage Status in Beaux Arts Village
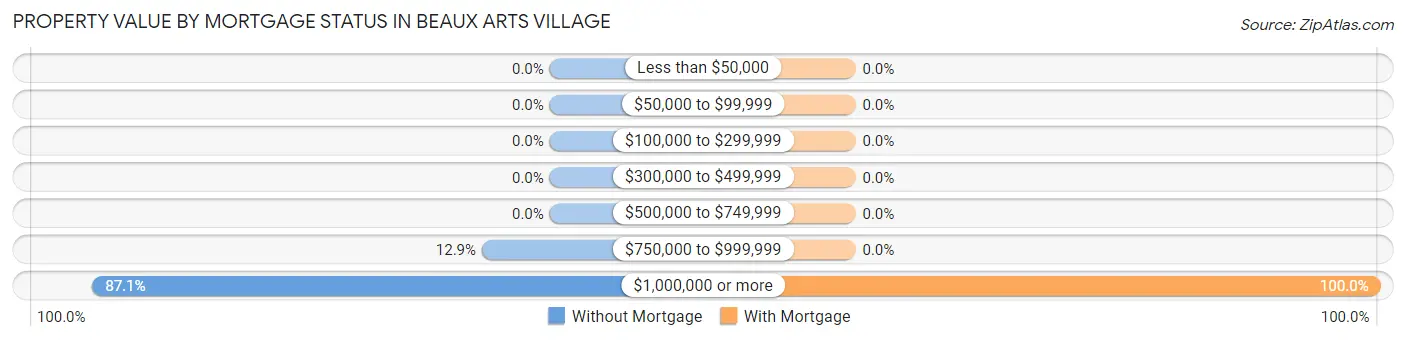
| Property Value | Without Mortgage | With Mortgage |
| Less than $50,000 | 0 (0.0%) | 0 (0.0%) |
| $50,000 to $99,999 | 0 (0.0%) | 0 (0.0%) |
| $100,000 to $299,999 | 0 (0.0%) | 0 (0.0%) |
| $300,000 to $499,999 | 0 (0.0%) | 0 (0.0%) |
| $500,000 to $749,999 | 0 (0.0%) | 0 (0.0%) |
| $750,000 to $999,999 | 4 (12.9%) | 0 (0.0%) |
| $1,000,000 or more | 27 (87.1%) | 58 (100.0%) |
| Total | 31 (100.0%) | 58 (100.0%) |
Household Income by Mortgage Status in Beaux Arts Village
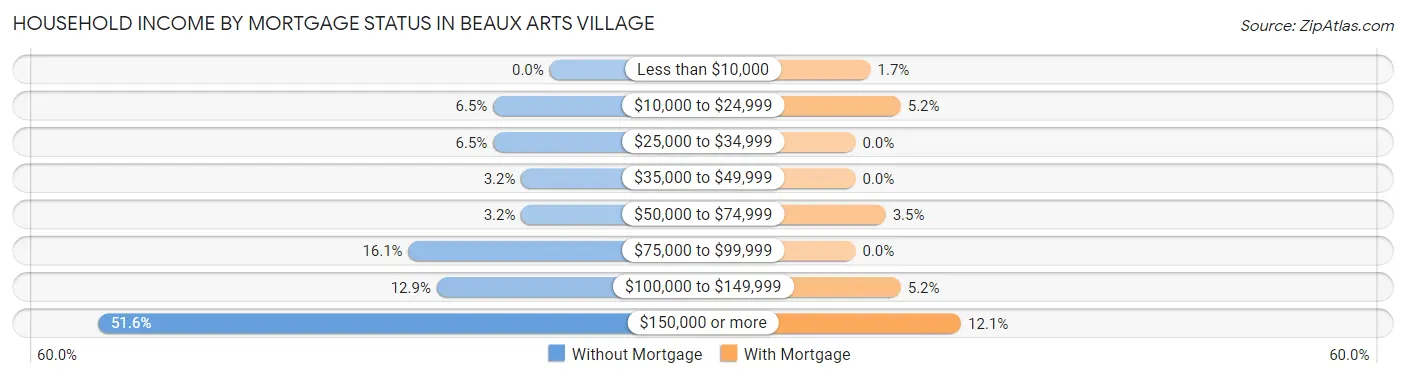
| Household Income | Without Mortgage | With Mortgage |
| Less than $10,000 | 0 (0.0%) | 1 (1.7%) |
| $10,000 to $24,999 | 2 (6.5%) | 3 (5.2%) |
| $25,000 to $34,999 | 2 (6.5%) | 0 (0.0%) |
| $35,000 to $49,999 | 1 (3.2%) | 0 (0.0%) |
| $50,000 to $74,999 | 1 (3.2%) | 2 (3.5%) |
| $75,000 to $99,999 | 5 (16.1%) | 0 (0.0%) |
| $100,000 to $149,999 | 4 (12.9%) | 3 (5.2%) |
| $150,000 or more | 16 (51.6%) | 7 (12.1%) |
| Total | 31 (100.0%) | 58 (100.0%) |
Property Value to Household Income Ratio in Beaux Arts Village
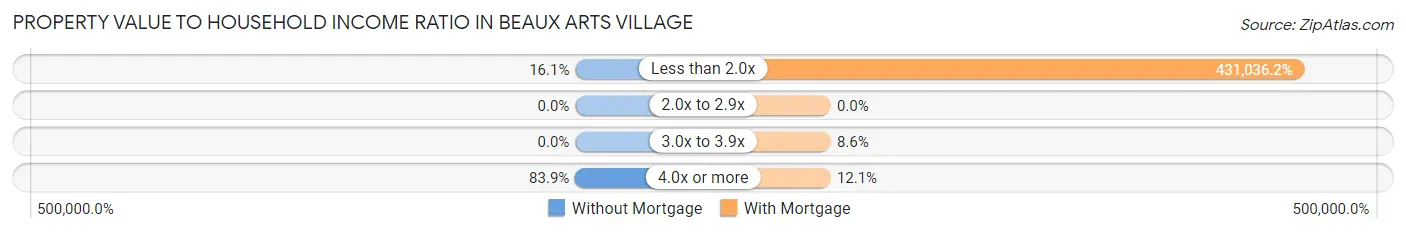
| Value-to-Income Ratio | Without Mortgage | With Mortgage |
| Less than 2.0x | 5 (16.1%) | 250,001 (431,036.2%) |
| 2.0x to 2.9x | 0 (0.0%) | 0 (0.0%) |
| 3.0x to 3.9x | 0 (0.0%) | 5 (8.6%) |
| 4.0x or more | 26 (83.9%) | 7 (12.1%) |
| Total | 31 (100.0%) | 58 (100.0%) |
Real Estate Taxes by Mortgage Status in Beaux Arts Village
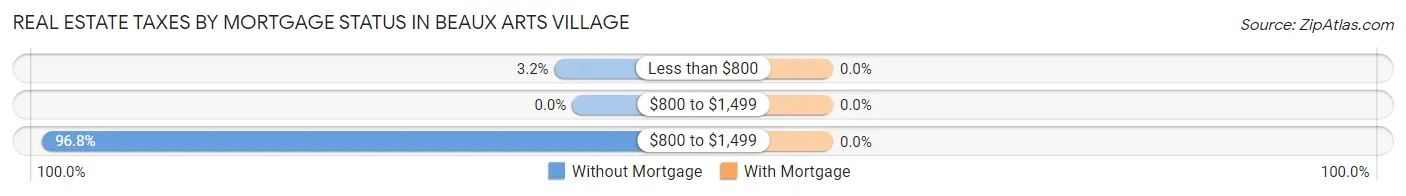
| Property Taxes | Without Mortgage | With Mortgage |
| Less than $800 | 1 (3.2%) | 0 (0.0%) |
| $800 to $1,499 | 0 (0.0%) | 0 (0.0%) |
| $800 to $1,499 | 30 (96.8%) | 0 (0.0%) |
| Total | 31 (100.0%) | 58 (100.0%) |
Health & Disability in Beaux Arts Village
Health Insurance Coverage by Age in Beaux Arts Village
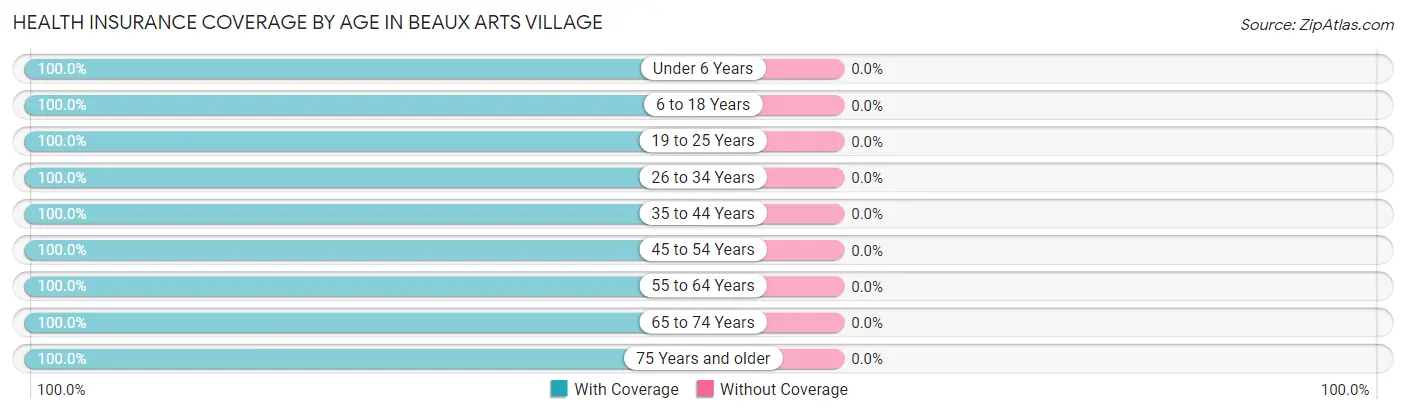
| Age Bracket | With Coverage | Without Coverage |
| Under 6 Years | 9 (100.0%) | 0 (0.0%) |
| 6 to 18 Years | 45 (100.0%) | 0 (0.0%) |
| 19 to 25 Years | 14 (100.0%) | 0 (0.0%) |
| 26 to 34 Years | 17 (100.0%) | 0 (0.0%) |
| 35 to 44 Years | 14 (100.0%) | 0 (0.0%) |
| 45 to 54 Years | 55 (100.0%) | 0 (0.0%) |
| 55 to 64 Years | 58 (100.0%) | 0 (0.0%) |
| 65 to 74 Years | 24 (100.0%) | 0 (0.0%) |
| 75 Years and older | 22 (100.0%) | 0 (0.0%) |
| Total | 258 (100.0%) | 0 (0.0%) |
Health Insurance Coverage by Citizenship Status in Beaux Arts Village
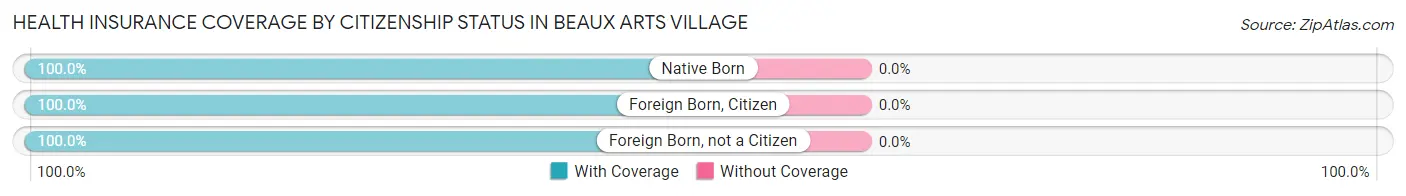
| Citizenship Status | With Coverage | Without Coverage |
| Native Born | 9 (100.0%) | 0 (0.0%) |
| Foreign Born, Citizen | 45 (100.0%) | 0 (0.0%) |
| Foreign Born, not a Citizen | 14 (100.0%) | 0 (0.0%) |
Health Insurance Coverage by Household Income in Beaux Arts Village
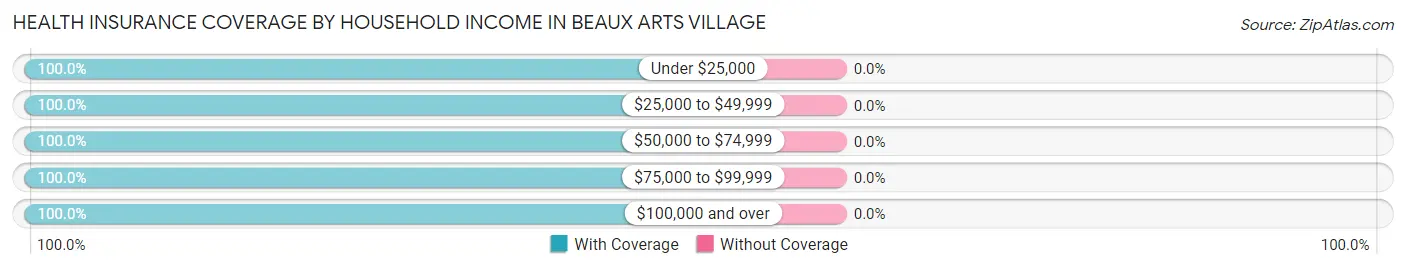
| Household Income | With Coverage | Without Coverage |
| Under $25,000 | 7 (100.0%) | 0 (0.0%) |
| $25,000 to $49,999 | 7 (100.0%) | 0 (0.0%) |
| $50,000 to $74,999 | 2 (100.0%) | 0 (0.0%) |
| $75,000 to $99,999 | 21 (100.0%) | 0 (0.0%) |
| $100,000 and over | 221 (100.0%) | 0 (0.0%) |
Public vs Private Health Insurance Coverage by Age in Beaux Arts Village
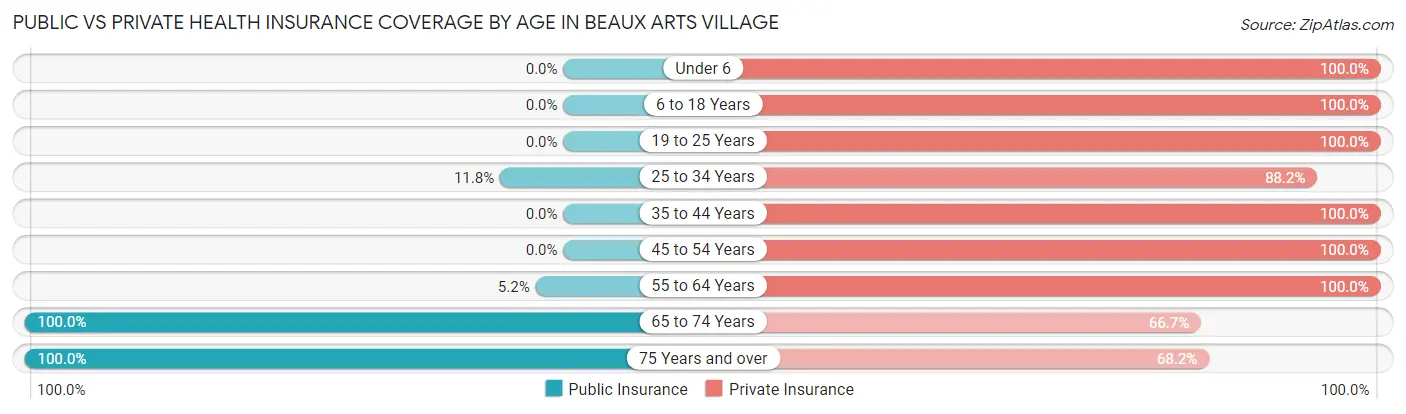
| Age Bracket | Public Insurance | Private Insurance |
| Under 6 | 0 (0.0%) | 9 (100.0%) |
| 6 to 18 Years | 0 (0.0%) | 45 (100.0%) |
| 19 to 25 Years | 0 (0.0%) | 14 (100.0%) |
| 25 to 34 Years | 2 (11.8%) | 15 (88.2%) |
| 35 to 44 Years | 0 (0.0%) | 14 (100.0%) |
| 45 to 54 Years | 0 (0.0%) | 55 (100.0%) |
| 55 to 64 Years | 3 (5.2%) | 58 (100.0%) |
| 65 to 74 Years | 24 (100.0%) | 16 (66.7%) |
| 75 Years and over | 22 (100.0%) | 15 (68.2%) |
| Total | 51 (19.8%) | 241 (93.4%) |
Disability Status by Sex by Age in Beaux Arts Village
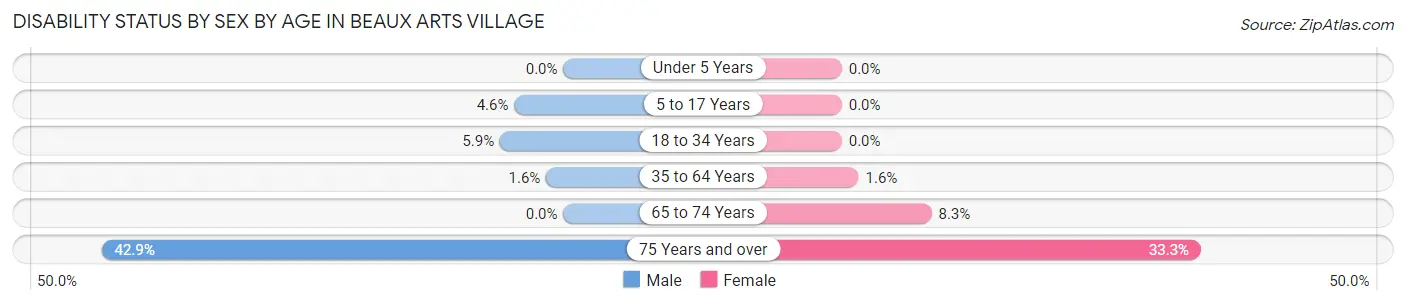
| Age Bracket | Male | Female |
| Under 5 Years | 0 (0.0%) | 0 (0.0%) |
| 5 to 17 Years | 1 (4.5%) | 0 (0.0%) |
| 18 to 34 Years | 1 (5.9%) | 0 (0.0%) |
| 35 to 64 Years | 1 (1.6%) | 1 (1.6%) |
| 65 to 74 Years | 0 (0.0%) | 1 (8.3%) |
| 75 Years and over | 3 (42.9%) | 5 (33.3%) |
Disability Class by Sex by Age in Beaux Arts Village
Disability Class: Hearing Difficulty
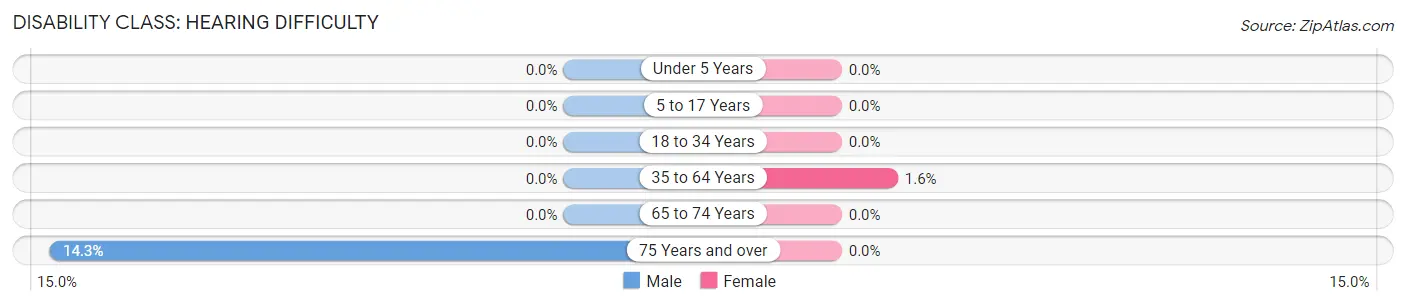
| Age Bracket | Male | Female |
| Under 5 Years | 0 (0.0%) | 0 (0.0%) |
| 5 to 17 Years | 0 (0.0%) | 0 (0.0%) |
| 18 to 34 Years | 0 (0.0%) | 0 (0.0%) |
| 35 to 64 Years | 0 (0.0%) | 1 (1.6%) |
| 65 to 74 Years | 0 (0.0%) | 0 (0.0%) |
| 75 Years and over | 1 (14.3%) | 0 (0.0%) |
Disability Class: Vision Difficulty
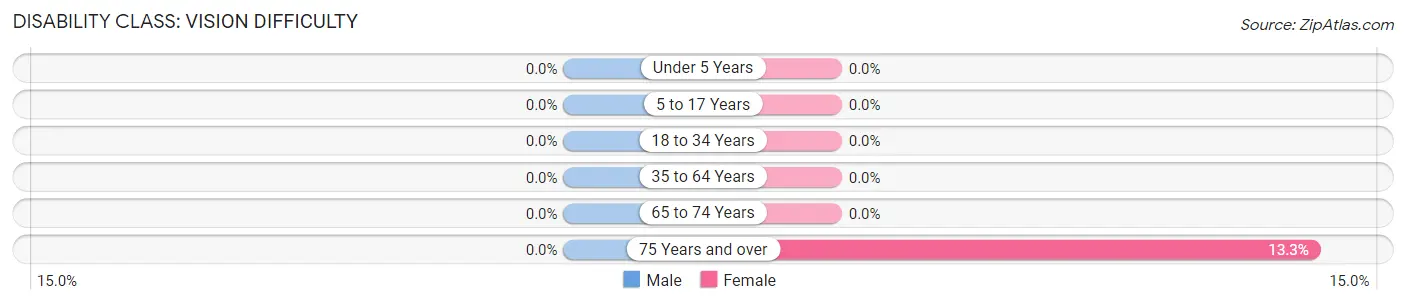
| Age Bracket | Male | Female |
| Under 5 Years | 0 (0.0%) | 0 (0.0%) |
| 5 to 17 Years | 0 (0.0%) | 0 (0.0%) |
| 18 to 34 Years | 0 (0.0%) | 0 (0.0%) |
| 35 to 64 Years | 0 (0.0%) | 0 (0.0%) |
| 65 to 74 Years | 0 (0.0%) | 0 (0.0%) |
| 75 Years and over | 0 (0.0%) | 2 (13.3%) |
Disability Class: Cognitive Difficulty
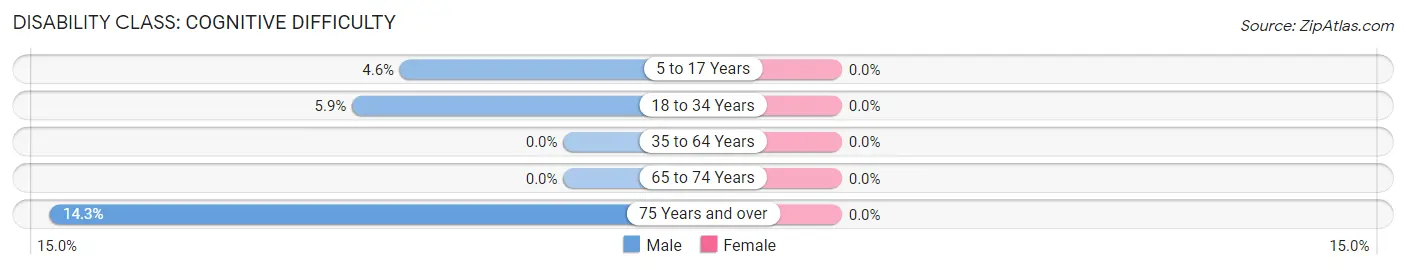
| Age Bracket | Male | Female |
| 5 to 17 Years | 1 (4.5%) | 0 (0.0%) |
| 18 to 34 Years | 1 (5.9%) | 0 (0.0%) |
| 35 to 64 Years | 0 (0.0%) | 0 (0.0%) |
| 65 to 74 Years | 0 (0.0%) | 0 (0.0%) |
| 75 Years and over | 1 (14.3%) | 0 (0.0%) |
Disability Class: Ambulatory Difficulty
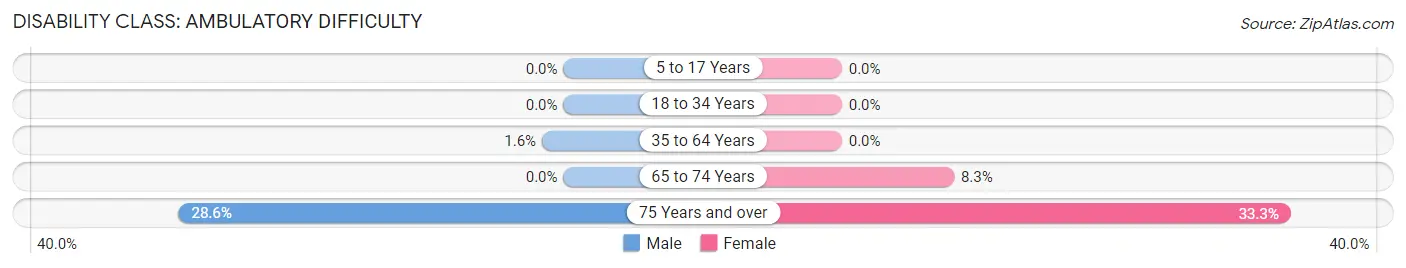
| Age Bracket | Male | Female |
| 5 to 17 Years | 0 (0.0%) | 0 (0.0%) |
| 18 to 34 Years | 0 (0.0%) | 0 (0.0%) |
| 35 to 64 Years | 1 (1.6%) | 0 (0.0%) |
| 65 to 74 Years | 0 (0.0%) | 1 (8.3%) |
| 75 Years and over | 2 (28.6%) | 5 (33.3%) |
Disability Class: Self-Care Difficulty
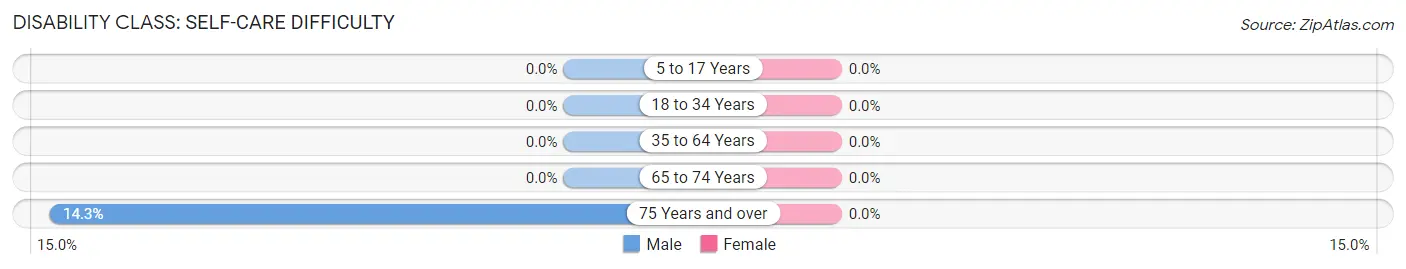
| Age Bracket | Male | Female |
| 5 to 17 Years | 0 (0.0%) | 0 (0.0%) |
| 18 to 34 Years | 0 (0.0%) | 0 (0.0%) |
| 35 to 64 Years | 0 (0.0%) | 0 (0.0%) |
| 65 to 74 Years | 0 (0.0%) | 0 (0.0%) |
| 75 Years and over | 1 (14.3%) | 0 (0.0%) |
Technology Access in Beaux Arts Village
Computing Device Access in Beaux Arts Village
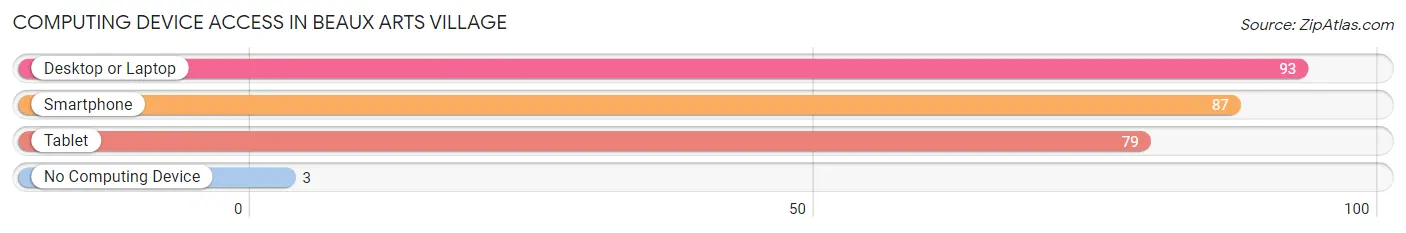
| Device Type | # Households | % Households |
| Desktop or Laptop | 93 | 96.9% |
| Smartphone | 87 | 90.6% |
| Tablet | 79 | 82.3% |
| No Computing Device | 3 | 3.1% |
| Total | 96 | 100.0% |
Internet Access in Beaux Arts Village
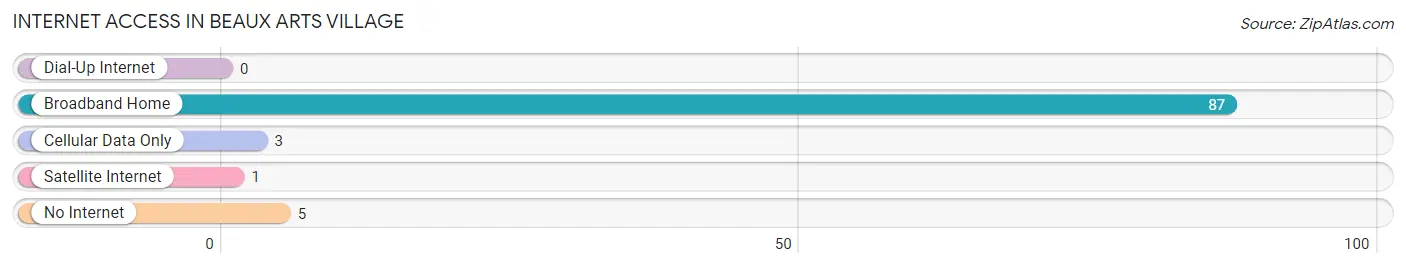
| Internet Type | # Households | % Households |
| Dial-Up Internet | 0 | 0.0% |
| Broadband Home | 87 | 90.6% |
| Cellular Data Only | 3 | 3.1% |
| Satellite Internet | 1 | 1.0% |
| No Internet | 5 | 5.2% |
| Total | 96 | 100.0% |
Beaux Arts Village Summary
Beaux Arts Village is a small town located in King County, Washington, United States. It is situated on the east side of Lake Washington, just south of Bellevue and north of Mercer Island. The population of Beaux Arts Village was 1,717 at the 2010 census.
History
Beaux Arts Village was founded in 1908 by the Beaux Arts Company, a real estate development firm. The company was founded by two brothers, Charles and William Stimson, who had previously developed the nearby town of Medina. The Stimson brothers named the town after the Beaux Arts architectural style, which was popular at the time.
The town was originally intended to be a residential community for wealthy families, and the Stimson brothers built a number of large homes in the area. The town was incorporated in 1911, and the first mayor was Charles Stimson.
Geography
Beaux Arts Village is located at 47°35'17" North, 122°11'45" West (47.588, -122.196). It is situated on the east side of Lake Washington, just south of Bellevue and north of Mercer Island. The town is bordered by the cities of Bellevue and Mercer Island to the north, and the city of Newcastle to the south.
The town has a total area of 0.7 square miles (1.8 km2), all of which is land. The terrain is mostly flat, with some hills in the northern part of the town.
Economy
Beaux Arts Village is primarily a residential community, and the majority of its residents are employed in the nearby cities of Bellevue and Seattle. The town does not have any major employers, but there are a number of small businesses located in the area.
Demographics
As of the 2010 census, there were 1,717 people, 690 households, and 486 families residing in the town. The population density was 2,521.3 people per square mile (973.2/km2). There were 730 housing units at an average density of 1,053.3 per square mile (406.7/km2). The racial makeup of the town was 87.2% White, 4.2% Asian, 2.2% African American, 0.6% Native American, 0.1% Pacific Islander, 2.7% from other races, and 3.0% from two or more races. Hispanic or Latino of any race were 6.2% of the population.
There were 690 households, out of which 28.3% had children under the age of 18 living with them, 57.2% were married couples living together, 8.3% had a female householder with no husband present, and 30.7% were non-families. 24.3% of all households were made up of individuals, and 8.3% had someone living alone who was 65 years of age or older. The average household size was 2.50 and the average family size was 3.00.
In the town, the population was spread out, with 22.7% under the age of 18, 5.2% from 18 to 24, 24.2% from 25 to 44, 33.2% from 45 to 64, and 14.7% who were 65 years of age or older. The median age was 44 years. For every 100 females, there were 97.2 males. For every 100 females age 18 and over, there were 94.2 males.
The median income for a household in the town was $90,938, and the median income for a family was $103,938. Males had a median income of $76,250 versus $50,000 for females. The per capita income for the town was $50,938. About 2.2% of families and 3.2% of the population were below the poverty line, including 3.2% of those under age 18 and none of those age 65 or over.
Common Questions
What is the Total Population of Beaux Arts Village?
Total Population of Beaux Arts Village is 258.
What is the Total Male Population of Beaux Arts Village?
Total Male Population of Beaux Arts Village is 128.
What is the Total Female Population of Beaux Arts Village?
Total Female Population of Beaux Arts Village is 130.
What is the Ratio of Males per 100 Females in Beaux Arts Village?
There are 98.46 Males per 100 Females in Beaux Arts Village.
What is the Ratio of Females per 100 Males in Beaux Arts Village?
There are 101.56 Females per 100 Males in Beaux Arts Village.
What is the Median Population Age in Beaux Arts Village?
Median Population Age in Beaux Arts Village is 53.0 Years.
What is the Average Family Size in Beaux Arts Village
Average Family Size in Beaux Arts Village is 2.9 People.
What is the Average Household Size in Beaux Arts Village
Average Household Size in Beaux Arts Village is 2.7 People.
What is Per Capita Income in Beaux Arts Village?
Per Capita income in Beaux Arts Village is $126,204.
What is the Median Family Income in Beaux Arts Village?
Median Family Income in Beaux Arts Village is $250,001.
What is the Median Household income in Beaux Arts Village?
Median Household Income in Beaux Arts Village is $250,001.
What is Income or Wage Gap in Beaux Arts Village?
Income or Wage Gap in Beaux Arts Village is 63.9%.
Women in Beaux Arts Village earn 36.1 cents for every dollar earned by a man.
What is Inequality or Gini Index in Beaux Arts Village?
Inequality or Gini Index in Beaux Arts Village is 0.45.
How Large is the Labor Force in Beaux Arts Village?
There are 146 People in the Labor Forcein in Beaux Arts Village.
What is the Percentage of People in the Labor Force in Beaux Arts Village?
64.0% of People are in the Labor Force in Beaux Arts Village.
What is the Unemployment Rate in Beaux Arts Village?
Unemployment Rate in Beaux Arts Village is 5.5%.