Newport, WA
Newport Map
Newport Overview
2,136
TOTAL POPULATION
1,078
MALE POPULATION
1,058
FEMALE POPULATION
101.89
MALES / 100 FEMALES
98.14
FEMALES / 100 MALES
38.8
MEDIAN AGE
2.9
AVG FAMILY SIZE
2.4
AVG HOUSEHOLD SIZE
$22,137
PER CAPITA INCOME
$49,194
AVG FAMILY INCOME
$46,250
AVG HOUSEHOLD INCOME
28.5%
WAGE / INCOME GAP [ % ]
71.5¢/ $1
WAGE / INCOME GAP [ $ ]
0.43
INEQUALITY / GINI INDEX
774
LABOR FORCE [ PEOPLE ]
45.8%
PERCENT IN LABOR FORCE
3.0%
UNEMPLOYMENT RATE
Newport Zip Codes
Newport Area Codes
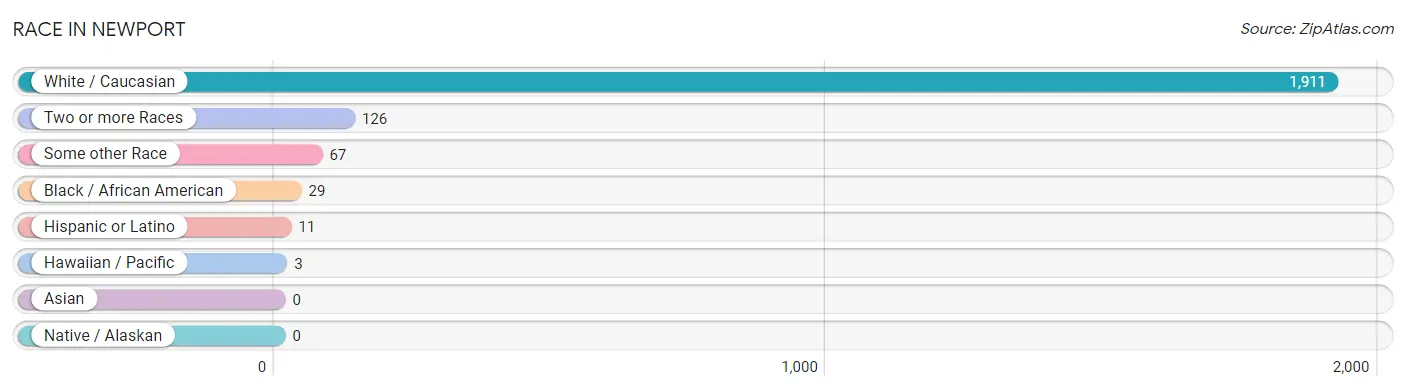
Race in Newport
The most populous races in Newport are White / Caucasian (1,911 | 89.5%), Two or more Races (126 | 5.9%), and Some other Race (67 | 3.1%).
| Race | # Population | % Population |
| Asian | 0 | 0.0% |
| Black / African American | 29 | 1.4% |
| Hawaiian / Pacific | 3 | 0.1% |
| Hispanic or Latino | 11 | 0.5% |
| Native / Alaskan | 0 | 0.0% |
| White / Caucasian | 1,911 | 89.5% |
| Two or more Races | 126 | 5.9% |
| Some other Race | 67 | 3.1% |
| Total | 2,136 | 100.0% |
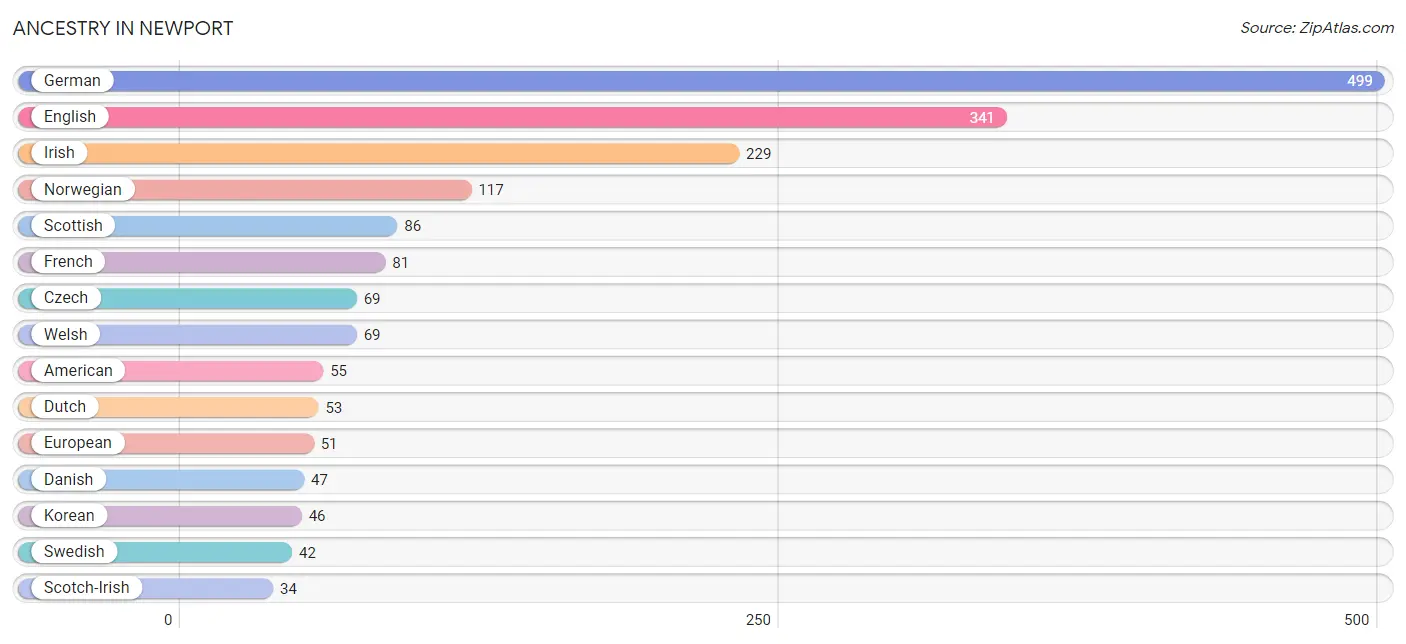
Ancestry in Newport
The most populous ancestries reported in Newport are German (499 | 23.4%), English (341 | 16.0%), Irish (229 | 10.7%), Norwegian (117 | 5.5%), and Scottish (86 | 4.0%), together accounting for 59.5% of all Newport residents.
| Ancestry | # Population | % Population |
| American | 55 | 2.6% |
| British | 4 | 0.2% |
| Canadian | 3 | 0.1% |
| Cherokee | 21 | 1.0% |
| Croatian | 15 | 0.7% |
| Czech | 69 | 3.2% |
| Danish | 47 | 2.2% |
| Dutch | 53 | 2.5% |
| English | 341 | 16.0% |
| European | 51 | 2.4% |
| Finnish | 11 | 0.5% |
| French | 81 | 3.8% |
| French Canadian | 25 | 1.2% |
| German | 499 | 23.4% |
| Irish | 229 | 10.7% |
| Italian | 25 | 1.2% |
| Jamaican | 3 | 0.1% |
| Korean | 46 | 2.1% |
| Mexican | 8 | 0.4% |
| Norwegian | 117 | 5.5% |
| Pennsylvania German | 15 | 0.7% |
| Polish | 11 | 0.5% |
| Russian | 17 | 0.8% |
| Scandinavian | 6 | 0.3% |
| Scotch-Irish | 34 | 1.6% |
| Scottish | 86 | 4.0% |
| Spanish | 3 | 0.1% |
| Swedish | 42 | 2.0% |
| Welsh | 69 | 3.2% |
| Yugoslavian | 3 | 0.1% | View All 30 Rows |
Immigrants in Newport
The most numerous immigrant groups reported in Newport came from , and Canada (20 | 0.9%), together accounting for 0.9% of all Newport residents.

| Immigration Origin | # Population | % Population |
| Canada | 20 | 0.9% | View All 1 Rows |
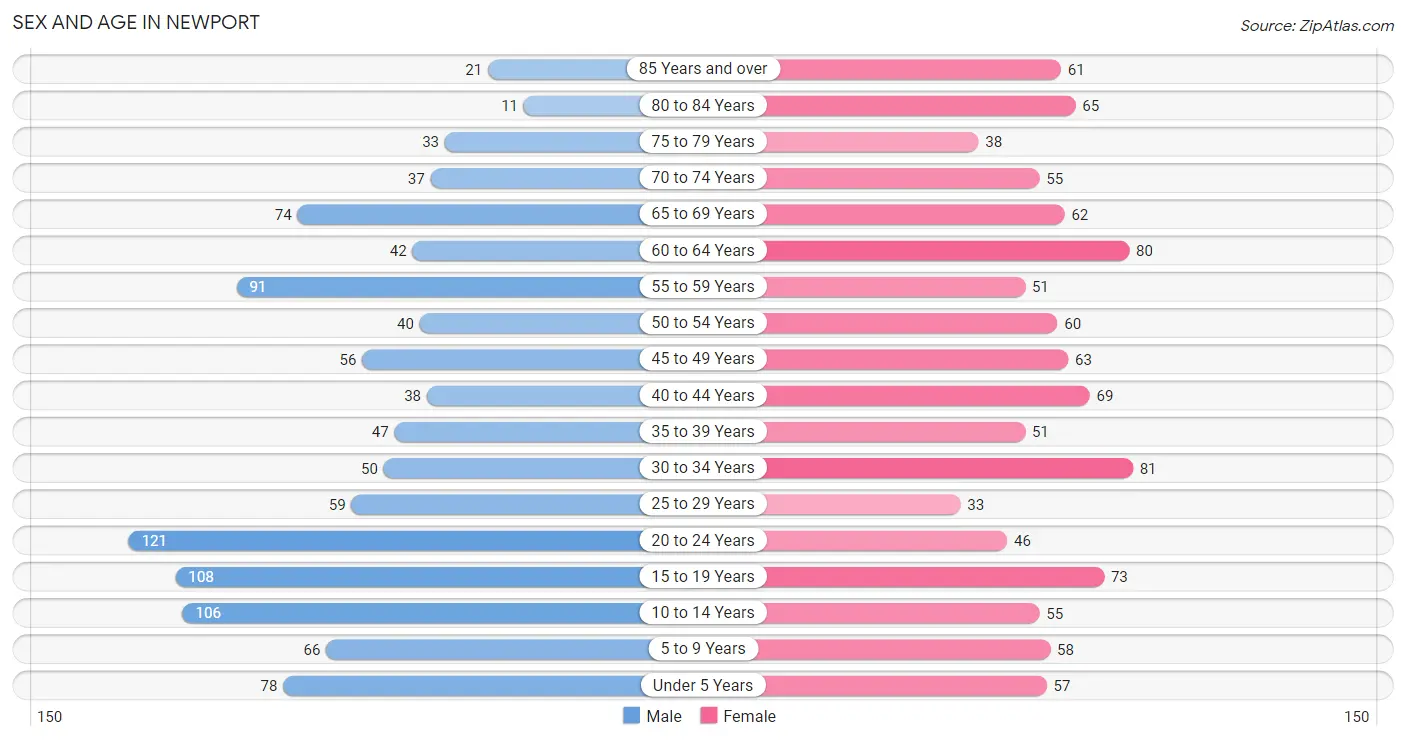
Sex and Age in Newport
Sex and Age in Newport
The most populous age groups in Newport are 20 to 24 Years (121 | 11.2%) for men and 30 to 34 Years (81 | 7.7%) for women.
| Age Bracket | Male | Female |
| Under 5 Years | 78 (7.2%) | 57 (5.4%) |
| 5 to 9 Years | 66 (6.1%) | 58 (5.5%) |
| 10 to 14 Years | 106 (9.8%) | 55 (5.2%) |
| 15 to 19 Years | 108 (10.0%) | 73 (6.9%) |
| 20 to 24 Years | 121 (11.2%) | 46 (4.3%) |
| 25 to 29 Years | 59 (5.5%) | 33 (3.1%) |
| 30 to 34 Years | 50 (4.6%) | 81 (7.7%) |
| 35 to 39 Years | 47 (4.4%) | 51 (4.8%) |
| 40 to 44 Years | 38 (3.5%) | 69 (6.5%) |
| 45 to 49 Years | 56 (5.2%) | 63 (5.9%) |
| 50 to 54 Years | 40 (3.7%) | 60 (5.7%) |
| 55 to 59 Years | 91 (8.4%) | 51 (4.8%) |
| 60 to 64 Years | 42 (3.9%) | 80 (7.6%) |
| 65 to 69 Years | 74 (6.9%) | 62 (5.9%) |
| 70 to 74 Years | 37 (3.4%) | 55 (5.2%) |
| 75 to 79 Years | 33 (3.1%) | 38 (3.6%) |
| 80 to 84 Years | 11 (1.0%) | 65 (6.1%) |
| 85 Years and over | 21 (1.9%) | 61 (5.8%) |
| Total | 1,078 (100.0%) | 1,058 (100.0%) |
Families and Households in Newport
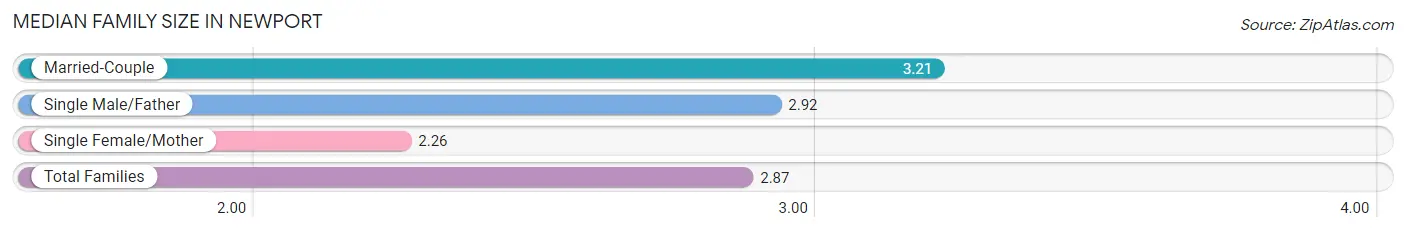
Median Family Size in Newport
The median family size in Newport is 2.87 persons per family, with married-couple families (339 | 62.8%) accounting for the largest median family size of 3.21 persons per family. On the other hand, single female/mother families (189 | 35.0%) represent the smallest median family size with 2.26 persons per family.
| Family Type | # Families | Family Size |
| Married-Couple | 339 (62.8%) | 3.21 |
| Single Male/Father | 12 (2.2%) | 2.92 |
| Single Female/Mother | 189 (35.0%) | 2.26 |
| Total Families | 540 (100.0%) | 2.87 |
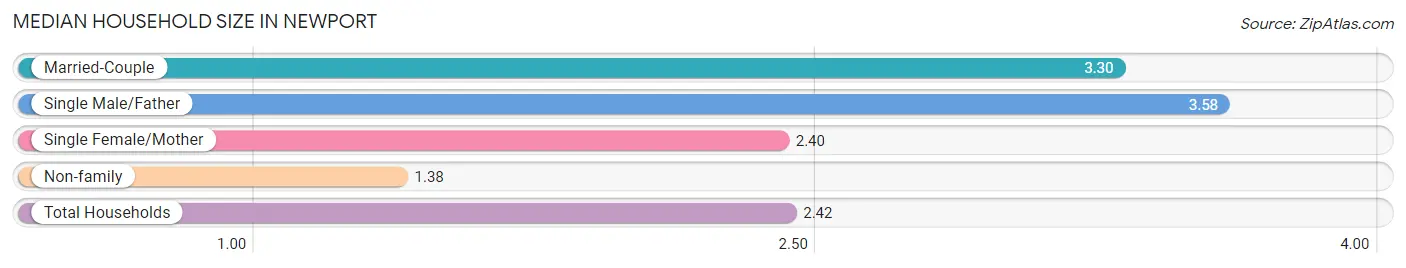
Median Household Size in Newport
The median household size in Newport is 2.42 persons per household, with single male/father households (12 | 1.4%) accounting for the largest median household size of 3.58 persons per household. non-family households (294 | 35.2%) represent the smallest median household size with 1.38 persons per household.
| Household Type | # Households | Household Size |
| Married-Couple | 339 (40.6%) | 3.30 |
| Single Male/Father | 12 (1.4%) | 3.58 |
| Single Female/Mother | 189 (22.7%) | 2.40 |
| Non-family | 294 (35.2%) | 1.38 |
| Total Households | 834 (100.0%) | 2.42 |
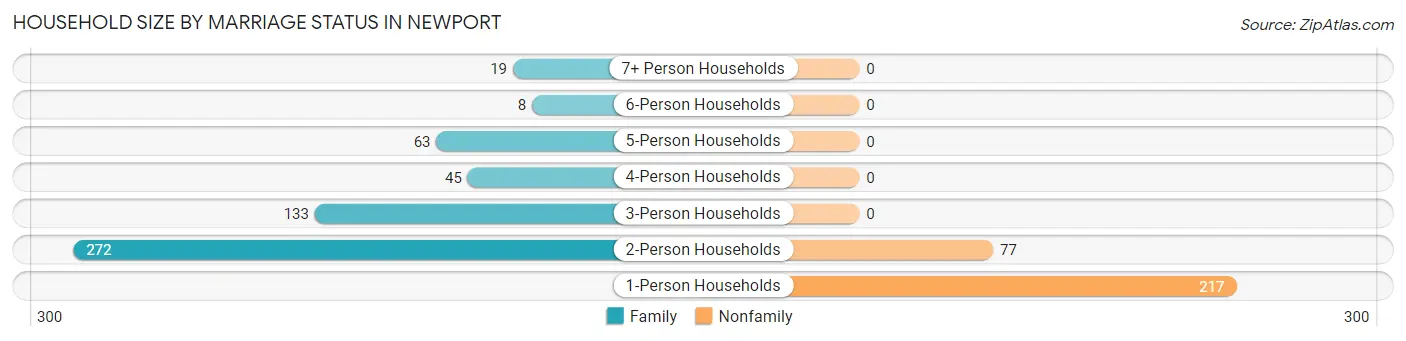
Household Size by Marriage Status in Newport
Out of a total of 834 households in Newport, 540 (64.7%) are family households, while 294 (35.2%) are nonfamily households. The most numerous type of family households are 2-person households, comprising 272, and the most common type of nonfamily households are 1-person households, comprising 217.
| Household Size | Family Households | Nonfamily Households |
| 1-Person Households | - | 217 (26.0%) |
| 2-Person Households | 272 (32.6%) | 77 (9.2%) |
| 3-Person Households | 133 (16.0%) | 0 (0.0%) |
| 4-Person Households | 45 (5.4%) | 0 (0.0%) |
| 5-Person Households | 63 (7.5%) | 0 (0.0%) |
| 6-Person Households | 8 (1.0%) | 0 (0.0%) |
| 7+ Person Households | 19 (2.3%) | 0 (0.0%) |
| Total | 540 (64.7%) | 294 (35.2%) |
Female Fertility in Newport
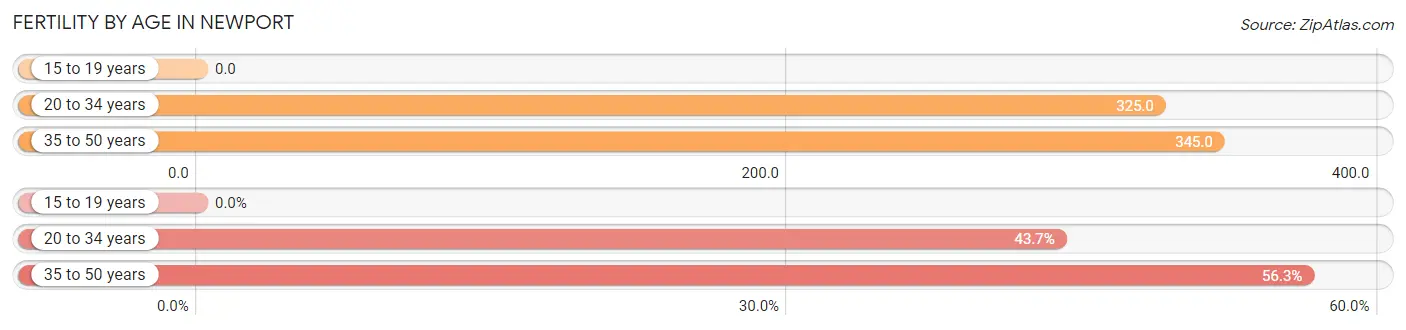
Fertility by Age in Newport
Average fertility rate in Newport is 279.0 births per 1,000 women. Women in the age bracket of 35 to 50 years have the highest fertility rate with 345.0 births per 1,000 women. Women in the age bracket of 35 to 50 years acount for 56.3% of all women with births.
| Age Bracket | Women with Births | Births / 1,000 Women |
| 15 to 19 years | 0 (0.0%) | 0.0 |
| 20 to 34 years | 52 (43.7%) | 325.0 |
| 35 to 50 years | 67 (56.3%) | 345.0 |
| Total | 119 (100.0%) | 279.0 |
Fertility by Age by Marriage Status in Newport
49.6% of women with births (119) in Newport are married. The highest percentage of unmarried women with births falls into 20 to 34 years age bracket with 100.0% of them unmarried at the time of birth, while the lowest percentage of unmarried women with births belong to 35 to 50 years age bracket with 11.9% of them unmarried.
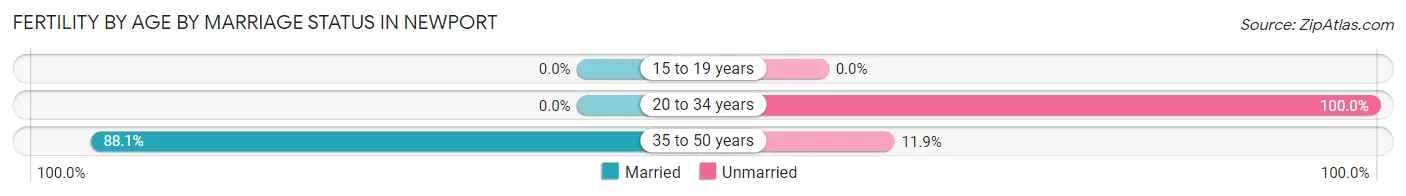
| Age Bracket | Married | Unmarried |
| 15 to 19 years | 0 (0.0%) | 0 (0.0%) |
| 20 to 34 years | 0 (0.0%) | 52 (100.0%) |
| 35 to 50 years | 59 (88.1%) | 8 (11.9%) |
| Total | 59 (49.6%) | 60 (50.4%) |
Fertility by Education in Newport
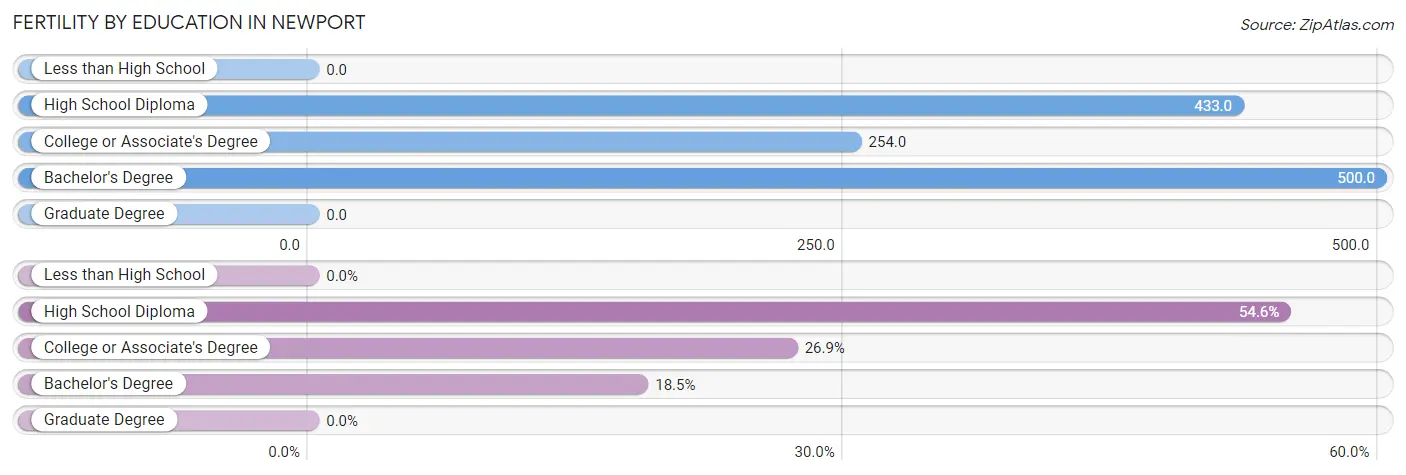
| Educational Attainment | Women with Births | Births / 1,000 Women |
| Less than High School | 0 (0.0%) | 0.0 |
| High School Diploma | 65 (54.6%) | 433.0 |
| College or Associate's Degree | 32 (26.9%) | 254.0 |
| Bachelor's Degree | 22 (18.5%) | 500.0 |
| Graduate Degree | 0 (0.0%) | 0.0 |
| Total | 119 (100.0%) | 279.0 |
Fertility by Education by Marriage Status in Newport
50.4% of women with births in Newport are unmarried. Women with the educational attainment of bachelor's degree are most likely to be married with 100.0% of them married at childbirth, while women with the educational attainment of high school diploma are least likely to be married with 76.9% of them unmarried at childbirth.
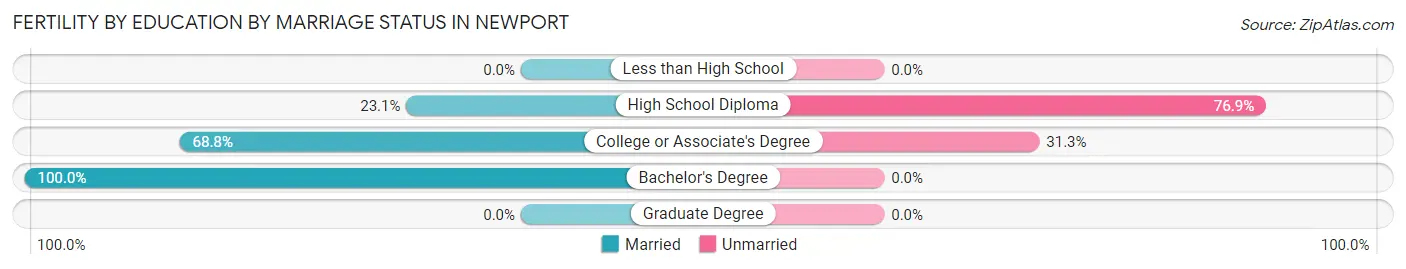
| Educational Attainment | Married | Unmarried |
| Less than High School | 0 (0.0%) | 0 (0.0%) |
| High School Diploma | 15 (23.1%) | 50 (76.9%) |
| College or Associate's Degree | 22 (68.8%) | 10 (31.2%) |
| Bachelor's Degree | 22 (100.0%) | 0 (0.0%) |
| Graduate Degree | 0 (0.0%) | 0 (0.0%) |
| Total | 59 (49.6%) | 60 (50.4%) |
Income in Newport
Income Overview in Newport
Per Capita Income in Newport is $22,137, while median incomes of families and households are $49,194 and $46,250 respectively.
| Characteristic | Number | Measure |
| Per Capita Income | 2,136 | $22,137 |
| Median Family Income | 540 | $49,194 |
| Mean Family Income | 540 | $62,704 |
| Median Household Income | 834 | $46,250 |
| Mean Household Income | 834 | $55,748 |
| Income Deficit | 540 | $0 |
| Wage / Income Gap (%) | 2,136 | 28.53% |
| Wage / Income Gap ($) | 2,136 | 71.47¢ per $1 |
| Gini / Inequality Index | 2,136 | 0.43 |
Earnings by Sex in Newport
Average Earnings in Newport are $29,137, $36,292 for men and $25,938 for women, a difference of 28.5%.
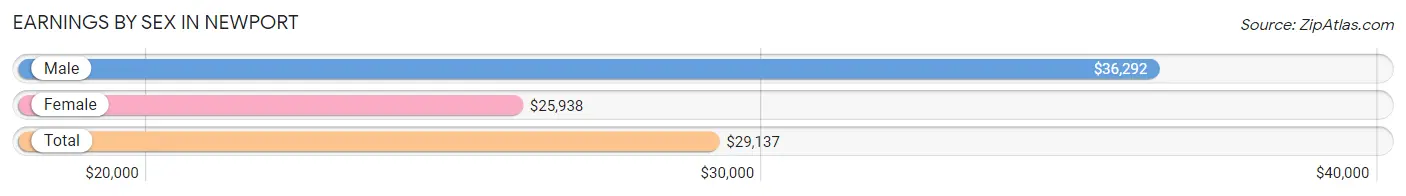
| Sex | Number | Average Earnings |
| Male | 447 (52.6%) | $36,292 |
| Female | 402 (47.3%) | $25,938 |
| Total | 849 (100.0%) | $29,137 |
Earnings by Sex by Income Bracket in Newport
The most common earnings brackets in Newport are $75,000 to $99,999 for men (68 | 15.2%) and $25,000 to $29,999 for women (53 | 13.2%).
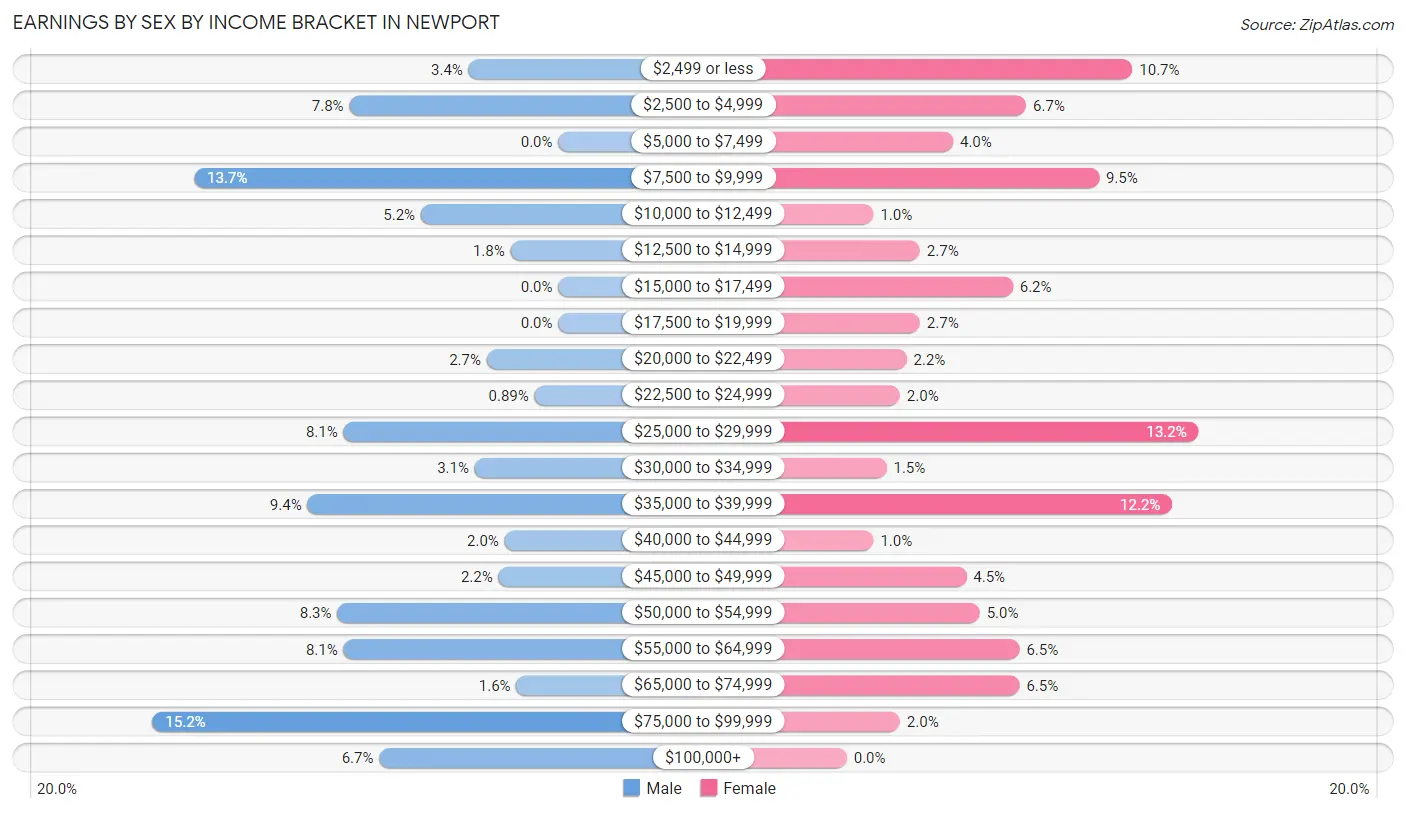
| Income | Male | Female |
| $2,499 or less | 15 (3.4%) | 43 (10.7%) |
| $2,500 to $4,999 | 35 (7.8%) | 27 (6.7%) |
| $5,000 to $7,499 | 0 (0.0%) | 16 (4.0%) |
| $7,500 to $9,999 | 61 (13.7%) | 38 (9.5%) |
| $10,000 to $12,499 | 23 (5.1%) | 4 (1.0%) |
| $12,500 to $14,999 | 8 (1.8%) | 11 (2.7%) |
| $15,000 to $17,499 | 0 (0.0%) | 25 (6.2%) |
| $17,500 to $19,999 | 0 (0.0%) | 11 (2.7%) |
| $20,000 to $22,499 | 12 (2.7%) | 9 (2.2%) |
| $22,500 to $24,999 | 4 (0.9%) | 8 (2.0%) |
| $25,000 to $29,999 | 36 (8.1%) | 53 (13.2%) |
| $30,000 to $34,999 | 14 (3.1%) | 6 (1.5%) |
| $35,000 to $39,999 | 42 (9.4%) | 49 (12.2%) |
| $40,000 to $44,999 | 9 (2.0%) | 4 (1.0%) |
| $45,000 to $49,999 | 10 (2.2%) | 18 (4.5%) |
| $50,000 to $54,999 | 37 (8.3%) | 20 (5.0%) |
| $55,000 to $64,999 | 36 (8.1%) | 26 (6.5%) |
| $65,000 to $74,999 | 7 (1.6%) | 26 (6.5%) |
| $75,000 to $99,999 | 68 (15.2%) | 8 (2.0%) |
| $100,000+ | 30 (6.7%) | 0 (0.0%) |
| Total | 447 (100.0%) | 402 (100.0%) |
Earnings by Sex by Educational Attainment in Newport
Average earnings in Newport are $52,563 for men and $26,927 for women, a difference of 48.8%. Men with an educational attainment of bachelor's degree enjoy the highest average annual earnings of $59,375, while those with high school diploma education earn the least with $48,375. Women with an educational attainment of graduate degree earn the most with the average annual earnings of $73,269, while those with college or associate's degree education have the smallest earnings of $36,500.
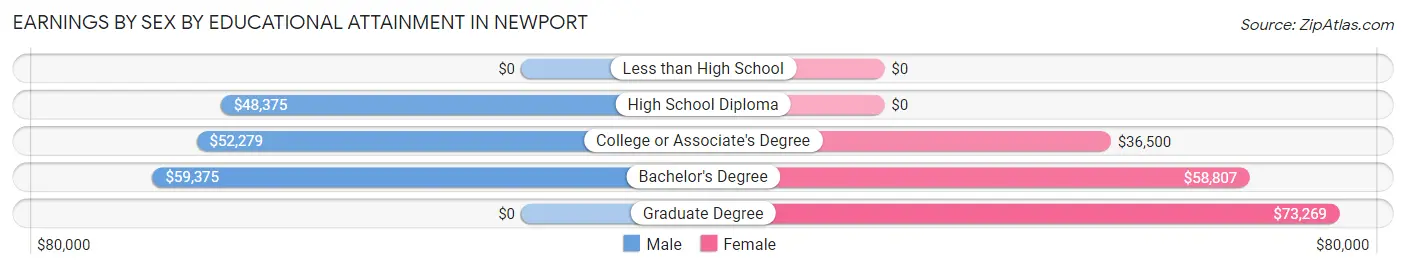
| Educational Attainment | Male Income | Female Income |
| Less than High School | - | - |
| High School Diploma | $48,375 | $0 |
| College or Associate's Degree | $52,279 | $36,500 |
| Bachelor's Degree | $59,375 | $58,807 |
| Graduate Degree | - | - |
| Total | $52,563 | $26,927 |
Family Income in Newport
Family Income Brackets in Newport
According to the Newport family income data, there are 97 families falling into the $35,000 to $49,999 income range, which is the most common income bracket and makes up 18.0% of all families. Conversely, the $200,000+ income bracket is the least frequent group with only 4 families (0.7%) belonging to this category.
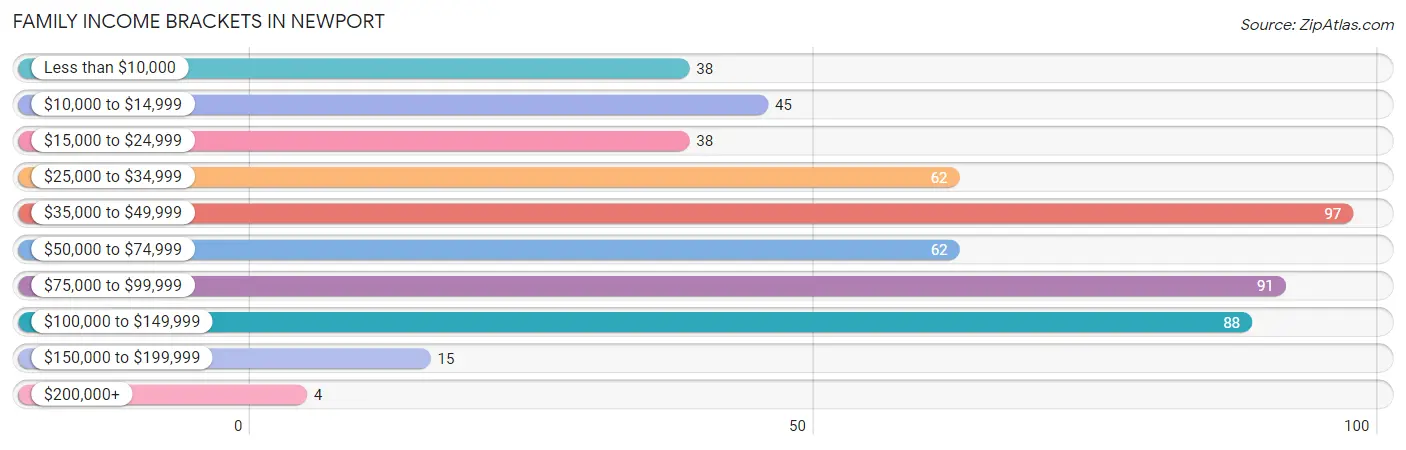
| Income Bracket | # Families | % Families |
| Less than $10,000 | 38 | 7.0% |
| $10,000 to $14,999 | 45 | 8.3% |
| $15,000 to $24,999 | 38 | 7.0% |
| $25,000 to $34,999 | 62 | 11.5% |
| $35,000 to $49,999 | 97 | 18.0% |
| $50,000 to $74,999 | 62 | 11.5% |
| $75,000 to $99,999 | 91 | 16.9% |
| $100,000 to $149,999 | 88 | 16.3% |
| $150,000 to $199,999 | 15 | 2.8% |
| $200,000+ | 4 | 0.7% |
Family Income by Famaliy Size in Newport
4-person families (53 | 9.8%) account for the highest median family income in Newport with $107,679 per family, while 4-person families (53 | 9.8%) have the highest median income of $26,920 per family member.
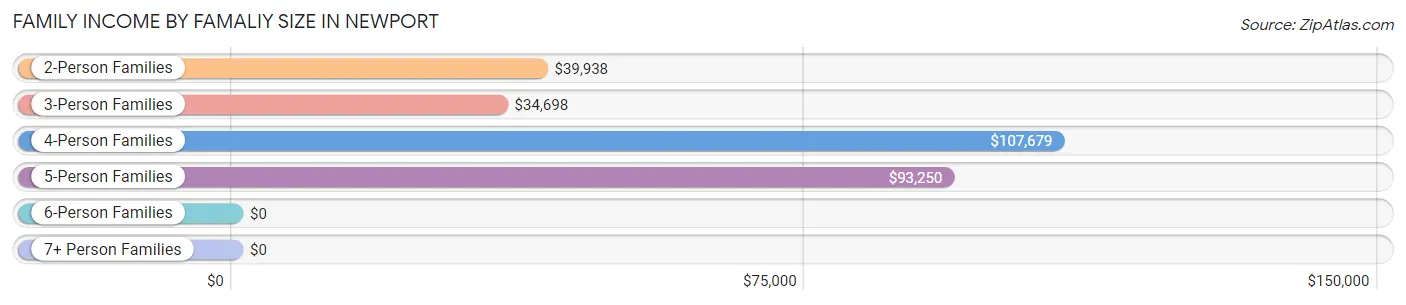
| Income Bracket | # Families | Median Income |
| 2-Person Families | 299 (55.4%) | $39,938 |
| 3-Person Families | 113 (20.9%) | $34,698 |
| 4-Person Families | 53 (9.8%) | $107,679 |
| 5-Person Families | 51 (9.4%) | $93,250 |
| 6-Person Families | 8 (1.5%) | $0 |
| 7+ Person Families | 16 (3.0%) | $0 |
| Total | 540 (100.0%) | $49,194 |
Family Income by Number of Earners in Newport
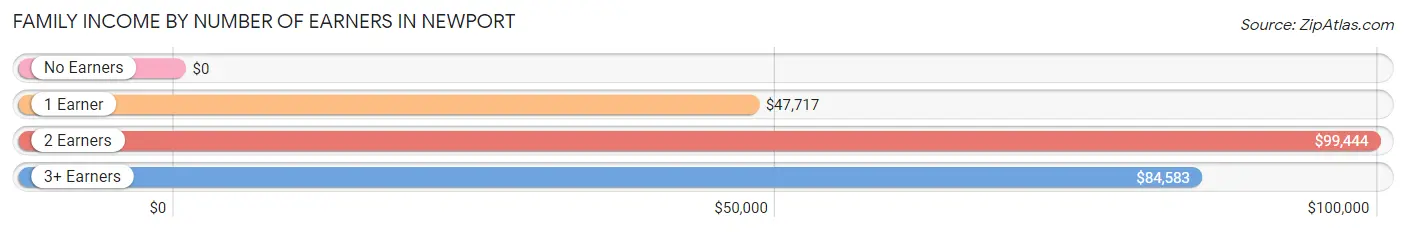
| Number of Earners | # Families | Median Income |
| No Earners | 122 (22.6%) | $0 |
| 1 Earner | 250 (46.3%) | $47,717 |
| 2 Earners | 122 (22.6%) | $99,444 |
| 3+ Earners | 46 (8.5%) | $84,583 |
| Total | 540 (100.0%) | $49,194 |
Household Income in Newport
Household Income Brackets in Newport
With 137 households falling in the category, the $35,000 to $49,999 income range is the most frequent in Newport, accounting for 16.4% of all households. In contrast, only 4 households (0.5%) fall into the $200,000+ income bracket, making it the least populous group.
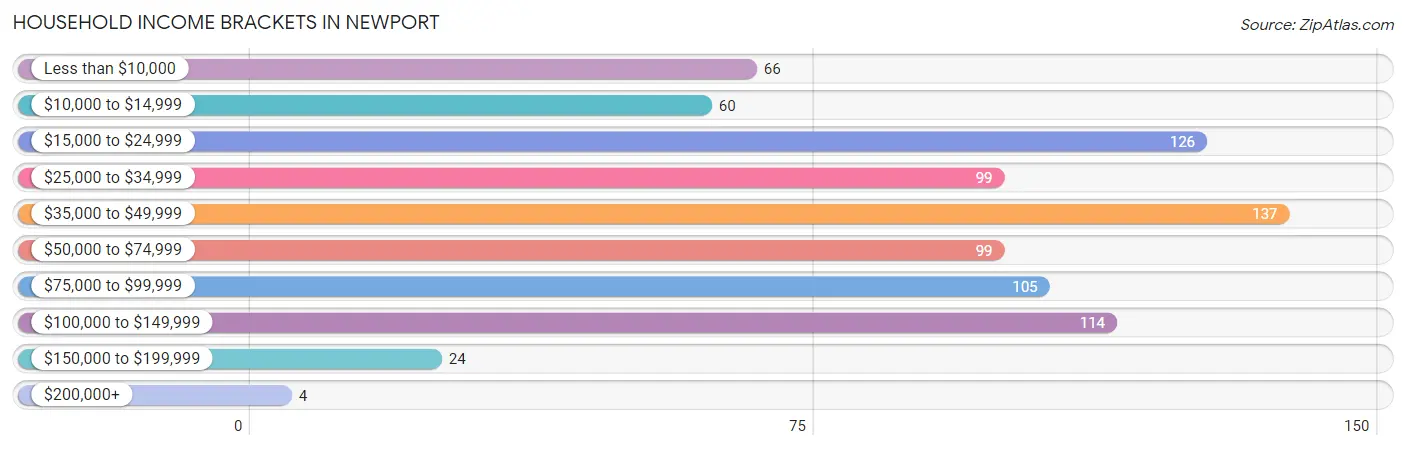
| Income Bracket | # Households | % Households |
| Less than $10,000 | 66 | 7.9% |
| $10,000 to $14,999 | 60 | 7.2% |
| $15,000 to $24,999 | 126 | 15.1% |
| $25,000 to $34,999 | 99 | 11.9% |
| $35,000 to $49,999 | 137 | 16.4% |
| $50,000 to $74,999 | 99 | 11.9% |
| $75,000 to $99,999 | 105 | 12.6% |
| $100,000 to $149,999 | 114 | 13.7% |
| $150,000 to $199,999 | 24 | 2.9% |
| $200,000+ | 4 | 0.5% |
Household Income by Householder Age in Newport
The median household income in Newport is $46,250, with the highest median household income of $66,667 found in the 45 to 64 years age bracket for the primary householder. A total of 304 households (36.4%) fall into this category. Meanwhile, the 15 to 24 years age bracket for the primary householder has the lowest median household income of $0, with 46 households (5.5%) in this group.
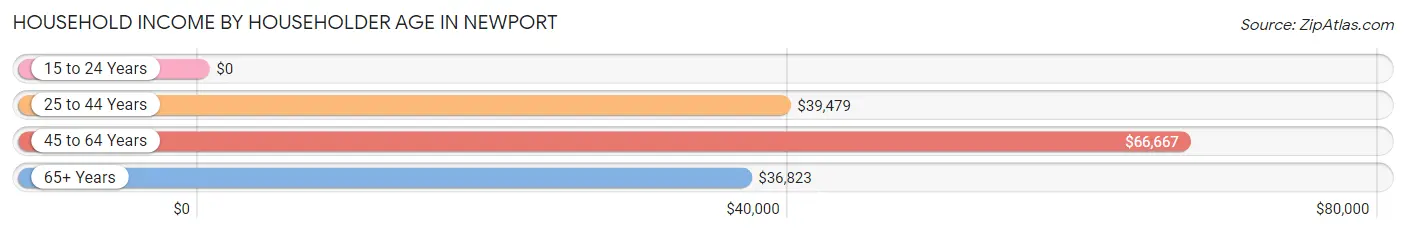
| Income Bracket | # Households | Median Income |
| 15 to 24 Years | 46 (5.5%) | $0 |
| 25 to 44 Years | 179 (21.5%) | $39,479 |
| 45 to 64 Years | 304 (36.4%) | $66,667 |
| 65+ Years | 305 (36.6%) | $36,823 |
| Total | 834 (100.0%) | $46,250 |
Poverty in Newport
Income Below Poverty by Sex and Age in Newport
With 21.3% poverty level for males and 26.3% for females among the residents of Newport, 18 to 24 year old males and 16 and 17 year old females are the most vulnerable to poverty, with 72 males (43.9%) and 26 females (55.3%) in their respective age groups living below the poverty level.
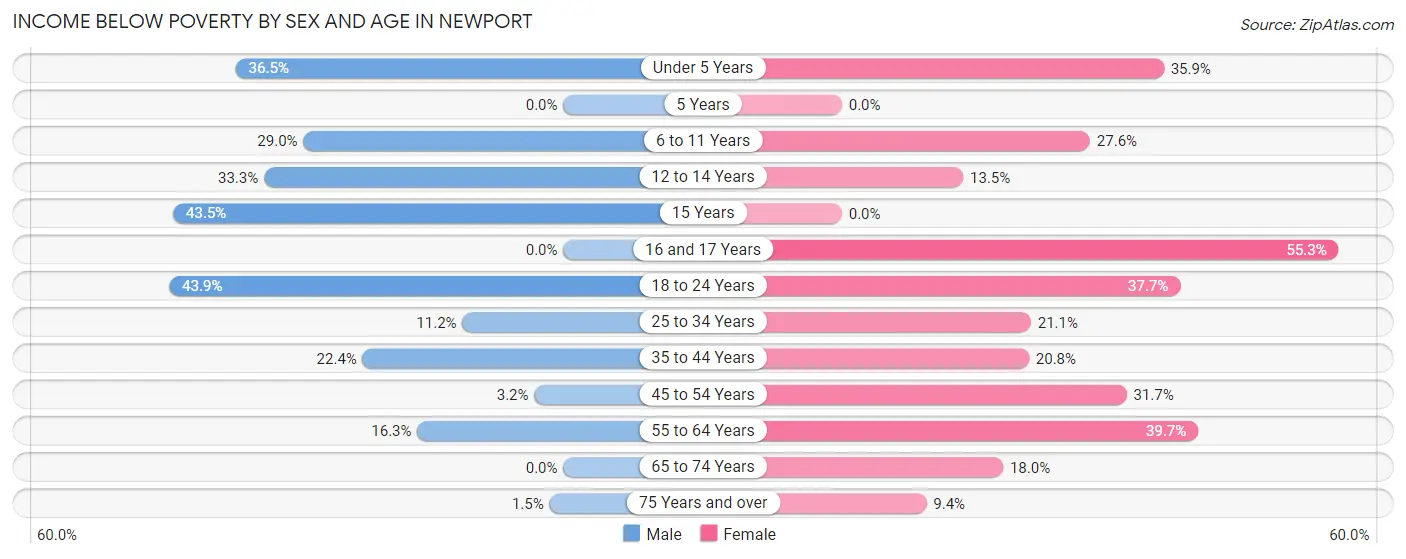
| Age Bracket | Male | Female |
| Under 5 Years | 27 (36.5%) | 19 (35.8%) |
| 5 Years | 0 (0.0%) | 0 (0.0%) |
| 6 to 11 Years | 33 (28.9%) | 21 (27.6%) |
| 12 to 14 Years | 16 (33.3%) | 5 (13.5%) |
| 15 Years | 10 (43.5%) | 0 (0.0%) |
| 16 and 17 Years | 0 (0.0%) | 26 (55.3%) |
| 18 to 24 Years | 72 (43.9%) | 26 (37.7%) |
| 25 to 34 Years | 10 (11.2%) | 24 (21.0%) |
| 35 to 44 Years | 19 (22.4%) | 25 (20.8%) |
| 45 to 54 Years | 3 (3.2%) | 39 (31.7%) |
| 55 to 64 Years | 20 (16.3%) | 50 (39.7%) |
| 65 to 74 Years | 0 (0.0%) | 21 (17.9%) |
| 75 Years and over | 1 (1.5%) | 13 (9.4%) |
| Total | 211 (21.3%) | 269 (26.3%) |
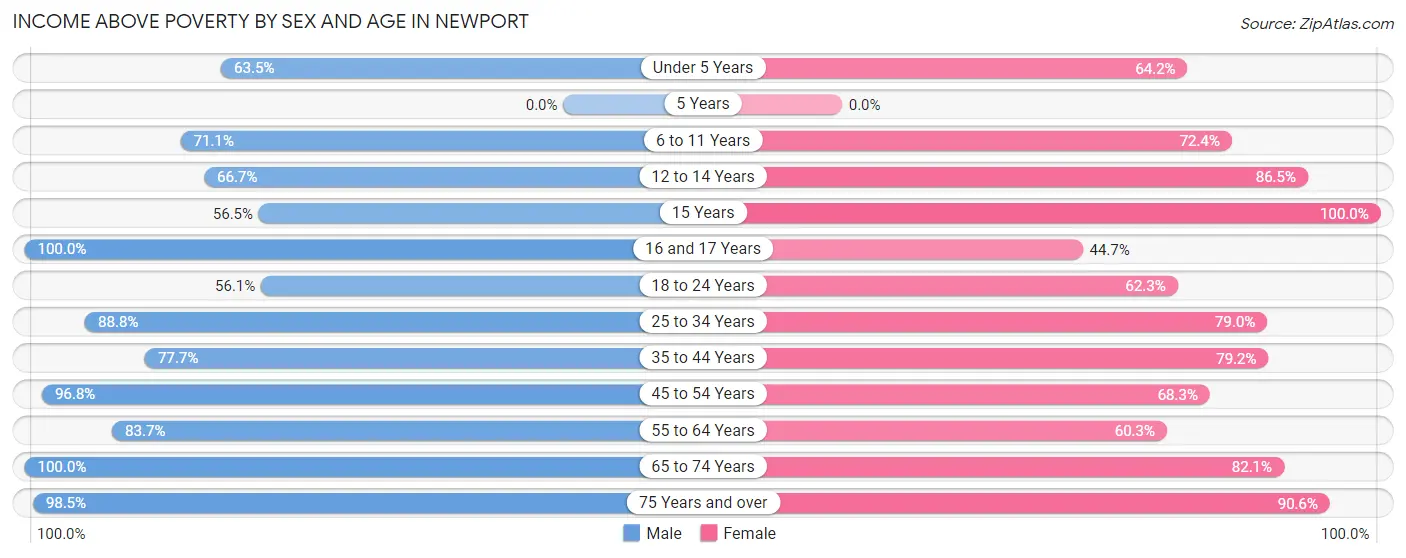
Income Above Poverty by Sex and Age in Newport
According to the poverty statistics in Newport, males aged 16 and 17 years and females aged 15 years are the age groups that are most secure financially, with 100.0% of males and 100.0% of females in these age groups living above the poverty line.
| Age Bracket | Male | Female |
| Under 5 Years | 47 (63.5%) | 34 (64.1%) |
| 5 Years | 0 (0.0%) | 0 (0.0%) |
| 6 to 11 Years | 81 (71.1%) | 55 (72.4%) |
| 12 to 14 Years | 32 (66.7%) | 32 (86.5%) |
| 15 Years | 13 (56.5%) | 3 (100.0%) |
| 16 and 17 Years | 30 (100.0%) | 21 (44.7%) |
| 18 to 24 Years | 92 (56.1%) | 43 (62.3%) |
| 25 to 34 Years | 79 (88.8%) | 90 (78.9%) |
| 35 to 44 Years | 66 (77.6%) | 95 (79.2%) |
| 45 to 54 Years | 90 (96.8%) | 84 (68.3%) |
| 55 to 64 Years | 103 (83.7%) | 76 (60.3%) |
| 65 to 74 Years | 84 (100.0%) | 96 (82.1%) |
| 75 Years and over | 64 (98.5%) | 125 (90.6%) |
| Total | 781 (78.7%) | 754 (73.7%) |
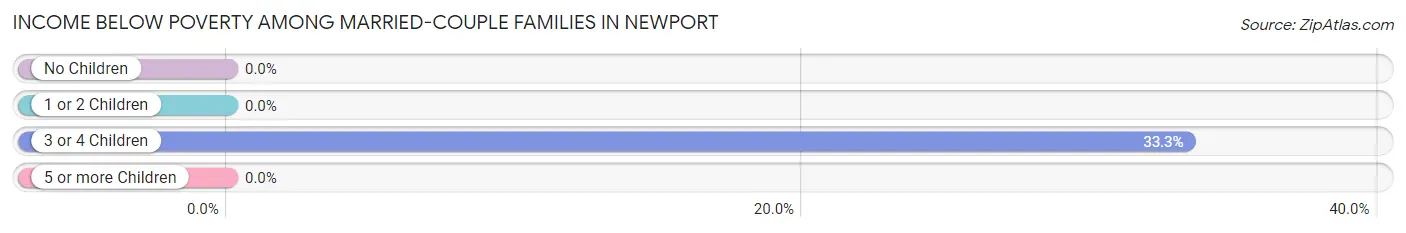
Income Below Poverty Among Married-Couple Families in Newport
The poverty statistics for married-couple families in Newport show that 5.6% or 19 of the total 339 families live below the poverty line. Families with 3 or 4 children have the highest poverty rate of 33.3%, comprising of 19 families. On the other hand, families with no children have the lowest poverty rate of 0.0%, which includes 0 families.
| Children | Above Poverty | Below Poverty |
| No Children | 177 (100.0%) | 0 (0.0%) |
| 1 or 2 Children | 105 (100.0%) | 0 (0.0%) |
| 3 or 4 Children | 38 (66.7%) | 19 (33.3%) |
| 5 or more Children | 0 (0.0%) | 0 (0.0%) |
| Total | 320 (94.4%) | 19 (5.6%) |
Income Below Poverty Among Single-Parent Households in Newport
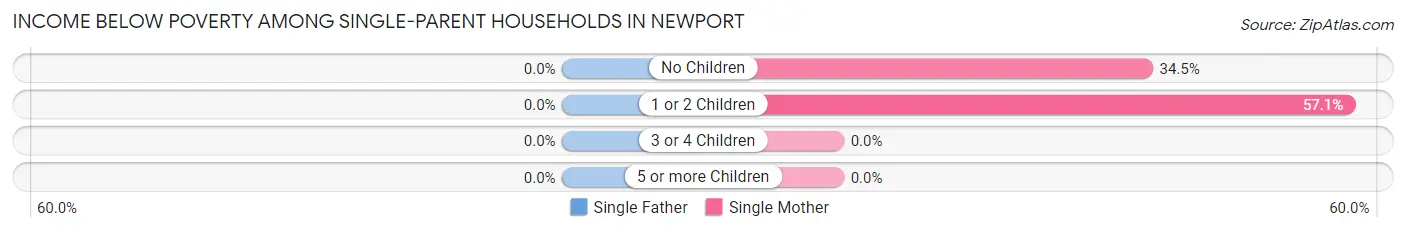
| Children | Single Father | Single Mother |
| No Children | 0 (0.0%) | 29 (34.5%) |
| 1 or 2 Children | 0 (0.0%) | 60 (57.1%) |
| 3 or 4 Children | 0 (0.0%) | 0 (0.0%) |
| 5 or more Children | 0 (0.0%) | 0 (0.0%) |
| Total | 0 (0.0%) | 89 (47.1%) |
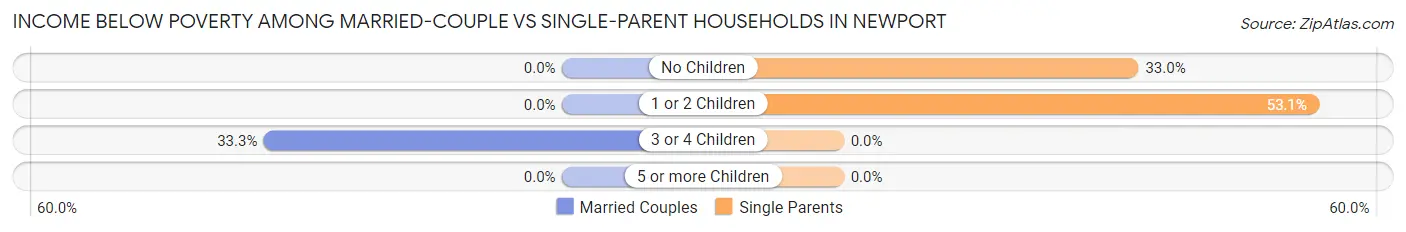
Income Below Poverty Among Married-Couple vs Single-Parent Households in Newport
The poverty data for Newport shows that 19 of the married-couple family households (5.6%) and 89 of the single-parent households (44.3%) are living below the poverty level. Within the married-couple family households, those with 3 or 4 children have the highest poverty rate, with 19 households (33.3%) falling below the poverty line. Among the single-parent households, those with 1 or 2 children have the highest poverty rate, with 60 household (53.1%) living below poverty.
| Children | Married-Couple Families | Single-Parent Households |
| No Children | 0 (0.0%) | 29 (33.0%) |
| 1 or 2 Children | 0 (0.0%) | 60 (53.1%) |
| 3 or 4 Children | 19 (33.3%) | 0 (0.0%) |
| 5 or more Children | 0 (0.0%) | 0 (0.0%) |
| Total | 19 (5.6%) | 89 (44.3%) |
Employment Characteristics in Newport
Employment by Class of Employer in Newport
Among the 731 employed individuals in Newport, private company employees (541 | 74.0%), not-for-profit organizations (61 | 8.3%), and local government employees (47 | 6.4%) make up the most common classes of employment.
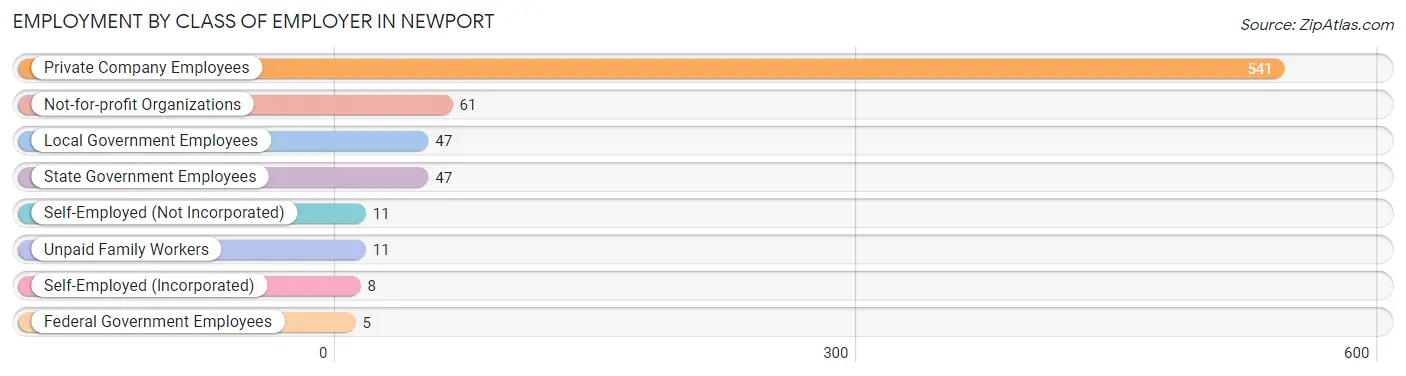
| Employer Class | # Employees | % Employees |
| Private Company Employees | 541 | 74.0% |
| Self-Employed (Incorporated) | 8 | 1.1% |
| Self-Employed (Not Incorporated) | 11 | 1.5% |
| Not-for-profit Organizations | 61 | 8.3% |
| Local Government Employees | 47 | 6.4% |
| State Government Employees | 47 | 6.4% |
| Federal Government Employees | 5 | 0.7% |
| Unpaid Family Workers | 11 | 1.5% |
| Total | 731 | 100.0% |
Employment Status by Age in Newport
According to the labor force statistics for Newport, out of the total population over 16 years of age (1,690), 45.8% or 774 individuals are in the labor force, with 3.0% or 23 of them unemployed. The age group with the highest labor force participation rate is 35 to 44 years, with 78.5% or 161 individuals in the labor force. Within the labor force, the 16 to 19 years age range has the highest percentage of unemployed individuals, with 17.0% or 15 of them being unemployed.
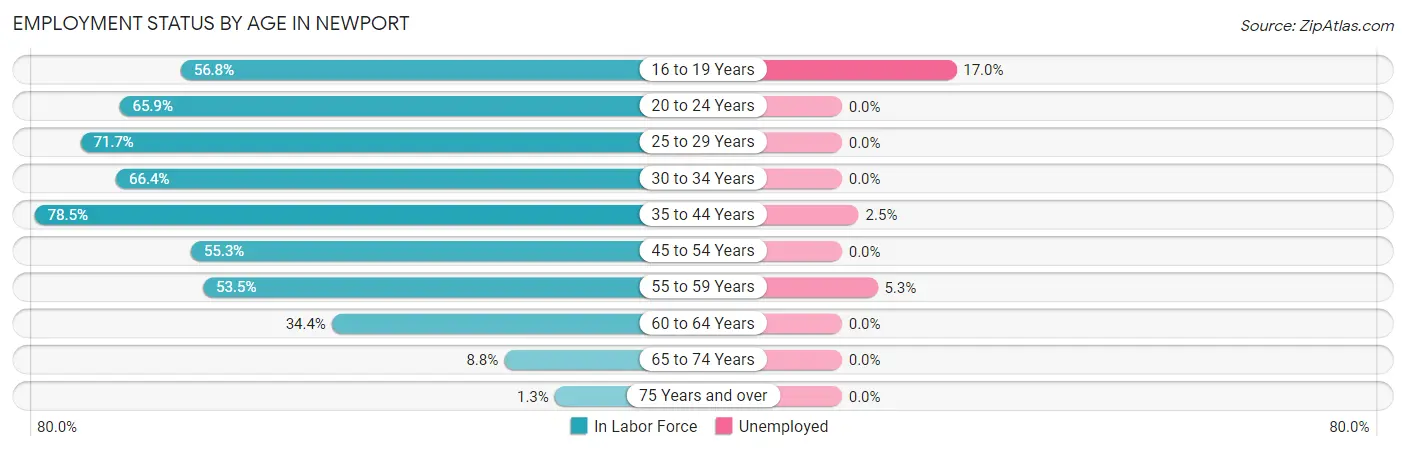
| Age Bracket | In Labor Force | Unemployed |
| 16 to 19 Years | 88 (56.8%) | 15 (17.0%) |
| 20 to 24 Years | 110 (65.9%) | 0 (0.0%) |
| 25 to 29 Years | 66 (71.7%) | 0 (0.0%) |
| 30 to 34 Years | 87 (66.4%) | 0 (0.0%) |
| 35 to 44 Years | 161 (78.5%) | 4 (2.5%) |
| 45 to 54 Years | 121 (55.3%) | 0 (0.0%) |
| 55 to 59 Years | 76 (53.5%) | 4 (5.3%) |
| 60 to 64 Years | 42 (34.4%) | 0 (0.0%) |
| 65 to 74 Years | 20 (8.8%) | 0 (0.0%) |
| 75 Years and over | 3 (1.3%) | 0 (0.0%) |
| Total | 774 (45.8%) | 23 (3.0%) |
Employment Status by Educational Attainment in Newport
According to labor force statistics for Newport, 60.7% of individuals (553) out of the total population between 25 and 64 years of age (911) are in the labor force, with 1.4% or 8 of them being unemployed. The group with the highest labor force participation rate are those with the educational attainment of bachelor's degree or higher, with 71.3% or 77 individuals in the labor force. Within the labor force, individuals with bachelor's degree or higher education have the highest percentage of unemployment, with 5.2% or 4 of them being unemployed.
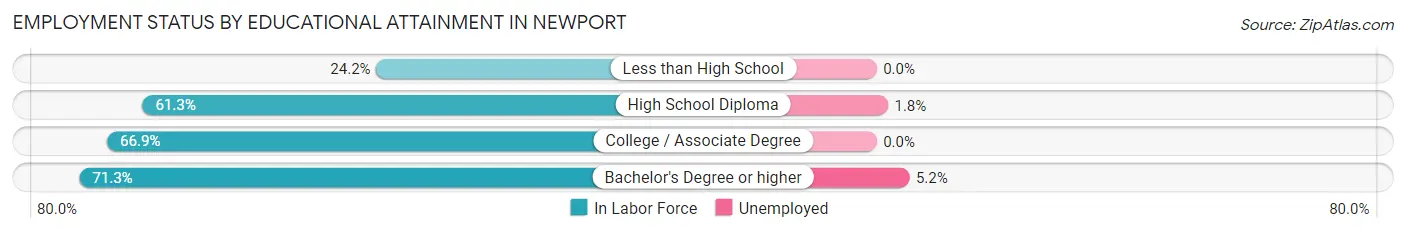
| Educational Attainment | In Labor Force | Unemployed |
| Less than High School | 23 (24.2%) | 0 (0.0%) |
| High School Diploma | 225 (61.3%) | 7 (1.8%) |
| College / Associate Degree | 228 (66.9%) | 0 (0.0%) |
| Bachelor's Degree or higher | 77 (71.3%) | 6 (5.2%) |
| Total | 553 (60.7%) | 13 (1.4%) |
Employment Occupations by Sex in Newport
Management, Business, Science and Arts Occupations
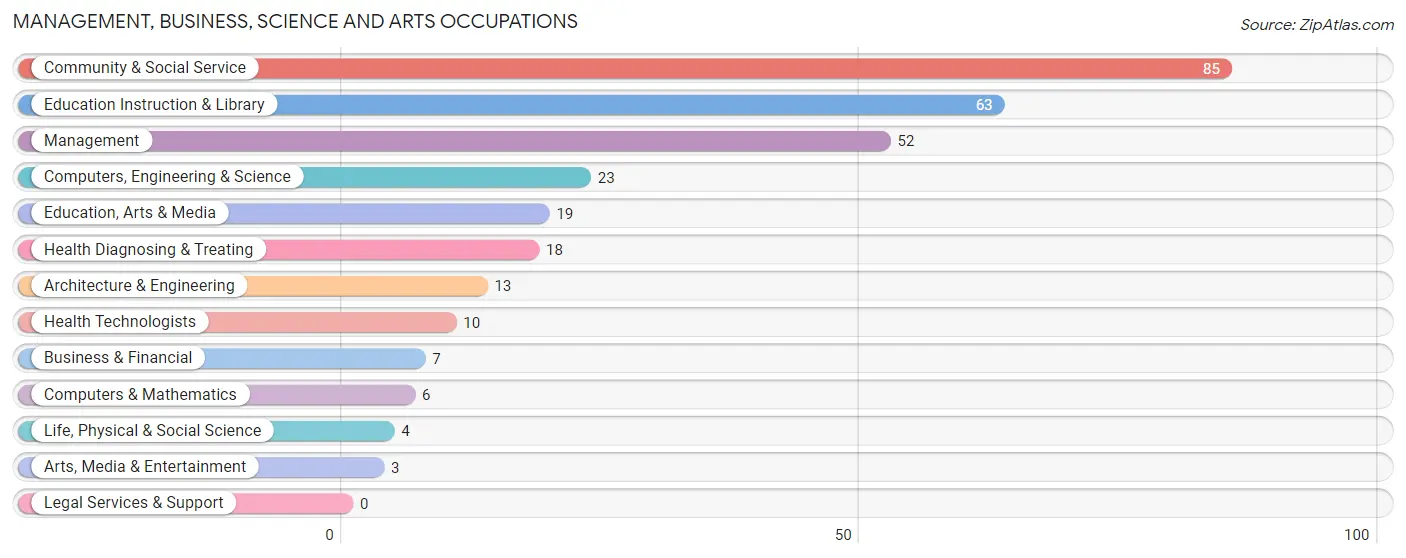
The most common Management, Business, Science and Arts occupations in Newport are Community & Social Service (85 | 11.3%), Education Instruction & Library (63 | 8.4%), Management (52 | 6.9%), Computers, Engineering & Science (23 | 3.1%), and Education, Arts & Media (19 | 2.5%).
Management, Business, Science and Arts Occupations by Sex
Within the Management, Business, Science and Arts occupations in Newport, the most male-oriented occupations are Computers, Engineering & Science (100.0%), Computers & Mathematics (100.0%), and Architecture & Engineering (100.0%), while the most female-oriented occupations are Business & Financial (100.0%), Health Diagnosing & Treating (100.0%), and Health Technologists (100.0%).
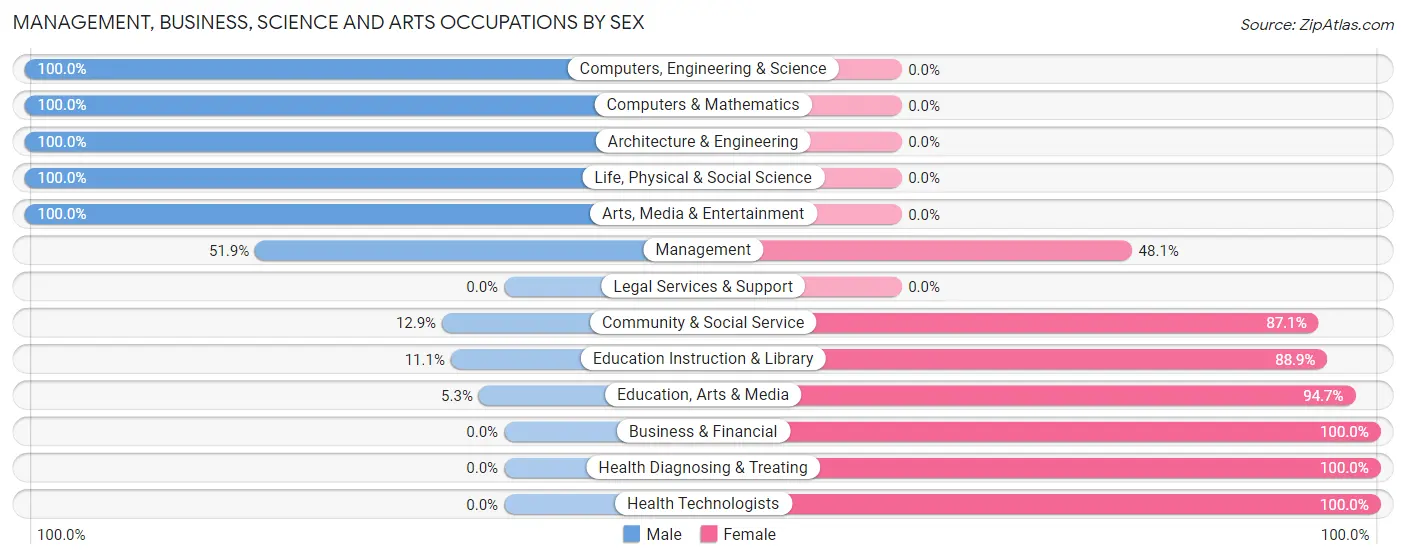
| Occupation | Male | Female |
| Management | 27 (51.9%) | 25 (48.1%) |
| Business & Financial | 0 (0.0%) | 7 (100.0%) |
| Computers, Engineering & Science | 23 (100.0%) | 0 (0.0%) |
| Computers & Mathematics | 6 (100.0%) | 0 (0.0%) |
| Architecture & Engineering | 13 (100.0%) | 0 (0.0%) |
| Life, Physical & Social Science | 4 (100.0%) | 0 (0.0%) |
| Community & Social Service | 11 (12.9%) | 74 (87.1%) |
| Education, Arts & Media | 1 (5.3%) | 18 (94.7%) |
| Legal Services & Support | 0 (0.0%) | 0 (0.0%) |
| Education Instruction & Library | 7 (11.1%) | 56 (88.9%) |
| Arts, Media & Entertainment | 3 (100.0%) | 0 (0.0%) |
| Health Diagnosing & Treating | 0 (0.0%) | 18 (100.0%) |
| Health Technologists | 0 (0.0%) | 10 (100.0%) |
| Total (Category) | 61 (33.0%) | 124 (67.0%) |
| Total (Overall) | 411 (54.7%) | 340 (45.3%) |
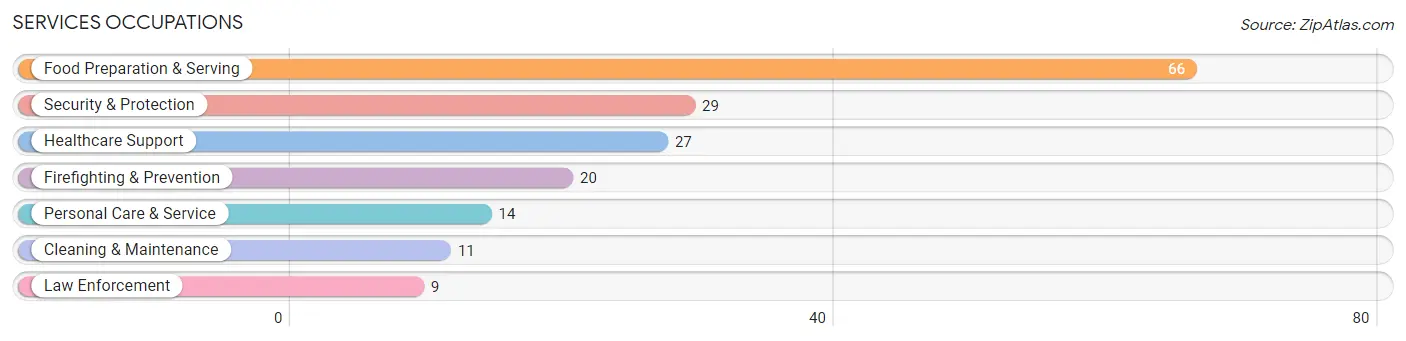
Services Occupations
The most common Services occupations in Newport are Food Preparation & Serving (66 | 8.8%), Security & Protection (29 | 3.9%), Healthcare Support (27 | 3.6%), Firefighting & Prevention (20 | 2.7%), and Personal Care & Service (14 | 1.9%).
Services Occupations by Sex
Within the Services occupations in Newport, the most male-oriented occupations are Security & Protection (100.0%), Firefighting & Prevention (100.0%), and Law Enforcement (100.0%), while the most female-oriented occupations are Healthcare Support (100.0%), Food Preparation & Serving (81.8%), and Personal Care & Service (64.3%).

| Occupation | Male | Female |
| Healthcare Support | 0 (0.0%) | 27 (100.0%) |
| Security & Protection | 29 (100.0%) | 0 (0.0%) |
| Firefighting & Prevention | 20 (100.0%) | 0 (0.0%) |
| Law Enforcement | 9 (100.0%) | 0 (0.0%) |
| Food Preparation & Serving | 12 (18.2%) | 54 (81.8%) |
| Cleaning & Maintenance | 4 (36.4%) | 7 (63.6%) |
| Personal Care & Service | 5 (35.7%) | 9 (64.3%) |
| Total (Category) | 50 (34.0%) | 97 (66.0%) |
| Total (Overall) | 411 (54.7%) | 340 (45.3%) |
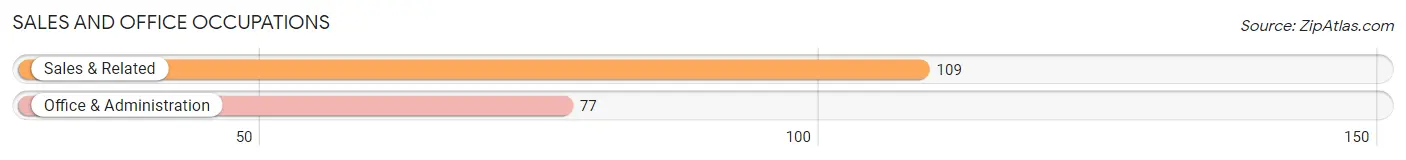
Sales and Office Occupations
The most common Sales and Office occupations in Newport are Sales & Related (109 | 14.5%), and Office & Administration (77 | 10.2%).
Sales and Office Occupations by Sex
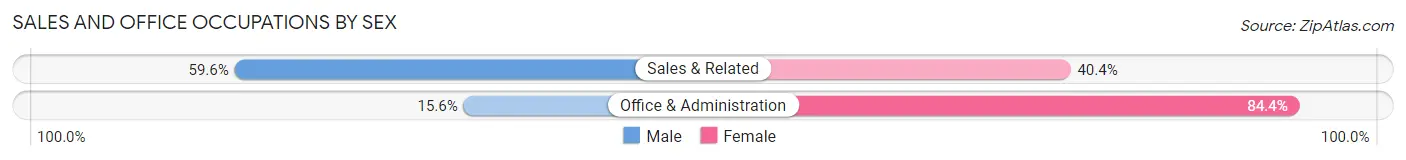
| Occupation | Male | Female |
| Sales & Related | 65 (59.6%) | 44 (40.4%) |
| Office & Administration | 12 (15.6%) | 65 (84.4%) |
| Total (Category) | 77 (41.4%) | 109 (58.6%) |
| Total (Overall) | 411 (54.7%) | 340 (45.3%) |
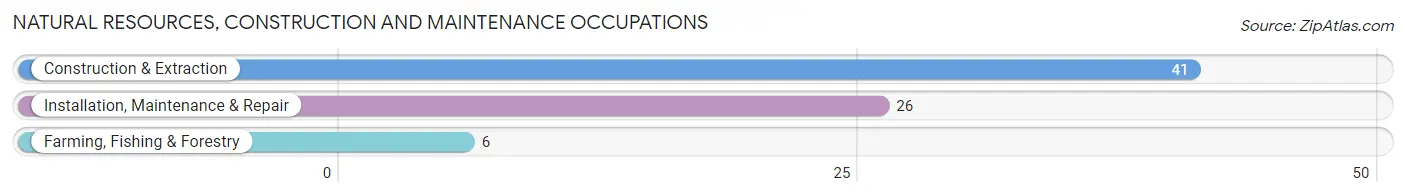
Natural Resources, Construction and Maintenance Occupations
The most common Natural Resources, Construction and Maintenance occupations in Newport are Construction & Extraction (41 | 5.5%), Installation, Maintenance & Repair (26 | 3.5%), and Farming, Fishing & Forestry (6 | 0.8%).
Natural Resources, Construction and Maintenance Occupations by Sex
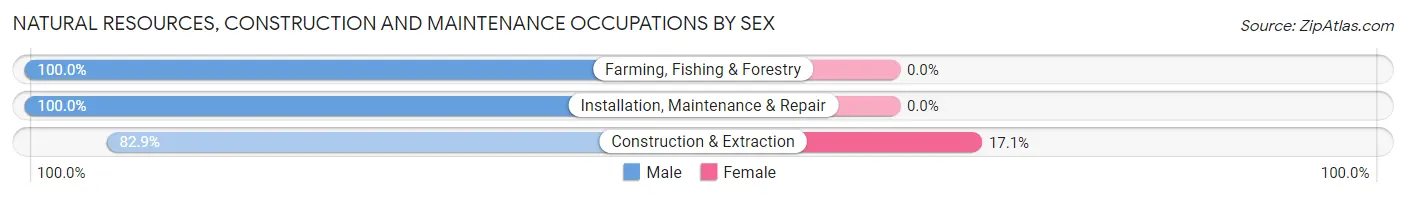
| Occupation | Male | Female |
| Farming, Fishing & Forestry | 6 (100.0%) | 0 (0.0%) |
| Construction & Extraction | 34 (82.9%) | 7 (17.1%) |
| Installation, Maintenance & Repair | 26 (100.0%) | 0 (0.0%) |
| Total (Category) | 66 (90.4%) | 7 (9.6%) |
| Total (Overall) | 411 (54.7%) | 340 (45.3%) |
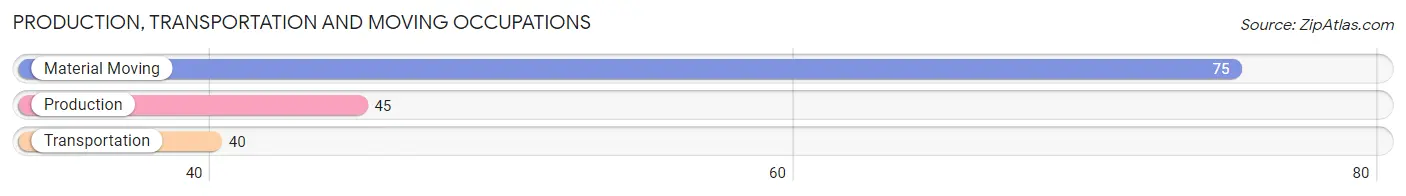
Production, Transportation and Moving Occupations
The most common Production, Transportation and Moving occupations in Newport are Material Moving (75 | 10.0%), Production (45 | 6.0%), and Transportation (40 | 5.3%).
Production, Transportation and Moving Occupations by Sex
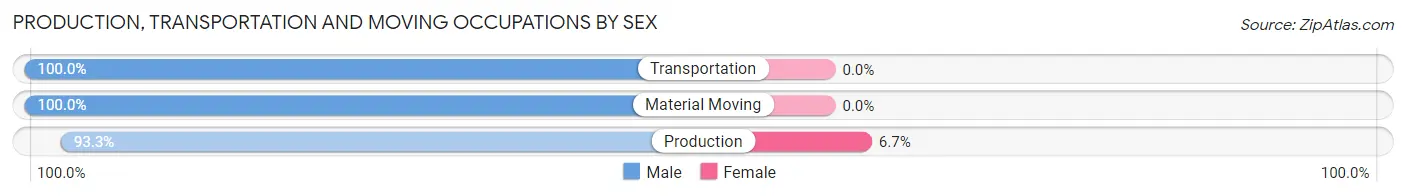
| Occupation | Male | Female |
| Production | 42 (93.3%) | 3 (6.7%) |
| Transportation | 40 (100.0%) | 0 (0.0%) |
| Material Moving | 75 (100.0%) | 0 (0.0%) |
| Total (Category) | 157 (98.1%) | 3 (1.9%) |
| Total (Overall) | 411 (54.7%) | 340 (45.3%) |
Employment Industries by Sex in Newport
Employment Industries in Newport
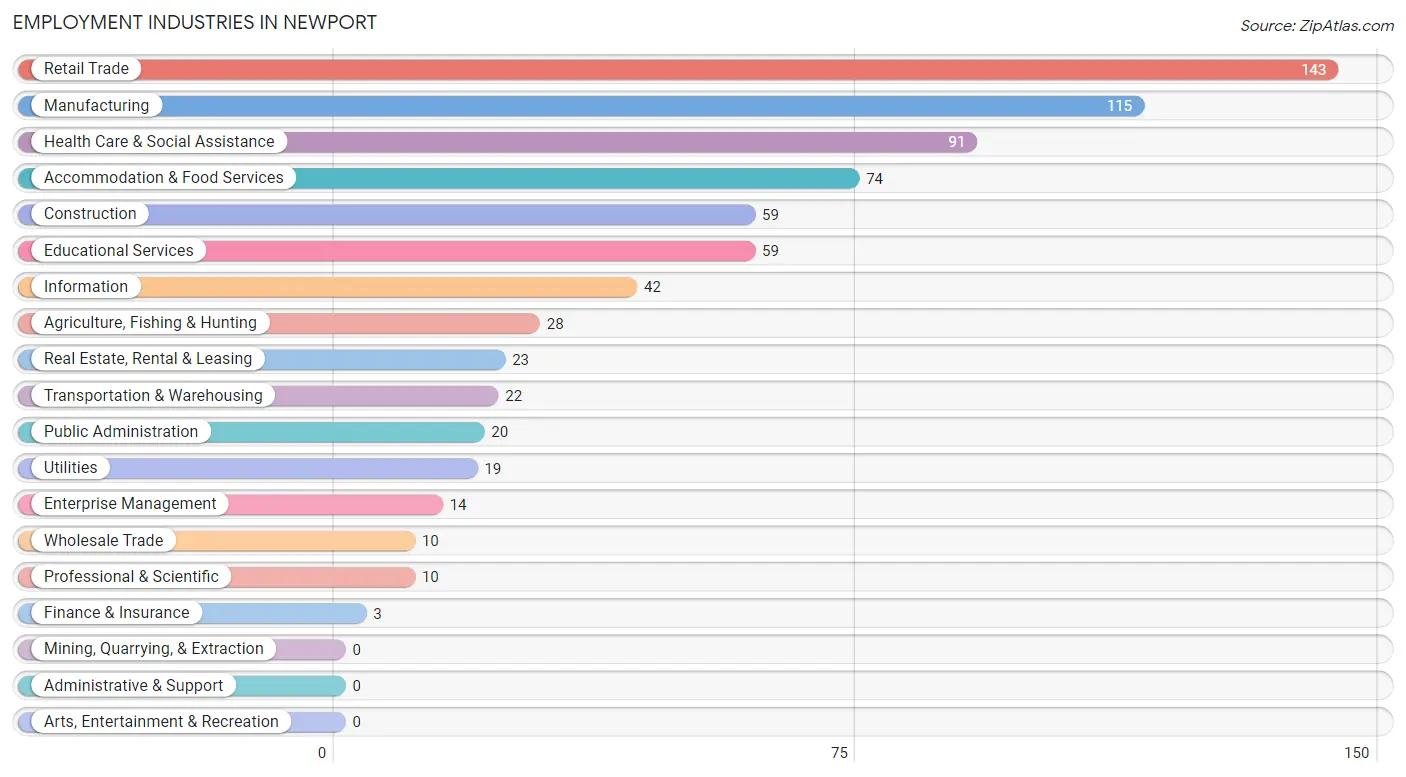
The major employment industries in Newport include Retail Trade (143 | 19.0%), Manufacturing (115 | 15.3%), Health Care & Social Assistance (91 | 12.1%), Accommodation & Food Services (74 | 9.9%), and Construction (59 | 7.9%).
Employment Industries by Sex in Newport
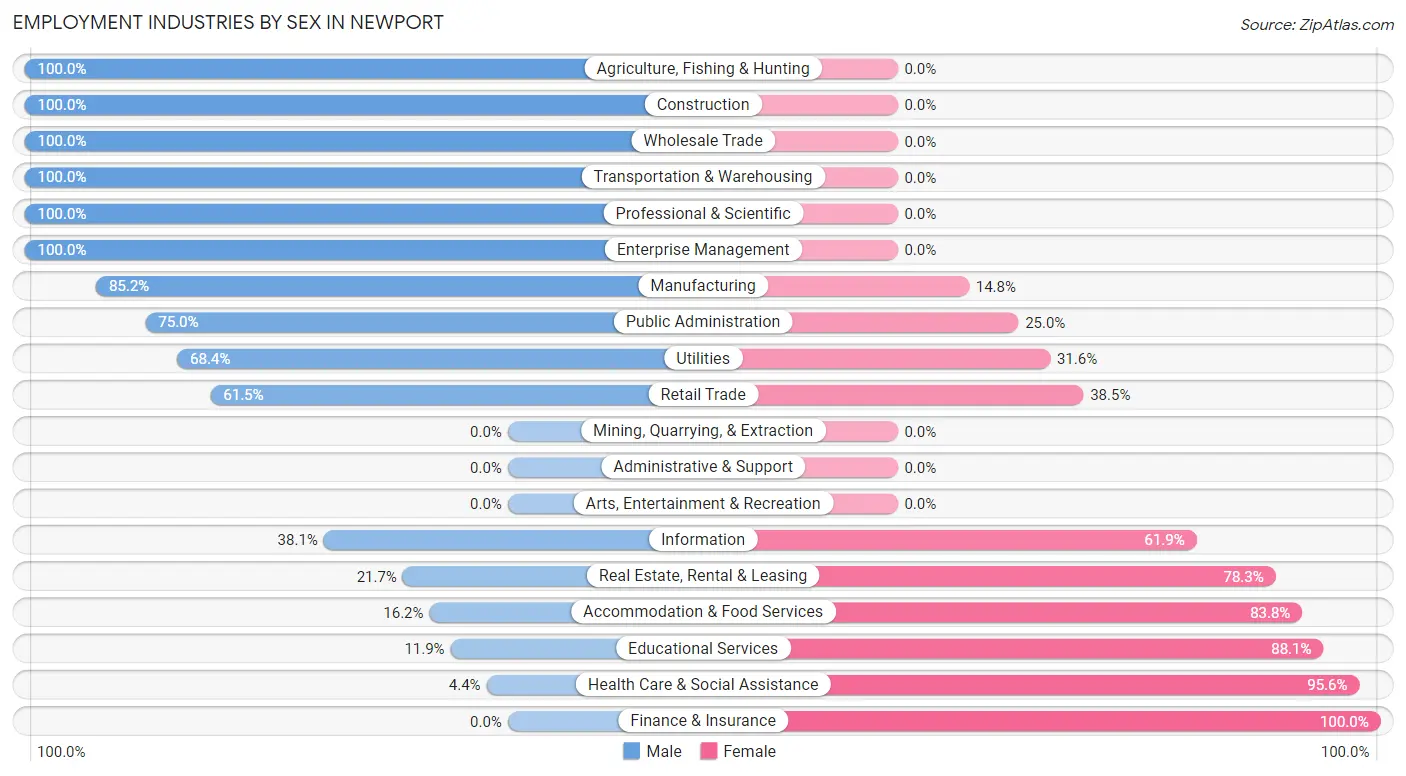
The Newport industries that see more men than women are Agriculture, Fishing & Hunting (100.0%), Construction (100.0%), and Wholesale Trade (100.0%), whereas the industries that tend to have a higher number of women are Finance & Insurance (100.0%), Health Care & Social Assistance (95.6%), and Educational Services (88.1%).
| Industry | Male | Female |
| Agriculture, Fishing & Hunting | 28 (100.0%) | 0 (0.0%) |
| Mining, Quarrying, & Extraction | 0 (0.0%) | 0 (0.0%) |
| Construction | 59 (100.0%) | 0 (0.0%) |
| Manufacturing | 98 (85.2%) | 17 (14.8%) |
| Wholesale Trade | 10 (100.0%) | 0 (0.0%) |
| Retail Trade | 88 (61.5%) | 55 (38.5%) |
| Transportation & Warehousing | 22 (100.0%) | 0 (0.0%) |
| Utilities | 13 (68.4%) | 6 (31.6%) |
| Information | 16 (38.1%) | 26 (61.9%) |
| Finance & Insurance | 0 (0.0%) | 3 (100.0%) |
| Real Estate, Rental & Leasing | 5 (21.7%) | 18 (78.3%) |
| Professional & Scientific | 10 (100.0%) | 0 (0.0%) |
| Enterprise Management | 14 (100.0%) | 0 (0.0%) |
| Administrative & Support | 0 (0.0%) | 0 (0.0%) |
| Educational Services | 7 (11.9%) | 52 (88.1%) |
| Health Care & Social Assistance | 4 (4.4%) | 87 (95.6%) |
| Arts, Entertainment & Recreation | 0 (0.0%) | 0 (0.0%) |
| Accommodation & Food Services | 12 (16.2%) | 62 (83.8%) |
| Public Administration | 15 (75.0%) | 5 (25.0%) |
| Total | 411 (54.7%) | 340 (45.3%) |
Education in Newport
School Enrollment in Newport
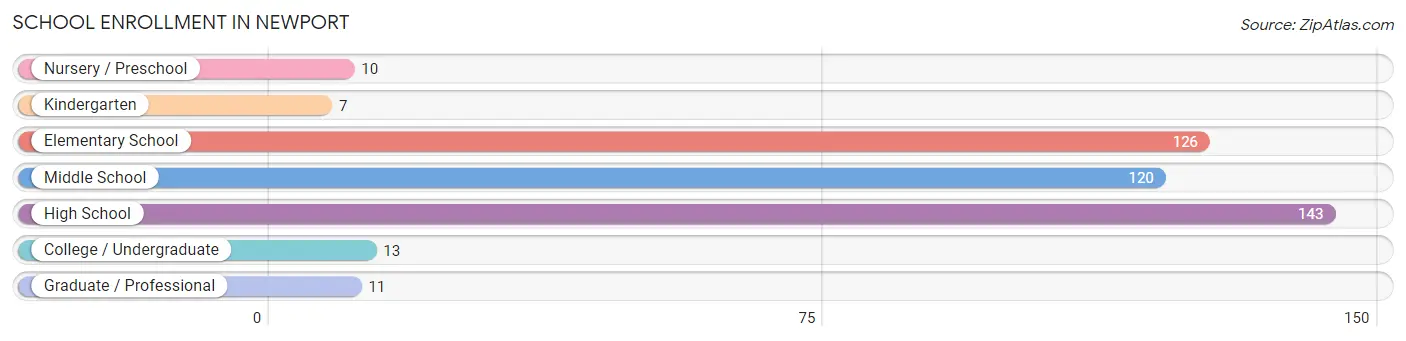
The most common levels of schooling among the 430 students in Newport are high school (143 | 33.3%), elementary school (126 | 29.3%), and middle school (120 | 27.9%).
| School Level | # Students | % Students |
| Nursery / Preschool | 10 | 2.3% |
| Kindergarten | 7 | 1.6% |
| Elementary School | 126 | 29.3% |
| Middle School | 120 | 27.9% |
| High School | 143 | 33.3% |
| College / Undergraduate | 13 | 3.0% |
| Graduate / Professional | 11 | 2.6% |
| Total | 430 | 100.0% |
School Enrollment by Age by Funding Source in Newport
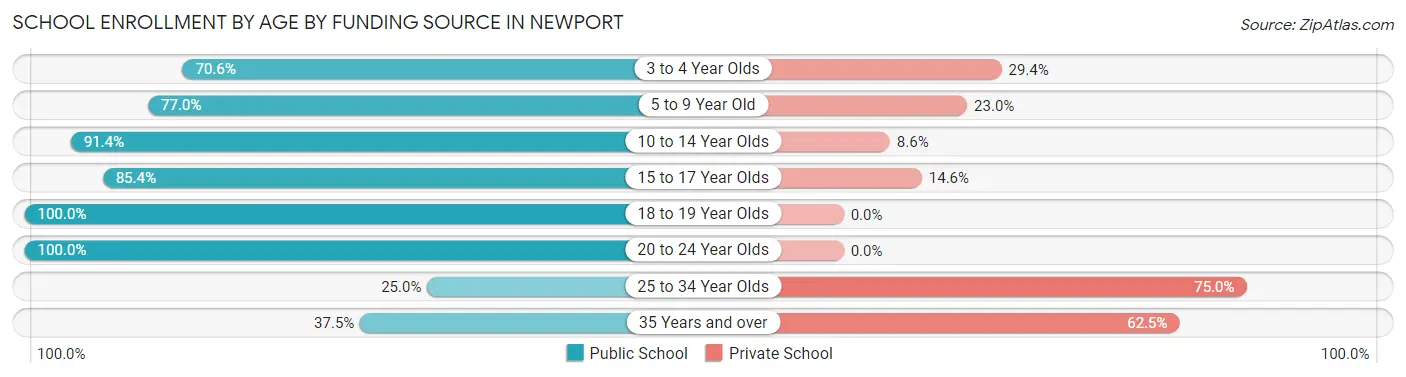
Out of a total of 430 students who are enrolled in schools in Newport, 64 (14.9%) attend a private institution, while the remaining 366 (85.1%) are enrolled in public schools. The age group of 25 to 34 year olds has the highest likelihood of being enrolled in private schools, with 3 (75.0% in the age bracket) enrolled. Conversely, the age group of 18 to 19 year olds has the lowest likelihood of being enrolled in a private school, with 39 (100.0% in the age bracket) attending a public institution.
| Age Bracket | Public School | Private School |
| 3 to 4 Year Olds | 12 (70.6%) | 5 (29.4%) |
| 5 to 9 Year Old | 77 (77.0%) | 23 (23.0%) |
| 10 to 14 Year Olds | 138 (91.4%) | 13 (8.6%) |
| 15 to 17 Year Olds | 88 (85.4%) | 15 (14.6%) |
| 18 to 19 Year Olds | 39 (100.0%) | 0 (0.0%) |
| 20 to 24 Year Olds | 8 (100.0%) | 0 (0.0%) |
| 25 to 34 Year Olds | 1 (25.0%) | 3 (75.0%) |
| 35 Years and over | 3 (37.5%) | 5 (62.5%) |
| Total | 366 (85.1%) | 64 (14.9%) |
Educational Attainment by Field of Study in Newport
Social sciences (41 | 20.1%), arts & humanities (36 | 17.6%), engineering (22 | 10.8%), psychology (21 | 10.3%), and education (18 | 8.8%) are the most common fields of study among 204 individuals in Newport who have obtained a bachelor's degree or higher.
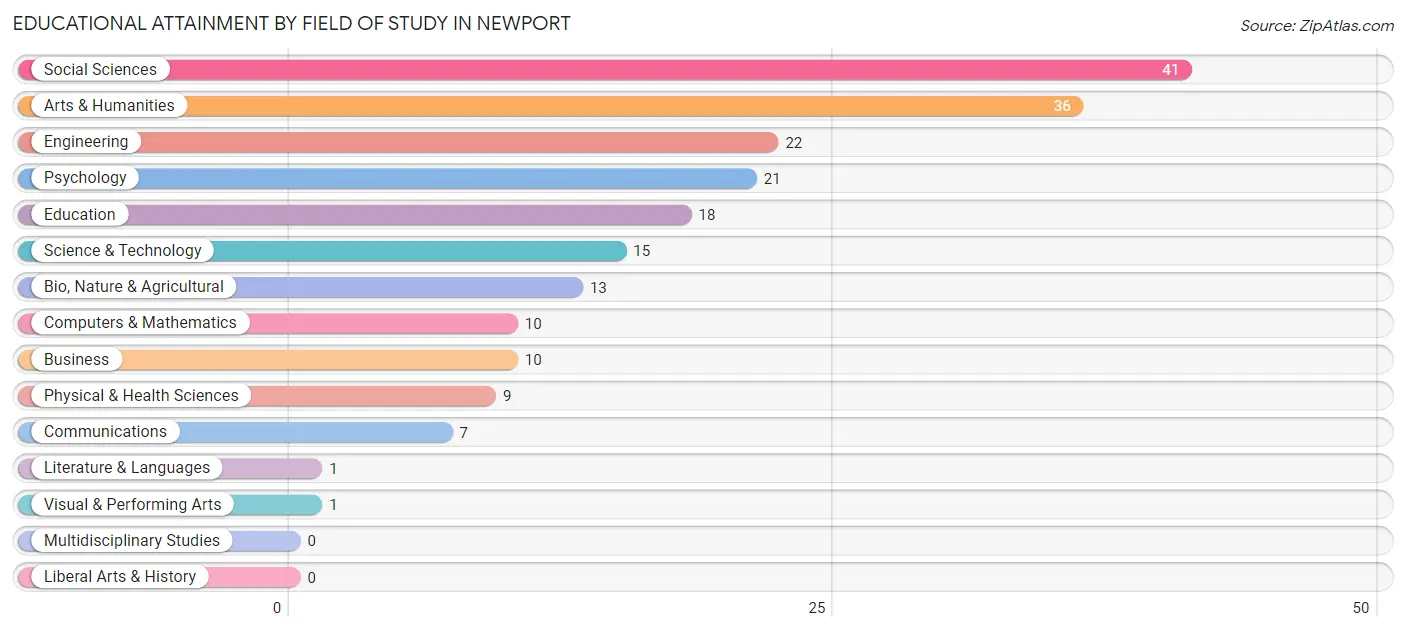
| Field of Study | # Graduates | % Graduates |
| Computers & Mathematics | 10 | 4.9% |
| Bio, Nature & Agricultural | 13 | 6.4% |
| Physical & Health Sciences | 9 | 4.4% |
| Psychology | 21 | 10.3% |
| Social Sciences | 41 | 20.1% |
| Engineering | 22 | 10.8% |
| Multidisciplinary Studies | 0 | 0.0% |
| Science & Technology | 15 | 7.3% |
| Business | 10 | 4.9% |
| Education | 18 | 8.8% |
| Literature & Languages | 1 | 0.5% |
| Liberal Arts & History | 0 | 0.0% |
| Visual & Performing Arts | 1 | 0.5% |
| Communications | 7 | 3.4% |
| Arts & Humanities | 36 | 17.6% |
| Total | 204 | 100.0% |
Transportation & Commute in Newport
Vehicle Availability by Sex in Newport
The most prevalent vehicle ownership categories in Newport are males with 2 vehicles (149, accounting for 37.0%) and females with 2 vehicles (108, making up 46.1%).
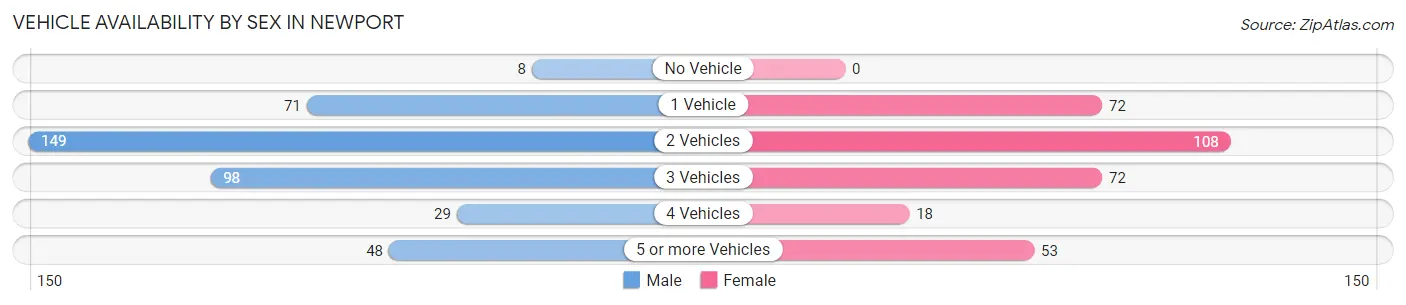
| Vehicles Available | Male | Female |
| No Vehicle | 8 (2.0%) | 0 (0.0%) |
| 1 Vehicle | 71 (17.6%) | 72 (22.3%) |
| 2 Vehicles | 149 (37.0%) | 108 (33.4%) |
| 3 Vehicles | 98 (24.3%) | 72 (22.3%) |
| 4 Vehicles | 29 (7.2%) | 18 (5.6%) |
| 5 or more Vehicles | 48 (11.9%) | 53 (16.4%) |
| Total | 403 (100.0%) | 323 (100.0%) |
Commute Time in Newport
The most frequently occuring commute durations in Newport are 5 to 9 minutes (286 commuters, 41.4%), 45 to 59 minutes (96 commuters, 13.9%), and 60 to 89 minutes (60 commuters, 8.7%).

| Commute Time | # Commuters | % Commuters |
| Less than 5 Minutes | 59 | 8.6% |
| 5 to 9 Minutes | 286 | 41.4% |
| 10 to 14 Minutes | 31 | 4.5% |
| 15 to 19 Minutes | 40 | 5.8% |
| 20 to 24 Minutes | 23 | 3.3% |
| 25 to 29 Minutes | 0 | 0.0% |
| 30 to 34 Minutes | 50 | 7.2% |
| 35 to 39 Minutes | 10 | 1.5% |
| 40 to 44 Minutes | 0 | 0.0% |
| 45 to 59 Minutes | 96 | 13.9% |
| 60 to 89 Minutes | 60 | 8.7% |
| 90 or more Minutes | 35 | 5.1% |
Commute Time by Sex in Newport
The most common commute times in Newport are 5 to 9 minutes (101 commuters, 26.4%) for males and 5 to 9 minutes (185 commuters, 60.1%) for females.
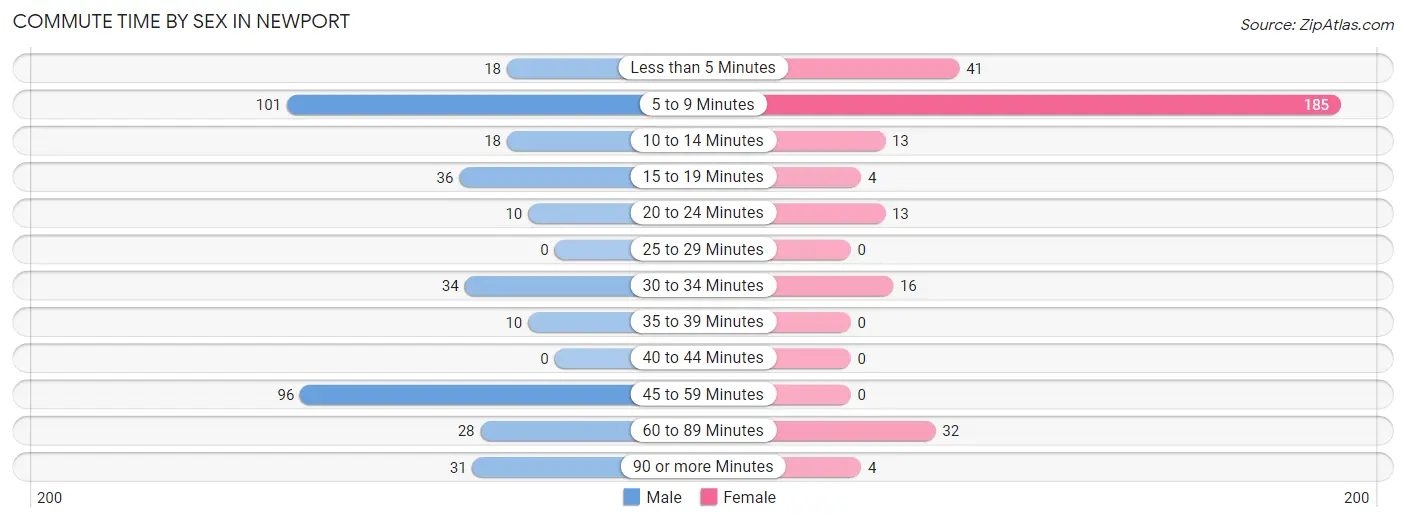
| Commute Time | Male | Female |
| Less than 5 Minutes | 18 (4.7%) | 41 (13.3%) |
| 5 to 9 Minutes | 101 (26.4%) | 185 (60.1%) |
| 10 to 14 Minutes | 18 (4.7%) | 13 (4.2%) |
| 15 to 19 Minutes | 36 (9.4%) | 4 (1.3%) |
| 20 to 24 Minutes | 10 (2.6%) | 13 (4.2%) |
| 25 to 29 Minutes | 0 (0.0%) | 0 (0.0%) |
| 30 to 34 Minutes | 34 (8.9%) | 16 (5.2%) |
| 35 to 39 Minutes | 10 (2.6%) | 0 (0.0%) |
| 40 to 44 Minutes | 0 (0.0%) | 0 (0.0%) |
| 45 to 59 Minutes | 96 (25.1%) | 0 (0.0%) |
| 60 to 89 Minutes | 28 (7.3%) | 32 (10.4%) |
| 90 or more Minutes | 31 (8.1%) | 4 (1.3%) |
Time of Departure to Work by Sex in Newport
The most frequent times of departure to work in Newport are 12:00 PM to 3:59 PM (99, 25.9%) for males and 9:00 AM to 9:59 AM (85, 27.6%) for females.
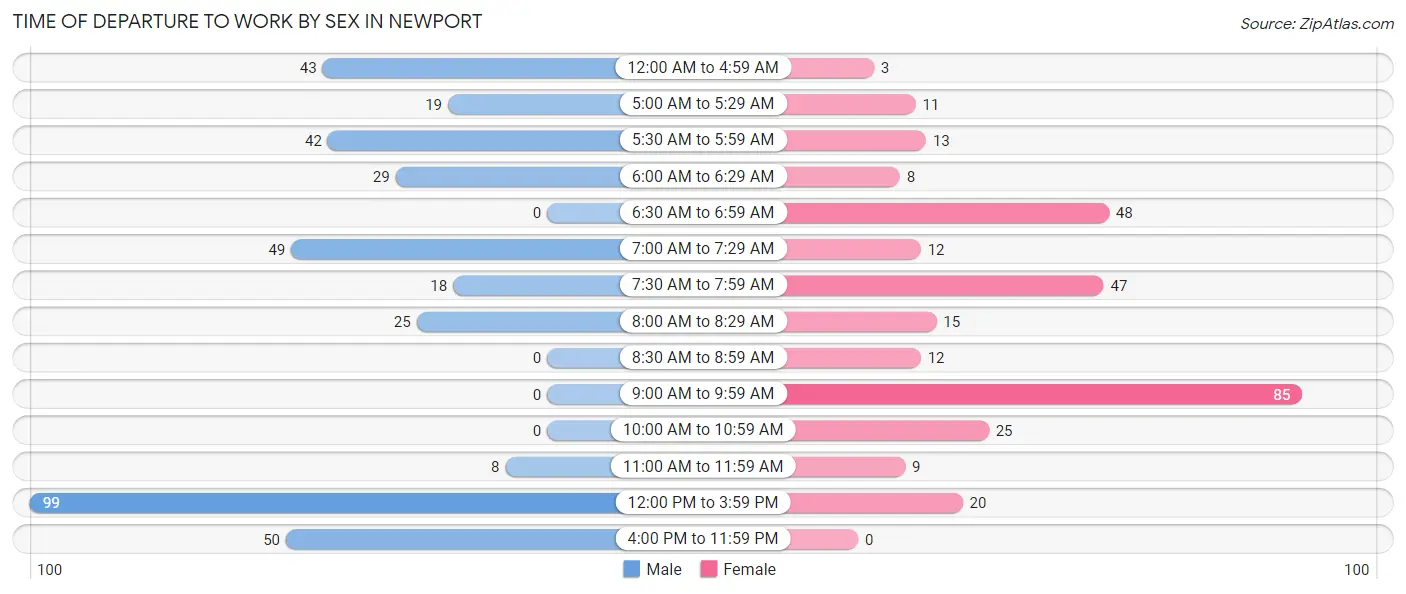
| Time of Departure | Male | Female |
| 12:00 AM to 4:59 AM | 43 (11.3%) | 3 (1.0%) |
| 5:00 AM to 5:29 AM | 19 (5.0%) | 11 (3.6%) |
| 5:30 AM to 5:59 AM | 42 (11.0%) | 13 (4.2%) |
| 6:00 AM to 6:29 AM | 29 (7.6%) | 8 (2.6%) |
| 6:30 AM to 6:59 AM | 0 (0.0%) | 48 (15.6%) |
| 7:00 AM to 7:29 AM | 49 (12.8%) | 12 (3.9%) |
| 7:30 AM to 7:59 AM | 18 (4.7%) | 47 (15.3%) |
| 8:00 AM to 8:29 AM | 25 (6.5%) | 15 (4.9%) |
| 8:30 AM to 8:59 AM | 0 (0.0%) | 12 (3.9%) |
| 9:00 AM to 9:59 AM | 0 (0.0%) | 85 (27.6%) |
| 10:00 AM to 10:59 AM | 0 (0.0%) | 25 (8.1%) |
| 11:00 AM to 11:59 AM | 8 (2.1%) | 9 (2.9%) |
| 12:00 PM to 3:59 PM | 99 (25.9%) | 20 (6.5%) |
| 4:00 PM to 11:59 PM | 50 (13.1%) | 0 (0.0%) |
| Total | 382 (100.0%) | 308 (100.0%) |
Housing Occupancy in Newport
Occupancy by Ownership in Newport
Of the total 834 dwellings in Newport, owner-occupied units account for 480 (57.6%), while renter-occupied units make up 354 (42.4%).
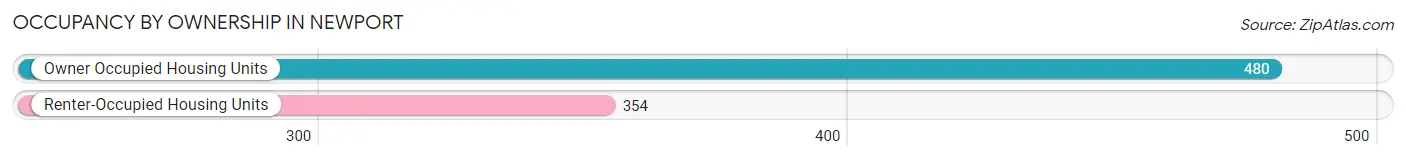
| Occupancy | # Housing Units | % Housing Units |
| Owner Occupied Housing Units | 480 | 57.6% |
| Renter-Occupied Housing Units | 354 | 42.4% |
| Total Occupied Housing Units | 834 | 100.0% |
Occupancy by Household Size in Newport
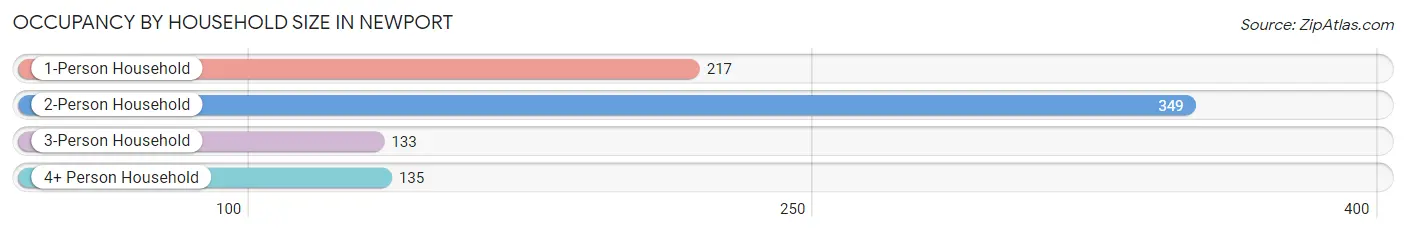
| Household Size | # Housing Units | % Housing Units |
| 1-Person Household | 217 | 26.0% |
| 2-Person Household | 349 | 41.8% |
| 3-Person Household | 133 | 16.0% |
| 4+ Person Household | 135 | 16.2% |
| Total Housing Units | 834 | 100.0% |
Occupancy by Ownership by Household Size in Newport
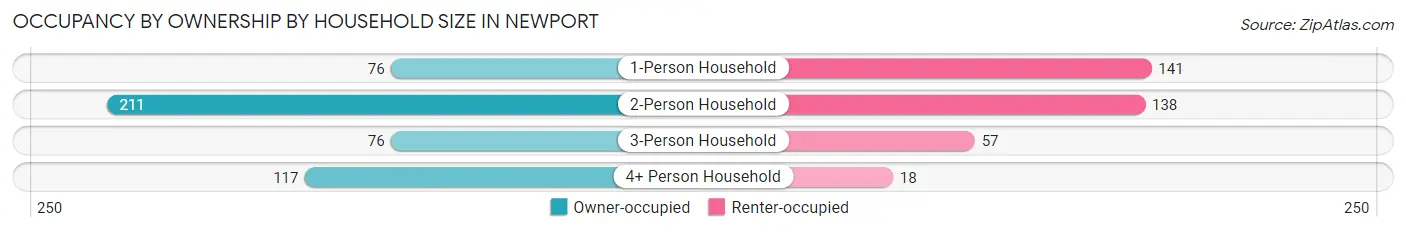
| Household Size | Owner-occupied | Renter-occupied |
| 1-Person Household | 76 (35.0%) | 141 (65.0%) |
| 2-Person Household | 211 (60.5%) | 138 (39.5%) |
| 3-Person Household | 76 (57.1%) | 57 (42.9%) |
| 4+ Person Household | 117 (86.7%) | 18 (13.3%) |
| Total Housing Units | 480 (57.6%) | 354 (42.4%) |
Occupancy by Educational Attainment in Newport
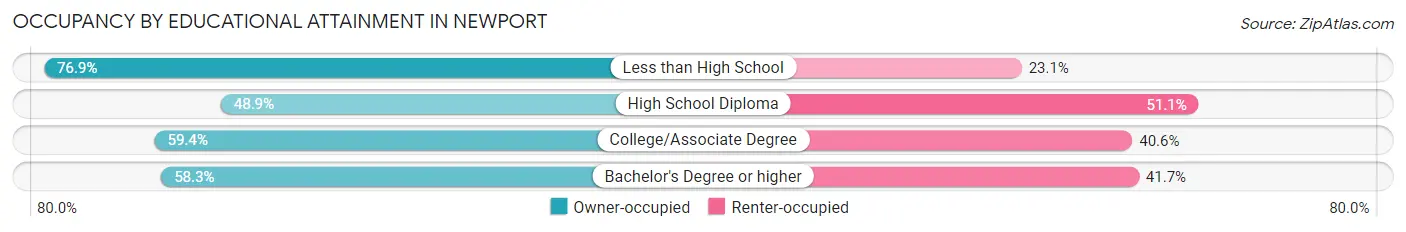
| Household Size | Owner-occupied | Renter-occupied |
| Less than High School | 60 (76.9%) | 18 (23.1%) |
| High School Diploma | 129 (48.9%) | 135 (51.1%) |
| College/Associate Degree | 228 (59.4%) | 156 (40.6%) |
| Bachelor's Degree or higher | 63 (58.3%) | 45 (41.7%) |
Occupancy by Age of Householder in Newport
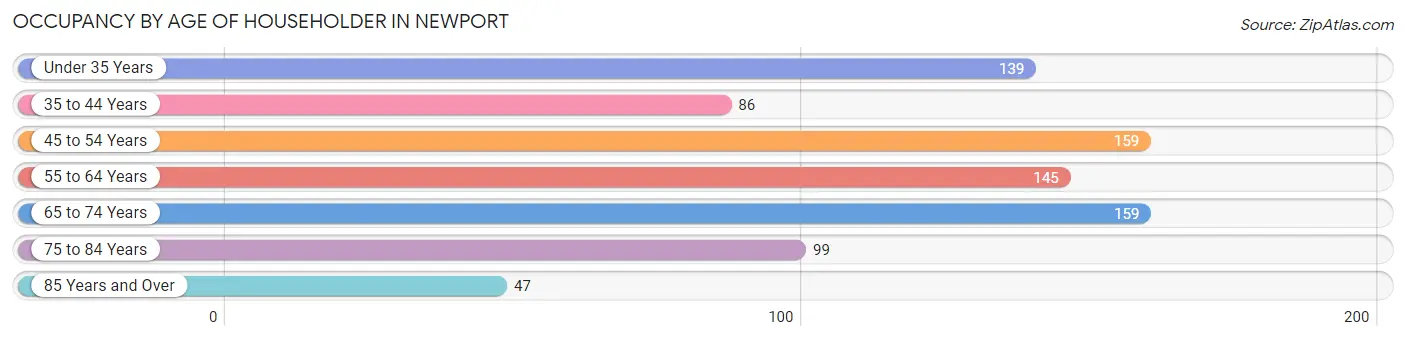
| Age Bracket | # Households | % Households |
| Under 35 Years | 139 | 16.7% |
| 35 to 44 Years | 86 | 10.3% |
| 45 to 54 Years | 159 | 19.1% |
| 55 to 64 Years | 145 | 17.4% |
| 65 to 74 Years | 159 | 19.1% |
| 75 to 84 Years | 99 | 11.9% |
| 85 Years and Over | 47 | 5.6% |
| Total | 834 | 100.0% |
Housing Finances in Newport
Median Income by Occupancy in Newport
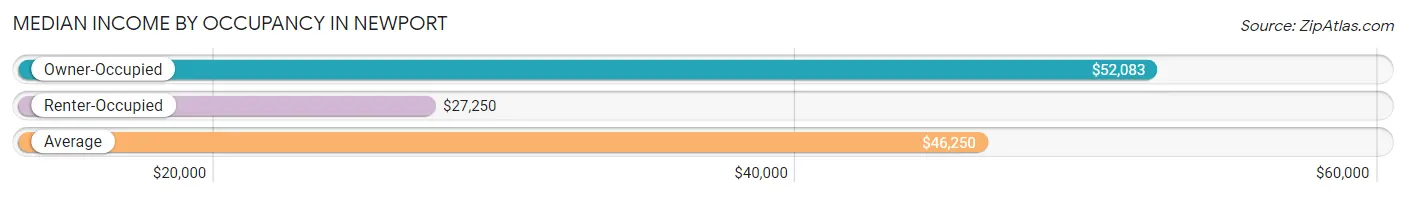
| Occupancy Type | # Households | Median Income |
| Owner-Occupied | 480 (57.6%) | $52,083 |
| Renter-Occupied | 354 (42.4%) | $27,250 |
| Average | 834 (100.0%) | $46,250 |
Occupancy by Householder Income Bracket in Newport
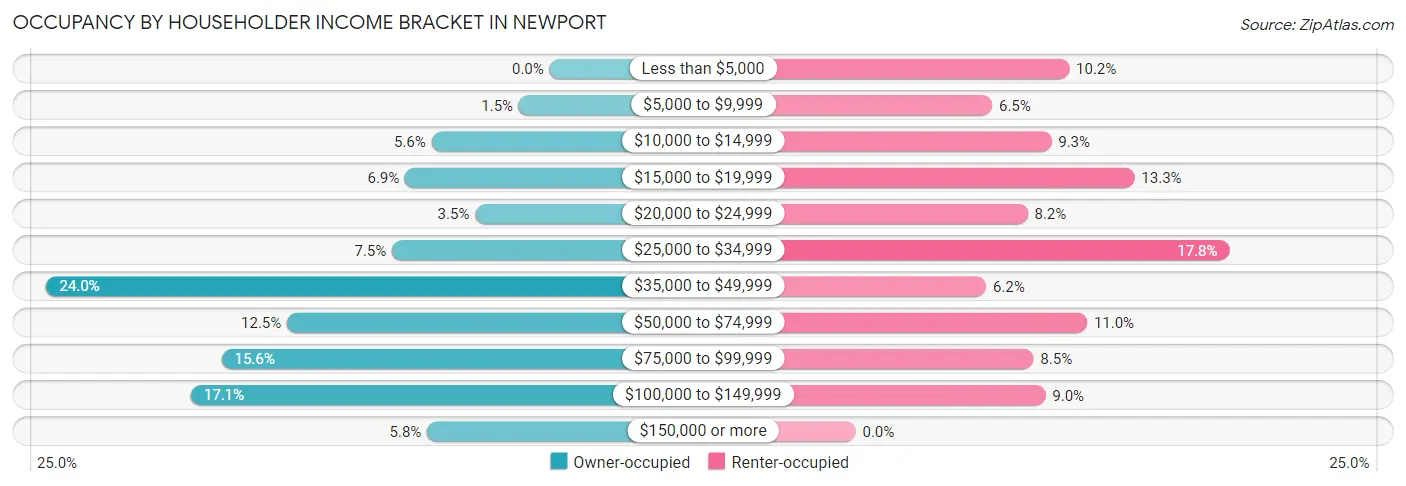
| Income Bracket | Owner-occupied | Renter-occupied |
| Less than $5,000 | 0 (0.0%) | 36 (10.2%) |
| $5,000 to $9,999 | 7 (1.5%) | 23 (6.5%) |
| $10,000 to $14,999 | 27 (5.6%) | 33 (9.3%) |
| $15,000 to $19,999 | 33 (6.9%) | 47 (13.3%) |
| $20,000 to $24,999 | 17 (3.5%) | 29 (8.2%) |
| $25,000 to $34,999 | 36 (7.5%) | 63 (17.8%) |
| $35,000 to $49,999 | 115 (24.0%) | 22 (6.2%) |
| $50,000 to $74,999 | 60 (12.5%) | 39 (11.0%) |
| $75,000 to $99,999 | 75 (15.6%) | 30 (8.5%) |
| $100,000 to $149,999 | 82 (17.1%) | 32 (9.0%) |
| $150,000 or more | 28 (5.8%) | 0 (0.0%) |
| Total | 480 (100.0%) | 354 (100.0%) |
Monthly Housing Cost Tiers in Newport
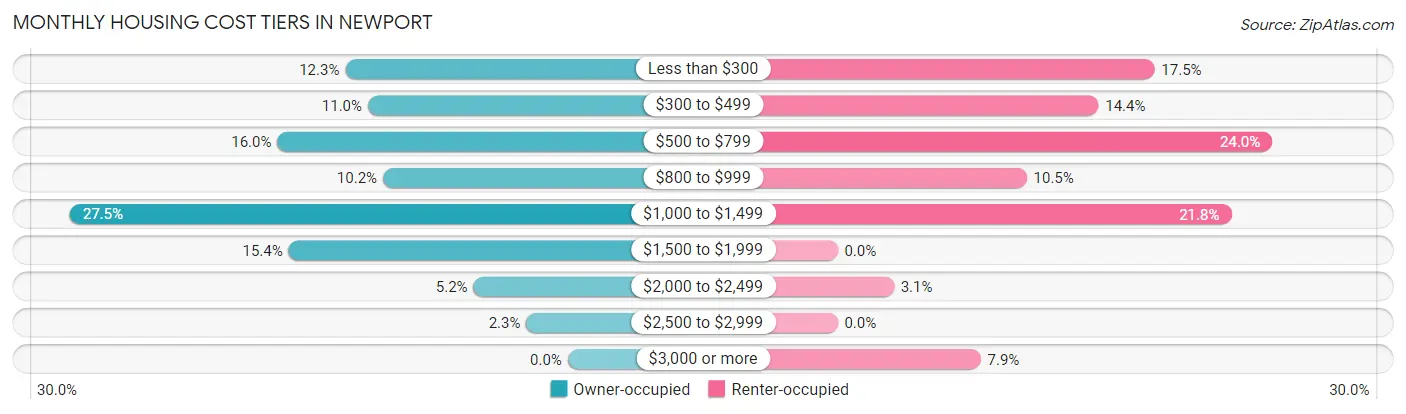
| Monthly Cost | Owner-occupied | Renter-occupied |
| Less than $300 | 59 (12.3%) | 62 (17.5%) |
| $300 to $499 | 53 (11.0%) | 51 (14.4%) |
| $500 to $799 | 77 (16.0%) | 85 (24.0%) |
| $800 to $999 | 49 (10.2%) | 37 (10.4%) |
| $1,000 to $1,499 | 132 (27.5%) | 77 (21.7%) |
| $1,500 to $1,999 | 74 (15.4%) | 0 (0.0%) |
| $2,000 to $2,499 | 25 (5.2%) | 11 (3.1%) |
| $2,500 to $2,999 | 11 (2.3%) | 0 (0.0%) |
| $3,000 or more | 0 (0.0%) | 28 (7.9%) |
| Total | 480 (100.0%) | 354 (100.0%) |
Physical Housing Characteristics in Newport
Housing Structures in Newport
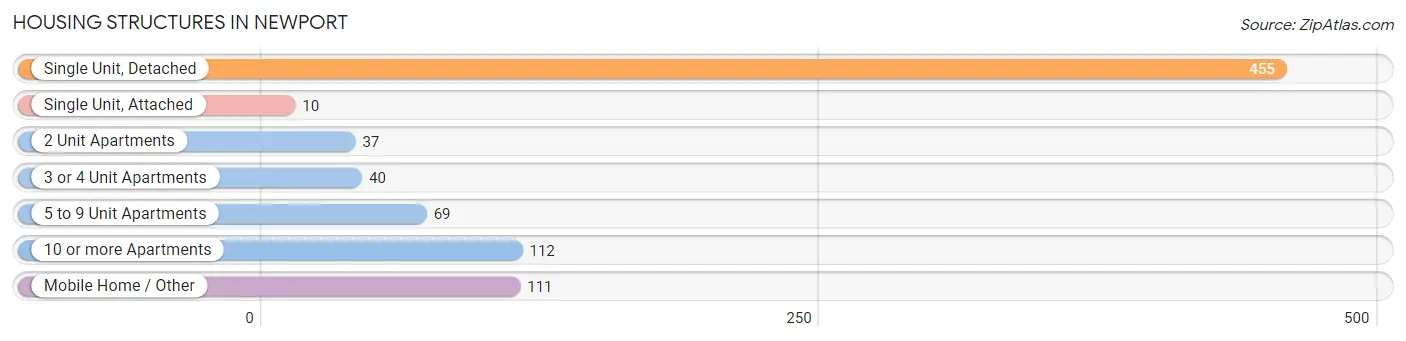
| Structure Type | # Housing Units | % Housing Units |
| Single Unit, Detached | 455 | 54.6% |
| Single Unit, Attached | 10 | 1.2% |
| 2 Unit Apartments | 37 | 4.4% |
| 3 or 4 Unit Apartments | 40 | 4.8% |
| 5 to 9 Unit Apartments | 69 | 8.3% |
| 10 or more Apartments | 112 | 13.4% |
| Mobile Home / Other | 111 | 13.3% |
| Total | 834 | 100.0% |
Housing Structures by Occupancy in Newport
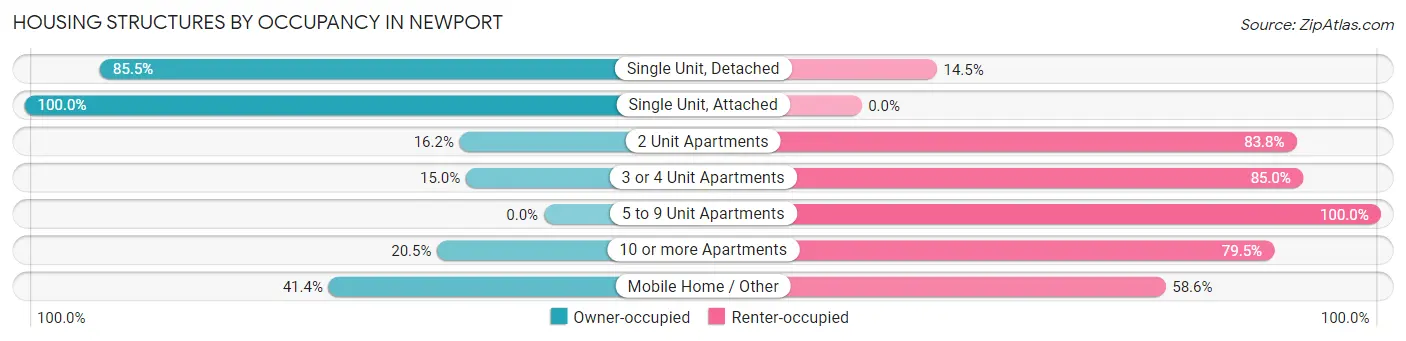
| Structure Type | Owner-occupied | Renter-occupied |
| Single Unit, Detached | 389 (85.5%) | 66 (14.5%) |
| Single Unit, Attached | 10 (100.0%) | 0 (0.0%) |
| 2 Unit Apartments | 6 (16.2%) | 31 (83.8%) |
| 3 or 4 Unit Apartments | 6 (15.0%) | 34 (85.0%) |
| 5 to 9 Unit Apartments | 0 (0.0%) | 69 (100.0%) |
| 10 or more Apartments | 23 (20.5%) | 89 (79.5%) |
| Mobile Home / Other | 46 (41.4%) | 65 (58.6%) |
| Total | 480 (57.6%) | 354 (42.4%) |
Housing Structures by Number of Rooms in Newport
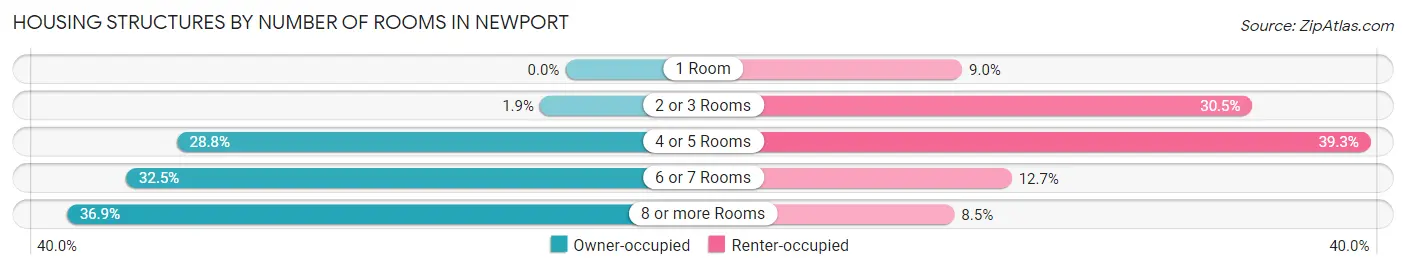
| Number of Rooms | Owner-occupied | Renter-occupied |
| 1 Room | 0 (0.0%) | 32 (9.0%) |
| 2 or 3 Rooms | 9 (1.9%) | 108 (30.5%) |
| 4 or 5 Rooms | 138 (28.7%) | 139 (39.3%) |
| 6 or 7 Rooms | 156 (32.5%) | 45 (12.7%) |
| 8 or more Rooms | 177 (36.9%) | 30 (8.5%) |
| Total | 480 (100.0%) | 354 (100.0%) |
Housing Structure by Heating Type in Newport
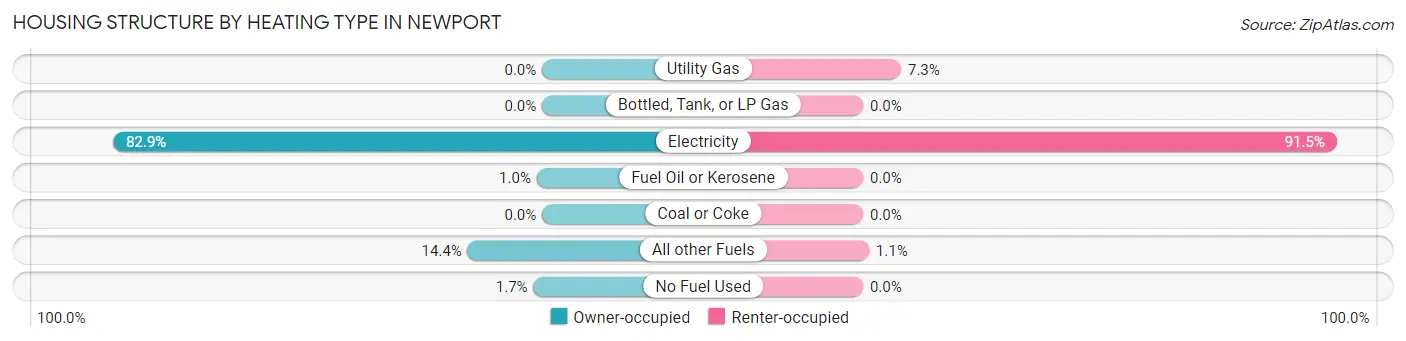
| Heating Type | Owner-occupied | Renter-occupied |
| Utility Gas | 0 (0.0%) | 26 (7.3%) |
| Bottled, Tank, or LP Gas | 0 (0.0%) | 0 (0.0%) |
| Electricity | 398 (82.9%) | 324 (91.5%) |
| Fuel Oil or Kerosene | 5 (1.0%) | 0 (0.0%) |
| Coal or Coke | 0 (0.0%) | 0 (0.0%) |
| All other Fuels | 69 (14.4%) | 4 (1.1%) |
| No Fuel Used | 8 (1.7%) | 0 (0.0%) |
| Total | 480 (100.0%) | 354 (100.0%) |
Household Vehicle Usage in Newport
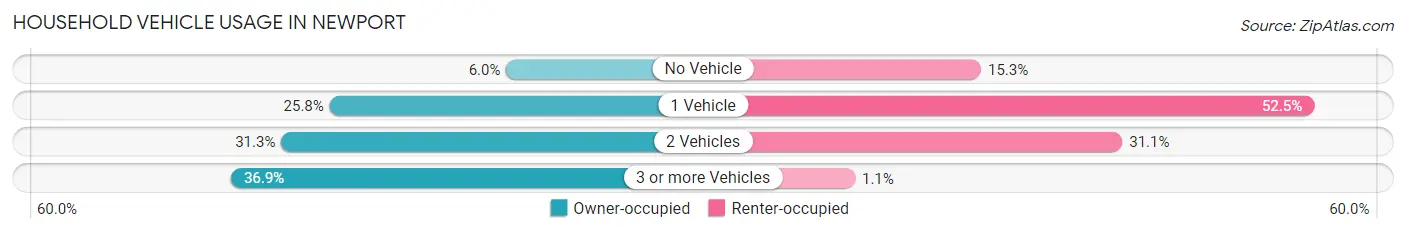
| Vehicles per Household | Owner-occupied | Renter-occupied |
| No Vehicle | 29 (6.0%) | 54 (15.2%) |
| 1 Vehicle | 124 (25.8%) | 186 (52.5%) |
| 2 Vehicles | 150 (31.2%) | 110 (31.1%) |
| 3 or more Vehicles | 177 (36.9%) | 4 (1.1%) |
| Total | 480 (100.0%) | 354 (100.0%) |
Real Estate & Mortgages in Newport
Real Estate and Mortgage Overview in Newport
| Characteristic | Without Mortgage | With Mortgage |
| Housing Units | 150 | 330 |
| Median Property Value | $170,700 | $203,500 |
| Median Household Income | $41,250 | $24 |
| Monthly Housing Costs | $411 | $0 |
| Real Estate Taxes | $1,139 | $0 |
Property Value by Mortgage Status in Newport
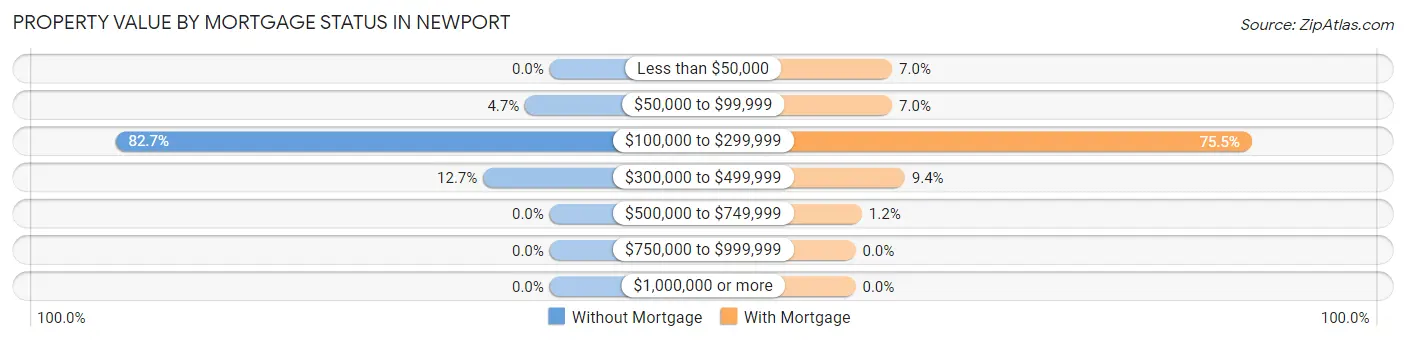
| Property Value | Without Mortgage | With Mortgage |
| Less than $50,000 | 0 (0.0%) | 23 (7.0%) |
| $50,000 to $99,999 | 7 (4.7%) | 23 (7.0%) |
| $100,000 to $299,999 | 124 (82.7%) | 249 (75.4%) |
| $300,000 to $499,999 | 19 (12.7%) | 31 (9.4%) |
| $500,000 to $749,999 | 0 (0.0%) | 4 (1.2%) |
| $750,000 to $999,999 | 0 (0.0%) | 0 (0.0%) |
| $1,000,000 or more | 0 (0.0%) | 0 (0.0%) |
| Total | 150 (100.0%) | 330 (100.0%) |
Household Income by Mortgage Status in Newport
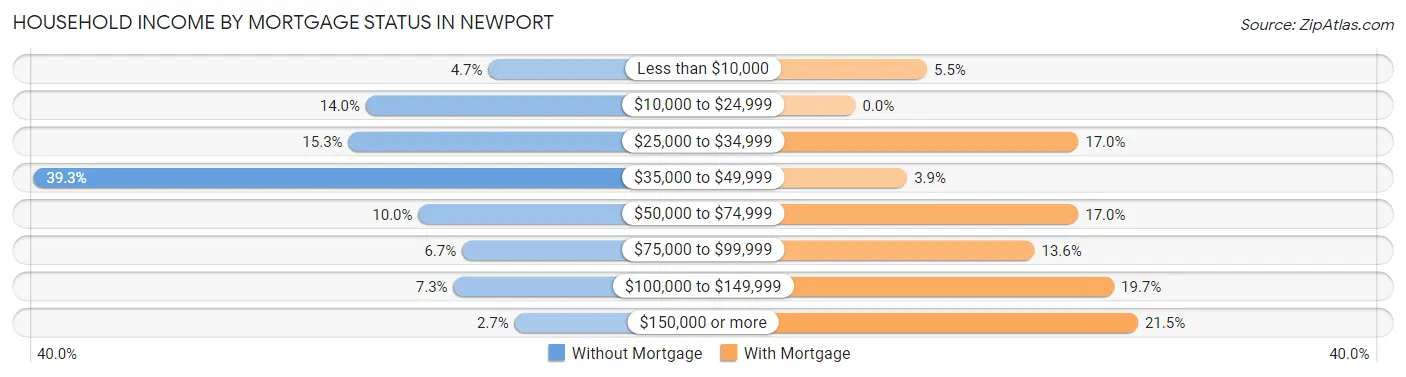
| Household Income | Without Mortgage | With Mortgage |
| Less than $10,000 | 7 (4.7%) | 18 (5.4%) |
| $10,000 to $24,999 | 21 (14.0%) | 0 (0.0%) |
| $25,000 to $34,999 | 23 (15.3%) | 56 (17.0%) |
| $35,000 to $49,999 | 59 (39.3%) | 13 (3.9%) |
| $50,000 to $74,999 | 15 (10.0%) | 56 (17.0%) |
| $75,000 to $99,999 | 10 (6.7%) | 45 (13.6%) |
| $100,000 to $149,999 | 11 (7.3%) | 65 (19.7%) |
| $150,000 or more | 4 (2.7%) | 71 (21.5%) |
| Total | 150 (100.0%) | 330 (100.0%) |
Property Value to Household Income Ratio in Newport
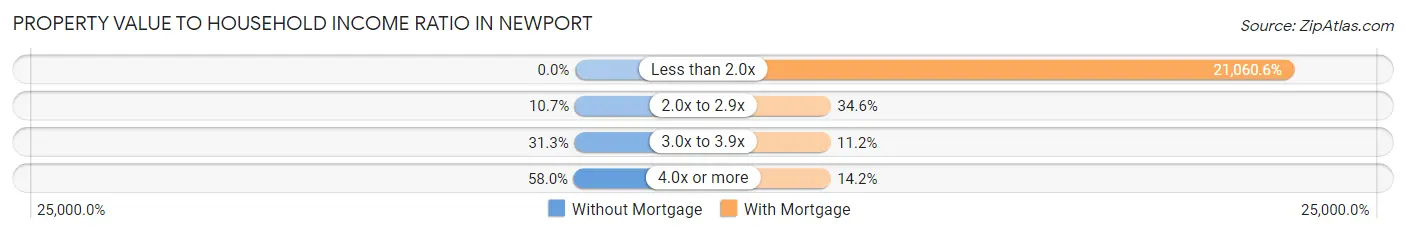
| Value-to-Income Ratio | Without Mortgage | With Mortgage |
| Less than 2.0x | 0 (0.0%) | 69,500 (21,060.6%) |
| 2.0x to 2.9x | 16 (10.7%) | 114 (34.5%) |
| 3.0x to 3.9x | 47 (31.3%) | 37 (11.2%) |
| 4.0x or more | 87 (58.0%) | 47 (14.2%) |
| Total | 150 (100.0%) | 330 (100.0%) |
Real Estate Taxes by Mortgage Status in Newport
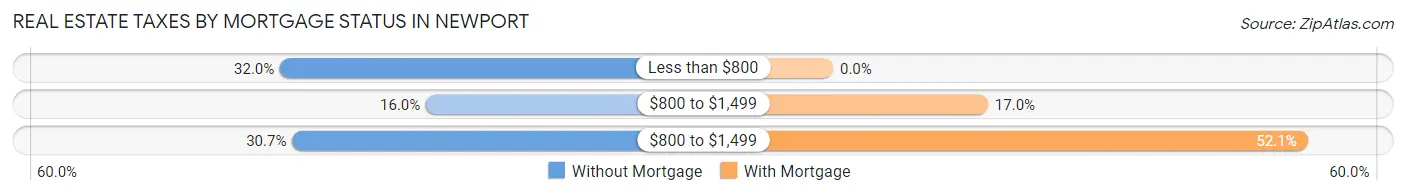
| Property Taxes | Without Mortgage | With Mortgage |
| Less than $800 | 48 (32.0%) | 0 (0.0%) |
| $800 to $1,499 | 24 (16.0%) | 56 (17.0%) |
| $800 to $1,499 | 46 (30.7%) | 172 (52.1%) |
| Total | 150 (100.0%) | 330 (100.0%) |
Health & Disability in Newport
Health Insurance Coverage by Age in Newport
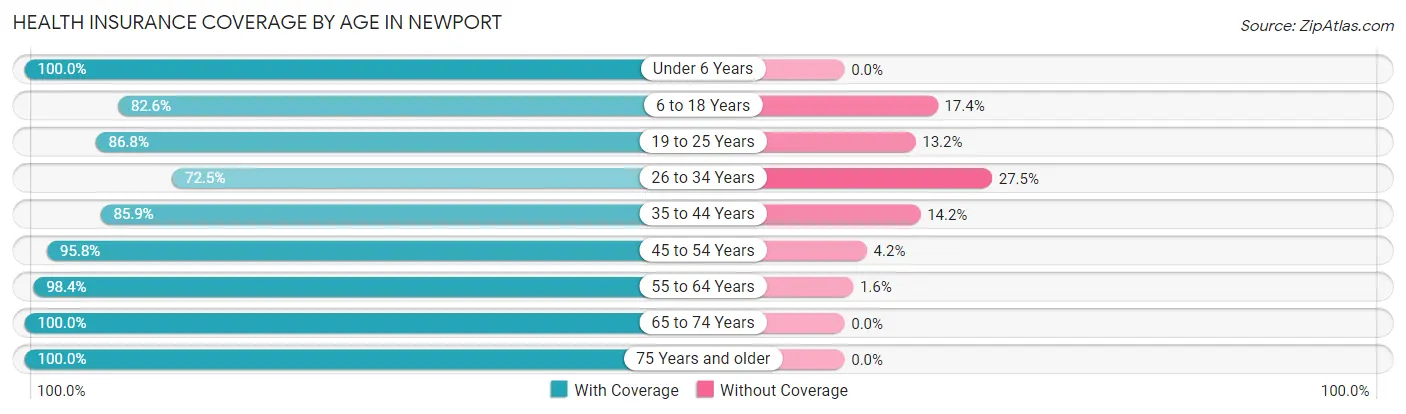
| Age Bracket | With Coverage | Without Coverage |
| Under 6 Years | 135 (100.0%) | 0 (0.0%) |
| 6 to 18 Years | 347 (82.6%) | 73 (17.4%) |
| 19 to 25 Years | 177 (86.8%) | 27 (13.2%) |
| 26 to 34 Years | 145 (72.5%) | 55 (27.5%) |
| 35 to 44 Years | 176 (85.9%) | 29 (14.1%) |
| 45 to 54 Years | 207 (95.8%) | 9 (4.2%) |
| 55 to 64 Years | 245 (98.4%) | 4 (1.6%) |
| 65 to 74 Years | 201 (100.0%) | 0 (0.0%) |
| 75 Years and older | 203 (100.0%) | 0 (0.0%) |
| Total | 1,836 (90.3%) | 197 (9.7%) |
Health Insurance Coverage by Citizenship Status in Newport
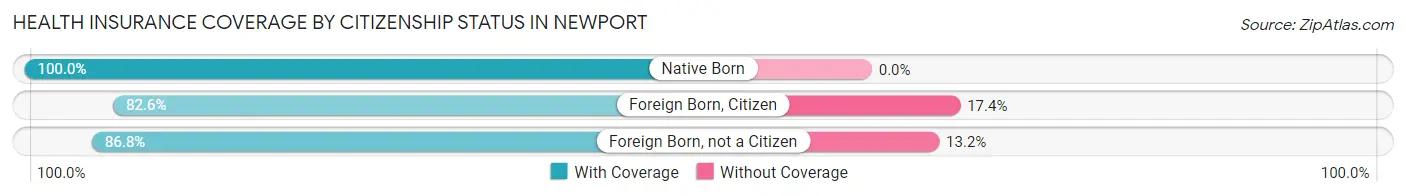
| Citizenship Status | With Coverage | Without Coverage |
| Native Born | 135 (100.0%) | 0 (0.0%) |
| Foreign Born, Citizen | 347 (82.6%) | 73 (17.4%) |
| Foreign Born, not a Citizen | 177 (86.8%) | 27 (13.2%) |
Health Insurance Coverage by Household Income in Newport
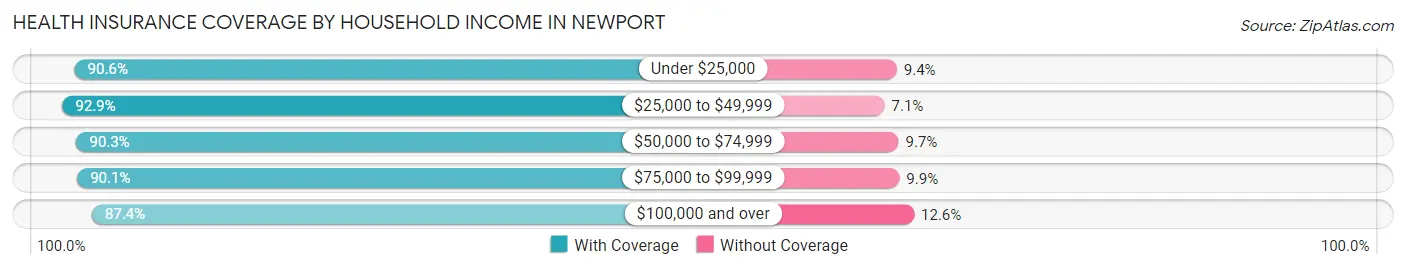
| Household Income | With Coverage | Without Coverage |
| Under $25,000 | 406 (90.6%) | 42 (9.4%) |
| $25,000 to $49,999 | 499 (92.9%) | 38 (7.1%) |
| $50,000 to $74,999 | 186 (90.3%) | 20 (9.7%) |
| $75,000 to $99,999 | 256 (90.1%) | 28 (9.9%) |
| $100,000 and over | 478 (87.4%) | 69 (12.6%) |
Public vs Private Health Insurance Coverage by Age in Newport
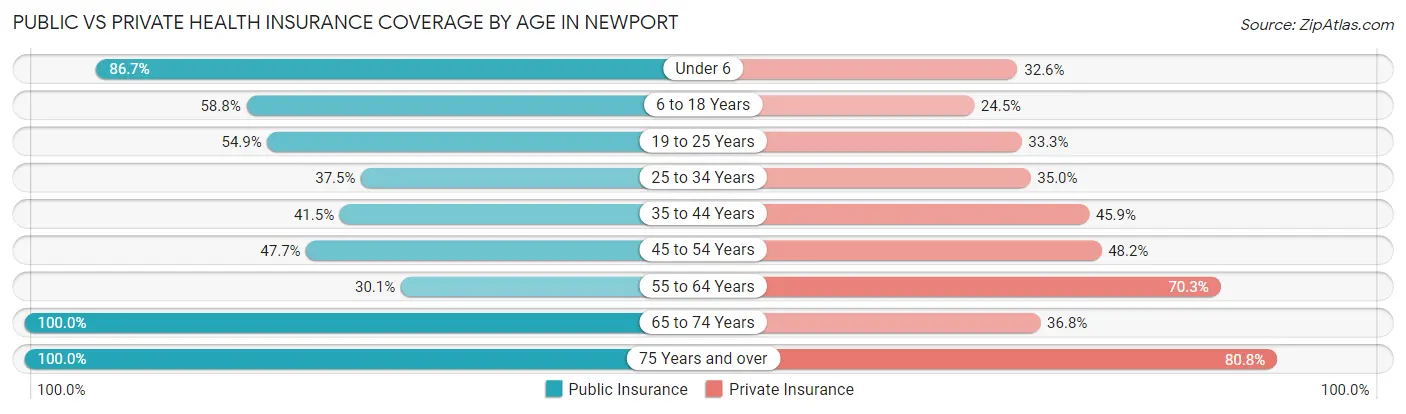
| Age Bracket | Public Insurance | Private Insurance |
| Under 6 | 117 (86.7%) | 44 (32.6%) |
| 6 to 18 Years | 247 (58.8%) | 103 (24.5%) |
| 19 to 25 Years | 112 (54.9%) | 68 (33.3%) |
| 25 to 34 Years | 75 (37.5%) | 70 (35.0%) |
| 35 to 44 Years | 85 (41.5%) | 94 (45.9%) |
| 45 to 54 Years | 103 (47.7%) | 104 (48.1%) |
| 55 to 64 Years | 75 (30.1%) | 175 (70.3%) |
| 65 to 74 Years | 201 (100.0%) | 74 (36.8%) |
| 75 Years and over | 203 (100.0%) | 164 (80.8%) |
| Total | 1,218 (59.9%) | 896 (44.1%) |
Disability Status by Sex by Age in Newport
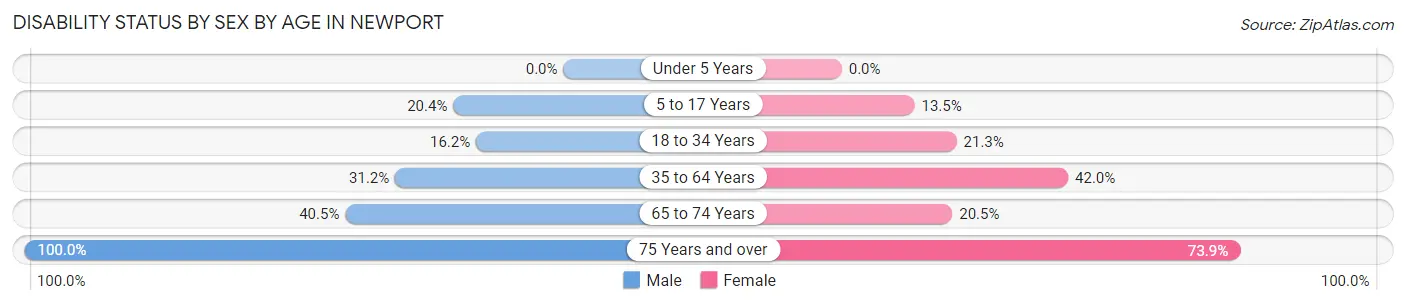
| Age Bracket | Male | Female |
| Under 5 Years | 0 (0.0%) | 0 (0.0%) |
| 5 to 17 Years | 46 (20.4%) | 22 (13.5%) |
| 18 to 34 Years | 41 (16.2%) | 39 (21.3%) |
| 35 to 64 Years | 94 (31.2%) | 155 (42.0%) |
| 65 to 74 Years | 34 (40.5%) | 24 (20.5%) |
| 75 Years and over | 65 (100.0%) | 102 (73.9%) |
Disability Class by Sex by Age in Newport
Disability Class: Hearing Difficulty
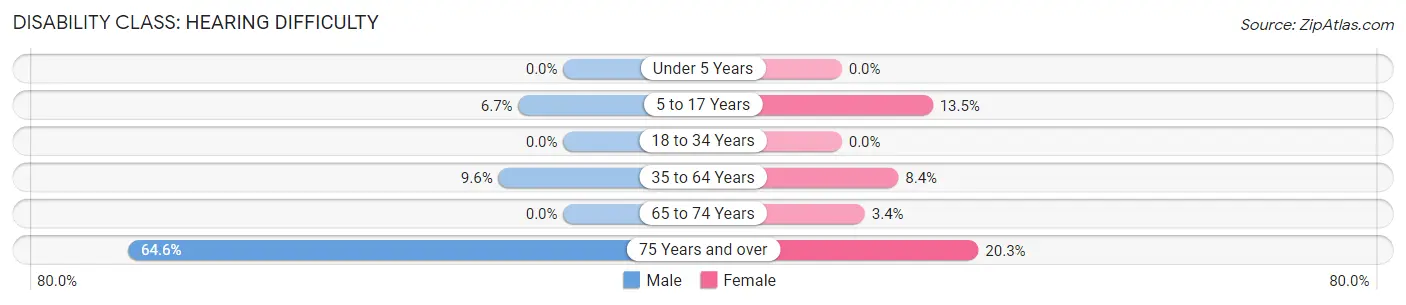
| Age Bracket | Male | Female |
| Under 5 Years | 0 (0.0%) | 0 (0.0%) |
| 5 to 17 Years | 15 (6.7%) | 22 (13.5%) |
| 18 to 34 Years | 0 (0.0%) | 0 (0.0%) |
| 35 to 64 Years | 29 (9.6%) | 31 (8.4%) |
| 65 to 74 Years | 0 (0.0%) | 4 (3.4%) |
| 75 Years and over | 42 (64.6%) | 28 (20.3%) |
Disability Class: Vision Difficulty
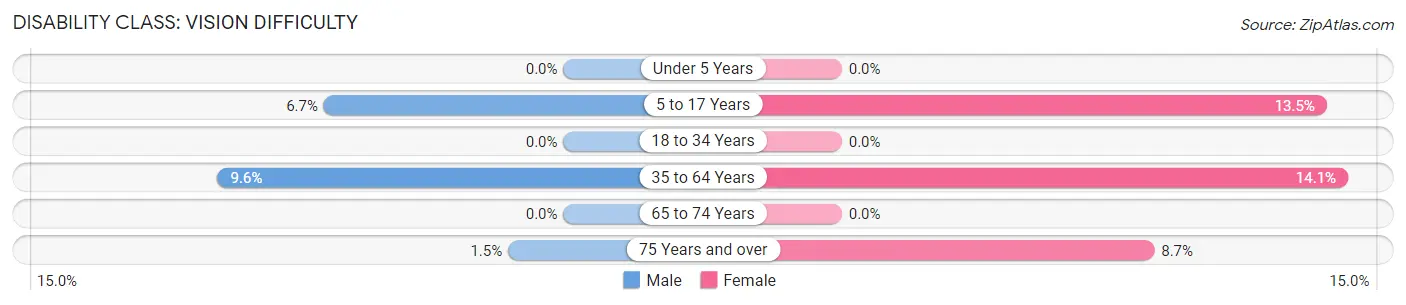
| Age Bracket | Male | Female |
| Under 5 Years | 0 (0.0%) | 0 (0.0%) |
| 5 to 17 Years | 15 (6.7%) | 22 (13.5%) |
| 18 to 34 Years | 0 (0.0%) | 0 (0.0%) |
| 35 to 64 Years | 29 (9.6%) | 52 (14.1%) |
| 65 to 74 Years | 0 (0.0%) | 0 (0.0%) |
| 75 Years and over | 1 (1.5%) | 12 (8.7%) |
Disability Class: Cognitive Difficulty
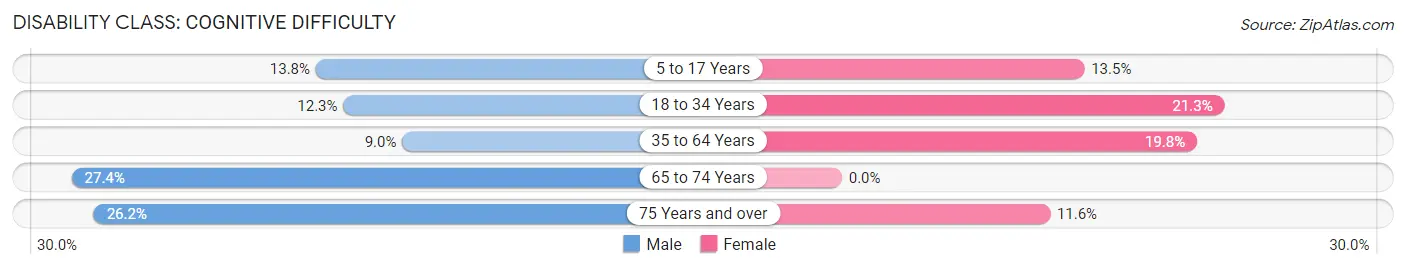
| Age Bracket | Male | Female |
| 5 to 17 Years | 31 (13.8%) | 22 (13.5%) |
| 18 to 34 Years | 31 (12.2%) | 39 (21.3%) |
| 35 to 64 Years | 27 (9.0%) | 73 (19.8%) |
| 65 to 74 Years | 23 (27.4%) | 0 (0.0%) |
| 75 Years and over | 17 (26.2%) | 16 (11.6%) |
Disability Class: Ambulatory Difficulty
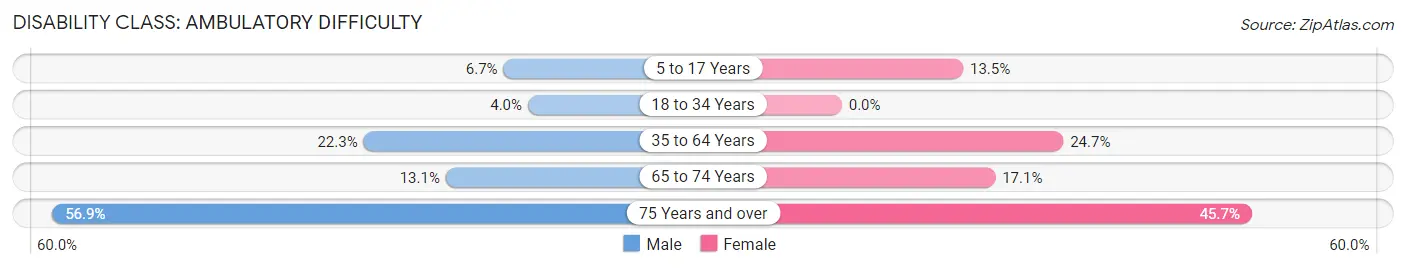
| Age Bracket | Male | Female |
| 5 to 17 Years | 15 (6.7%) | 22 (13.5%) |
| 18 to 34 Years | 10 (4.0%) | 0 (0.0%) |
| 35 to 64 Years | 67 (22.3%) | 91 (24.7%) |
| 65 to 74 Years | 11 (13.1%) | 20 (17.1%) |
| 75 Years and over | 37 (56.9%) | 63 (45.7%) |
Disability Class: Self-Care Difficulty
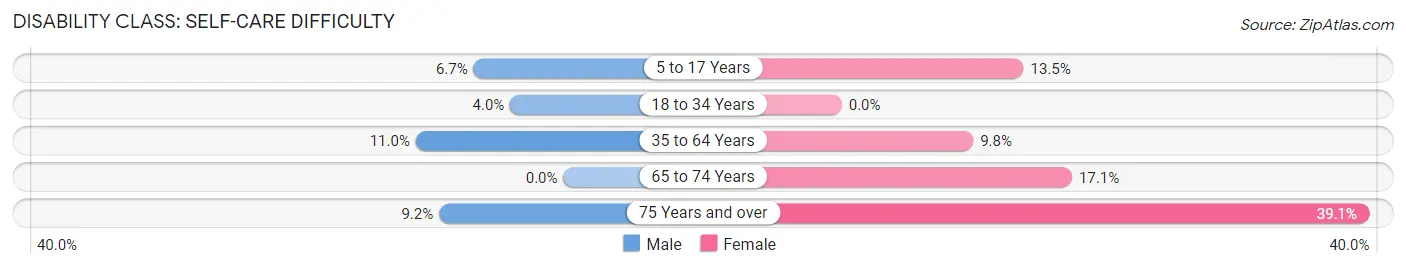
| Age Bracket | Male | Female |
| 5 to 17 Years | 15 (6.7%) | 22 (13.5%) |
| 18 to 34 Years | 10 (4.0%) | 0 (0.0%) |
| 35 to 64 Years | 33 (11.0%) | 36 (9.8%) |
| 65 to 74 Years | 0 (0.0%) | 20 (17.1%) |
| 75 Years and over | 6 (9.2%) | 54 (39.1%) |
Technology Access in Newport
Computing Device Access in Newport
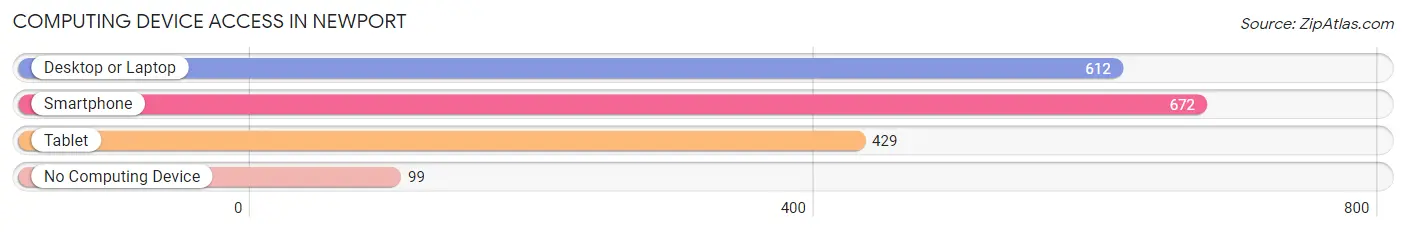
| Device Type | # Households | % Households |
| Desktop or Laptop | 612 | 73.4% |
| Smartphone | 672 | 80.6% |
| Tablet | 429 | 51.4% |
| No Computing Device | 99 | 11.9% |
| Total | 834 | 100.0% |
Internet Access in Newport
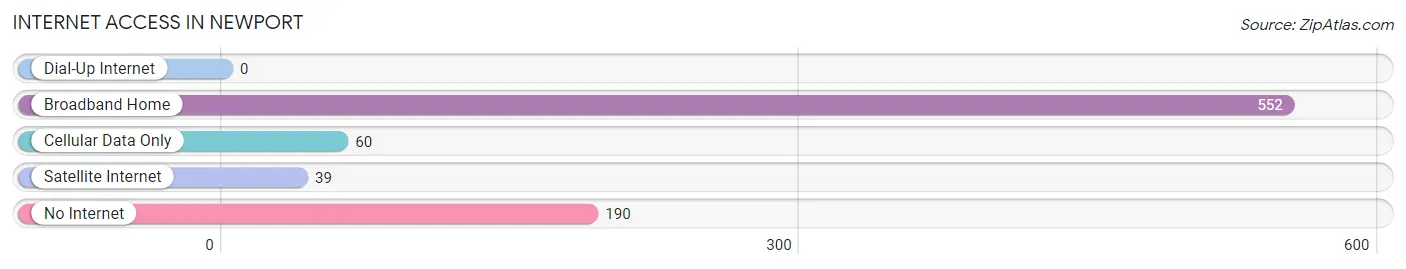
| Internet Type | # Households | % Households |
| Dial-Up Internet | 0 | 0.0% |
| Broadband Home | 552 | 66.2% |
| Cellular Data Only | 60 | 7.2% |
| Satellite Internet | 39 | 4.7% |
| No Internet | 190 | 22.8% |
| Total | 834 | 100.0% |
Newport Summary
Newport is a city located in Pend Oreille County, Washington, United States. The population was 1,845 at the 2010 census. It is the county seat of Pend Oreille County.
History
The area that is now Newport was first settled in the late 1800s by miners and loggers. The town was officially incorporated in 1909. The city was named after Newport, Rhode Island, the hometown of one of the early settlers.
In the early 1900s, Newport was a bustling logging and mining town. The city was home to several sawmills, a large lumber mill, and a copper smelter. The city also had a large railroad yard and a large number of hotels and saloons.
In the 1920s, the city began to decline as the logging and mining industries moved away. The city was hit hard by the Great Depression and many of the businesses closed.
In the 1950s, the city began to experience a resurgence as the timber industry returned to the area. The city also became a popular tourist destination, with many people coming to enjoy the nearby lakes and rivers.
Geography
Newport is located at 48°11′N 117°2′W (48.1833, -117.0333). According to the United States Census Bureau, the city has a total area of 1.3 square miles (3.4 km2), all of it land.
The city is located on the Pend Oreille River, which is a tributary of the Columbia River. The city is surrounded by mountains and forests.
Economy
The economy of Newport is largely based on tourism and timber. The city is home to several sawmills and lumber mills, as well as a number of tourist attractions.
The city is also home to a number of small businesses, including restaurants, shops, and other services.
Demographics
As of the census of 2010, there were 1,845 people, 790 households, and 486 families residing in the city. The population density was 1,420.7 people per square mile (548.7/km2). There were 890 housing units at an average density of 683.8 per square mile (264.3/km2). The racial makeup of the city was 94.2% White, 0.3% African American, 1.2% Native American, 0.4% Asian, 0.1% Pacific Islander, 0.7% from other races, and 2.9% from two or more races. Hispanic or Latino of any race were 3.2% of the population.
There were 790 households, out of which 24.3% had children under the age of 18 living with them, 46.3% were married couples living together, 10.9% had a female householder with no husband present, and 38.3% were non-families. 33.3% of all households were made up of individuals, and 15.3% had someone living alone who was 65 years of age or older. The average household size was 2.25 and the average family size was 2.86.
In the city, the population was spread out, with 22.2% under the age of 18, 7.2% from 18 to 24, 24.2% from 25 to 44, 27.2% from 45 to 64, and 19.2% who were 65 years of age or older. The median age was 42 years. For every 100 females, there were 94.2 males. For every 100 females age 18 and over, there were 91.2 males.
The median income for a household in the city was $30,938, and the median income for a family was $37,500. Males had a median income of $30,000 versus $20,000 for females. The per capita income for the city was $17,845. About 11.3% of families and 14.2% of the population were below the poverty line, including 19.2% of those under age 18 and 8.2% of those age 65 or over.
Common Questions
What is the Total Population of Newport?
Total Population of Newport is 2,136.
What is the Total Male Population of Newport?
Total Male Population of Newport is 1,078.
What is the Total Female Population of Newport?
Total Female Population of Newport is 1,058.
What is the Ratio of Males per 100 Females in Newport?
There are 101.89 Males per 100 Females in Newport.
What is the Ratio of Females per 100 Males in Newport?
There are 98.14 Females per 100 Males in Newport.
What is the Median Population Age in Newport?
Median Population Age in Newport is 38.8 Years.
What is the Average Family Size in Newport
Average Family Size in Newport is 2.9 People.
What is the Average Household Size in Newport
Average Household Size in Newport is 2.4 People.
What is Per Capita Income in Newport?
Per Capita income in Newport is $22,137.
What is the Median Family Income in Newport?
Median Family Income in Newport is $49,194.
What is the Median Household income in Newport?
Median Household Income in Newport is $46,250.
What is Income or Wage Gap in Newport?
Income or Wage Gap in Newport is 28.5%.
Women in Newport earn 71.5 cents for every dollar earned by a man.
What is Inequality or Gini Index in Newport?
Inequality or Gini Index in Newport is 0.43.
How Large is the Labor Force in Newport?
There are 774 People in the Labor Forcein in Newport.
What is the Percentage of People in the Labor Force in Newport?
45.8% of People are in the Labor Force in Newport.
What is the Unemployment Rate in Newport?
Unemployment Rate in Newport is 3.0%.