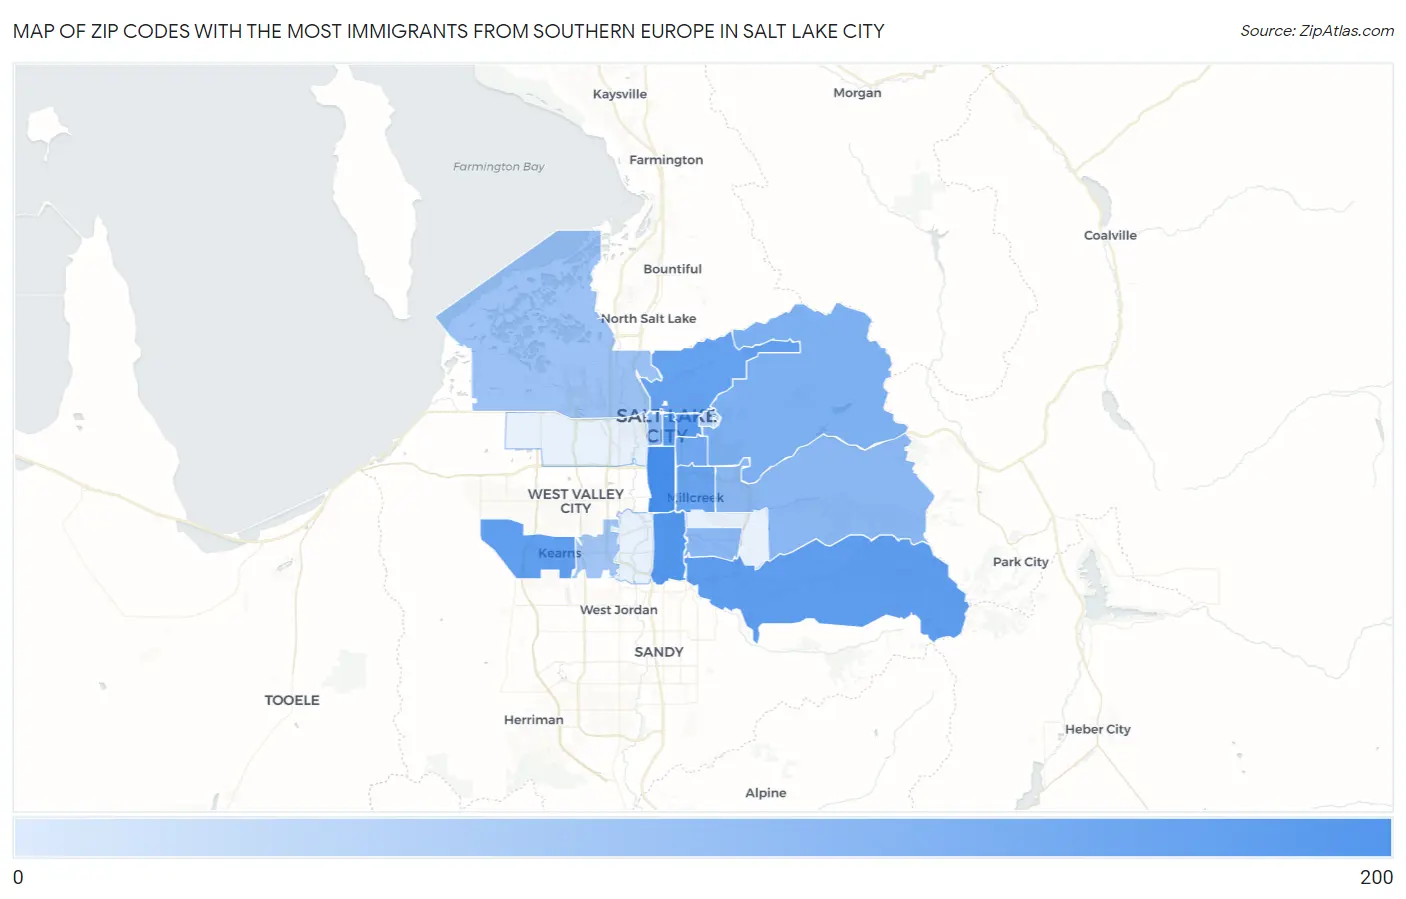
Zip Codes with the Most Immigrants from Southern Europe in Salt Lake City, UT
RELATED REPORTS & OPTIONS
Southern Europe
Salt Lake City
Compare Zip Codes
Map of Zip Codes with the Most Immigrants from Southern Europe in Salt Lake City
0
200
Zip Codes with the Most Immigrants from Southern Europe in Salt Lake City, UT
| Zip Code | Southern Europe | vs State | vs National | |
| 1. | 84115 | 173 | 2,555(6.77%)#2 | 728,588(0.02%)#980 |
| 2. | 84107 | 120 | 2,555(4.70%)#3 | 728,588(0.02%)#1,535 |
| 3. | 84102 | 101 | 2,555(3.95%)#4 | 728,588(0.01%)#1,835 |
| 4. | 84111 | 85 | 2,555(3.33%)#6 | 728,588(0.01%)#2,170 |
| 5. | 84121 | 78 | 2,555(3.05%)#9 | 728,588(0.01%)#2,328 |
| 6. | 84118 | 73 | 2,555(2.86%)#13 | 728,588(0.01%)#2,481 |
| 7. | 84103 | 63 | 2,555(2.47%)#15 | 728,588(0.01%)#2,800 |
| 8. | 84106 | 51 | 2,555(2.00%)#18 | 728,588(0.01%)#3,266 |
| 9. | 84105 | 40 | 2,555(1.57%)#22 | 728,588(0.01%)#3,833 |
| 10. | 84108 | 26 | 2,555(1.02%)#32 | 728,588(0.00%)#4,862 |
| 11. | 84101 | 17 | 2,555(0.67%)#43 | 728,588(0.00%)#5,832 |
| 12. | 84109 | 16 | 2,555(0.63%)#44 | 728,588(0.00%)#5,900 |
| 13. | 84117 | 16 | 2,555(0.63%)#45 | 728,588(0.00%)#5,903 |
| 14. | 84116 | 9 | 2,555(0.35%)#55 | 728,588(0.00%)#6,999 |
| 15. | 84129 | 7 | 2,555(0.27%)#60 | 728,588(0.00%)#7,428 |
| 16. | 84112 | 4 | 2,555(0.16%)#71 | 728,588(0.00%)#8,186 |
1
Common Questions
What are the Top 10 Zip Codes with the Most Immigrants from Southern Europe in Salt Lake City, UT?
Top 10 Zip Codes with the Most Immigrants from Southern Europe in Salt Lake City, UT are:
What zip code has the Most Immigrants from Southern Europe in Salt Lake City, UT?
84115 has the Most Immigrants from Southern Europe in Salt Lake City, UT with 173.
What is the Total Immigrants from Southern Europe in Salt Lake City, UT?
Total Immigrants from Southern Europe in Salt Lake City is 381.
What is the Total Immigrants from Southern Europe in Utah?
Total Immigrants from Southern Europe in Utah is 2,555.
What is the Total Immigrants from Southern Europe in the United States?
Total Immigrants from Southern Europe in the United States is 728,588.