Sneedville, TN
Sneedville Map
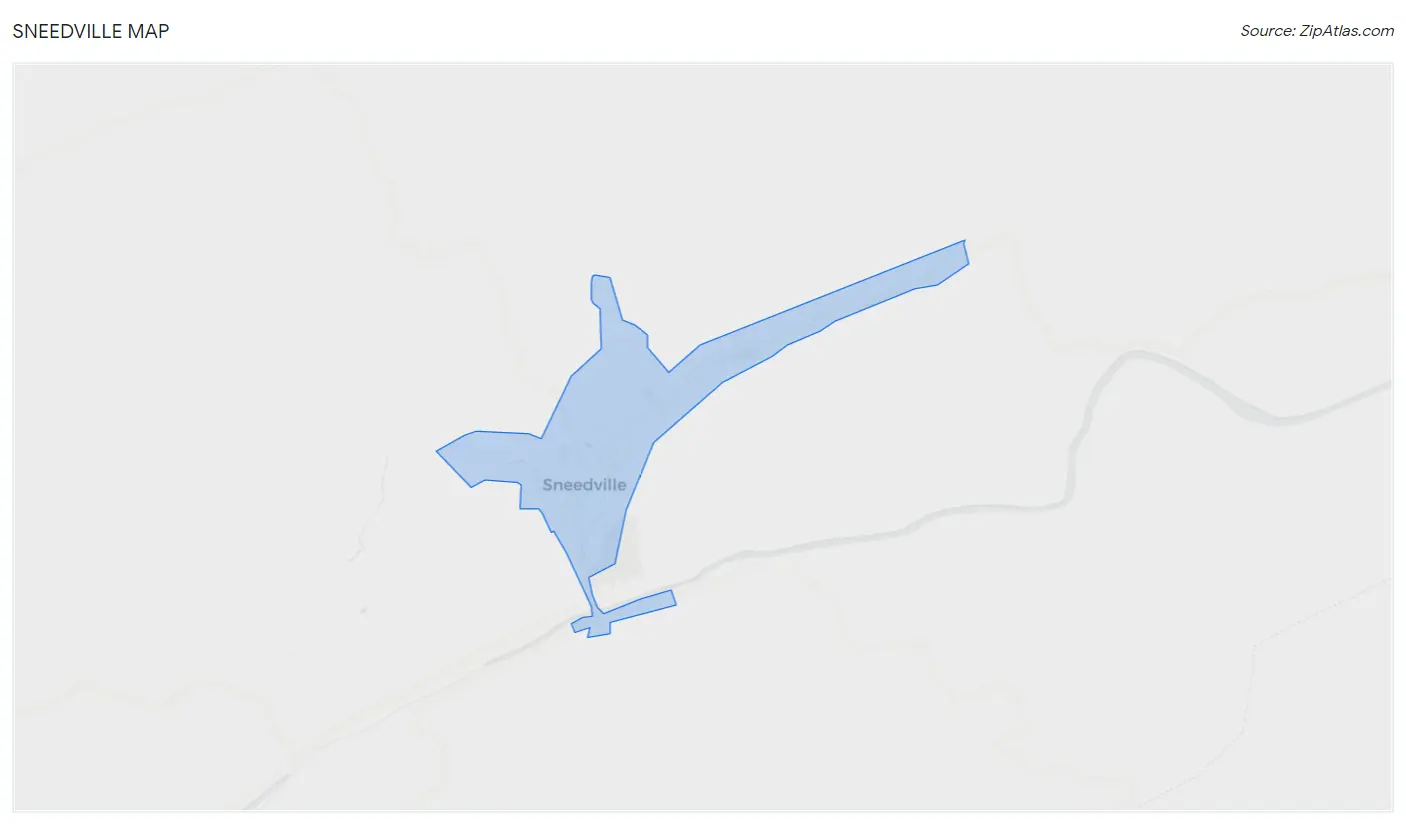
Sneedville Overview
1,590
TOTAL POPULATION
782
MALE POPULATION
808
FEMALE POPULATION
96.78
MALES / 100 FEMALES
103.32
FEMALES / 100 MALES
39.7
MEDIAN AGE
2.6
AVG FAMILY SIZE
2.3
AVG HOUSEHOLD SIZE
$17,222
PER CAPITA INCOME
$31,563
AVG FAMILY INCOME
$23,897
AVG HOUSEHOLD INCOME
38.2%
WAGE / INCOME GAP [ % ]
61.8¢/ $1
WAGE / INCOME GAP [ $ ]
0.55
INEQUALITY / GINI INDEX
501
LABOR FORCE [ PEOPLE ]
38.3%
PERCENT IN LABOR FORCE
13.6%
UNEMPLOYMENT RATE
Sneedville Zip Codes
Sneedville Area Codes
Race in Sneedville
The most populous races in Sneedville are White / Caucasian (1,500 | 94.3%), Two or more Races (41 | 2.6%), and Black / African American (33 | 2.1%).
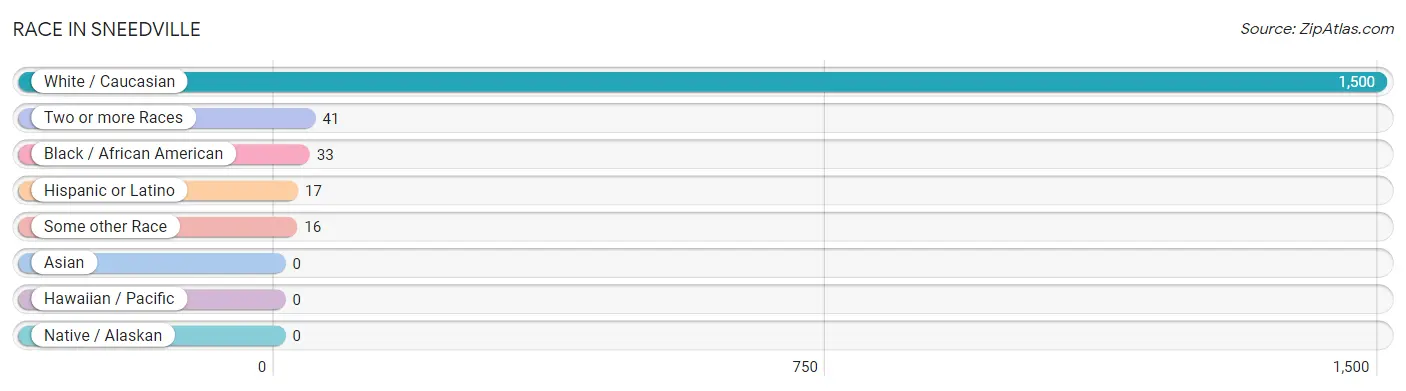
| Race | # Population | % Population |
| Asian | 0 | 0.0% |
| Black / African American | 33 | 2.1% |
| Hawaiian / Pacific | 0 | 0.0% |
| Hispanic or Latino | 17 | 1.1% |
| Native / Alaskan | 0 | 0.0% |
| White / Caucasian | 1,500 | 94.3% |
| Two or more Races | 41 | 2.6% |
| Some other Race | 16 | 1.0% |
| Total | 1,590 | 100.0% |
Ancestry in Sneedville
The most populous ancestries reported in Sneedville are English (251 | 15.8%), American (178 | 11.2%), Irish (124 | 7.8%), Mexican (17 | 1.1%), and Cherokee (13 | 0.8%), together accounting for 36.7% of all Sneedville residents.
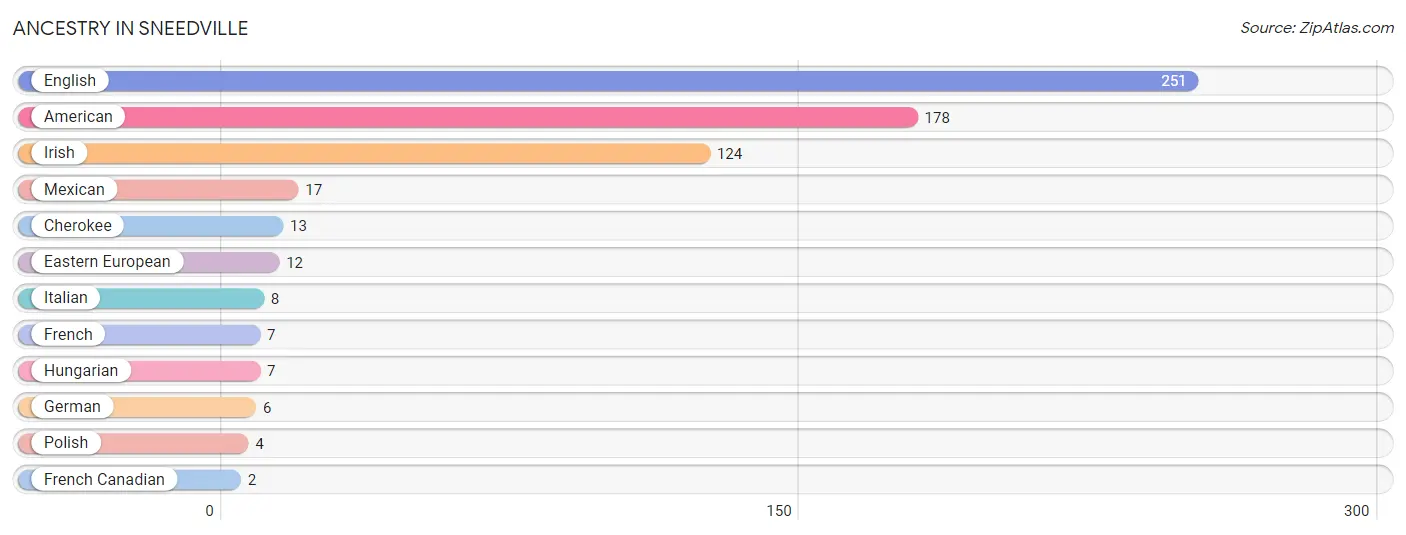
| Ancestry | # Population | % Population |
| American | 178 | 11.2% |
| Cherokee | 13 | 0.8% |
| Eastern European | 12 | 0.7% |
| English | 251 | 15.8% |
| French | 7 | 0.4% |
| French Canadian | 2 | 0.1% |
| German | 6 | 0.4% |
| Hungarian | 7 | 0.4% |
| Irish | 124 | 7.8% |
| Italian | 8 | 0.5% |
| Mexican | 17 | 1.1% |
| Polish | 4 | 0.3% | View All 12 Rows |
Immigrants in Sneedville
The most numerous immigrant groups reported in Sneedville came from Central America (7 | 0.4%), Latin America (7 | 0.4%), and Mexico (7 | 0.4%), together accounting for 1.3% of all Sneedville residents.
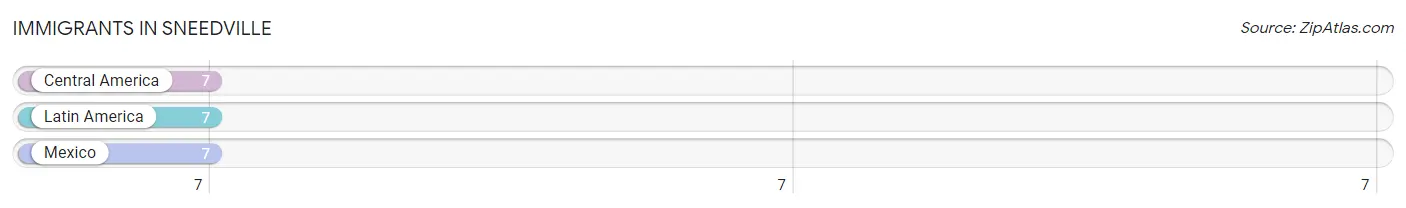
| Immigration Origin | # Population | % Population |
| Central America | 7 | 0.4% |
| Latin America | 7 | 0.4% |
| Mexico | 7 | 0.4% | View All 3 Rows |
Sex and Age in Sneedville
Sex and Age in Sneedville
The most populous age groups in Sneedville are 25 to 29 Years (132 | 16.9%) for men and 55 to 59 Years (97 | 12.0%) for women.
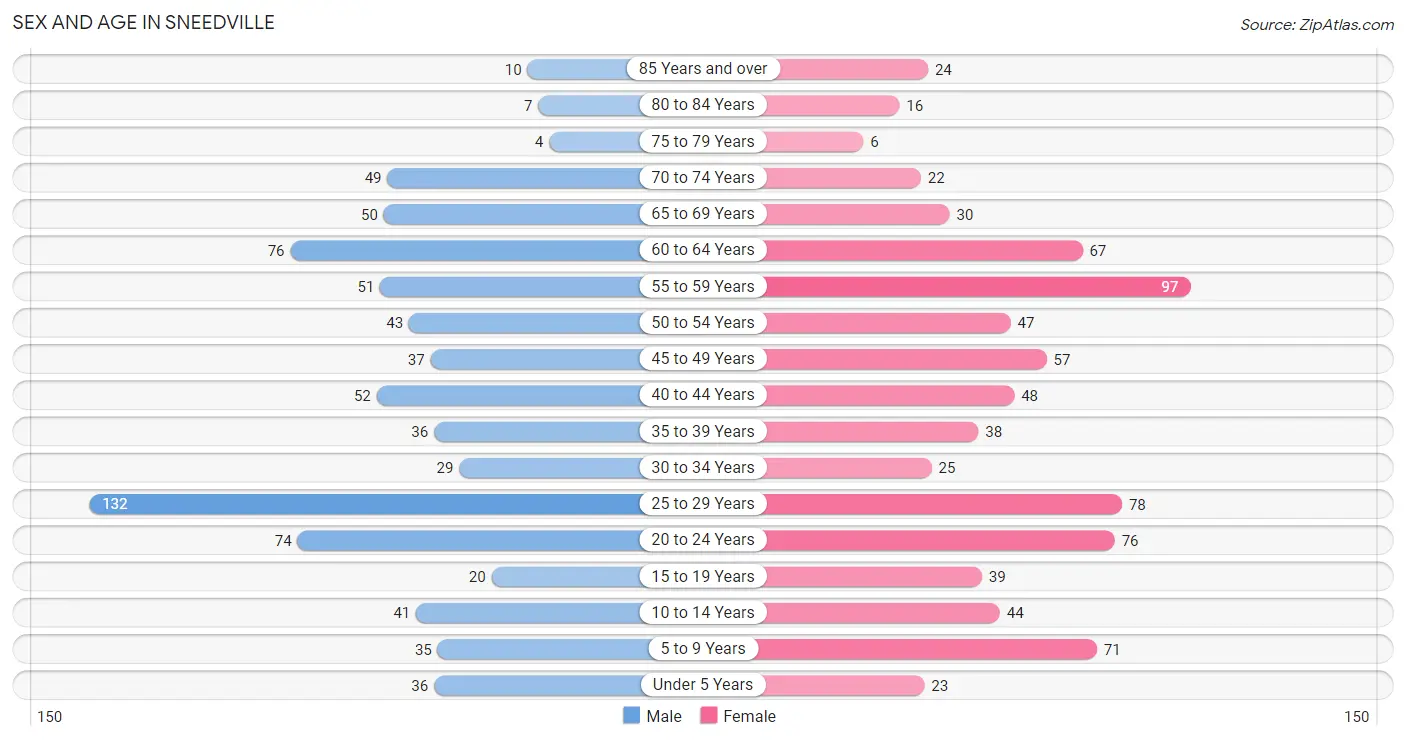
| Age Bracket | Male | Female |
| Under 5 Years | 36 (4.6%) | 23 (2.9%) |
| 5 to 9 Years | 35 (4.5%) | 71 (8.8%) |
| 10 to 14 Years | 41 (5.2%) | 44 (5.4%) |
| 15 to 19 Years | 20 (2.6%) | 39 (4.8%) |
| 20 to 24 Years | 74 (9.5%) | 76 (9.4%) |
| 25 to 29 Years | 132 (16.9%) | 78 (9.7%) |
| 30 to 34 Years | 29 (3.7%) | 25 (3.1%) |
| 35 to 39 Years | 36 (4.6%) | 38 (4.7%) |
| 40 to 44 Years | 52 (6.7%) | 48 (5.9%) |
| 45 to 49 Years | 37 (4.7%) | 57 (7.0%) |
| 50 to 54 Years | 43 (5.5%) | 47 (5.8%) |
| 55 to 59 Years | 51 (6.5%) | 97 (12.0%) |
| 60 to 64 Years | 76 (9.7%) | 67 (8.3%) |
| 65 to 69 Years | 50 (6.4%) | 30 (3.7%) |
| 70 to 74 Years | 49 (6.3%) | 22 (2.7%) |
| 75 to 79 Years | 4 (0.5%) | 6 (0.7%) |
| 80 to 84 Years | 7 (0.9%) | 16 (2.0%) |
| 85 Years and over | 10 (1.3%) | 24 (3.0%) |
| Total | 782 (100.0%) | 808 (100.0%) |
Families and Households in Sneedville
Median Family Size in Sneedville
The median family size in Sneedville is 2.61 persons per family, with married-couple families (208 | 48.7%) accounting for the largest median family size of 2.93 persons per family. On the other hand, single male/father families (81 | 19.0%) represent the smallest median family size with 1.88 persons per family.
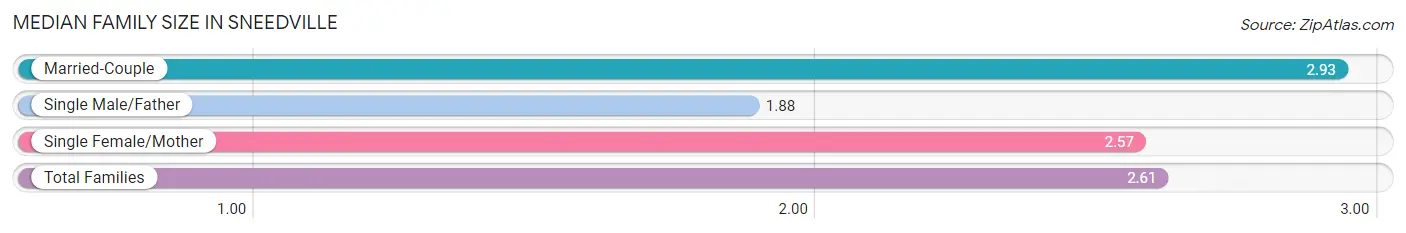
| Family Type | # Families | Family Size |
| Married-Couple | 208 (48.7%) | 2.93 |
| Single Male/Father | 81 (19.0%) | 1.88 |
| Single Female/Mother | 138 (32.3%) | 2.57 |
| Total Families | 427 (100.0%) | 2.61 |
Median Household Size in Sneedville
The median household size in Sneedville is 2.32 persons per household, with married-couple households (208 | 33.4%) accounting for the largest median household size of 2.93 persons per household. non-family households (196 | 31.5%) represent the smallest median household size with 1.20 persons per household.
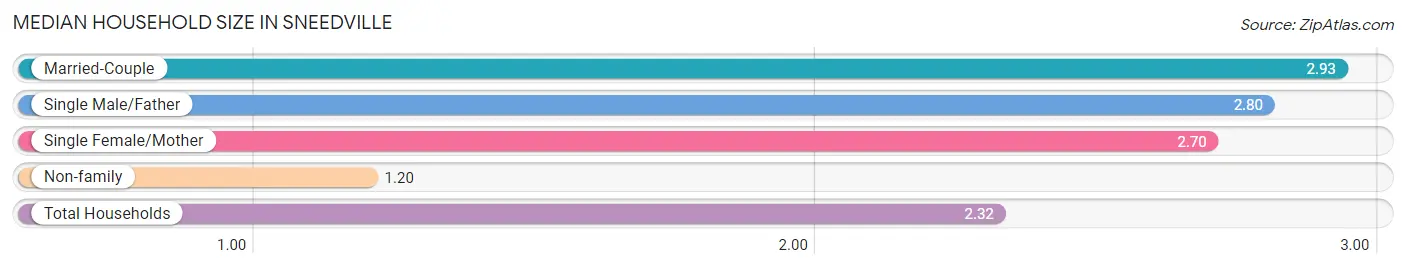
| Household Type | # Households | Household Size |
| Married-Couple | 208 (33.4%) | 2.93 |
| Single Male/Father | 81 (13.0%) | 2.80 |
| Single Female/Mother | 138 (22.2%) | 2.70 |
| Non-family | 196 (31.5%) | 1.20 |
| Total Households | 623 (100.0%) | 2.32 |
Household Size by Marriage Status in Sneedville
Out of a total of 623 households in Sneedville, 427 (68.5%) are family households, while 196 (31.5%) are nonfamily households. The most numerous type of family households are 3-person households, comprising 164, and the most common type of nonfamily households are 1-person households, comprising 182.
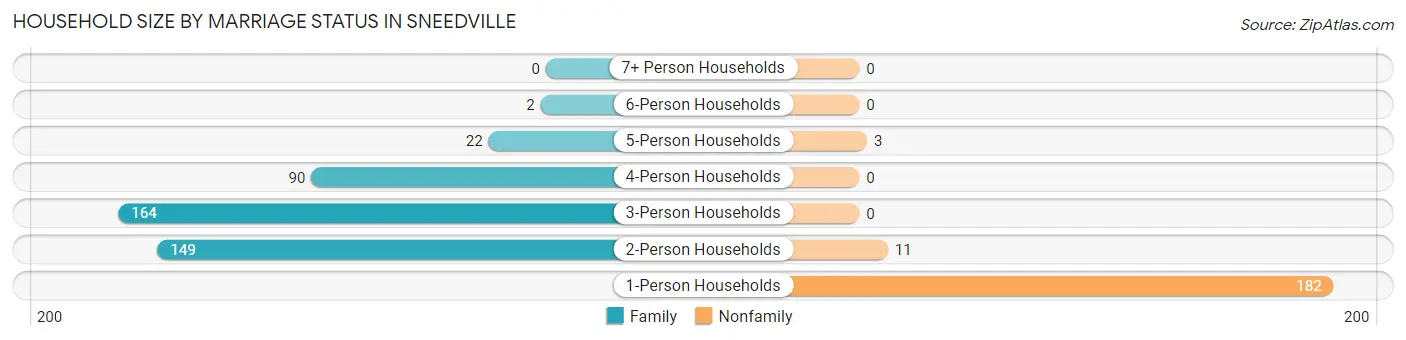
| Household Size | Family Households | Nonfamily Households |
| 1-Person Households | - | 182 (29.2%) |
| 2-Person Households | 149 (23.9%) | 11 (1.8%) |
| 3-Person Households | 164 (26.3%) | 0 (0.0%) |
| 4-Person Households | 90 (14.4%) | 0 (0.0%) |
| 5-Person Households | 22 (3.5%) | 3 (0.5%) |
| 6-Person Households | 2 (0.3%) | 0 (0.0%) |
| 7+ Person Households | 0 (0.0%) | 0 (0.0%) |
| Total | 427 (68.5%) | 196 (31.5%) |
Female Fertility in Sneedville
Fertility by Age in Sneedville
Average fertility rate in Sneedville is 42.0 births per 1,000 women. Women in the age bracket of 20 to 34 years have the highest fertility rate with 89.0 births per 1,000 women. Women in the age bracket of 20 to 34 years acount for 100.0% of all women with births.
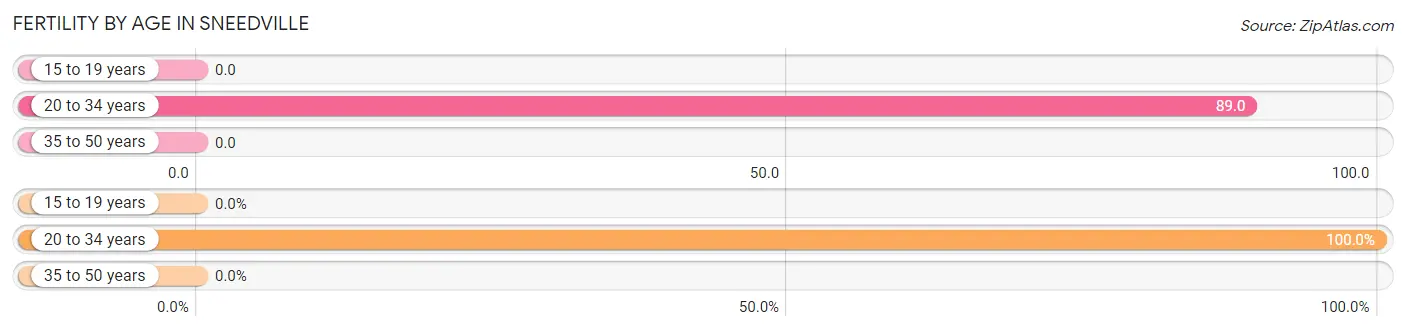
| Age Bracket | Women with Births | Births / 1,000 Women |
| 15 to 19 years | 0 (0.0%) | 0.0 |
| 20 to 34 years | 16 (100.0%) | 89.0 |
| 35 to 50 years | 0 (0.0%) | 0.0 |
| Total | 16 (100.0%) | 42.0 |
Fertility by Age by Marriage Status in Sneedville
43.8% of women with births (16) in Sneedville are married. The highest percentage of unmarried women with births falls into 20 to 34 years age bracket with 56.2% of them unmarried at the time of birth, while the lowest percentage of unmarried women with births belong to 20 to 34 years age bracket with 56.2% of them unmarried.
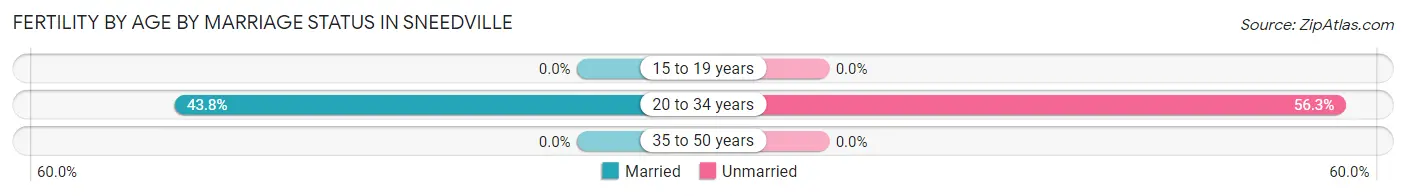
| Age Bracket | Married | Unmarried |
| 15 to 19 years | 0 (0.0%) | 0 (0.0%) |
| 20 to 34 years | 7 (43.8%) | 9 (56.2%) |
| 35 to 50 years | 0 (0.0%) | 0 (0.0%) |
| Total | 7 (43.8%) | 9 (56.2%) |
Fertility by Education in Sneedville
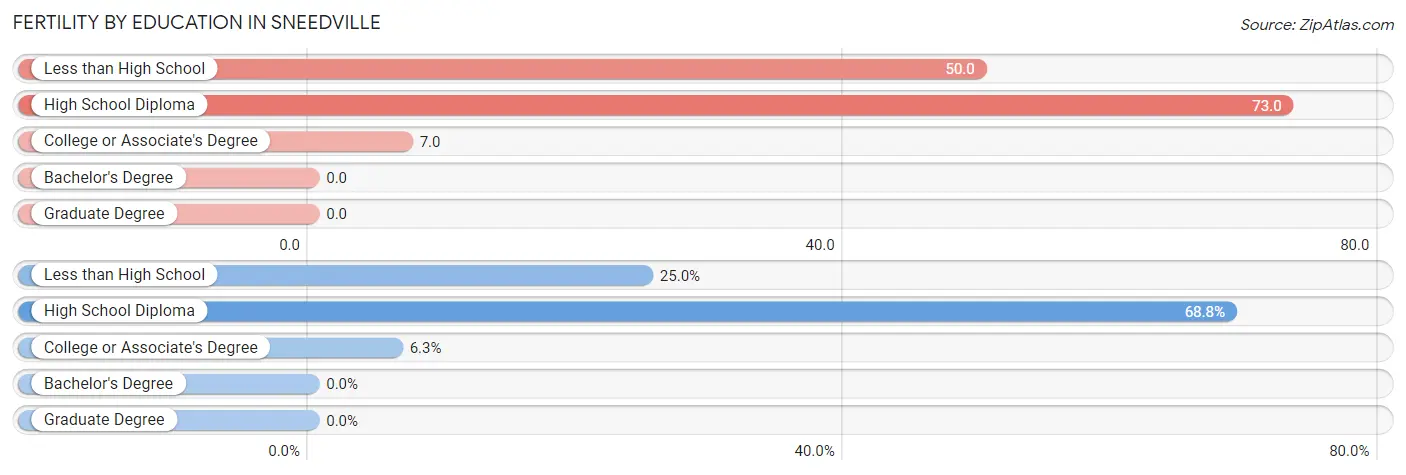
| Educational Attainment | Women with Births | Births / 1,000 Women |
| Less than High School | 4 (25.0%) | 50.0 |
| High School Diploma | 11 (68.8%) | 73.0 |
| College or Associate's Degree | 1 (6.2%) | 7.0 |
| Bachelor's Degree | 0 (0.0%) | 0.0 |
| Graduate Degree | 0 (0.0%) | 0.0 |
| Total | 16 (100.0%) | 42.0 |
Fertility by Education by Marriage Status in Sneedville
56.2% of women with births in Sneedville are unmarried. Women with the educational attainment of college or associate's degree are most likely to be married with 100.0% of them married at childbirth, while women with the educational attainment of less than high school are least likely to be married with 100.0% of them unmarried at childbirth.
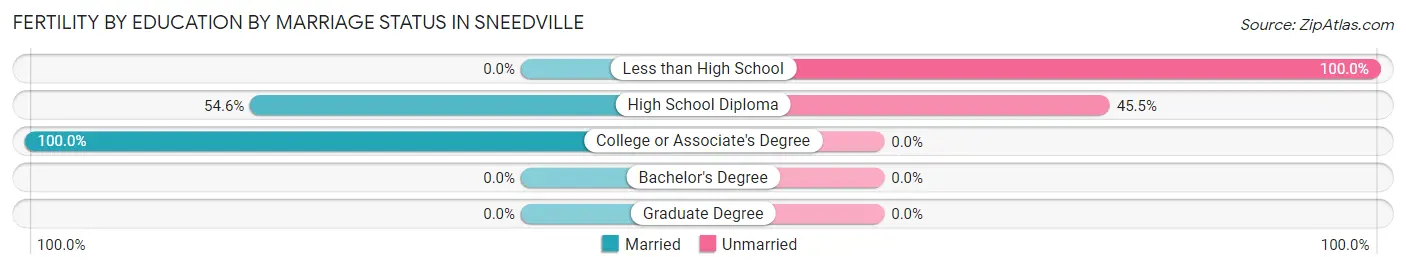
| Educational Attainment | Married | Unmarried |
| Less than High School | 0 (0.0%) | 4 (100.0%) |
| High School Diploma | 6 (54.5%) | 5 (45.5%) |
| College or Associate's Degree | 1 (100.0%) | 0 (0.0%) |
| Bachelor's Degree | 0 (0.0%) | 0 (0.0%) |
| Graduate Degree | 0 (0.0%) | 0 (0.0%) |
| Total | 7 (43.8%) | 9 (56.2%) |
Income in Sneedville
Income Overview in Sneedville
Per Capita Income in Sneedville is $17,222, while median incomes of families and households are $31,563 and $23,897 respectively.
| Characteristic | Number | Measure |
| Per Capita Income | 1,590 | $17,222 |
| Median Family Income | 427 | $31,563 |
| Mean Family Income | 427 | $49,283 |
| Median Household Income | 623 | $23,897 |
| Mean Household Income | 623 | $41,091 |
| Income Deficit | 427 | $0 |
| Wage / Income Gap (%) | 1,590 | 38.23% |
| Wage / Income Gap ($) | 1,590 | 61.77¢ per $1 |
| Gini / Inequality Index | 1,590 | 0.55 |
Earnings by Sex in Sneedville
Average Earnings in Sneedville are $27,820, $37,731 for men and $23,306 for women, a difference of 38.2%.
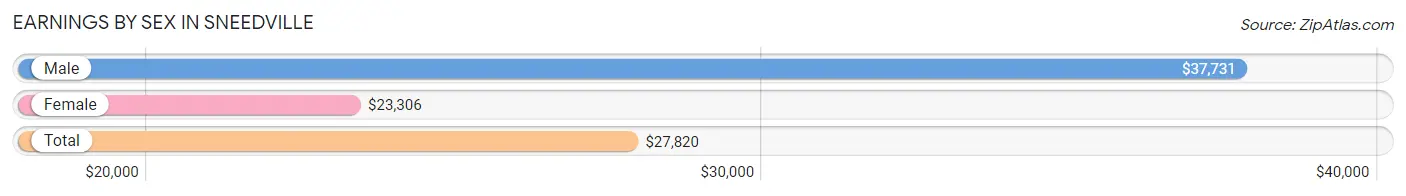
| Sex | Number | Average Earnings |
| Male | 237 (43.3%) | $37,731 |
| Female | 310 (56.7%) | $23,306 |
| Total | 547 (100.0%) | $27,820 |
Earnings by Sex by Income Bracket in Sneedville
The most common earnings brackets in Sneedville are $50,000 to $54,999 for men (32 | 13.5%) and $25,000 to $29,999 for women (41 | 13.2%).
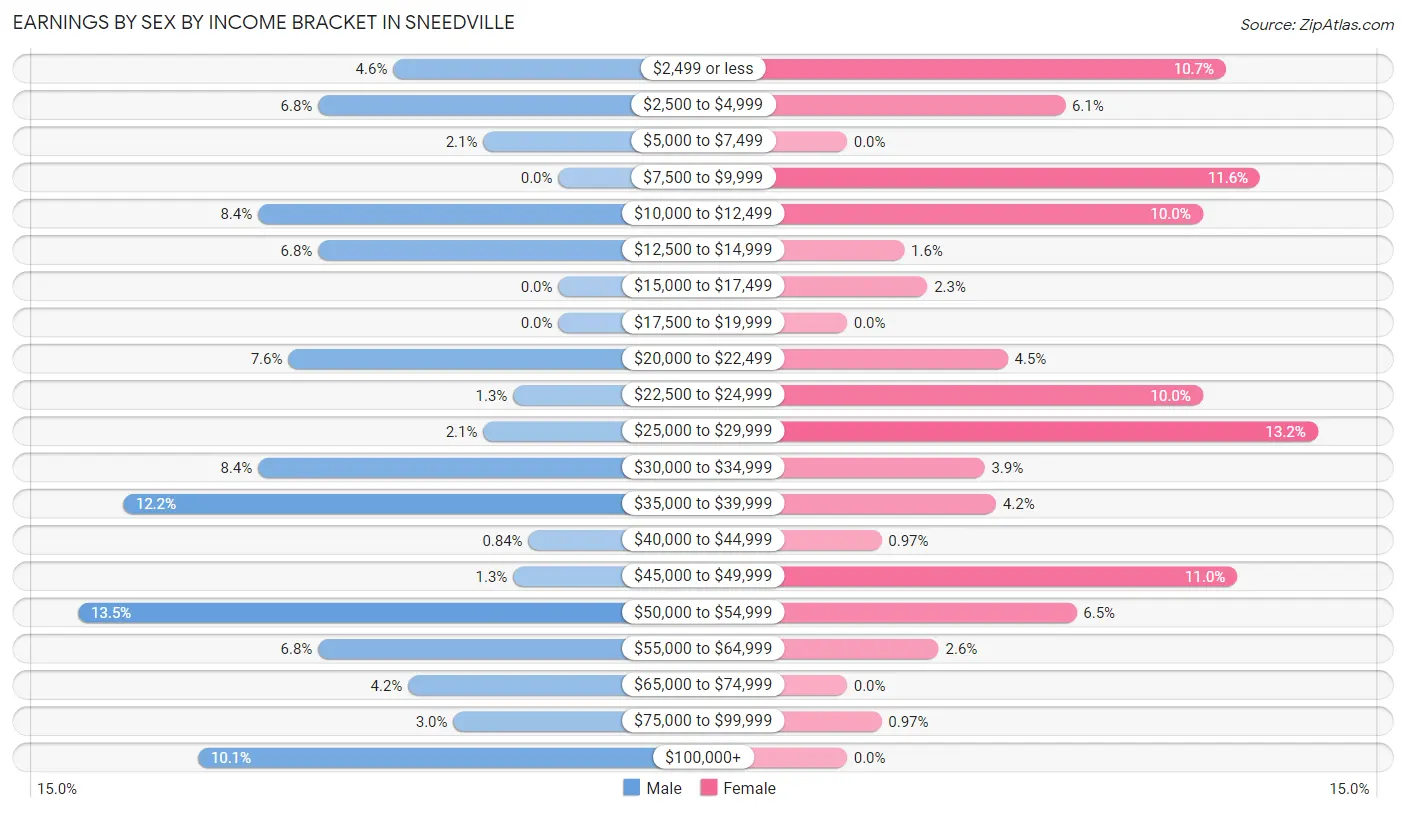
| Income | Male | Female |
| $2,499 or less | 11 (4.6%) | 33 (10.6%) |
| $2,500 to $4,999 | 16 (6.8%) | 19 (6.1%) |
| $5,000 to $7,499 | 5 (2.1%) | 0 (0.0%) |
| $7,500 to $9,999 | 0 (0.0%) | 36 (11.6%) |
| $10,000 to $12,499 | 20 (8.4%) | 31 (10.0%) |
| $12,500 to $14,999 | 16 (6.8%) | 5 (1.6%) |
| $15,000 to $17,499 | 0 (0.0%) | 7 (2.3%) |
| $17,500 to $19,999 | 0 (0.0%) | 0 (0.0%) |
| $20,000 to $22,499 | 18 (7.6%) | 14 (4.5%) |
| $22,500 to $24,999 | 3 (1.3%) | 31 (10.0%) |
| $25,000 to $29,999 | 5 (2.1%) | 41 (13.2%) |
| $30,000 to $34,999 | 20 (8.4%) | 12 (3.9%) |
| $35,000 to $39,999 | 29 (12.2%) | 13 (4.2%) |
| $40,000 to $44,999 | 2 (0.8%) | 3 (1.0%) |
| $45,000 to $49,999 | 3 (1.3%) | 34 (11.0%) |
| $50,000 to $54,999 | 32 (13.5%) | 20 (6.5%) |
| $55,000 to $64,999 | 16 (6.8%) | 8 (2.6%) |
| $65,000 to $74,999 | 10 (4.2%) | 0 (0.0%) |
| $75,000 to $99,999 | 7 (2.9%) | 3 (1.0%) |
| $100,000+ | 24 (10.1%) | 0 (0.0%) |
| Total | 237 (100.0%) | 310 (100.0%) |
Earnings by Sex by Educational Attainment in Sneedville
Average earnings in Sneedville are $38,102 for men and $23,088 for women, a difference of 39.4%. Men with an educational attainment of high school diploma enjoy the highest average annual earnings of $39,219, while those with college or associate's degree education earn the least with $34,125. Women with an educational attainment of graduate degree earn the most with the average annual earnings of $51,429, while those with high school diploma education have the smallest earnings of $10,761.
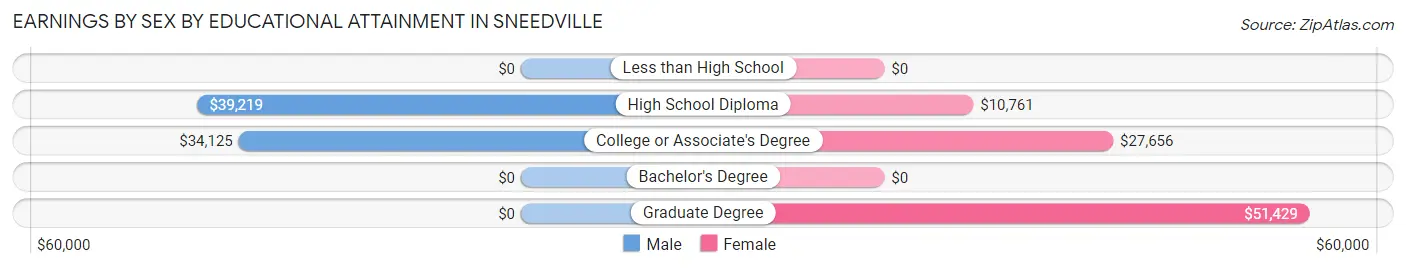
| Educational Attainment | Male Income | Female Income |
| Less than High School | - | - |
| High School Diploma | $39,219 | $10,761 |
| College or Associate's Degree | $34,125 | $27,656 |
| Bachelor's Degree | - | - |
| Graduate Degree | - | - |
| Total | $38,102 | $23,088 |
Family Income in Sneedville
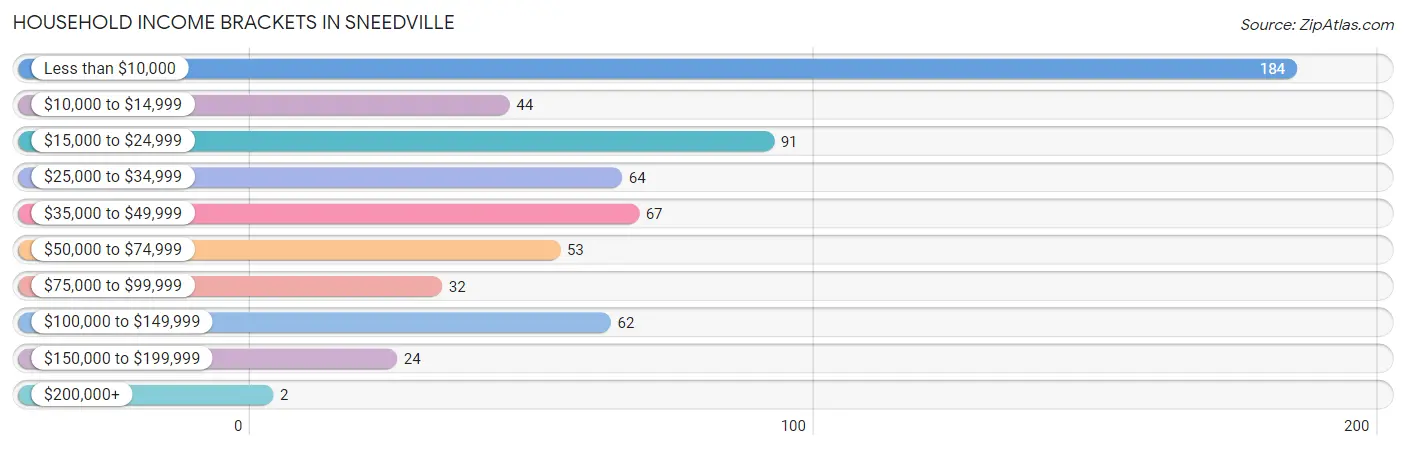
Family Income Brackets in Sneedville
According to the Sneedville family income data, there are 112 families falling into the less than $10,000 income range, which is the most common income bracket and makes up 26.2% of all families. Conversely, the $200,000+ income bracket is the least frequent group with only 2 families (0.5%) belonging to this category.
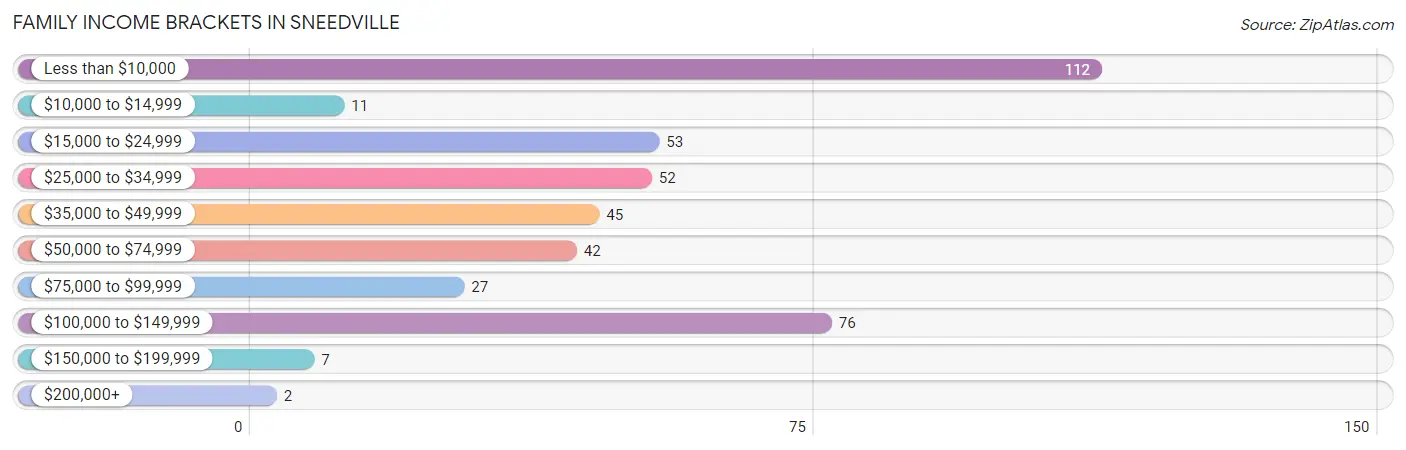
| Income Bracket | # Families | % Families |
| Less than $10,000 | 112 | 26.2% |
| $10,000 to $14,999 | 11 | 2.6% |
| $15,000 to $24,999 | 53 | 12.4% |
| $25,000 to $34,999 | 52 | 12.2% |
| $35,000 to $49,999 | 45 | 10.5% |
| $50,000 to $74,999 | 42 | 9.8% |
| $75,000 to $99,999 | 27 | 6.3% |
| $100,000 to $149,999 | 76 | 17.8% |
| $150,000 to $199,999 | 7 | 1.6% |
| $200,000+ | 2 | 0.5% |
Family Income by Famaliy Size in Sneedville
4-person families (41 | 9.6%) account for the highest median family income in Sneedville with $58,523 per family, while 2-person families (190 | 44.5%) have the highest median income of $21,000 per family member.
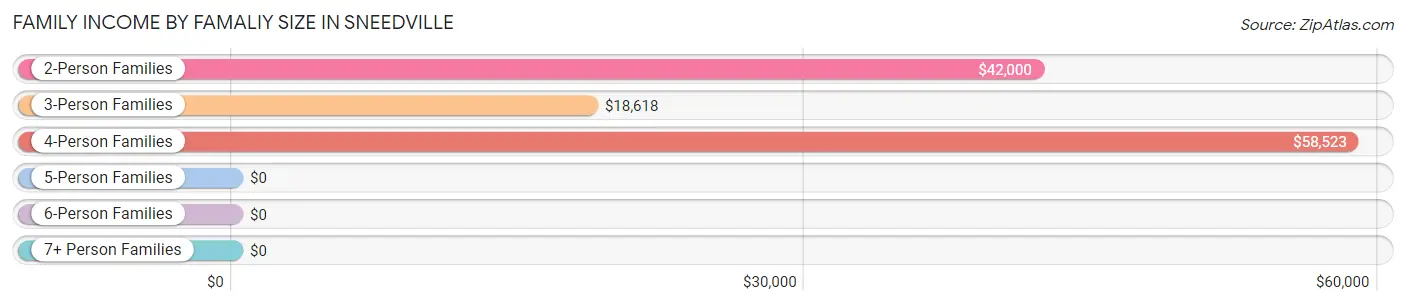
| Income Bracket | # Families | Median Income |
| 2-Person Families | 190 (44.5%) | $42,000 |
| 3-Person Families | 179 (41.9%) | $18,618 |
| 4-Person Families | 41 (9.6%) | $58,523 |
| 5-Person Families | 15 (3.5%) | $0 |
| 6-Person Families | 2 (0.5%) | $0 |
| 7+ Person Families | 0 (0.0%) | $0 |
| Total | 427 (100.0%) | $31,563 |
Family Income by Number of Earners in Sneedville
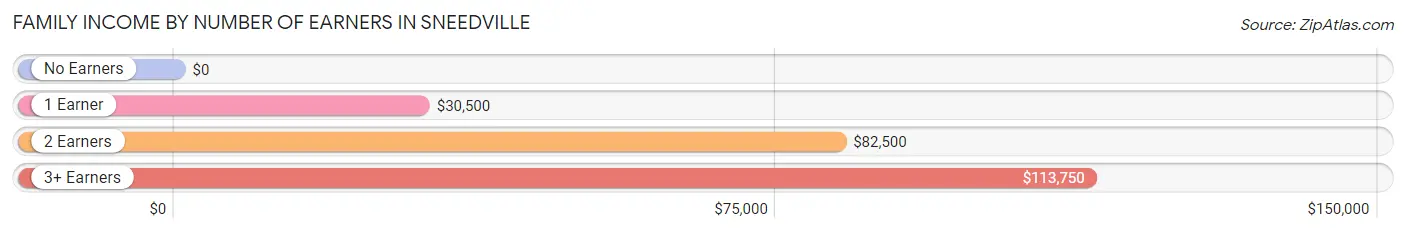
| Number of Earners | # Families | Median Income |
| No Earners | 127 (29.7%) | $0 |
| 1 Earner | 216 (50.6%) | $30,500 |
| 2 Earners | 58 (13.6%) | $82,500 |
| 3+ Earners | 26 (6.1%) | $113,750 |
| Total | 427 (100.0%) | $31,563 |
Household Income in Sneedville
Household Income Brackets in Sneedville
With 184 households falling in the category, the less than $10,000 income range is the most frequent in Sneedville, accounting for 29.5% of all households. In contrast, only 2 households (0.3%) fall into the $200,000+ income bracket, making it the least populous group.
| Income Bracket | # Households | % Households |
| Less than $10,000 | 184 | 29.5% |
| $10,000 to $14,999 | 44 | 7.1% |
| $15,000 to $24,999 | 91 | 14.6% |
| $25,000 to $34,999 | 64 | 10.3% |
| $35,000 to $49,999 | 67 | 10.8% |
| $50,000 to $74,999 | 53 | 8.5% |
| $75,000 to $99,999 | 32 | 5.1% |
| $100,000 to $149,999 | 62 | 10.0% |
| $150,000 to $199,999 | 24 | 3.9% |
| $200,000+ | 2 | 0.3% |
Household Income by Householder Age in Sneedville
The median household income in Sneedville is $23,897, with the highest median household income of $31,250 found in the 65+ years age bracket for the primary householder. A total of 143 households (23.0%) fall into this category. Meanwhile, the 15 to 24 years age bracket for the primary householder has the lowest median household income of $0, with 28 households (4.5%) in this group.
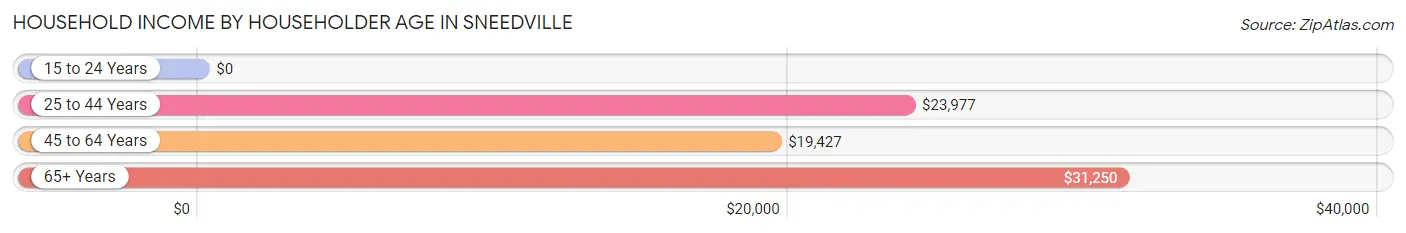
| Income Bracket | # Households | Median Income |
| 15 to 24 Years | 28 (4.5%) | $0 |
| 25 to 44 Years | 189 (30.3%) | $23,977 |
| 45 to 64 Years | 263 (42.2%) | $19,427 |
| 65+ Years | 143 (23.0%) | $31,250 |
| Total | 623 (100.0%) | $23,897 |
Poverty in Sneedville
Income Below Poverty by Sex and Age in Sneedville
With 40.6% poverty level for males and 45.8% for females among the residents of Sneedville, 12 to 14 year old males and 5 year old females are the most vulnerable to poverty, with 21 males (91.3%) and 22 females (100.0%) in their respective age groups living below the poverty level.
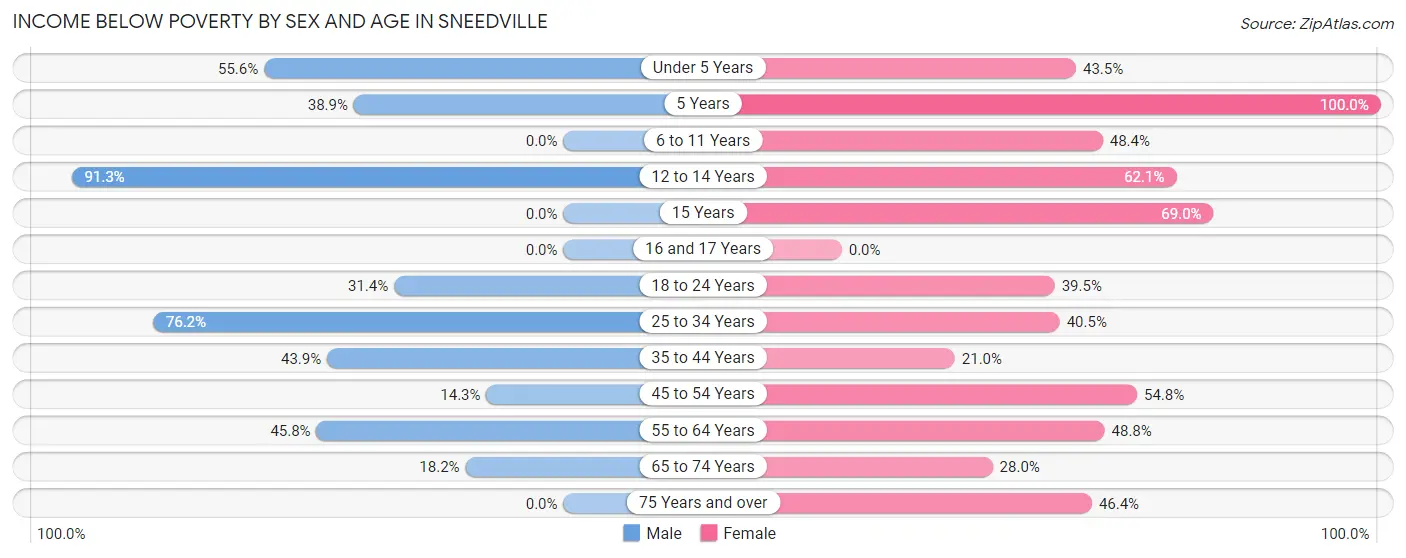
| Age Bracket | Male | Female |
| Under 5 Years | 20 (55.6%) | 10 (43.5%) |
| 5 Years | 7 (38.9%) | 22 (100.0%) |
| 6 to 11 Years | 0 (0.0%) | 31 (48.4%) |
| 12 to 14 Years | 21 (91.3%) | 18 (62.1%) |
| 15 Years | 0 (0.0%) | 20 (69.0%) |
| 16 and 17 Years | 0 (0.0%) | 0 (0.0%) |
| 18 to 24 Years | 22 (31.4%) | 34 (39.5%) |
| 25 to 34 Years | 96 (76.2%) | 36 (40.5%) |
| 35 to 44 Years | 25 (43.9%) | 17 (21.0%) |
| 45 to 54 Years | 10 (14.3%) | 57 (54.8%) |
| 55 to 64 Years | 55 (45.8%) | 80 (48.8%) |
| 65 to 74 Years | 18 (18.2%) | 14 (28.0%) |
| 75 Years and over | 0 (0.0%) | 13 (46.4%) |
| Total | 274 (40.6%) | 352 (45.8%) |
Income Above Poverty by Sex and Age in Sneedville
According to the poverty statistics in Sneedville, males aged 6 to 11 years and females aged 35 to 44 years are the age groups that are most secure financially, with 100.0% of males and 79.0% of females in these age groups living above the poverty line.
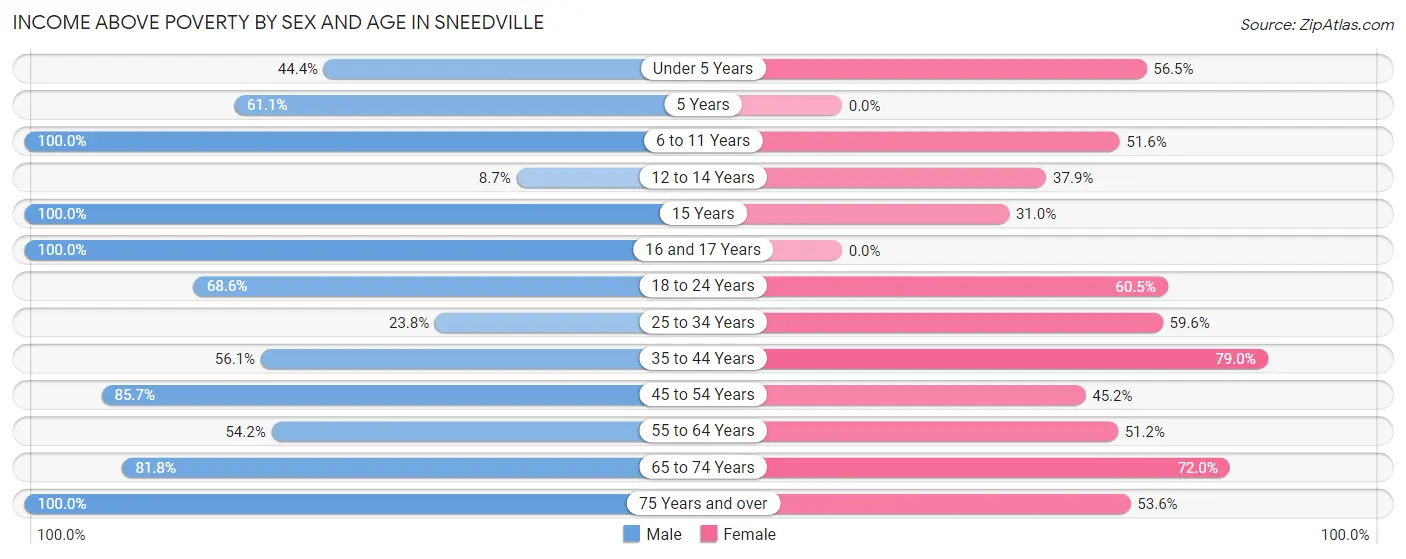
| Age Bracket | Male | Female |
| Under 5 Years | 16 (44.4%) | 13 (56.5%) |
| 5 Years | 11 (61.1%) | 0 (0.0%) |
| 6 to 11 Years | 34 (100.0%) | 33 (51.6%) |
| 12 to 14 Years | 2 (8.7%) | 11 (37.9%) |
| 15 Years | 4 (100.0%) | 9 (31.0%) |
| 16 and 17 Years | 10 (100.0%) | 0 (0.0%) |
| 18 to 24 Years | 48 (68.6%) | 52 (60.5%) |
| 25 to 34 Years | 30 (23.8%) | 53 (59.6%) |
| 35 to 44 Years | 32 (56.1%) | 64 (79.0%) |
| 45 to 54 Years | 60 (85.7%) | 47 (45.2%) |
| 55 to 64 Years | 65 (54.2%) | 84 (51.2%) |
| 65 to 74 Years | 81 (81.8%) | 36 (72.0%) |
| 75 Years and over | 7 (100.0%) | 15 (53.6%) |
| Total | 400 (59.4%) | 417 (54.2%) |
Income Below Poverty Among Married-Couple Families in Sneedville
The poverty statistics for married-couple families in Sneedville show that 16.4% or 34 of the total 208 families live below the poverty line. Families with 1 or 2 children have the highest poverty rate of 27.4%, comprising of 17 families. On the other hand, families with 3 or 4 children have the lowest poverty rate of 0.0%, which includes 0 families.
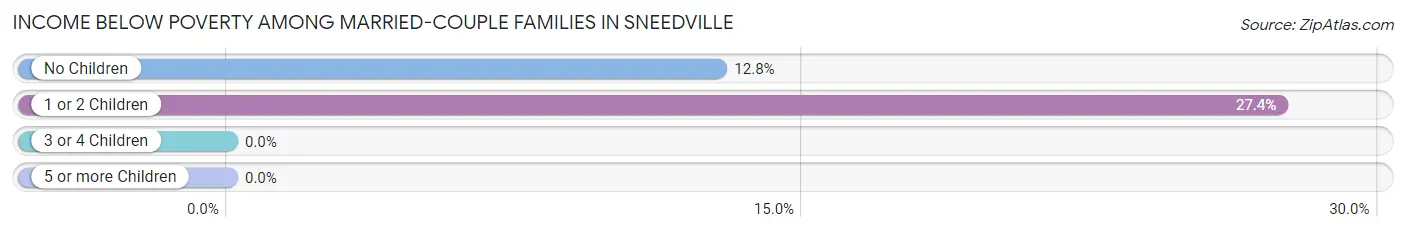
| Children | Above Poverty | Below Poverty |
| No Children | 116 (87.2%) | 17 (12.8%) |
| 1 or 2 Children | 45 (72.6%) | 17 (27.4%) |
| 3 or 4 Children | 13 (100.0%) | 0 (0.0%) |
| 5 or more Children | 0 (0.0%) | 0 (0.0%) |
| Total | 174 (83.7%) | 34 (16.4%) |
Income Below Poverty Among Single-Parent Households in Sneedville
According to the poverty data in Sneedville, 58.0% or 47 single-father households and 71.0% or 98 single-mother households are living below the poverty line. Among single-father households, those with 1 or 2 children have the highest poverty rate, with 47 households (83.9%) experiencing poverty. Likewise, among single-mother households, those with 3 or 4 children have the highest poverty rate, with 11 households (100.0%) falling below the poverty line.
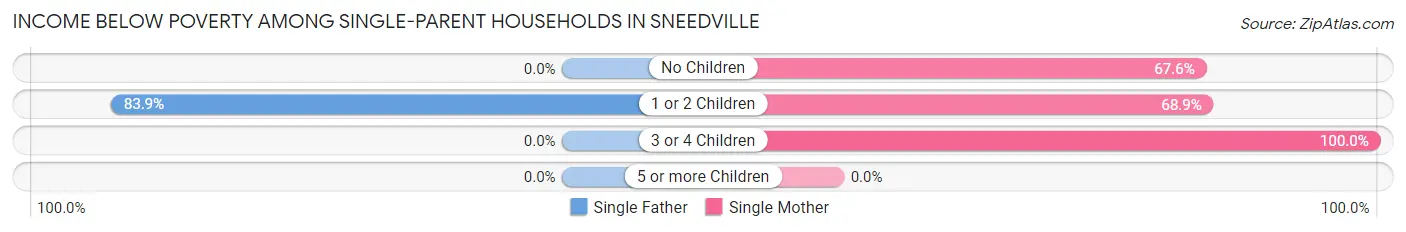
| Children | Single Father | Single Mother |
| No Children | 0 (0.0%) | 25 (67.6%) |
| 1 or 2 Children | 47 (83.9%) | 62 (68.9%) |
| 3 or 4 Children | 0 (0.0%) | 11 (100.0%) |
| 5 or more Children | 0 (0.0%) | 0 (0.0%) |
| Total | 47 (58.0%) | 98 (71.0%) |
Income Below Poverty Among Married-Couple vs Single-Parent Households in Sneedville
The poverty data for Sneedville shows that 34 of the married-couple family households (16.4%) and 145 of the single-parent households (66.2%) are living below the poverty level. Within the married-couple family households, those with 1 or 2 children have the highest poverty rate, with 17 households (27.4%) falling below the poverty line. Among the single-parent households, those with 3 or 4 children have the highest poverty rate, with 11 household (100.0%) living below poverty.
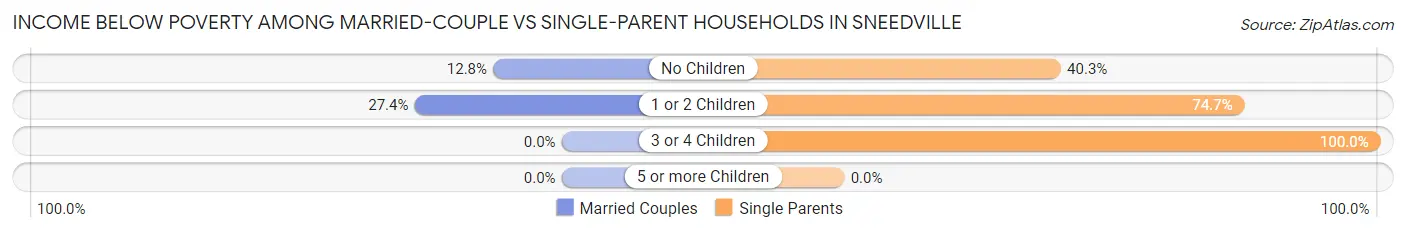
| Children | Married-Couple Families | Single-Parent Households |
| No Children | 17 (12.8%) | 25 (40.3%) |
| 1 or 2 Children | 17 (27.4%) | 109 (74.7%) |
| 3 or 4 Children | 0 (0.0%) | 11 (100.0%) |
| 5 or more Children | 0 (0.0%) | 0 (0.0%) |
| Total | 34 (16.4%) | 145 (66.2%) |
Employment Characteristics in Sneedville
Employment by Class of Employer in Sneedville
Among the 408 employed individuals in Sneedville, private company employees (302 | 74.0%), local government employees (73 | 17.9%), and self-employed (not incorporated) (12 | 2.9%) make up the most common classes of employment.
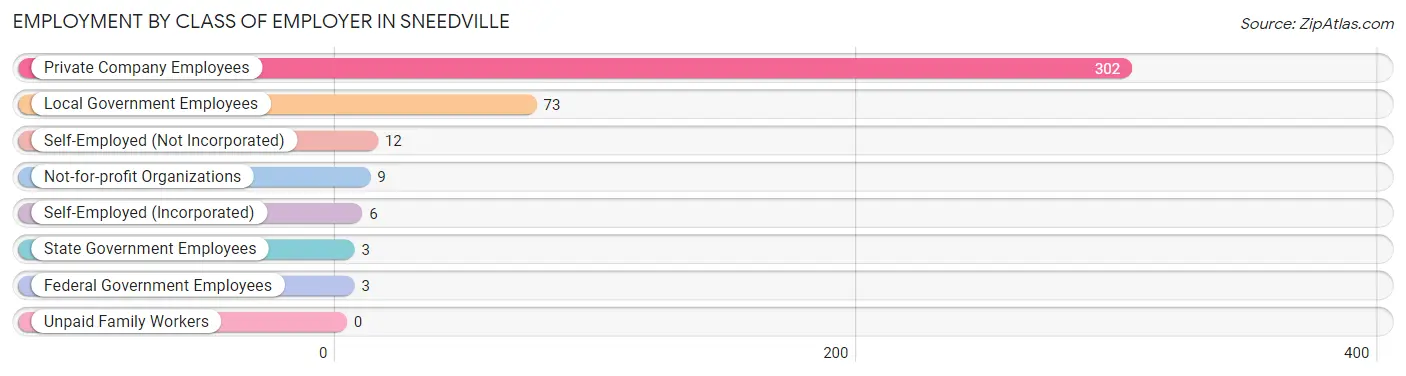
| Employer Class | # Employees | % Employees |
| Private Company Employees | 302 | 74.0% |
| Self-Employed (Incorporated) | 6 | 1.5% |
| Self-Employed (Not Incorporated) | 12 | 2.9% |
| Not-for-profit Organizations | 9 | 2.2% |
| Local Government Employees | 73 | 17.9% |
| State Government Employees | 3 | 0.7% |
| Federal Government Employees | 3 | 0.7% |
| Unpaid Family Workers | 0 | 0.0% |
| Total | 408 | 100.0% |
Employment Status by Age in Sneedville
According to the labor force statistics for Sneedville, out of the total population over 16 years of age (1,307), 38.3% or 501 individuals are in the labor force, with 13.6% or 68 of them unemployed. The age group with the highest labor force participation rate is 45 to 54 years, with 64.1% or 118 individuals in the labor force. Within the labor force, the 30 to 34 years age range has the highest percentage of unemployed individuals, with 42.9% or 6 of them being unemployed.
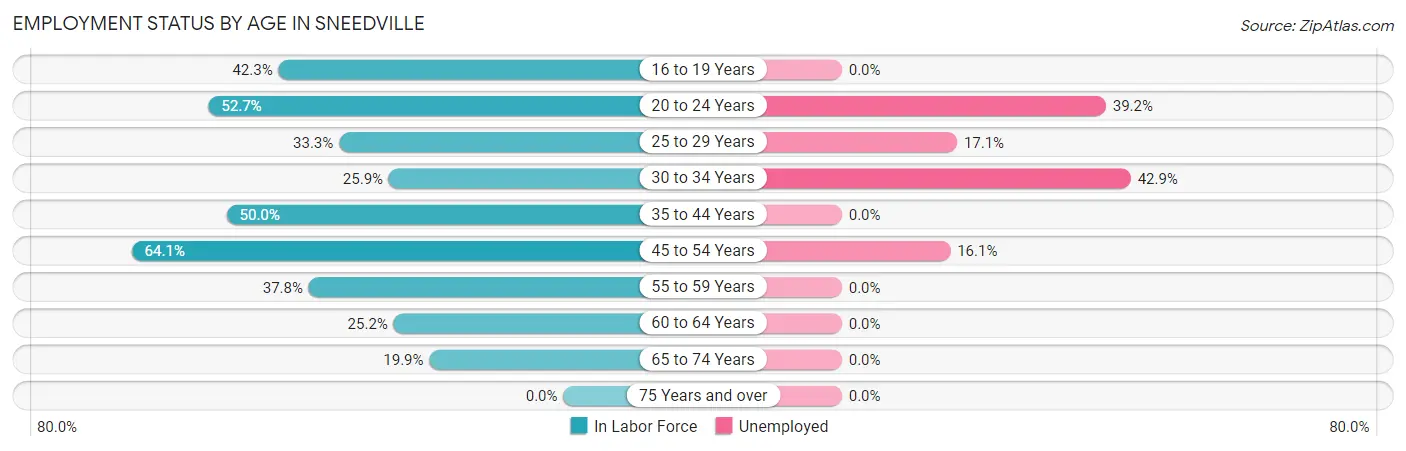
| Age Bracket | In Labor Force | Unemployed |
| 16 to 19 Years | 11 (42.3%) | 0 (0.0%) |
| 20 to 24 Years | 79 (52.7%) | 31 (39.2%) |
| 25 to 29 Years | 70 (33.3%) | 12 (17.1%) |
| 30 to 34 Years | 14 (25.9%) | 6 (42.9%) |
| 35 to 44 Years | 87 (50.0%) | 0 (0.0%) |
| 45 to 54 Years | 118 (64.1%) | 19 (16.1%) |
| 55 to 59 Years | 56 (37.8%) | 0 (0.0%) |
| 60 to 64 Years | 36 (25.2%) | 0 (0.0%) |
| 65 to 74 Years | 30 (19.9%) | 0 (0.0%) |
| 75 Years and over | 0 (0.0%) | 0 (0.0%) |
| Total | 501 (38.3%) | 68 (13.6%) |
Employment Status by Educational Attainment in Sneedville
According to labor force statistics for Sneedville, 41.7% of individuals (381) out of the total population between 25 and 64 years of age (913) are in the labor force, with 9.7% or 37 of them being unemployed. The group with the highest labor force participation rate are those with the educational attainment of college / associate degree, with 49.7% or 161 individuals in the labor force. Within the labor force, individuals with high school diploma education have the highest percentage of unemployment, with 15.0% or 25 of them being unemployed.
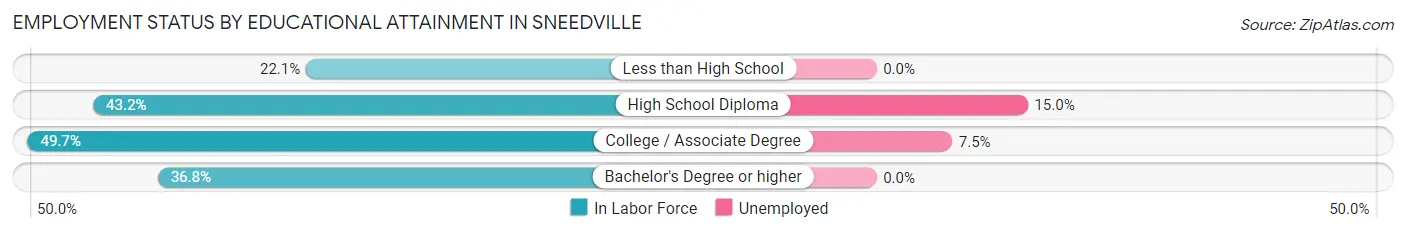
| Educational Attainment | In Labor Force | Unemployed |
| Less than High School | 32 (22.1%) | 0 (0.0%) |
| High School Diploma | 167 (43.2%) | 58 (15.0%) |
| College / Associate Degree | 161 (49.7%) | 24 (7.5%) |
| Bachelor's Degree or higher | 21 (36.8%) | 0 (0.0%) |
| Total | 381 (41.7%) | 89 (9.7%) |
Employment Occupations by Sex in Sneedville
Management, Business, Science and Arts Occupations
The most common Management, Business, Science and Arts occupations in Sneedville are Community & Social Service (56 | 12.9%), Education Instruction & Library (27 | 6.2%), Management (25 | 5.8%), Arts, Media & Entertainment (24 | 5.5%), and Health Diagnosing & Treating (9 | 2.1%).
Management, Business, Science and Arts Occupations by Sex
Within the Management, Business, Science and Arts occupations in Sneedville, the most male-oriented occupations are Management (52.0%), Education, Arts & Media (40.0%), and Community & Social Service (3.6%), while the most female-oriented occupations are Education Instruction & Library (100.0%), Arts, Media & Entertainment (100.0%), and Health Diagnosing & Treating (100.0%).
| Occupation | Male | Female |
| Management | 13 (52.0%) | 12 (48.0%) |
| Business & Financial | 0 (0.0%) | 0 (0.0%) |
| Computers, Engineering & Science | 0 (0.0%) | 0 (0.0%) |
| Computers & Mathematics | 0 (0.0%) | 0 (0.0%) |
| Architecture & Engineering | 0 (0.0%) | 0 (0.0%) |
| Life, Physical & Social Science | 0 (0.0%) | 0 (0.0%) |
| Community & Social Service | 2 (3.6%) | 54 (96.4%) |
| Education, Arts & Media | 2 (40.0%) | 3 (60.0%) |
| Legal Services & Support | 0 (0.0%) | 0 (0.0%) |
| Education Instruction & Library | 0 (0.0%) | 27 (100.0%) |
| Arts, Media & Entertainment | 0 (0.0%) | 24 (100.0%) |
| Health Diagnosing & Treating | 0 (0.0%) | 9 (100.0%) |
| Health Technologists | 0 (0.0%) | 6 (100.0%) |
| Total (Category) | 15 (16.7%) | 75 (83.3%) |
| Total (Overall) | 182 (42.0%) | 251 (58.0%) |
Services Occupations
The most common Services occupations in Sneedville are Personal Care & Service (22 | 5.1%), Security & Protection (21 | 4.9%), Food Preparation & Serving (20 | 4.6%), Cleaning & Maintenance (18 | 4.2%), and Healthcare Support (17 | 3.9%).
Services Occupations by Sex
Within the Services occupations in Sneedville, the most male-oriented occupations are Law Enforcement (100.0%), Cleaning & Maintenance (100.0%), and Personal Care & Service (100.0%), while the most female-oriented occupations are Healthcare Support (100.0%), Firefighting & Prevention (100.0%), and Food Preparation & Serving (85.0%).
| Occupation | Male | Female |
| Healthcare Support | 0 (0.0%) | 17 (100.0%) |
| Security & Protection | 10 (47.6%) | 11 (52.4%) |
| Firefighting & Prevention | 0 (0.0%) | 11 (100.0%) |
| Law Enforcement | 10 (100.0%) | 0 (0.0%) |
| Food Preparation & Serving | 3 (15.0%) | 17 (85.0%) |
| Cleaning & Maintenance | 18 (100.0%) | 0 (0.0%) |
| Personal Care & Service | 22 (100.0%) | 0 (0.0%) |
| Total (Category) | 53 (54.1%) | 45 (45.9%) |
| Total (Overall) | 182 (42.0%) | 251 (58.0%) |
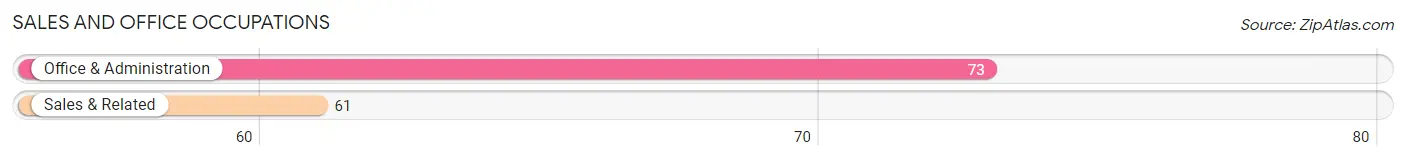
Sales and Office Occupations
The most common Sales and Office occupations in Sneedville are Office & Administration (73 | 16.9%), and Sales & Related (61 | 14.1%).
Sales and Office Occupations by Sex
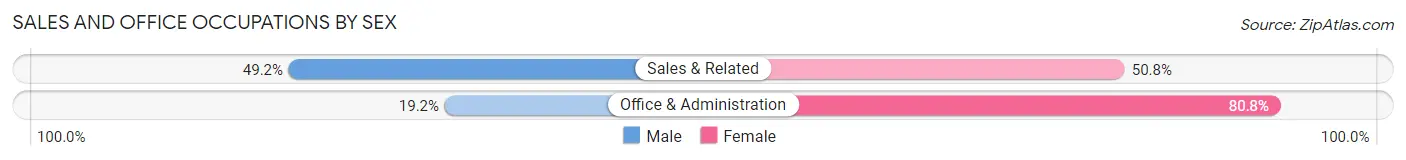
| Occupation | Male | Female |
| Sales & Related | 30 (49.2%) | 31 (50.8%) |
| Office & Administration | 14 (19.2%) | 59 (80.8%) |
| Total (Category) | 44 (32.8%) | 90 (67.2%) |
| Total (Overall) | 182 (42.0%) | 251 (58.0%) |
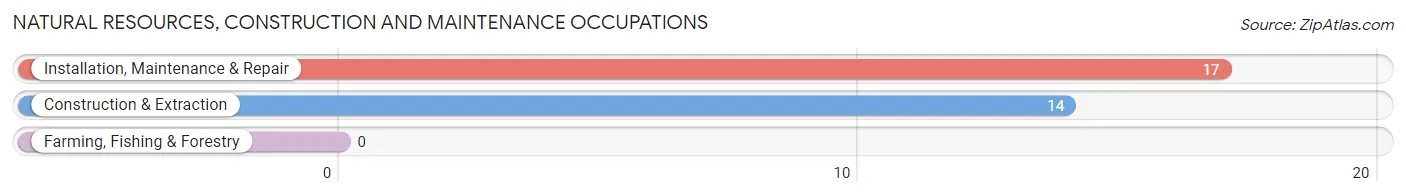
Natural Resources, Construction and Maintenance Occupations
The most common Natural Resources, Construction and Maintenance occupations in Sneedville are Installation, Maintenance & Repair (17 | 3.9%), and Construction & Extraction (14 | 3.2%).
Natural Resources, Construction and Maintenance Occupations by Sex
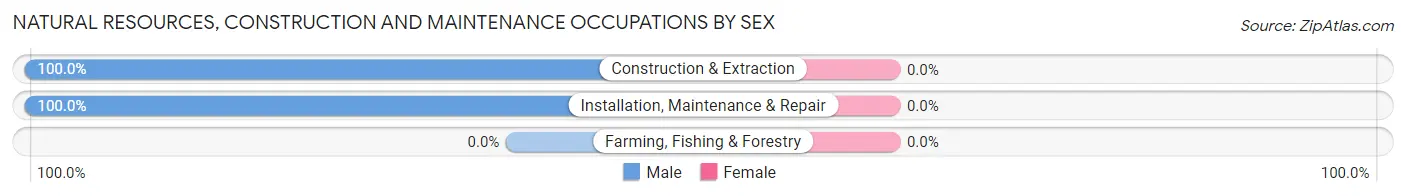
| Occupation | Male | Female |
| Farming, Fishing & Forestry | 0 (0.0%) | 0 (0.0%) |
| Construction & Extraction | 14 (100.0%) | 0 (0.0%) |
| Installation, Maintenance & Repair | 17 (100.0%) | 0 (0.0%) |
| Total (Category) | 31 (100.0%) | 0 (0.0%) |
| Total (Overall) | 182 (42.0%) | 251 (58.0%) |
Production, Transportation and Moving Occupations
The most common Production, Transportation and Moving occupations in Sneedville are Production (52 | 12.0%), Transportation (25 | 5.8%), and Material Moving (3 | 0.7%).
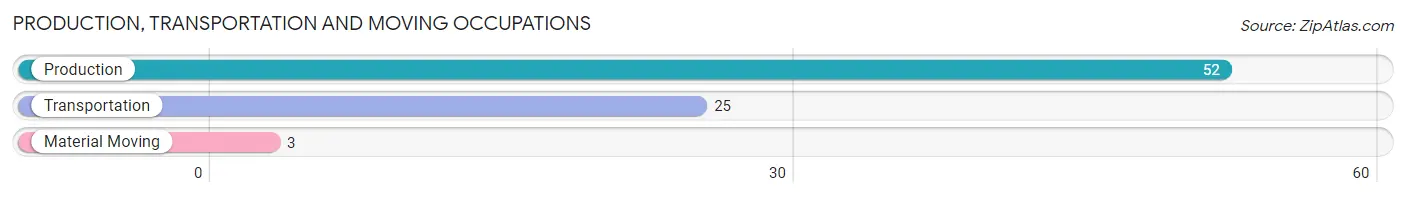
Production, Transportation and Moving Occupations by Sex
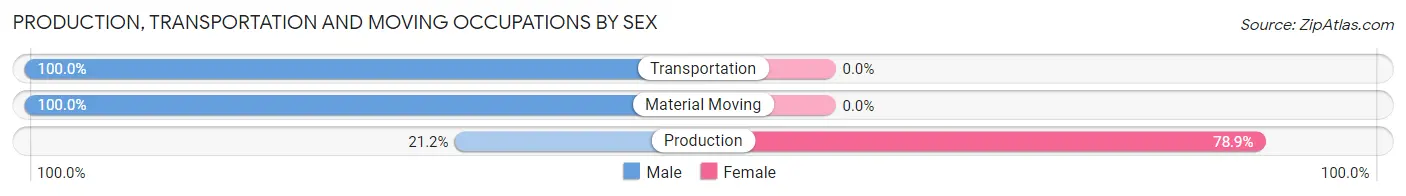
| Occupation | Male | Female |
| Production | 11 (21.1%) | 41 (78.8%) |
| Transportation | 25 (100.0%) | 0 (0.0%) |
| Material Moving | 3 (100.0%) | 0 (0.0%) |
| Total (Category) | 39 (48.7%) | 41 (51.2%) |
| Total (Overall) | 182 (42.0%) | 251 (58.0%) |
Employment Industries by Sex in Sneedville
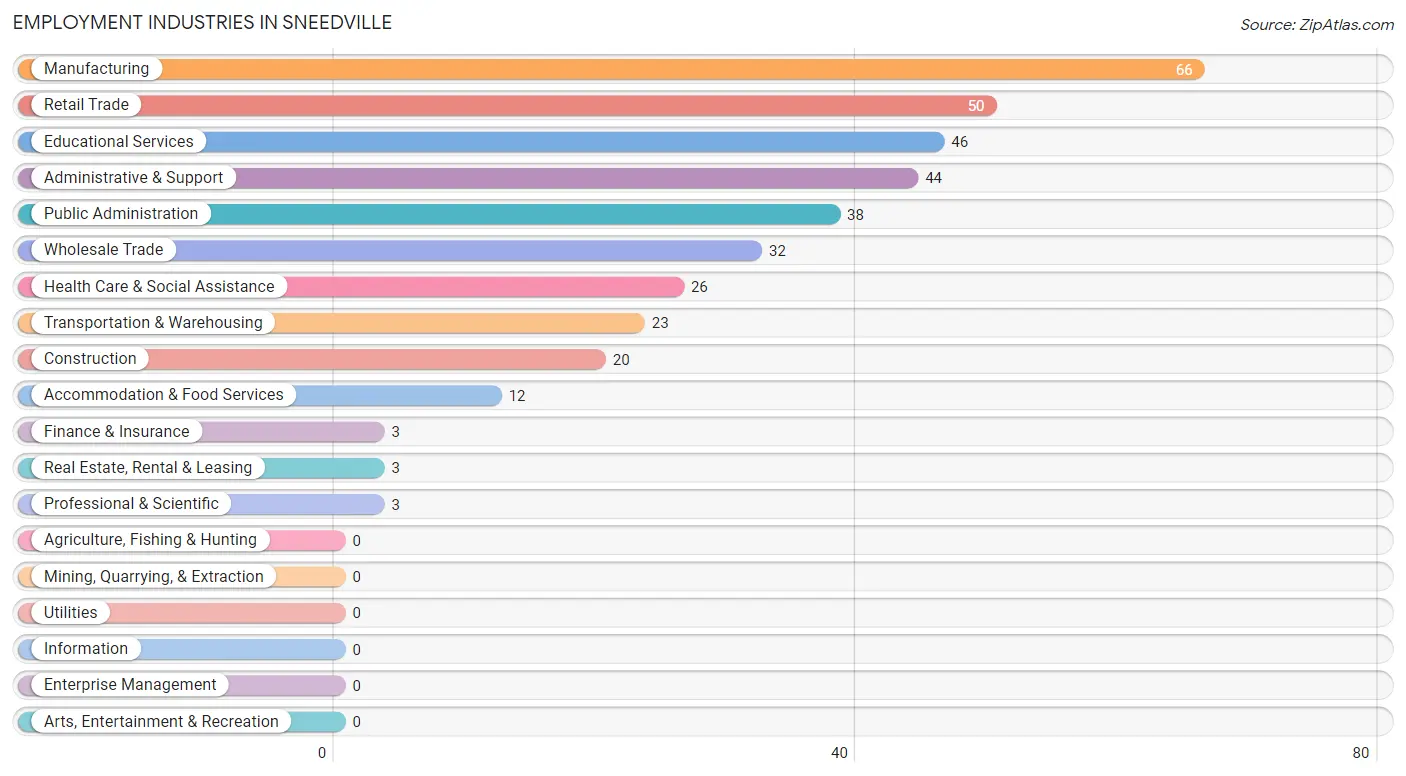
Employment Industries in Sneedville
The major employment industries in Sneedville include Manufacturing (66 | 15.2%), Retail Trade (50 | 11.6%), Educational Services (46 | 10.6%), Administrative & Support (44 | 10.2%), and Public Administration (38 | 8.8%).
Employment Industries by Sex in Sneedville
The Sneedville industries that see more men than women are Construction (100.0%), Professional & Scientific (100.0%), and Transportation & Warehousing (87.0%), whereas the industries that tend to have a higher number of women are Finance & Insurance (100.0%), Real Estate, Rental & Leasing (100.0%), and Educational Services (100.0%).
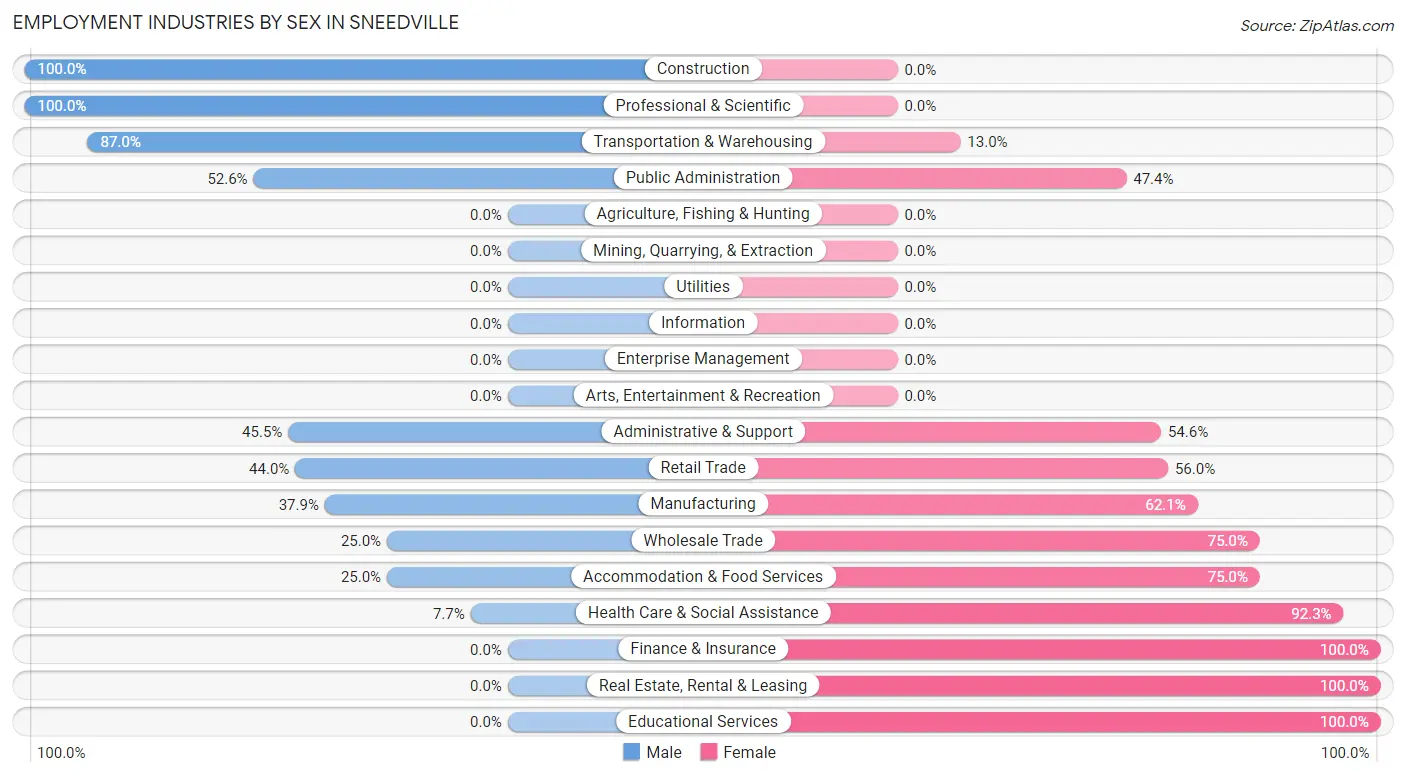
| Industry | Male | Female |
| Agriculture, Fishing & Hunting | 0 (0.0%) | 0 (0.0%) |
| Mining, Quarrying, & Extraction | 0 (0.0%) | 0 (0.0%) |
| Construction | 20 (100.0%) | 0 (0.0%) |
| Manufacturing | 25 (37.9%) | 41 (62.1%) |
| Wholesale Trade | 8 (25.0%) | 24 (75.0%) |
| Retail Trade | 22 (44.0%) | 28 (56.0%) |
| Transportation & Warehousing | 20 (87.0%) | 3 (13.0%) |
| Utilities | 0 (0.0%) | 0 (0.0%) |
| Information | 0 (0.0%) | 0 (0.0%) |
| Finance & Insurance | 0 (0.0%) | 3 (100.0%) |
| Real Estate, Rental & Leasing | 0 (0.0%) | 3 (100.0%) |
| Professional & Scientific | 3 (100.0%) | 0 (0.0%) |
| Enterprise Management | 0 (0.0%) | 0 (0.0%) |
| Administrative & Support | 20 (45.5%) | 24 (54.5%) |
| Educational Services | 0 (0.0%) | 46 (100.0%) |
| Health Care & Social Assistance | 2 (7.7%) | 24 (92.3%) |
| Arts, Entertainment & Recreation | 0 (0.0%) | 0 (0.0%) |
| Accommodation & Food Services | 3 (25.0%) | 9 (75.0%) |
| Public Administration | 20 (52.6%) | 18 (47.4%) |
| Total | 182 (42.0%) | 251 (58.0%) |
Education in Sneedville
School Enrollment in Sneedville
The most common levels of schooling among the 296 students in Sneedville are high school (70 | 23.6%), college / undergraduate (69 | 23.3%), and elementary school (60 | 20.3%).
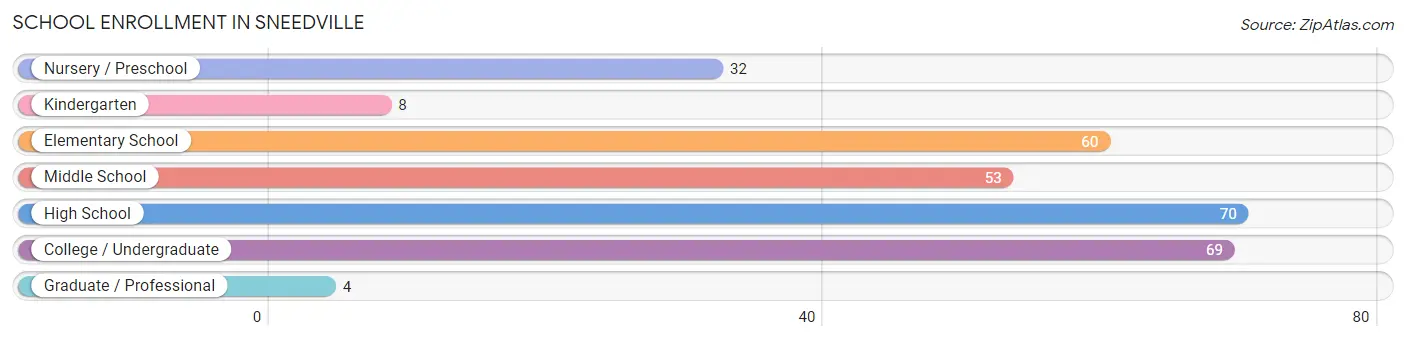
| School Level | # Students | % Students |
| Nursery / Preschool | 32 | 10.8% |
| Kindergarten | 8 | 2.7% |
| Elementary School | 60 | 20.3% |
| Middle School | 53 | 17.9% |
| High School | 70 | 23.6% |
| College / Undergraduate | 69 | 23.3% |
| Graduate / Professional | 4 | 1.3% |
| Total | 296 | 100.0% |
School Enrollment by Age by Funding Source in Sneedville
Out of a total of 296 students who are enrolled in schools in Sneedville, 7 (2.4%) attend a private institution, while the remaining 289 (97.6%) are enrolled in public schools. The age group of 18 to 19 year olds has the highest likelihood of being enrolled in private schools, with 3 (21.4% in the age bracket) enrolled. Conversely, the age group of 3 to 4 year olds has the lowest likelihood of being enrolled in a private school, with 5 (100.0% in the age bracket) attending a public institution.
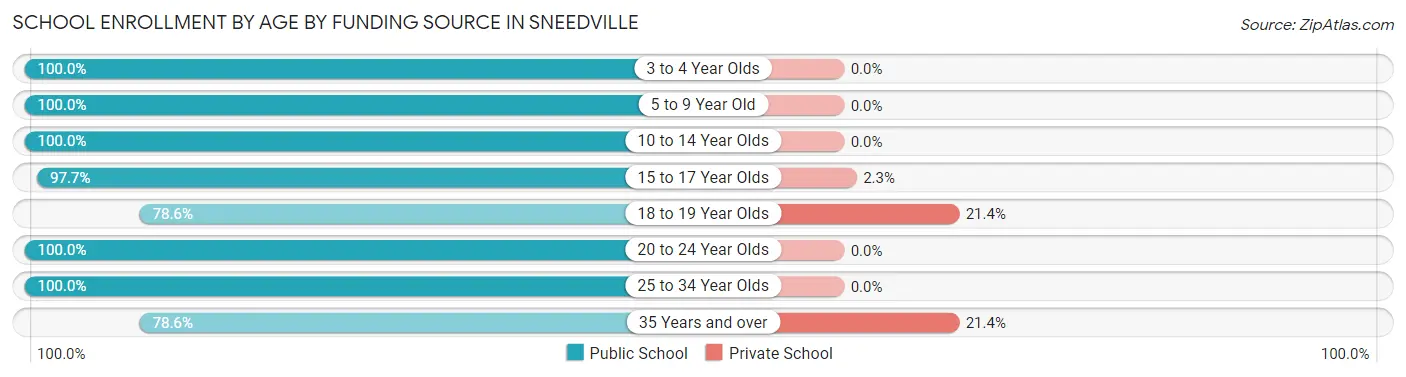
| Age Bracket | Public School | Private School |
| 3 to 4 Year Olds | 5 (100.0%) | 0 (0.0%) |
| 5 to 9 Year Old | 88 (100.0%) | 0 (0.0%) |
| 10 to 14 Year Olds | 77 (100.0%) | 0 (0.0%) |
| 15 to 17 Year Olds | 42 (97.7%) | 1 (2.3%) |
| 18 to 19 Year Olds | 11 (78.6%) | 3 (21.4%) |
| 20 to 24 Year Olds | 4 (100.0%) | 0 (0.0%) |
| 25 to 34 Year Olds | 51 (100.0%) | 0 (0.0%) |
| 35 Years and over | 11 (78.6%) | 3 (21.4%) |
| Total | 289 (97.6%) | 7 (2.4%) |
Educational Attainment by Field of Study in Sneedville
Business (28 | 36.8%), education (26 | 34.2%), arts & humanities (7 | 9.2%), psychology (5 | 6.6%), and literature & languages (5 | 6.6%) are the most common fields of study among 76 individuals in Sneedville who have obtained a bachelor's degree or higher.
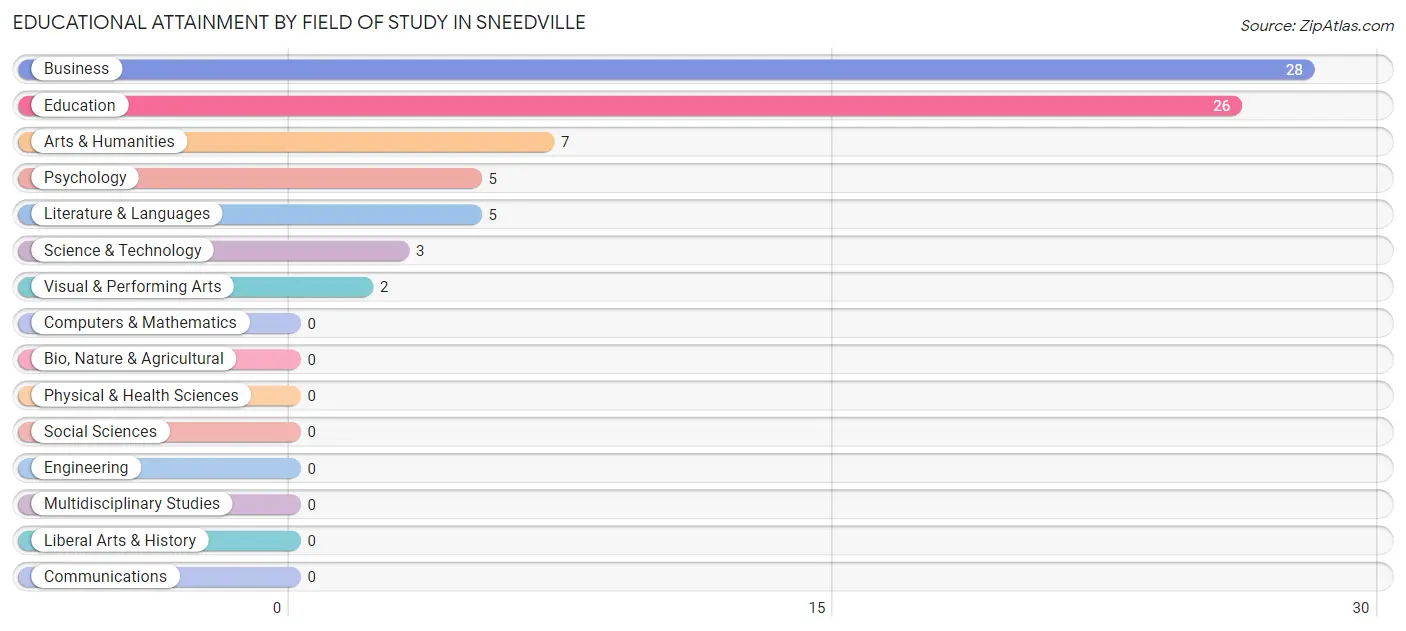
| Field of Study | # Graduates | % Graduates |
| Computers & Mathematics | 0 | 0.0% |
| Bio, Nature & Agricultural | 0 | 0.0% |
| Physical & Health Sciences | 0 | 0.0% |
| Psychology | 5 | 6.6% |
| Social Sciences | 0 | 0.0% |
| Engineering | 0 | 0.0% |
| Multidisciplinary Studies | 0 | 0.0% |
| Science & Technology | 3 | 4.0% |
| Business | 28 | 36.8% |
| Education | 26 | 34.2% |
| Literature & Languages | 5 | 6.6% |
| Liberal Arts & History | 0 | 0.0% |
| Visual & Performing Arts | 2 | 2.6% |
| Communications | 0 | 0.0% |
| Arts & Humanities | 7 | 9.2% |
| Total | 76 | 100.0% |
Transportation & Commute in Sneedville
Vehicle Availability by Sex in Sneedville
The most prevalent vehicle ownership categories in Sneedville are males with 2 vehicles (61, accounting for 37.2%) and females with 2 vehicles (118, making up 25.0%).
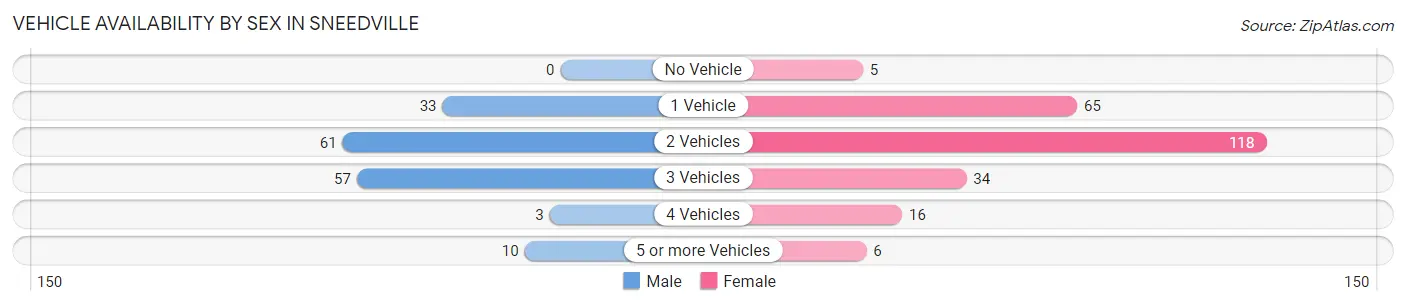
| Vehicles Available | Male | Female |
| No Vehicle | 0 (0.0%) | 5 (2.1%) |
| 1 Vehicle | 33 (20.1%) | 65 (26.6%) |
| 2 Vehicles | 61 (37.2%) | 118 (48.4%) |
| 3 Vehicles | 57 (34.8%) | 34 (13.9%) |
| 4 Vehicles | 3 (1.8%) | 16 (6.6%) |
| 5 or more Vehicles | 10 (6.1%) | 6 (2.5%) |
| Total | 164 (100.0%) | 244 (100.0%) |
Commute Time in Sneedville
The most frequently occuring commute durations in Sneedville are less than 5 minutes (105 commuters, 26.5%), 5 to 9 minutes (89 commuters, 22.4%), and 60 to 89 minutes (57 commuters, 14.4%).
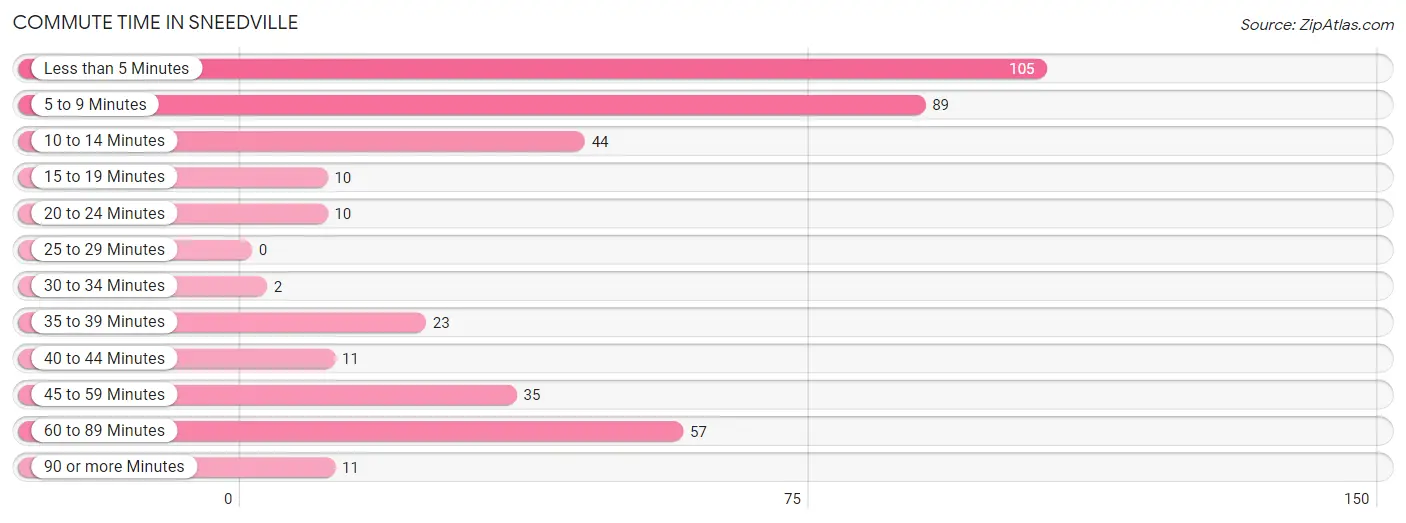
| Commute Time | # Commuters | % Commuters |
| Less than 5 Minutes | 105 | 26.5% |
| 5 to 9 Minutes | 89 | 22.4% |
| 10 to 14 Minutes | 44 | 11.1% |
| 15 to 19 Minutes | 10 | 2.5% |
| 20 to 24 Minutes | 10 | 2.5% |
| 25 to 29 Minutes | 0 | 0.0% |
| 30 to 34 Minutes | 2 | 0.5% |
| 35 to 39 Minutes | 23 | 5.8% |
| 40 to 44 Minutes | 11 | 2.8% |
| 45 to 59 Minutes | 35 | 8.8% |
| 60 to 89 Minutes | 57 | 14.4% |
| 90 or more Minutes | 11 | 2.8% |
Commute Time by Sex in Sneedville
The most common commute times in Sneedville are 5 to 9 minutes (41 commuters, 25.0%) for males and less than 5 minutes (79 commuters, 33.9%) for females.
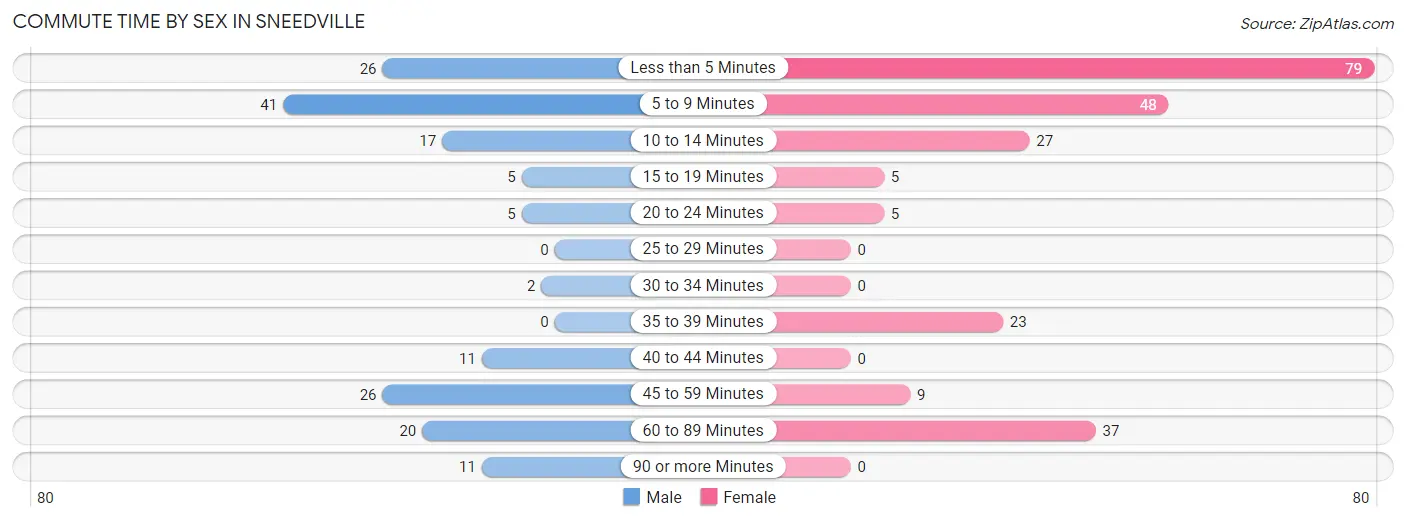
| Commute Time | Male | Female |
| Less than 5 Minutes | 26 (15.9%) | 79 (33.9%) |
| 5 to 9 Minutes | 41 (25.0%) | 48 (20.6%) |
| 10 to 14 Minutes | 17 (10.4%) | 27 (11.6%) |
| 15 to 19 Minutes | 5 (3.0%) | 5 (2.1%) |
| 20 to 24 Minutes | 5 (3.0%) | 5 (2.1%) |
| 25 to 29 Minutes | 0 (0.0%) | 0 (0.0%) |
| 30 to 34 Minutes | 2 (1.2%) | 0 (0.0%) |
| 35 to 39 Minutes | 0 (0.0%) | 23 (9.9%) |
| 40 to 44 Minutes | 11 (6.7%) | 0 (0.0%) |
| 45 to 59 Minutes | 26 (15.9%) | 9 (3.9%) |
| 60 to 89 Minutes | 20 (12.2%) | 37 (15.9%) |
| 90 or more Minutes | 11 (6.7%) | 0 (0.0%) |
Time of Departure to Work by Sex in Sneedville
The most frequent times of departure to work in Sneedville are 9:00 AM to 9:59 AM (37, 22.6%) for males and 8:00 AM to 8:29 AM (63, 27.0%) for females.
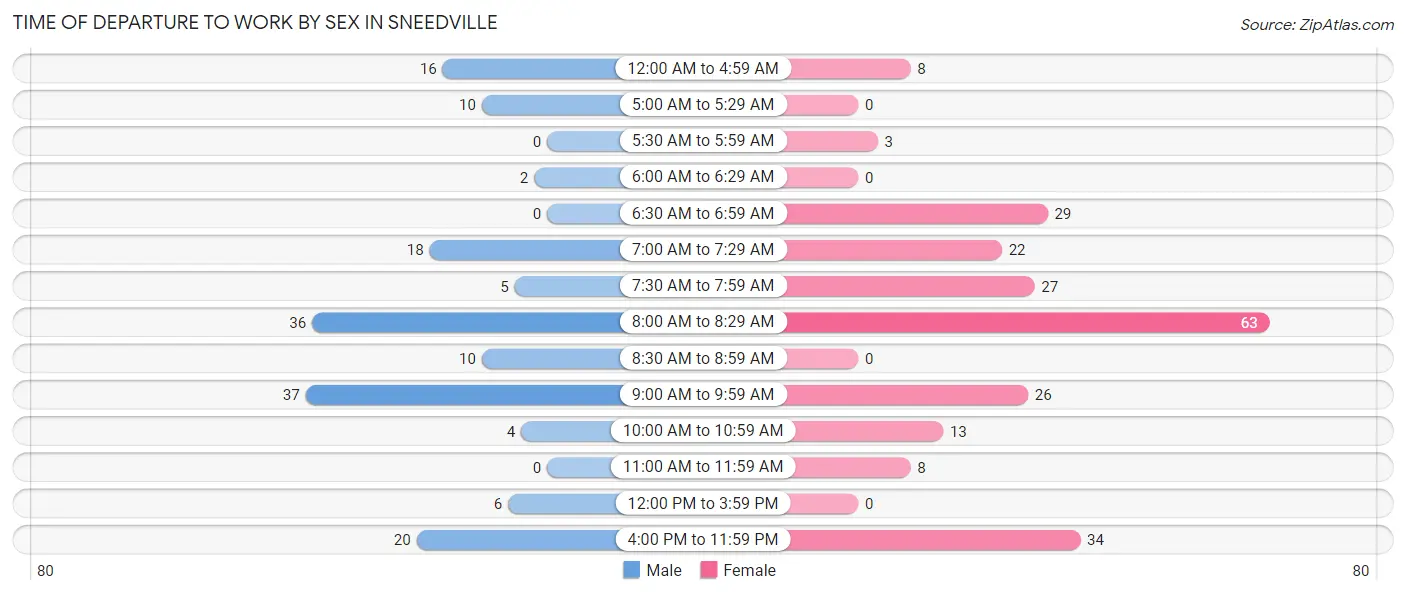
| Time of Departure | Male | Female |
| 12:00 AM to 4:59 AM | 16 (9.8%) | 8 (3.4%) |
| 5:00 AM to 5:29 AM | 10 (6.1%) | 0 (0.0%) |
| 5:30 AM to 5:59 AM | 0 (0.0%) | 3 (1.3%) |
| 6:00 AM to 6:29 AM | 2 (1.2%) | 0 (0.0%) |
| 6:30 AM to 6:59 AM | 0 (0.0%) | 29 (12.4%) |
| 7:00 AM to 7:29 AM | 18 (11.0%) | 22 (9.4%) |
| 7:30 AM to 7:59 AM | 5 (3.0%) | 27 (11.6%) |
| 8:00 AM to 8:29 AM | 36 (22.0%) | 63 (27.0%) |
| 8:30 AM to 8:59 AM | 10 (6.1%) | 0 (0.0%) |
| 9:00 AM to 9:59 AM | 37 (22.6%) | 26 (11.2%) |
| 10:00 AM to 10:59 AM | 4 (2.4%) | 13 (5.6%) |
| 11:00 AM to 11:59 AM | 0 (0.0%) | 8 (3.4%) |
| 12:00 PM to 3:59 PM | 6 (3.7%) | 0 (0.0%) |
| 4:00 PM to 11:59 PM | 20 (12.2%) | 34 (14.6%) |
| Total | 164 (100.0%) | 233 (100.0%) |
Housing Occupancy in Sneedville
Occupancy by Ownership in Sneedville
Of the total 623 dwellings in Sneedville, owner-occupied units account for 301 (48.3%), while renter-occupied units make up 322 (51.7%).
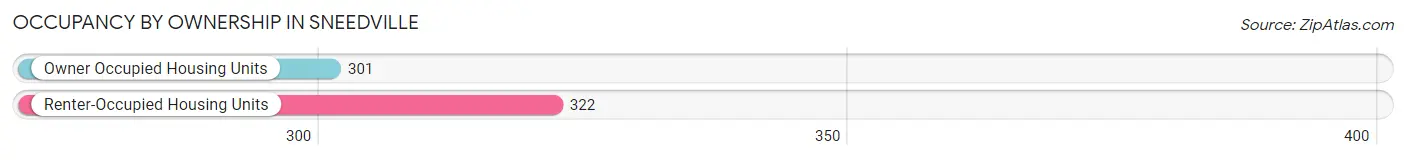
| Occupancy | # Housing Units | % Housing Units |
| Owner Occupied Housing Units | 301 | 48.3% |
| Renter-Occupied Housing Units | 322 | 51.7% |
| Total Occupied Housing Units | 623 | 100.0% |
Occupancy by Household Size in Sneedville
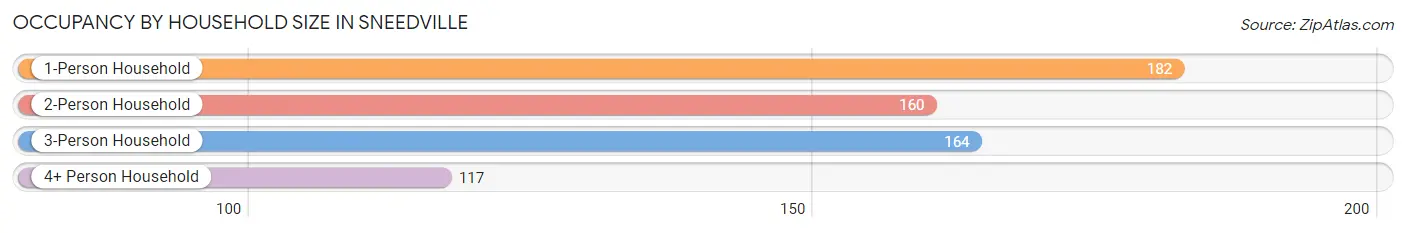
| Household Size | # Housing Units | % Housing Units |
| 1-Person Household | 182 | 29.2% |
| 2-Person Household | 160 | 25.7% |
| 3-Person Household | 164 | 26.3% |
| 4+ Person Household | 117 | 18.8% |
| Total Housing Units | 623 | 100.0% |
Occupancy by Ownership by Household Size in Sneedville
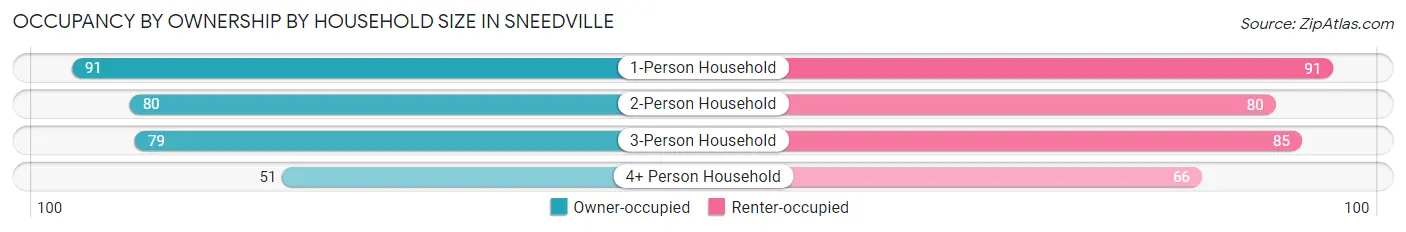
| Household Size | Owner-occupied | Renter-occupied |
| 1-Person Household | 91 (50.0%) | 91 (50.0%) |
| 2-Person Household | 80 (50.0%) | 80 (50.0%) |
| 3-Person Household | 79 (48.2%) | 85 (51.8%) |
| 4+ Person Household | 51 (43.6%) | 66 (56.4%) |
| Total Housing Units | 301 (48.3%) | 322 (51.7%) |
Occupancy by Educational Attainment in Sneedville
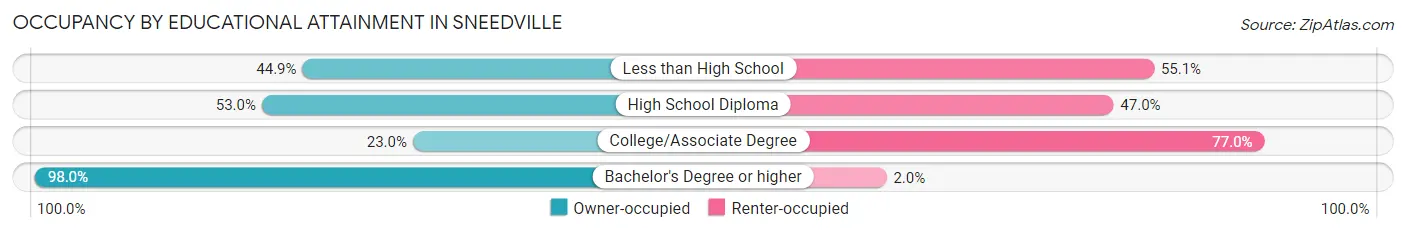
| Household Size | Owner-occupied | Renter-occupied |
| Less than High School | 31 (44.9%) | 38 (55.1%) |
| High School Diploma | 187 (53.0%) | 166 (47.0%) |
| College/Associate Degree | 35 (23.0%) | 117 (77.0%) |
| Bachelor's Degree or higher | 48 (98.0%) | 1 (2.0%) |
Occupancy by Age of Householder in Sneedville
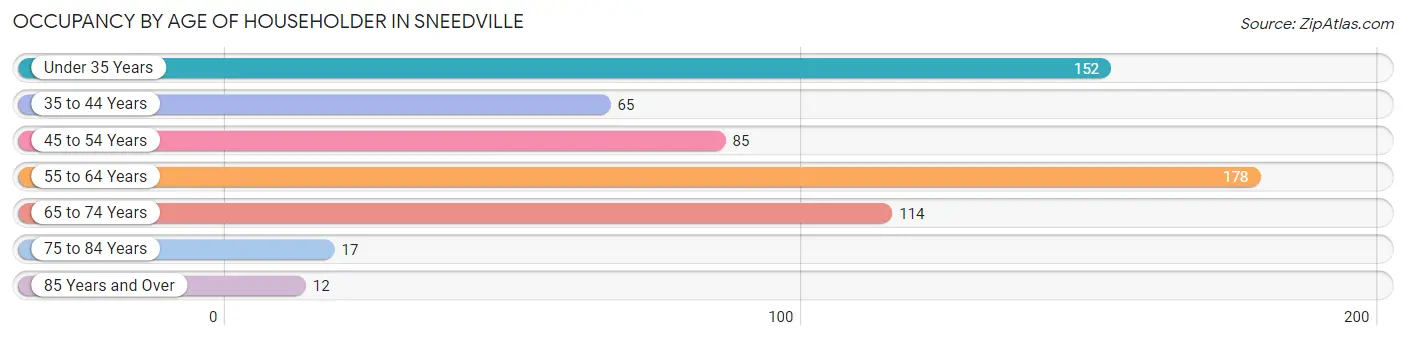
| Age Bracket | # Households | % Households |
| Under 35 Years | 152 | 24.4% |
| 35 to 44 Years | 65 | 10.4% |
| 45 to 54 Years | 85 | 13.6% |
| 55 to 64 Years | 178 | 28.6% |
| 65 to 74 Years | 114 | 18.3% |
| 75 to 84 Years | 17 | 2.7% |
| 85 Years and Over | 12 | 1.9% |
| Total | 623 | 100.0% |
Housing Finances in Sneedville
Median Income by Occupancy in Sneedville
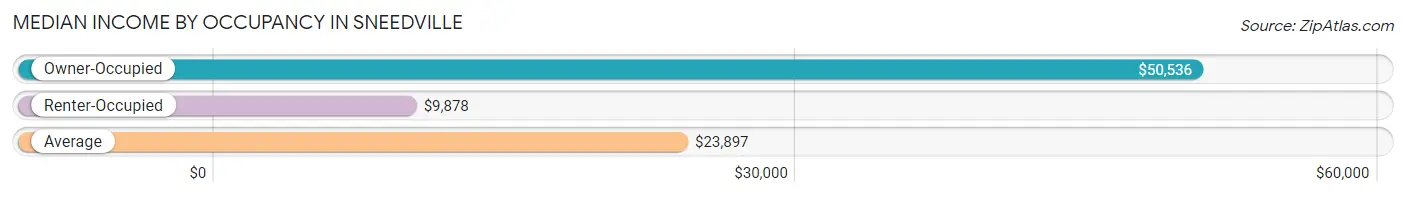
| Occupancy Type | # Households | Median Income |
| Owner-Occupied | 301 (48.3%) | $50,536 |
| Renter-Occupied | 322 (51.7%) | $9,878 |
| Average | 623 (100.0%) | $23,897 |
Occupancy by Householder Income Bracket in Sneedville
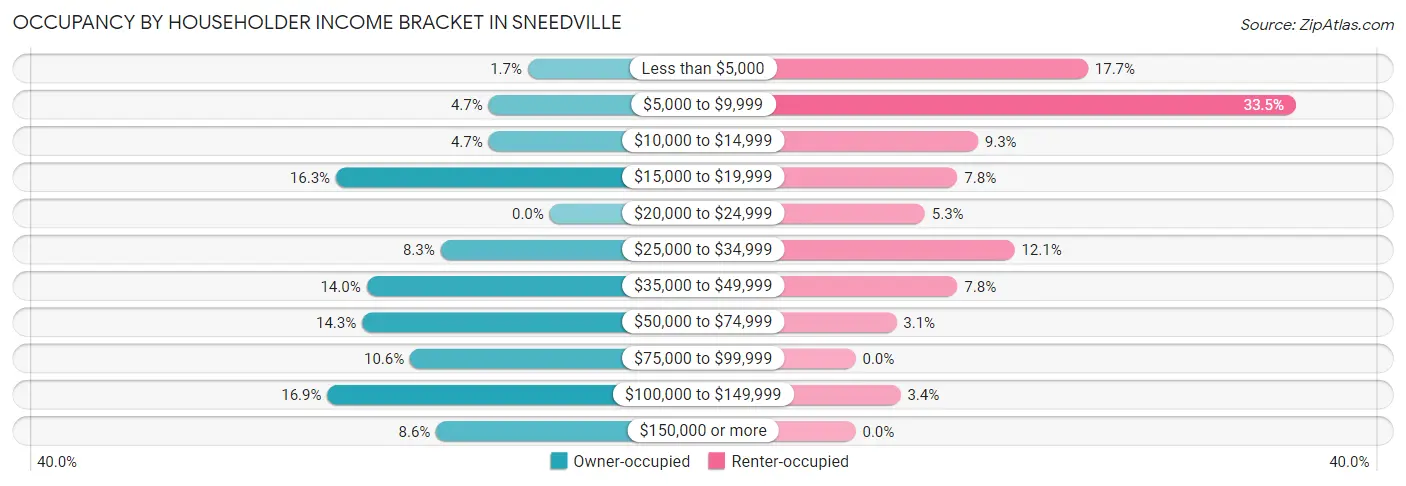
| Income Bracket | Owner-occupied | Renter-occupied |
| Less than $5,000 | 5 (1.7%) | 57 (17.7%) |
| $5,000 to $9,999 | 14 (4.6%) | 108 (33.5%) |
| $10,000 to $14,999 | 14 (4.6%) | 30 (9.3%) |
| $15,000 to $19,999 | 49 (16.3%) | 25 (7.8%) |
| $20,000 to $24,999 | 0 (0.0%) | 17 (5.3%) |
| $25,000 to $34,999 | 25 (8.3%) | 39 (12.1%) |
| $35,000 to $49,999 | 42 (14.0%) | 25 (7.8%) |
| $50,000 to $74,999 | 43 (14.3%) | 10 (3.1%) |
| $75,000 to $99,999 | 32 (10.6%) | 0 (0.0%) |
| $100,000 to $149,999 | 51 (16.9%) | 11 (3.4%) |
| $150,000 or more | 26 (8.6%) | 0 (0.0%) |
| Total | 301 (100.0%) | 322 (100.0%) |
Monthly Housing Cost Tiers in Sneedville
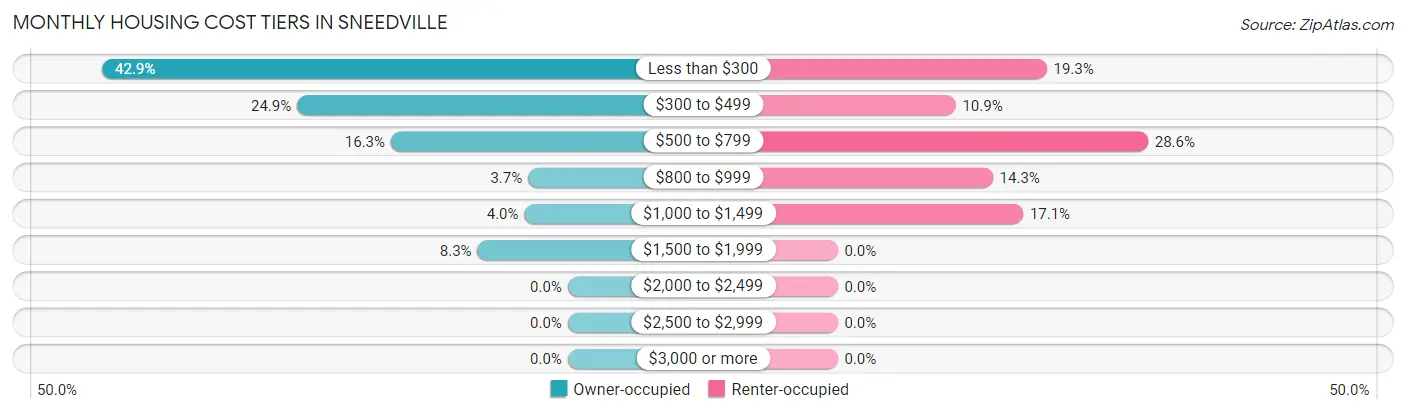
| Monthly Cost | Owner-occupied | Renter-occupied |
| Less than $300 | 129 (42.9%) | 62 (19.3%) |
| $300 to $499 | 75 (24.9%) | 35 (10.9%) |
| $500 to $799 | 49 (16.3%) | 92 (28.6%) |
| $800 to $999 | 11 (3.6%) | 46 (14.3%) |
| $1,000 to $1,499 | 12 (4.0%) | 55 (17.1%) |
| $1,500 to $1,999 | 25 (8.3%) | 0 (0.0%) |
| $2,000 to $2,499 | 0 (0.0%) | 0 (0.0%) |
| $2,500 to $2,999 | 0 (0.0%) | 0 (0.0%) |
| $3,000 or more | 0 (0.0%) | 0 (0.0%) |
| Total | 301 (100.0%) | 322 (100.0%) |
Physical Housing Characteristics in Sneedville
Housing Structures in Sneedville
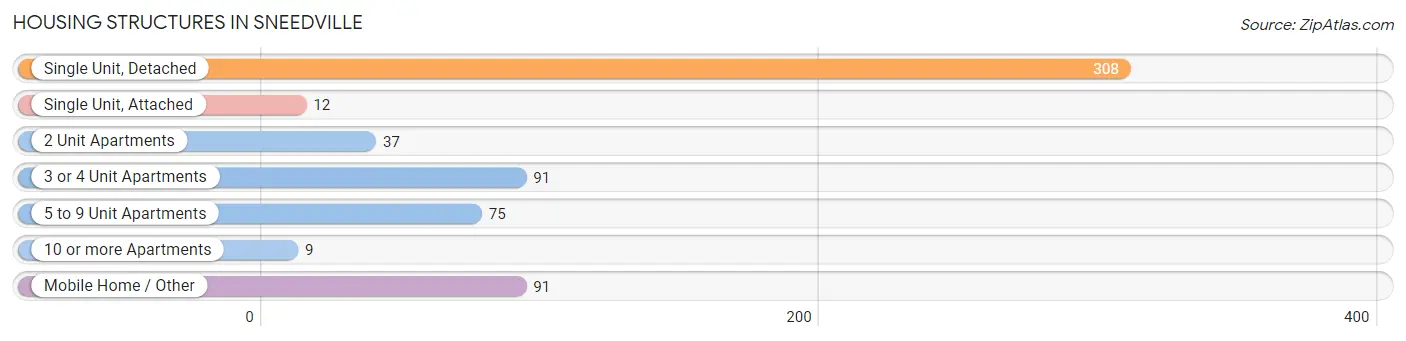
| Structure Type | # Housing Units | % Housing Units |
| Single Unit, Detached | 308 | 49.4% |
| Single Unit, Attached | 12 | 1.9% |
| 2 Unit Apartments | 37 | 5.9% |
| 3 or 4 Unit Apartments | 91 | 14.6% |
| 5 to 9 Unit Apartments | 75 | 12.0% |
| 10 or more Apartments | 9 | 1.4% |
| Mobile Home / Other | 91 | 14.6% |
| Total | 623 | 100.0% |
Housing Structures by Occupancy in Sneedville
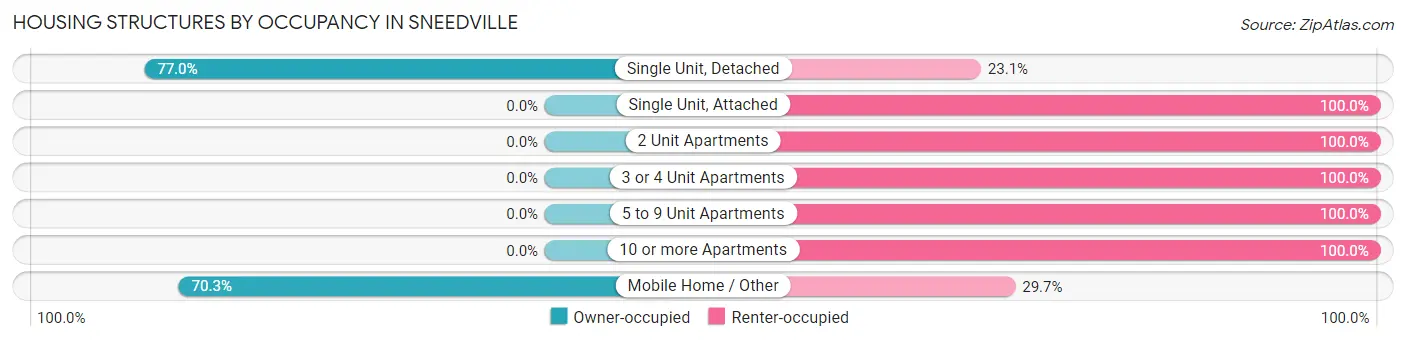
| Structure Type | Owner-occupied | Renter-occupied |
| Single Unit, Detached | 237 (76.9%) | 71 (23.1%) |
| Single Unit, Attached | 0 (0.0%) | 12 (100.0%) |
| 2 Unit Apartments | 0 (0.0%) | 37 (100.0%) |
| 3 or 4 Unit Apartments | 0 (0.0%) | 91 (100.0%) |
| 5 to 9 Unit Apartments | 0 (0.0%) | 75 (100.0%) |
| 10 or more Apartments | 0 (0.0%) | 9 (100.0%) |
| Mobile Home / Other | 64 (70.3%) | 27 (29.7%) |
| Total | 301 (48.3%) | 322 (51.7%) |
Housing Structures by Number of Rooms in Sneedville
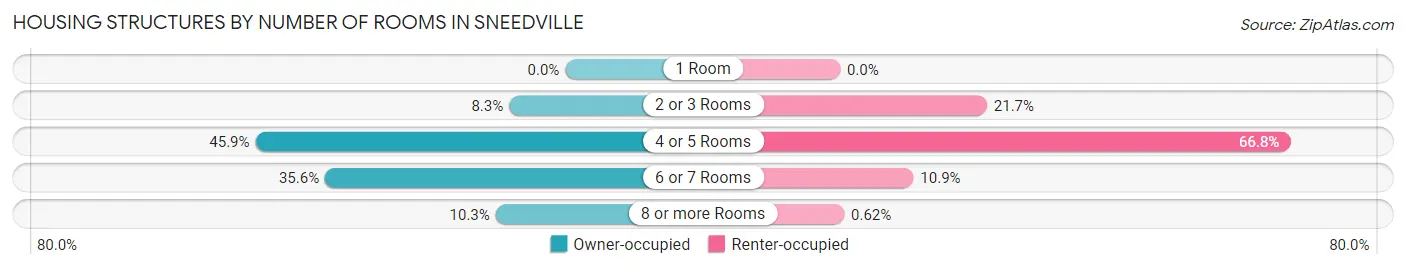
| Number of Rooms | Owner-occupied | Renter-occupied |
| 1 Room | 0 (0.0%) | 0 (0.0%) |
| 2 or 3 Rooms | 25 (8.3%) | 70 (21.7%) |
| 4 or 5 Rooms | 138 (45.9%) | 215 (66.8%) |
| 6 or 7 Rooms | 107 (35.5%) | 35 (10.9%) |
| 8 or more Rooms | 31 (10.3%) | 2 (0.6%) |
| Total | 301 (100.0%) | 322 (100.0%) |
Housing Structure by Heating Type in Sneedville
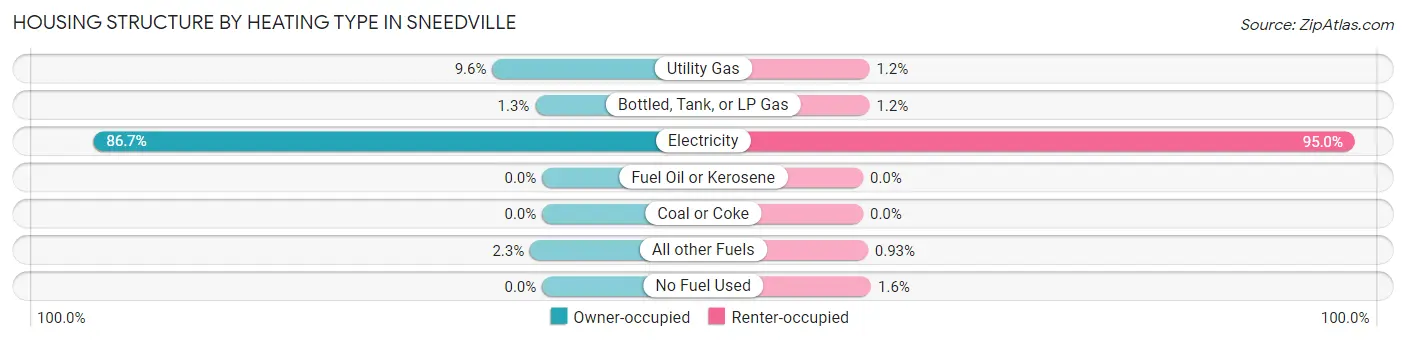
| Heating Type | Owner-occupied | Renter-occupied |
| Utility Gas | 29 (9.6%) | 4 (1.2%) |
| Bottled, Tank, or LP Gas | 4 (1.3%) | 4 (1.2%) |
| Electricity | 261 (86.7%) | 306 (95.0%) |
| Fuel Oil or Kerosene | 0 (0.0%) | 0 (0.0%) |
| Coal or Coke | 0 (0.0%) | 0 (0.0%) |
| All other Fuels | 7 (2.3%) | 3 (0.9%) |
| No Fuel Used | 0 (0.0%) | 5 (1.5%) |
| Total | 301 (100.0%) | 322 (100.0%) |
Household Vehicle Usage in Sneedville
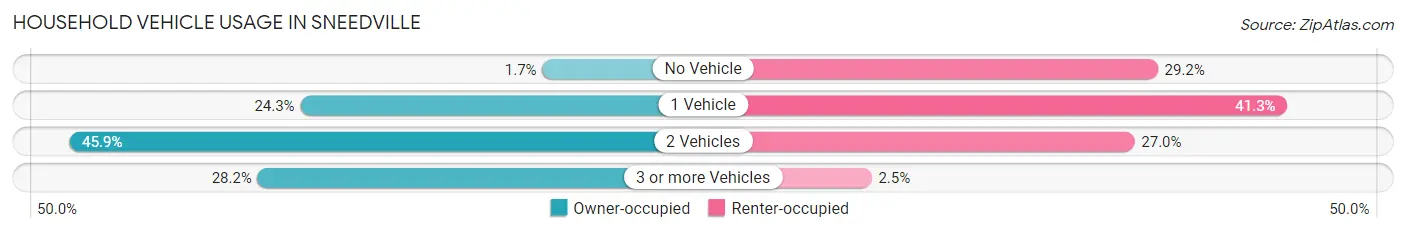
| Vehicles per Household | Owner-occupied | Renter-occupied |
| No Vehicle | 5 (1.7%) | 94 (29.2%) |
| 1 Vehicle | 73 (24.2%) | 133 (41.3%) |
| 2 Vehicles | 138 (45.9%) | 87 (27.0%) |
| 3 or more Vehicles | 85 (28.2%) | 8 (2.5%) |
| Total | 301 (100.0%) | 322 (100.0%) |
Real Estate & Mortgages in Sneedville
Real Estate and Mortgage Overview in Sneedville
| Characteristic | Without Mortgage | With Mortgage |
| Housing Units | 218 | 83 |
| Median Property Value | $57,600 | $122,900 |
| Median Household Income | $36,538 | $7 |
| Monthly Housing Costs | $288 | $0 |
| Real Estate Taxes | $461 | $0 |
Property Value by Mortgage Status in Sneedville
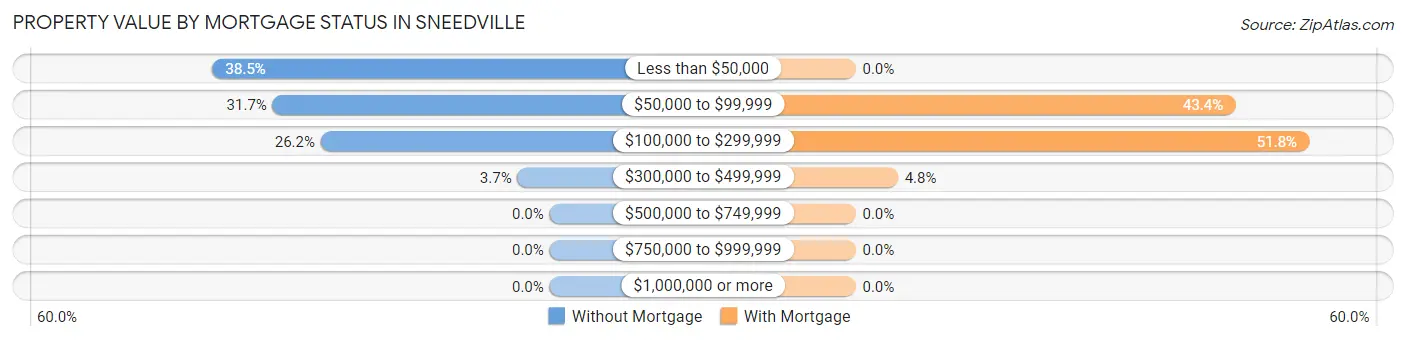
| Property Value | Without Mortgage | With Mortgage |
| Less than $50,000 | 84 (38.5%) | 0 (0.0%) |
| $50,000 to $99,999 | 69 (31.7%) | 36 (43.4%) |
| $100,000 to $299,999 | 57 (26.2%) | 43 (51.8%) |
| $300,000 to $499,999 | 8 (3.7%) | 4 (4.8%) |
| $500,000 to $749,999 | 0 (0.0%) | 0 (0.0%) |
| $750,000 to $999,999 | 0 (0.0%) | 0 (0.0%) |
| $1,000,000 or more | 0 (0.0%) | 0 (0.0%) |
| Total | 218 (100.0%) | 83 (100.0%) |
Household Income by Mortgage Status in Sneedville
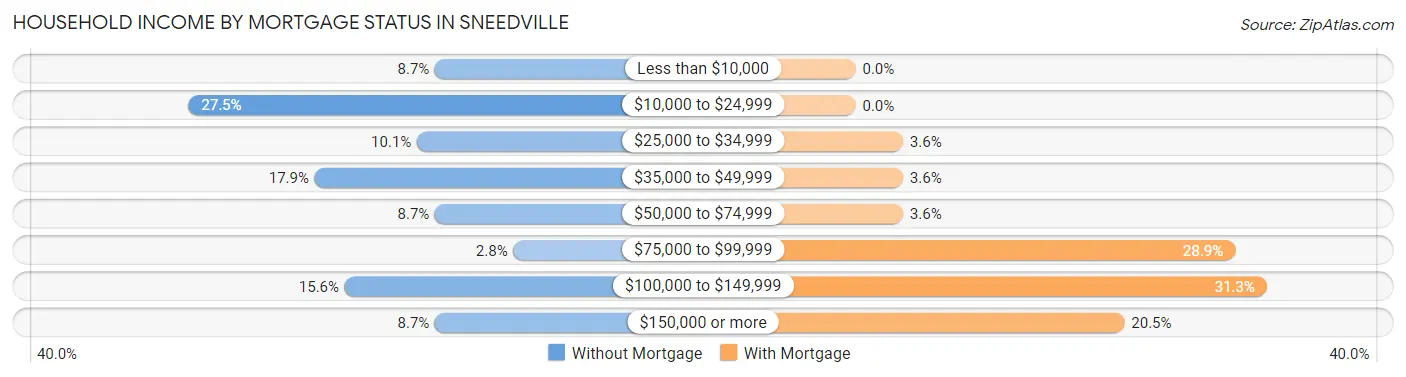
| Household Income | Without Mortgage | With Mortgage |
| Less than $10,000 | 19 (8.7%) | 0 (0.0%) |
| $10,000 to $24,999 | 60 (27.5%) | 0 (0.0%) |
| $25,000 to $34,999 | 22 (10.1%) | 3 (3.6%) |
| $35,000 to $49,999 | 39 (17.9%) | 3 (3.6%) |
| $50,000 to $74,999 | 19 (8.7%) | 3 (3.6%) |
| $75,000 to $99,999 | 6 (2.8%) | 24 (28.9%) |
| $100,000 to $149,999 | 34 (15.6%) | 26 (31.3%) |
| $150,000 or more | 19 (8.7%) | 17 (20.5%) |
| Total | 218 (100.0%) | 83 (100.0%) |
Property Value to Household Income Ratio in Sneedville
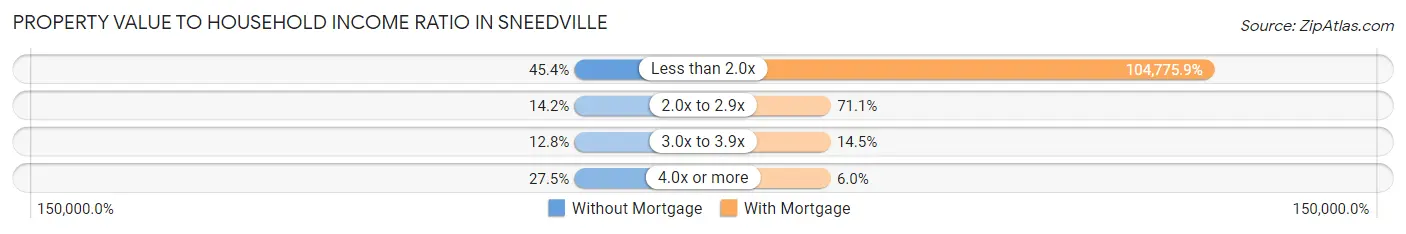
| Value-to-Income Ratio | Without Mortgage | With Mortgage |
| Less than 2.0x | 99 (45.4%) | 86,964 (104,775.9%) |
| 2.0x to 2.9x | 31 (14.2%) | 59 (71.1%) |
| 3.0x to 3.9x | 28 (12.8%) | 12 (14.5%) |
| 4.0x or more | 60 (27.5%) | 5 (6.0%) |
| Total | 218 (100.0%) | 83 (100.0%) |
Real Estate Taxes by Mortgage Status in Sneedville
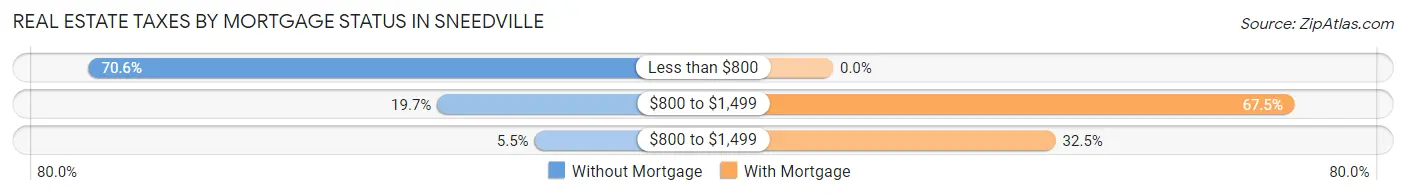
| Property Taxes | Without Mortgage | With Mortgage |
| Less than $800 | 154 (70.6%) | 0 (0.0%) |
| $800 to $1,499 | 43 (19.7%) | 56 (67.5%) |
| $800 to $1,499 | 12 (5.5%) | 27 (32.5%) |
| Total | 218 (100.0%) | 83 (100.0%) |
Health & Disability in Sneedville
Health Insurance Coverage by Age in Sneedville
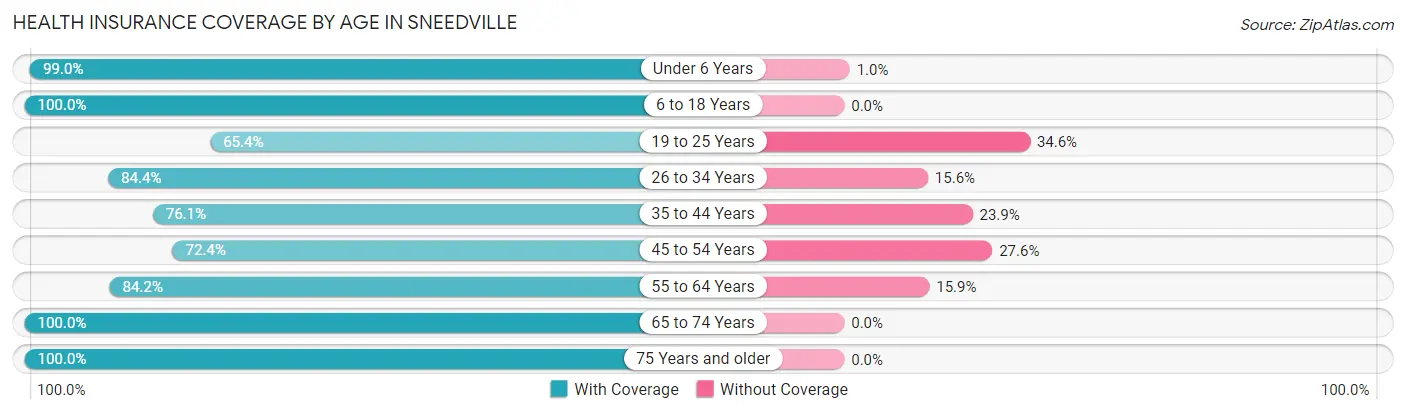
| Age Bracket | With Coverage | Without Coverage |
| Under 6 Years | 98 (99.0%) | 1 (1.0%) |
| 6 to 18 Years | 197 (100.0%) | 0 (0.0%) |
| 19 to 25 Years | 119 (65.4%) | 63 (34.6%) |
| 26 to 34 Years | 157 (84.4%) | 29 (15.6%) |
| 35 to 44 Years | 105 (76.1%) | 33 (23.9%) |
| 45 to 54 Years | 126 (72.4%) | 48 (27.6%) |
| 55 to 64 Years | 239 (84.2%) | 45 (15.9%) |
| 65 to 74 Years | 149 (100.0%) | 0 (0.0%) |
| 75 Years and older | 35 (100.0%) | 0 (0.0%) |
| Total | 1,225 (84.8%) | 219 (15.2%) |
Health Insurance Coverage by Citizenship Status in Sneedville
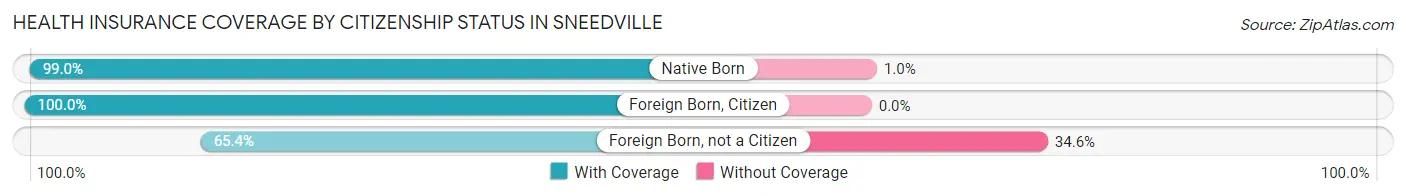
| Citizenship Status | With Coverage | Without Coverage |
| Native Born | 98 (99.0%) | 1 (1.0%) |
| Foreign Born, Citizen | 197 (100.0%) | 0 (0.0%) |
| Foreign Born, not a Citizen | 119 (65.4%) | 63 (34.6%) |
Health Insurance Coverage by Household Income in Sneedville
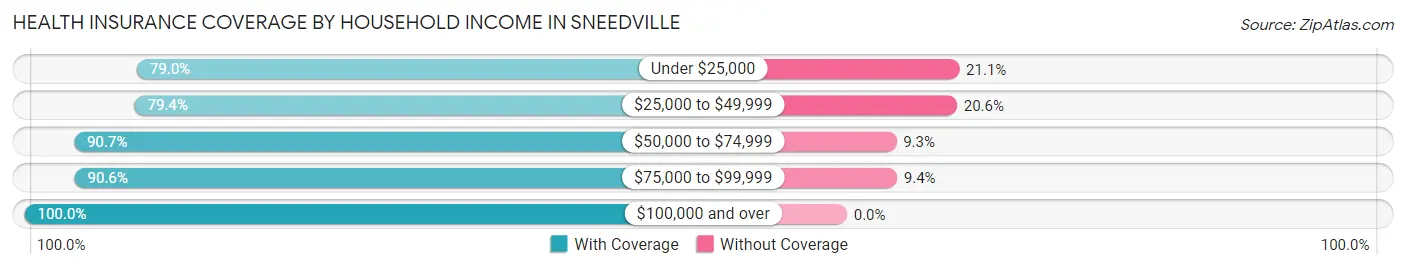
| Household Income | With Coverage | Without Coverage |
| Under $25,000 | 465 (78.9%) | 124 (21.0%) |
| $25,000 to $49,999 | 285 (79.4%) | 74 (20.6%) |
| $50,000 to $74,999 | 147 (90.7%) | 15 (9.3%) |
| $75,000 to $99,999 | 58 (90.6%) | 6 (9.4%) |
| $100,000 and over | 270 (100.0%) | 0 (0.0%) |
Public vs Private Health Insurance Coverage by Age in Sneedville
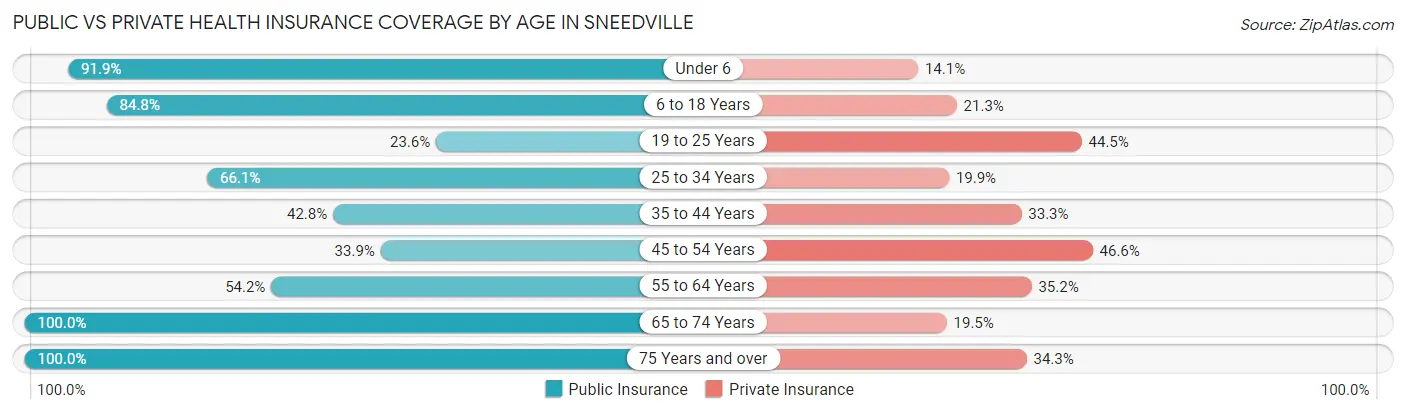
| Age Bracket | Public Insurance | Private Insurance |
| Under 6 | 91 (91.9%) | 14 (14.1%) |
| 6 to 18 Years | 167 (84.8%) | 42 (21.3%) |
| 19 to 25 Years | 43 (23.6%) | 81 (44.5%) |
| 25 to 34 Years | 123 (66.1%) | 37 (19.9%) |
| 35 to 44 Years | 59 (42.7%) | 46 (33.3%) |
| 45 to 54 Years | 59 (33.9%) | 81 (46.6%) |
| 55 to 64 Years | 154 (54.2%) | 100 (35.2%) |
| 65 to 74 Years | 149 (100.0%) | 29 (19.5%) |
| 75 Years and over | 35 (100.0%) | 12 (34.3%) |
| Total | 880 (60.9%) | 442 (30.6%) |
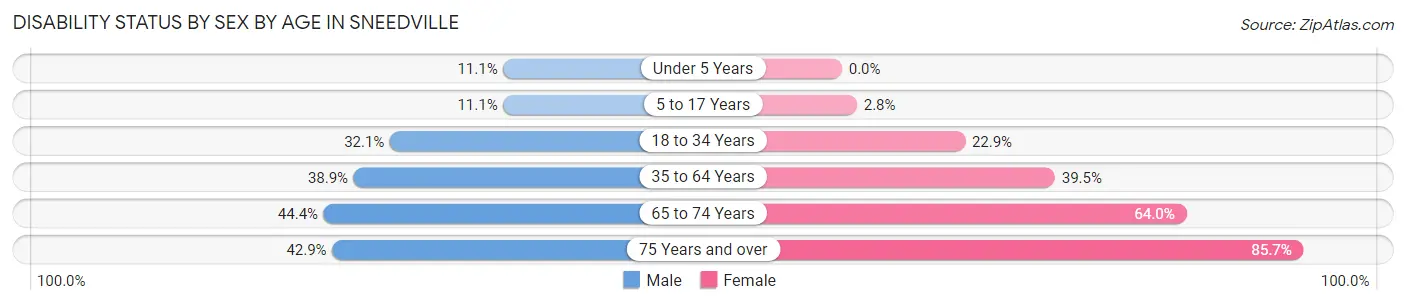
Disability Status by Sex by Age in Sneedville
| Age Bracket | Male | Female |
| Under 5 Years | 4 (11.1%) | 0 (0.0%) |
| 5 to 17 Years | 10 (11.1%) | 4 (2.8%) |
| 18 to 34 Years | 63 (32.1%) | 40 (22.9%) |
| 35 to 64 Years | 96 (38.9%) | 138 (39.5%) |
| 65 to 74 Years | 44 (44.4%) | 32 (64.0%) |
| 75 Years and over | 3 (42.9%) | 24 (85.7%) |
Disability Class by Sex by Age in Sneedville
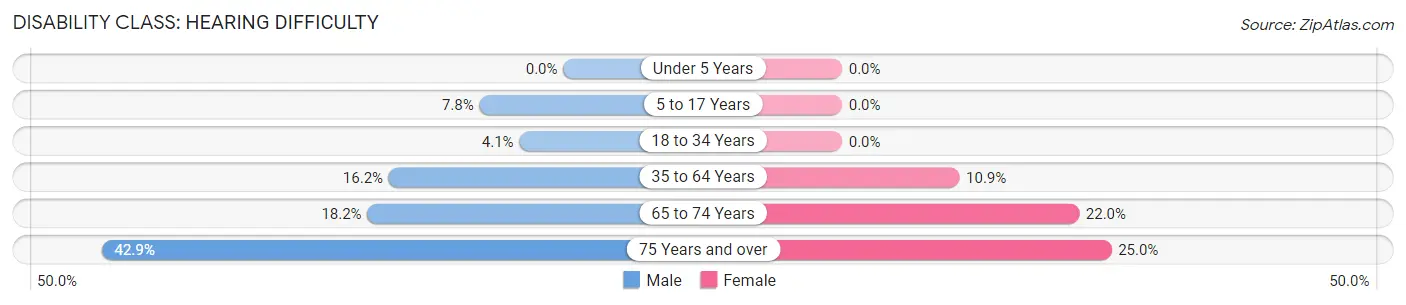
Disability Class: Hearing Difficulty
| Age Bracket | Male | Female |
| Under 5 Years | 0 (0.0%) | 0 (0.0%) |
| 5 to 17 Years | 7 (7.8%) | 0 (0.0%) |
| 18 to 34 Years | 8 (4.1%) | 0 (0.0%) |
| 35 to 64 Years | 40 (16.2%) | 38 (10.9%) |
| 65 to 74 Years | 18 (18.2%) | 11 (22.0%) |
| 75 Years and over | 3 (42.9%) | 7 (25.0%) |
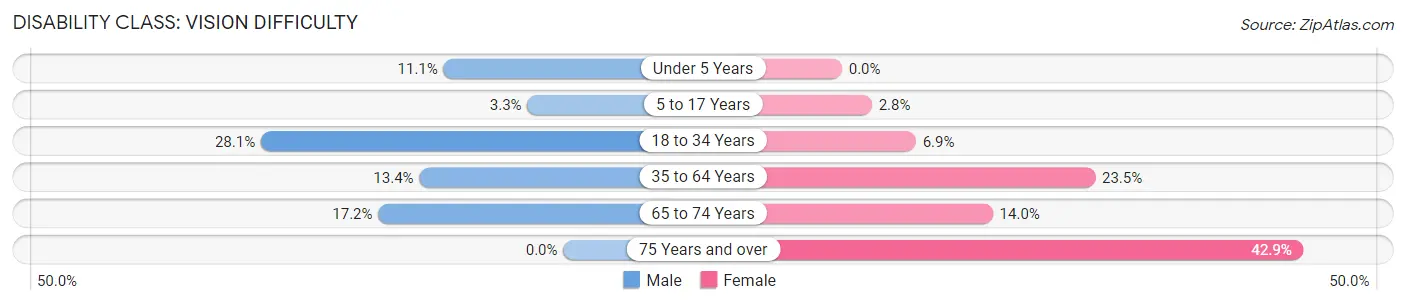
Disability Class: Vision Difficulty
| Age Bracket | Male | Female |
| Under 5 Years | 4 (11.1%) | 0 (0.0%) |
| 5 to 17 Years | 3 (3.3%) | 4 (2.8%) |
| 18 to 34 Years | 55 (28.1%) | 12 (6.9%) |
| 35 to 64 Years | 33 (13.4%) | 82 (23.5%) |
| 65 to 74 Years | 17 (17.2%) | 7 (14.0%) |
| 75 Years and over | 0 (0.0%) | 12 (42.9%) |
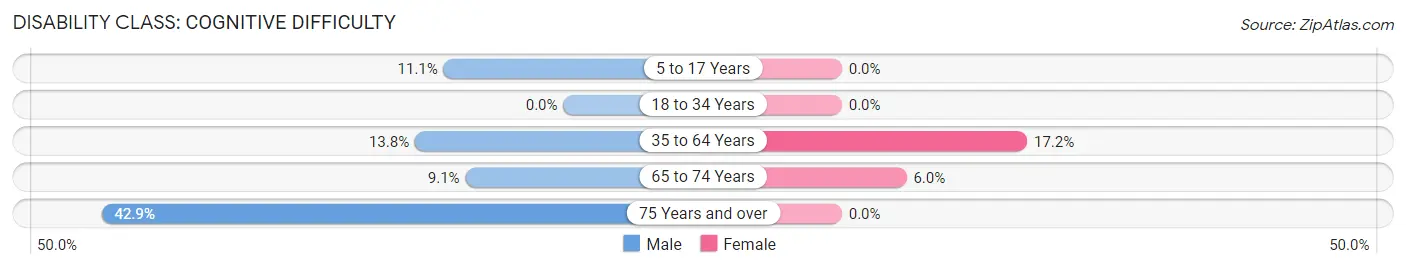
Disability Class: Cognitive Difficulty
| Age Bracket | Male | Female |
| 5 to 17 Years | 10 (11.1%) | 0 (0.0%) |
| 18 to 34 Years | 0 (0.0%) | 0 (0.0%) |
| 35 to 64 Years | 34 (13.8%) | 60 (17.2%) |
| 65 to 74 Years | 9 (9.1%) | 3 (6.0%) |
| 75 Years and over | 3 (42.9%) | 0 (0.0%) |
Disability Class: Ambulatory Difficulty
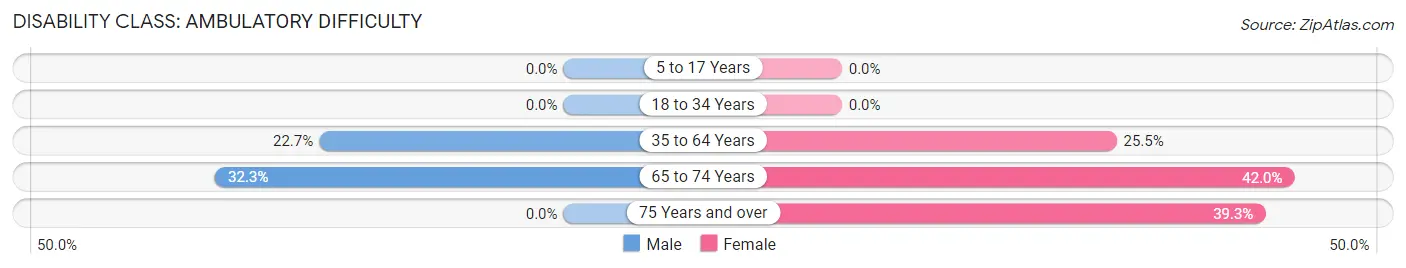
| Age Bracket | Male | Female |
| 5 to 17 Years | 0 (0.0%) | 0 (0.0%) |
| 18 to 34 Years | 0 (0.0%) | 0 (0.0%) |
| 35 to 64 Years | 56 (22.7%) | 89 (25.5%) |
| 65 to 74 Years | 32 (32.3%) | 21 (42.0%) |
| 75 Years and over | 0 (0.0%) | 11 (39.3%) |
Disability Class: Self-Care Difficulty
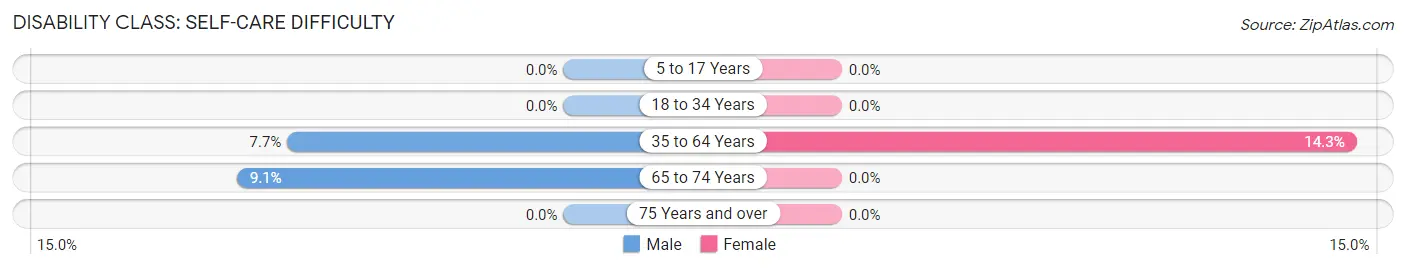
| Age Bracket | Male | Female |
| 5 to 17 Years | 0 (0.0%) | 0 (0.0%) |
| 18 to 34 Years | 0 (0.0%) | 0 (0.0%) |
| 35 to 64 Years | 19 (7.7%) | 50 (14.3%) |
| 65 to 74 Years | 9 (9.1%) | 0 (0.0%) |
| 75 Years and over | 0 (0.0%) | 0 (0.0%) |
Technology Access in Sneedville
Computing Device Access in Sneedville
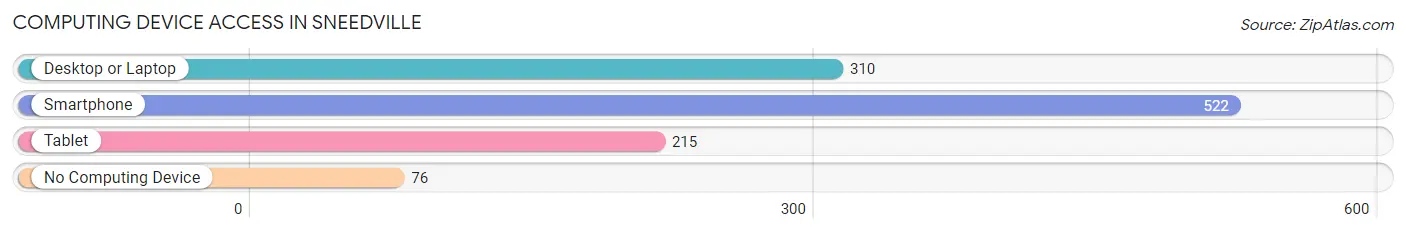
| Device Type | # Households | % Households |
| Desktop or Laptop | 310 | 49.8% |
| Smartphone | 522 | 83.8% |
| Tablet | 215 | 34.5% |
| No Computing Device | 76 | 12.2% |
| Total | 623 | 100.0% |
Internet Access in Sneedville
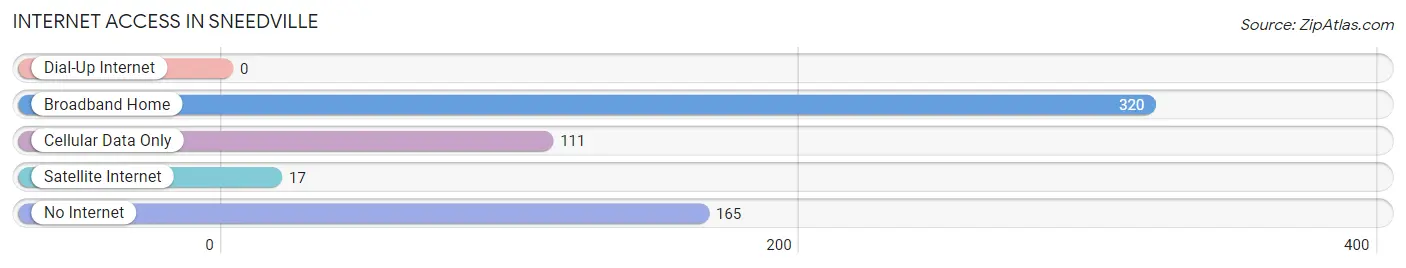
| Internet Type | # Households | % Households |
| Dial-Up Internet | 0 | 0.0% |
| Broadband Home | 320 | 51.4% |
| Cellular Data Only | 111 | 17.8% |
| Satellite Internet | 17 | 2.7% |
| No Internet | 165 | 26.5% |
| Total | 623 | 100.0% |
Sneedville Summary
Sneedville is a small town located in Hancock County, Tennessee. It is situated in the foothills of the Appalachian Mountains and is part of the Appalachian region. The town has a population of 1,717 people, according to the 2010 census. The town was founded in 1820 by William Sneed, who was a Revolutionary War veteran.
Geography
Sneedville is located in the foothills of the Appalachian Mountains in Hancock County, Tennessee. The town is situated at an elevation of 1,068 feet above sea level. The town is located in the Clinch River Valley, which is a major tributary of the Tennessee River. The town is surrounded by the Cherokee National Forest and is located near the Big South Fork National River and Recreation Area. The town is located approximately 30 miles from Knoxville, Tennessee and is accessible by US Route 33.
Economy
Sneedville’s economy is largely based on agriculture and tourism. The town is home to several farms, which produce a variety of crops, including corn, soybeans, wheat, and hay. The town is also home to several small businesses, including restaurants, convenience stores, and gas stations. The town is also home to a few manufacturing companies, which produce a variety of products, including furniture, clothing, and automotive parts.
Demographics
According to the 2010 census, the population of Sneedville was 1,717 people. The town is predominantly white, with a population of 1,541 people (90.1%). The town also has a small African American population of 97 people (5.7%). The town also has a small Hispanic population of 28 people (1.6%). The median household income in the town is $25,972, and the median age is 41.7 years.
History
Sneedville was founded in 1820 by William Sneed, a Revolutionary War veteran. The town was originally known as “Sneed’s Crossroads” and was a stop on the stagecoach route between Knoxville and Nashville. The town was officially incorporated in 1872 and was named after William Sneed. The town was a major stop on the railroad line between Knoxville and Nashville, and the town grew rapidly in the late 19th century. The town was also home to several coal mines, which provided employment for many of the town’s residents. The town was also home to several schools, churches, and businesses.
In the early 20th century, the town began to decline due to the decline of the coal industry and the Great Depression. The town’s population decreased significantly, and many of the town’s businesses closed. The town’s economy began to recover in the 1950s, when the town began to attract tourists due to its proximity to the Great Smoky Mountains National Park. The town’s population has remained relatively stable since then, and the town is now a popular tourist destination.
Common Questions
What is the Total Population of Sneedville?
Total Population of Sneedville is 1,590.
What is the Total Male Population of Sneedville?
Total Male Population of Sneedville is 782.
What is the Total Female Population of Sneedville?
Total Female Population of Sneedville is 808.
What is the Ratio of Males per 100 Females in Sneedville?
There are 96.78 Males per 100 Females in Sneedville.
What is the Ratio of Females per 100 Males in Sneedville?
There are 103.32 Females per 100 Males in Sneedville.
What is the Median Population Age in Sneedville?
Median Population Age in Sneedville is 39.7 Years.
What is the Average Family Size in Sneedville
Average Family Size in Sneedville is 2.6 People.
What is the Average Household Size in Sneedville
Average Household Size in Sneedville is 2.3 People.
What is Per Capita Income in Sneedville?
Per Capita income in Sneedville is $17,222.
What is the Median Family Income in Sneedville?
Median Family Income in Sneedville is $31,563.
What is the Median Household income in Sneedville?
Median Household Income in Sneedville is $23,897.
What is Income or Wage Gap in Sneedville?
Income or Wage Gap in Sneedville is 38.2%.
Women in Sneedville earn 61.8 cents for every dollar earned by a man.
What is Inequality or Gini Index in Sneedville?
Inequality or Gini Index in Sneedville is 0.55.
How Large is the Labor Force in Sneedville?
There are 501 People in the Labor Forcein in Sneedville.
What is the Percentage of People in the Labor Force in Sneedville?
38.3% of People are in the Labor Force in Sneedville.
What is the Unemployment Rate in Sneedville?
Unemployment Rate in Sneedville is 13.6%.