Zelienople borough, PA
Zelienople borough Overview
3,870
TOTAL POPULATION
1,711
MALE POPULATION
2,159
FEMALE POPULATION
79.25
MALES / 100 FEMALES
126.18
FEMALES / 100 MALES
41.1
MEDIAN AGE
2.9
AVG FAMILY SIZE
1.9
AVG HOUSEHOLD SIZE
$45,466
PER CAPITA INCOME
$107,434
AVG FAMILY INCOME
$63,038
AVG HOUSEHOLD INCOME
5.2%
WAGE / INCOME GAP [ % ]
94.8¢/ $1
WAGE / INCOME GAP [ $ ]
$6,725
FAMILY INCOME DEFICIT
0.46
INEQUALITY / GINI INDEX
2,100
LABOR FORCE [ PEOPLE ]
64.7%
PERCENT IN LABOR FORCE
Race in Zelienople borough
The most populous races in Zelienople borough are White / Caucasian (3,726 | 96.3%), Black / African American (78 | 2.0%), and Hispanic or Latino (73 | 1.9%).
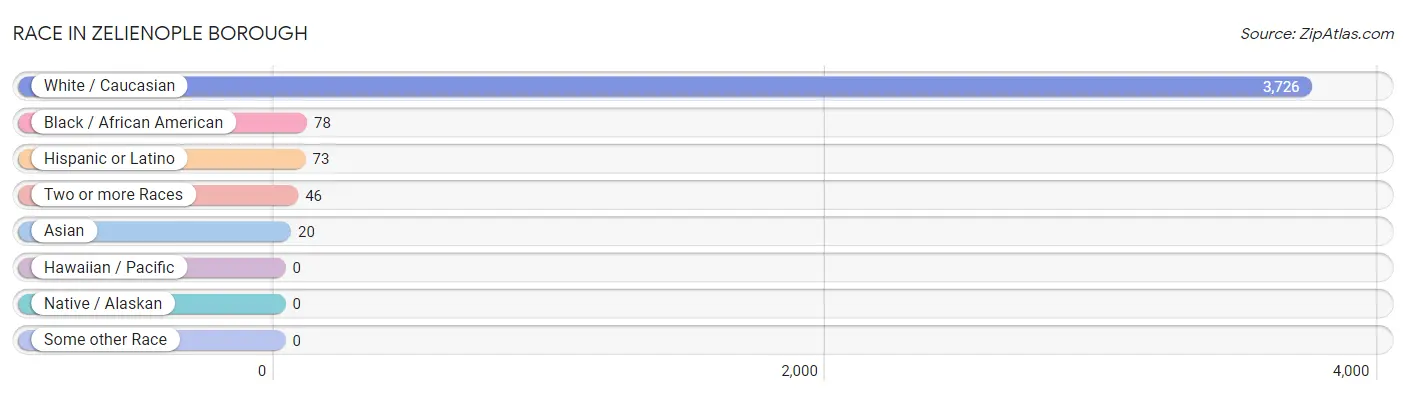
| Race | # Population | % Population |
| Asian | 20 | 0.5% |
| Black / African American | 78 | 2.0% |
| Hawaiian / Pacific | 0 | 0.0% |
| Hispanic or Latino | 73 | 1.9% |
| Native / Alaskan | 0 | 0.0% |
| White / Caucasian | 3,726 | 96.3% |
| Two or more Races | 46 | 1.2% |
| Some other Race | 0 | 0.0% |
| Total | 3,870 | 100.0% |
Ancestry in Zelienople borough
The most populous ancestries reported in Zelienople borough are German (1,607 | 41.5%), Irish (889 | 23.0%), English (585 | 15.1%), Italian (526 | 13.6%), and Polish (313 | 8.1%), together accounting for 101.3% of all Zelienople borough residents.
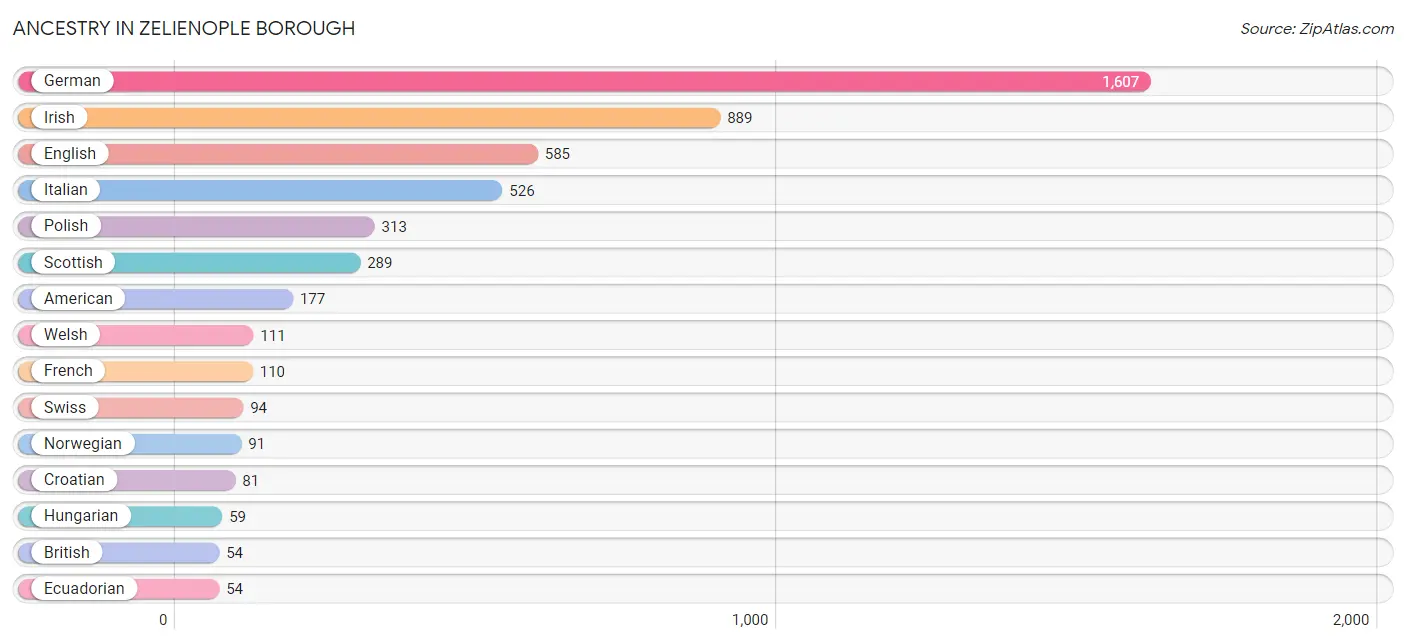
| Ancestry | # Population | % Population |
| American | 177 | 4.6% |
| British | 54 | 1.4% |
| Croatian | 81 | 2.1% |
| Czech | 16 | 0.4% |
| Czechoslovakian | 16 | 0.4% |
| Dutch | 38 | 1.0% |
| Eastern European | 20 | 0.5% |
| Ecuadorian | 54 | 1.4% |
| English | 585 | 15.1% |
| European | 41 | 1.1% |
| French | 110 | 2.8% |
| German | 1,607 | 41.5% |
| Greek | 9 | 0.2% |
| Hungarian | 59 | 1.5% |
| Irish | 889 | 23.0% |
| Italian | 526 | 13.6% |
| Lithuanian | 15 | 0.4% |
| Norwegian | 91 | 2.4% |
| Polish | 313 | 8.1% |
| Portuguese | 22 | 0.6% |
| Russian | 26 | 0.7% |
| Scotch-Irish | 39 | 1.0% |
| Scottish | 289 | 7.5% |
| Slavic | 17 | 0.4% |
| Slovak | 51 | 1.3% |
| Slovene | 6 | 0.2% |
| South American | 54 | 1.4% |
| Spanish | 19 | 0.5% |
| Swedish | 12 | 0.3% |
| Swiss | 94 | 2.4% |
| Welsh | 111 | 2.9% | View All 31 Rows |
Immigrants in Zelienople borough
The most numerous immigrant groups reported in Zelienople borough came from Asia (10 | 0.3%), Pakistan (10 | 0.3%), and South Central Asia (10 | 0.3%), together accounting for 0.8% of all Zelienople borough residents.
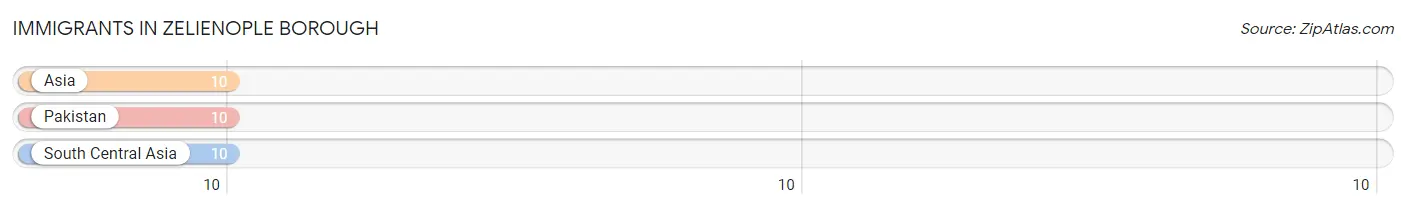
| Immigration Origin | # Population | % Population |
| Asia | 10 | 0.3% |
| Pakistan | 10 | 0.3% |
| South Central Asia | 10 | 0.3% | View All 3 Rows |
Sex and Age in Zelienople borough
Sex and Age in Zelienople borough
The most populous age groups in Zelienople borough are 35 to 39 Years (282 | 16.5%) for men and 85 Years and over (319 | 14.8%) for women.
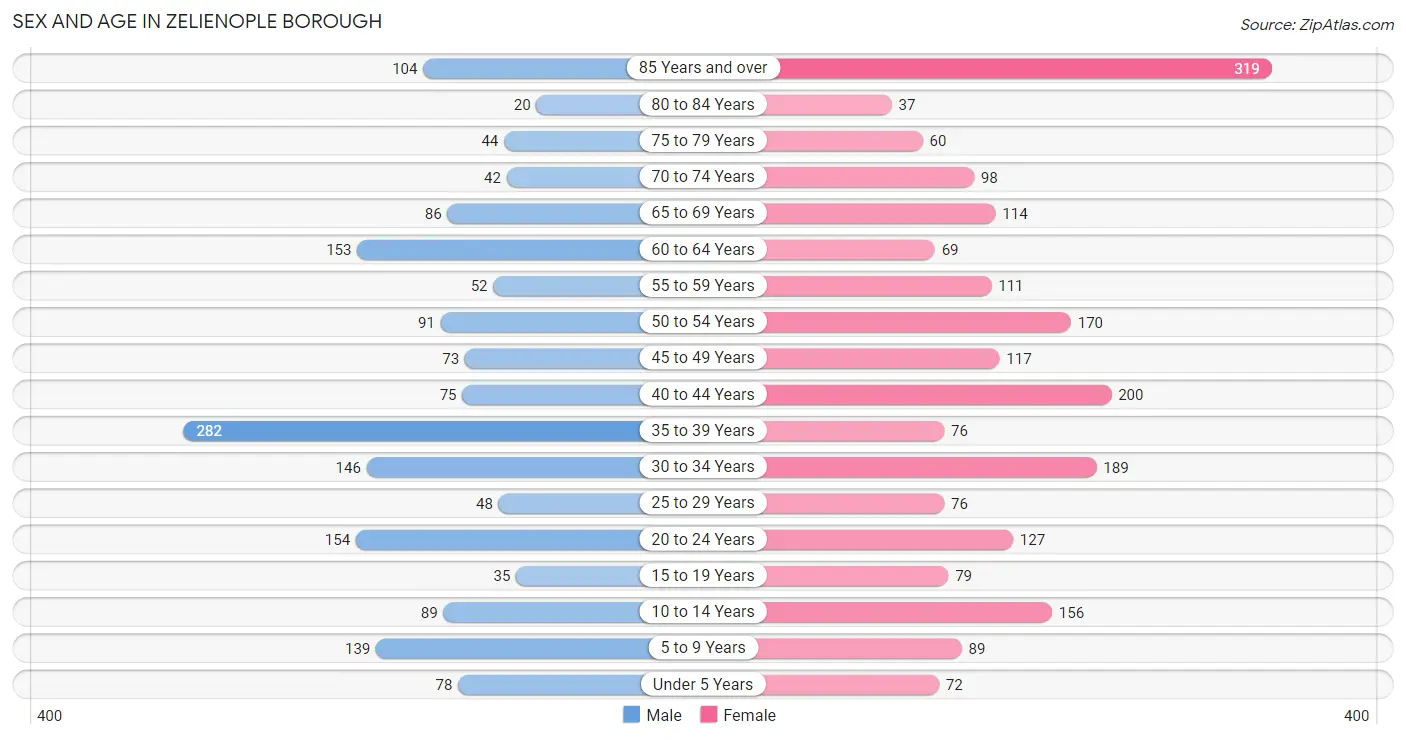
| Age Bracket | Male | Female |
| Under 5 Years | 78 (4.6%) | 72 (3.3%) |
| 5 to 9 Years | 139 (8.1%) | 89 (4.1%) |
| 10 to 14 Years | 89 (5.2%) | 156 (7.2%) |
| 15 to 19 Years | 35 (2.1%) | 79 (3.7%) |
| 20 to 24 Years | 154 (9.0%) | 127 (5.9%) |
| 25 to 29 Years | 48 (2.8%) | 76 (3.5%) |
| 30 to 34 Years | 146 (8.5%) | 189 (8.7%) |
| 35 to 39 Years | 282 (16.5%) | 76 (3.5%) |
| 40 to 44 Years | 75 (4.4%) | 200 (9.3%) |
| 45 to 49 Years | 73 (4.3%) | 117 (5.4%) |
| 50 to 54 Years | 91 (5.3%) | 170 (7.9%) |
| 55 to 59 Years | 52 (3.0%) | 111 (5.1%) |
| 60 to 64 Years | 153 (8.9%) | 69 (3.2%) |
| 65 to 69 Years | 86 (5.0%) | 114 (5.3%) |
| 70 to 74 Years | 42 (2.5%) | 98 (4.5%) |
| 75 to 79 Years | 44 (2.6%) | 60 (2.8%) |
| 80 to 84 Years | 20 (1.2%) | 37 (1.7%) |
| 85 Years and over | 104 (6.1%) | 319 (14.8%) |
| Total | 1,711 (100.0%) | 2,159 (100.0%) |
Families and Households in Zelienople borough
Median Family Size in Zelienople borough
The median family size in Zelienople borough is 2.85 persons per family, with married-couple families (731 | 80.8%) accounting for the largest median family size of 2.95 persons per family. On the other hand, single male/father families (30 | 3.3%) represent the smallest median family size with 1.87 persons per family.
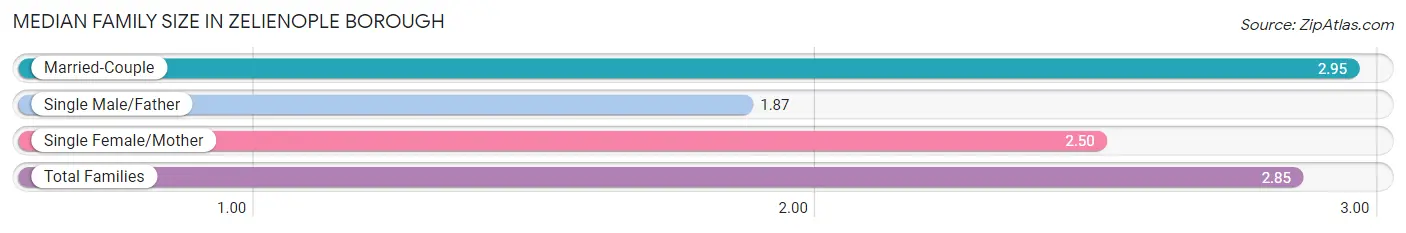
| Family Type | # Families | Family Size |
| Married-Couple | 731 (80.8%) | 2.95 |
| Single Male/Father | 30 (3.3%) | 1.87 |
| Single Female/Mother | 144 (15.9%) | 2.50 |
| Total Families | 905 (100.0%) | 2.85 |
Median Household Size in Zelienople borough
The median household size in Zelienople borough is 1.95 persons per household, with married-couple households (731 | 37.1%) accounting for the largest median household size of 2.95 persons per household. non-family households (1,067 | 54.1%) represent the smallest median household size with 1.19 persons per household.
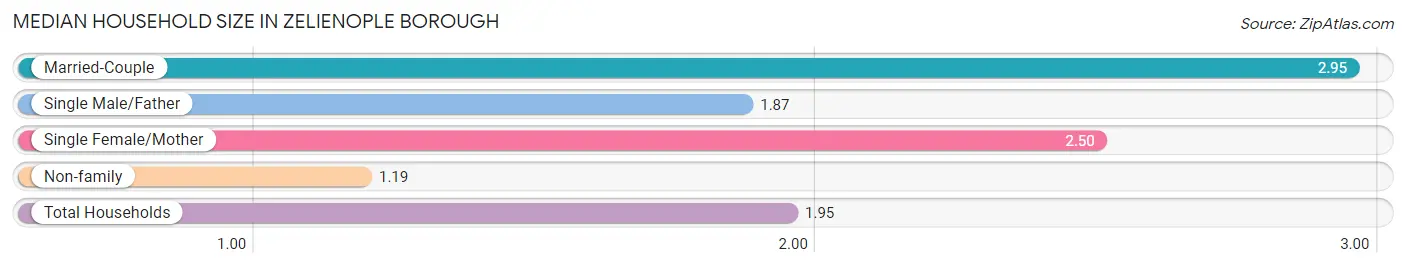
| Household Type | # Households | Household Size |
| Married-Couple | 731 (37.1%) | 2.95 |
| Single Male/Father | 30 (1.5%) | 1.87 |
| Single Female/Mother | 144 (7.3%) | 2.50 |
| Non-family | 1,067 (54.1%) | 1.19 |
| Total Households | 1,972 (100.0%) | 1.95 |
Household Size by Marriage Status in Zelienople borough
Out of a total of 1,972 households in Zelienople borough, 905 (45.9%) are family households, while 1,067 (54.1%) are nonfamily households. The most numerous type of family households are 2-person households, comprising 443, and the most common type of nonfamily households are 1-person households, comprising 913.
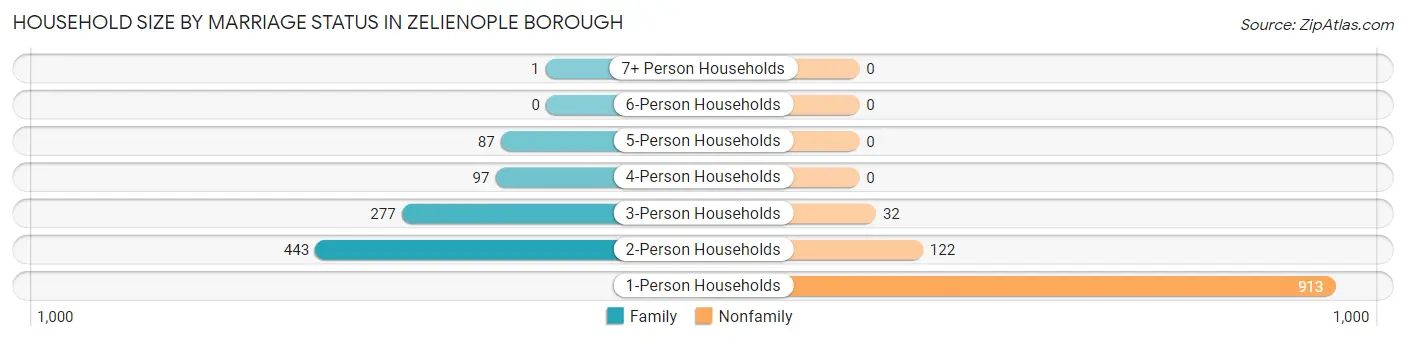
| Household Size | Family Households | Nonfamily Households |
| 1-Person Households | - | 913 (46.3%) |
| 2-Person Households | 443 (22.5%) | 122 (6.2%) |
| 3-Person Households | 277 (14.1%) | 32 (1.6%) |
| 4-Person Households | 97 (4.9%) | 0 (0.0%) |
| 5-Person Households | 87 (4.4%) | 0 (0.0%) |
| 6-Person Households | 0 (0.0%) | 0 (0.0%) |
| 7+ Person Households | 1 (0.1%) | 0 (0.0%) |
| Total | 905 (45.9%) | 1,067 (54.1%) |
Female Fertility in Zelienople borough
Fertility by Age in Zelienople borough
| Age Bracket | Women with Births | Births / 1,000 Women |
| 15 to 19 years | 0 (0.0%) | 0.0 |
| 20 to 34 years | 0 (0.0%) | 0.0 |
| 35 to 50 years | 0 (0.0%) | 0.0 |
| Total | 0 (0.0%) | 0.0 |
Fertility by Age by Marriage Status in Zelienople borough
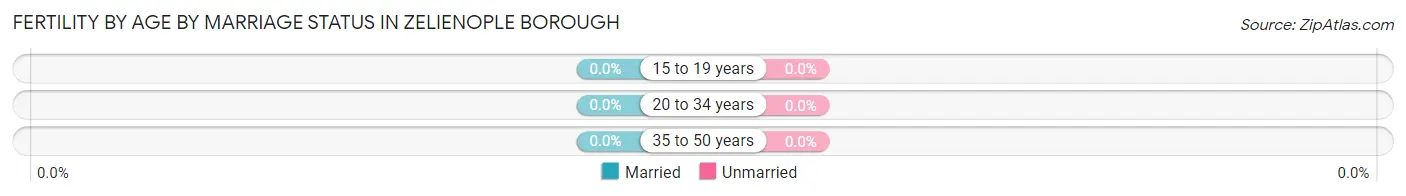
| Age Bracket | Married | Unmarried |
| 15 to 19 years | 0 (0.0%) | 0 (0.0%) |
| 20 to 34 years | 0 (0.0%) | 0 (0.0%) |
| 35 to 50 years | 0 (0.0%) | 0 (0.0%) |
| Total | 0 (0.0%) | 0 (0.0%) |
Fertility by Education in Zelienople borough
| Educational Attainment | Women with Births | Births / 1,000 Women |
| Less than High School | 0 (0.0%) | 0.0 |
| High School Diploma | 0 (0.0%) | 0.0 |
| College or Associate's Degree | 0 (0.0%) | 0.0 |
| Bachelor's Degree | 0 (0.0%) | 0.0 |
| Graduate Degree | 0 (0.0%) | 0.0 |
| Total | 0 (0.0%) | 0.0 |
Fertility by Education by Marriage Status in Zelienople borough
| Educational Attainment | Married | Unmarried |
| Less than High School | 0 (0.0%) | 0 (0.0%) |
| High School Diploma | 0 (0.0%) | 0 (0.0%) |
| College or Associate's Degree | 0 (0.0%) | 0 (0.0%) |
| Bachelor's Degree | 0 (0.0%) | 0 (0.0%) |
| Graduate Degree | 0 (0.0%) | 0 (0.0%) |
| Total | 0 (0.0%) | 0 (0.0%) |
Income in Zelienople borough
Income Overview in Zelienople borough
Per Capita Income in Zelienople borough is $45,466, while median incomes of families and households are $107,434 and $63,038 respectively.
| Characteristic | Number | Measure |
| Per Capita Income | 3,870 | $45,466 |
| Median Family Income | 905 | $107,434 |
| Mean Family Income | 905 | $129,196 |
| Median Household Income | 1,972 | $63,038 |
| Mean Household Income | 1,972 | $89,330 |
| Income Deficit | 905 | $6,725 |
| Wage / Income Gap (%) | 3,870 | 5.23% |
| Wage / Income Gap ($) | 3,870 | 94.77¢ per $1 |
| Gini / Inequality Index | 3,870 | 0.46 |
Earnings by Sex in Zelienople borough
Average Earnings in Zelienople borough are $45,513, $43,355 for men and $45,746 for women, a difference of 5.2%.
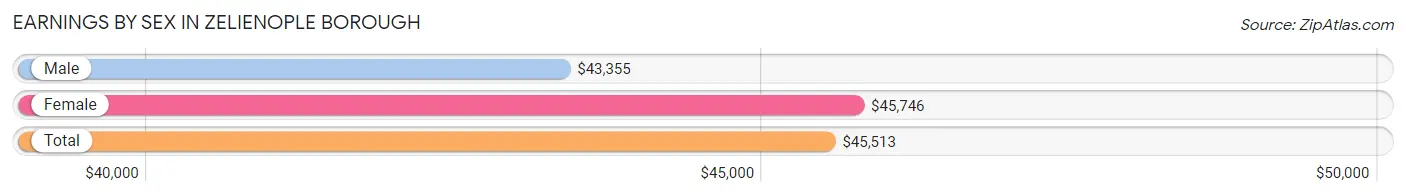
| Sex | Number | Average Earnings |
| Male | 979 (44.5%) | $43,355 |
| Female | 1,220 (55.5%) | $45,746 |
| Total | 2,199 (100.0%) | $45,513 |
Earnings by Sex by Income Bracket in Zelienople borough
The most common earnings brackets in Zelienople borough are $100,000+ for men (206 | 21.0%) and $45,000 to $49,999 for women (175 | 14.3%).
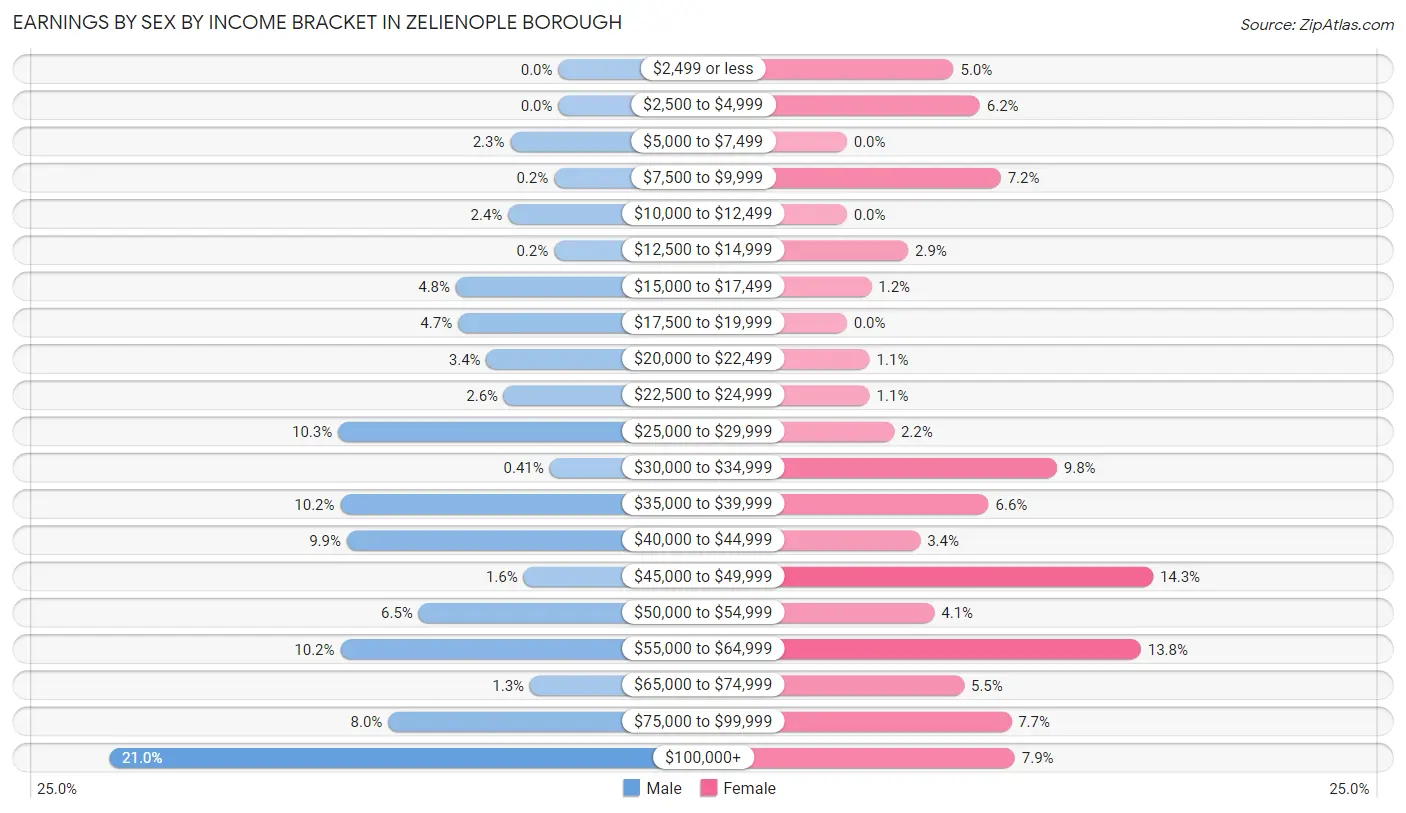
| Income | Male | Female |
| $2,499 or less | 0 (0.0%) | 61 (5.0%) |
| $2,500 to $4,999 | 0 (0.0%) | 76 (6.2%) |
| $5,000 to $7,499 | 22 (2.2%) | 0 (0.0%) |
| $7,500 to $9,999 | 2 (0.2%) | 88 (7.2%) |
| $10,000 to $12,499 | 23 (2.4%) | 0 (0.0%) |
| $12,500 to $14,999 | 2 (0.2%) | 35 (2.9%) |
| $15,000 to $17,499 | 47 (4.8%) | 14 (1.1%) |
| $17,500 to $19,999 | 46 (4.7%) | 0 (0.0%) |
| $20,000 to $22,499 | 33 (3.4%) | 13 (1.1%) |
| $22,500 to $24,999 | 25 (2.5%) | 13 (1.1%) |
| $25,000 to $29,999 | 101 (10.3%) | 27 (2.2%) |
| $30,000 to $34,999 | 4 (0.4%) | 120 (9.8%) |
| $35,000 to $39,999 | 100 (10.2%) | 81 (6.6%) |
| $40,000 to $44,999 | 97 (9.9%) | 42 (3.4%) |
| $45,000 to $49,999 | 16 (1.6%) | 175 (14.3%) |
| $50,000 to $54,999 | 64 (6.5%) | 50 (4.1%) |
| $55,000 to $64,999 | 100 (10.2%) | 168 (13.8%) |
| $65,000 to $74,999 | 13 (1.3%) | 67 (5.5%) |
| $75,000 to $99,999 | 78 (8.0%) | 94 (7.7%) |
| $100,000+ | 206 (21.0%) | 96 (7.9%) |
| Total | 979 (100.0%) | 1,220 (100.0%) |
Earnings by Sex by Educational Attainment in Zelienople borough
Average earnings in Zelienople borough are $51,895 for men and $46,772 for women, a difference of 9.9%. Men with an educational attainment of graduate degree enjoy the highest average annual earnings of $95,170, while those with college or associate's degree education earn the least with $50,799. Women with an educational attainment of bachelor's degree earn the most with the average annual earnings of $59,955, while those with college or associate's degree education have the smallest earnings of $35,521.
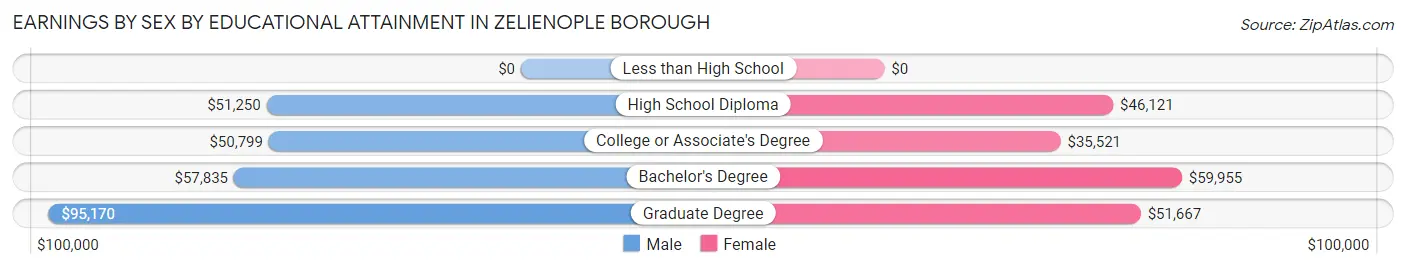
| Educational Attainment | Male Income | Female Income |
| Less than High School | - | - |
| High School Diploma | $51,250 | $46,121 |
| College or Associate's Degree | $50,799 | $35,521 |
| Bachelor's Degree | $57,835 | $59,955 |
| Graduate Degree | $95,170 | $51,667 |
| Total | $51,895 | $46,772 |
Family Income in Zelienople borough
Family Income Brackets in Zelienople borough
According to the Zelienople borough family income data, there are 238 families falling into the $100,000 to $149,999 income range, which is the most common income bracket and makes up 26.3% of all families.

| Income Bracket | # Families | % Families |
| Less than $10,000 | 23 | 2.5% |
| $10,000 to $14,999 | 0 | 0.0% |
| $15,000 to $24,999 | 57 | 6.3% |
| $25,000 to $34,999 | 76 | 8.4% |
| $35,000 to $49,999 | 13 | 1.4% |
| $50,000 to $74,999 | 129 | 14.3% |
| $75,000 to $99,999 | 136 | 15.0% |
| $100,000 to $149,999 | 238 | 26.3% |
| $150,000 to $199,999 | 120 | 13.3% |
| $200,000+ | 113 | 12.5% |
Family Income by Famaliy Size in Zelienople borough
2-person families (443 | 48.9%) account for the highest median family income in Zelienople borough with $98,750 per family, while 2-person families (443 | 48.9%) have the highest median income of $49,375 per family member.
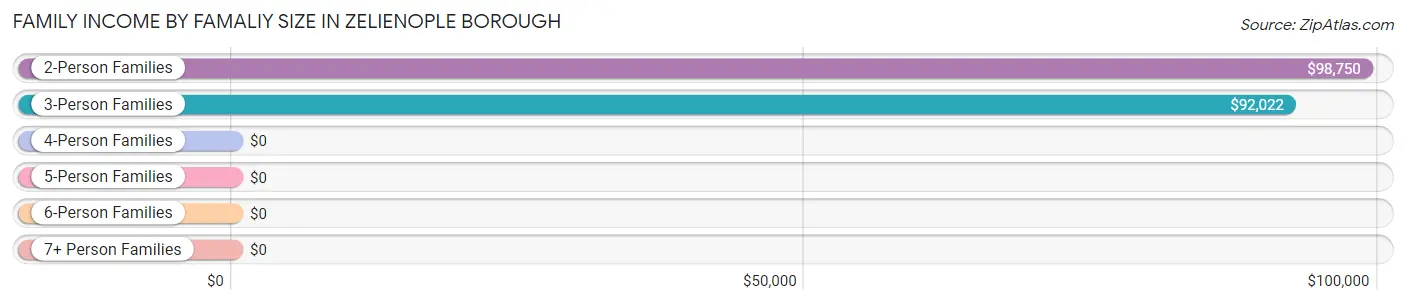
| Income Bracket | # Families | Median Income |
| 2-Person Families | 443 (48.9%) | $98,750 |
| 3-Person Families | 277 (30.6%) | $92,022 |
| 4-Person Families | 97 (10.7%) | $0 |
| 5-Person Families | 87 (9.6%) | $0 |
| 6-Person Families | 0 (0.0%) | $0 |
| 7+ Person Families | 1 (0.1%) | $0 |
| Total | 905 (100.0%) | $107,434 |
Family Income by Number of Earners in Zelienople borough
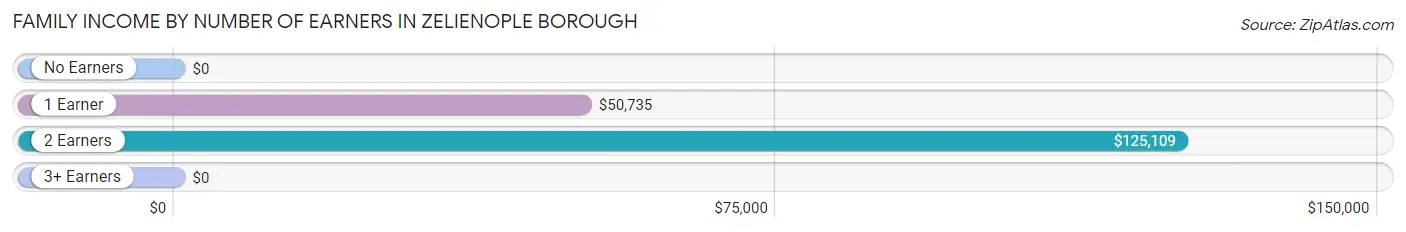
| Number of Earners | # Families | Median Income |
| No Earners | 129 (14.2%) | $0 |
| 1 Earner | 172 (19.0%) | $50,735 |
| 2 Earners | 504 (55.7%) | $125,109 |
| 3+ Earners | 100 (11.1%) | $0 |
| Total | 905 (100.0%) | $107,434 |
Household Income in Zelienople borough
Household Income Brackets in Zelienople borough
With 420 households falling in the category, the $50,000 to $74,999 income range is the most frequent in Zelienople borough, accounting for 21.3% of all households.
| Income Bracket | # Households | % Households |
| Less than $10,000 | 43 | 2.2% |
| $10,000 to $14,999 | 0 | 0.0% |
| $15,000 to $24,999 | 239 | 12.1% |
| $25,000 to $34,999 | 317 | 16.1% |
| $35,000 to $49,999 | 219 | 11.1% |
| $50,000 to $74,999 | 420 | 21.3% |
| $75,000 to $99,999 | 176 | 8.9% |
| $100,000 to $149,999 | 282 | 14.3% |
| $150,000 to $199,999 | 130 | 6.6% |
| $200,000+ | 146 | 7.4% |
Household Income by Householder Age in Zelienople borough
The median household income in Zelienople borough is $63,038, with the highest median household income of $87,667 found in the 45 to 64 years age bracket for the primary householder. A total of 548 households (27.8%) fall into this category. Meanwhile, the 15 to 24 years age bracket for the primary householder has the lowest median household income of $34,375, with 122 households (6.2%) in this group.
| Income Bracket | # Households | Median Income |
| 15 to 24 Years | 122 (6.2%) | $34,375 |
| 25 to 44 Years | 592 (30.0%) | $82,391 |
| 45 to 64 Years | 548 (27.8%) | $87,667 |
| 65+ Years | 710 (36.0%) | $35,156 |
| Total | 1,972 (100.0%) | $63,038 |
Poverty in Zelienople borough
Income Below Poverty by Sex and Age in Zelienople borough
With 2.6% poverty level for males and 8.3% for females among the residents of Zelienople borough, 12 to 14 year old males and 12 to 14 year old females are the most vulnerable to poverty, with 23 males (100.0%) and 50 females (47.6%) in their respective age groups living below the poverty level.
| Age Bracket | Male | Female |
| Under 5 Years | 0 (0.0%) | 0 (0.0%) |
| 5 Years | 0 (0.0%) | 0 (0.0%) |
| 6 to 11 Years | 22 (14.5%) | 0 (0.0%) |
| 12 to 14 Years | 23 (100.0%) | 50 (47.6%) |
| 15 Years | 0 (0.0%) | 0 (0.0%) |
| 16 and 17 Years | 0 (0.0%) | 23 (29.1%) |
| 18 to 24 Years | 0 (0.0%) | 0 (0.0%) |
| 25 to 34 Years | 0 (0.0%) | 0 (0.0%) |
| 35 to 44 Years | 0 (0.0%) | 48 (17.4%) |
| 45 to 54 Years | 0 (0.0%) | 32 (11.2%) |
| 55 to 64 Years | 0 (0.0%) | 2 (1.1%) |
| 65 to 74 Years | 0 (0.0%) | 2 (0.9%) |
| 75 Years and over | 0 (0.0%) | 20 (5.1%) |
| Total | 45 (2.6%) | 177 (8.3%) |
Income Above Poverty by Sex and Age in Zelienople borough
According to the poverty statistics in Zelienople borough, males aged under 5 years and females aged under 5 years are the age groups that are most secure financially, with 100.0% of males and 100.0% of females in these age groups living above the poverty line.
| Age Bracket | Male | Female |
| Under 5 Years | 78 (100.0%) | 72 (100.0%) |
| 5 Years | 53 (100.0%) | 41 (100.0%) |
| 6 to 11 Years | 130 (85.5%) | 89 (100.0%) |
| 12 to 14 Years | 0 (0.0%) | 55 (52.4%) |
| 15 Years | 2 (100.0%) | 0 (0.0%) |
| 16 and 17 Years | 0 (0.0%) | 56 (70.9%) |
| 18 to 24 Years | 187 (100.0%) | 127 (100.0%) |
| 25 to 34 Years | 194 (100.0%) | 265 (100.0%) |
| 35 to 44 Years | 357 (100.0%) | 228 (82.6%) |
| 45 to 54 Years | 164 (100.0%) | 255 (88.8%) |
| 55 to 64 Years | 205 (100.0%) | 178 (98.9%) |
| 65 to 74 Years | 128 (100.0%) | 210 (99.1%) |
| 75 Years and over | 168 (100.0%) | 375 (94.9%) |
| Total | 1,666 (97.4%) | 1,951 (91.7%) |
Income Below Poverty Among Married-Couple Families in Zelienople borough
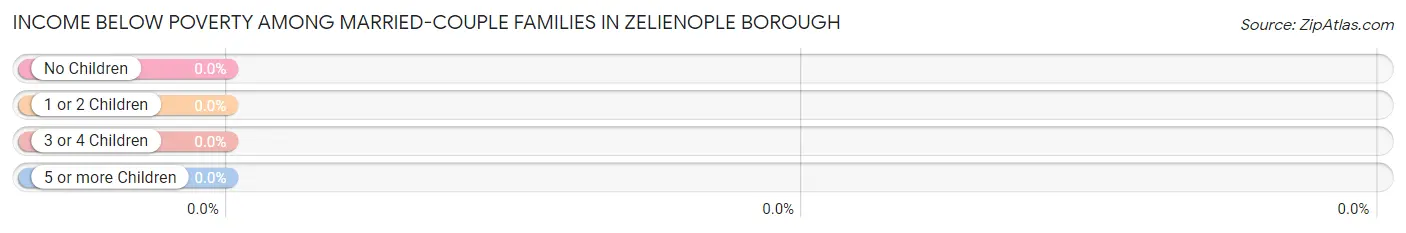
| Children | Above Poverty | Below Poverty |
| No Children | 424 (100.0%) | 0 (0.0%) |
| 1 or 2 Children | 255 (100.0%) | 0 (0.0%) |
| 3 or 4 Children | 52 (100.0%) | 0 (0.0%) |
| 5 or more Children | 0 (0.0%) | 0 (0.0%) |
| Total | 731 (100.0%) | 0 (0.0%) |
Income Below Poverty Among Single-Parent Households in Zelienople borough
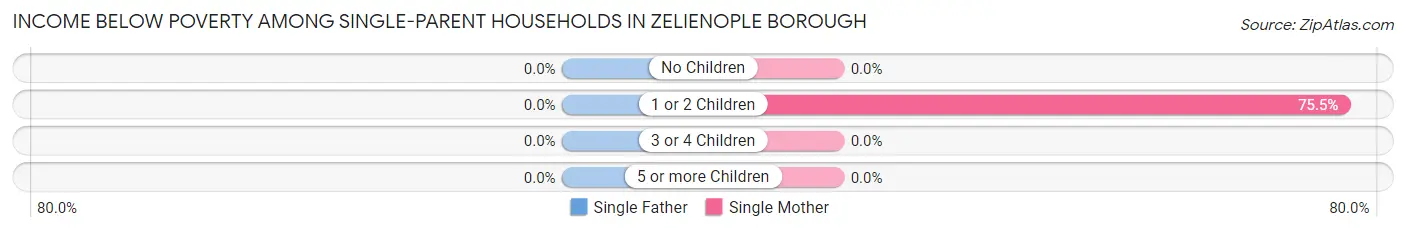
| Children | Single Father | Single Mother |
| No Children | 0 (0.0%) | 0 (0.0%) |
| 1 or 2 Children | 0 (0.0%) | 80 (75.5%) |
| 3 or 4 Children | 0 (0.0%) | 0 (0.0%) |
| 5 or more Children | 0 (0.0%) | 0 (0.0%) |
| Total | 0 (0.0%) | 80 (55.6%) |
Income Below Poverty Among Married-Couple vs Single-Parent Households in Zelienople borough
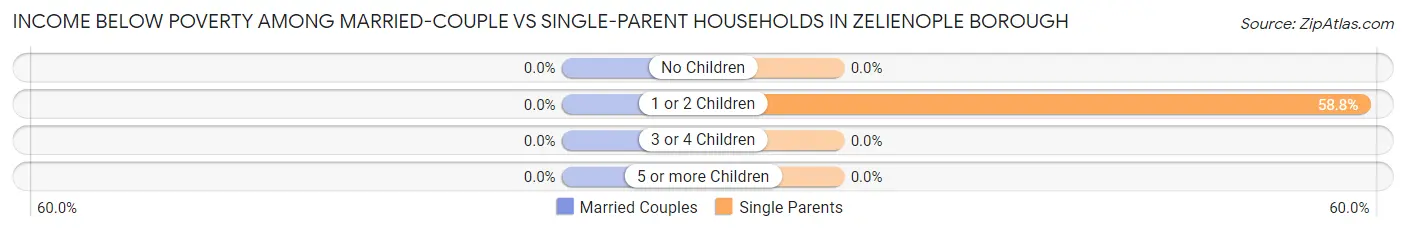
| Children | Married-Couple Families | Single-Parent Households |
| No Children | 0 (0.0%) | 0 (0.0%) |
| 1 or 2 Children | 0 (0.0%) | 80 (58.8%) |
| 3 or 4 Children | 0 (0.0%) | 0 (0.0%) |
| 5 or more Children | 0 (0.0%) | 0 (0.0%) |
| Total | 0 (0.0%) | 80 (46.0%) |
Employment Characteristics in Zelienople borough
Employment by Class of Employer in Zelienople borough
Among the 2,076 employed individuals in Zelienople borough, private company employees (1,359 | 65.5%), not-for-profit organizations (336 | 16.2%), and local government employees (201 | 9.7%) make up the most common classes of employment.
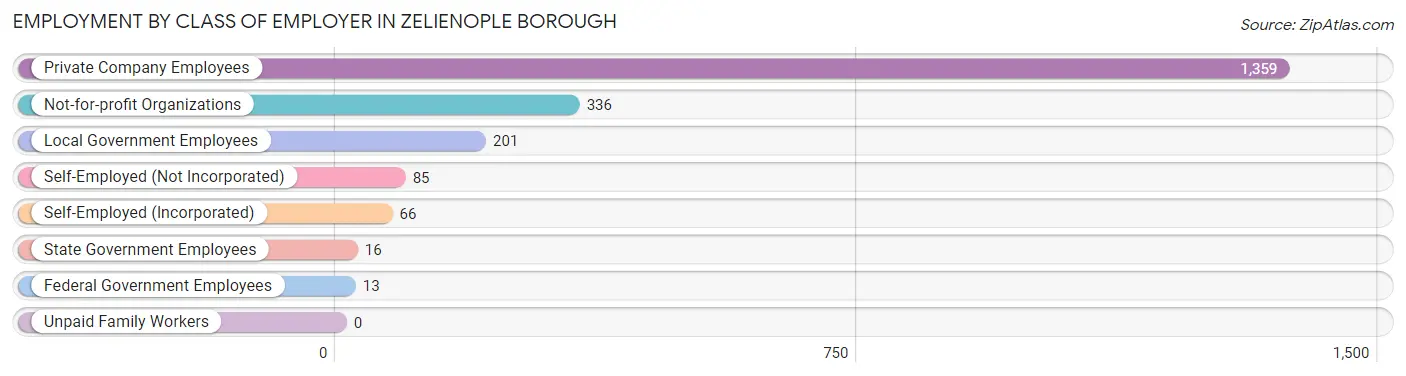
| Employer Class | # Employees | % Employees |
| Private Company Employees | 1,359 | 65.5% |
| Self-Employed (Incorporated) | 66 | 3.2% |
| Self-Employed (Not Incorporated) | 85 | 4.1% |
| Not-for-profit Organizations | 336 | 16.2% |
| Local Government Employees | 201 | 9.7% |
| State Government Employees | 16 | 0.8% |
| Federal Government Employees | 13 | 0.6% |
| Unpaid Family Workers | 0 | 0.0% |
| Total | 2,076 | 100.0% |
Employment Status by Age in Zelienople borough
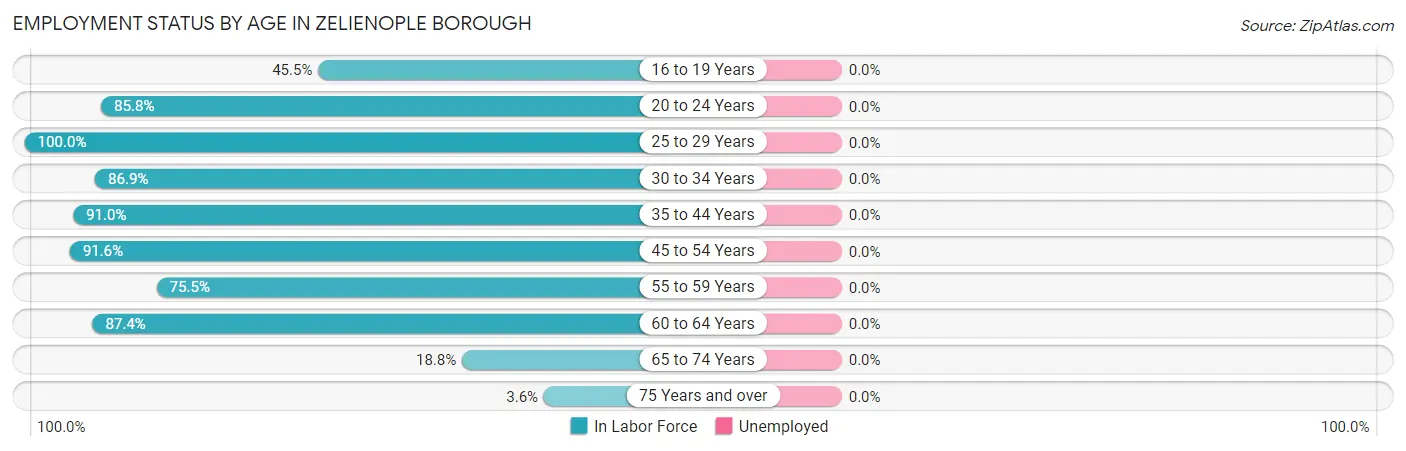
| Age Bracket | In Labor Force | Unemployed |
| 16 to 19 Years | 51 (45.5%) | 0 (0.0%) |
| 20 to 24 Years | 241 (85.8%) | 0 (0.0%) |
| 25 to 29 Years | 124 (100.0%) | 0 (0.0%) |
| 30 to 34 Years | 291 (86.9%) | 0 (0.0%) |
| 35 to 44 Years | 576 (91.0%) | 0 (0.0%) |
| 45 to 54 Years | 413 (91.6%) | 0 (0.0%) |
| 55 to 59 Years | 123 (75.5%) | 0 (0.0%) |
| 60 to 64 Years | 194 (87.4%) | 0 (0.0%) |
| 65 to 74 Years | 64 (18.8%) | 0 (0.0%) |
| 75 Years and over | 21 (3.6%) | 0 (0.0%) |
| Total | 2,100 (64.7%) | 0 (0.0%) |
Employment Status by Educational Attainment in Zelienople borough
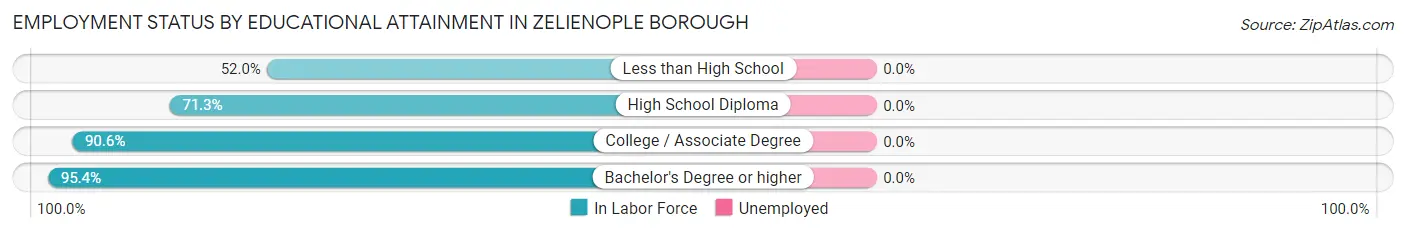
| Educational Attainment | In Labor Force | Unemployed |
| Less than High School | 26 (52.0%) | 0 (0.0%) |
| High School Diploma | 191 (71.3%) | 0 (0.0%) |
| College / Associate Degree | 610 (90.6%) | 0 (0.0%) |
| Bachelor's Degree or higher | 894 (95.4%) | 0 (0.0%) |
| Total | 1,722 (89.3%) | 0 (0.0%) |
Employment Occupations by Sex in Zelienople borough
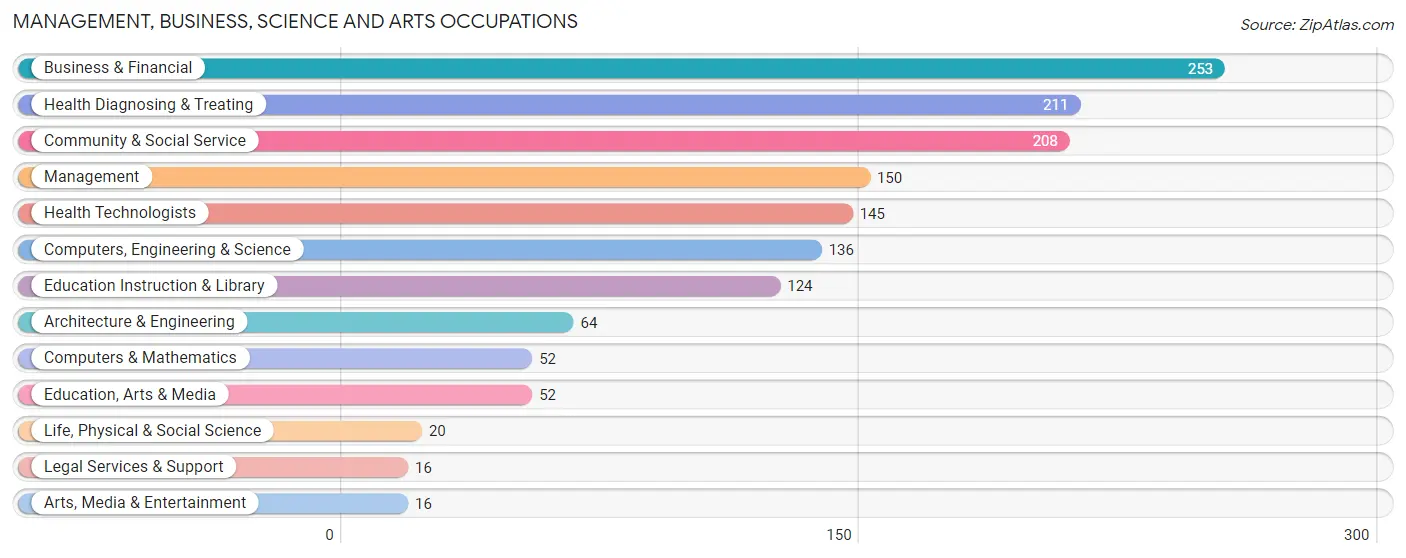
Management, Business, Science and Arts Occupations
The most common Management, Business, Science and Arts occupations in Zelienople borough are Business & Financial (253 | 12.1%), Health Diagnosing & Treating (211 | 10.1%), Community & Social Service (208 | 9.9%), Management (150 | 7.1%), and Health Technologists (145 | 6.9%).
Management, Business, Science and Arts Occupations by Sex
Within the Management, Business, Science and Arts occupations in Zelienople borough, the most male-oriented occupations are Life, Physical & Social Science (100.0%), Arts, Media & Entertainment (100.0%), and Architecture & Engineering (76.6%), while the most female-oriented occupations are Education, Arts & Media (100.0%), Legal Services & Support (100.0%), and Education Instruction & Library (100.0%).
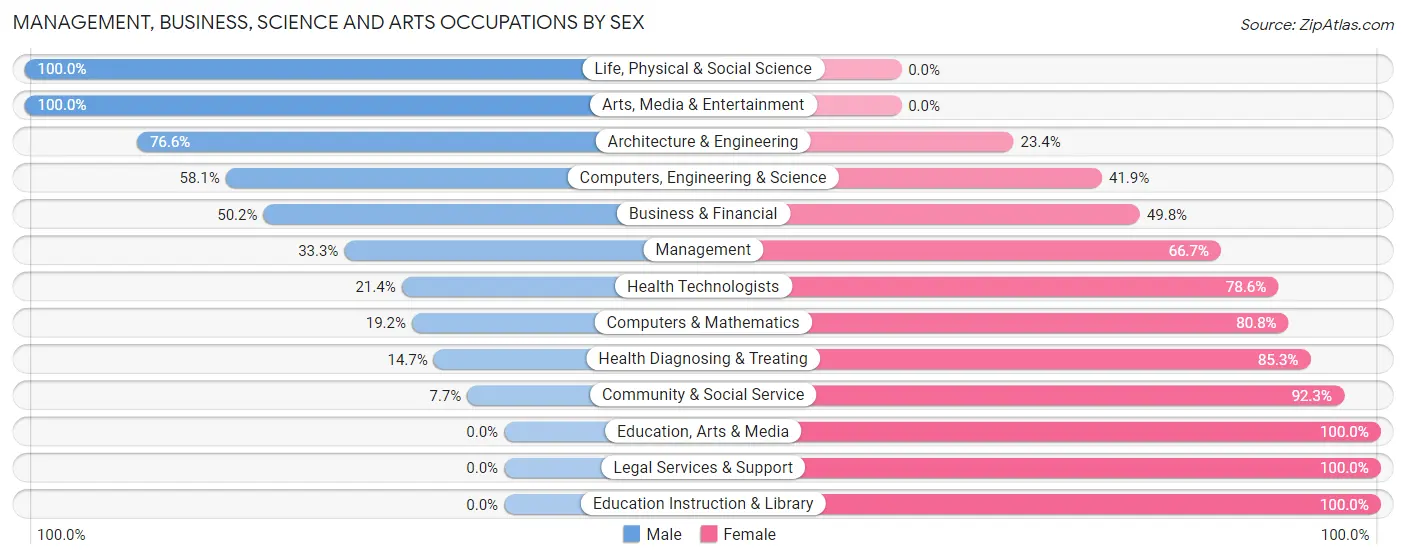
| Occupation | Male | Female |
| Management | 50 (33.3%) | 100 (66.7%) |
| Business & Financial | 127 (50.2%) | 126 (49.8%) |
| Computers, Engineering & Science | 79 (58.1%) | 57 (41.9%) |
| Computers & Mathematics | 10 (19.2%) | 42 (80.8%) |
| Architecture & Engineering | 49 (76.6%) | 15 (23.4%) |
| Life, Physical & Social Science | 20 (100.0%) | 0 (0.0%) |
| Community & Social Service | 16 (7.7%) | 192 (92.3%) |
| Education, Arts & Media | 0 (0.0%) | 52 (100.0%) |
| Legal Services & Support | 0 (0.0%) | 16 (100.0%) |
| Education Instruction & Library | 0 (0.0%) | 124 (100.0%) |
| Arts, Media & Entertainment | 16 (100.0%) | 0 (0.0%) |
| Health Diagnosing & Treating | 31 (14.7%) | 180 (85.3%) |
| Health Technologists | 31 (21.4%) | 114 (78.6%) |
| Total (Category) | 303 (31.6%) | 655 (68.4%) |
| Total (Overall) | 945 (45.0%) | 1,153 (55.0%) |
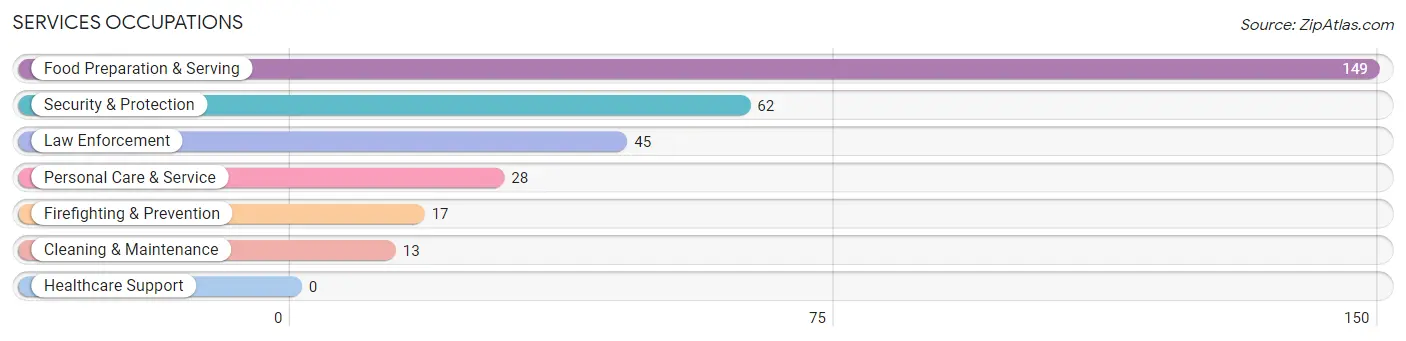
Services Occupations
The most common Services occupations in Zelienople borough are Food Preparation & Serving (149 | 7.1%), Security & Protection (62 | 3.0%), Law Enforcement (45 | 2.1%), Personal Care & Service (28 | 1.3%), and Firefighting & Prevention (17 | 0.8%).
Services Occupations by Sex
Within the Services occupations in Zelienople borough, the most male-oriented occupations are Law Enforcement (100.0%), Security & Protection (72.6%), and Food Preparation & Serving (45.0%), while the most female-oriented occupations are Firefighting & Prevention (100.0%), Cleaning & Maintenance (100.0%), and Personal Care & Service (100.0%).
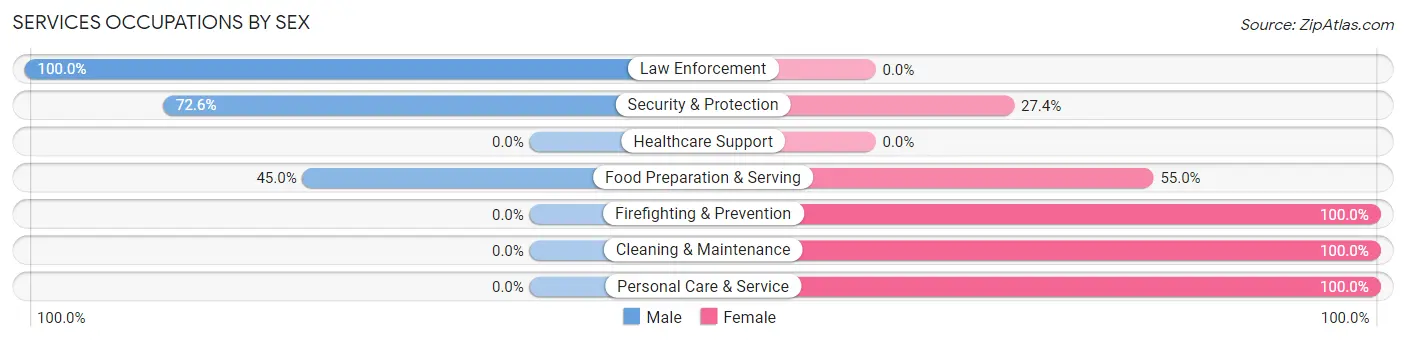
| Occupation | Male | Female |
| Healthcare Support | 0 (0.0%) | 0 (0.0%) |
| Security & Protection | 45 (72.6%) | 17 (27.4%) |
| Firefighting & Prevention | 0 (0.0%) | 17 (100.0%) |
| Law Enforcement | 45 (100.0%) | 0 (0.0%) |
| Food Preparation & Serving | 67 (45.0%) | 82 (55.0%) |
| Cleaning & Maintenance | 0 (0.0%) | 13 (100.0%) |
| Personal Care & Service | 0 (0.0%) | 28 (100.0%) |
| Total (Category) | 112 (44.4%) | 140 (55.6%) |
| Total (Overall) | 945 (45.0%) | 1,153 (55.0%) |
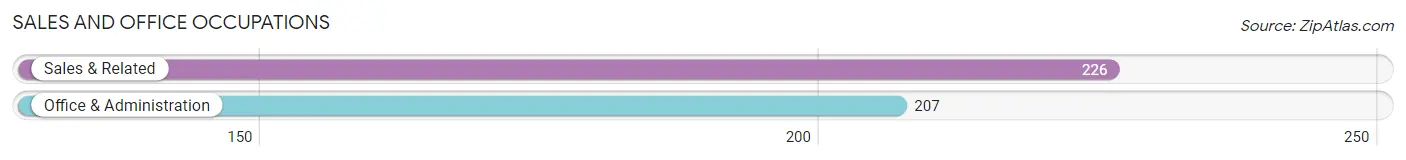
Sales and Office Occupations
The most common Sales and Office occupations in Zelienople borough are Sales & Related (226 | 10.8%), and Office & Administration (207 | 9.9%).
Sales and Office Occupations by Sex
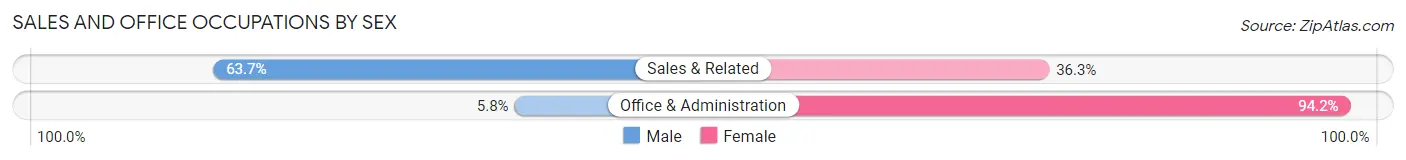
| Occupation | Male | Female |
| Sales & Related | 144 (63.7%) | 82 (36.3%) |
| Office & Administration | 12 (5.8%) | 195 (94.2%) |
| Total (Category) | 156 (36.0%) | 277 (64.0%) |
| Total (Overall) | 945 (45.0%) | 1,153 (55.0%) |
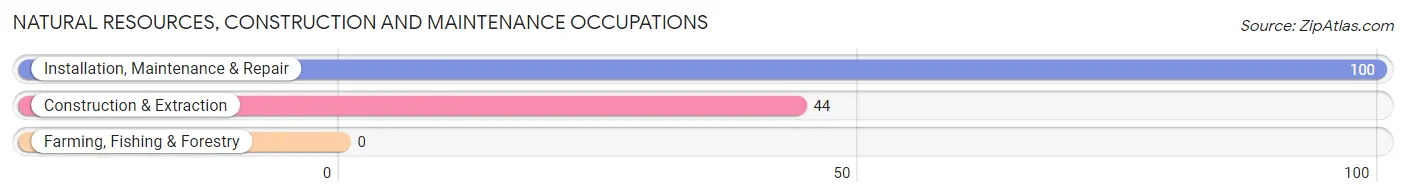
Natural Resources, Construction and Maintenance Occupations
The most common Natural Resources, Construction and Maintenance occupations in Zelienople borough are Installation, Maintenance & Repair (100 | 4.8%), and Construction & Extraction (44 | 2.1%).
Natural Resources, Construction and Maintenance Occupations by Sex
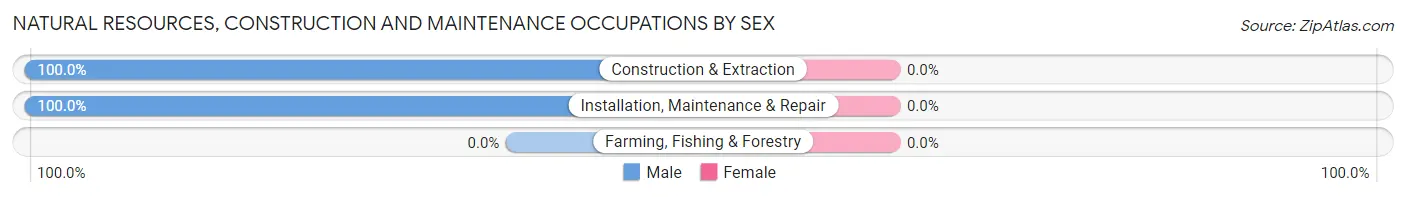
| Occupation | Male | Female |
| Farming, Fishing & Forestry | 0 (0.0%) | 0 (0.0%) |
| Construction & Extraction | 44 (100.0%) | 0 (0.0%) |
| Installation, Maintenance & Repair | 100 (100.0%) | 0 (0.0%) |
| Total (Category) | 144 (100.0%) | 0 (0.0%) |
| Total (Overall) | 945 (45.0%) | 1,153 (55.0%) |
Production, Transportation and Moving Occupations
The most common Production, Transportation and Moving occupations in Zelienople borough are Transportation (150 | 7.1%), Production (113 | 5.4%), and Material Moving (48 | 2.3%).
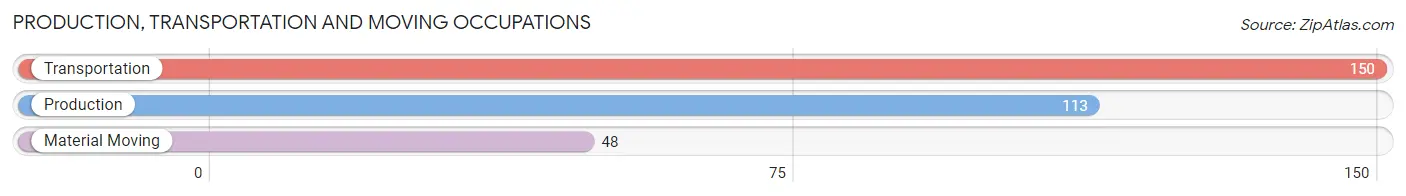
Production, Transportation and Moving Occupations by Sex
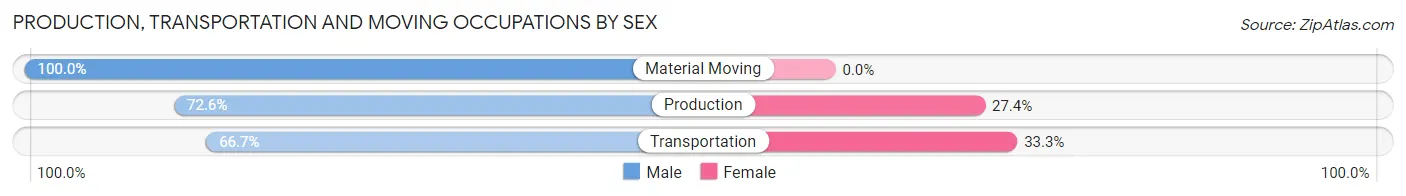
| Occupation | Male | Female |
| Production | 82 (72.6%) | 31 (27.4%) |
| Transportation | 100 (66.7%) | 50 (33.3%) |
| Material Moving | 48 (100.0%) | 0 (0.0%) |
| Total (Category) | 230 (74.0%) | 81 (26.1%) |
| Total (Overall) | 945 (45.0%) | 1,153 (55.0%) |
Employment Industries by Sex in Zelienople borough
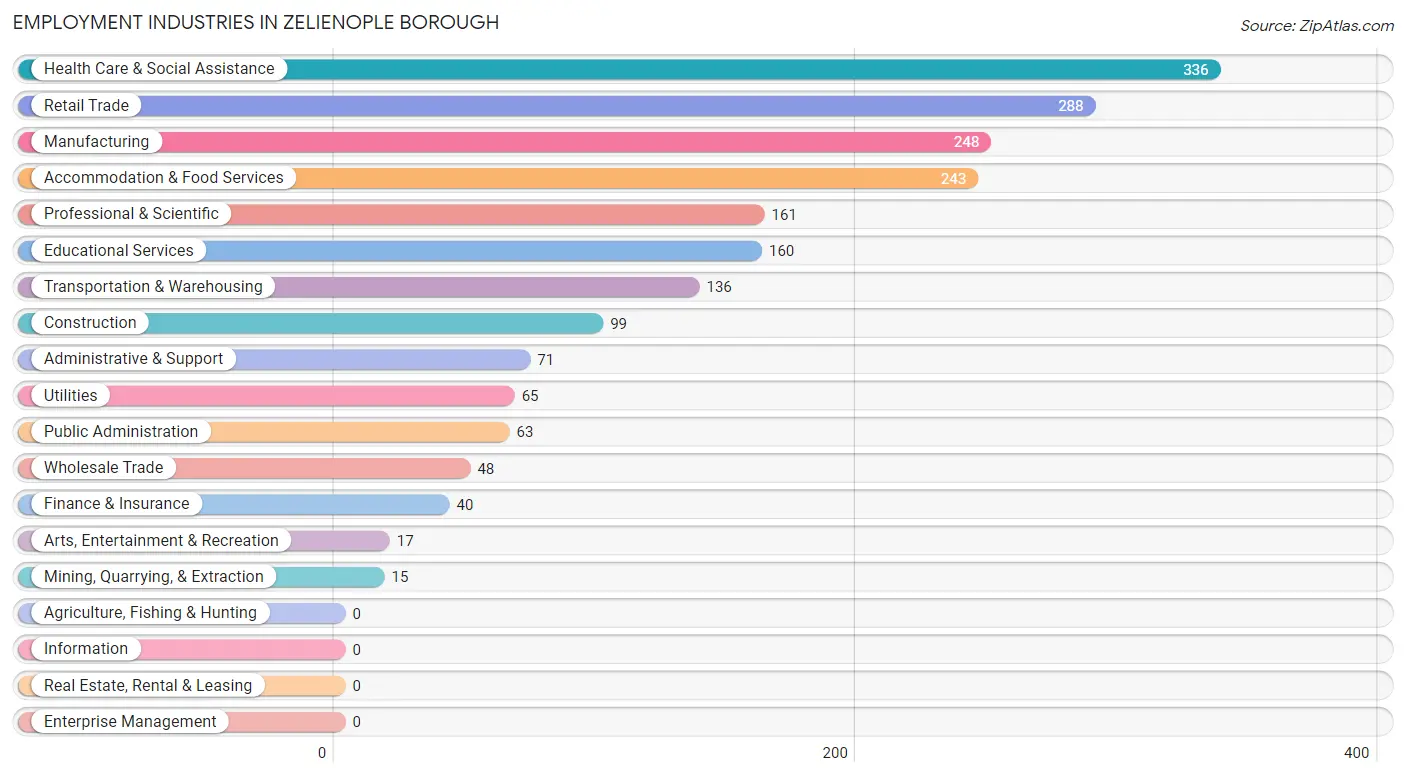
Employment Industries in Zelienople borough
The major employment industries in Zelienople borough include Health Care & Social Assistance (336 | 16.0%), Retail Trade (288 | 13.7%), Manufacturing (248 | 11.8%), Accommodation & Food Services (243 | 11.6%), and Professional & Scientific (161 | 7.7%).
Employment Industries by Sex in Zelienople borough
The Zelienople borough industries that see more men than women are Wholesale Trade (100.0%), Utilities (81.5%), and Construction (77.8%), whereas the industries that tend to have a higher number of women are Mining, Quarrying, & Extraction (100.0%), Arts, Entertainment & Recreation (100.0%), and Educational Services (90.0%).
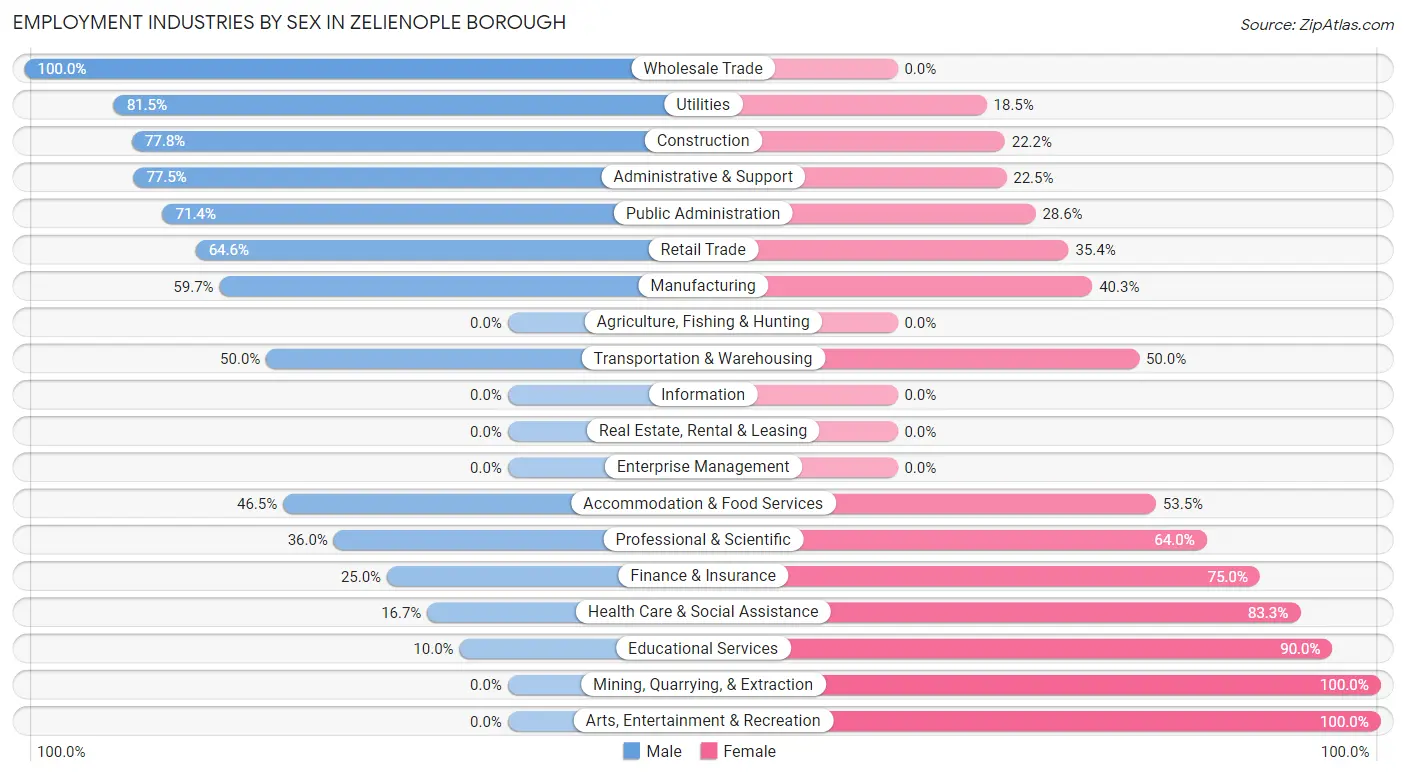
| Industry | Male | Female |
| Agriculture, Fishing & Hunting | 0 (0.0%) | 0 (0.0%) |
| Mining, Quarrying, & Extraction | 0 (0.0%) | 15 (100.0%) |
| Construction | 77 (77.8%) | 22 (22.2%) |
| Manufacturing | 148 (59.7%) | 100 (40.3%) |
| Wholesale Trade | 48 (100.0%) | 0 (0.0%) |
| Retail Trade | 186 (64.6%) | 102 (35.4%) |
| Transportation & Warehousing | 68 (50.0%) | 68 (50.0%) |
| Utilities | 53 (81.5%) | 12 (18.5%) |
| Information | 0 (0.0%) | 0 (0.0%) |
| Finance & Insurance | 10 (25.0%) | 30 (75.0%) |
| Real Estate, Rental & Leasing | 0 (0.0%) | 0 (0.0%) |
| Professional & Scientific | 58 (36.0%) | 103 (64.0%) |
| Enterprise Management | 0 (0.0%) | 0 (0.0%) |
| Administrative & Support | 55 (77.5%) | 16 (22.5%) |
| Educational Services | 16 (10.0%) | 144 (90.0%) |
| Health Care & Social Assistance | 56 (16.7%) | 280 (83.3%) |
| Arts, Entertainment & Recreation | 0 (0.0%) | 17 (100.0%) |
| Accommodation & Food Services | 113 (46.5%) | 130 (53.5%) |
| Public Administration | 45 (71.4%) | 18 (28.6%) |
| Total | 945 (45.0%) | 1,153 (55.0%) |
Education in Zelienople borough
School Enrollment in Zelienople borough
The most common levels of schooling among the 716 students in Zelienople borough are middle school (214 | 29.9%), college / undergraduate (108 | 15.1%), and high school (107 | 14.9%).
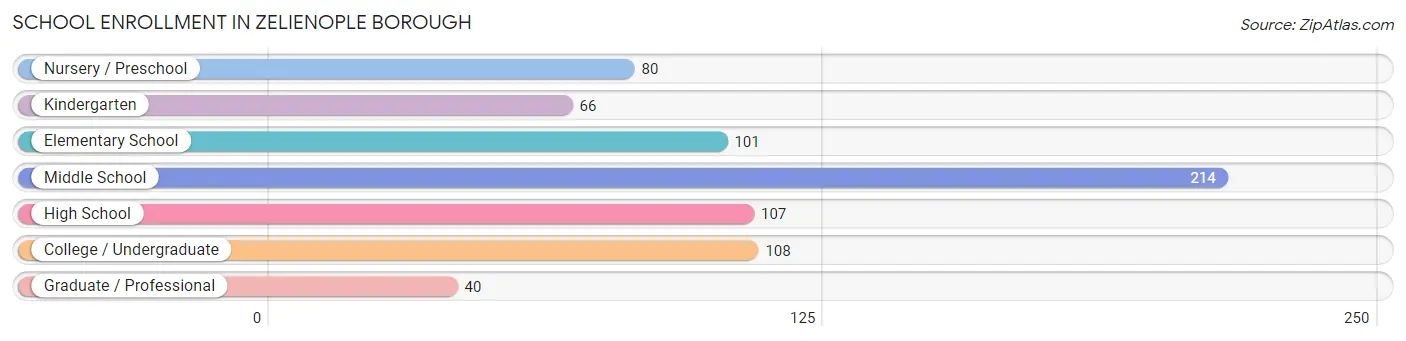
| School Level | # Students | % Students |
| Nursery / Preschool | 80 | 11.2% |
| Kindergarten | 66 | 9.2% |
| Elementary School | 101 | 14.1% |
| Middle School | 214 | 29.9% |
| High School | 107 | 14.9% |
| College / Undergraduate | 108 | 15.1% |
| Graduate / Professional | 40 | 5.6% |
| Total | 716 | 100.0% |
School Enrollment by Age by Funding Source in Zelienople borough
Out of a total of 716 students who are enrolled in schools in Zelienople borough, 133 (18.6%) attend a private institution, while the remaining 583 (81.4%) are enrolled in public schools. The age group of 3 to 4 year olds has the highest likelihood of being enrolled in private schools, with 19 (100.0% in the age bracket) enrolled. Conversely, the age group of 10 to 14 year olds has the lowest likelihood of being enrolled in a private school, with 242 (100.0% in the age bracket) attending a public institution.
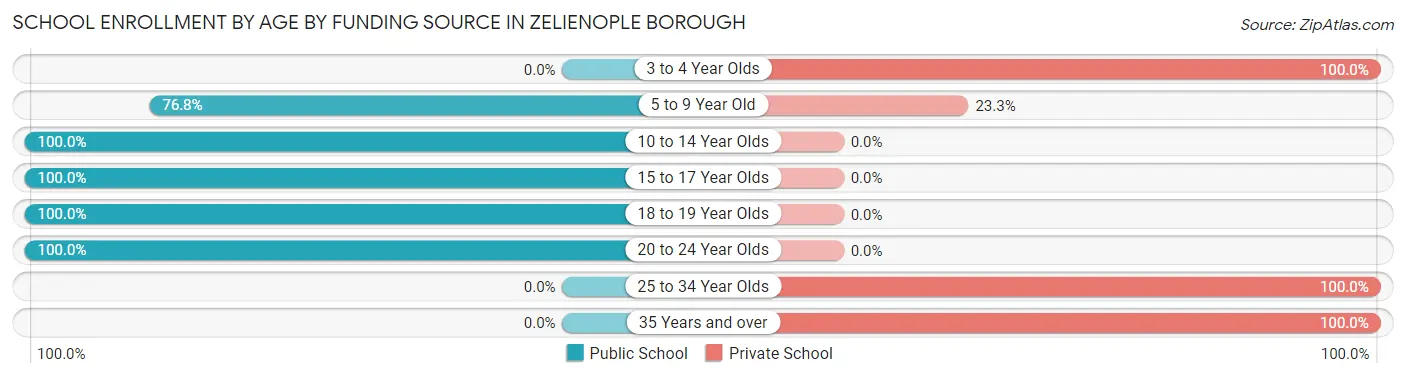
| Age Bracket | Public School | Private School |
| 3 to 4 Year Olds | 0 (0.0%) | 19 (100.0%) |
| 5 to 9 Year Old | 175 (76.7%) | 53 (23.3%) |
| 10 to 14 Year Olds | 242 (100.0%) | 0 (0.0%) |
| 15 to 17 Year Olds | 79 (100.0%) | 0 (0.0%) |
| 18 to 19 Year Olds | 32 (100.0%) | 0 (0.0%) |
| 20 to 24 Year Olds | 55 (100.0%) | 0 (0.0%) |
| 25 to 34 Year Olds | 0 (0.0%) | 48 (100.0%) |
| 35 Years and over | 0 (0.0%) | 13 (100.0%) |
| Total | 583 (81.4%) | 133 (18.6%) |
Educational Attainment by Field of Study in Zelienople borough
Business (255 | 18.0%), science & technology (218 | 15.4%), education (187 | 13.2%), engineering (161 | 11.4%), and social sciences (107 | 7.6%) are the most common fields of study among 1,414 individuals in Zelienople borough who have obtained a bachelor's degree or higher.
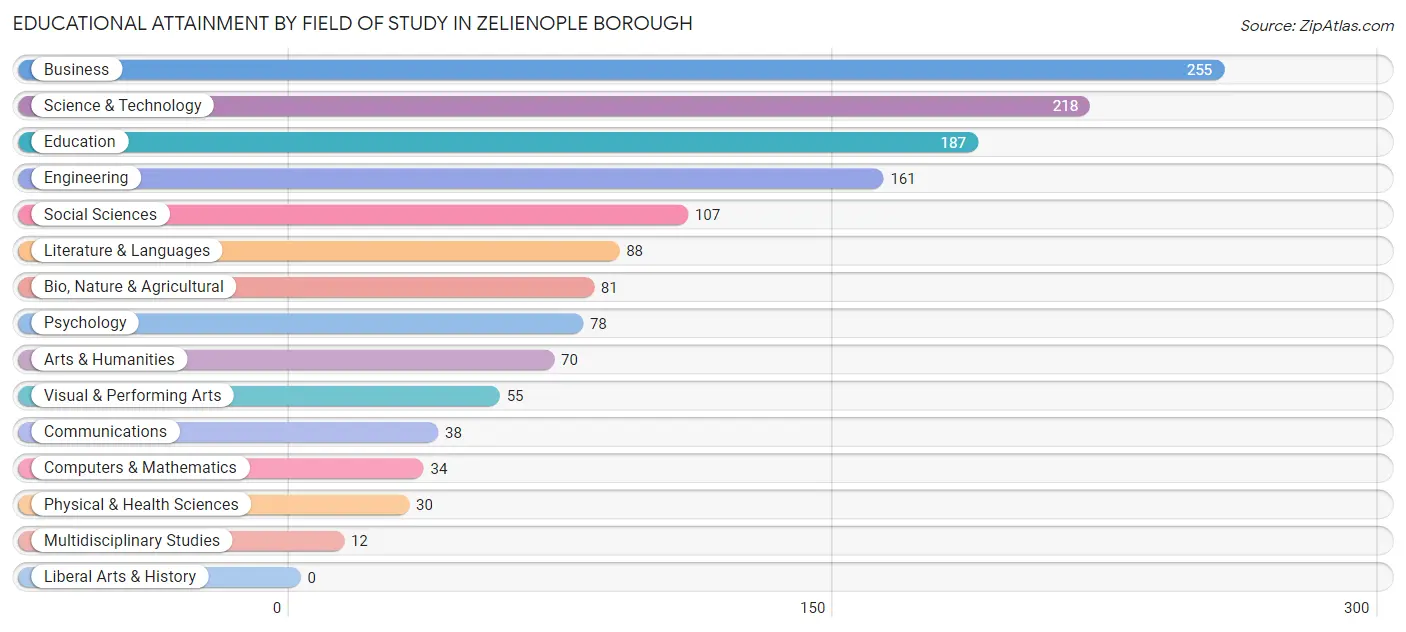
| Field of Study | # Graduates | % Graduates |
| Computers & Mathematics | 34 | 2.4% |
| Bio, Nature & Agricultural | 81 | 5.7% |
| Physical & Health Sciences | 30 | 2.1% |
| Psychology | 78 | 5.5% |
| Social Sciences | 107 | 7.6% |
| Engineering | 161 | 11.4% |
| Multidisciplinary Studies | 12 | 0.9% |
| Science & Technology | 218 | 15.4% |
| Business | 255 | 18.0% |
| Education | 187 | 13.2% |
| Literature & Languages | 88 | 6.2% |
| Liberal Arts & History | 0 | 0.0% |
| Visual & Performing Arts | 55 | 3.9% |
| Communications | 38 | 2.7% |
| Arts & Humanities | 70 | 5.0% |
| Total | 1,414 | 100.0% |
Transportation & Commute in Zelienople borough
Vehicle Availability by Sex in Zelienople borough
The most prevalent vehicle ownership categories in Zelienople borough are males with 2 vehicles (398, accounting for 43.1%) and females with 2 vehicles (465, making up 34.5%).
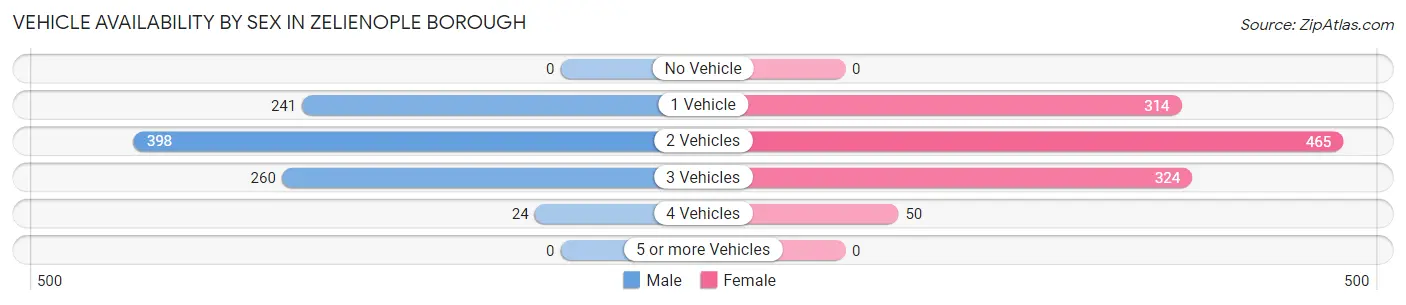
| Vehicles Available | Male | Female |
| No Vehicle | 0 (0.0%) | 0 (0.0%) |
| 1 Vehicle | 241 (26.1%) | 314 (27.2%) |
| 2 Vehicles | 398 (43.1%) | 465 (40.3%) |
| 3 Vehicles | 260 (28.2%) | 324 (28.1%) |
| 4 Vehicles | 24 (2.6%) | 50 (4.3%) |
| 5 or more Vehicles | 0 (0.0%) | 0 (0.0%) |
| Total | 923 (100.0%) | 1,153 (100.0%) |
Commute Time in Zelienople borough
The most frequently occuring commute durations in Zelienople borough are 30 to 34 minutes (300 commuters, 16.1%), 20 to 24 minutes (253 commuters, 13.6%), and 10 to 14 minutes (213 commuters, 11.4%).
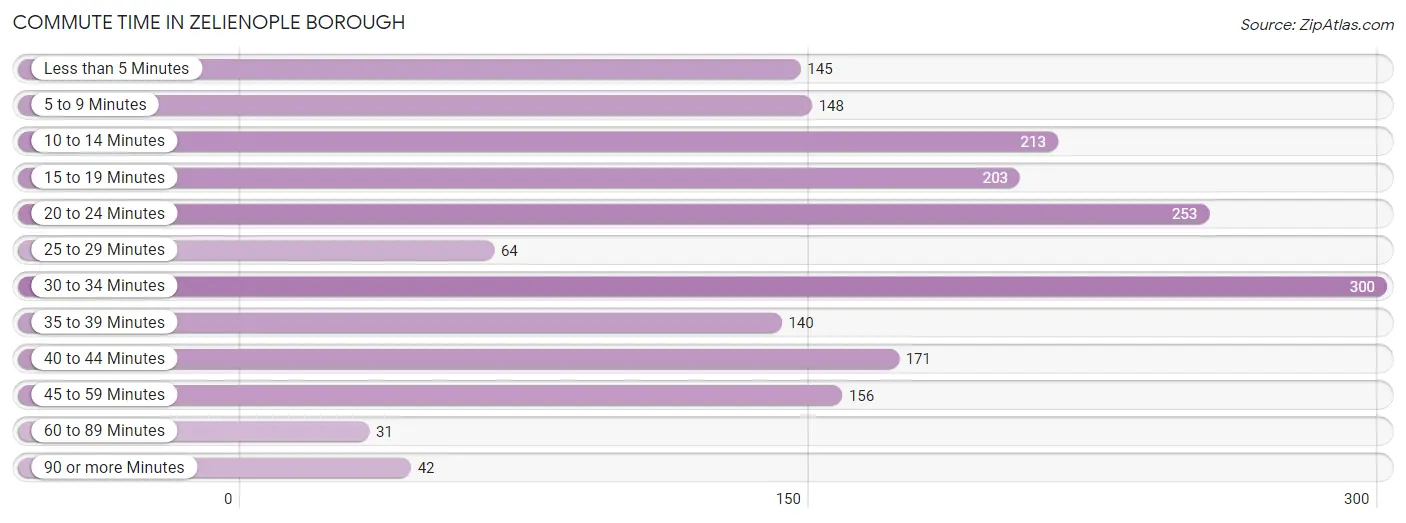
| Commute Time | # Commuters | % Commuters |
| Less than 5 Minutes | 145 | 7.8% |
| 5 to 9 Minutes | 148 | 7.9% |
| 10 to 14 Minutes | 213 | 11.4% |
| 15 to 19 Minutes | 203 | 10.9% |
| 20 to 24 Minutes | 253 | 13.6% |
| 25 to 29 Minutes | 64 | 3.4% |
| 30 to 34 Minutes | 300 | 16.1% |
| 35 to 39 Minutes | 140 | 7.5% |
| 40 to 44 Minutes | 171 | 9.2% |
| 45 to 59 Minutes | 156 | 8.4% |
| 60 to 89 Minutes | 31 | 1.7% |
| 90 or more Minutes | 42 | 2.2% |
Commute Time by Sex in Zelienople borough
The most common commute times in Zelienople borough are 30 to 34 minutes (169 commuters, 20.0%) for males and 20 to 24 minutes (202 commuters, 19.8%) for females.
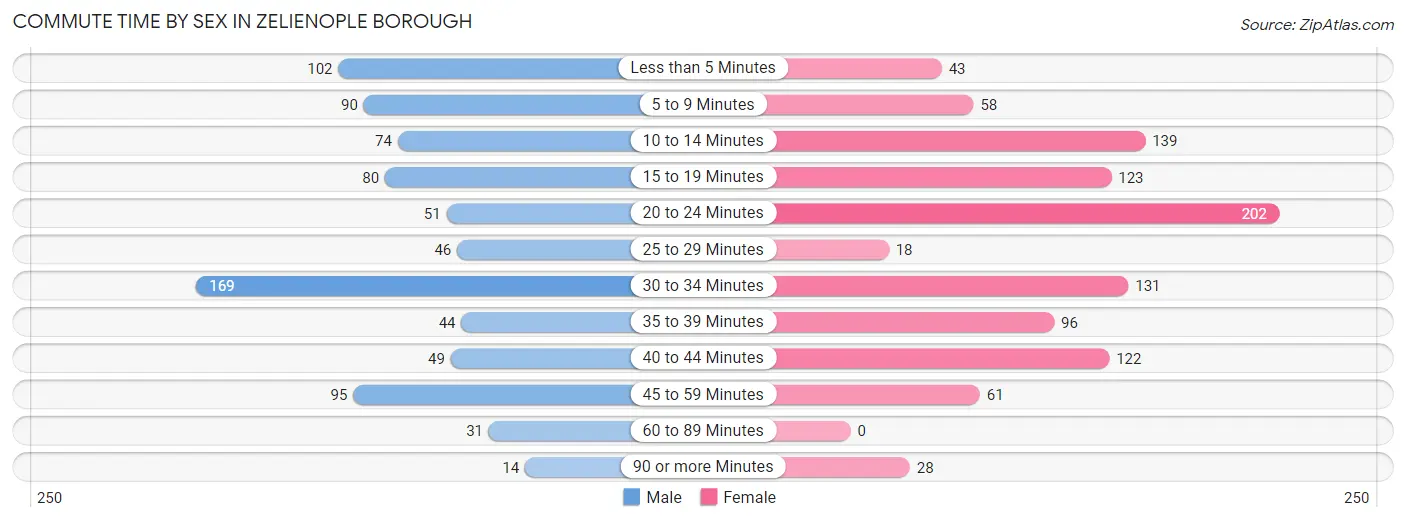
| Commute Time | Male | Female |
| Less than 5 Minutes | 102 (12.1%) | 43 (4.2%) |
| 5 to 9 Minutes | 90 (10.6%) | 58 (5.7%) |
| 10 to 14 Minutes | 74 (8.8%) | 139 (13.6%) |
| 15 to 19 Minutes | 80 (9.5%) | 123 (12.0%) |
| 20 to 24 Minutes | 51 (6.0%) | 202 (19.8%) |
| 25 to 29 Minutes | 46 (5.4%) | 18 (1.8%) |
| 30 to 34 Minutes | 169 (20.0%) | 131 (12.8%) |
| 35 to 39 Minutes | 44 (5.2%) | 96 (9.4%) |
| 40 to 44 Minutes | 49 (5.8%) | 122 (11.9%) |
| 45 to 59 Minutes | 95 (11.2%) | 61 (6.0%) |
| 60 to 89 Minutes | 31 (3.7%) | 0 (0.0%) |
| 90 or more Minutes | 14 (1.7%) | 28 (2.7%) |
Time of Departure to Work by Sex in Zelienople borough
The most frequent times of departure to work in Zelienople borough are 6:30 AM to 6:59 AM (144, 17.0%) for males and 7:30 AM to 7:59 AM (202, 19.8%) for females.
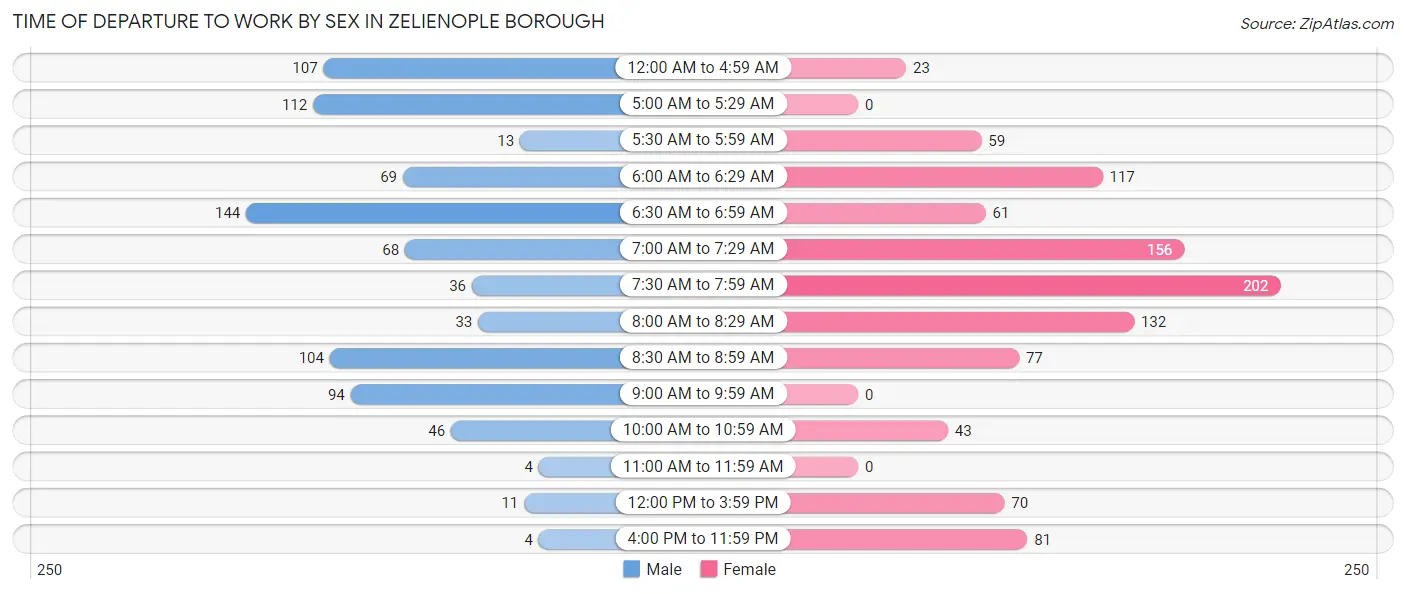
| Time of Departure | Male | Female |
| 12:00 AM to 4:59 AM | 107 (12.7%) | 23 (2.2%) |
| 5:00 AM to 5:29 AM | 112 (13.3%) | 0 (0.0%) |
| 5:30 AM to 5:59 AM | 13 (1.5%) | 59 (5.8%) |
| 6:00 AM to 6:29 AM | 69 (8.2%) | 117 (11.5%) |
| 6:30 AM to 6:59 AM | 144 (17.0%) | 61 (6.0%) |
| 7:00 AM to 7:29 AM | 68 (8.1%) | 156 (15.3%) |
| 7:30 AM to 7:59 AM | 36 (4.3%) | 202 (19.8%) |
| 8:00 AM to 8:29 AM | 33 (3.9%) | 132 (12.9%) |
| 8:30 AM to 8:59 AM | 104 (12.3%) | 77 (7.5%) |
| 9:00 AM to 9:59 AM | 94 (11.1%) | 0 (0.0%) |
| 10:00 AM to 10:59 AM | 46 (5.4%) | 43 (4.2%) |
| 11:00 AM to 11:59 AM | 4 (0.5%) | 0 (0.0%) |
| 12:00 PM to 3:59 PM | 11 (1.3%) | 70 (6.9%) |
| 4:00 PM to 11:59 PM | 4 (0.5%) | 81 (7.9%) |
| Total | 845 (100.0%) | 1,021 (100.0%) |
Housing Occupancy in Zelienople borough
Occupancy by Ownership in Zelienople borough
Of the total 1,972 dwellings in Zelienople borough, owner-occupied units account for 920 (46.7%), while renter-occupied units make up 1,052 (53.3%).
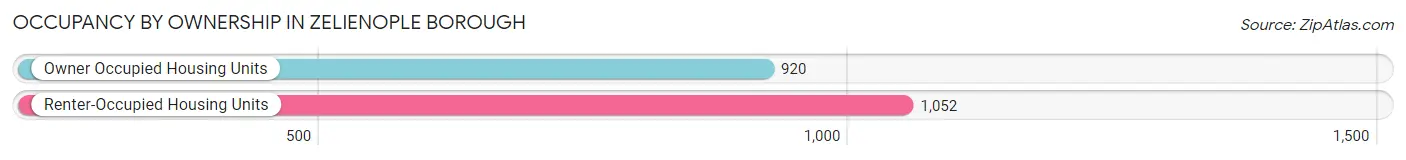
| Occupancy | # Housing Units | % Housing Units |
| Owner Occupied Housing Units | 920 | 46.7% |
| Renter-Occupied Housing Units | 1,052 | 53.3% |
| Total Occupied Housing Units | 1,972 | 100.0% |
Occupancy by Household Size in Zelienople borough
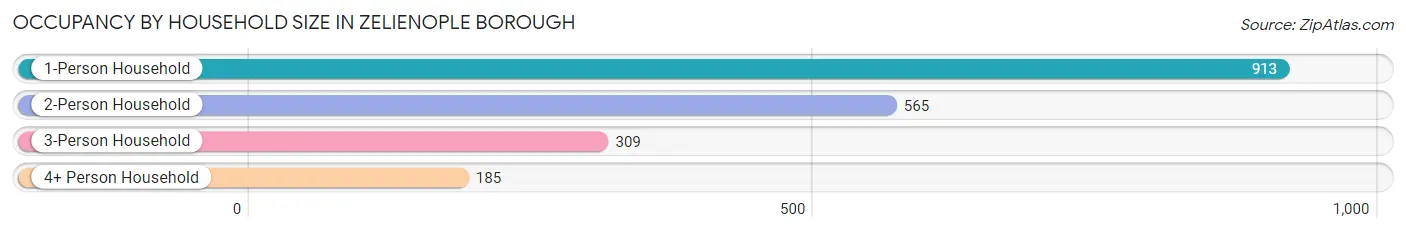
| Household Size | # Housing Units | % Housing Units |
| 1-Person Household | 913 | 46.3% |
| 2-Person Household | 565 | 28.6% |
| 3-Person Household | 309 | 15.7% |
| 4+ Person Household | 185 | 9.4% |
| Total Housing Units | 1,972 | 100.0% |
Occupancy by Ownership by Household Size in Zelienople borough
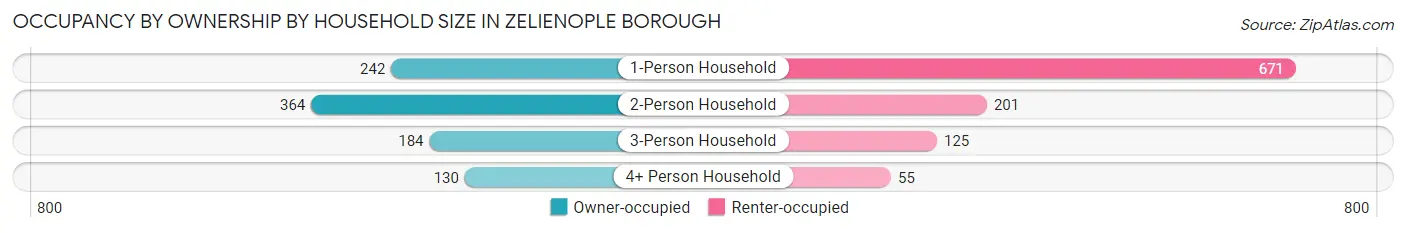
| Household Size | Owner-occupied | Renter-occupied |
| 1-Person Household | 242 (26.5%) | 671 (73.5%) |
| 2-Person Household | 364 (64.4%) | 201 (35.6%) |
| 3-Person Household | 184 (59.6%) | 125 (40.5%) |
| 4+ Person Household | 130 (70.3%) | 55 (29.7%) |
| Total Housing Units | 920 (46.7%) | 1,052 (53.3%) |
Occupancy by Educational Attainment in Zelienople borough
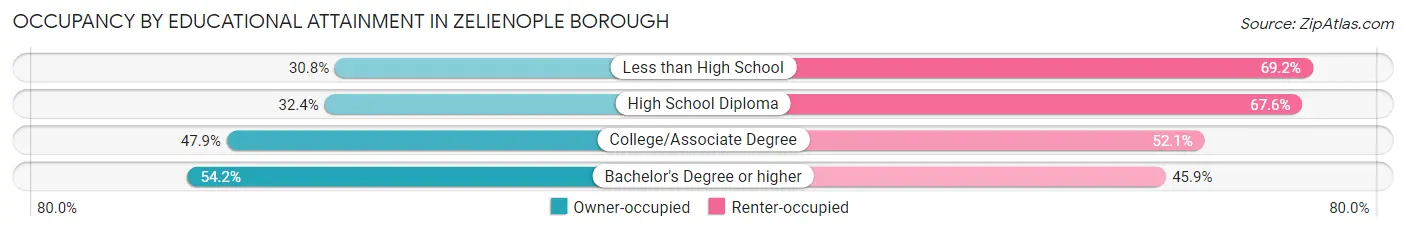
| Household Size | Owner-occupied | Renter-occupied |
| Less than High School | 20 (30.8%) | 45 (69.2%) |
| High School Diploma | 142 (32.4%) | 296 (67.6%) |
| College/Associate Degree | 288 (47.9%) | 313 (52.1%) |
| Bachelor's Degree or higher | 470 (54.1%) | 398 (45.9%) |
Occupancy by Age of Householder in Zelienople borough
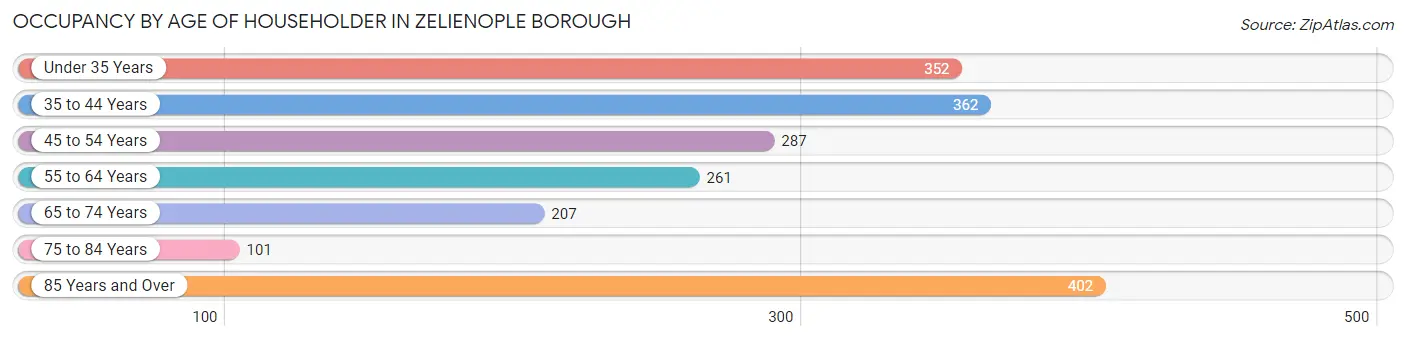
| Age Bracket | # Households | % Households |
| Under 35 Years | 352 | 17.8% |
| 35 to 44 Years | 362 | 18.4% |
| 45 to 54 Years | 287 | 14.5% |
| 55 to 64 Years | 261 | 13.2% |
| 65 to 74 Years | 207 | 10.5% |
| 75 to 84 Years | 101 | 5.1% |
| 85 Years and Over | 402 | 20.4% |
| Total | 1,972 | 100.0% |
Housing Finances in Zelienople borough
Median Income by Occupancy in Zelienople borough
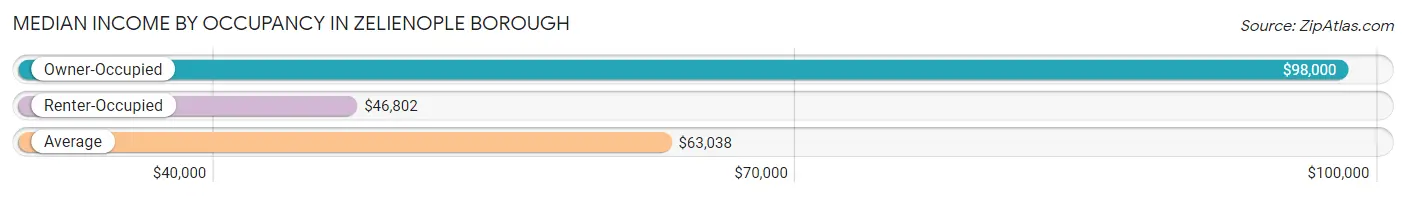
| Occupancy Type | # Households | Median Income |
| Owner-Occupied | 920 (46.7%) | $98,000 |
| Renter-Occupied | 1,052 (53.3%) | $46,802 |
| Average | 1,972 (100.0%) | $63,038 |
Occupancy by Householder Income Bracket in Zelienople borough
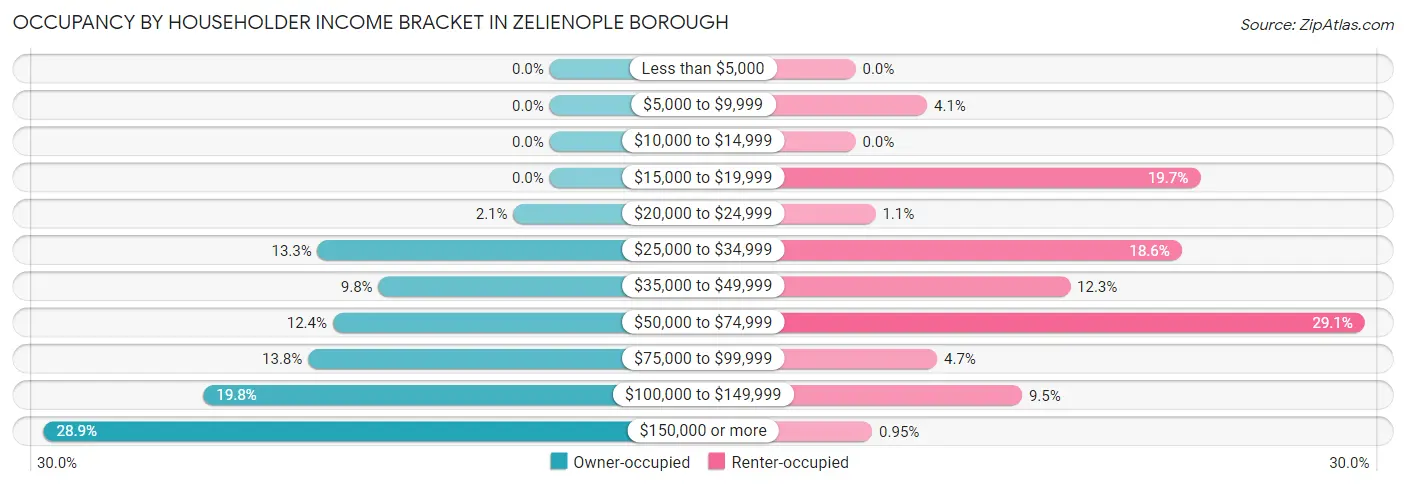
| Income Bracket | Owner-occupied | Renter-occupied |
| Less than $5,000 | 0 (0.0%) | 0 (0.0%) |
| $5,000 to $9,999 | 0 (0.0%) | 43 (4.1%) |
| $10,000 to $14,999 | 0 (0.0%) | 0 (0.0%) |
| $15,000 to $19,999 | 0 (0.0%) | 207 (19.7%) |
| $20,000 to $24,999 | 19 (2.1%) | 12 (1.1%) |
| $25,000 to $34,999 | 122 (13.3%) | 196 (18.6%) |
| $35,000 to $49,999 | 90 (9.8%) | 129 (12.3%) |
| $50,000 to $74,999 | 114 (12.4%) | 306 (29.1%) |
| $75,000 to $99,999 | 127 (13.8%) | 49 (4.7%) |
| $100,000 to $149,999 | 182 (19.8%) | 100 (9.5%) |
| $150,000 or more | 266 (28.9%) | 10 (0.9%) |
| Total | 920 (100.0%) | 1,052 (100.0%) |
Monthly Housing Cost Tiers in Zelienople borough
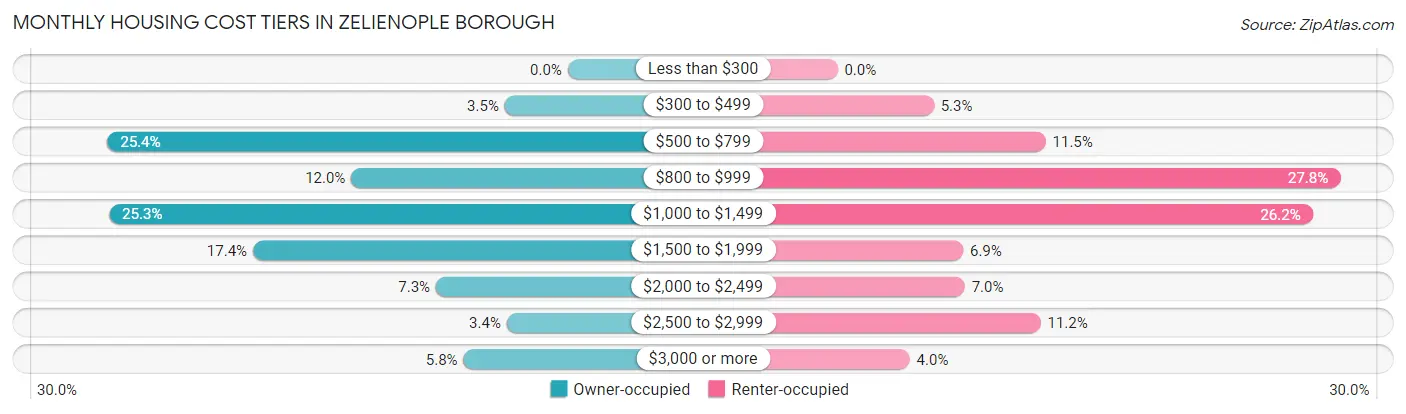
| Monthly Cost | Owner-occupied | Renter-occupied |
| Less than $300 | 0 (0.0%) | 0 (0.0%) |
| $300 to $499 | 32 (3.5%) | 56 (5.3%) |
| $500 to $799 | 234 (25.4%) | 121 (11.5%) |
| $800 to $999 | 110 (12.0%) | 292 (27.8%) |
| $1,000 to $1,499 | 233 (25.3%) | 276 (26.2%) |
| $1,500 to $1,999 | 160 (17.4%) | 73 (6.9%) |
| $2,000 to $2,499 | 67 (7.3%) | 74 (7.0%) |
| $2,500 to $2,999 | 31 (3.4%) | 118 (11.2%) |
| $3,000 or more | 53 (5.8%) | 42 (4.0%) |
| Total | 920 (100.0%) | 1,052 (100.0%) |
Physical Housing Characteristics in Zelienople borough
Housing Structures in Zelienople borough
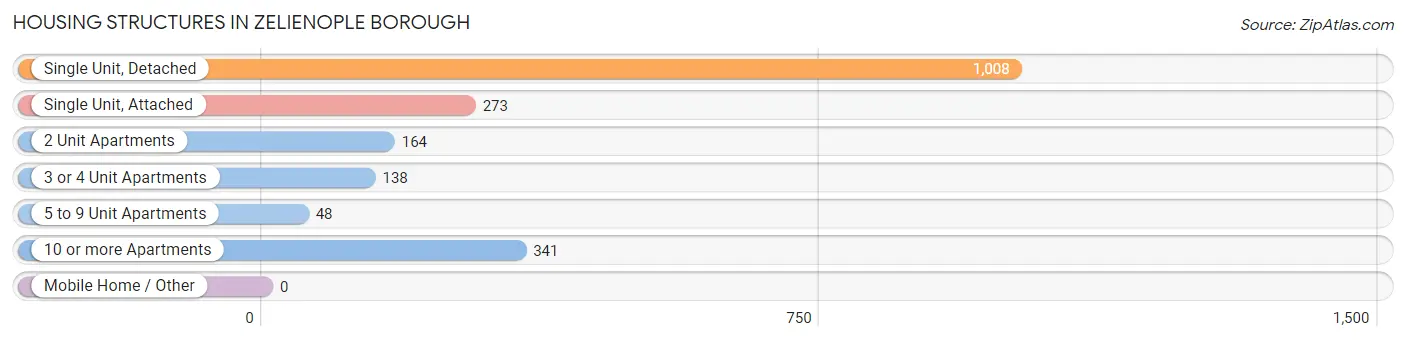
| Structure Type | # Housing Units | % Housing Units |
| Single Unit, Detached | 1,008 | 51.1% |
| Single Unit, Attached | 273 | 13.8% |
| 2 Unit Apartments | 164 | 8.3% |
| 3 or 4 Unit Apartments | 138 | 7.0% |
| 5 to 9 Unit Apartments | 48 | 2.4% |
| 10 or more Apartments | 341 | 17.3% |
| Mobile Home / Other | 0 | 0.0% |
| Total | 1,972 | 100.0% |
Housing Structures by Occupancy in Zelienople borough
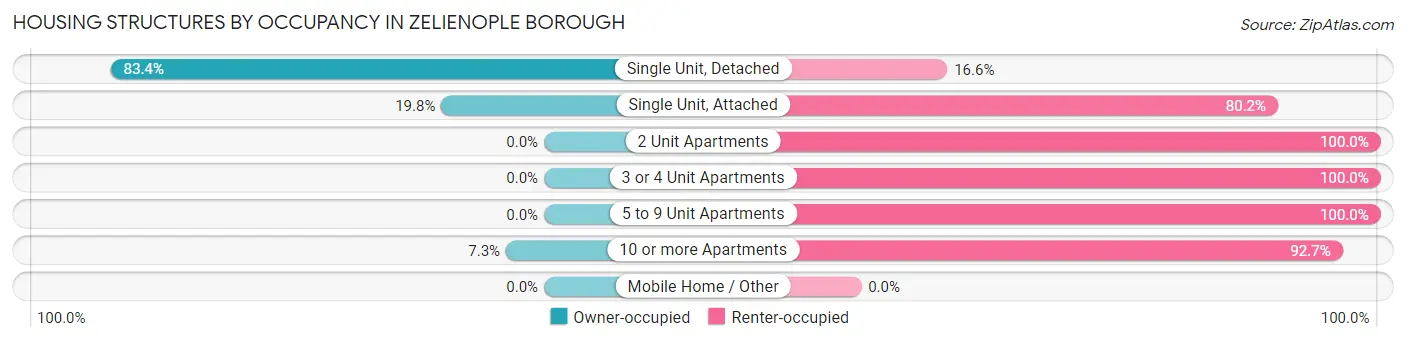
| Structure Type | Owner-occupied | Renter-occupied |
| Single Unit, Detached | 841 (83.4%) | 167 (16.6%) |
| Single Unit, Attached | 54 (19.8%) | 219 (80.2%) |
| 2 Unit Apartments | 0 (0.0%) | 164 (100.0%) |
| 3 or 4 Unit Apartments | 0 (0.0%) | 138 (100.0%) |
| 5 to 9 Unit Apartments | 0 (0.0%) | 48 (100.0%) |
| 10 or more Apartments | 25 (7.3%) | 316 (92.7%) |
| Mobile Home / Other | 0 (0.0%) | 0 (0.0%) |
| Total | 920 (46.7%) | 1,052 (53.3%) |
Housing Structures by Number of Rooms in Zelienople borough
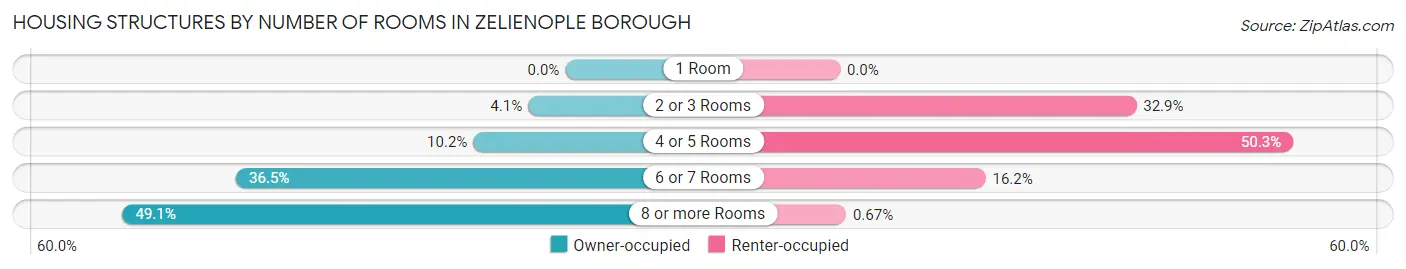
| Number of Rooms | Owner-occupied | Renter-occupied |
| 1 Room | 0 (0.0%) | 0 (0.0%) |
| 2 or 3 Rooms | 38 (4.1%) | 346 (32.9%) |
| 4 or 5 Rooms | 94 (10.2%) | 529 (50.3%) |
| 6 or 7 Rooms | 336 (36.5%) | 170 (16.2%) |
| 8 or more Rooms | 452 (49.1%) | 7 (0.7%) |
| Total | 920 (100.0%) | 1,052 (100.0%) |
Housing Structure by Heating Type in Zelienople borough
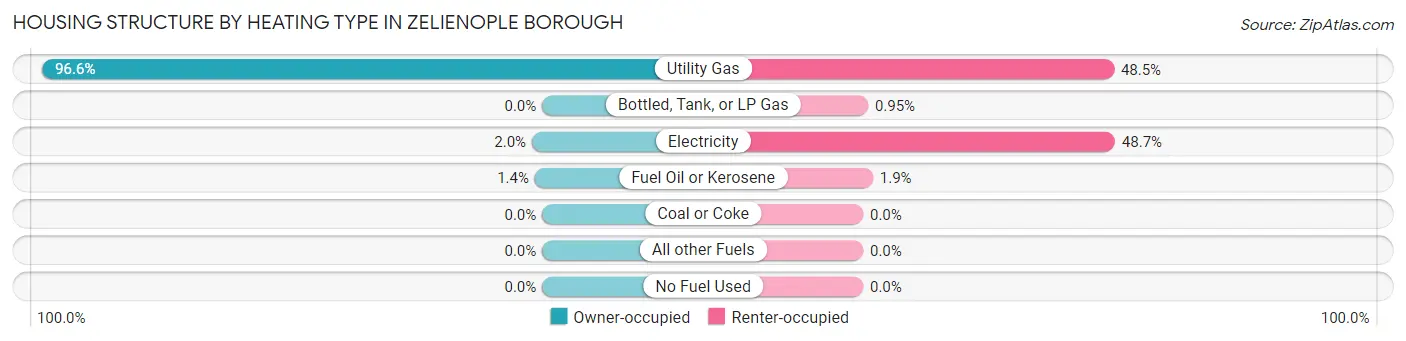
| Heating Type | Owner-occupied | Renter-occupied |
| Utility Gas | 889 (96.6%) | 510 (48.5%) |
| Bottled, Tank, or LP Gas | 0 (0.0%) | 10 (0.9%) |
| Electricity | 18 (2.0%) | 512 (48.7%) |
| Fuel Oil or Kerosene | 13 (1.4%) | 20 (1.9%) |
| Coal or Coke | 0 (0.0%) | 0 (0.0%) |
| All other Fuels | 0 (0.0%) | 0 (0.0%) |
| No Fuel Used | 0 (0.0%) | 0 (0.0%) |
| Total | 920 (100.0%) | 1,052 (100.0%) |
Household Vehicle Usage in Zelienople borough
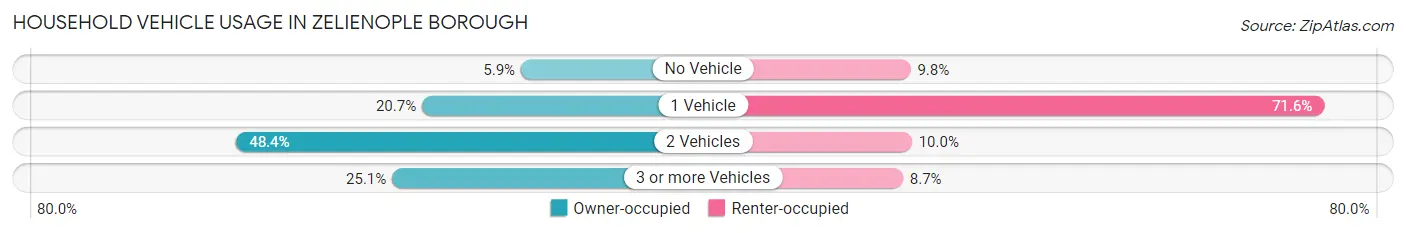
| Vehicles per Household | Owner-occupied | Renter-occupied |
| No Vehicle | 54 (5.9%) | 103 (9.8%) |
| 1 Vehicle | 190 (20.6%) | 753 (71.6%) |
| 2 Vehicles | 445 (48.4%) | 105 (10.0%) |
| 3 or more Vehicles | 231 (25.1%) | 91 (8.6%) |
| Total | 920 (100.0%) | 1,052 (100.0%) |
Real Estate & Mortgages in Zelienople borough
Real Estate and Mortgage Overview in Zelienople borough
| Characteristic | Without Mortgage | With Mortgage |
| Housing Units | 355 | 565 |
| Median Property Value | $266,200 | $242,100 |
| Median Household Income | $84,712 | $207 |
| Monthly Housing Costs | $662 | $53 |
| Real Estate Taxes | $3,399 | $16 |
Property Value by Mortgage Status in Zelienople borough
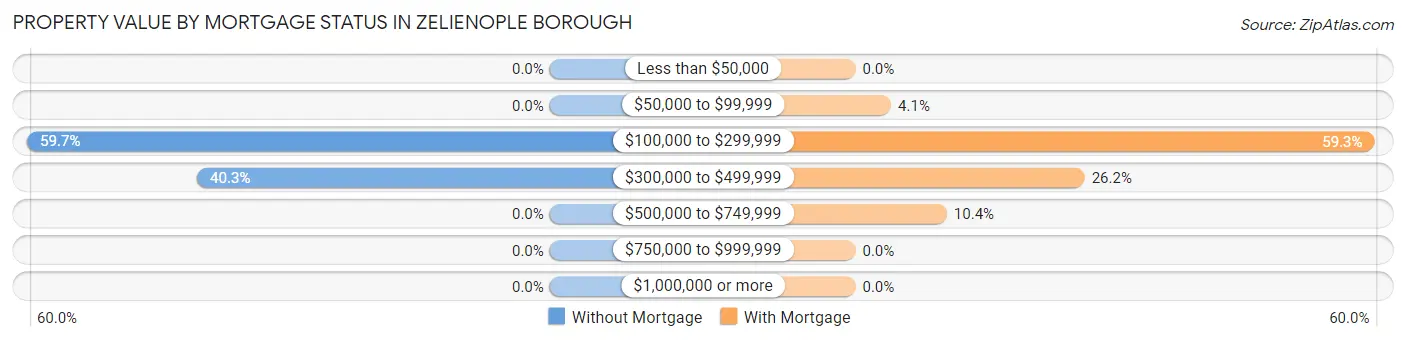
| Property Value | Without Mortgage | With Mortgage |
| Less than $50,000 | 0 (0.0%) | 0 (0.0%) |
| $50,000 to $99,999 | 0 (0.0%) | 23 (4.1%) |
| $100,000 to $299,999 | 212 (59.7%) | 335 (59.3%) |
| $300,000 to $499,999 | 143 (40.3%) | 148 (26.2%) |
| $500,000 to $749,999 | 0 (0.0%) | 59 (10.4%) |
| $750,000 to $999,999 | 0 (0.0%) | 0 (0.0%) |
| $1,000,000 or more | 0 (0.0%) | 0 (0.0%) |
| Total | 355 (100.0%) | 565 (100.0%) |
Household Income by Mortgage Status in Zelienople borough
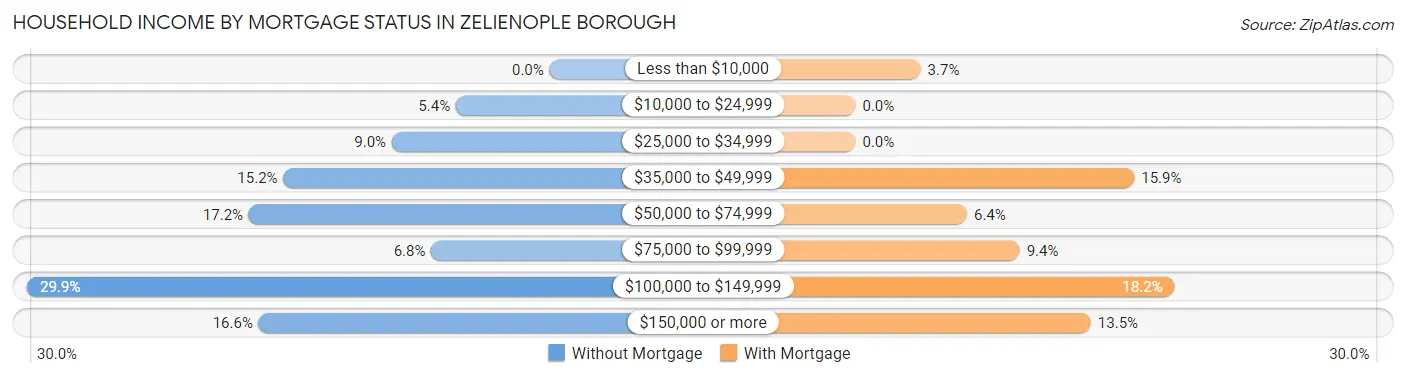
| Household Income | Without Mortgage | With Mortgage |
| Less than $10,000 | 0 (0.0%) | 21 (3.7%) |
| $10,000 to $24,999 | 19 (5.3%) | 0 (0.0%) |
| $25,000 to $34,999 | 32 (9.0%) | 0 (0.0%) |
| $35,000 to $49,999 | 54 (15.2%) | 90 (15.9%) |
| $50,000 to $74,999 | 61 (17.2%) | 36 (6.4%) |
| $75,000 to $99,999 | 24 (6.8%) | 53 (9.4%) |
| $100,000 to $149,999 | 106 (29.9%) | 103 (18.2%) |
| $150,000 or more | 59 (16.6%) | 76 (13.5%) |
| Total | 355 (100.0%) | 565 (100.0%) |
Property Value to Household Income Ratio in Zelienople borough
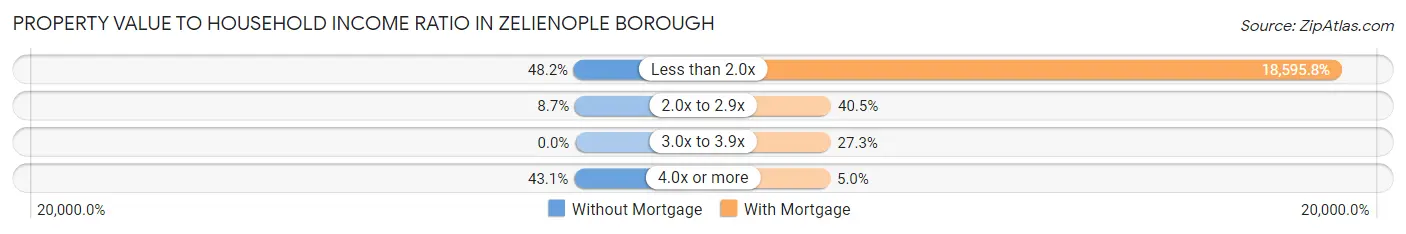
| Value-to-Income Ratio | Without Mortgage | With Mortgage |
| Less than 2.0x | 171 (48.2%) | 105,066 (18,595.8%) |
| 2.0x to 2.9x | 31 (8.7%) | 229 (40.5%) |
| 3.0x to 3.9x | 0 (0.0%) | 154 (27.3%) |
| 4.0x or more | 153 (43.1%) | 28 (5.0%) |
| Total | 355 (100.0%) | 565 (100.0%) |
Real Estate Taxes by Mortgage Status in Zelienople borough
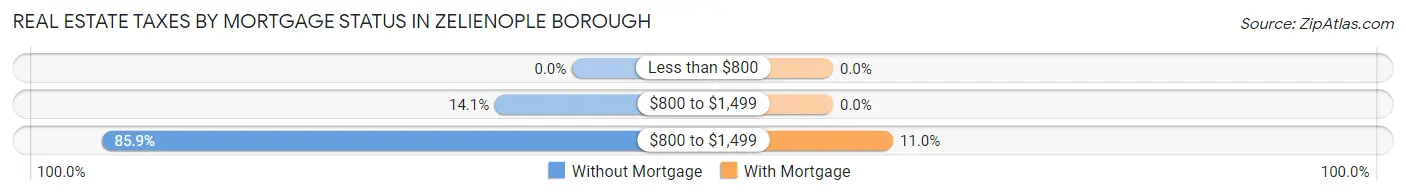
| Property Taxes | Without Mortgage | With Mortgage |
| Less than $800 | 0 (0.0%) | 0 (0.0%) |
| $800 to $1,499 | 50 (14.1%) | 0 (0.0%) |
| $800 to $1,499 | 305 (85.9%) | 62 (11.0%) |
| Total | 355 (100.0%) | 565 (100.0%) |
Health & Disability in Zelienople borough
Health Insurance Coverage by Age in Zelienople borough
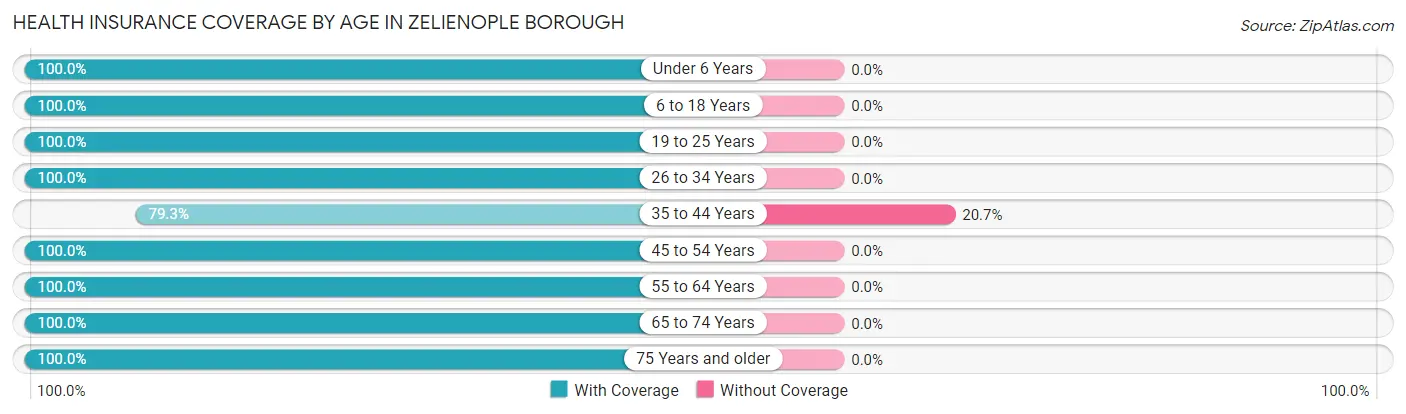
| Age Bracket | With Coverage | Without Coverage |
| Under 6 Years | 244 (100.0%) | 0 (0.0%) |
| 6 to 18 Years | 461 (100.0%) | 0 (0.0%) |
| 19 to 25 Years | 347 (100.0%) | 0 (0.0%) |
| 26 to 34 Years | 425 (100.0%) | 0 (0.0%) |
| 35 to 44 Years | 502 (79.3%) | 131 (20.7%) |
| 45 to 54 Years | 451 (100.0%) | 0 (0.0%) |
| 55 to 64 Years | 385 (100.0%) | 0 (0.0%) |
| 65 to 74 Years | 340 (100.0%) | 0 (0.0%) |
| 75 Years and older | 563 (100.0%) | 0 (0.0%) |
| Total | 3,718 (96.6%) | 131 (3.4%) |
Health Insurance Coverage by Citizenship Status in Zelienople borough
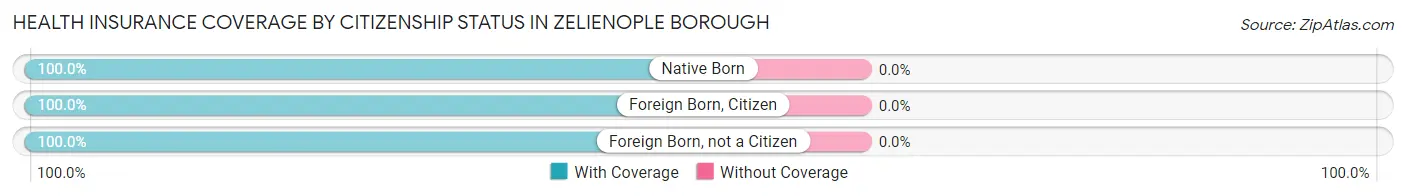
| Citizenship Status | With Coverage | Without Coverage |
| Native Born | 244 (100.0%) | 0 (0.0%) |
| Foreign Born, Citizen | 461 (100.0%) | 0 (0.0%) |
| Foreign Born, not a Citizen | 347 (100.0%) | 0 (0.0%) |
Health Insurance Coverage by Household Income in Zelienople borough
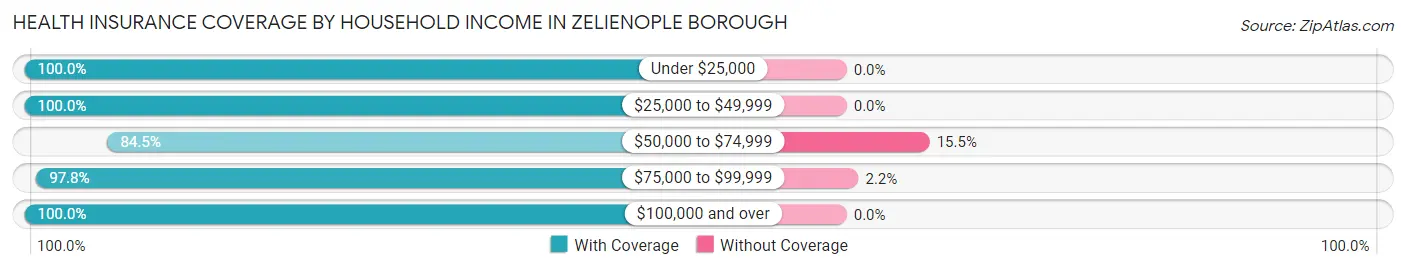
| Household Income | With Coverage | Without Coverage |
| Under $25,000 | 399 (100.0%) | 0 (0.0%) |
| $25,000 to $49,999 | 647 (100.0%) | 0 (0.0%) |
| $50,000 to $74,999 | 663 (84.5%) | 122 (15.5%) |
| $75,000 to $99,999 | 401 (97.8%) | 9 (2.2%) |
| $100,000 and over | 1,601 (100.0%) | 0 (0.0%) |
Public vs Private Health Insurance Coverage by Age in Zelienople borough
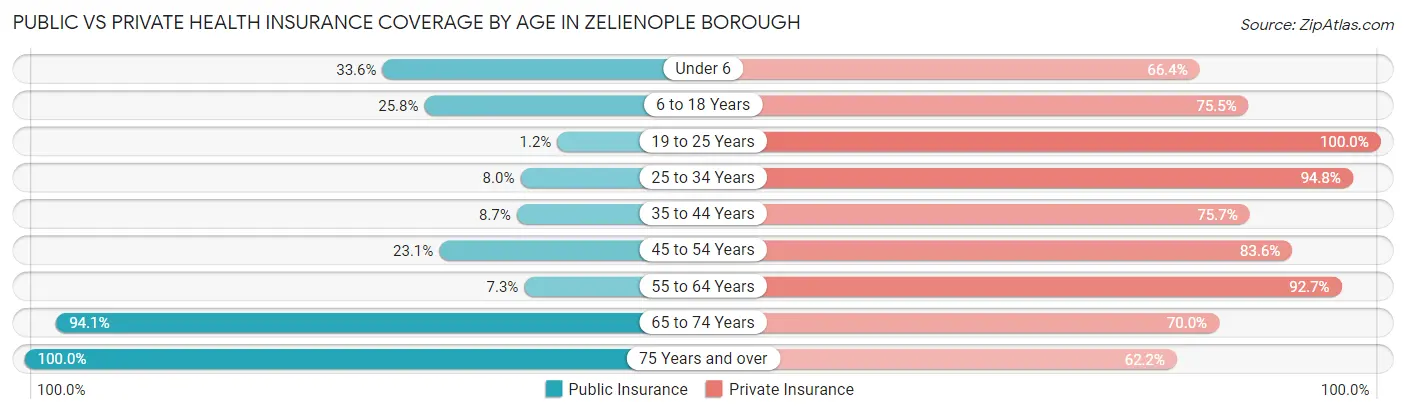
| Age Bracket | Public Insurance | Private Insurance |
| Under 6 | 82 (33.6%) | 162 (66.4%) |
| 6 to 18 Years | 119 (25.8%) | 348 (75.5%) |
| 19 to 25 Years | 4 (1.1%) | 347 (100.0%) |
| 25 to 34 Years | 34 (8.0%) | 403 (94.8%) |
| 35 to 44 Years | 55 (8.7%) | 479 (75.7%) |
| 45 to 54 Years | 104 (23.1%) | 377 (83.6%) |
| 55 to 64 Years | 28 (7.3%) | 357 (92.7%) |
| 65 to 74 Years | 320 (94.1%) | 238 (70.0%) |
| 75 Years and over | 563 (100.0%) | 350 (62.2%) |
| Total | 1,309 (34.0%) | 3,061 (79.5%) |
Disability Status by Sex by Age in Zelienople borough
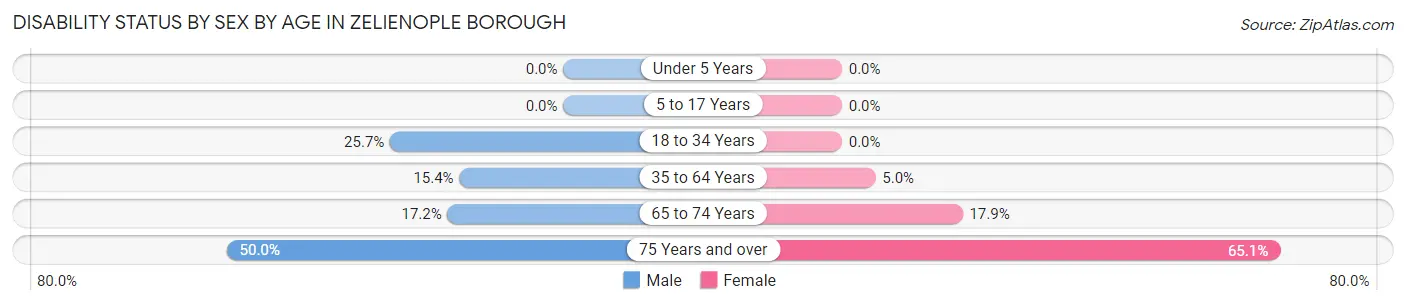
| Age Bracket | Male | Female |
| Under 5 Years | 0 (0.0%) | 0 (0.0%) |
| 5 to 17 Years | 0 (0.0%) | 0 (0.0%) |
| 18 to 34 Years | 98 (25.7%) | 0 (0.0%) |
| 35 to 64 Years | 112 (15.4%) | 37 (5.0%) |
| 65 to 74 Years | 22 (17.2%) | 38 (17.9%) |
| 75 Years and over | 84 (50.0%) | 257 (65.1%) |
Disability Class by Sex by Age in Zelienople borough
Disability Class: Hearing Difficulty
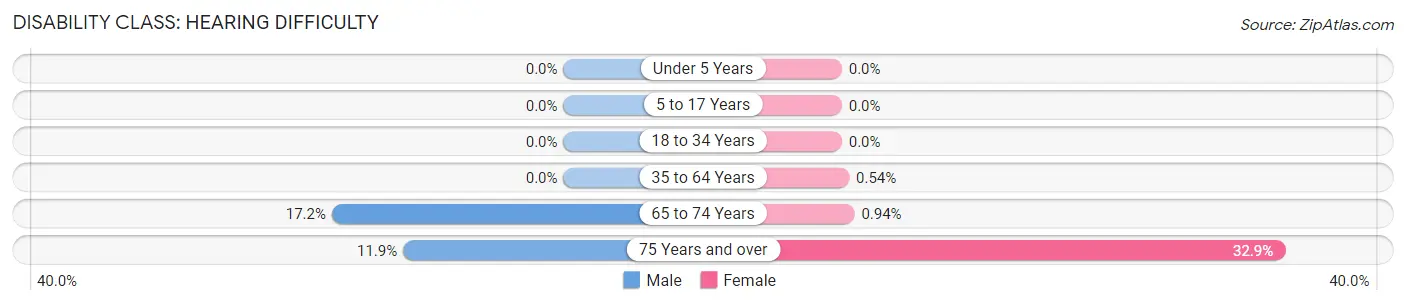
| Age Bracket | Male | Female |
| Under 5 Years | 0 (0.0%) | 0 (0.0%) |
| 5 to 17 Years | 0 (0.0%) | 0 (0.0%) |
| 18 to 34 Years | 0 (0.0%) | 0 (0.0%) |
| 35 to 64 Years | 0 (0.0%) | 4 (0.5%) |
| 65 to 74 Years | 22 (17.2%) | 2 (0.9%) |
| 75 Years and over | 20 (11.9%) | 130 (32.9%) |
Disability Class: Vision Difficulty
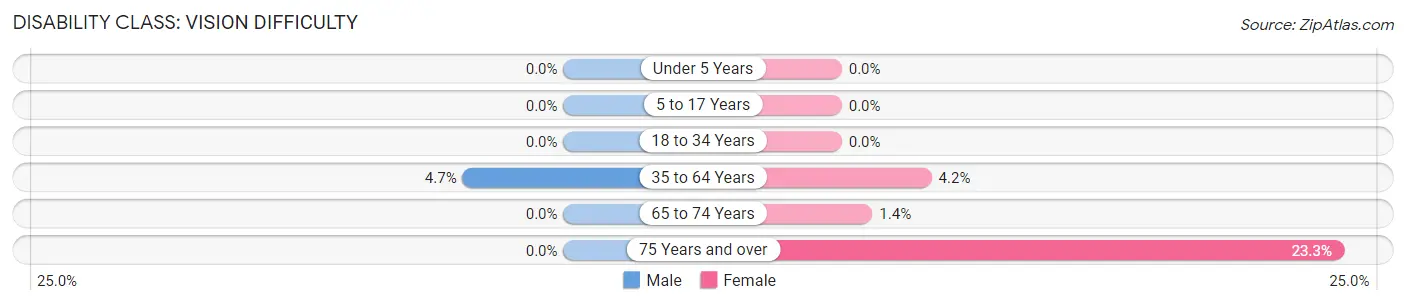
| Age Bracket | Male | Female |
| Under 5 Years | 0 (0.0%) | 0 (0.0%) |
| 5 to 17 Years | 0 (0.0%) | 0 (0.0%) |
| 18 to 34 Years | 0 (0.0%) | 0 (0.0%) |
| 35 to 64 Years | 34 (4.7%) | 31 (4.2%) |
| 65 to 74 Years | 0 (0.0%) | 3 (1.4%) |
| 75 Years and over | 0 (0.0%) | 92 (23.3%) |
Disability Class: Cognitive Difficulty
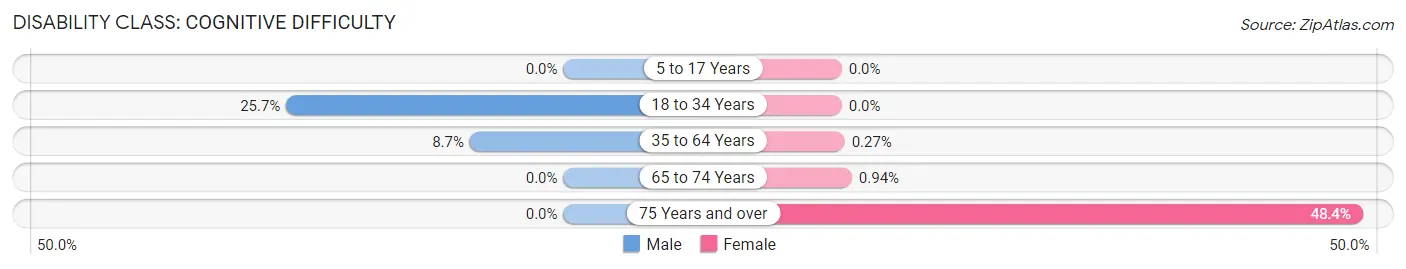
| Age Bracket | Male | Female |
| 5 to 17 Years | 0 (0.0%) | 0 (0.0%) |
| 18 to 34 Years | 98 (25.7%) | 0 (0.0%) |
| 35 to 64 Years | 63 (8.7%) | 2 (0.3%) |
| 65 to 74 Years | 0 (0.0%) | 2 (0.9%) |
| 75 Years and over | 0 (0.0%) | 191 (48.3%) |
Disability Class: Ambulatory Difficulty
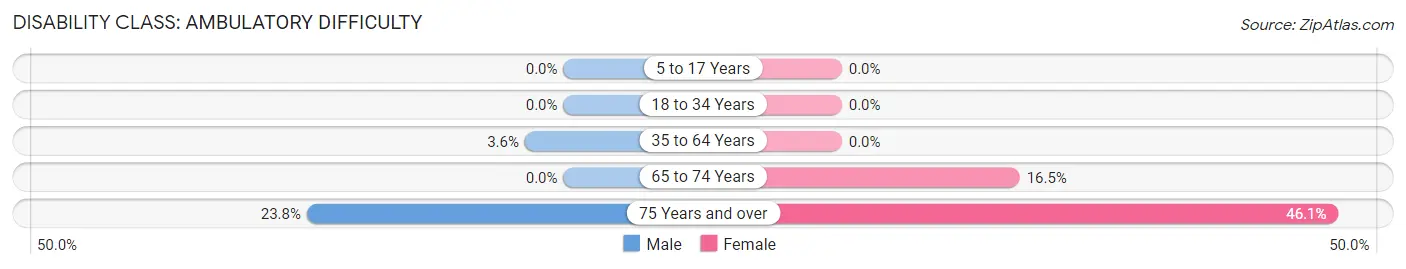
| Age Bracket | Male | Female |
| 5 to 17 Years | 0 (0.0%) | 0 (0.0%) |
| 18 to 34 Years | 0 (0.0%) | 0 (0.0%) |
| 35 to 64 Years | 26 (3.6%) | 0 (0.0%) |
| 65 to 74 Years | 0 (0.0%) | 35 (16.5%) |
| 75 Years and over | 40 (23.8%) | 182 (46.1%) |
Disability Class: Self-Care Difficulty
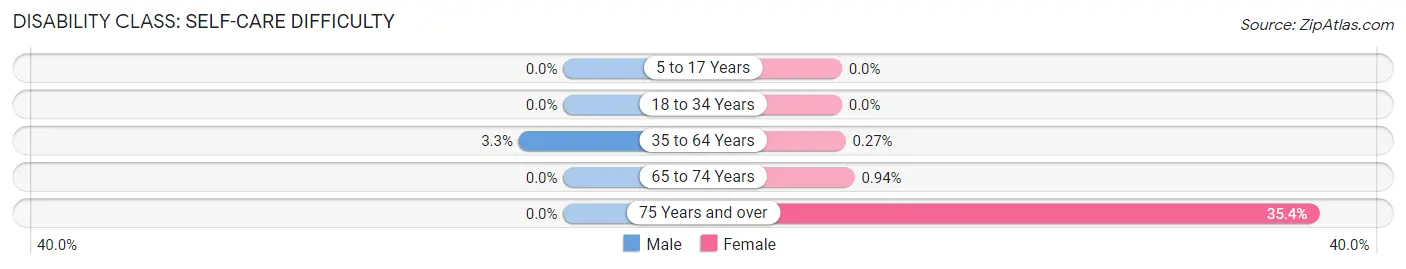
| Age Bracket | Male | Female |
| 5 to 17 Years | 0 (0.0%) | 0 (0.0%) |
| 18 to 34 Years | 0 (0.0%) | 0 (0.0%) |
| 35 to 64 Years | 24 (3.3%) | 2 (0.3%) |
| 65 to 74 Years | 0 (0.0%) | 2 (0.9%) |
| 75 Years and over | 0 (0.0%) | 140 (35.4%) |
Technology Access in Zelienople borough
Computing Device Access in Zelienople borough
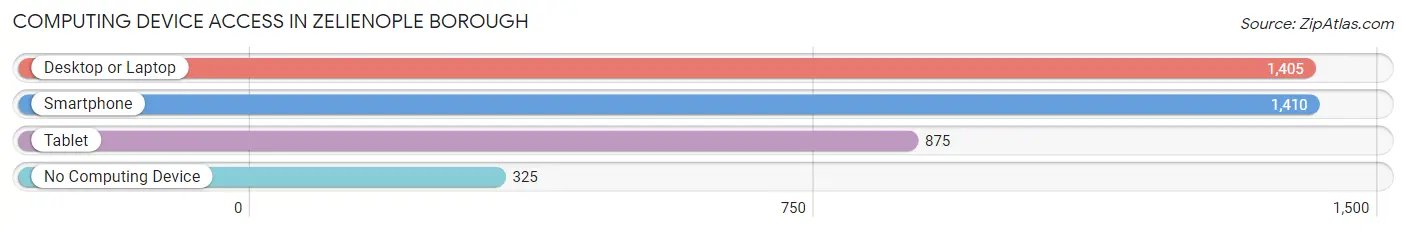
| Device Type | # Households | % Households |
| Desktop or Laptop | 1,405 | 71.3% |
| Smartphone | 1,410 | 71.5% |
| Tablet | 875 | 44.4% |
| No Computing Device | 325 | 16.5% |
| Total | 1,972 | 100.0% |
Internet Access in Zelienople borough
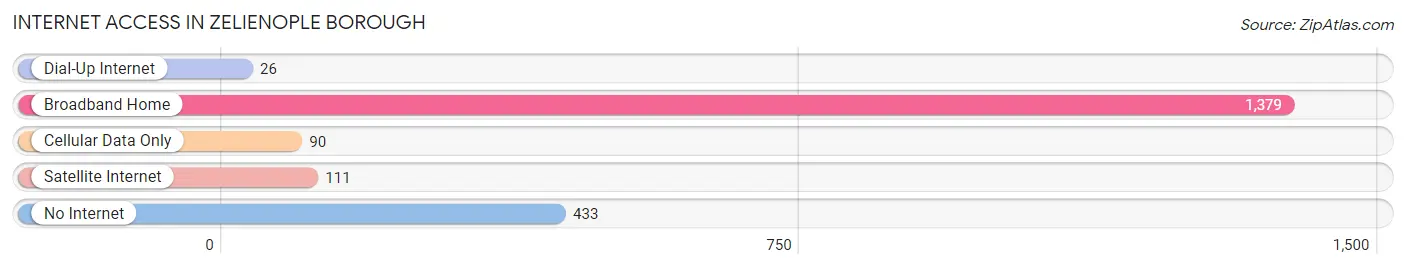
| Internet Type | # Households | % Households |
| Dial-Up Internet | 26 | 1.3% |
| Broadband Home | 1,379 | 69.9% |
| Cellular Data Only | 90 | 4.6% |
| Satellite Internet | 111 | 5.6% |
| No Internet | 433 | 22.0% |
| Total | 1,972 | 100.0% |
Zelienople borough Summary
Zelienople Borough is a small borough located in Butler County, Pennsylvania. It is situated in the northwest corner of the county, approximately 25 miles north of Pittsburgh. The borough is home to a population of 3,813 people, according to the 2010 census.
History
The area that is now Zelienople Borough was first settled in 1796 by John George Schmiedel, a German immigrant. Schmiedel purchased the land from the Commonwealth of Pennsylvania and named it “Zelienople” after the German word for “happy valley.” The area quickly grew in popularity and by 1820, the population had grown to over 500 people.
In 1832, the borough was officially incorporated and the first mayor, John George Schmiedel, was elected. The borough continued to grow and by the late 1800s, it had become a popular tourist destination. The town was known for its mineral springs, which were believed to have healing properties.
In the early 1900s, the borough began to experience a decline in population as people moved away to larger cities. However, the borough was able to maintain its small-town charm and today it is a popular destination for visitors looking to experience a piece of small-town America.
Geography
Zelienople Borough is located in the northwest corner of Butler County, Pennsylvania. It is situated approximately 25 miles north of Pittsburgh. The borough is bordered by Jackson Township to the north, Harmony Township to the east, Franklin Township to the south, and Marion Township to the west.
The borough is situated on a plateau that is part of the Allegheny Plateau. The terrain is mostly flat with some rolling hills. The borough is located in the Allegheny River watershed and is home to several small streams, including the Connoquenessing Creek and the Little Connoquenessing Creek.
Economy
The economy of Zelienople Borough is largely based on tourism. The borough is home to several attractions, including the historic Zelienople Opera House, the Zelienople Community Park, and the Zelienople Historical Society Museum. The borough is also home to several small businesses, including restaurants, shops, and galleries.
The borough is also home to several manufacturing companies, including the Zelienople Manufacturing Company, which produces industrial machinery, and the Zelienople Glass Company, which produces glass products.
Demographics
According to the 2010 census, the population of Zelienople Borough was 3,813. The racial makeup of the borough was 97.3% White, 0.7% African American, 0.2% Native American, 0.7% Asian, and 0.9% from other races. Hispanic or Latino of any race were 1.2% of the population.
The median household income in the borough was $50,945 and the median family income was $60,917. The per capita income was $25,945. About 5.2% of families and 6.7% of the population were below the poverty line, including 8.2% of those under age 18 and 4.2% of those age 65 or over.
Common Questions
What is the Total Population of Zelienople borough?
Total Population of Zelienople borough is 3,870.
What is the Total Male Population of Zelienople borough?
Total Male Population of Zelienople borough is 1,711.
What is the Total Female Population of Zelienople borough?
Total Female Population of Zelienople borough is 2,159.
What is the Ratio of Males per 100 Females in Zelienople borough?
There are 79.25 Males per 100 Females in Zelienople borough.
What is the Ratio of Females per 100 Males in Zelienople borough?
There are 126.18 Females per 100 Males in Zelienople borough.
What is the Median Population Age in Zelienople borough?
Median Population Age in Zelienople borough is 41.1 Years.
What is the Average Family Size in Zelienople borough
Average Family Size in Zelienople borough is 2.9 People.
What is the Average Household Size in Zelienople borough
Average Household Size in Zelienople borough is 1.9 People.
What is Per Capita Income in Zelienople borough?
Per Capita income in Zelienople borough is $45,466.
What is the Median Family Income in Zelienople borough?
Median Family Income in Zelienople borough is $107,434.
What is the Median Household income in Zelienople borough?
Median Household Income in Zelienople borough is $63,038.
What is Income or Wage Gap in Zelienople borough?
Income or Wage Gap in Zelienople borough is 5.2%.
Women in Zelienople borough earn 94.8 cents for every dollar earned by a man.
What is Family Income Deficit in Zelienople borough?
Family Income Deficit in Zelienople borough is $6,725.
Families that are below poverty line in Zelienople borough earn $6,725 less on average than the poverty threshold level.
What is Inequality or Gini Index in Zelienople borough?
Inequality or Gini Index in Zelienople borough is 0.46.
How Large is the Labor Force in Zelienople borough?
There are 2,100 People in the Labor Forcein in Zelienople borough.
What is the Percentage of People in the Labor Force in Zelienople borough?
64.7% of People are in the Labor Force in Zelienople borough.