Woodland Heights, PA
Woodland Heights Map
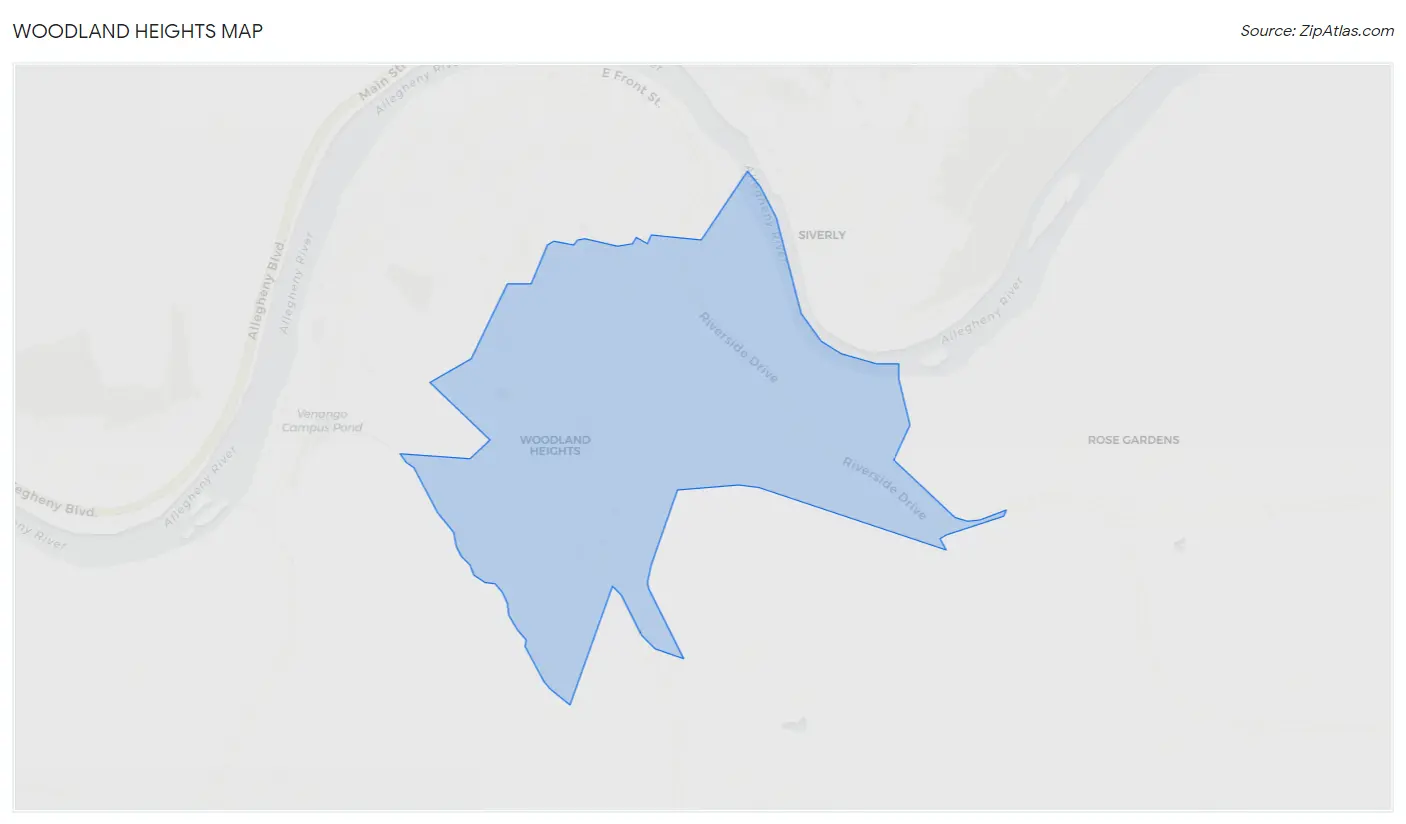
Woodland Heights Overview
1,326
TOTAL POPULATION
712
MALE POPULATION
614
FEMALE POPULATION
115.96
MALES / 100 FEMALES
86.24
FEMALES / 100 MALES
30.8
MEDIAN AGE
3.2
AVG FAMILY SIZE
2.4
AVG HOUSEHOLD SIZE
$21,451
PER CAPITA INCOME
$67,684
AVG FAMILY INCOME
$50,526
AVG HOUSEHOLD INCOME
48.4%
WAGE / INCOME GAP [ % ]
51.6¢/ $1
WAGE / INCOME GAP [ $ ]
0.38
INEQUALITY / GINI INDEX
468
LABOR FORCE [ PEOPLE ]
48.5%
PERCENT IN LABOR FORCE
22.6%
UNEMPLOYMENT RATE
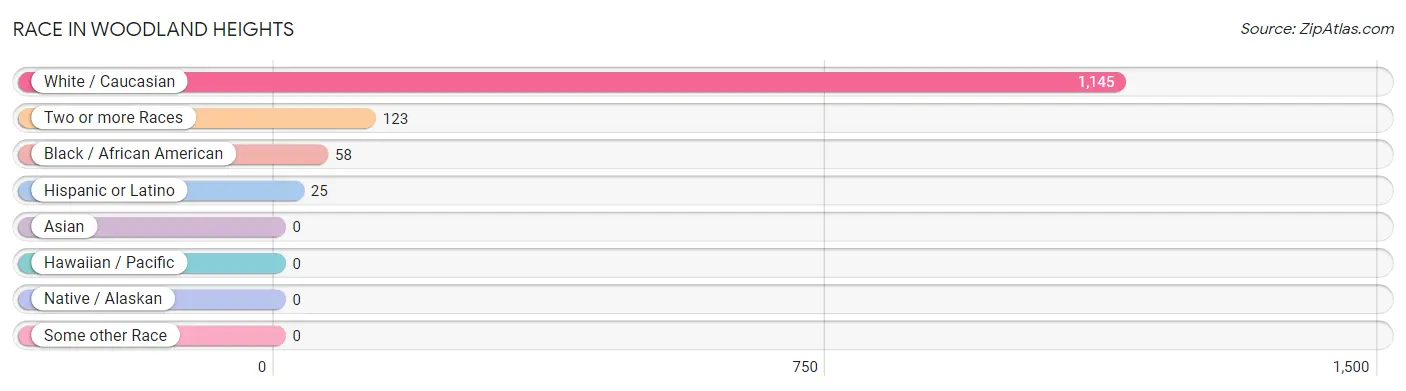
Race in Woodland Heights
The most populous races in Woodland Heights are White / Caucasian (1,145 | 86.4%), Two or more Races (123 | 9.3%), and Black / African American (58 | 4.4%).
| Race | # Population | % Population |
| Asian | 0 | 0.0% |
| Black / African American | 58 | 4.4% |
| Hawaiian / Pacific | 0 | 0.0% |
| Hispanic or Latino | 25 | 1.9% |
| Native / Alaskan | 0 | 0.0% |
| White / Caucasian | 1,145 | 86.4% |
| Two or more Races | 123 | 9.3% |
| Some other Race | 0 | 0.0% |
| Total | 1,326 | 100.0% |
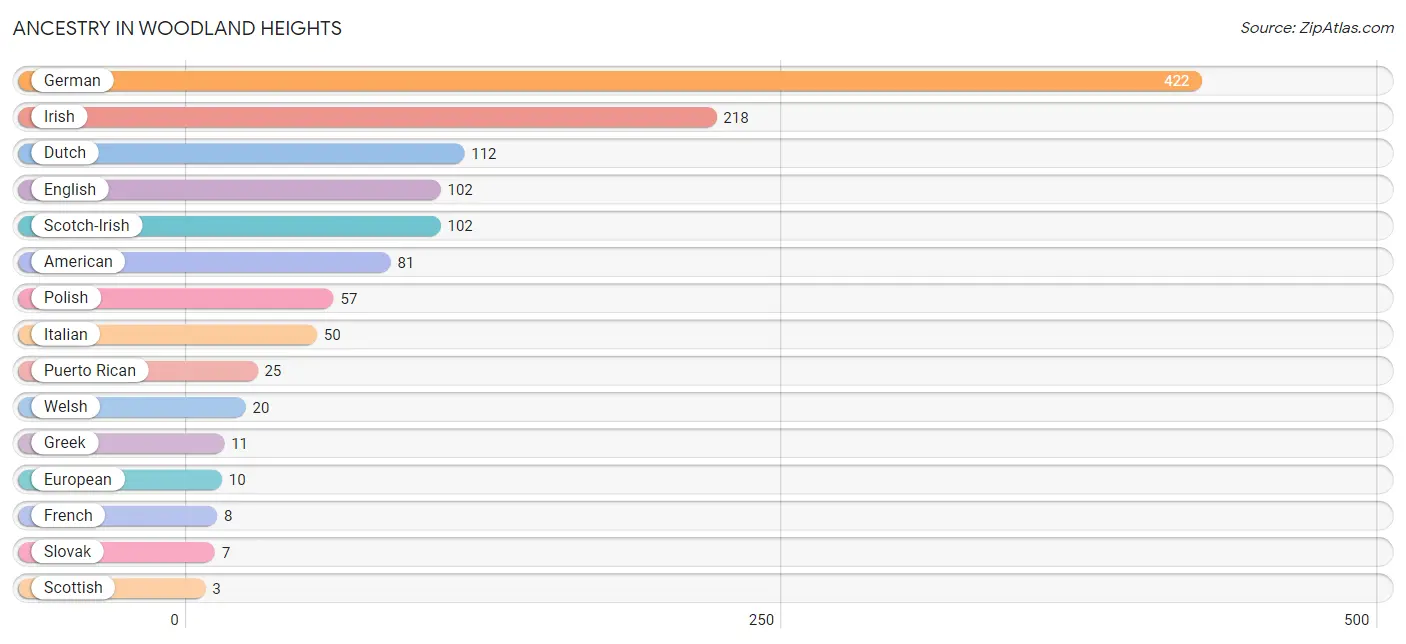
Ancestry in Woodland Heights
The most populous ancestries reported in Woodland Heights are German (422 | 31.8%), Irish (218 | 16.4%), Dutch (112 | 8.5%), English (102 | 7.7%), and Scotch-Irish (102 | 7.7%), together accounting for 72.1% of all Woodland Heights residents.
| Ancestry | # Population | % Population |
| American | 81 | 6.1% |
| Dutch | 112 | 8.5% |
| English | 102 | 7.7% |
| European | 10 | 0.7% |
| French | 8 | 0.6% |
| German | 422 | 31.8% |
| Greek | 11 | 0.8% |
| Irish | 218 | 16.4% |
| Italian | 50 | 3.8% |
| Polish | 57 | 4.3% |
| Puerto Rican | 25 | 1.9% |
| Scotch-Irish | 102 | 7.7% |
| Scottish | 3 | 0.2% |
| Slovak | 7 | 0.5% |
| Welsh | 20 | 1.5% | View All 15 Rows |
Immigrants in Woodland Heights

| Immigration Origin | # Population | % Population | View All 0 Rows |
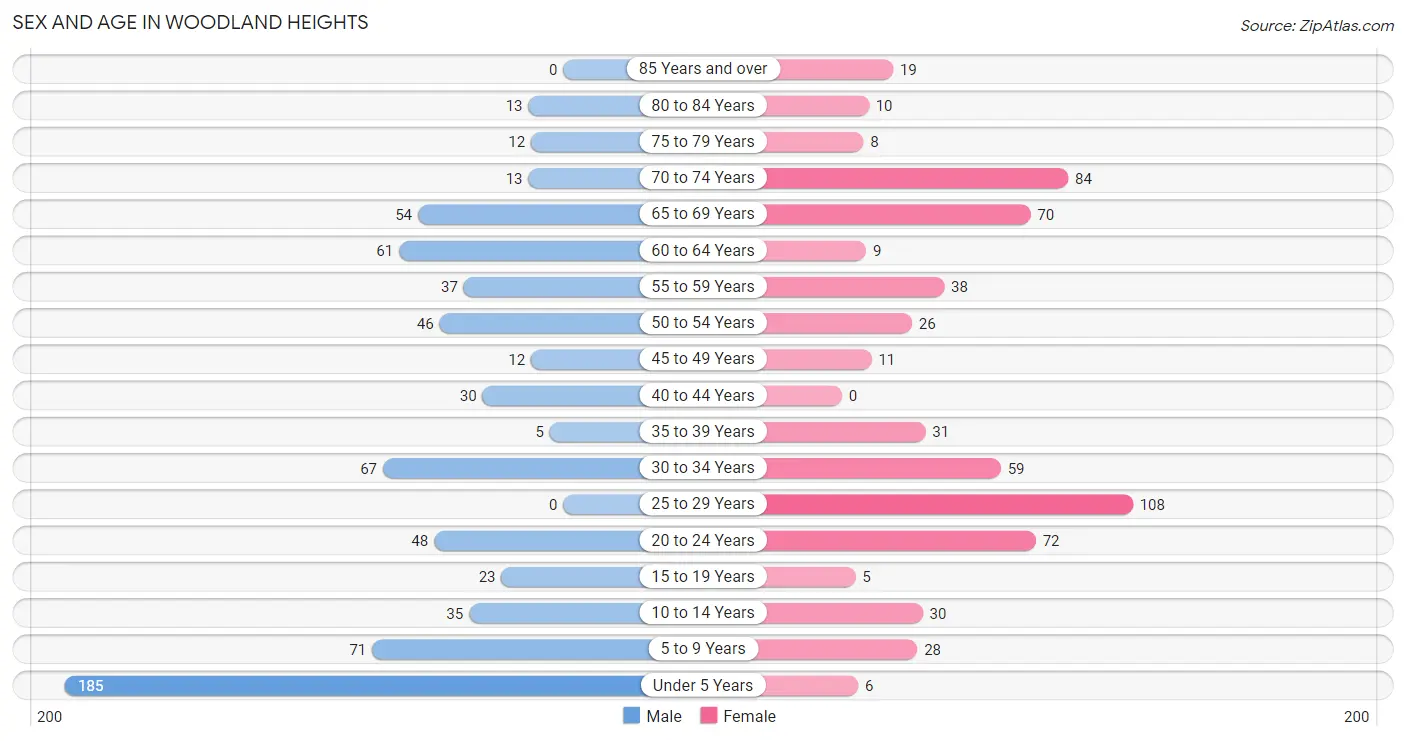
Sex and Age in Woodland Heights
Sex and Age in Woodland Heights
The most populous age groups in Woodland Heights are Under 5 Years (185 | 26.0%) for men and 25 to 29 Years (108 | 17.6%) for women.
| Age Bracket | Male | Female |
| Under 5 Years | 185 (26.0%) | 6 (1.0%) |
| 5 to 9 Years | 71 (10.0%) | 28 (4.6%) |
| 10 to 14 Years | 35 (4.9%) | 30 (4.9%) |
| 15 to 19 Years | 23 (3.2%) | 5 (0.8%) |
| 20 to 24 Years | 48 (6.7%) | 72 (11.7%) |
| 25 to 29 Years | 0 (0.0%) | 108 (17.6%) |
| 30 to 34 Years | 67 (9.4%) | 59 (9.6%) |
| 35 to 39 Years | 5 (0.7%) | 31 (5.1%) |
| 40 to 44 Years | 30 (4.2%) | 0 (0.0%) |
| 45 to 49 Years | 12 (1.7%) | 11 (1.8%) |
| 50 to 54 Years | 46 (6.5%) | 26 (4.2%) |
| 55 to 59 Years | 37 (5.2%) | 38 (6.2%) |
| 60 to 64 Years | 61 (8.6%) | 9 (1.5%) |
| 65 to 69 Years | 54 (7.6%) | 70 (11.4%) |
| 70 to 74 Years | 13 (1.8%) | 84 (13.7%) |
| 75 to 79 Years | 12 (1.7%) | 8 (1.3%) |
| 80 to 84 Years | 13 (1.8%) | 10 (1.6%) |
| 85 Years and over | 0 (0.0%) | 19 (3.1%) |
| Total | 712 (100.0%) | 614 (100.0%) |
Families and Households in Woodland Heights
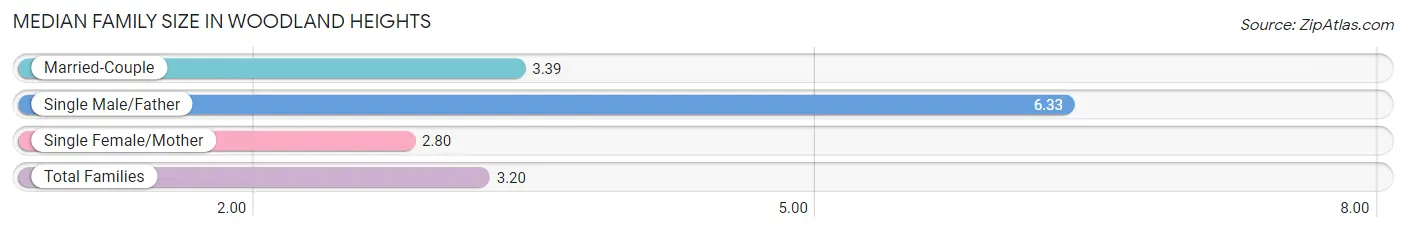
Median Family Size in Woodland Heights
The median family size in Woodland Heights is 3.20 persons per family, with single male/father families (3 | 0.9%) accounting for the largest median family size of 6.33 persons per family. On the other hand, single female/mother families (119 | 37.1%) represent the smallest median family size with 2.80 persons per family.
| Family Type | # Families | Family Size |
| Married-Couple | 199 (62.0%) | 3.39 |
| Single Male/Father | 3 (0.9%) | 6.33 |
| Single Female/Mother | 119 (37.1%) | 2.80 |
| Total Families | 321 (100.0%) | 3.20 |
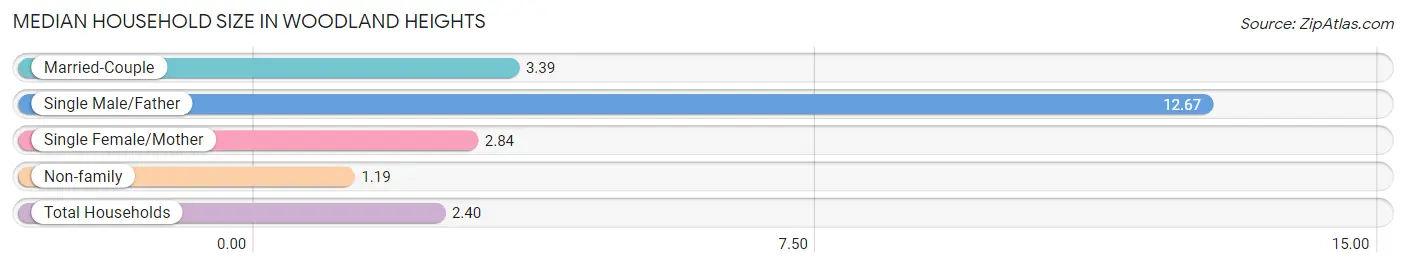
Median Household Size in Woodland Heights
The median household size in Woodland Heights is 2.40 persons per household, with single male/father households (3 | 0.5%) accounting for the largest median household size of 12.67 persons per household. non-family households (231 | 41.8%) represent the smallest median household size with 1.19 persons per household.
| Household Type | # Households | Household Size |
| Married-Couple | 199 (36.0%) | 3.39 |
| Single Male/Father | 3 (0.5%) | 12.67 |
| Single Female/Mother | 119 (21.6%) | 2.84 |
| Non-family | 231 (41.8%) | 1.19 |
| Total Households | 552 (100.0%) | 2.40 |
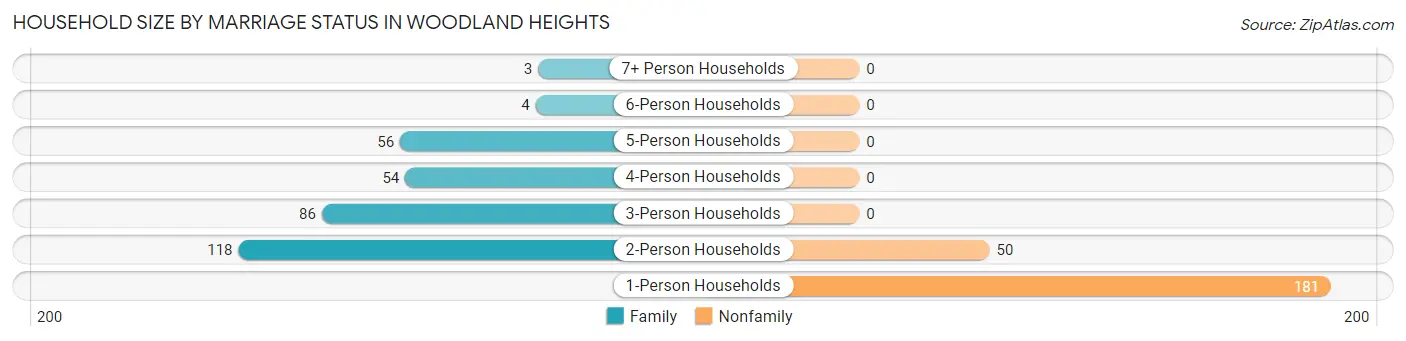
Household Size by Marriage Status in Woodland Heights
Out of a total of 552 households in Woodland Heights, 321 (58.2%) are family households, while 231 (41.8%) are nonfamily households. The most numerous type of family households are 2-person households, comprising 118, and the most common type of nonfamily households are 1-person households, comprising 181.
| Household Size | Family Households | Nonfamily Households |
| 1-Person Households | - | 181 (32.8%) |
| 2-Person Households | 118 (21.4%) | 50 (9.1%) |
| 3-Person Households | 86 (15.6%) | 0 (0.0%) |
| 4-Person Households | 54 (9.8%) | 0 (0.0%) |
| 5-Person Households | 56 (10.1%) | 0 (0.0%) |
| 6-Person Households | 4 (0.7%) | 0 (0.0%) |
| 7+ Person Households | 3 (0.5%) | 0 (0.0%) |
| Total | 321 (58.2%) | 231 (41.8%) |
Female Fertility in Woodland Heights
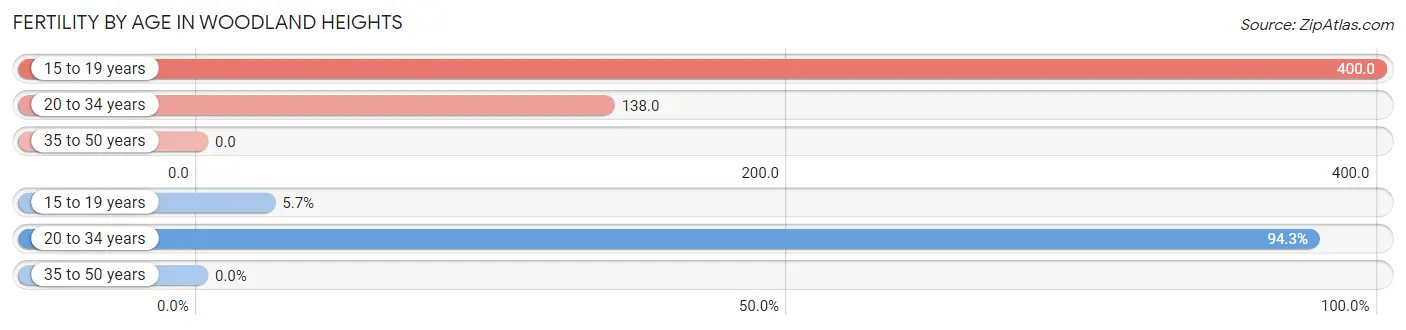
Fertility by Age in Woodland Heights
Average fertility rate in Woodland Heights is 122.0 births per 1,000 women. Women in the age bracket of 15 to 19 years have the highest fertility rate with 400.0 births per 1,000 women. Women in the age bracket of 20 to 34 years acount for 94.3% of all women with births.
| Age Bracket | Women with Births | Births / 1,000 Women |
| 15 to 19 years | 2 (5.7%) | 400.0 |
| 20 to 34 years | 33 (94.3%) | 138.0 |
| 35 to 50 years | 0 (0.0%) | 0.0 |
| Total | 35 (100.0%) | 122.0 |
Fertility by Age by Marriage Status in Woodland Heights
94.3% of women with births (35) in Woodland Heights are married. The highest percentage of unmarried women with births falls into 15 to 19 years age bracket with 100.0% of them unmarried at the time of birth, while the lowest percentage of unmarried women with births belong to 20 to 34 years age bracket with 0.0% of them unmarried.
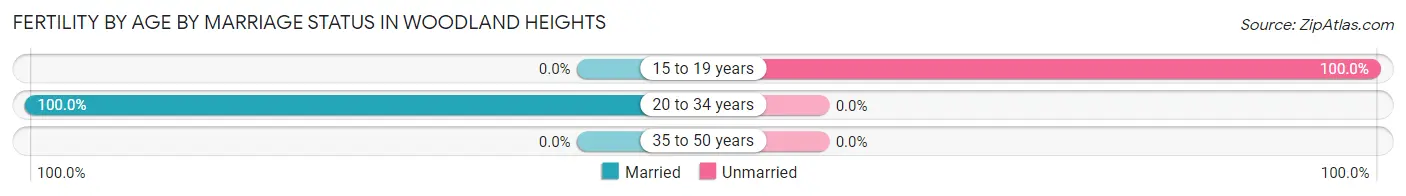
| Age Bracket | Married | Unmarried |
| 15 to 19 years | 0 (0.0%) | 2 (100.0%) |
| 20 to 34 years | 33 (100.0%) | 0 (0.0%) |
| 35 to 50 years | 0 (0.0%) | 0 (0.0%) |
| Total | 33 (94.3%) | 2 (5.7%) |
Fertility by Education in Woodland Heights
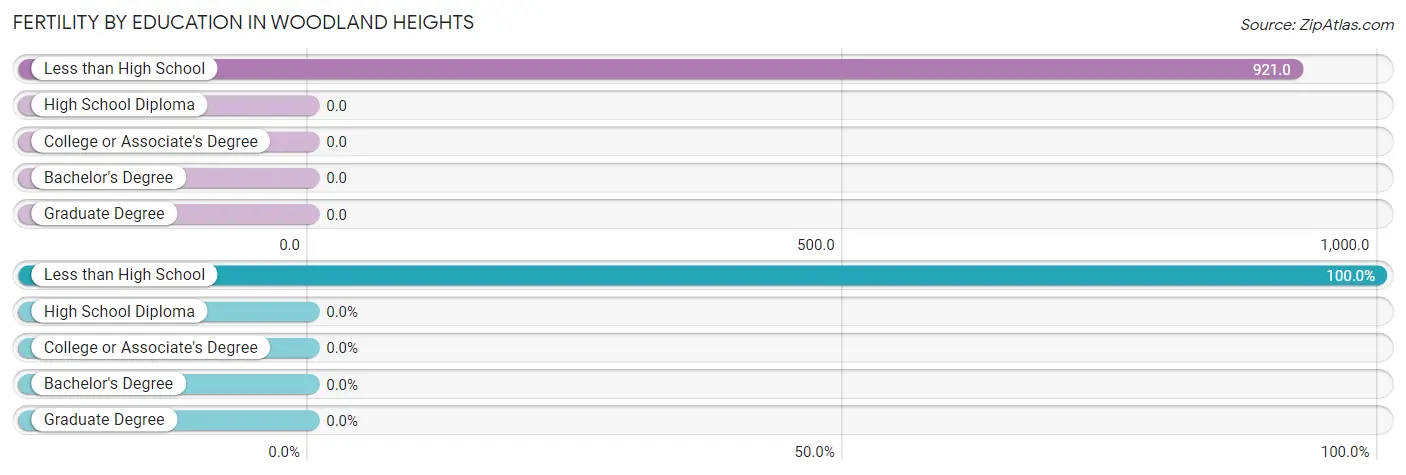
| Educational Attainment | Women with Births | Births / 1,000 Women |
| Less than High School | 35 (100.0%) | 921.0 |
| High School Diploma | 0 (0.0%) | 0.0 |
| College or Associate's Degree | 0 (0.0%) | 0.0 |
| Bachelor's Degree | 0 (0.0%) | 0.0 |
| Graduate Degree | 0 (0.0%) | 0.0 |
| Total | 35 (100.0%) | 122.0 |
Fertility by Education by Marriage Status in Woodland Heights
5.7% of women with births in Woodland Heights are unmarried. Women with the educational attainment of less than high school are most likely to be married with 94.3% of them married at childbirth, while women with the educational attainment of less than high school are least likely to be married with 5.7% of them unmarried at childbirth.
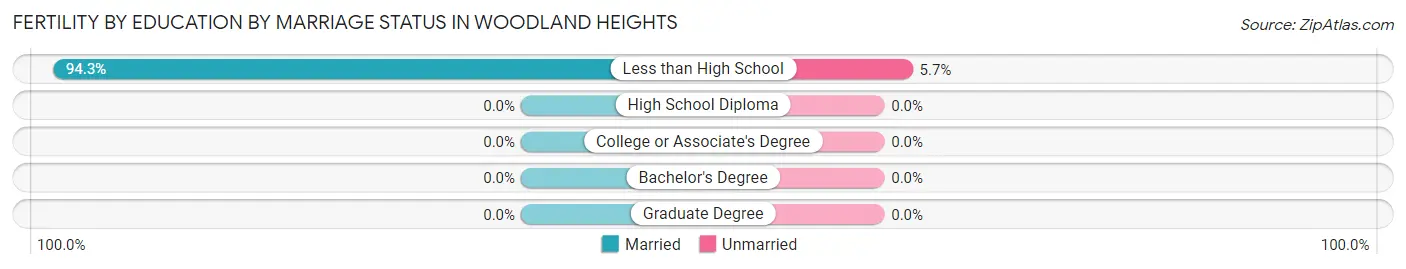
| Educational Attainment | Married | Unmarried |
| Less than High School | 33 (94.3%) | 2 (5.7%) |
| High School Diploma | 0 (0.0%) | 0 (0.0%) |
| College or Associate's Degree | 0 (0.0%) | 0 (0.0%) |
| Bachelor's Degree | 0 (0.0%) | 0 (0.0%) |
| Graduate Degree | 0 (0.0%) | 0 (0.0%) |
| Total | 33 (94.3%) | 2 (5.7%) |
Income in Woodland Heights
Income Overview in Woodland Heights
Per Capita Income in Woodland Heights is $21,451, while median incomes of families and households are $67,684 and $50,526 respectively.
| Characteristic | Number | Measure |
| Per Capita Income | 1,326 | $21,451 |
| Median Family Income | 321 | $67,684 |
| Mean Family Income | 321 | $59,966 |
| Median Household Income | 552 | $50,526 |
| Mean Household Income | 552 | $49,978 |
| Income Deficit | 321 | $0 |
| Wage / Income Gap (%) | 1,326 | 48.36% |
| Wage / Income Gap ($) | 1,326 | 51.64¢ per $1 |
| Gini / Inequality Index | 1,326 | 0.38 |
Earnings by Sex in Woodland Heights
Average Earnings in Woodland Heights are $30,281, $37,639 for men and $19,438 for women, a difference of 48.4%.
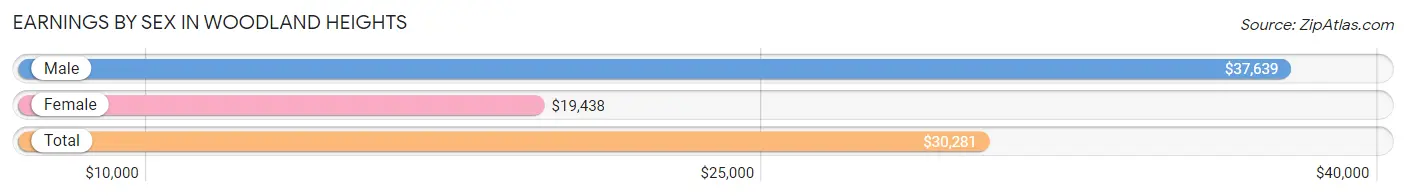
| Sex | Number | Average Earnings |
| Male | 285 (56.1%) | $37,639 |
| Female | 223 (43.9%) | $19,438 |
| Total | 508 (100.0%) | $30,281 |
Earnings by Sex by Income Bracket in Woodland Heights
The most common earnings brackets in Woodland Heights are $35,000 to $39,999 for men (45 | 15.8%) and $30,000 to $34,999 for women (71 | 31.8%).
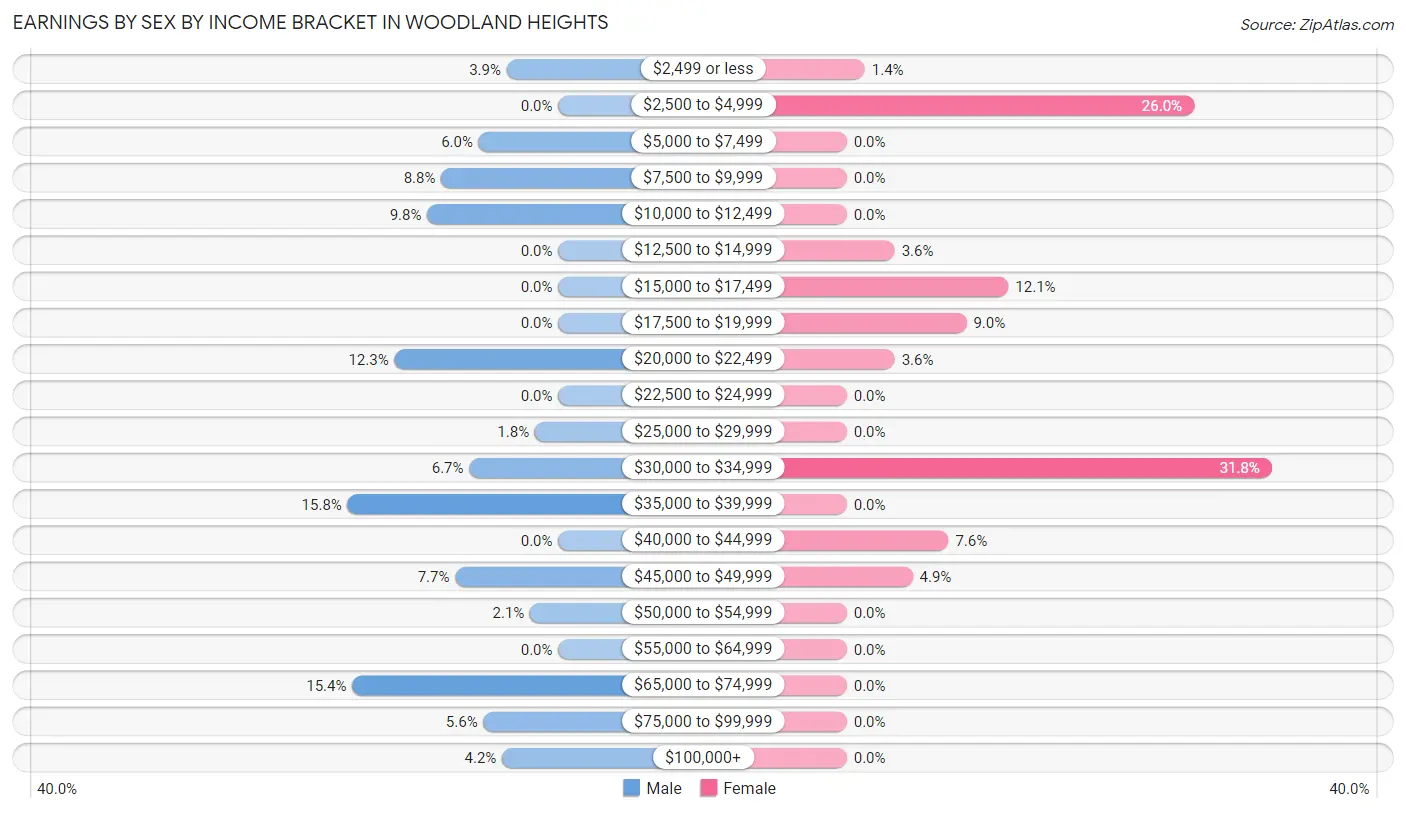
| Income | Male | Female |
| $2,499 or less | 11 (3.9%) | 3 (1.3%) |
| $2,500 to $4,999 | 0 (0.0%) | 58 (26.0%) |
| $5,000 to $7,499 | 17 (6.0%) | 0 (0.0%) |
| $7,500 to $9,999 | 25 (8.8%) | 0 (0.0%) |
| $10,000 to $12,499 | 28 (9.8%) | 0 (0.0%) |
| $12,500 to $14,999 | 0 (0.0%) | 8 (3.6%) |
| $15,000 to $17,499 | 0 (0.0%) | 27 (12.1%) |
| $17,500 to $19,999 | 0 (0.0%) | 20 (9.0%) |
| $20,000 to $22,499 | 35 (12.3%) | 8 (3.6%) |
| $22,500 to $24,999 | 0 (0.0%) | 0 (0.0%) |
| $25,000 to $29,999 | 5 (1.8%) | 0 (0.0%) |
| $30,000 to $34,999 | 19 (6.7%) | 71 (31.8%) |
| $35,000 to $39,999 | 45 (15.8%) | 0 (0.0%) |
| $40,000 to $44,999 | 0 (0.0%) | 17 (7.6%) |
| $45,000 to $49,999 | 22 (7.7%) | 11 (4.9%) |
| $50,000 to $54,999 | 6 (2.1%) | 0 (0.0%) |
| $55,000 to $64,999 | 0 (0.0%) | 0 (0.0%) |
| $65,000 to $74,999 | 44 (15.4%) | 0 (0.0%) |
| $75,000 to $99,999 | 16 (5.6%) | 0 (0.0%) |
| $100,000+ | 12 (4.2%) | 0 (0.0%) |
| Total | 285 (100.0%) | 223 (100.0%) |
Earnings by Sex by Educational Attainment in Woodland Heights
Average earnings in Woodland Heights are $38,833 for men and $30,335 for women, a difference of 21.9%. Men with an educational attainment of college or associate's degree enjoy the highest average annual earnings of $45,625, while those with high school diploma education earn the least with $32,875. Women with an educational attainment of college or associate's degree earn the most with the average annual earnings of $43,000, while those with college or associate's degree education have the smallest earnings of $43,000.
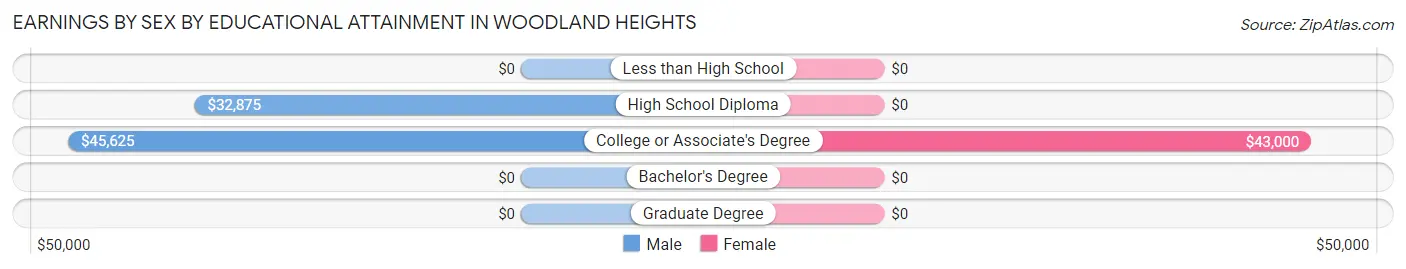
| Educational Attainment | Male Income | Female Income |
| Less than High School | - | - |
| High School Diploma | $32,875 | $0 |
| College or Associate's Degree | $45,625 | $43,000 |
| Bachelor's Degree | - | - |
| Graduate Degree | - | - |
| Total | $38,833 | $30,335 |
Family Income in Woodland Heights
Family Income Brackets in Woodland Heights
According to the Woodland Heights family income data, there are 137 families falling into the $50,000 to $74,999 income range, which is the most common income bracket and makes up 42.7% of all families.
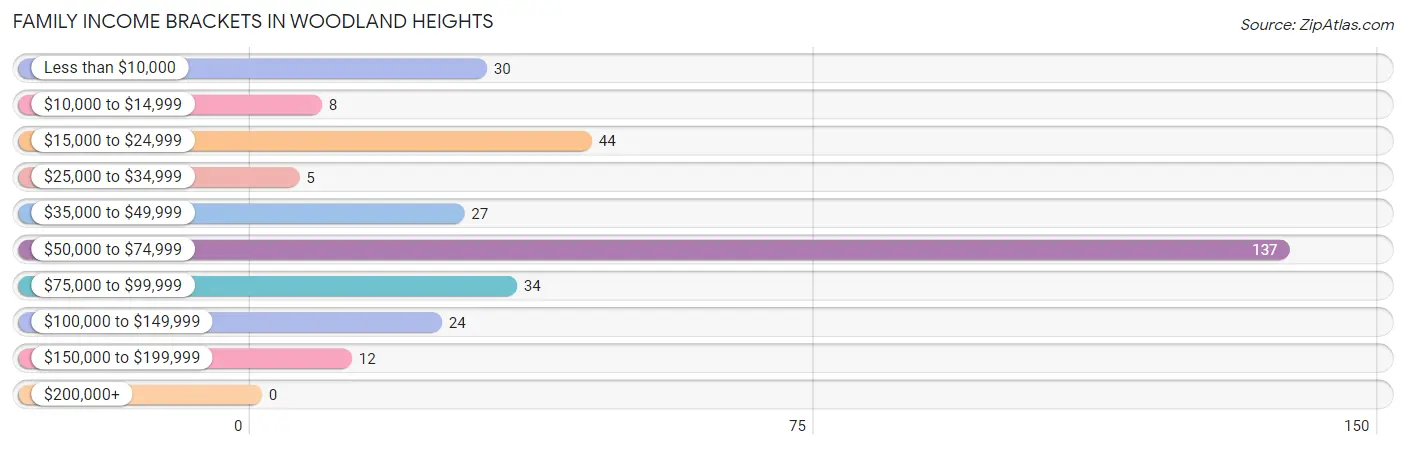
| Income Bracket | # Families | % Families |
| Less than $10,000 | 30 | 9.3% |
| $10,000 to $14,999 | 8 | 2.5% |
| $15,000 to $24,999 | 44 | 13.7% |
| $25,000 to $34,999 | 5 | 1.6% |
| $35,000 to $49,999 | 27 | 8.4% |
| $50,000 to $74,999 | 137 | 42.7% |
| $75,000 to $99,999 | 34 | 10.6% |
| $100,000 to $149,999 | 24 | 7.5% |
| $150,000 to $199,999 | 12 | 3.7% |
| $200,000+ | 0 | 0.0% |
Family Income by Famaliy Size in Woodland Heights
4-person families (54 | 16.8%) account for the highest median family income in Woodland Heights with $70,515 per family, while 2-person families (118 | 36.8%) have the highest median income of $26,022 per family member.
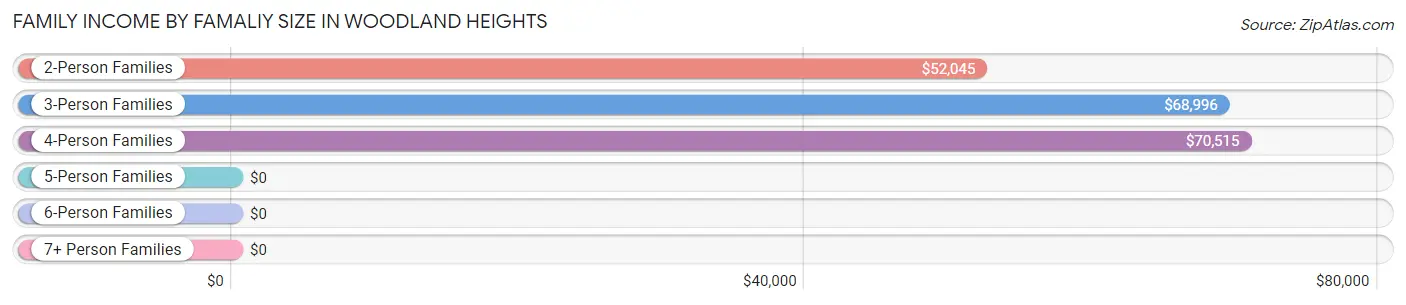
| Income Bracket | # Families | Median Income |
| 2-Person Families | 118 (36.8%) | $52,045 |
| 3-Person Families | 89 (27.7%) | $68,996 |
| 4-Person Families | 54 (16.8%) | $70,515 |
| 5-Person Families | 60 (18.7%) | $0 |
| 6-Person Families | 0 (0.0%) | $0 |
| 7+ Person Families | 0 (0.0%) | $0 |
| Total | 321 (100.0%) | $67,684 |
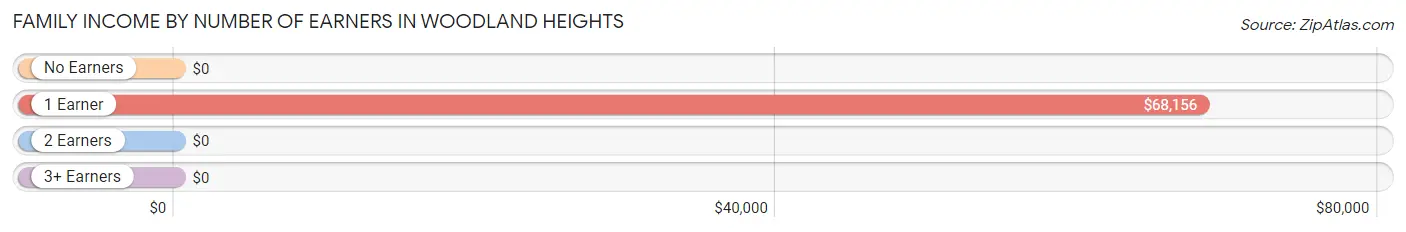
Family Income by Number of Earners in Woodland Heights
| Number of Earners | # Families | Median Income |
| No Earners | 65 (20.3%) | $0 |
| 1 Earner | 196 (61.1%) | $68,156 |
| 2 Earners | 34 (10.6%) | $0 |
| 3+ Earners | 26 (8.1%) | $0 |
| Total | 321 (100.0%) | $67,684 |
Household Income in Woodland Heights
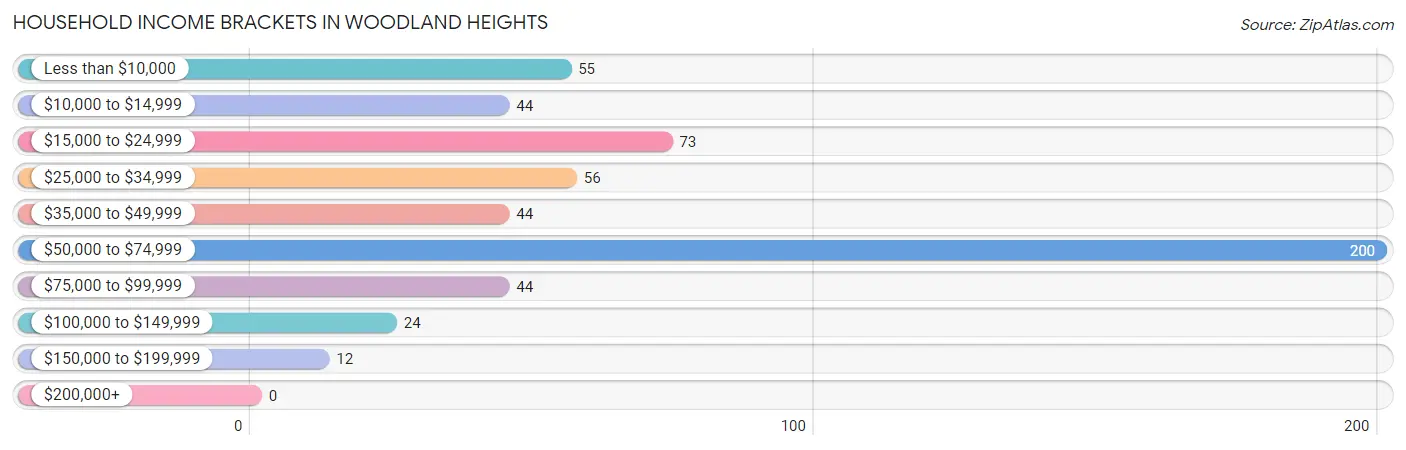
Household Income Brackets in Woodland Heights
With 200 households falling in the category, the $50,000 to $74,999 income range is the most frequent in Woodland Heights, accounting for 36.2% of all households.
| Income Bracket | # Households | % Households |
| Less than $10,000 | 55 | 10.0% |
| $10,000 to $14,999 | 44 | 8.0% |
| $15,000 to $24,999 | 73 | 13.2% |
| $25,000 to $34,999 | 56 | 10.1% |
| $35,000 to $49,999 | 44 | 8.0% |
| $50,000 to $74,999 | 200 | 36.2% |
| $75,000 to $99,999 | 44 | 8.0% |
| $100,000 to $149,999 | 24 | 4.3% |
| $150,000 to $199,999 | 12 | 2.2% |
| $200,000+ | 0 | 0.0% |
Household Income by Householder Age in Woodland Heights
The median household income in Woodland Heights is $50,526, with the highest median household income of $66,979 found in the 45 to 64 years age bracket for the primary householder. A total of 177 households (32.1%) fall into this category. Meanwhile, the 15 to 24 years age bracket for the primary householder has the lowest median household income of $0, with 41 households (7.4%) in this group.

| Income Bracket | # Households | Median Income |
| 15 to 24 Years | 41 (7.4%) | $0 |
| 25 to 44 Years | 125 (22.6%) | $20,265 |
| 45 to 64 Years | 177 (32.1%) | $66,979 |
| 65+ Years | 209 (37.9%) | $61,528 |
| Total | 552 (100.0%) | $50,526 |
Poverty in Woodland Heights
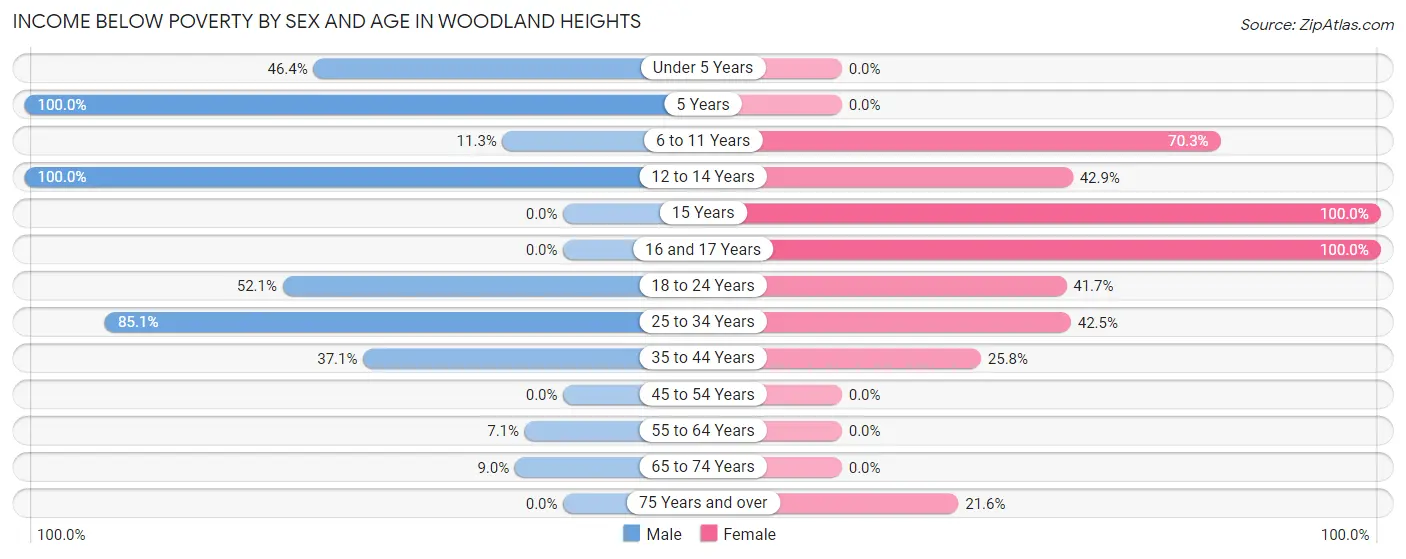
Income Below Poverty by Sex and Age in Woodland Heights
With 33.1% poverty level for males and 25.6% for females among the residents of Woodland Heights, 5 year old males and 15 year old females are the most vulnerable to poverty, with 8 males (100.0%) and 3 females (100.0%) in their respective age groups living below the poverty level.
| Age Bracket | Male | Female |
| Under 5 Years | 83 (46.4%) | 0 (0.0%) |
| 5 Years | 8 (100.0%) | 0 (0.0%) |
| 6 to 11 Years | 8 (11.3%) | 26 (70.3%) |
| 12 to 14 Years | 27 (100.0%) | 9 (42.9%) |
| 15 Years | 0 (0.0%) | 3 (100.0%) |
| 16 and 17 Years | 0 (0.0%) | 2 (100.0%) |
| 18 to 24 Years | 25 (52.1%) | 30 (41.7%) |
| 25 to 34 Years | 57 (85.1%) | 71 (42.5%) |
| 35 to 44 Years | 13 (37.1%) | 8 (25.8%) |
| 45 to 54 Years | 0 (0.0%) | 0 (0.0%) |
| 55 to 64 Years | 7 (7.1%) | 0 (0.0%) |
| 65 to 74 Years | 6 (9.0%) | 0 (0.0%) |
| 75 Years and over | 0 (0.0%) | 8 (21.6%) |
| Total | 234 (33.1%) | 157 (25.6%) |
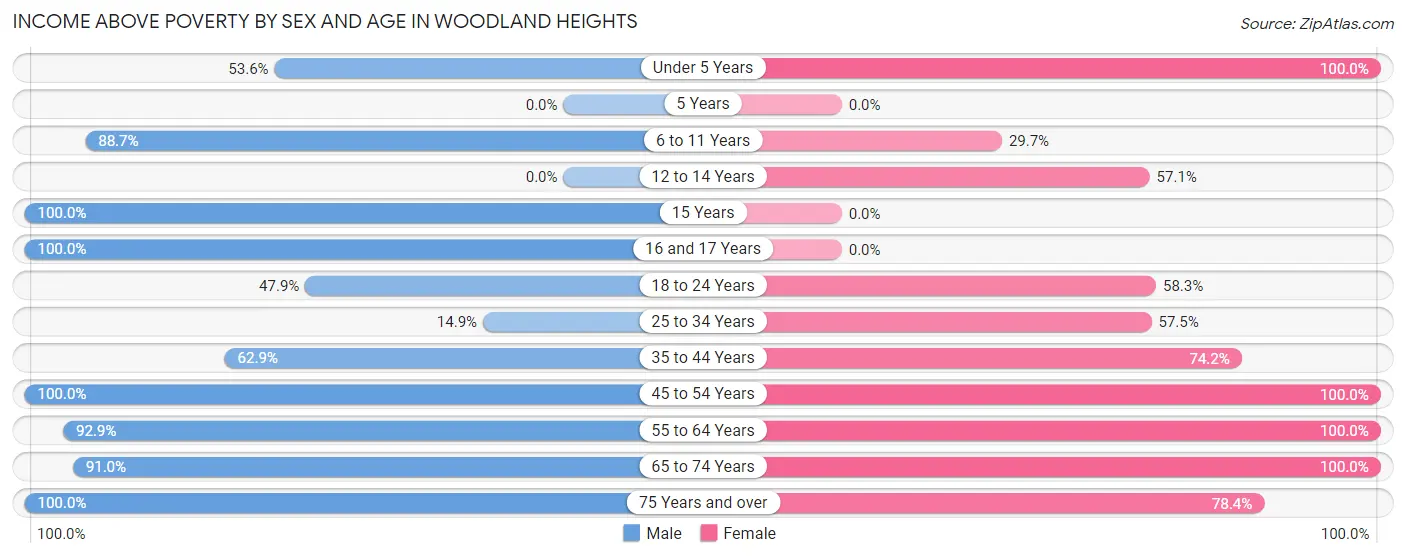
Income Above Poverty by Sex and Age in Woodland Heights
According to the poverty statistics in Woodland Heights, males aged 15 years and females aged under 5 years are the age groups that are most secure financially, with 100.0% of males and 100.0% of females in these age groups living above the poverty line.
| Age Bracket | Male | Female |
| Under 5 Years | 96 (53.6%) | 6 (100.0%) |
| 5 Years | 0 (0.0%) | 0 (0.0%) |
| 6 to 11 Years | 63 (88.7%) | 11 (29.7%) |
| 12 to 14 Years | 0 (0.0%) | 12 (57.1%) |
| 15 Years | 4 (100.0%) | 0 (0.0%) |
| 16 and 17 Years | 19 (100.0%) | 0 (0.0%) |
| 18 to 24 Years | 23 (47.9%) | 42 (58.3%) |
| 25 to 34 Years | 10 (14.9%) | 96 (57.5%) |
| 35 to 44 Years | 22 (62.9%) | 23 (74.2%) |
| 45 to 54 Years | 58 (100.0%) | 37 (100.0%) |
| 55 to 64 Years | 91 (92.9%) | 47 (100.0%) |
| 65 to 74 Years | 61 (91.0%) | 154 (100.0%) |
| 75 Years and over | 25 (100.0%) | 29 (78.4%) |
| Total | 472 (66.9%) | 457 (74.4%) |
Income Below Poverty Among Married-Couple Families in Woodland Heights
The poverty statistics for married-couple families in Woodland Heights show that 22.1% or 44 of the total 199 families live below the poverty line. Families with 3 or 4 children have the highest poverty rate of 100.0%, comprising of 44 families. On the other hand, families with no children have the lowest poverty rate of 0.0%, which includes 0 families.
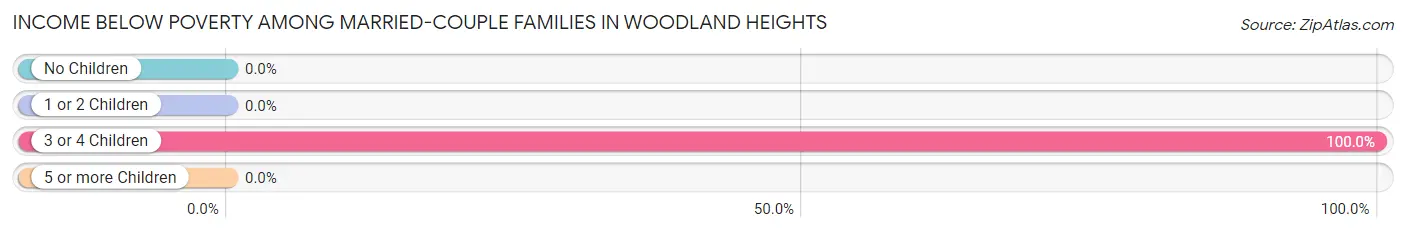
| Children | Above Poverty | Below Poverty |
| No Children | 90 (100.0%) | 0 (0.0%) |
| 1 or 2 Children | 65 (100.0%) | 0 (0.0%) |
| 3 or 4 Children | 0 (0.0%) | 44 (100.0%) |
| 5 or more Children | 0 (0.0%) | 0 (0.0%) |
| Total | 155 (77.9%) | 44 (22.1%) |
Income Below Poverty Among Single-Parent Households in Woodland Heights
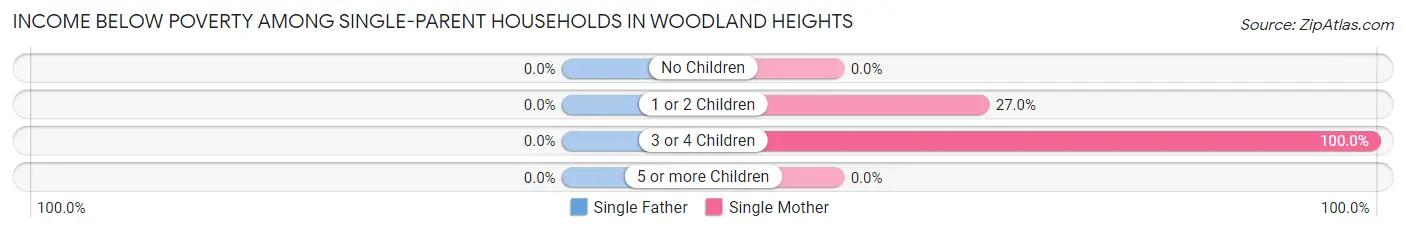
| Children | Single Father | Single Mother |
| No Children | 0 (0.0%) | 0 (0.0%) |
| 1 or 2 Children | 0 (0.0%) | 30 (27.0%) |
| 3 or 4 Children | 0 (0.0%) | 8 (100.0%) |
| 5 or more Children | 0 (0.0%) | 0 (0.0%) |
| Total | 0 (0.0%) | 38 (31.9%) |
Income Below Poverty Among Married-Couple vs Single-Parent Households in Woodland Heights
The poverty data for Woodland Heights shows that 44 of the married-couple family households (22.1%) and 38 of the single-parent households (31.1%) are living below the poverty level. Within the married-couple family households, those with 3 or 4 children have the highest poverty rate, with 44 households (100.0%) falling below the poverty line. Among the single-parent households, those with 3 or 4 children have the highest poverty rate, with 8 household (100.0%) living below poverty.
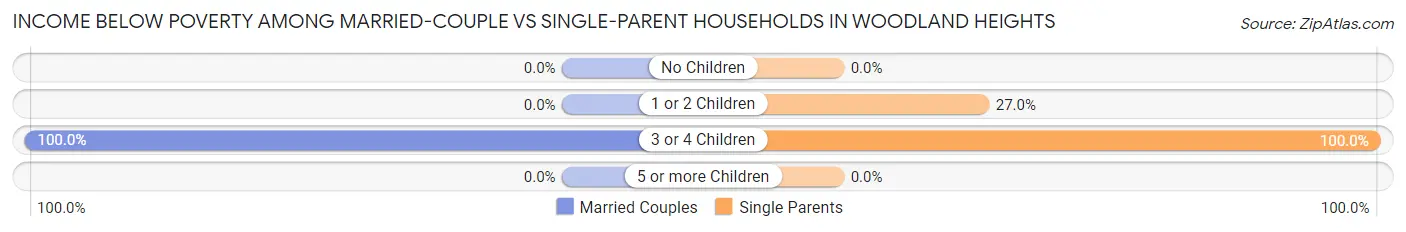
| Children | Married-Couple Families | Single-Parent Households |
| No Children | 0 (0.0%) | 0 (0.0%) |
| 1 or 2 Children | 0 (0.0%) | 30 (27.0%) |
| 3 or 4 Children | 44 (100.0%) | 8 (100.0%) |
| 5 or more Children | 0 (0.0%) | 0 (0.0%) |
| Total | 44 (22.1%) | 38 (31.1%) |
Employment Characteristics in Woodland Heights
Employment by Class of Employer in Woodland Heights
Among the 348 employed individuals in Woodland Heights, private company employees (245 | 70.4%), local government employees (64 | 18.4%), and state government employees (22 | 6.3%) make up the most common classes of employment.
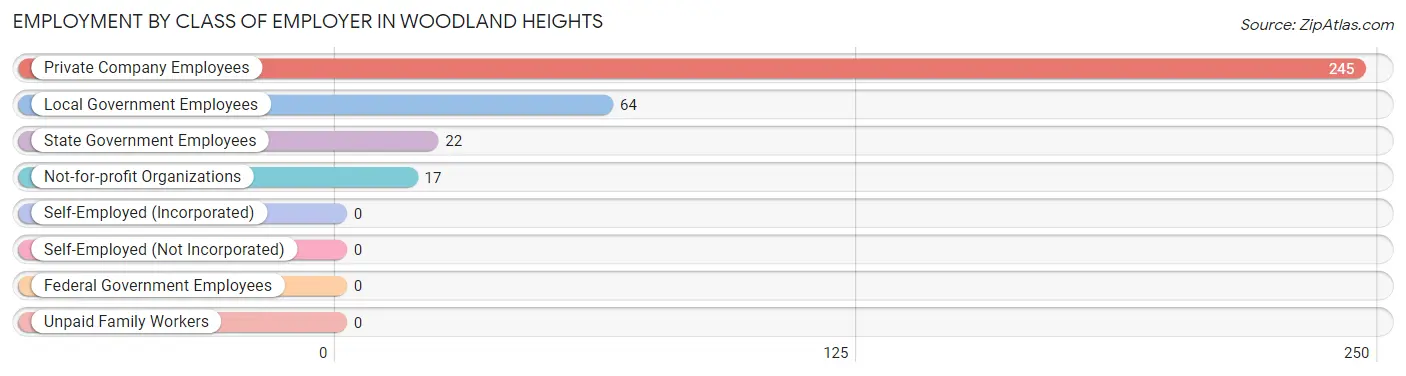
| Employer Class | # Employees | % Employees |
| Private Company Employees | 245 | 70.4% |
| Self-Employed (Incorporated) | 0 | 0.0% |
| Self-Employed (Not Incorporated) | 0 | 0.0% |
| Not-for-profit Organizations | 17 | 4.9% |
| Local Government Employees | 64 | 18.4% |
| State Government Employees | 22 | 6.3% |
| Federal Government Employees | 0 | 0.0% |
| Unpaid Family Workers | 0 | 0.0% |
| Total | 348 | 100.0% |
Employment Status by Age in Woodland Heights
According to the labor force statistics for Woodland Heights, out of the total population over 16 years of age (964), 48.5% or 468 individuals are in the labor force, with 22.6% or 106 of them unemployed. The age group with the highest labor force participation rate is 45 to 54 years, with 100.0% or 95 individuals in the labor force. Within the labor force, the 25 to 29 years age range has the highest percentage of unemployed individuals, with 94.7% or 71 of them being unemployed.
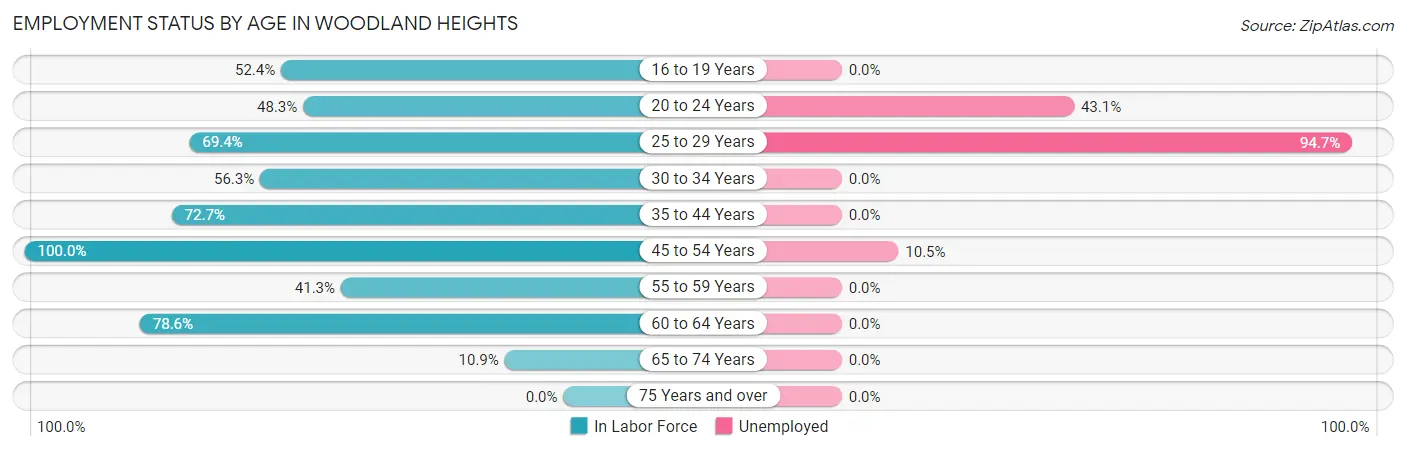
| Age Bracket | In Labor Force | Unemployed |
| 16 to 19 Years | 11 (52.4%) | 0 (0.0%) |
| 20 to 24 Years | 58 (48.3%) | 25 (43.1%) |
| 25 to 29 Years | 75 (69.4%) | 71 (94.7%) |
| 30 to 34 Years | 71 (56.3%) | 0 (0.0%) |
| 35 to 44 Years | 48 (72.7%) | 0 (0.0%) |
| 45 to 54 Years | 95 (100.0%) | 10 (10.5%) |
| 55 to 59 Years | 31 (41.3%) | 0 (0.0%) |
| 60 to 64 Years | 55 (78.6%) | 0 (0.0%) |
| 65 to 74 Years | 24 (10.9%) | 0 (0.0%) |
| 75 Years and over | 0 (0.0%) | 0 (0.0%) |
| Total | 468 (48.5%) | 106 (22.6%) |
Employment Status by Educational Attainment in Woodland Heights
According to labor force statistics for Woodland Heights, 69.4% of individuals (375) out of the total population between 25 and 64 years of age (540) are in the labor force, with 21.6% or 81 of them being unemployed. The group with the highest labor force participation rate are those with the educational attainment of college / associate degree, with 90.0% or 72 individuals in the labor force. Within the labor force, individuals with high school diploma education have the highest percentage of unemployment, with 35.8% or 81 of them being unemployed.
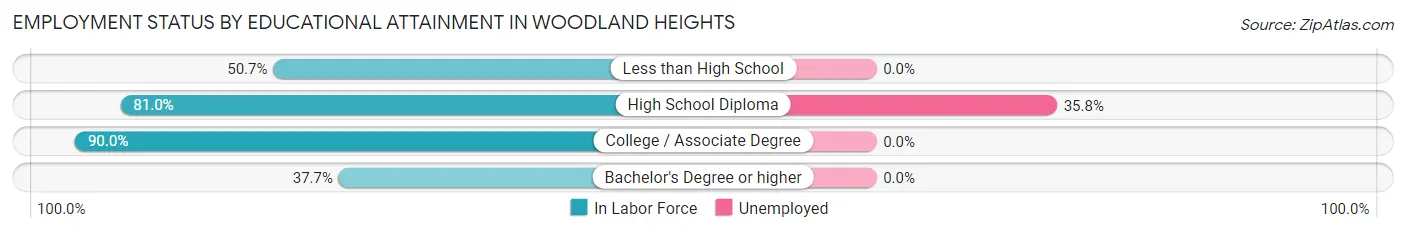
| Educational Attainment | In Labor Force | Unemployed |
| Less than High School | 34 (50.7%) | 0 (0.0%) |
| High School Diploma | 226 (81.0%) | 100 (35.8%) |
| College / Associate Degree | 72 (90.0%) | 0 (0.0%) |
| Bachelor's Degree or higher | 43 (37.7%) | 0 (0.0%) |
| Total | 375 (69.4%) | 117 (21.6%) |
Employment Occupations by Sex in Woodland Heights
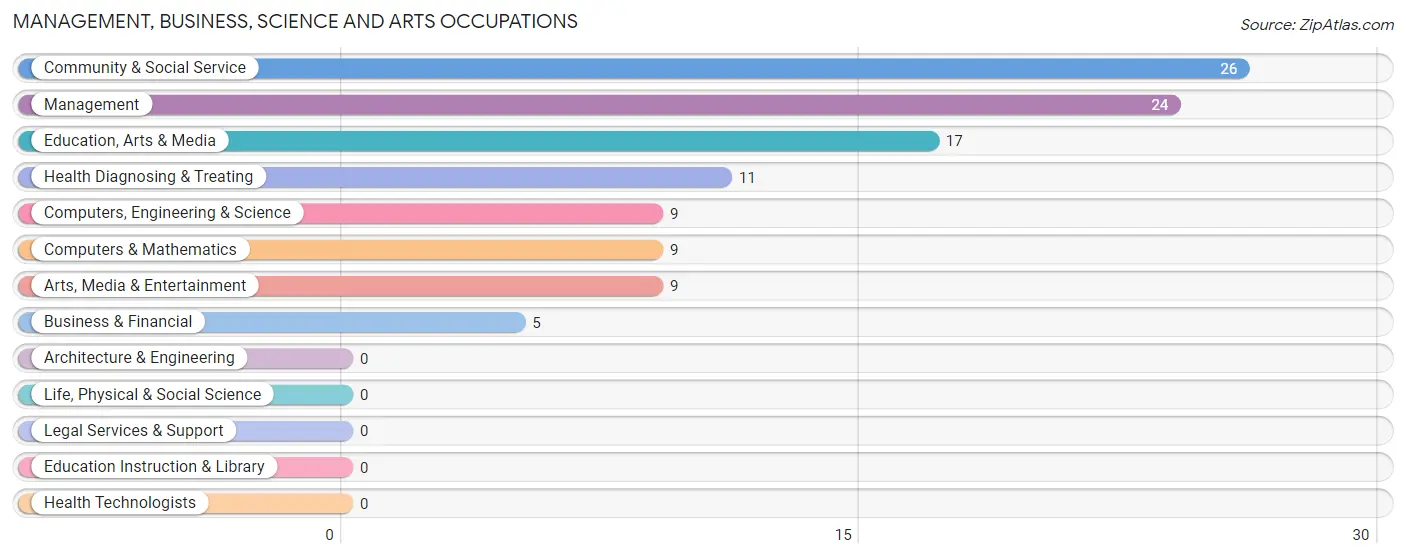
Management, Business, Science and Arts Occupations
The most common Management, Business, Science and Arts occupations in Woodland Heights are Community & Social Service (26 | 7.2%), Management (24 | 6.6%), Education, Arts & Media (17 | 4.7%), Health Diagnosing & Treating (11 | 3.0%), and Computers, Engineering & Science (9 | 2.5%).
Management, Business, Science and Arts Occupations by Sex
Within the Management, Business, Science and Arts occupations in Woodland Heights, the most male-oriented occupations are Business & Financial (100.0%), Computers, Engineering & Science (100.0%), and Computers & Mathematics (100.0%), while the most female-oriented occupations are Health Diagnosing & Treating (100.0%), Education, Arts & Media (58.8%), and Management (50.0%).
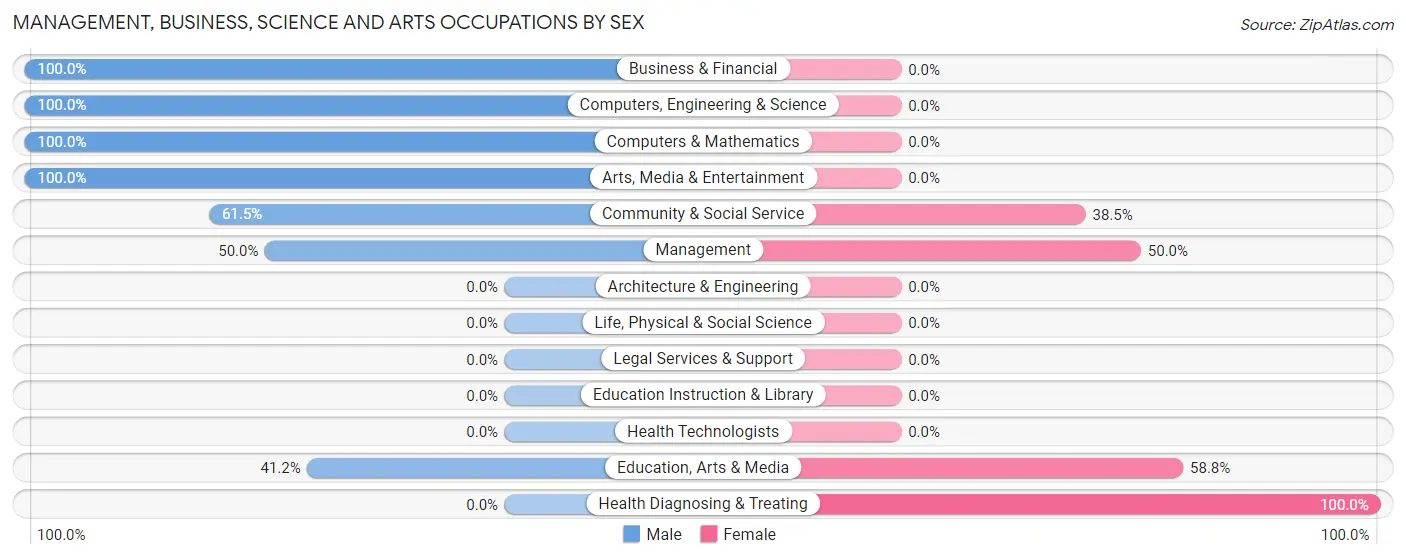
| Occupation | Male | Female |
| Management | 12 (50.0%) | 12 (50.0%) |
| Business & Financial | 5 (100.0%) | 0 (0.0%) |
| Computers, Engineering & Science | 9 (100.0%) | 0 (0.0%) |
| Computers & Mathematics | 9 (100.0%) | 0 (0.0%) |
| Architecture & Engineering | 0 (0.0%) | 0 (0.0%) |
| Life, Physical & Social Science | 0 (0.0%) | 0 (0.0%) |
| Community & Social Service | 16 (61.5%) | 10 (38.5%) |
| Education, Arts & Media | 7 (41.2%) | 10 (58.8%) |
| Legal Services & Support | 0 (0.0%) | 0 (0.0%) |
| Education Instruction & Library | 0 (0.0%) | 0 (0.0%) |
| Arts, Media & Entertainment | 9 (100.0%) | 0 (0.0%) |
| Health Diagnosing & Treating | 0 (0.0%) | 11 (100.0%) |
| Health Technologists | 0 (0.0%) | 0 (0.0%) |
| Total (Category) | 42 (56.0%) | 33 (44.0%) |
| Total (Overall) | 260 (71.8%) | 102 (28.2%) |
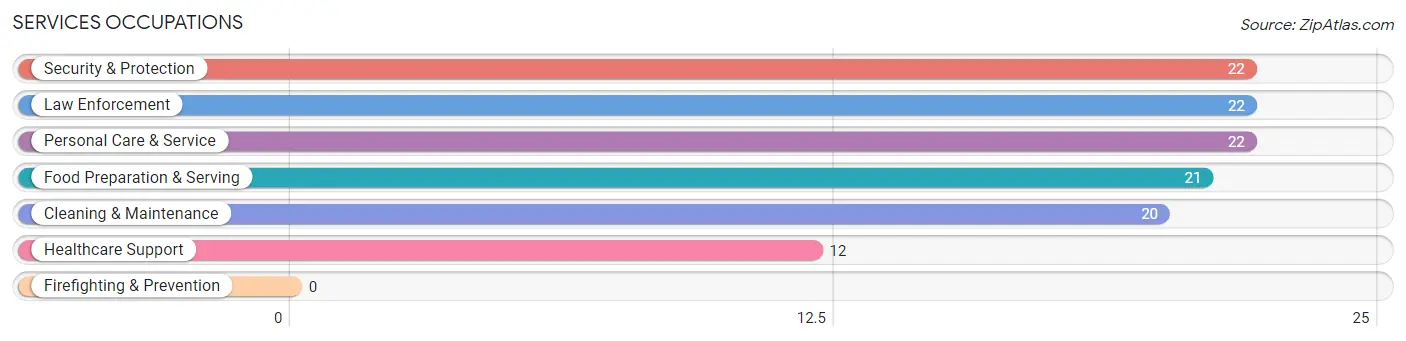
Services Occupations
The most common Services occupations in Woodland Heights are Security & Protection (22 | 6.1%), Law Enforcement (22 | 6.1%), Personal Care & Service (22 | 6.1%), Food Preparation & Serving (21 | 5.8%), and Cleaning & Maintenance (20 | 5.5%).
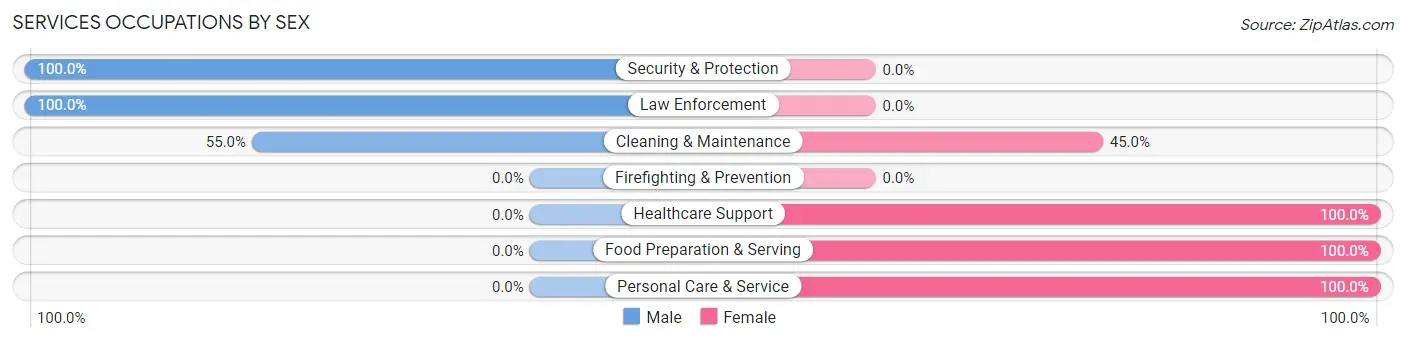
Services Occupations by Sex
Within the Services occupations in Woodland Heights, the most male-oriented occupations are Security & Protection (100.0%), Law Enforcement (100.0%), and Cleaning & Maintenance (55.0%), while the most female-oriented occupations are Healthcare Support (100.0%), Food Preparation & Serving (100.0%), and Personal Care & Service (100.0%).
| Occupation | Male | Female |
| Healthcare Support | 0 (0.0%) | 12 (100.0%) |
| Security & Protection | 22 (100.0%) | 0 (0.0%) |
| Firefighting & Prevention | 0 (0.0%) | 0 (0.0%) |
| Law Enforcement | 22 (100.0%) | 0 (0.0%) |
| Food Preparation & Serving | 0 (0.0%) | 21 (100.0%) |
| Cleaning & Maintenance | 11 (55.0%) | 9 (45.0%) |
| Personal Care & Service | 0 (0.0%) | 22 (100.0%) |
| Total (Category) | 33 (34.0%) | 64 (66.0%) |
| Total (Overall) | 260 (71.8%) | 102 (28.2%) |
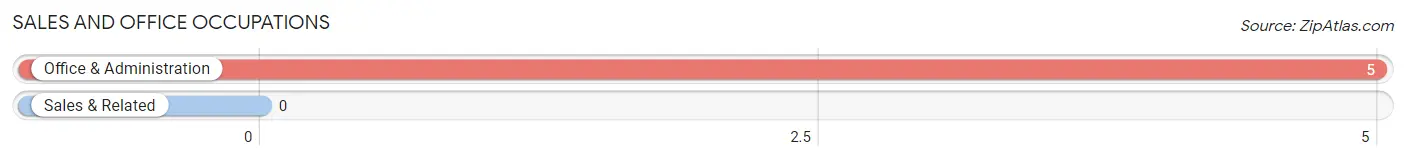
Sales and Office Occupations
The most common Sales and Office occupations in Woodland Heights are , and Office & Administration (5 | 1.4%).
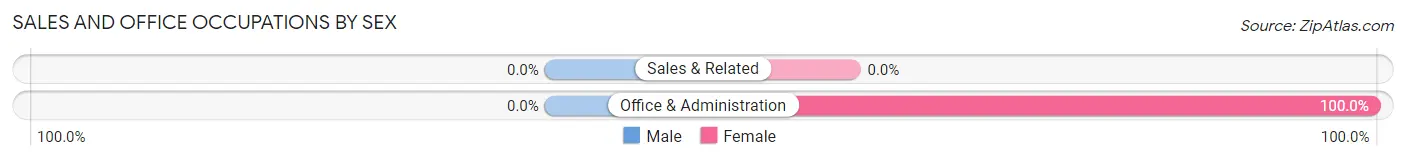
Sales and Office Occupations by Sex
| Occupation | Male | Female |
| Sales & Related | 0 (0.0%) | 0 (0.0%) |
| Office & Administration | 0 (0.0%) | 5 (100.0%) |
| Total (Category) | 0 (0.0%) | 5 (100.0%) |
| Total (Overall) | 260 (71.8%) | 102 (28.2%) |
Natural Resources, Construction and Maintenance Occupations
The most common Natural Resources, Construction and Maintenance occupations in Woodland Heights are Installation, Maintenance & Repair (32 | 8.8%), and Farming, Fishing & Forestry (10 | 2.8%).
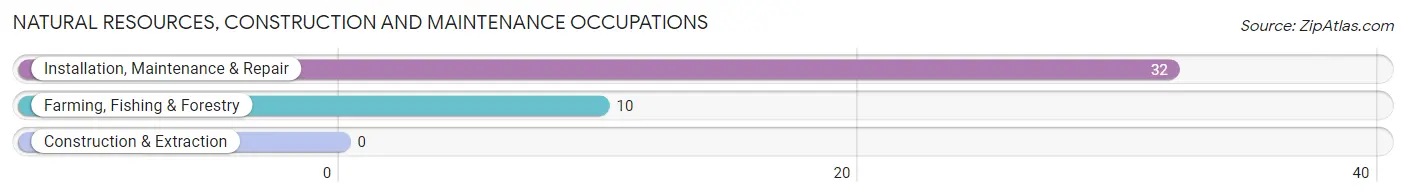
Natural Resources, Construction and Maintenance Occupations by Sex
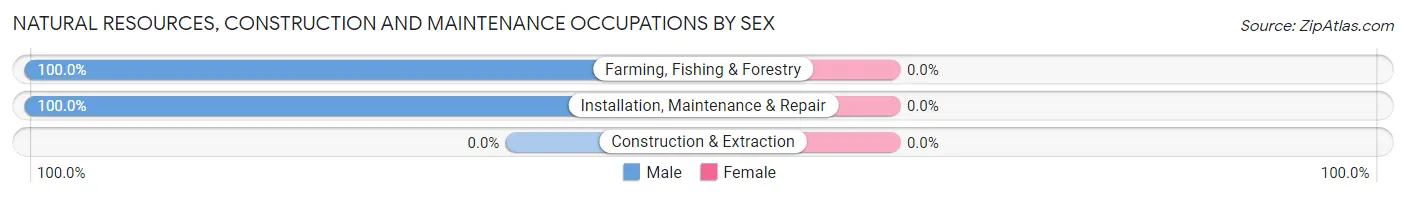
| Occupation | Male | Female |
| Farming, Fishing & Forestry | 10 (100.0%) | 0 (0.0%) |
| Construction & Extraction | 0 (0.0%) | 0 (0.0%) |
| Installation, Maintenance & Repair | 32 (100.0%) | 0 (0.0%) |
| Total (Category) | 42 (100.0%) | 0 (0.0%) |
| Total (Overall) | 260 (71.8%) | 102 (28.2%) |
Production, Transportation and Moving Occupations
The most common Production, Transportation and Moving occupations in Woodland Heights are Transportation (85 | 23.5%), Production (35 | 9.7%), and Material Moving (23 | 6.4%).
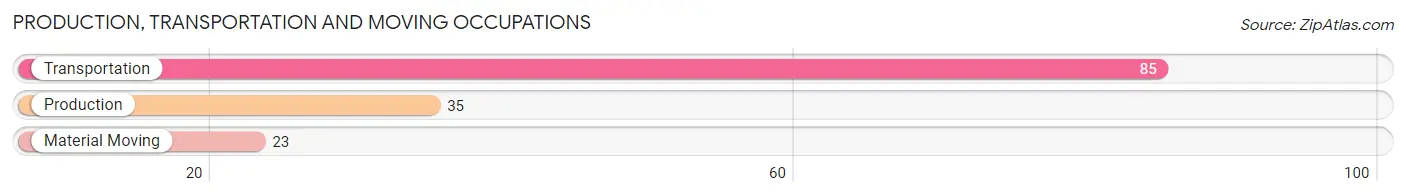
Production, Transportation and Moving Occupations by Sex
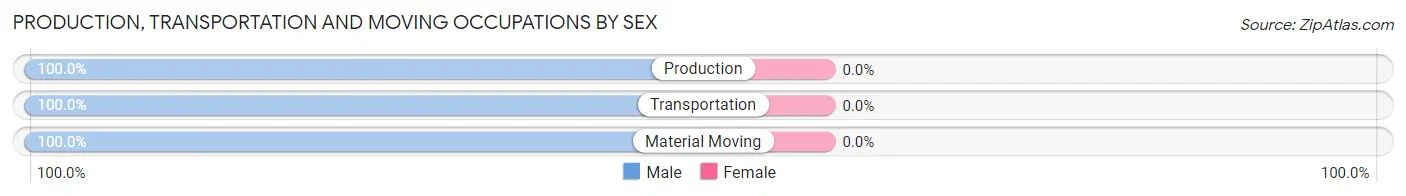
| Occupation | Male | Female |
| Production | 35 (100.0%) | 0 (0.0%) |
| Transportation | 85 (100.0%) | 0 (0.0%) |
| Material Moving | 23 (100.0%) | 0 (0.0%) |
| Total (Category) | 143 (100.0%) | 0 (0.0%) |
| Total (Overall) | 260 (71.8%) | 102 (28.2%) |
Employment Industries by Sex in Woodland Heights
Employment Industries in Woodland Heights
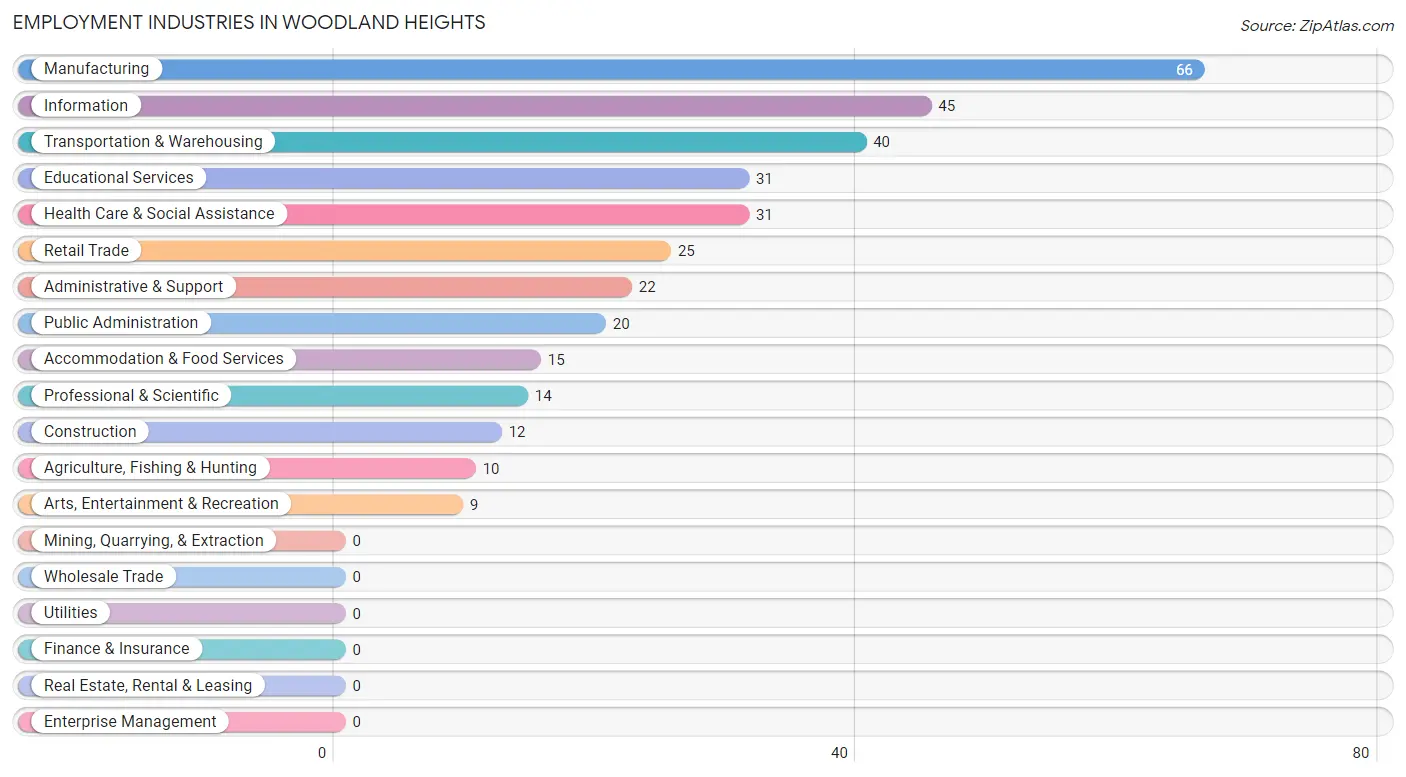
The major employment industries in Woodland Heights include Manufacturing (66 | 18.2%), Information (45 | 12.4%), Transportation & Warehousing (40 | 11.1%), Educational Services (31 | 8.6%), and Health Care & Social Assistance (31 | 8.6%).
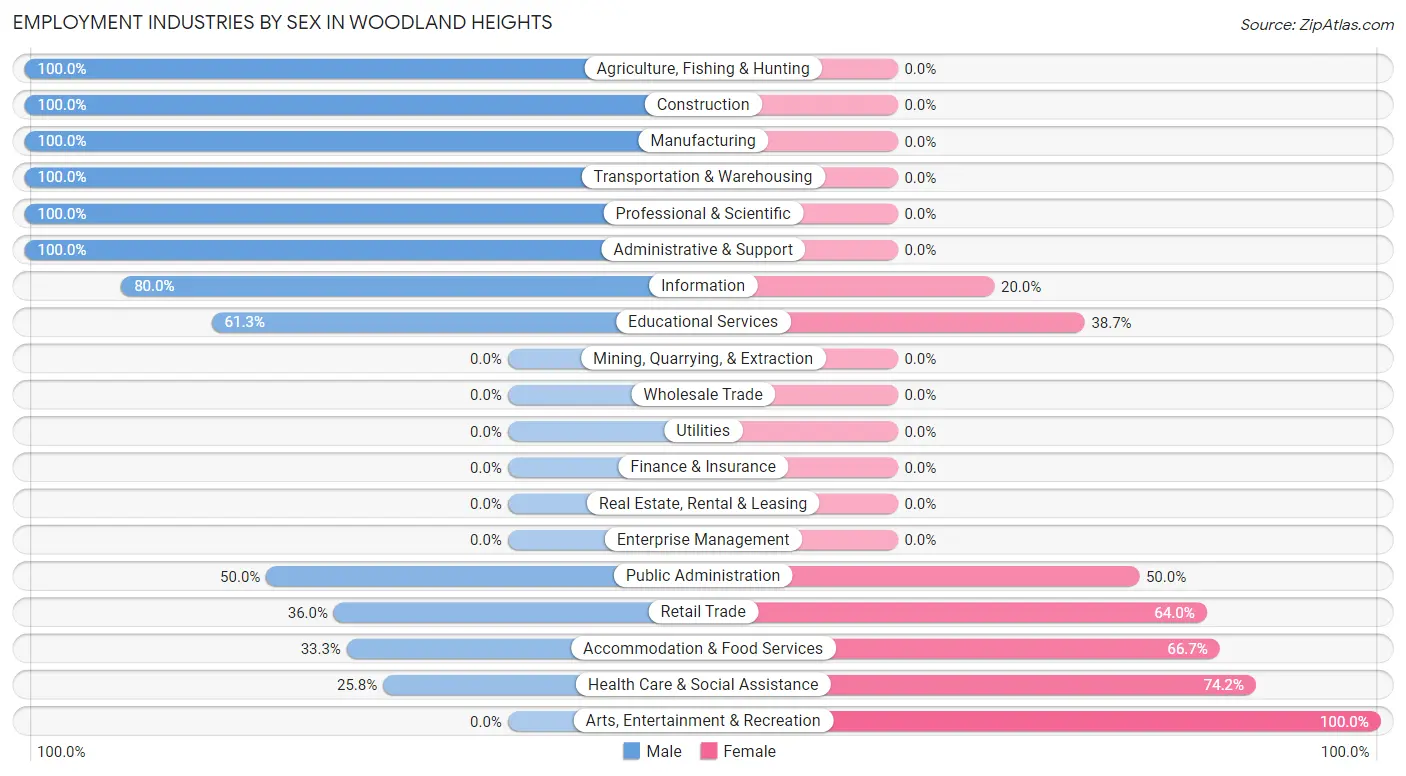
Employment Industries by Sex in Woodland Heights
The Woodland Heights industries that see more men than women are Agriculture, Fishing & Hunting (100.0%), Construction (100.0%), and Manufacturing (100.0%), whereas the industries that tend to have a higher number of women are Arts, Entertainment & Recreation (100.0%), Health Care & Social Assistance (74.2%), and Accommodation & Food Services (66.7%).
| Industry | Male | Female |
| Agriculture, Fishing & Hunting | 10 (100.0%) | 0 (0.0%) |
| Mining, Quarrying, & Extraction | 0 (0.0%) | 0 (0.0%) |
| Construction | 12 (100.0%) | 0 (0.0%) |
| Manufacturing | 66 (100.0%) | 0 (0.0%) |
| Wholesale Trade | 0 (0.0%) | 0 (0.0%) |
| Retail Trade | 9 (36.0%) | 16 (64.0%) |
| Transportation & Warehousing | 40 (100.0%) | 0 (0.0%) |
| Utilities | 0 (0.0%) | 0 (0.0%) |
| Information | 36 (80.0%) | 9 (20.0%) |
| Finance & Insurance | 0 (0.0%) | 0 (0.0%) |
| Real Estate, Rental & Leasing | 0 (0.0%) | 0 (0.0%) |
| Professional & Scientific | 14 (100.0%) | 0 (0.0%) |
| Enterprise Management | 0 (0.0%) | 0 (0.0%) |
| Administrative & Support | 22 (100.0%) | 0 (0.0%) |
| Educational Services | 19 (61.3%) | 12 (38.7%) |
| Health Care & Social Assistance | 8 (25.8%) | 23 (74.2%) |
| Arts, Entertainment & Recreation | 0 (0.0%) | 9 (100.0%) |
| Accommodation & Food Services | 5 (33.3%) | 10 (66.7%) |
| Public Administration | 10 (50.0%) | 10 (50.0%) |
| Total | 260 (71.8%) | 102 (28.2%) |
Education in Woodland Heights
School Enrollment in Woodland Heights
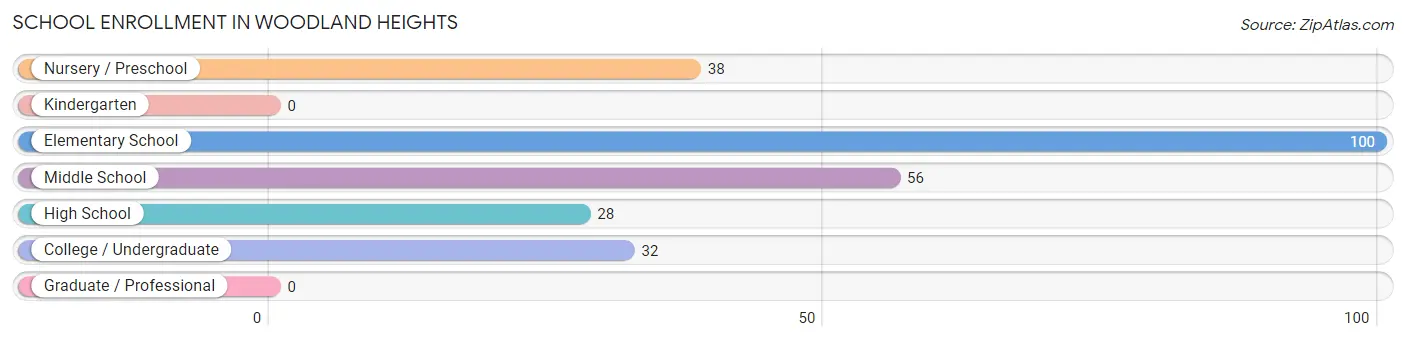
The most common levels of schooling among the 254 students in Woodland Heights are elementary school (100 | 39.4%), middle school (56 | 22.1%), and nursery / preschool (38 | 15.0%).
| School Level | # Students | % Students |
| Nursery / Preschool | 38 | 15.0% |
| Kindergarten | 0 | 0.0% |
| Elementary School | 100 | 39.4% |
| Middle School | 56 | 22.1% |
| High School | 28 | 11.0% |
| College / Undergraduate | 32 | 12.6% |
| Graduate / Professional | 0 | 0.0% |
| Total | 254 | 100.0% |
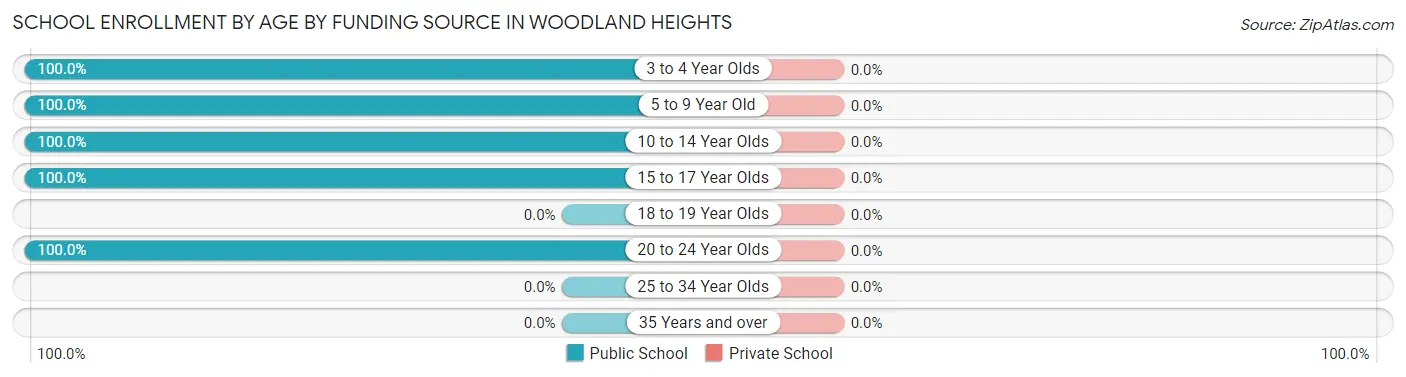
School Enrollment by Age by Funding Source in Woodland Heights
| Age Bracket | Public School | Private School |
| 3 to 4 Year Olds | 30 (100.0%) | 0 (0.0%) |
| 5 to 9 Year Old | 99 (100.0%) | 0 (0.0%) |
| 10 to 14 Year Olds | 65 (100.0%) | 0 (0.0%) |
| 15 to 17 Year Olds | 28 (100.0%) | 0 (0.0%) |
| 18 to 19 Year Olds | 0 (0.0%) | 0 (0.0%) |
| 20 to 24 Year Olds | 32 (100.0%) | 0 (0.0%) |
| 25 to 34 Year Olds | 0 (0.0%) | 0 (0.0%) |
| 35 Years and over | 0 (0.0%) | 0 (0.0%) |
| Total | 254 (100.0%) | 0 (0.0%) |
Educational Attainment by Field of Study in Woodland Heights
Social sciences (46 | 28.6%), science & technology (29 | 18.0%), education (28 | 17.4%), business (20 | 12.4%), and engineering (17 | 10.6%) are the most common fields of study among 161 individuals in Woodland Heights who have obtained a bachelor's degree or higher.
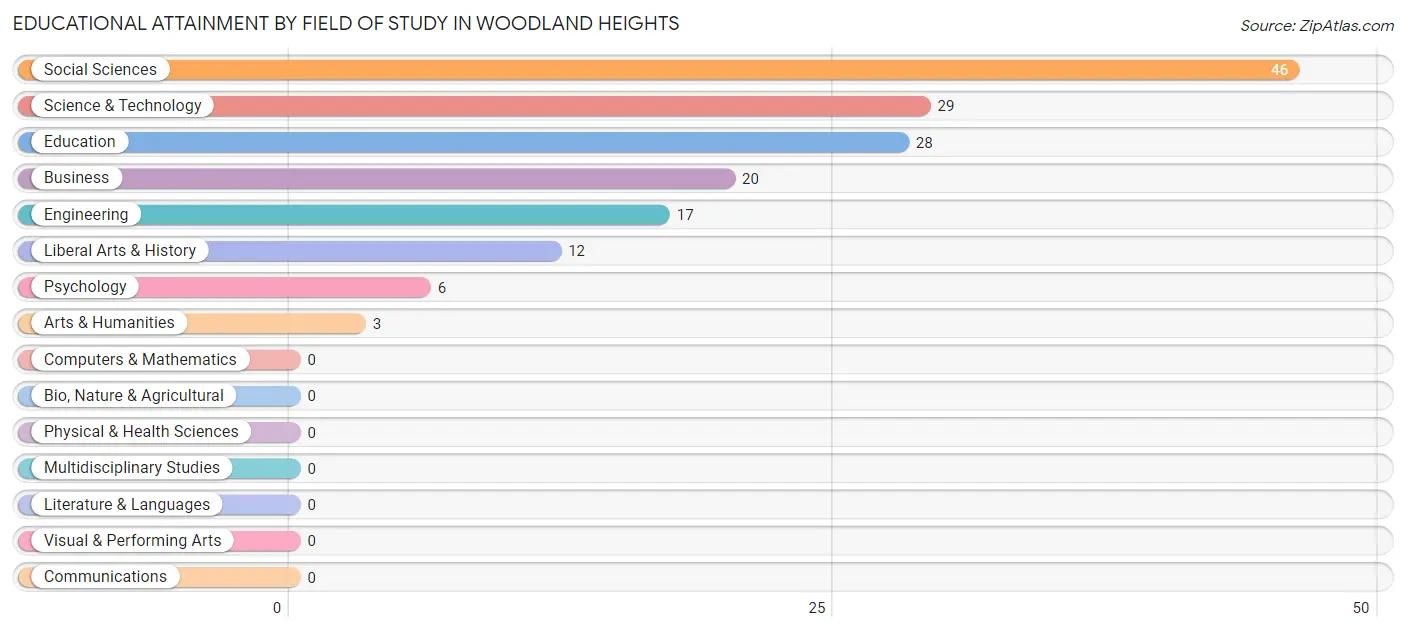
| Field of Study | # Graduates | % Graduates |
| Computers & Mathematics | 0 | 0.0% |
| Bio, Nature & Agricultural | 0 | 0.0% |
| Physical & Health Sciences | 0 | 0.0% |
| Psychology | 6 | 3.7% |
| Social Sciences | 46 | 28.6% |
| Engineering | 17 | 10.6% |
| Multidisciplinary Studies | 0 | 0.0% |
| Science & Technology | 29 | 18.0% |
| Business | 20 | 12.4% |
| Education | 28 | 17.4% |
| Literature & Languages | 0 | 0.0% |
| Liberal Arts & History | 12 | 7.4% |
| Visual & Performing Arts | 0 | 0.0% |
| Communications | 0 | 0.0% |
| Arts & Humanities | 3 | 1.9% |
| Total | 161 | 100.0% |
Transportation & Commute in Woodland Heights
Vehicle Availability by Sex in Woodland Heights
The most prevalent vehicle ownership categories in Woodland Heights are males with 2 vehicles (123, accounting for 49.0%) and females with 2 vehicles (55, making up 126.8%).
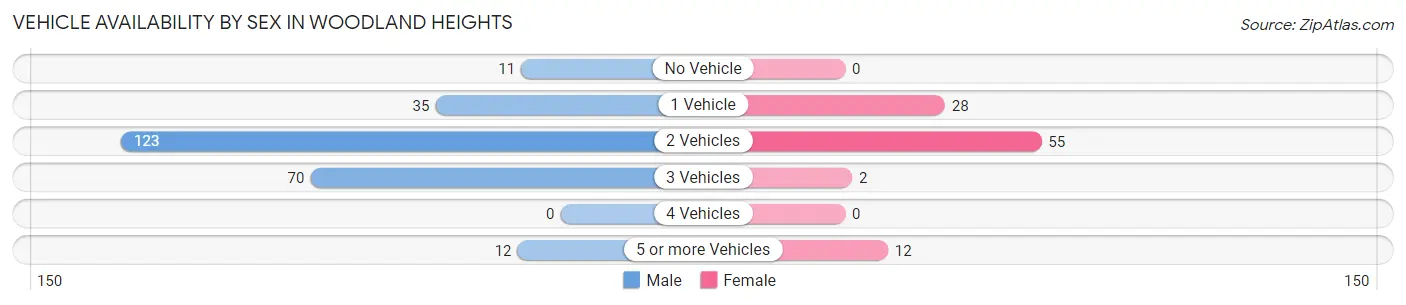
| Vehicles Available | Male | Female |
| No Vehicle | 11 (4.4%) | 0 (0.0%) |
| 1 Vehicle | 35 (13.9%) | 28 (28.9%) |
| 2 Vehicles | 123 (49.0%) | 55 (56.7%) |
| 3 Vehicles | 70 (27.9%) | 2 (2.1%) |
| 4 Vehicles | 0 (0.0%) | 0 (0.0%) |
| 5 or more Vehicles | 12 (4.8%) | 12 (12.4%) |
| Total | 251 (100.0%) | 97 (100.0%) |
Commute Time in Woodland Heights
The most frequently occuring commute durations in Woodland Heights are 30 to 34 minutes (50 commuters, 14.9%), 90 or more minutes (45 commuters, 13.4%), and 20 to 24 minutes (42 commuters, 12.5%).
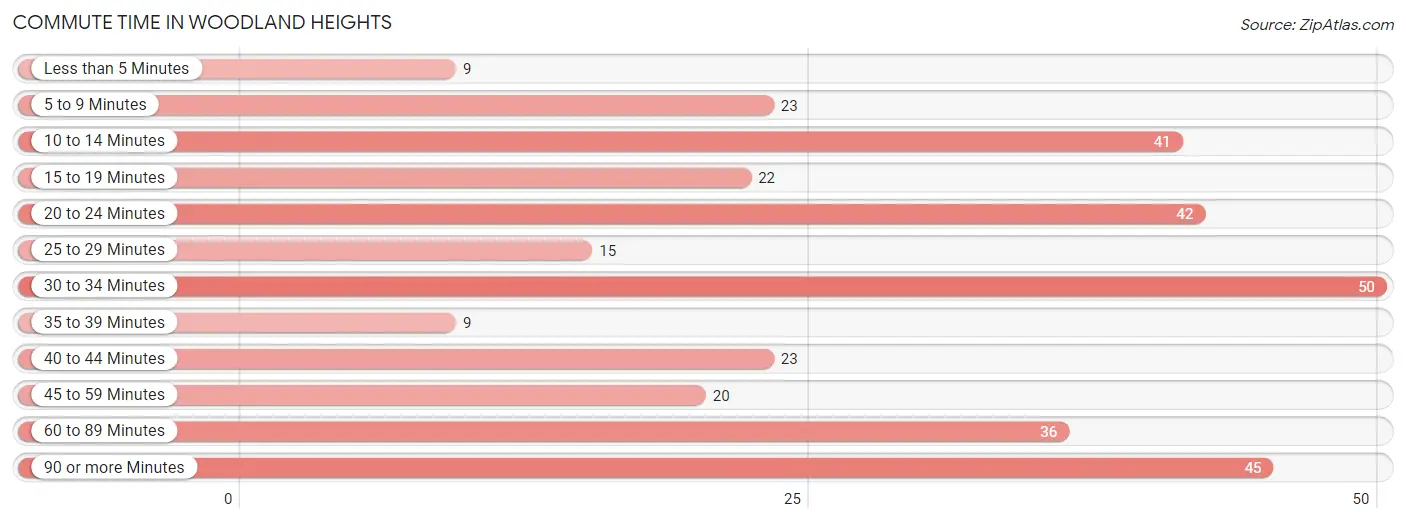
| Commute Time | # Commuters | % Commuters |
| Less than 5 Minutes | 9 | 2.7% |
| 5 to 9 Minutes | 23 | 6.9% |
| 10 to 14 Minutes | 41 | 12.2% |
| 15 to 19 Minutes | 22 | 6.6% |
| 20 to 24 Minutes | 42 | 12.5% |
| 25 to 29 Minutes | 15 | 4.5% |
| 30 to 34 Minutes | 50 | 14.9% |
| 35 to 39 Minutes | 9 | 2.7% |
| 40 to 44 Minutes | 23 | 6.9% |
| 45 to 59 Minutes | 20 | 6.0% |
| 60 to 89 Minutes | 36 | 10.7% |
| 90 or more Minutes | 45 | 13.4% |
Commute Time by Sex in Woodland Heights
The most common commute times in Woodland Heights are 30 to 34 minutes (50 commuters, 19.9%) for males and 20 to 24 minutes (42 commuters, 50.0%) for females.
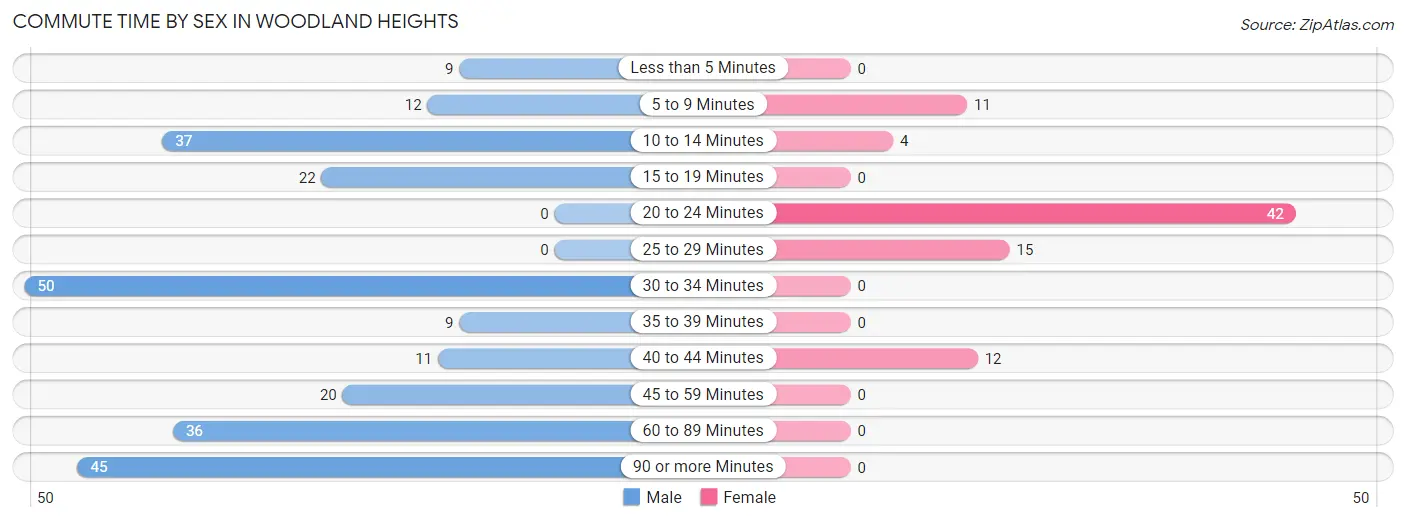
| Commute Time | Male | Female |
| Less than 5 Minutes | 9 (3.6%) | 0 (0.0%) |
| 5 to 9 Minutes | 12 (4.8%) | 11 (13.1%) |
| 10 to 14 Minutes | 37 (14.7%) | 4 (4.8%) |
| 15 to 19 Minutes | 22 (8.8%) | 0 (0.0%) |
| 20 to 24 Minutes | 0 (0.0%) | 42 (50.0%) |
| 25 to 29 Minutes | 0 (0.0%) | 15 (17.9%) |
| 30 to 34 Minutes | 50 (19.9%) | 0 (0.0%) |
| 35 to 39 Minutes | 9 (3.6%) | 0 (0.0%) |
| 40 to 44 Minutes | 11 (4.4%) | 12 (14.3%) |
| 45 to 59 Minutes | 20 (8.0%) | 0 (0.0%) |
| 60 to 89 Minutes | 36 (14.3%) | 0 (0.0%) |
| 90 or more Minutes | 45 (17.9%) | 0 (0.0%) |
Time of Departure to Work by Sex in Woodland Heights
The most frequent times of departure to work in Woodland Heights are 12:00 AM to 4:59 AM (57, 22.7%) for males and 6:00 AM to 6:29 AM (23, 27.4%) for females.
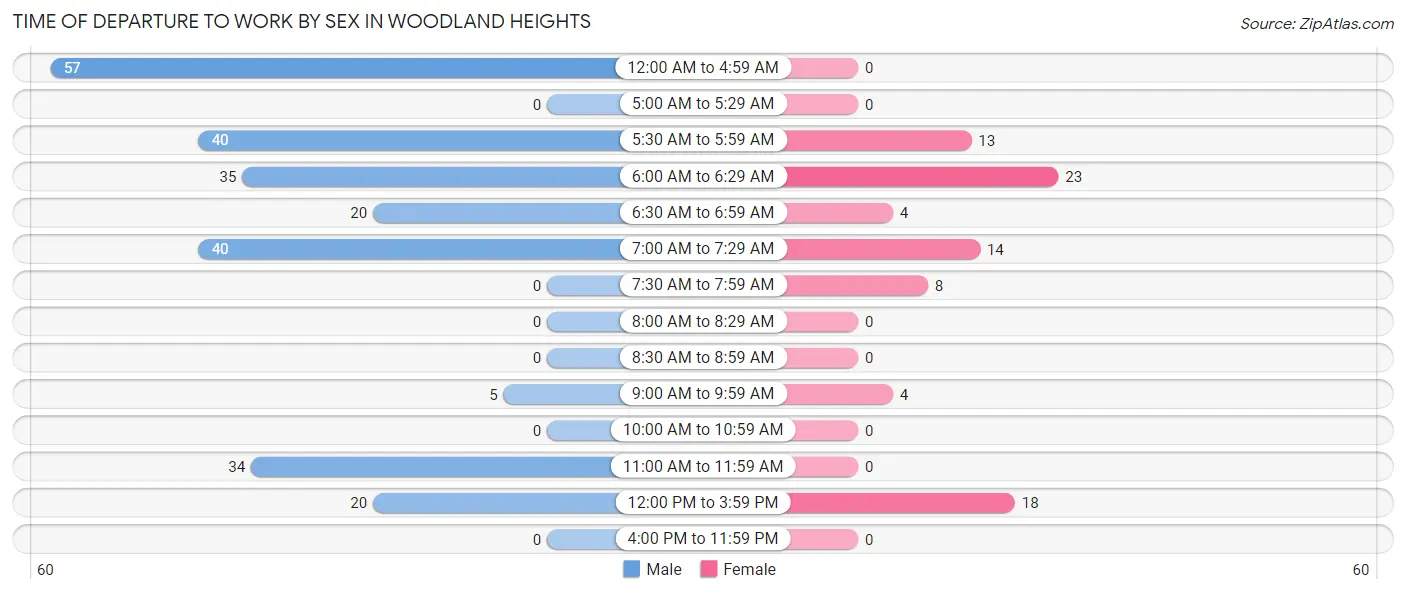
| Time of Departure | Male | Female |
| 12:00 AM to 4:59 AM | 57 (22.7%) | 0 (0.0%) |
| 5:00 AM to 5:29 AM | 0 (0.0%) | 0 (0.0%) |
| 5:30 AM to 5:59 AM | 40 (15.9%) | 13 (15.5%) |
| 6:00 AM to 6:29 AM | 35 (13.9%) | 23 (27.4%) |
| 6:30 AM to 6:59 AM | 20 (8.0%) | 4 (4.8%) |
| 7:00 AM to 7:29 AM | 40 (15.9%) | 14 (16.7%) |
| 7:30 AM to 7:59 AM | 0 (0.0%) | 8 (9.5%) |
| 8:00 AM to 8:29 AM | 0 (0.0%) | 0 (0.0%) |
| 8:30 AM to 8:59 AM | 0 (0.0%) | 0 (0.0%) |
| 9:00 AM to 9:59 AM | 5 (2.0%) | 4 (4.8%) |
| 10:00 AM to 10:59 AM | 0 (0.0%) | 0 (0.0%) |
| 11:00 AM to 11:59 AM | 34 (13.6%) | 0 (0.0%) |
| 12:00 PM to 3:59 PM | 20 (8.0%) | 18 (21.4%) |
| 4:00 PM to 11:59 PM | 0 (0.0%) | 0 (0.0%) |
| Total | 251 (100.0%) | 84 (100.0%) |
Housing Occupancy in Woodland Heights
Occupancy by Ownership in Woodland Heights
Of the total 552 dwellings in Woodland Heights, owner-occupied units account for 248 (44.9%), while renter-occupied units make up 304 (55.1%).
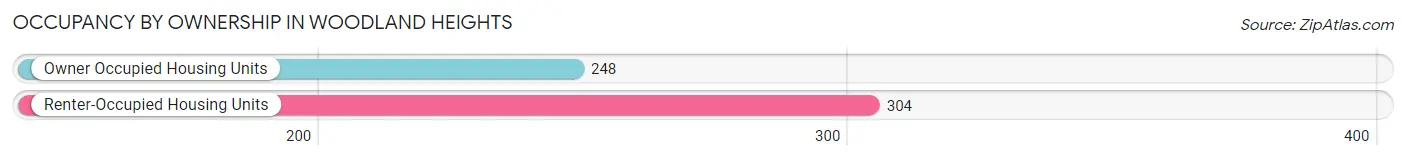
| Occupancy | # Housing Units | % Housing Units |
| Owner Occupied Housing Units | 248 | 44.9% |
| Renter-Occupied Housing Units | 304 | 55.1% |
| Total Occupied Housing Units | 552 | 100.0% |
Occupancy by Household Size in Woodland Heights
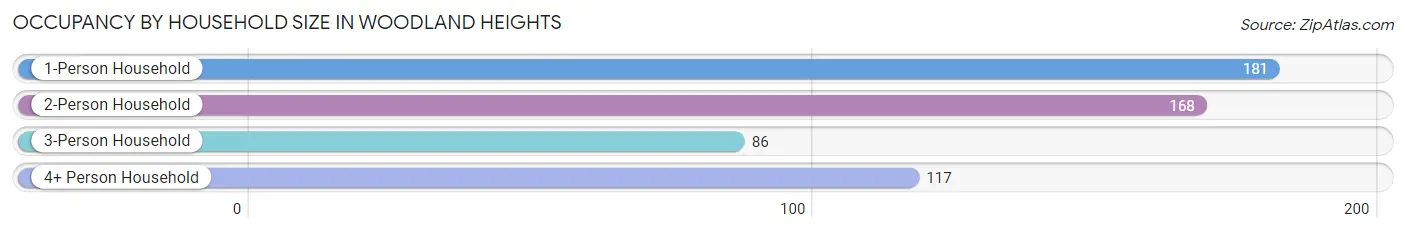
| Household Size | # Housing Units | % Housing Units |
| 1-Person Household | 181 | 32.8% |
| 2-Person Household | 168 | 30.4% |
| 3-Person Household | 86 | 15.6% |
| 4+ Person Household | 117 | 21.2% |
| Total Housing Units | 552 | 100.0% |
Occupancy by Ownership by Household Size in Woodland Heights
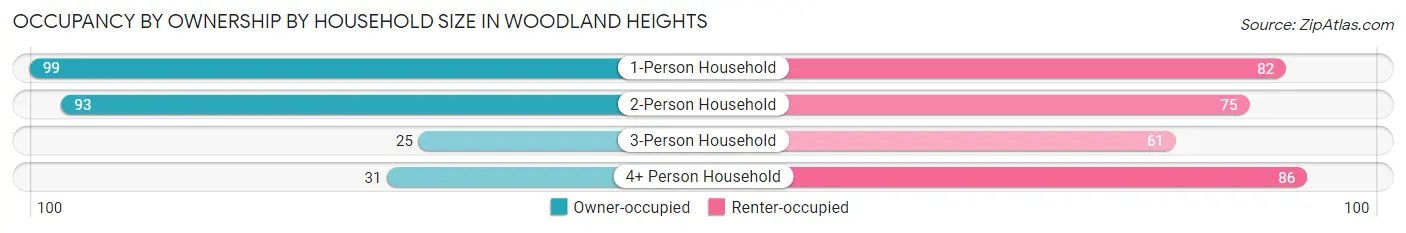
| Household Size | Owner-occupied | Renter-occupied |
| 1-Person Household | 99 (54.7%) | 82 (45.3%) |
| 2-Person Household | 93 (55.4%) | 75 (44.6%) |
| 3-Person Household | 25 (29.1%) | 61 (70.9%) |
| 4+ Person Household | 31 (26.5%) | 86 (73.5%) |
| Total Housing Units | 248 (44.9%) | 304 (55.1%) |
Occupancy by Educational Attainment in Woodland Heights
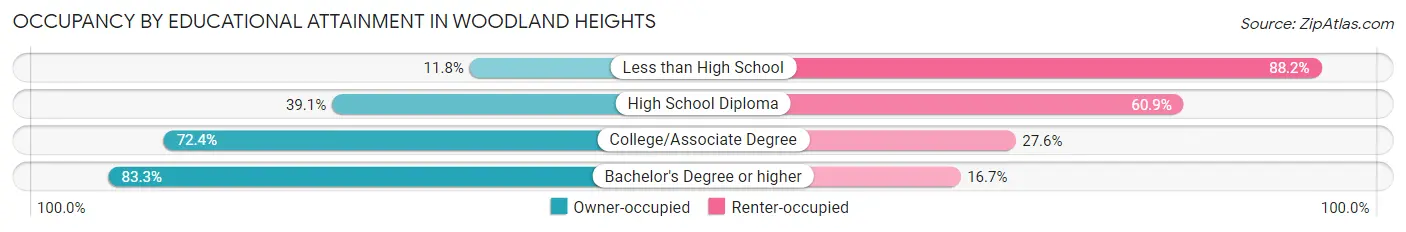
| Household Size | Owner-occupied | Renter-occupied |
| Less than High School | 10 (11.8%) | 75 (88.2%) |
| High School Diploma | 125 (39.1%) | 195 (60.9%) |
| College/Associate Degree | 63 (72.4%) | 24 (27.6%) |
| Bachelor's Degree or higher | 50 (83.3%) | 10 (16.7%) |
Occupancy by Age of Householder in Woodland Heights
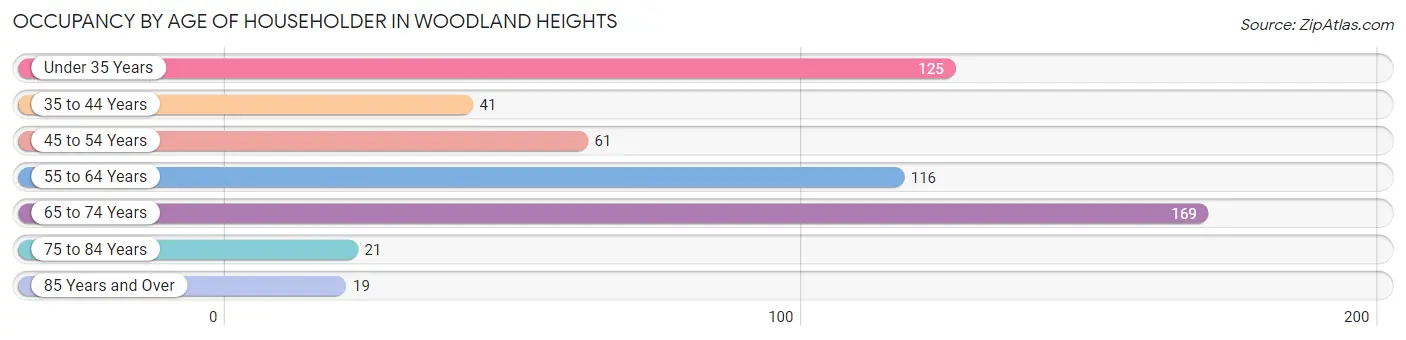
| Age Bracket | # Households | % Households |
| Under 35 Years | 125 | 22.6% |
| 35 to 44 Years | 41 | 7.4% |
| 45 to 54 Years | 61 | 11.1% |
| 55 to 64 Years | 116 | 21.0% |
| 65 to 74 Years | 169 | 30.6% |
| 75 to 84 Years | 21 | 3.8% |
| 85 Years and Over | 19 | 3.4% |
| Total | 552 | 100.0% |
Housing Finances in Woodland Heights
Median Income by Occupancy in Woodland Heights
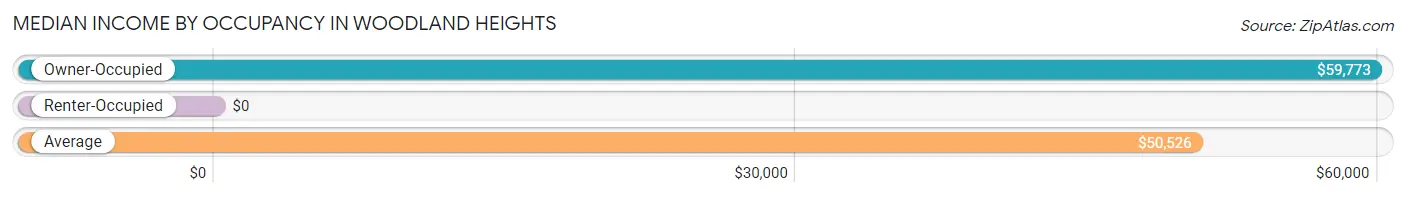
| Occupancy Type | # Households | Median Income |
| Owner-Occupied | 248 (44.9%) | $59,773 |
| Renter-Occupied | 304 (55.1%) | $0 |
| Average | 552 (100.0%) | $50,526 |
Occupancy by Householder Income Bracket in Woodland Heights
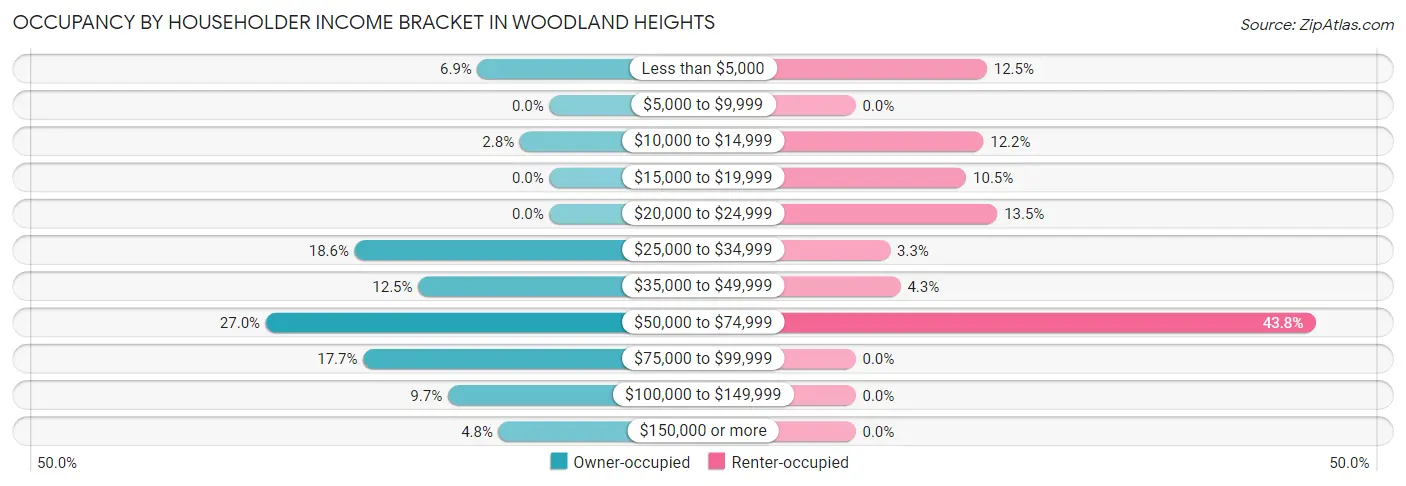
| Income Bracket | Owner-occupied | Renter-occupied |
| Less than $5,000 | 17 (6.9%) | 38 (12.5%) |
| $5,000 to $9,999 | 0 (0.0%) | 0 (0.0%) |
| $10,000 to $14,999 | 7 (2.8%) | 37 (12.2%) |
| $15,000 to $19,999 | 0 (0.0%) | 32 (10.5%) |
| $20,000 to $24,999 | 0 (0.0%) | 41 (13.5%) |
| $25,000 to $34,999 | 46 (18.5%) | 10 (3.3%) |
| $35,000 to $49,999 | 31 (12.5%) | 13 (4.3%) |
| $50,000 to $74,999 | 67 (27.0%) | 133 (43.8%) |
| $75,000 to $99,999 | 44 (17.7%) | 0 (0.0%) |
| $100,000 to $149,999 | 24 (9.7%) | 0 (0.0%) |
| $150,000 or more | 12 (4.8%) | 0 (0.0%) |
| Total | 248 (100.0%) | 304 (100.0%) |
Monthly Housing Cost Tiers in Woodland Heights
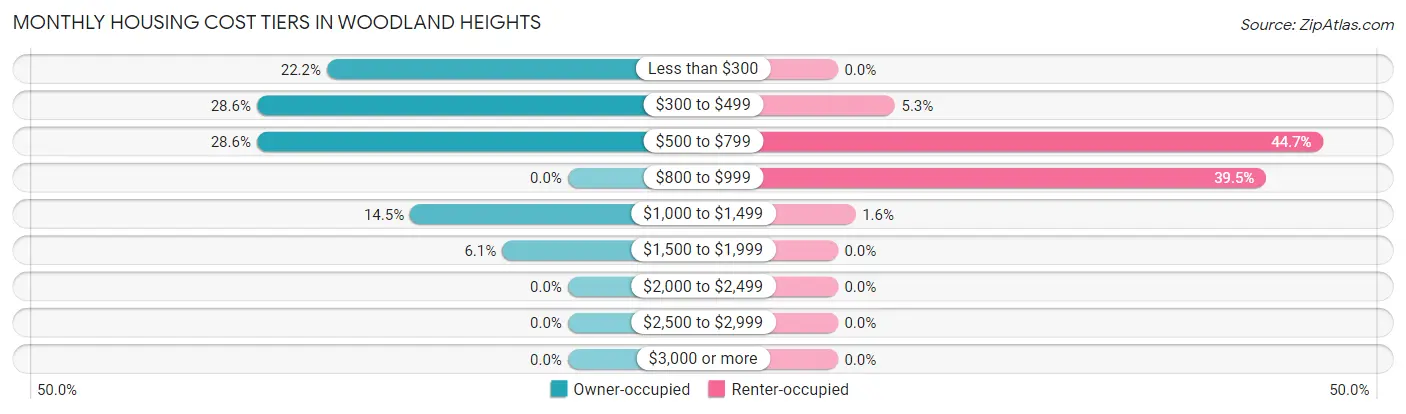
| Monthly Cost | Owner-occupied | Renter-occupied |
| Less than $300 | 55 (22.2%) | 0 (0.0%) |
| $300 to $499 | 71 (28.6%) | 16 (5.3%) |
| $500 to $799 | 71 (28.6%) | 136 (44.7%) |
| $800 to $999 | 0 (0.0%) | 120 (39.5%) |
| $1,000 to $1,499 | 36 (14.5%) | 5 (1.6%) |
| $1,500 to $1,999 | 15 (6.0%) | 0 (0.0%) |
| $2,000 to $2,499 | 0 (0.0%) | 0 (0.0%) |
| $2,500 to $2,999 | 0 (0.0%) | 0 (0.0%) |
| $3,000 or more | 0 (0.0%) | 0 (0.0%) |
| Total | 248 (100.0%) | 304 (100.0%) |
Physical Housing Characteristics in Woodland Heights
Housing Structures in Woodland Heights
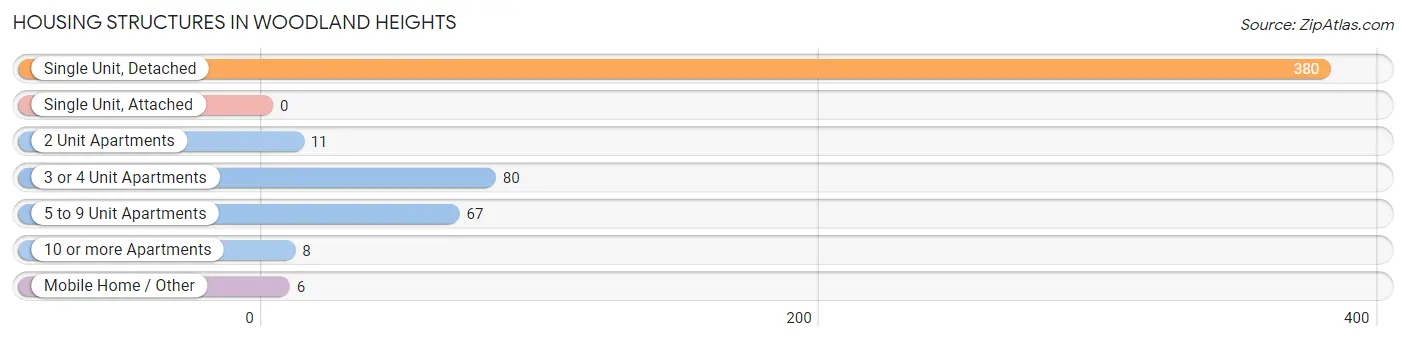
| Structure Type | # Housing Units | % Housing Units |
| Single Unit, Detached | 380 | 68.8% |
| Single Unit, Attached | 0 | 0.0% |
| 2 Unit Apartments | 11 | 2.0% |
| 3 or 4 Unit Apartments | 80 | 14.5% |
| 5 to 9 Unit Apartments | 67 | 12.1% |
| 10 or more Apartments | 8 | 1.5% |
| Mobile Home / Other | 6 | 1.1% |
| Total | 552 | 100.0% |
Housing Structures by Occupancy in Woodland Heights
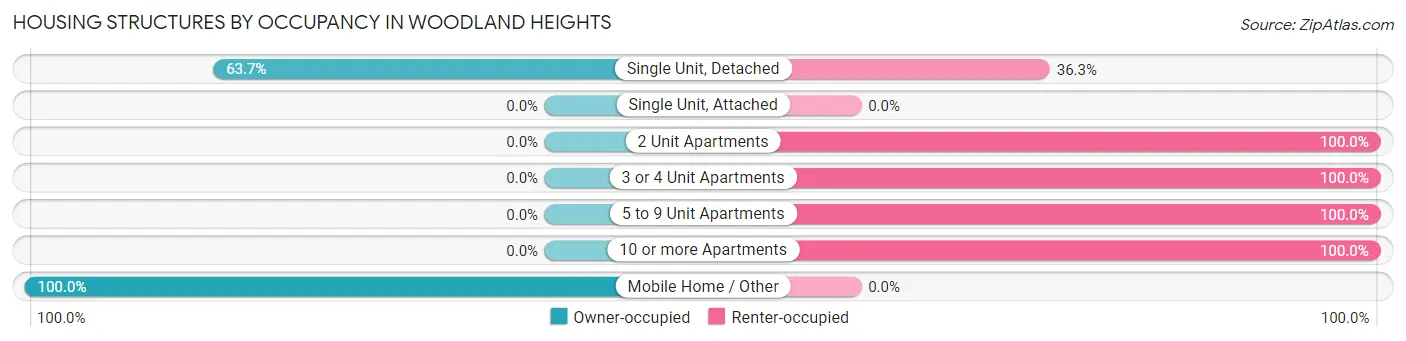
| Structure Type | Owner-occupied | Renter-occupied |
| Single Unit, Detached | 242 (63.7%) | 138 (36.3%) |
| Single Unit, Attached | 0 (0.0%) | 0 (0.0%) |
| 2 Unit Apartments | 0 (0.0%) | 11 (100.0%) |
| 3 or 4 Unit Apartments | 0 (0.0%) | 80 (100.0%) |
| 5 to 9 Unit Apartments | 0 (0.0%) | 67 (100.0%) |
| 10 or more Apartments | 0 (0.0%) | 8 (100.0%) |
| Mobile Home / Other | 6 (100.0%) | 0 (0.0%) |
| Total | 248 (44.9%) | 304 (55.1%) |
Housing Structures by Number of Rooms in Woodland Heights
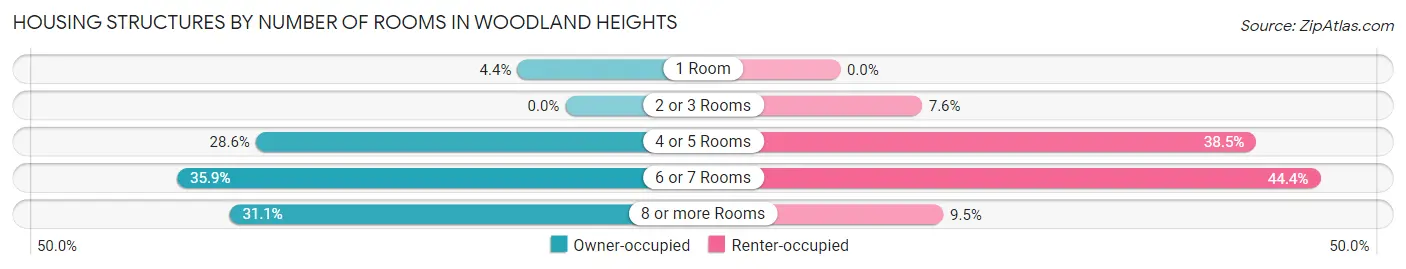
| Number of Rooms | Owner-occupied | Renter-occupied |
| 1 Room | 11 (4.4%) | 0 (0.0%) |
| 2 or 3 Rooms | 0 (0.0%) | 23 (7.6%) |
| 4 or 5 Rooms | 71 (28.6%) | 117 (38.5%) |
| 6 or 7 Rooms | 89 (35.9%) | 135 (44.4%) |
| 8 or more Rooms | 77 (31.0%) | 29 (9.5%) |
| Total | 248 (100.0%) | 304 (100.0%) |
Housing Structure by Heating Type in Woodland Heights
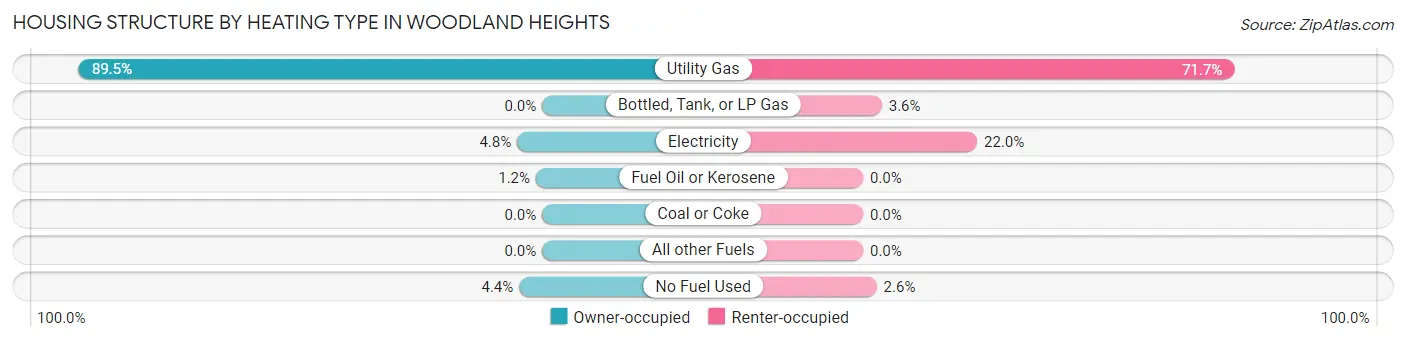
| Heating Type | Owner-occupied | Renter-occupied |
| Utility Gas | 222 (89.5%) | 218 (71.7%) |
| Bottled, Tank, or LP Gas | 0 (0.0%) | 11 (3.6%) |
| Electricity | 12 (4.8%) | 67 (22.0%) |
| Fuel Oil or Kerosene | 3 (1.2%) | 0 (0.0%) |
| Coal or Coke | 0 (0.0%) | 0 (0.0%) |
| All other Fuels | 0 (0.0%) | 0 (0.0%) |
| No Fuel Used | 11 (4.4%) | 8 (2.6%) |
| Total | 248 (100.0%) | 304 (100.0%) |
Household Vehicle Usage in Woodland Heights
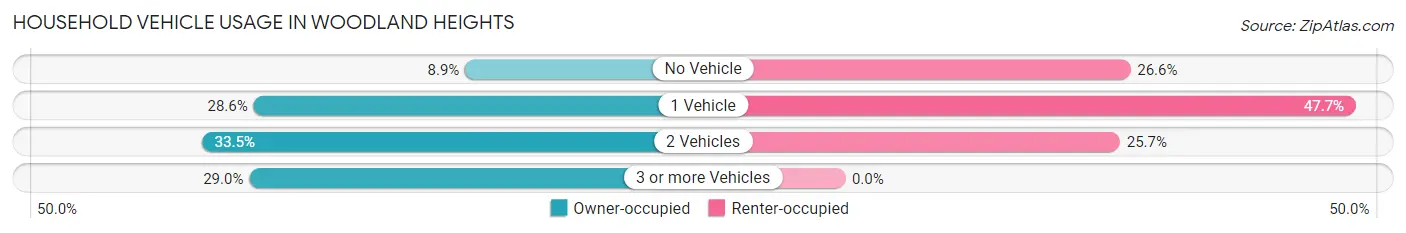
| Vehicles per Household | Owner-occupied | Renter-occupied |
| No Vehicle | 22 (8.9%) | 81 (26.6%) |
| 1 Vehicle | 71 (28.6%) | 145 (47.7%) |
| 2 Vehicles | 83 (33.5%) | 78 (25.7%) |
| 3 or more Vehicles | 72 (29.0%) | 0 (0.0%) |
| Total | 248 (100.0%) | 304 (100.0%) |
Real Estate & Mortgages in Woodland Heights
Real Estate and Mortgage Overview in Woodland Heights
| Characteristic | Without Mortgage | With Mortgage |
| Housing Units | 136 | 112 |
| Median Property Value | $108,000 | $160,600 |
| Median Household Income | $38,611 | $12 |
| Monthly Housing Costs | $332 | $0 |
| Real Estate Taxes | $903 | $0 |
Property Value by Mortgage Status in Woodland Heights
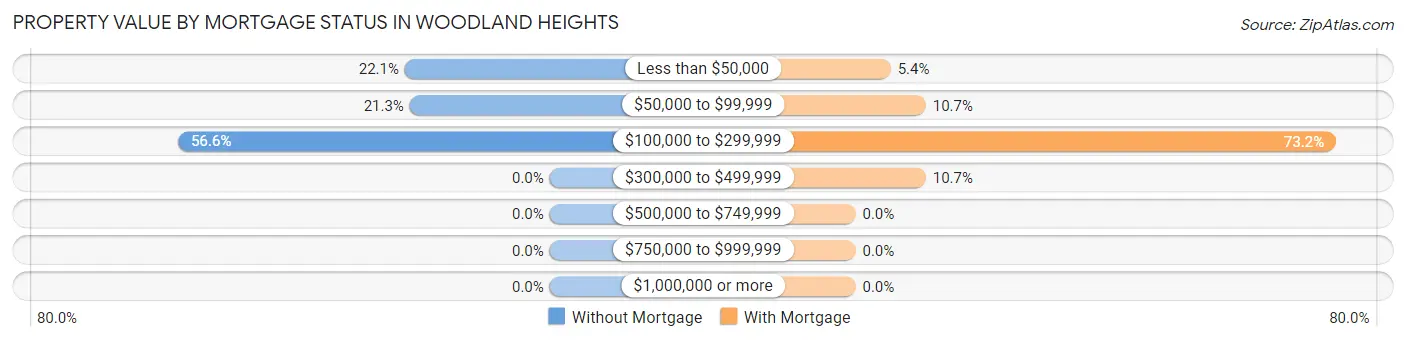
| Property Value | Without Mortgage | With Mortgage |
| Less than $50,000 | 30 (22.1%) | 6 (5.4%) |
| $50,000 to $99,999 | 29 (21.3%) | 12 (10.7%) |
| $100,000 to $299,999 | 77 (56.6%) | 82 (73.2%) |
| $300,000 to $499,999 | 0 (0.0%) | 12 (10.7%) |
| $500,000 to $749,999 | 0 (0.0%) | 0 (0.0%) |
| $750,000 to $999,999 | 0 (0.0%) | 0 (0.0%) |
| $1,000,000 or more | 0 (0.0%) | 0 (0.0%) |
| Total | 136 (100.0%) | 112 (100.0%) |
Household Income by Mortgage Status in Woodland Heights
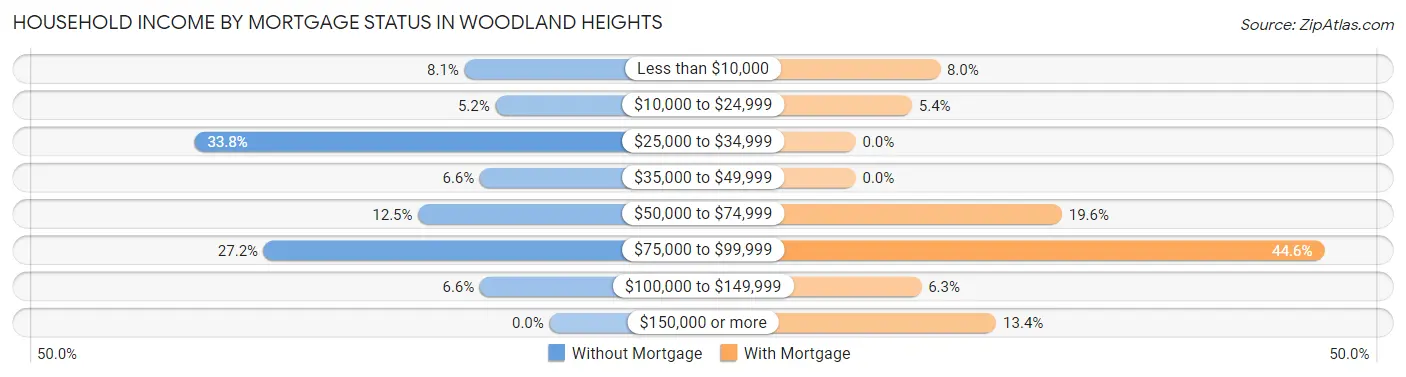
| Household Income | Without Mortgage | With Mortgage |
| Less than $10,000 | 11 (8.1%) | 9 (8.0%) |
| $10,000 to $24,999 | 7 (5.1%) | 6 (5.4%) |
| $25,000 to $34,999 | 46 (33.8%) | 0 (0.0%) |
| $35,000 to $49,999 | 9 (6.6%) | 0 (0.0%) |
| $50,000 to $74,999 | 17 (12.5%) | 22 (19.6%) |
| $75,000 to $99,999 | 37 (27.2%) | 50 (44.6%) |
| $100,000 to $149,999 | 9 (6.6%) | 7 (6.2%) |
| $150,000 or more | 0 (0.0%) | 15 (13.4%) |
| Total | 136 (100.0%) | 112 (100.0%) |
Property Value to Household Income Ratio in Woodland Heights
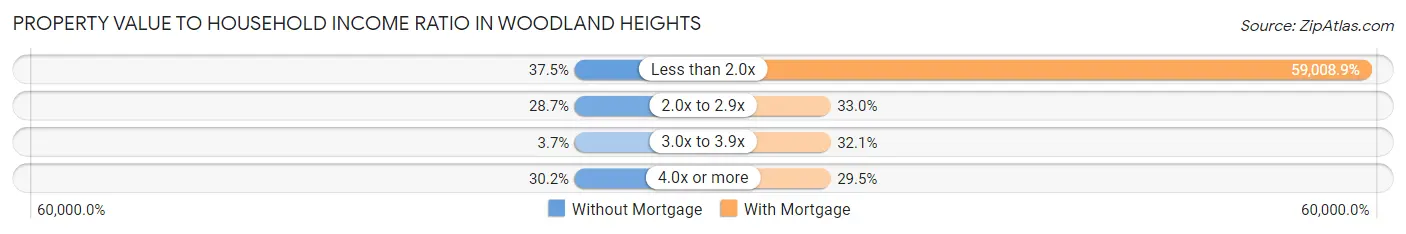
| Value-to-Income Ratio | Without Mortgage | With Mortgage |
| Less than 2.0x | 51 (37.5%) | 66,090 (59,008.9%) |
| 2.0x to 2.9x | 39 (28.7%) | 37 (33.0%) |
| 3.0x to 3.9x | 5 (3.7%) | 36 (32.1%) |
| 4.0x or more | 41 (30.1%) | 33 (29.5%) |
| Total | 136 (100.0%) | 112 (100.0%) |
Real Estate Taxes by Mortgage Status in Woodland Heights
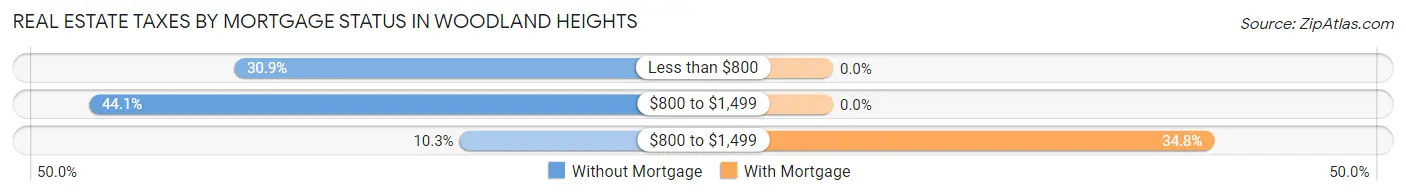
| Property Taxes | Without Mortgage | With Mortgage |
| Less than $800 | 42 (30.9%) | 0 (0.0%) |
| $800 to $1,499 | 60 (44.1%) | 0 (0.0%) |
| $800 to $1,499 | 14 (10.3%) | 39 (34.8%) |
| Total | 136 (100.0%) | 112 (100.0%) |
Health & Disability in Woodland Heights
Health Insurance Coverage by Age in Woodland Heights
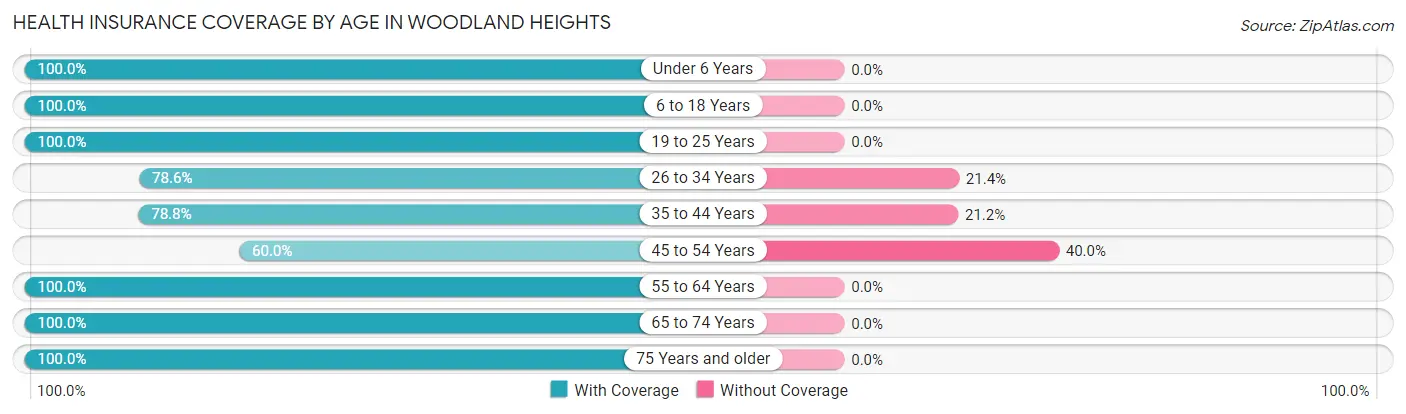
| Age Bracket | With Coverage | Without Coverage |
| Under 6 Years | 199 (100.0%) | 0 (0.0%) |
| 6 to 18 Years | 184 (100.0%) | 0 (0.0%) |
| 19 to 25 Years | 120 (100.0%) | 0 (0.0%) |
| 26 to 34 Years | 184 (78.6%) | 50 (21.4%) |
| 35 to 44 Years | 52 (78.8%) | 14 (21.2%) |
| 45 to 54 Years | 57 (60.0%) | 38 (40.0%) |
| 55 to 64 Years | 145 (100.0%) | 0 (0.0%) |
| 65 to 74 Years | 221 (100.0%) | 0 (0.0%) |
| 75 Years and older | 62 (100.0%) | 0 (0.0%) |
| Total | 1,224 (92.3%) | 102 (7.7%) |
Health Insurance Coverage by Citizenship Status in Woodland Heights
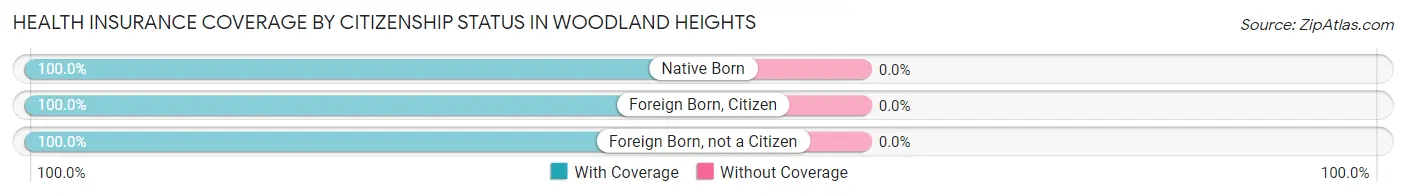
| Citizenship Status | With Coverage | Without Coverage |
| Native Born | 199 (100.0%) | 0 (0.0%) |
| Foreign Born, Citizen | 184 (100.0%) | 0 (0.0%) |
| Foreign Born, not a Citizen | 120 (100.0%) | 0 (0.0%) |
Health Insurance Coverage by Household Income in Woodland Heights
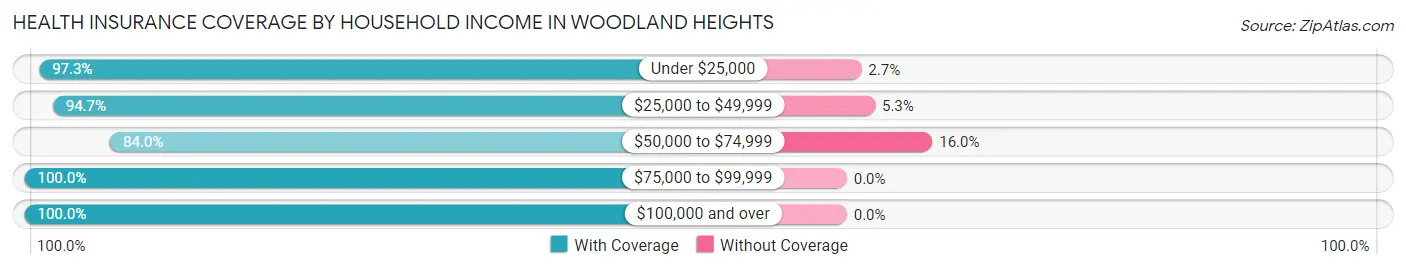
| Household Income | With Coverage | Without Coverage |
| Under $25,000 | 391 (97.3%) | 11 (2.7%) |
| $25,000 to $49,999 | 161 (94.7%) | 9 (5.3%) |
| $50,000 to $74,999 | 430 (84.0%) | 82 (16.0%) |
| $75,000 to $99,999 | 97 (100.0%) | 0 (0.0%) |
| $100,000 and over | 145 (100.0%) | 0 (0.0%) |
Public vs Private Health Insurance Coverage by Age in Woodland Heights
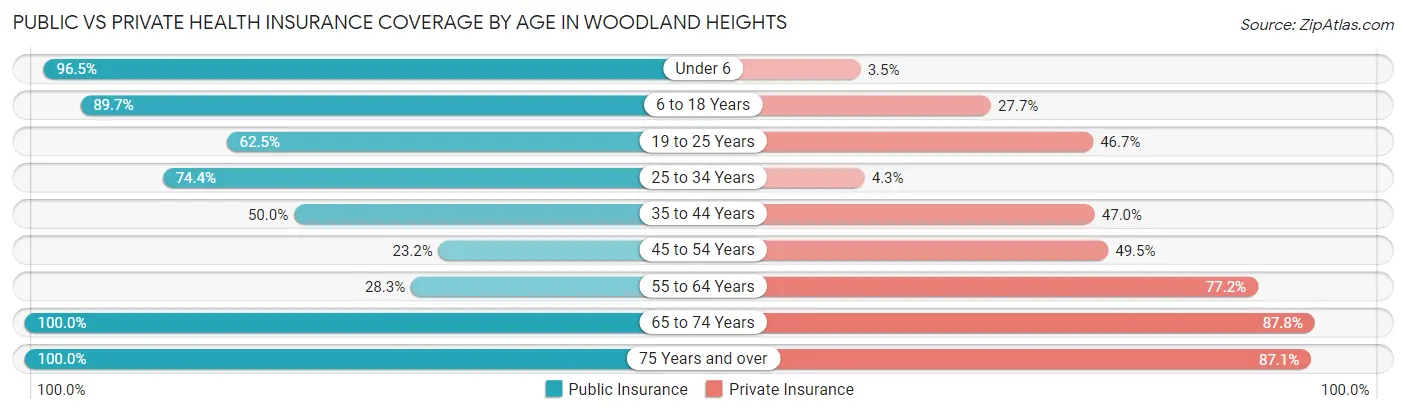
| Age Bracket | Public Insurance | Private Insurance |
| Under 6 | 192 (96.5%) | 7 (3.5%) |
| 6 to 18 Years | 165 (89.7%) | 51 (27.7%) |
| 19 to 25 Years | 75 (62.5%) | 56 (46.7%) |
| 25 to 34 Years | 174 (74.4%) | 10 (4.3%) |
| 35 to 44 Years | 33 (50.0%) | 31 (47.0%) |
| 45 to 54 Years | 22 (23.2%) | 47 (49.5%) |
| 55 to 64 Years | 41 (28.3%) | 112 (77.2%) |
| 65 to 74 Years | 221 (100.0%) | 194 (87.8%) |
| 75 Years and over | 62 (100.0%) | 54 (87.1%) |
| Total | 985 (74.3%) | 562 (42.4%) |
Disability Status by Sex by Age in Woodland Heights
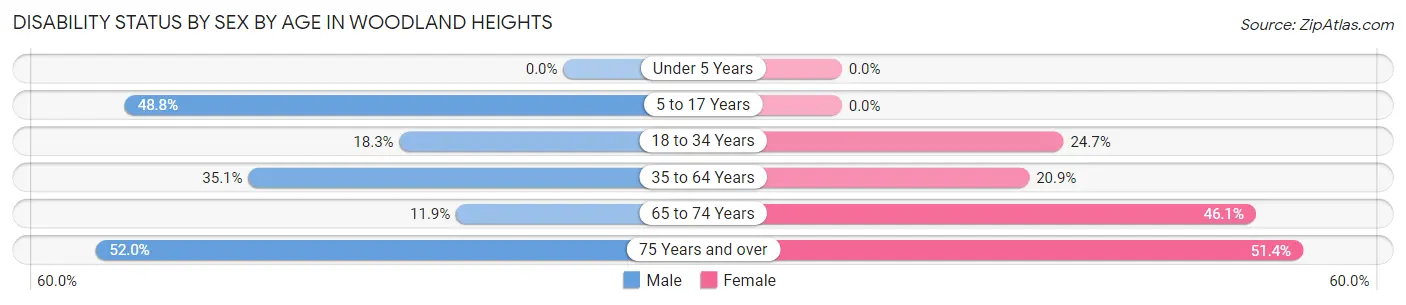
| Age Bracket | Male | Female |
| Under 5 Years | 0 (0.0%) | 0 (0.0%) |
| 5 to 17 Years | 63 (48.8%) | 0 (0.0%) |
| 18 to 34 Years | 21 (18.3%) | 59 (24.7%) |
| 35 to 64 Years | 67 (35.1%) | 24 (20.9%) |
| 65 to 74 Years | 8 (11.9%) | 71 (46.1%) |
| 75 Years and over | 13 (52.0%) | 19 (51.3%) |
Disability Class by Sex by Age in Woodland Heights
Disability Class: Hearing Difficulty
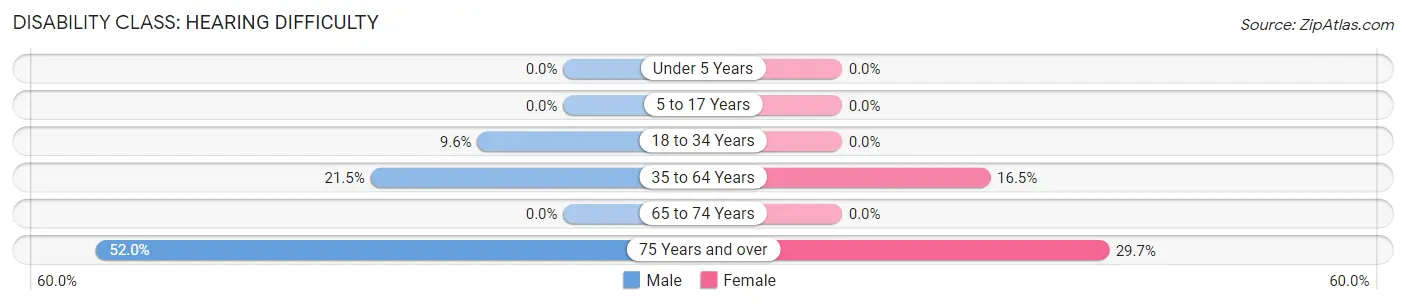
| Age Bracket | Male | Female |
| Under 5 Years | 0 (0.0%) | 0 (0.0%) |
| 5 to 17 Years | 0 (0.0%) | 0 (0.0%) |
| 18 to 34 Years | 11 (9.6%) | 0 (0.0%) |
| 35 to 64 Years | 41 (21.5%) | 19 (16.5%) |
| 65 to 74 Years | 0 (0.0%) | 0 (0.0%) |
| 75 Years and over | 13 (52.0%) | 11 (29.7%) |
Disability Class: Vision Difficulty
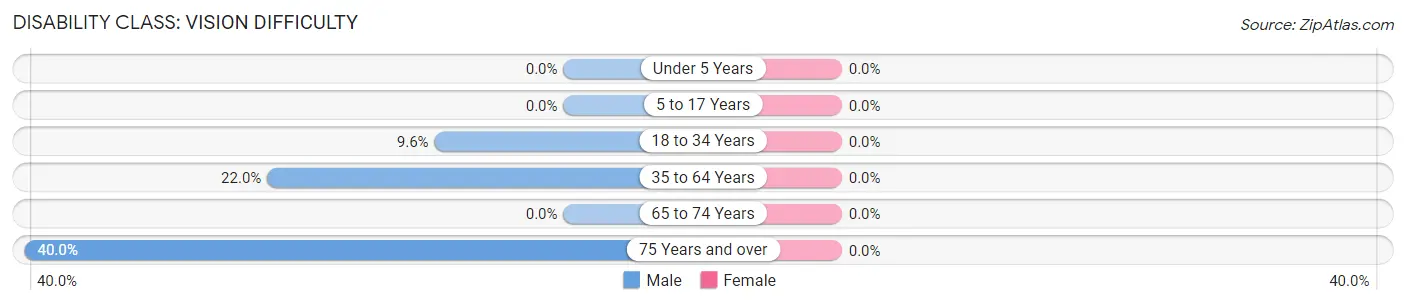
| Age Bracket | Male | Female |
| Under 5 Years | 0 (0.0%) | 0 (0.0%) |
| 5 to 17 Years | 0 (0.0%) | 0 (0.0%) |
| 18 to 34 Years | 11 (9.6%) | 0 (0.0%) |
| 35 to 64 Years | 42 (22.0%) | 0 (0.0%) |
| 65 to 74 Years | 0 (0.0%) | 0 (0.0%) |
| 75 Years and over | 10 (40.0%) | 0 (0.0%) |
Disability Class: Cognitive Difficulty
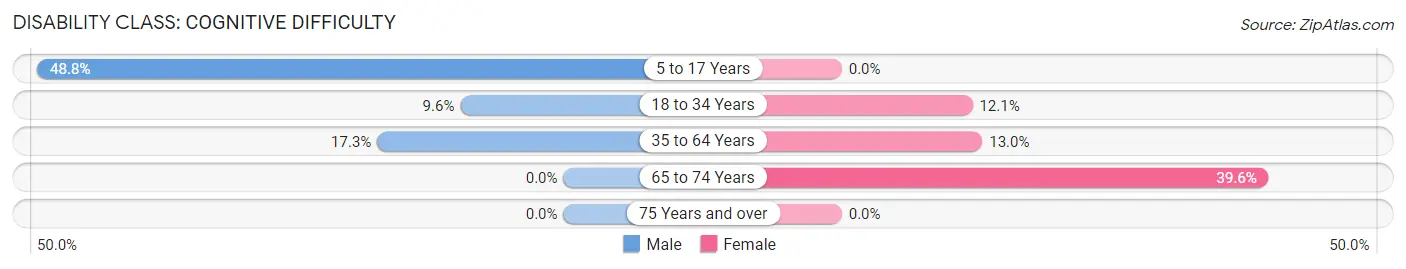
| Age Bracket | Male | Female |
| 5 to 17 Years | 63 (48.8%) | 0 (0.0%) |
| 18 to 34 Years | 11 (9.6%) | 29 (12.1%) |
| 35 to 64 Years | 33 (17.3%) | 15 (13.0%) |
| 65 to 74 Years | 0 (0.0%) | 61 (39.6%) |
| 75 Years and over | 0 (0.0%) | 0 (0.0%) |
Disability Class: Ambulatory Difficulty
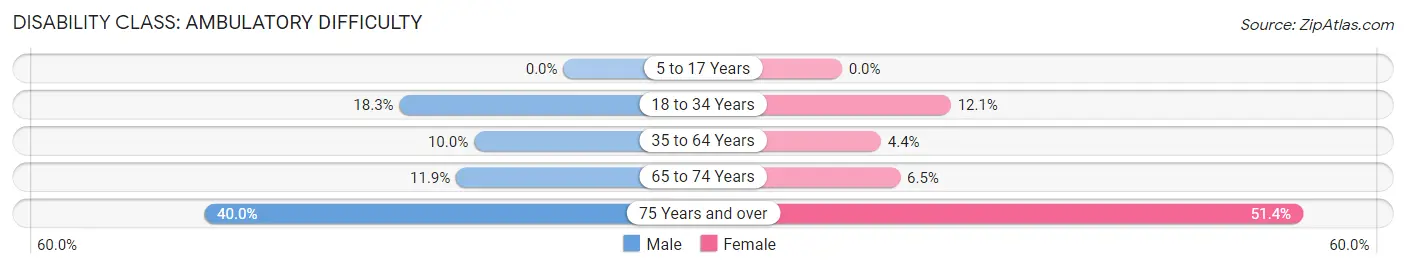
| Age Bracket | Male | Female |
| 5 to 17 Years | 0 (0.0%) | 0 (0.0%) |
| 18 to 34 Years | 21 (18.3%) | 29 (12.1%) |
| 35 to 64 Years | 19 (10.0%) | 5 (4.3%) |
| 65 to 74 Years | 8 (11.9%) | 10 (6.5%) |
| 75 Years and over | 10 (40.0%) | 19 (51.3%) |
Disability Class: Self-Care Difficulty
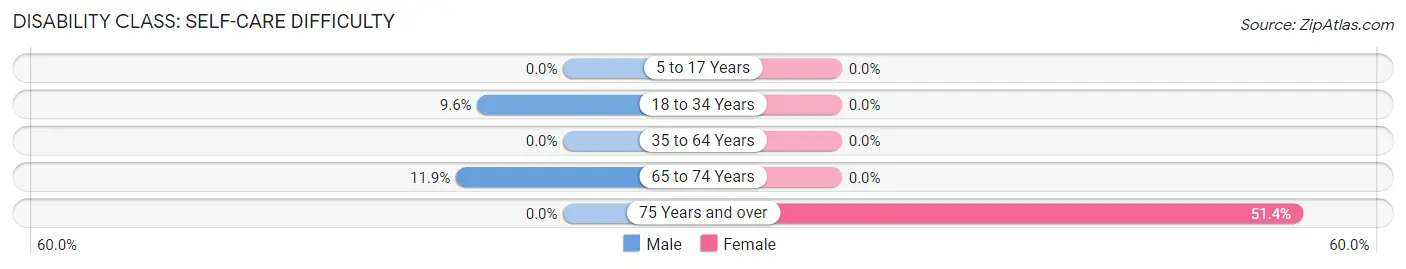
| Age Bracket | Male | Female |
| 5 to 17 Years | 0 (0.0%) | 0 (0.0%) |
| 18 to 34 Years | 11 (9.6%) | 0 (0.0%) |
| 35 to 64 Years | 0 (0.0%) | 0 (0.0%) |
| 65 to 74 Years | 8 (11.9%) | 0 (0.0%) |
| 75 Years and over | 0 (0.0%) | 19 (51.3%) |
Technology Access in Woodland Heights
Computing Device Access in Woodland Heights
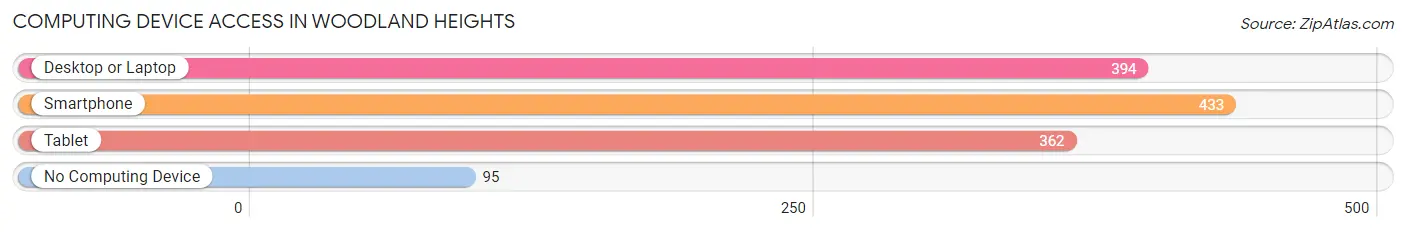
| Device Type | # Households | % Households |
| Desktop or Laptop | 394 | 71.4% |
| Smartphone | 433 | 78.4% |
| Tablet | 362 | 65.6% |
| No Computing Device | 95 | 17.2% |
| Total | 552 | 100.0% |
Internet Access in Woodland Heights
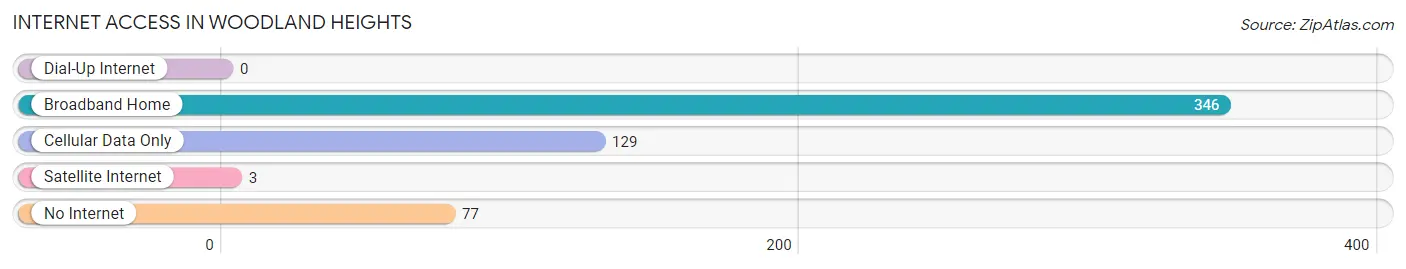
| Internet Type | # Households | % Households |
| Dial-Up Internet | 0 | 0.0% |
| Broadband Home | 346 | 62.7% |
| Cellular Data Only | 129 | 23.4% |
| Satellite Internet | 3 | 0.5% |
| No Internet | 77 | 14.0% |
| Total | 552 | 100.0% |
Woodland Heights Summary
Woodland Heights is a small borough located in the Allegheny Mountains of Pennsylvania. It is situated in the northern part of the state, about 25 miles from the state capital of Harrisburg. The borough is home to a population of just over 1,000 people, and is part of the larger Huntingdon County.
History
Woodland Heights was first settled in the late 1700s by a group of German immigrants. The area was originally known as “Woodland” and was part of the larger Huntingdon County. In 1845, the area was officially incorporated as the Borough of Woodland Heights. The name was changed to reflect the fact that the area was located on a hill, and the name “Woodland Heights” was chosen to reflect this.
The borough was primarily an agricultural community for much of its history, with the main crops being wheat, corn, and oats. The area was also known for its timber industry, with many of the local residents working in the lumber mills. In the late 1800s, the borough began to experience a period of growth and development, with the construction of a railroad line and the opening of several businesses.
Geography
Woodland Heights is located in the northern part of Pennsylvania, in the Allegheny Mountains. The borough is situated in the Juniata River Valley, and is surrounded by rolling hills and forests. The borough is located about 25 miles from the state capital of Harrisburg.
The borough has a total area of 0.7 square miles, all of which is land. The borough is located at an elevation of 1,400 feet above sea level. The climate in the area is classified as humid continental, with cold winters and warm summers.
Economy
The economy of Woodland Heights is largely based on agriculture and tourism. The borough is home to several farms, which produce a variety of crops, including wheat, corn, and oats. The area is also known for its timber industry, with many of the local residents working in the lumber mills.
In recent years, the borough has seen an increase in tourism, with many visitors coming to the area to enjoy the natural beauty of the Allegheny Mountains. The borough is home to several parks and recreational areas, including the Woodland Heights State Park.
Demographics
As of the 2010 census, the population of Woodland Heights was 1,072. The racial makeup of the borough was 97.3% White, 0.9% African American, 0.3% Native American, 0.2% Asian, and 0.3% from other races. Hispanic or Latino of any race were 0.7% of the population.
The median household income in the borough was $41,250, and the median family income was $50,000. The per capita income for the borough was $20,845. About 11.2% of families and 14.2% of the population were below the poverty line, including 18.2% of those under the age of 18 and 8.3% of those 65 and older.
Common Questions
What is the Total Population of Woodland Heights?
Total Population of Woodland Heights is 1,326.
What is the Total Male Population of Woodland Heights?
Total Male Population of Woodland Heights is 712.
What is the Total Female Population of Woodland Heights?
Total Female Population of Woodland Heights is 614.
What is the Ratio of Males per 100 Females in Woodland Heights?
There are 115.96 Males per 100 Females in Woodland Heights.
What is the Ratio of Females per 100 Males in Woodland Heights?
There are 86.24 Females per 100 Males in Woodland Heights.
What is the Median Population Age in Woodland Heights?
Median Population Age in Woodland Heights is 30.8 Years.
What is the Average Family Size in Woodland Heights
Average Family Size in Woodland Heights is 3.2 People.
What is the Average Household Size in Woodland Heights
Average Household Size in Woodland Heights is 2.4 People.
What is Per Capita Income in Woodland Heights?
Per Capita income in Woodland Heights is $21,451.
What is the Median Family Income in Woodland Heights?
Median Family Income in Woodland Heights is $67,684.
What is the Median Household income in Woodland Heights?
Median Household Income in Woodland Heights is $50,526.
What is Income or Wage Gap in Woodland Heights?
Income or Wage Gap in Woodland Heights is 48.4%.
Women in Woodland Heights earn 51.6 cents for every dollar earned by a man.
What is Inequality or Gini Index in Woodland Heights?
Inequality or Gini Index in Woodland Heights is 0.38.
How Large is the Labor Force in Woodland Heights?
There are 468 People in the Labor Forcein in Woodland Heights.
What is the Percentage of People in the Labor Force in Woodland Heights?
48.5% of People are in the Labor Force in Woodland Heights.
What is the Unemployment Rate in Woodland Heights?
Unemployment Rate in Woodland Heights is 22.6%.