Vandergrift borough, PA
Vandergrift borough Overview
5,051
TOTAL POPULATION
2,365
MALE POPULATION
2,686
FEMALE POPULATION
88.05
MALES / 100 FEMALES
113.57
FEMALES / 100 MALES
35.7
MEDIAN AGE
2.9
AVG FAMILY SIZE
2.3
AVG HOUSEHOLD SIZE
$23,564
PER CAPITA INCOME
$48,948
AVG FAMILY INCOME
$47,530
AVG HOUSEHOLD INCOME
17.8%
WAGE / INCOME GAP [ % ]
82.2¢/ $1
WAGE / INCOME GAP [ $ ]
0.38
INEQUALITY / GINI INDEX
2,519
LABOR FORCE [ PEOPLE ]
64.7%
PERCENT IN LABOR FORCE
10.2%
UNEMPLOYMENT RATE
Race in Vandergrift borough
The most populous races in Vandergrift borough are White / Caucasian (4,558 | 90.2%), Two or more Races (331 | 6.6%), and Black / African American (124 | 2.5%).
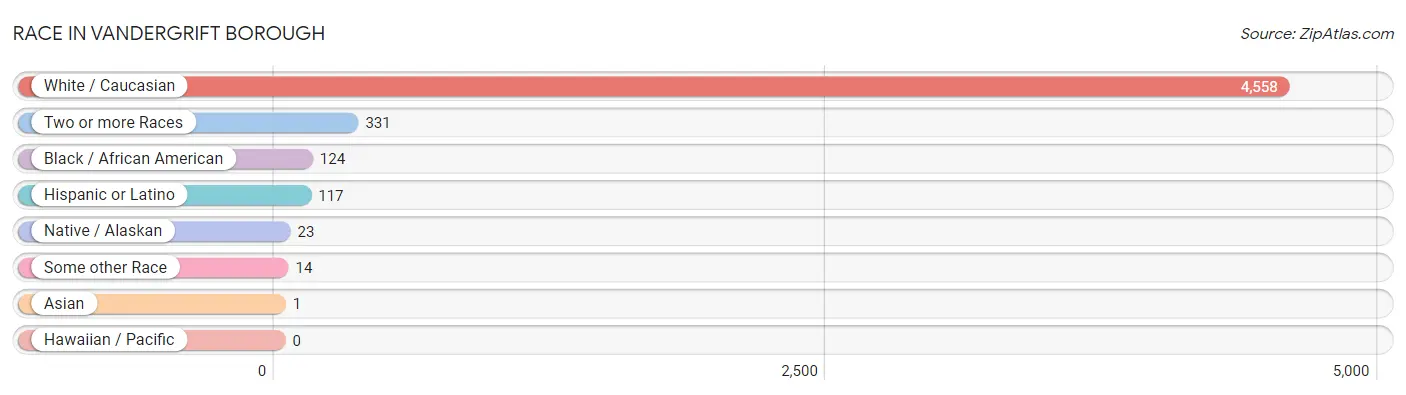
| Race | # Population | % Population |
| Asian | 1 | 0.0% |
| Black / African American | 124 | 2.5% |
| Hawaiian / Pacific | 0 | 0.0% |
| Hispanic or Latino | 117 | 2.3% |
| Native / Alaskan | 23 | 0.5% |
| White / Caucasian | 4,558 | 90.2% |
| Two or more Races | 331 | 6.6% |
| Some other Race | 14 | 0.3% |
| Total | 5,051 | 100.0% |
Ancestry in Vandergrift borough
The most populous ancestries reported in Vandergrift borough are German (1,111 | 22.0%), Italian (708 | 14.0%), Polish (495 | 9.8%), Slovak (418 | 8.3%), and Irish (366 | 7.2%), together accounting for 61.3% of all Vandergrift borough residents.
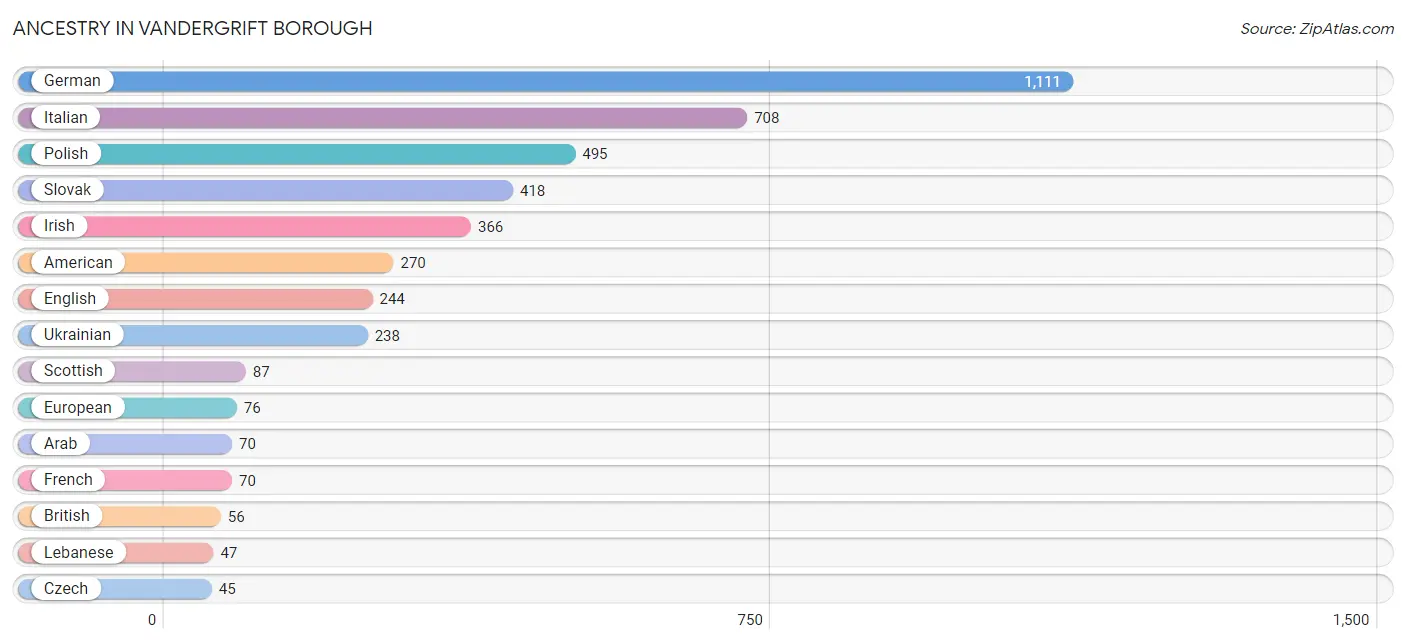
| Ancestry | # Population | % Population |
| American | 270 | 5.3% |
| Arab | 70 | 1.4% |
| Bhutanese | 7 | 0.1% |
| Blackfeet | 7 | 0.1% |
| Bolivian | 35 | 0.7% |
| British | 56 | 1.1% |
| Canadian | 5 | 0.1% |
| Central American | 6 | 0.1% |
| Cherokee | 7 | 0.1% |
| Croatian | 11 | 0.2% |
| Cuban | 10 | 0.2% |
| Czech | 45 | 0.9% |
| Czechoslovakian | 6 | 0.1% |
| Dutch | 32 | 0.6% |
| Eastern European | 5 | 0.1% |
| English | 244 | 4.8% |
| European | 76 | 1.5% |
| French | 70 | 1.4% |
| French Canadian | 6 | 0.1% |
| German | 1,111 | 22.0% |
| Greek | 8 | 0.2% |
| Guatemalan | 6 | 0.1% |
| Hungarian | 17 | 0.3% |
| Irish | 366 | 7.2% |
| Italian | 708 | 14.0% |
| Jamaican | 26 | 0.5% |
| Lebanese | 47 | 0.9% |
| Lithuanian | 39 | 0.8% |
| Mexican | 41 | 0.8% |
| Northern European | 34 | 0.7% |
| Norwegian | 45 | 0.9% |
| Pennsylvania German | 15 | 0.3% |
| Polish | 495 | 9.8% |
| Puerto Rican | 18 | 0.4% |
| Scotch-Irish | 42 | 0.8% |
| Scottish | 87 | 1.7% |
| Slovak | 418 | 8.3% |
| South American | 35 | 0.7% |
| Swedish | 7 | 0.1% |
| Swiss | 8 | 0.2% |
| Syrian | 8 | 0.2% |
| Thai | 1 | 0.0% |
| Ukrainian | 238 | 4.7% |
| Welsh | 25 | 0.5% |
| West Indian | 26 | 0.5% | View All 45 Rows |
Immigrants in Vandergrift borough
The most numerous immigrant groups reported in Vandergrift borough came from Latin America (36 | 0.7%), Europe (25 | 0.5%), Italy (25 | 0.5%), Southern Europe (25 | 0.5%), and Caribbean (21 | 0.4%), together accounting for 2.6% of all Vandergrift borough residents.
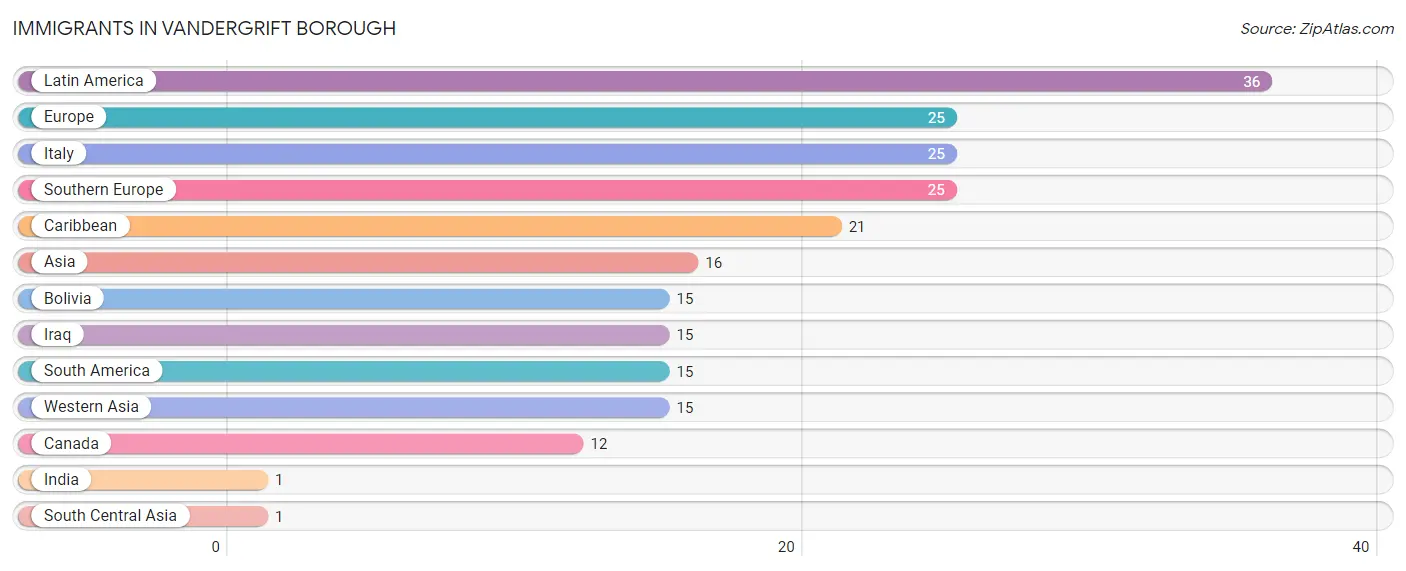
| Immigration Origin | # Population | % Population |
| Asia | 16 | 0.3% |
| Bolivia | 15 | 0.3% |
| Canada | 12 | 0.2% |
| Caribbean | 21 | 0.4% |
| Europe | 25 | 0.5% |
| India | 1 | 0.0% |
| Iraq | 15 | 0.3% |
| Italy | 25 | 0.5% |
| Latin America | 36 | 0.7% |
| South America | 15 | 0.3% |
| South Central Asia | 1 | 0.0% |
| Southern Europe | 25 | 0.5% |
| Western Asia | 15 | 0.3% | View All 13 Rows |
Sex and Age in Vandergrift borough
Sex and Age in Vandergrift borough
The most populous age groups in Vandergrift borough are 15 to 19 Years (262 | 11.1%) for men and 45 to 49 Years (300 | 11.2%) for women.
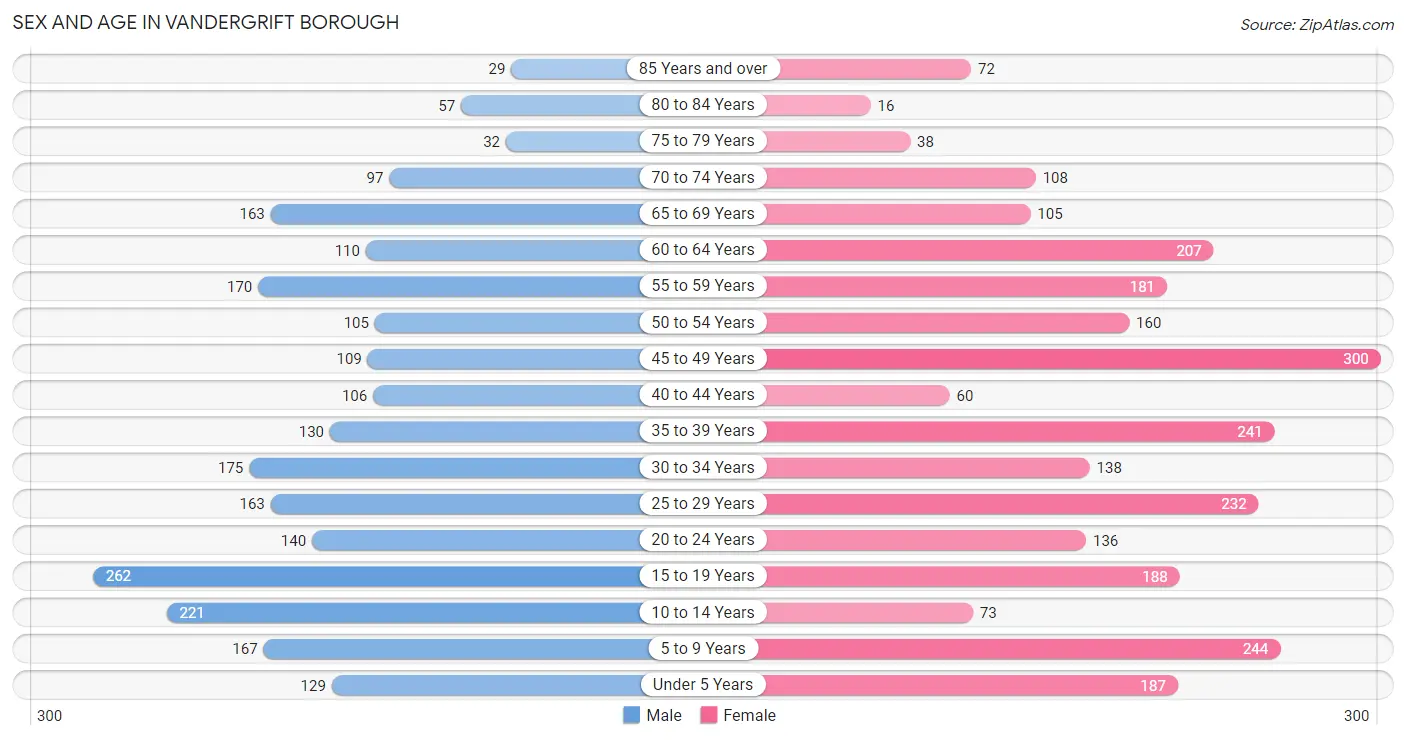
| Age Bracket | Male | Female |
| Under 5 Years | 129 (5.4%) | 187 (7.0%) |
| 5 to 9 Years | 167 (7.1%) | 244 (9.1%) |
| 10 to 14 Years | 221 (9.3%) | 73 (2.7%) |
| 15 to 19 Years | 262 (11.1%) | 188 (7.0%) |
| 20 to 24 Years | 140 (5.9%) | 136 (5.1%) |
| 25 to 29 Years | 163 (6.9%) | 232 (8.6%) |
| 30 to 34 Years | 175 (7.4%) | 138 (5.1%) |
| 35 to 39 Years | 130 (5.5%) | 241 (9.0%) |
| 40 to 44 Years | 106 (4.5%) | 60 (2.2%) |
| 45 to 49 Years | 109 (4.6%) | 300 (11.2%) |
| 50 to 54 Years | 105 (4.4%) | 160 (6.0%) |
| 55 to 59 Years | 170 (7.2%) | 181 (6.7%) |
| 60 to 64 Years | 110 (4.6%) | 207 (7.7%) |
| 65 to 69 Years | 163 (6.9%) | 105 (3.9%) |
| 70 to 74 Years | 97 (4.1%) | 108 (4.0%) |
| 75 to 79 Years | 32 (1.3%) | 38 (1.4%) |
| 80 to 84 Years | 57 (2.4%) | 16 (0.6%) |
| 85 Years and over | 29 (1.2%) | 72 (2.7%) |
| Total | 2,365 (100.0%) | 2,686 (100.0%) |
Families and Households in Vandergrift borough
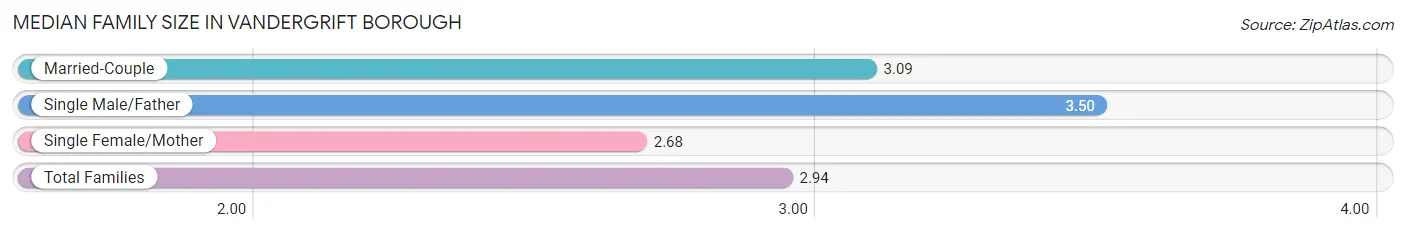
Median Family Size in Vandergrift borough
The median family size in Vandergrift borough is 2.94 persons per family, with single male/father families (54 | 4.0%) accounting for the largest median family size of 3.5 persons per family. On the other hand, single female/mother families (546 | 40.7%) represent the smallest median family size with 2.68 persons per family.
| Family Type | # Families | Family Size |
| Married-Couple | 740 (55.2%) | 3.09 |
| Single Male/Father | 54 (4.0%) | 3.50 |
| Single Female/Mother | 546 (40.7%) | 2.68 |
| Total Families | 1,340 (100.0%) | 2.94 |
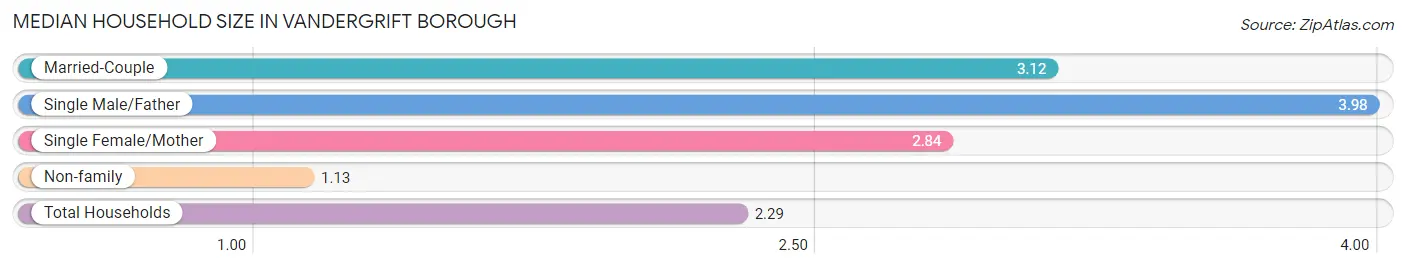
Median Household Size in Vandergrift borough
The median household size in Vandergrift borough is 2.29 persons per household, with single male/father households (54 | 2.5%) accounting for the largest median household size of 3.98 persons per household. non-family households (860 | 39.1%) represent the smallest median household size with 1.13 persons per household.
| Household Type | # Households | Household Size |
| Married-Couple | 740 (33.6%) | 3.12 |
| Single Male/Father | 54 (2.5%) | 3.98 |
| Single Female/Mother | 546 (24.8%) | 2.84 |
| Non-family | 860 (39.1%) | 1.13 |
| Total Households | 2,200 (100.0%) | 2.29 |
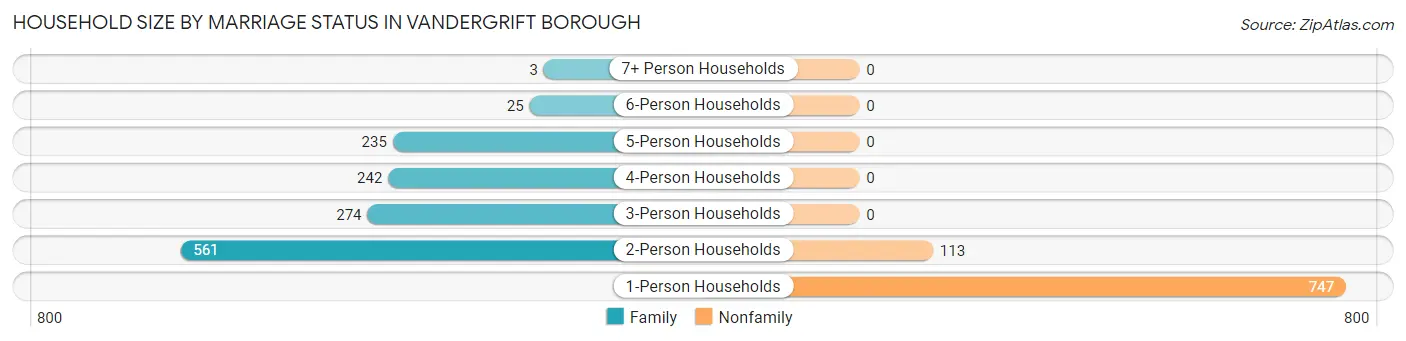
Household Size by Marriage Status in Vandergrift borough
Out of a total of 2,200 households in Vandergrift borough, 1,340 (60.9%) are family households, while 860 (39.1%) are nonfamily households. The most numerous type of family households are 2-person households, comprising 561, and the most common type of nonfamily households are 1-person households, comprising 747.
| Household Size | Family Households | Nonfamily Households |
| 1-Person Households | - | 747 (34.0%) |
| 2-Person Households | 561 (25.5%) | 113 (5.1%) |
| 3-Person Households | 274 (12.4%) | 0 (0.0%) |
| 4-Person Households | 242 (11.0%) | 0 (0.0%) |
| 5-Person Households | 235 (10.7%) | 0 (0.0%) |
| 6-Person Households | 25 (1.1%) | 0 (0.0%) |
| 7+ Person Households | 3 (0.1%) | 0 (0.0%) |
| Total | 1,340 (60.9%) | 860 (39.1%) |
Female Fertility in Vandergrift borough
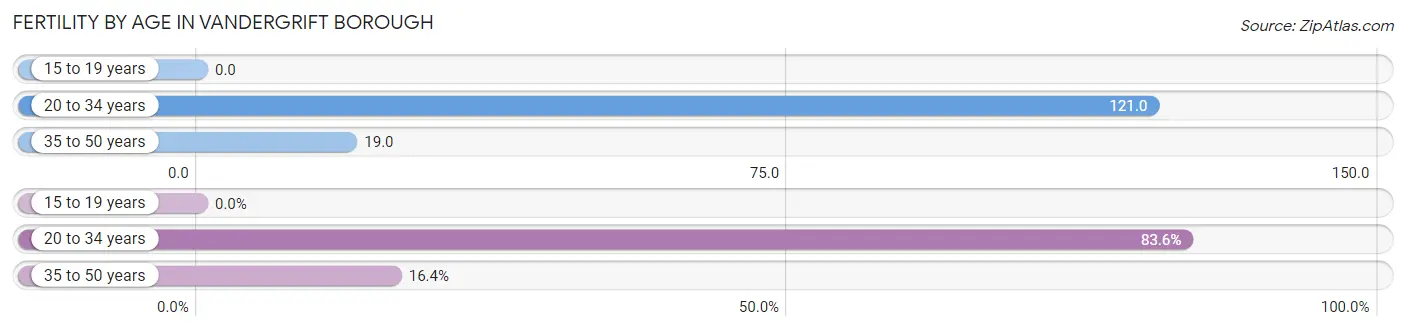
Fertility by Age in Vandergrift borough
Average fertility rate in Vandergrift borough is 56.0 births per 1,000 women. Women in the age bracket of 20 to 34 years have the highest fertility rate with 121.0 births per 1,000 women. Women in the age bracket of 20 to 34 years acount for 83.6% of all women with births.
| Age Bracket | Women with Births | Births / 1,000 Women |
| 15 to 19 years | 0 (0.0%) | 0.0 |
| 20 to 34 years | 61 (83.6%) | 121.0 |
| 35 to 50 years | 12 (16.4%) | 19.0 |
| Total | 73 (100.0%) | 56.0 |
Fertility by Age by Marriage Status in Vandergrift borough
78.1% of women with births (73) in Vandergrift borough are married. The highest percentage of unmarried women with births falls into 20 to 34 years age bracket with 26.2% of them unmarried at the time of birth, while the lowest percentage of unmarried women with births belong to 35 to 50 years age bracket with 0.0% of them unmarried.
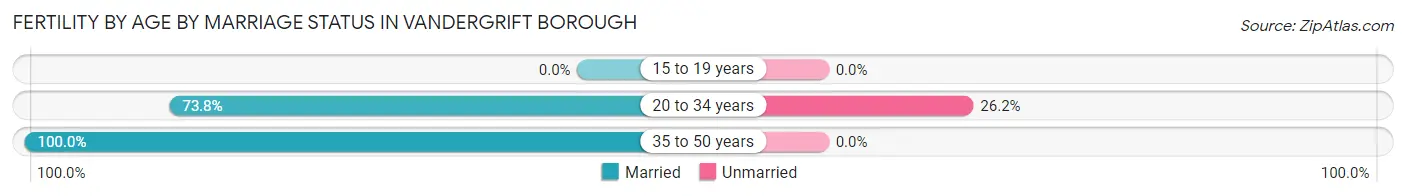
| Age Bracket | Married | Unmarried |
| 15 to 19 years | 0 (0.0%) | 0 (0.0%) |
| 20 to 34 years | 45 (73.8%) | 16 (26.2%) |
| 35 to 50 years | 12 (100.0%) | 0 (0.0%) |
| Total | 57 (78.1%) | 16 (21.9%) |
Fertility by Education in Vandergrift borough
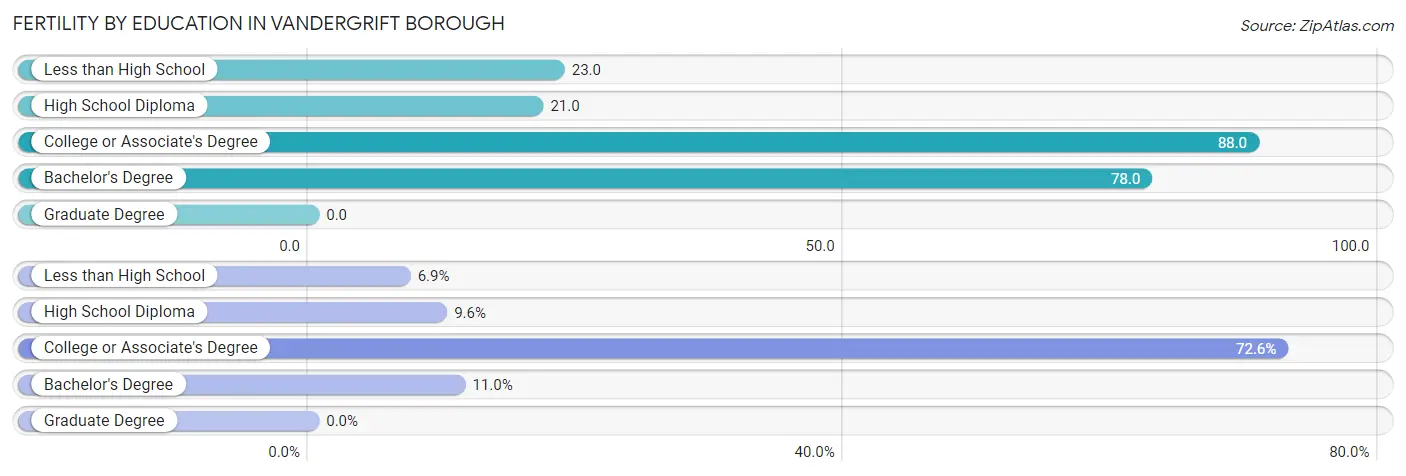
| Educational Attainment | Women with Births | Births / 1,000 Women |
| Less than High School | 5 (6.9%) | 23.0 |
| High School Diploma | 7 (9.6%) | 21.0 |
| College or Associate's Degree | 53 (72.6%) | 88.0 |
| Bachelor's Degree | 8 (11.0%) | 78.0 |
| Graduate Degree | 0 (0.0%) | 0.0 |
| Total | 73 (100.0%) | 56.0 |
Fertility by Education by Marriage Status in Vandergrift borough
21.9% of women with births in Vandergrift borough are unmarried. Women with the educational attainment of less than high school are most likely to be married with 100.0% of them married at childbirth, while women with the educational attainment of college or associate's degree are least likely to be married with 30.2% of them unmarried at childbirth.
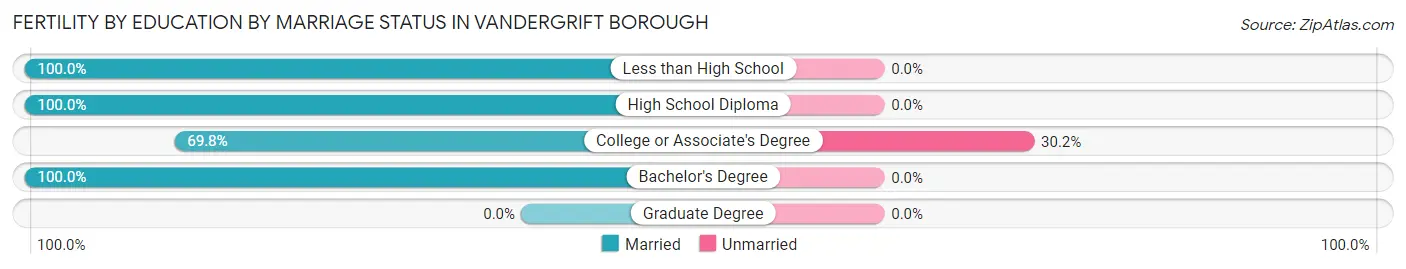
| Educational Attainment | Married | Unmarried |
| Less than High School | 5 (100.0%) | 0 (0.0%) |
| High School Diploma | 7 (100.0%) | 0 (0.0%) |
| College or Associate's Degree | 37 (69.8%) | 16 (30.2%) |
| Bachelor's Degree | 8 (100.0%) | 0 (0.0%) |
| Graduate Degree | 0 (0.0%) | 0 (0.0%) |
| Total | 57 (78.1%) | 16 (21.9%) |
Income in Vandergrift borough
Income Overview in Vandergrift borough
Per Capita Income in Vandergrift borough is $23,564, while median incomes of families and households are $48,948 and $47,530 respectively.
| Characteristic | Number | Measure |
| Per Capita Income | 5,051 | $23,564 |
| Median Family Income | 1,340 | $48,948 |
| Mean Family Income | 1,340 | $56,118 |
| Median Household Income | 2,200 | $47,530 |
| Mean Household Income | 2,200 | $52,951 |
| Income Deficit | 1,340 | $0 |
| Wage / Income Gap (%) | 5,051 | 17.82% |
| Wage / Income Gap ($) | 5,051 | 82.18¢ per $1 |
| Gini / Inequality Index | 5,051 | 0.38 |
Earnings by Sex in Vandergrift borough
Average Earnings in Vandergrift borough are $33,324, $37,865 for men and $31,118 for women, a difference of 17.8%.
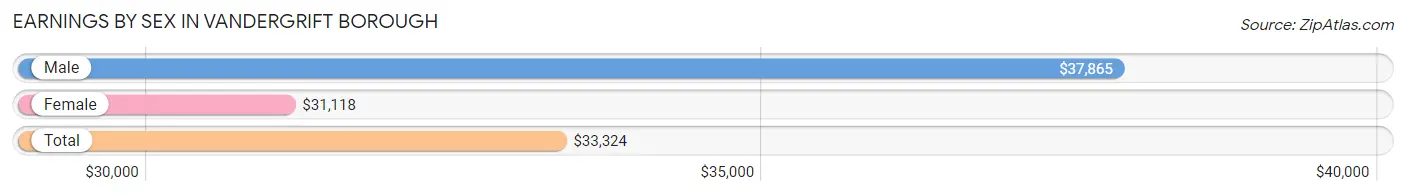
| Sex | Number | Average Earnings |
| Male | 1,205 (47.7%) | $37,865 |
| Female | 1,322 (52.3%) | $31,118 |
| Total | 2,527 (100.0%) | $33,324 |
Earnings by Sex by Income Bracket in Vandergrift borough
The most common earnings brackets in Vandergrift borough are $55,000 to $64,999 for men (123 | 10.2%) and $30,000 to $34,999 for women (184 | 13.9%).
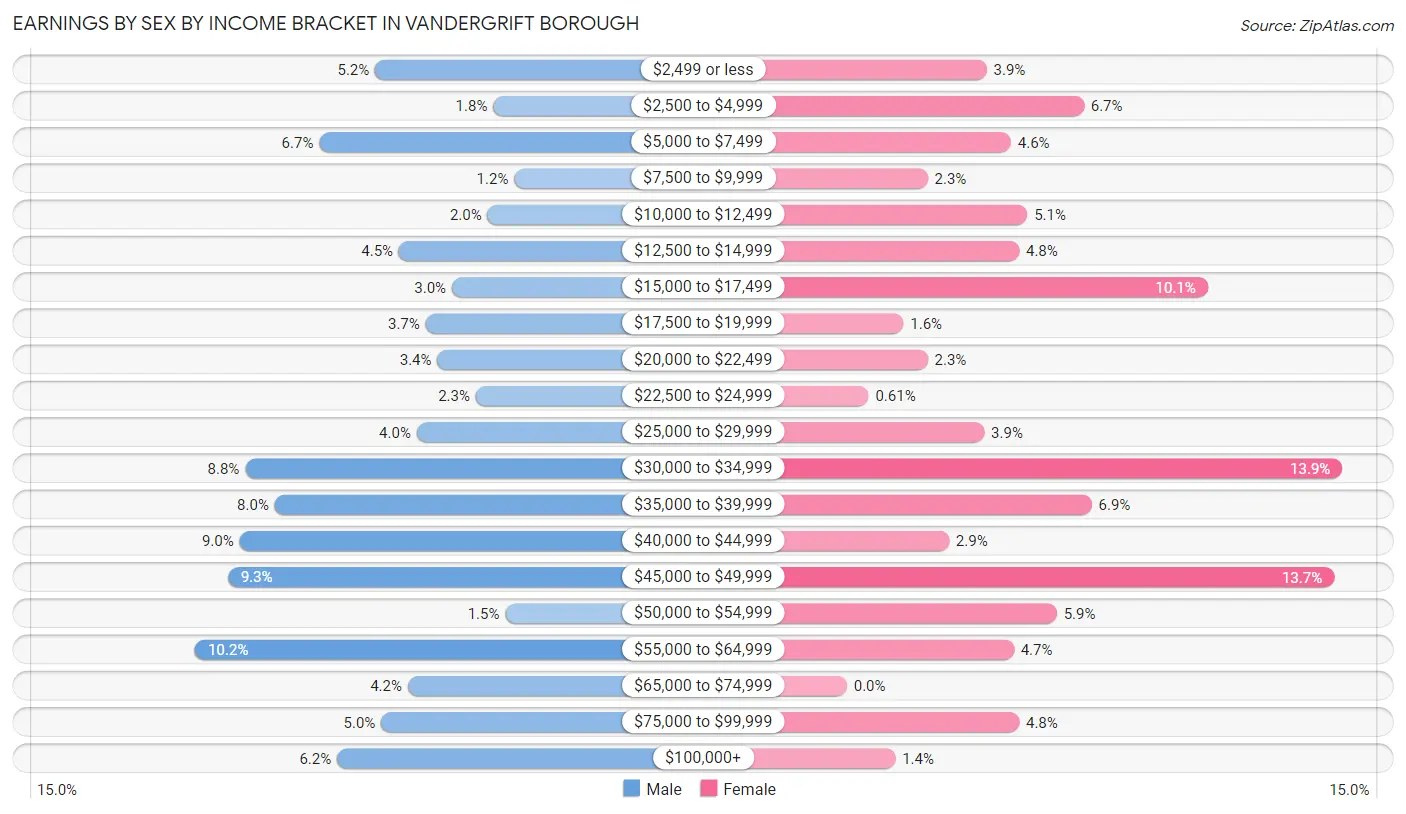
| Income | Male | Female |
| $2,499 or less | 62 (5.1%) | 52 (3.9%) |
| $2,500 to $4,999 | 22 (1.8%) | 88 (6.7%) |
| $5,000 to $7,499 | 81 (6.7%) | 61 (4.6%) |
| $7,500 to $9,999 | 15 (1.2%) | 30 (2.3%) |
| $10,000 to $12,499 | 24 (2.0%) | 67 (5.1%) |
| $12,500 to $14,999 | 54 (4.5%) | 64 (4.8%) |
| $15,000 to $17,499 | 36 (3.0%) | 134 (10.1%) |
| $17,500 to $19,999 | 45 (3.7%) | 21 (1.6%) |
| $20,000 to $22,499 | 41 (3.4%) | 30 (2.3%) |
| $22,500 to $24,999 | 28 (2.3%) | 8 (0.6%) |
| $25,000 to $29,999 | 48 (4.0%) | 51 (3.9%) |
| $30,000 to $34,999 | 106 (8.8%) | 184 (13.9%) |
| $35,000 to $39,999 | 96 (8.0%) | 91 (6.9%) |
| $40,000 to $44,999 | 108 (9.0%) | 38 (2.9%) |
| $45,000 to $49,999 | 112 (9.3%) | 181 (13.7%) |
| $50,000 to $54,999 | 18 (1.5%) | 78 (5.9%) |
| $55,000 to $64,999 | 123 (10.2%) | 62 (4.7%) |
| $65,000 to $74,999 | 51 (4.2%) | 0 (0.0%) |
| $75,000 to $99,999 | 60 (5.0%) | 64 (4.8%) |
| $100,000+ | 75 (6.2%) | 18 (1.4%) |
| Total | 1,205 (100.0%) | 1,322 (100.0%) |
Earnings by Sex by Educational Attainment in Vandergrift borough
Average earnings in Vandergrift borough are $39,462 for men and $32,746 for women, a difference of 17.0%. Men with an educational attainment of graduate degree enjoy the highest average annual earnings of $72,333, while those with less than high school education earn the least with $20,781. Women with an educational attainment of graduate degree earn the most with the average annual earnings of $53,625, while those with high school diploma education have the smallest earnings of $18,824.
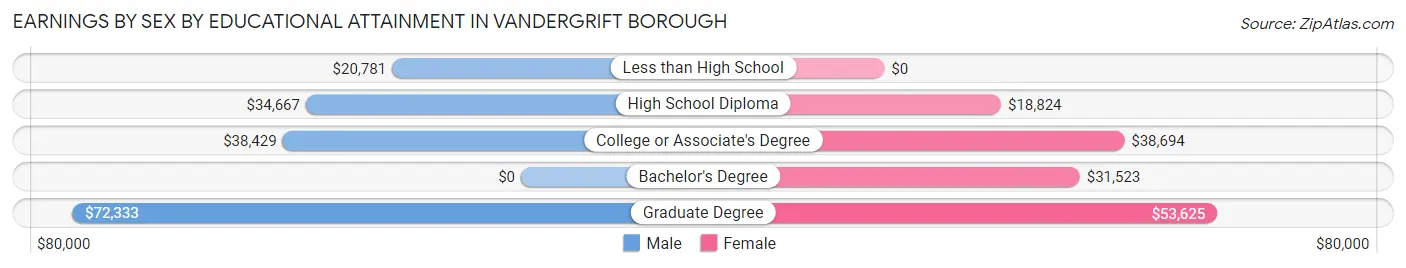
| Educational Attainment | Male Income | Female Income |
| Less than High School | $20,781 | $0 |
| High School Diploma | $34,667 | $18,824 |
| College or Associate's Degree | $38,429 | $38,694 |
| Bachelor's Degree | - | - |
| Graduate Degree | $72,333 | $53,625 |
| Total | $39,462 | $32,746 |
Family Income in Vandergrift borough
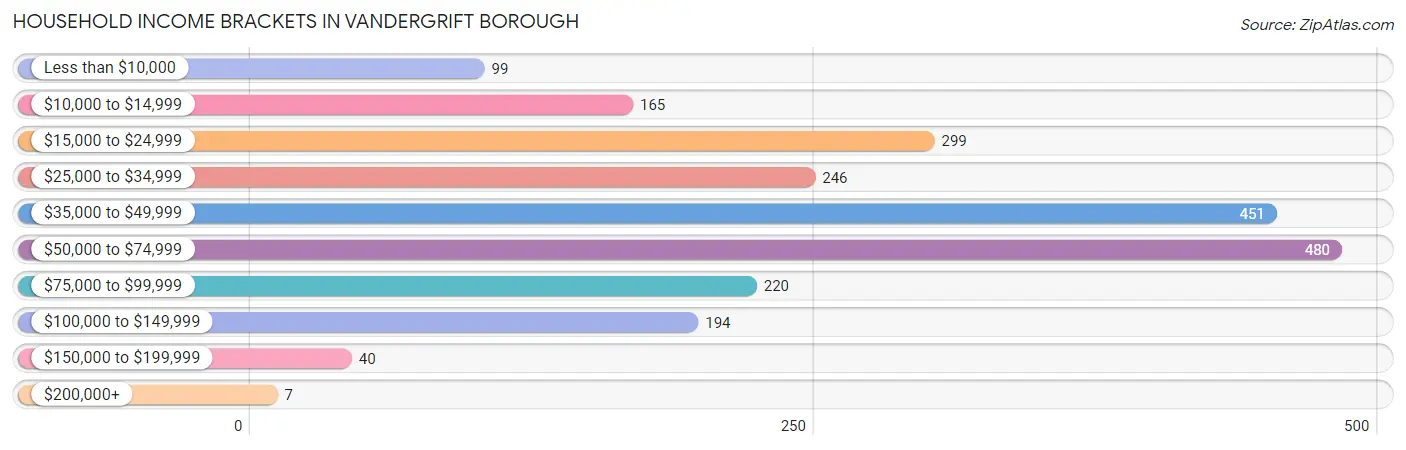
Family Income Brackets in Vandergrift borough
According to the Vandergrift borough family income data, there are 300 families falling into the $35,000 to $49,999 income range, which is the most common income bracket and makes up 22.4% of all families. Conversely, the $200,000+ income bracket is the least frequent group with only 7 families (0.5%) belonging to this category.
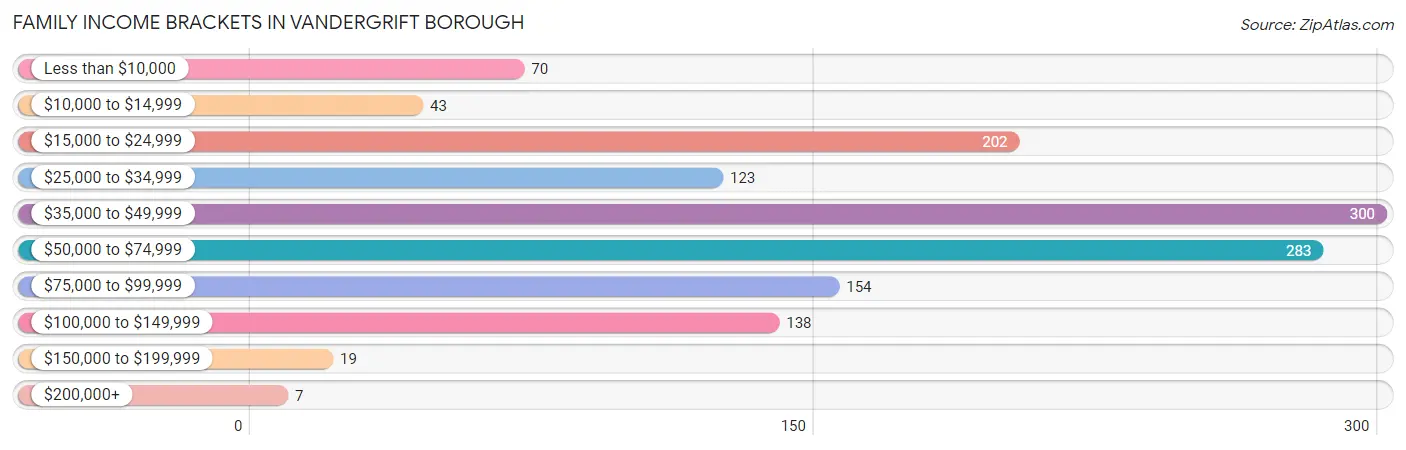
| Income Bracket | # Families | % Families |
| Less than $10,000 | 70 | 5.2% |
| $10,000 to $14,999 | 43 | 3.2% |
| $15,000 to $24,999 | 202 | 15.1% |
| $25,000 to $34,999 | 123 | 9.2% |
| $35,000 to $49,999 | 300 | 22.4% |
| $50,000 to $74,999 | 283 | 21.1% |
| $75,000 to $99,999 | 154 | 11.5% |
| $100,000 to $149,999 | 138 | 10.3% |
| $150,000 to $199,999 | 19 | 1.4% |
| $200,000+ | 7 | 0.5% |
Family Income by Famaliy Size in Vandergrift borough
4-person families (192 | 14.3%) account for the highest median family income in Vandergrift borough with $59,722 per family, while 2-person families (597 | 44.6%) have the highest median income of $24,436 per family member.
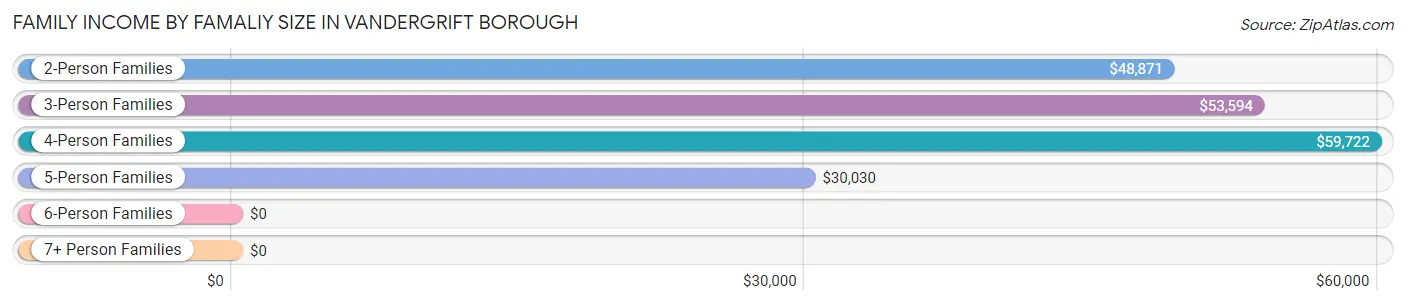
| Income Bracket | # Families | Median Income |
| 2-Person Families | 597 (44.6%) | $48,871 |
| 3-Person Families | 310 (23.1%) | $53,594 |
| 4-Person Families | 192 (14.3%) | $59,722 |
| 5-Person Families | 213 (15.9%) | $30,030 |
| 6-Person Families | 25 (1.9%) | $0 |
| 7+ Person Families | 3 (0.2%) | $0 |
| Total | 1,340 (100.0%) | $48,948 |
Family Income by Number of Earners in Vandergrift borough
The median family income in Vandergrift borough is $48,948, with families comprising 3+ earners (98) having the highest median family income of $95,625, while families with no earners (295) have the lowest median family income of $38,142, accounting for 7.3% and 22.0% of families, respectively.
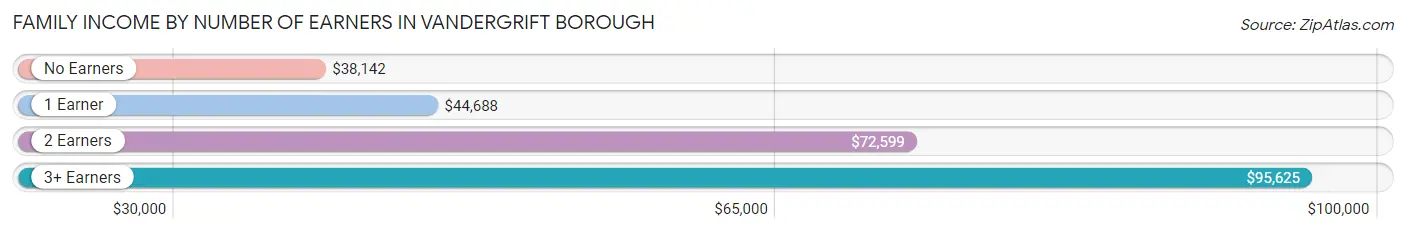
| Number of Earners | # Families | Median Income |
| No Earners | 295 (22.0%) | $38,142 |
| 1 Earner | 544 (40.6%) | $44,688 |
| 2 Earners | 403 (30.1%) | $72,599 |
| 3+ Earners | 98 (7.3%) | $95,625 |
| Total | 1,340 (100.0%) | $48,948 |
Household Income in Vandergrift borough
Household Income Brackets in Vandergrift borough
With 480 households falling in the category, the $50,000 to $74,999 income range is the most frequent in Vandergrift borough, accounting for 21.8% of all households. In contrast, only 7 households (0.3%) fall into the $200,000+ income bracket, making it the least populous group.
| Income Bracket | # Households | % Households |
| Less than $10,000 | 99 | 4.5% |
| $10,000 to $14,999 | 165 | 7.5% |
| $15,000 to $24,999 | 299 | 13.6% |
| $25,000 to $34,999 | 246 | 11.2% |
| $35,000 to $49,999 | 451 | 20.5% |
| $50,000 to $74,999 | 480 | 21.8% |
| $75,000 to $99,999 | 220 | 10.0% |
| $100,000 to $149,999 | 194 | 8.8% |
| $150,000 to $199,999 | 40 | 1.8% |
| $200,000+ | 7 | 0.3% |
Household Income by Householder Age in Vandergrift borough
The median household income in Vandergrift borough is $47,530, with the highest median household income of $49,224 found in the 45 to 64 years age bracket for the primary householder. A total of 961 households (43.7%) fall into this category. Meanwhile, the 15 to 24 years age bracket for the primary householder has the lowest median household income of $0, with 106 households (4.8%) in this group.
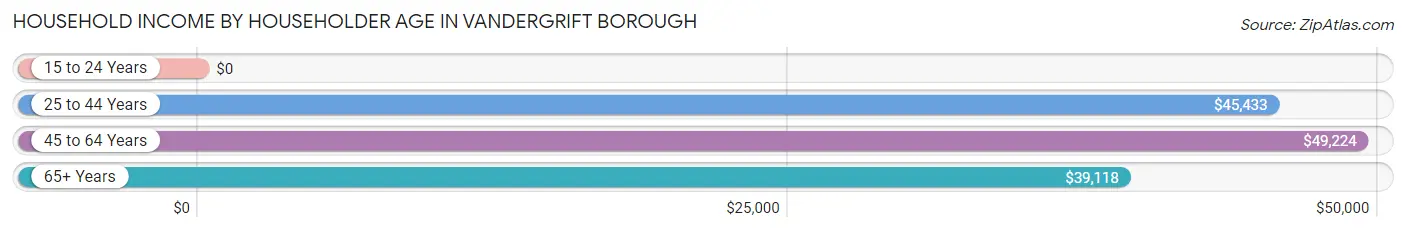
| Income Bracket | # Households | Median Income |
| 15 to 24 Years | 106 (4.8%) | $0 |
| 25 to 44 Years | 657 (29.9%) | $45,433 |
| 45 to 64 Years | 961 (43.7%) | $49,224 |
| 65+ Years | 476 (21.6%) | $39,118 |
| Total | 2,200 (100.0%) | $47,530 |
Poverty in Vandergrift borough
Income Below Poverty by Sex and Age in Vandergrift borough
With 17.6% poverty level for males and 35.9% for females among the residents of Vandergrift borough, 6 to 11 year old males and 5 year old females are the most vulnerable to poverty, with 124 males (46.3%) and 29 females (78.4%) in their respective age groups living below the poverty level.
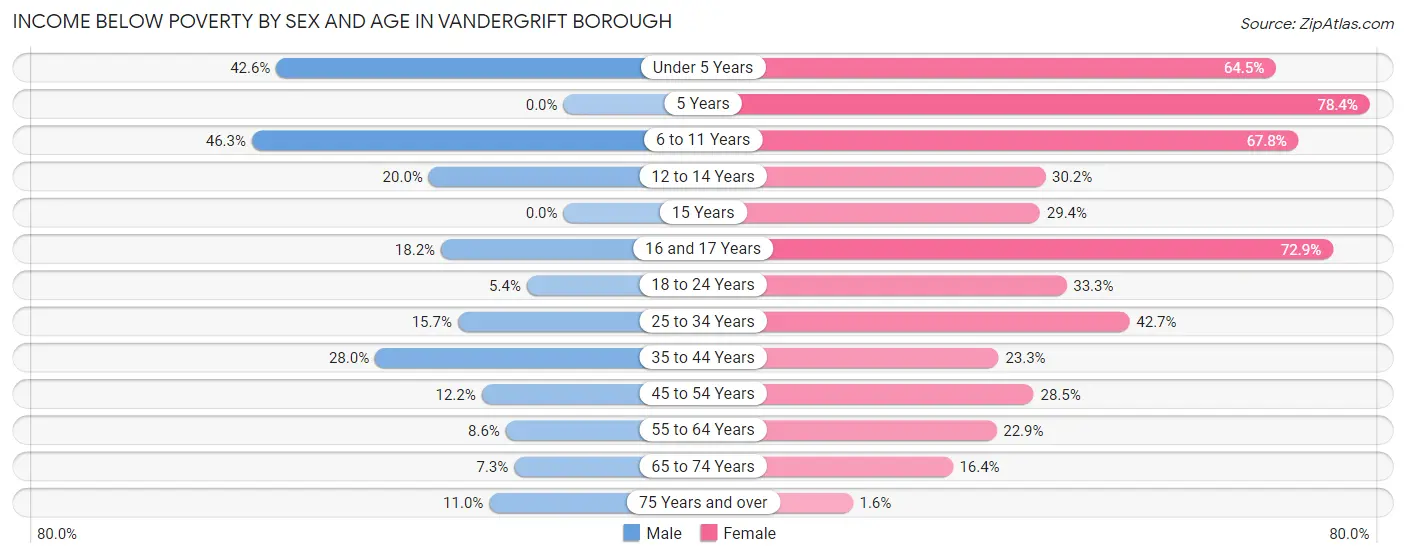
| Age Bracket | Male | Female |
| Under 5 Years | 55 (42.6%) | 118 (64.5%) |
| 5 Years | 0 (0.0%) | 29 (78.4%) |
| 6 to 11 Years | 124 (46.3%) | 154 (67.8%) |
| 12 to 14 Years | 16 (20.0%) | 16 (30.2%) |
| 15 Years | 0 (0.0%) | 5 (29.4%) |
| 16 and 17 Years | 8 (18.2%) | 97 (72.9%) |
| 18 to 24 Years | 13 (5.4%) | 58 (33.3%) |
| 25 to 34 Years | 53 (15.7%) | 158 (42.7%) |
| 35 to 44 Years | 66 (28.0%) | 70 (23.3%) |
| 45 to 54 Years | 26 (12.1%) | 131 (28.5%) |
| 55 to 64 Years | 24 (8.6%) | 89 (22.9%) |
| 65 to 74 Years | 19 (7.3%) | 35 (16.4%) |
| 75 Years and over | 13 (11.0%) | 2 (1.6%) |
| Total | 417 (17.6%) | 962 (35.9%) |
Income Above Poverty by Sex and Age in Vandergrift borough
According to the poverty statistics in Vandergrift borough, males aged 5 years and females aged 75 years and over are the age groups that are most secure financially, with 100.0% of males and 98.4% of females in these age groups living above the poverty line.
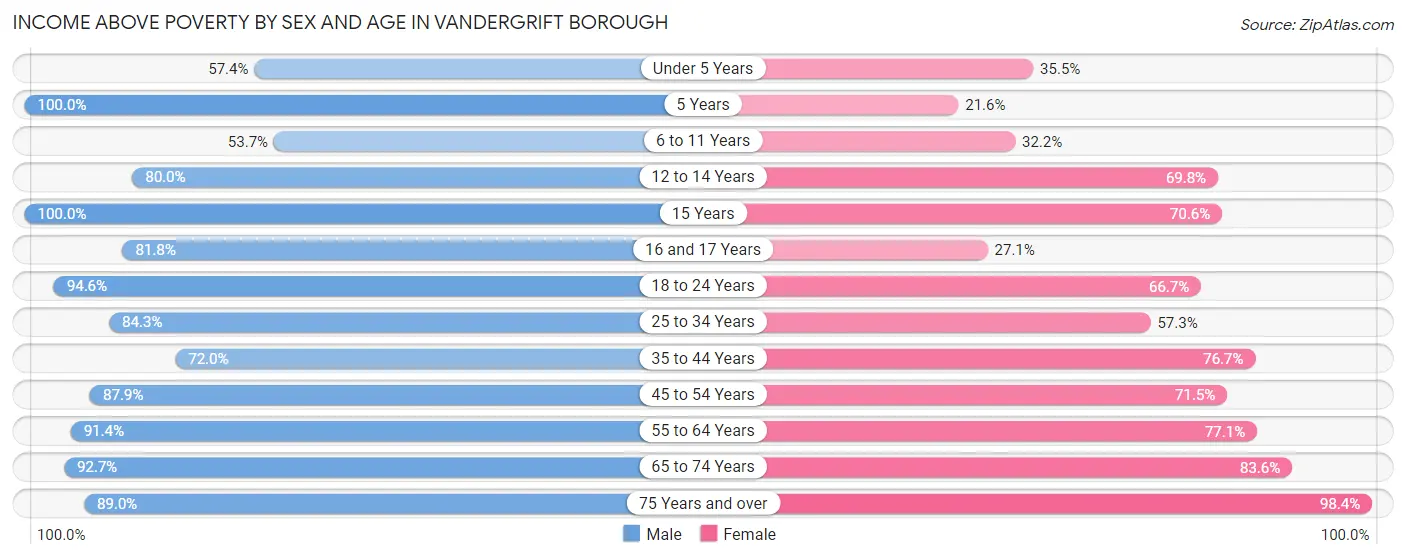
| Age Bracket | Male | Female |
| Under 5 Years | 74 (57.4%) | 65 (35.5%) |
| 5 Years | 40 (100.0%) | 8 (21.6%) |
| 6 to 11 Years | 144 (53.7%) | 73 (32.2%) |
| 12 to 14 Years | 64 (80.0%) | 37 (69.8%) |
| 15 Years | 119 (100.0%) | 12 (70.6%) |
| 16 and 17 Years | 36 (81.8%) | 36 (27.1%) |
| 18 to 24 Years | 226 (94.6%) | 116 (66.7%) |
| 25 to 34 Years | 285 (84.3%) | 212 (57.3%) |
| 35 to 44 Years | 170 (72.0%) | 231 (76.7%) |
| 45 to 54 Years | 188 (87.8%) | 329 (71.5%) |
| 55 to 64 Years | 256 (91.4%) | 299 (77.1%) |
| 65 to 74 Years | 241 (92.7%) | 178 (83.6%) |
| 75 Years and over | 105 (89.0%) | 124 (98.4%) |
| Total | 1,948 (82.4%) | 1,720 (64.1%) |
Income Below Poverty Among Married-Couple Families in Vandergrift borough
The poverty statistics for married-couple families in Vandergrift borough show that 16.5% or 122 of the total 740 families live below the poverty line. Families with 3 or 4 children have the highest poverty rate of 64.8%, comprising of 70 families. On the other hand, families with 5 or more children have the lowest poverty rate of 0.0%, which includes 0 families.
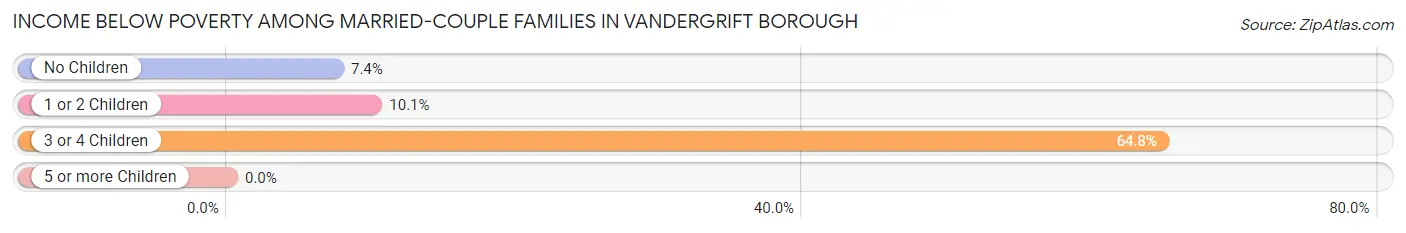
| Children | Above Poverty | Below Poverty |
| No Children | 389 (92.6%) | 31 (7.4%) |
| 1 or 2 Children | 188 (89.9%) | 21 (10.1%) |
| 3 or 4 Children | 38 (35.2%) | 70 (64.8%) |
| 5 or more Children | 3 (100.0%) | 0 (0.0%) |
| Total | 618 (83.5%) | 122 (16.5%) |
Income Below Poverty Among Single-Parent Households in Vandergrift borough
According to the poverty data in Vandergrift borough, 18.5% or 10 single-father households and 39.9% or 218 single-mother households are living below the poverty line. Among single-father households, those with 3 or 4 children have the highest poverty rate, with 7 households (43.8%) experiencing poverty. Likewise, among single-mother households, those with 3 or 4 children have the highest poverty rate, with 101 households (91.0%) falling below the poverty line.
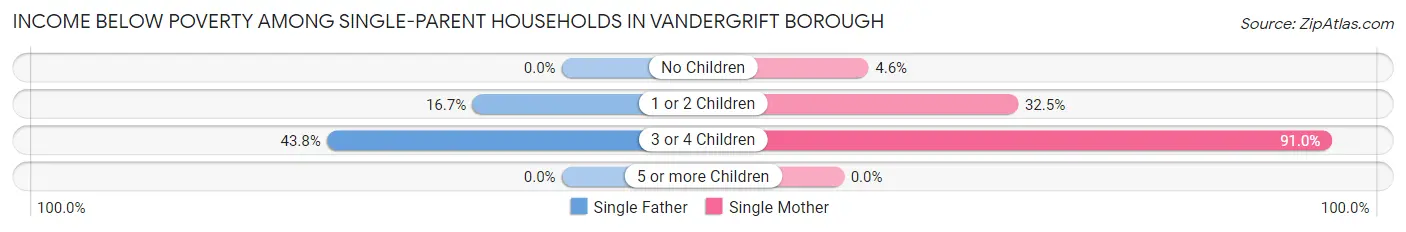
| Children | Single Father | Single Mother |
| No Children | 0 (0.0%) | 4 (4.6%) |
| 1 or 2 Children | 3 (16.7%) | 113 (32.5%) |
| 3 or 4 Children | 7 (43.8%) | 101 (91.0%) |
| 5 or more Children | 0 (0.0%) | 0 (0.0%) |
| Total | 10 (18.5%) | 218 (39.9%) |
Income Below Poverty Among Married-Couple vs Single-Parent Households in Vandergrift borough
The poverty data for Vandergrift borough shows that 122 of the married-couple family households (16.5%) and 228 of the single-parent households (38.0%) are living below the poverty level. Within the married-couple family households, those with 3 or 4 children have the highest poverty rate, with 70 households (64.8%) falling below the poverty line. Among the single-parent households, those with 3 or 4 children have the highest poverty rate, with 108 household (85.0%) living below poverty.
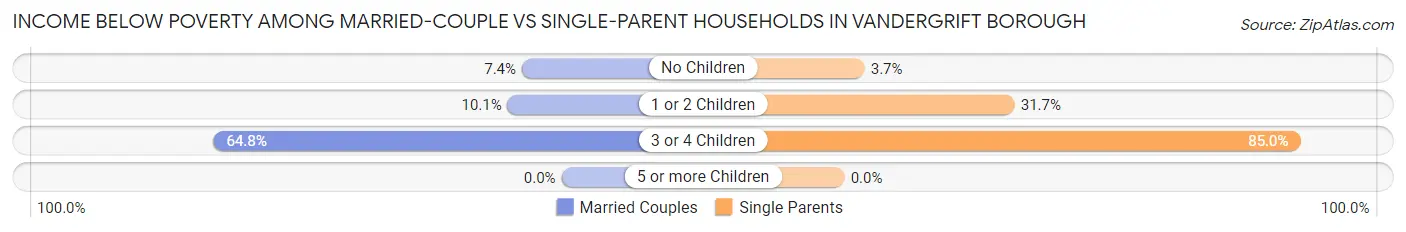
| Children | Married-Couple Families | Single-Parent Households |
| No Children | 31 (7.4%) | 4 (3.7%) |
| 1 or 2 Children | 21 (10.1%) | 116 (31.7%) |
| 3 or 4 Children | 70 (64.8%) | 108 (85.0%) |
| 5 or more Children | 0 (0.0%) | 0 (0.0%) |
| Total | 122 (16.5%) | 228 (38.0%) |
Employment Characteristics in Vandergrift borough
Employment by Class of Employer in Vandergrift borough
Among the 2,187 employed individuals in Vandergrift borough, private company employees (1,494 | 68.3%), not-for-profit organizations (350 | 16.0%), and self-employed (not incorporated) (160 | 7.3%) make up the most common classes of employment.
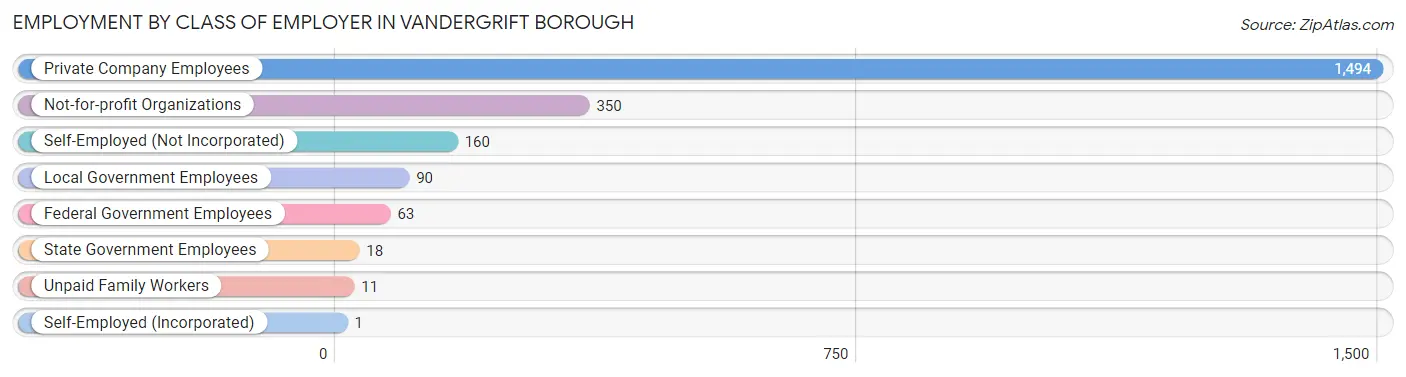
| Employer Class | # Employees | % Employees |
| Private Company Employees | 1,494 | 68.3% |
| Self-Employed (Incorporated) | 1 | 0.1% |
| Self-Employed (Not Incorporated) | 160 | 7.3% |
| Not-for-profit Organizations | 350 | 16.0% |
| Local Government Employees | 90 | 4.1% |
| State Government Employees | 18 | 0.8% |
| Federal Government Employees | 63 | 2.9% |
| Unpaid Family Workers | 11 | 0.5% |
| Total | 2,187 | 100.0% |
Employment Status by Age in Vandergrift borough
According to the labor force statistics for Vandergrift borough, out of the total population over 16 years of age (3,894), 64.7% or 2,519 individuals are in the labor force, with 10.2% or 257 of them unemployed. The age group with the highest labor force participation rate is 25 to 29 years, with 94.7% or 374 individuals in the labor force. Within the labor force, the 20 to 24 years age range has the highest percentage of unemployed individuals, with 38.6% or 88 of them being unemployed.
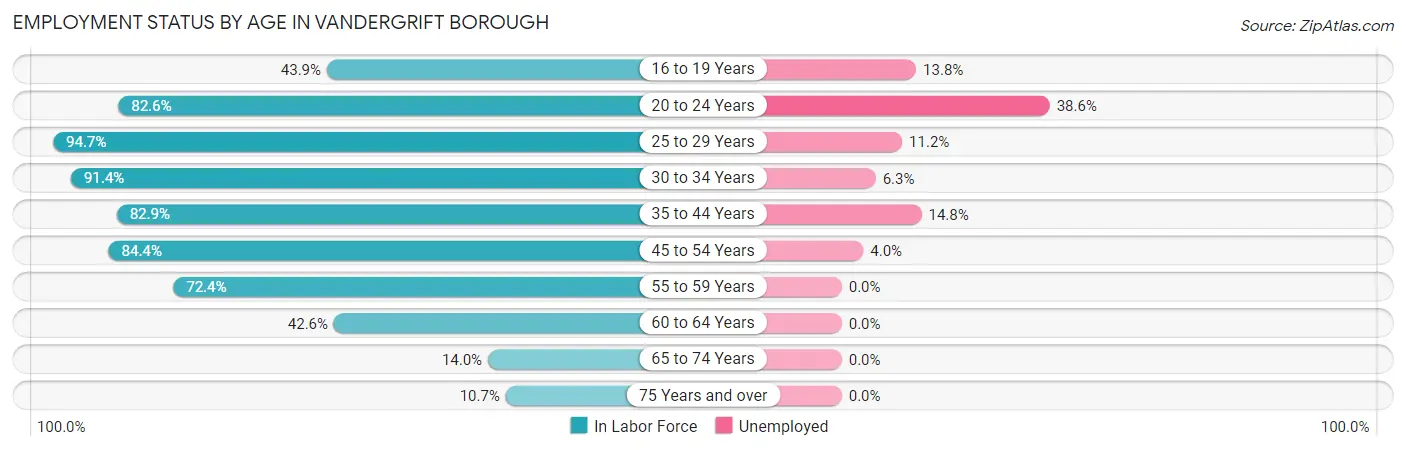
| Age Bracket | In Labor Force | Unemployed |
| 16 to 19 Years | 138 (43.9%) | 19 (13.8%) |
| 20 to 24 Years | 228 (82.6%) | 88 (38.6%) |
| 25 to 29 Years | 374 (94.7%) | 42 (11.2%) |
| 30 to 34 Years | 286 (91.4%) | 18 (6.3%) |
| 35 to 44 Years | 445 (82.9%) | 66 (14.8%) |
| 45 to 54 Years | 569 (84.4%) | 23 (4.0%) |
| 55 to 59 Years | 254 (72.4%) | 0 (0.0%) |
| 60 to 64 Years | 135 (42.6%) | 0 (0.0%) |
| 65 to 74 Years | 66 (14.0%) | 0 (0.0%) |
| 75 Years and over | 26 (10.7%) | 0 (0.0%) |
| Total | 2,519 (64.7%) | 257 (10.2%) |
Employment Status by Educational Attainment in Vandergrift borough
According to labor force statistics for Vandergrift borough, 79.7% of individuals (2,062) out of the total population between 25 and 64 years of age (2,587) are in the labor force, with 7.2% or 148 of them being unemployed. The group with the highest labor force participation rate are those with the educational attainment of college / associate degree, with 88.8% or 895 individuals in the labor force. Within the labor force, individuals with high school diploma education have the highest percentage of unemployment, with 14.5% or 109 of them being unemployed.
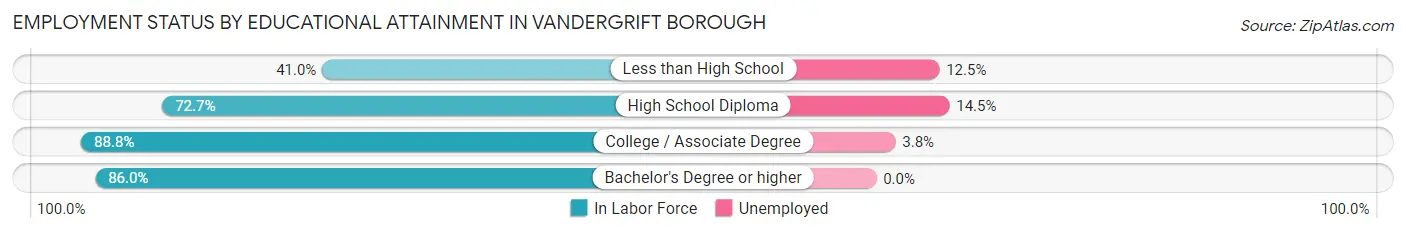
| Educational Attainment | In Labor Force | Unemployed |
| Less than High School | 48 (41.0%) | 15 (12.5%) |
| High School Diploma | 751 (72.7%) | 150 (14.5%) |
| College / Associate Degree | 895 (88.8%) | 38 (3.8%) |
| Bachelor's Degree or higher | 369 (86.0%) | 0 (0.0%) |
| Total | 2,062 (79.7%) | 186 (7.2%) |
Employment Occupations by Sex in Vandergrift borough
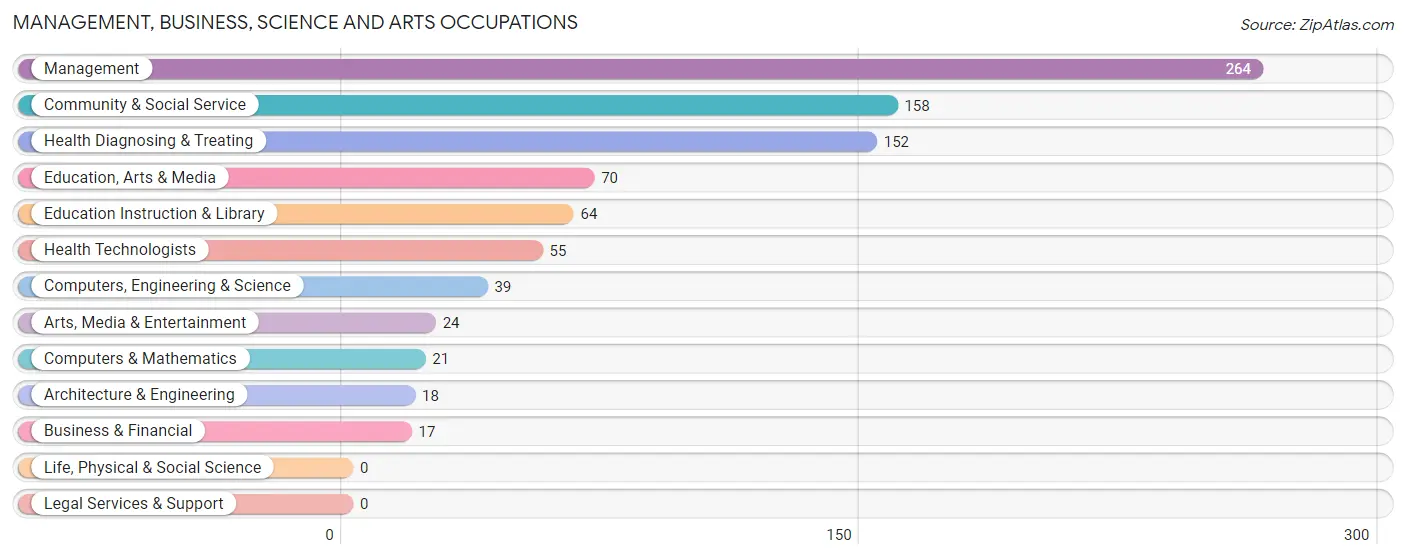
Management, Business, Science and Arts Occupations
The most common Management, Business, Science and Arts occupations in Vandergrift borough are Management (264 | 11.7%), Community & Social Service (158 | 7.0%), Health Diagnosing & Treating (152 | 6.7%), Education, Arts & Media (70 | 3.1%), and Education Instruction & Library (64 | 2.8%).
Management, Business, Science and Arts Occupations by Sex
Within the Management, Business, Science and Arts occupations in Vandergrift borough, the most male-oriented occupations are Business & Financial (100.0%), Architecture & Engineering (100.0%), and Arts, Media & Entertainment (100.0%), while the most female-oriented occupations are Health Technologists (100.0%), Health Diagnosing & Treating (90.1%), and Education, Arts & Media (88.6%).
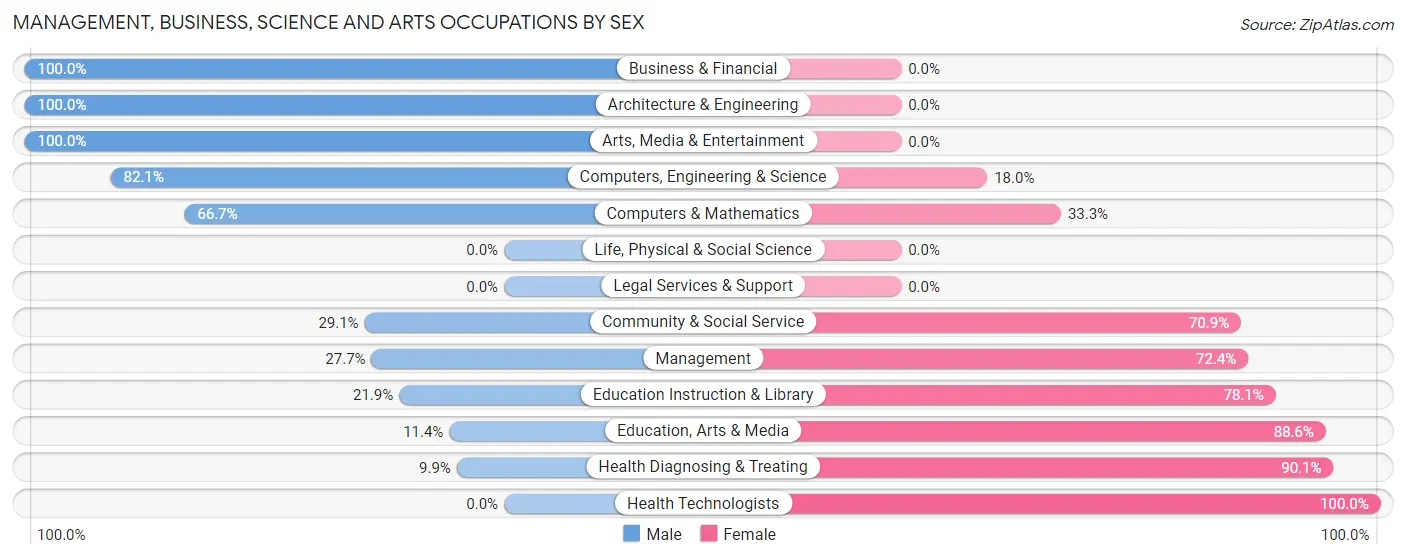
| Occupation | Male | Female |
| Management | 73 (27.7%) | 191 (72.4%) |
| Business & Financial | 17 (100.0%) | 0 (0.0%) |
| Computers, Engineering & Science | 32 (82.1%) | 7 (17.9%) |
| Computers & Mathematics | 14 (66.7%) | 7 (33.3%) |
| Architecture & Engineering | 18 (100.0%) | 0 (0.0%) |
| Life, Physical & Social Science | 0 (0.0%) | 0 (0.0%) |
| Community & Social Service | 46 (29.1%) | 112 (70.9%) |
| Education, Arts & Media | 8 (11.4%) | 62 (88.6%) |
| Legal Services & Support | 0 (0.0%) | 0 (0.0%) |
| Education Instruction & Library | 14 (21.9%) | 50 (78.1%) |
| Arts, Media & Entertainment | 24 (100.0%) | 0 (0.0%) |
| Health Diagnosing & Treating | 15 (9.9%) | 137 (90.1%) |
| Health Technologists | 0 (0.0%) | 55 (100.0%) |
| Total (Category) | 183 (29.0%) | 447 (71.0%) |
| Total (Overall) | 1,018 (44.9%) | 1,247 (55.1%) |
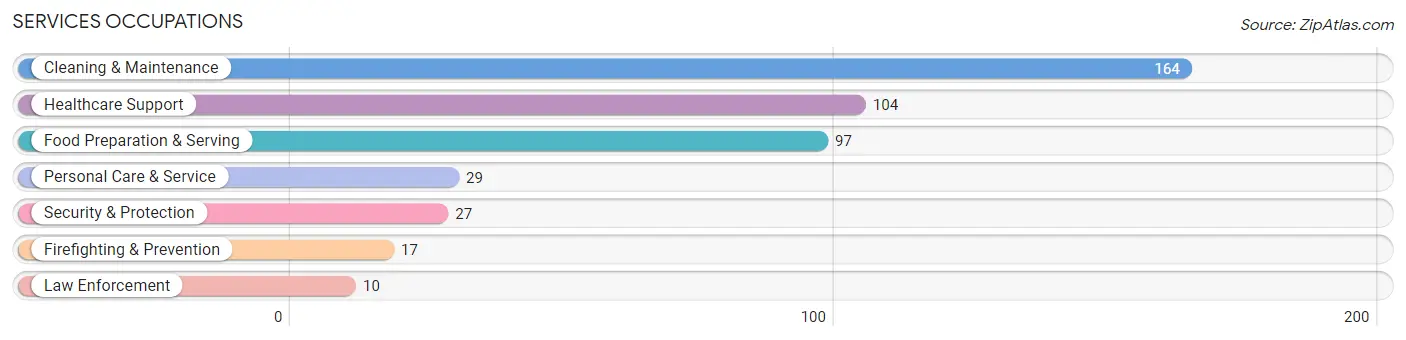
Services Occupations
The most common Services occupations in Vandergrift borough are Cleaning & Maintenance (164 | 7.2%), Healthcare Support (104 | 4.6%), Food Preparation & Serving (97 | 4.3%), Personal Care & Service (29 | 1.3%), and Security & Protection (27 | 1.2%).
Services Occupations by Sex
Within the Services occupations in Vandergrift borough, the most male-oriented occupations are Law Enforcement (100.0%), Personal Care & Service (72.4%), and Security & Protection (66.7%), while the most female-oriented occupations are Healthcare Support (83.7%), Food Preparation & Serving (68.0%), and Firefighting & Prevention (52.9%).
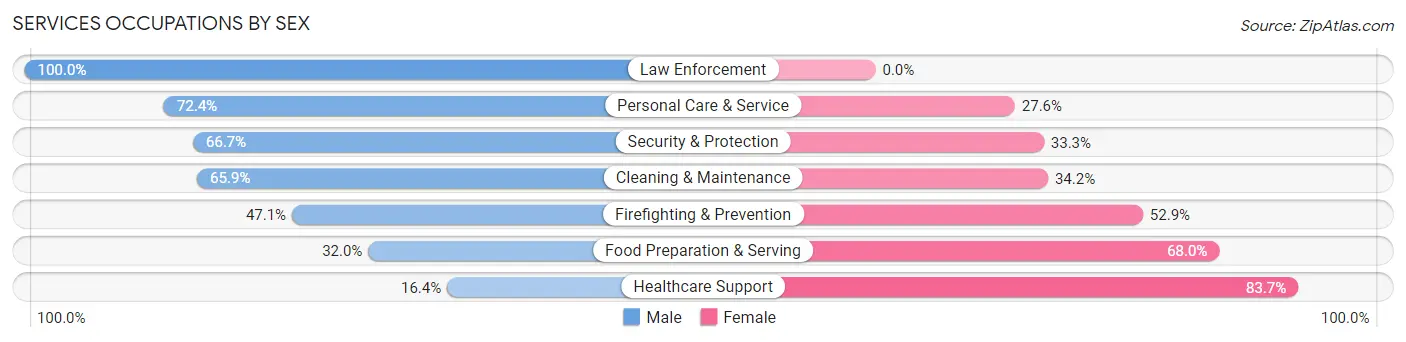
| Occupation | Male | Female |
| Healthcare Support | 17 (16.4%) | 87 (83.7%) |
| Security & Protection | 18 (66.7%) | 9 (33.3%) |
| Firefighting & Prevention | 8 (47.1%) | 9 (52.9%) |
| Law Enforcement | 10 (100.0%) | 0 (0.0%) |
| Food Preparation & Serving | 31 (32.0%) | 66 (68.0%) |
| Cleaning & Maintenance | 108 (65.8%) | 56 (34.2%) |
| Personal Care & Service | 21 (72.4%) | 8 (27.6%) |
| Total (Category) | 195 (46.3%) | 226 (53.7%) |
| Total (Overall) | 1,018 (44.9%) | 1,247 (55.1%) |
Sales and Office Occupations
The most common Sales and Office occupations in Vandergrift borough are Sales & Related (403 | 17.8%), and Office & Administration (255 | 11.3%).

Sales and Office Occupations by Sex
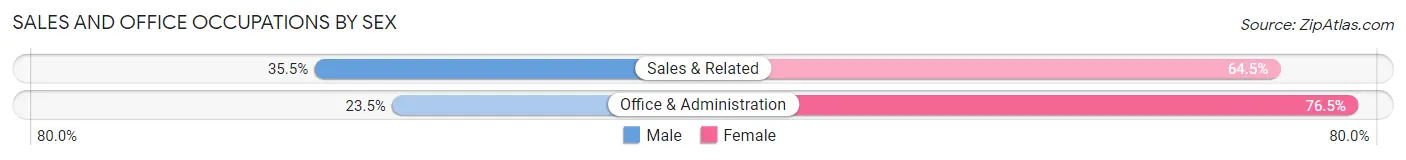
| Occupation | Male | Female |
| Sales & Related | 143 (35.5%) | 260 (64.5%) |
| Office & Administration | 60 (23.5%) | 195 (76.5%) |
| Total (Category) | 203 (30.8%) | 455 (69.2%) |
| Total (Overall) | 1,018 (44.9%) | 1,247 (55.1%) |
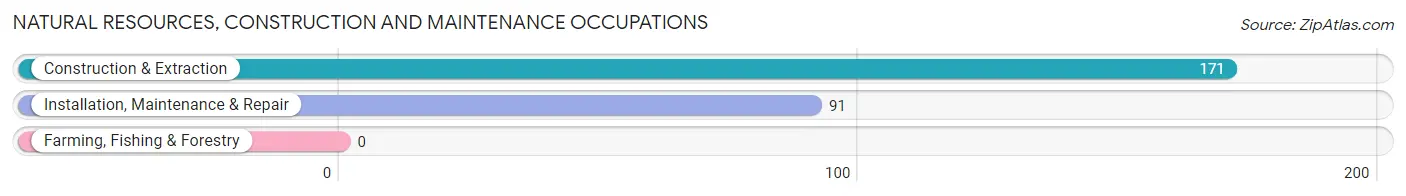
Natural Resources, Construction and Maintenance Occupations
The most common Natural Resources, Construction and Maintenance occupations in Vandergrift borough are Construction & Extraction (171 | 7.5%), and Installation, Maintenance & Repair (91 | 4.0%).
Natural Resources, Construction and Maintenance Occupations by Sex

| Occupation | Male | Female |
| Farming, Fishing & Forestry | 0 (0.0%) | 0 (0.0%) |
| Construction & Extraction | 171 (100.0%) | 0 (0.0%) |
| Installation, Maintenance & Repair | 91 (100.0%) | 0 (0.0%) |
| Total (Category) | 262 (100.0%) | 0 (0.0%) |
| Total (Overall) | 1,018 (44.9%) | 1,247 (55.1%) |
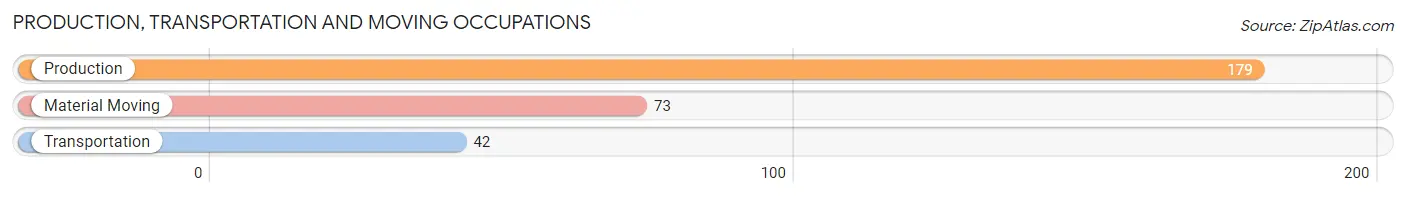
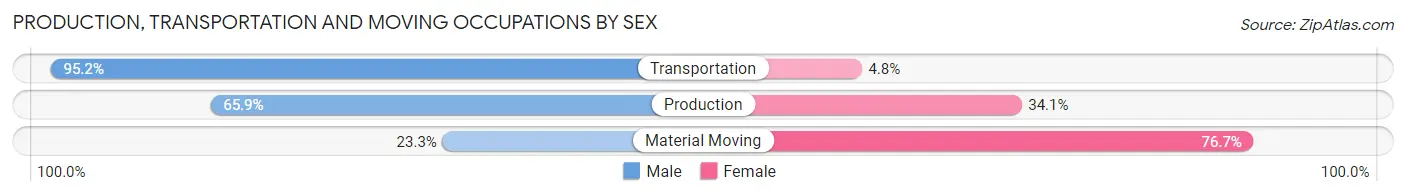
Production, Transportation and Moving Occupations
The most common Production, Transportation and Moving occupations in Vandergrift borough are Production (179 | 7.9%), Material Moving (73 | 3.2%), and Transportation (42 | 1.8%).
Production, Transportation and Moving Occupations by Sex
| Occupation | Male | Female |
| Production | 118 (65.9%) | 61 (34.1%) |
| Transportation | 40 (95.2%) | 2 (4.8%) |
| Material Moving | 17 (23.3%) | 56 (76.7%) |
| Total (Category) | 175 (59.5%) | 119 (40.5%) |
| Total (Overall) | 1,018 (44.9%) | 1,247 (55.1%) |
Employment Industries by Sex in Vandergrift borough
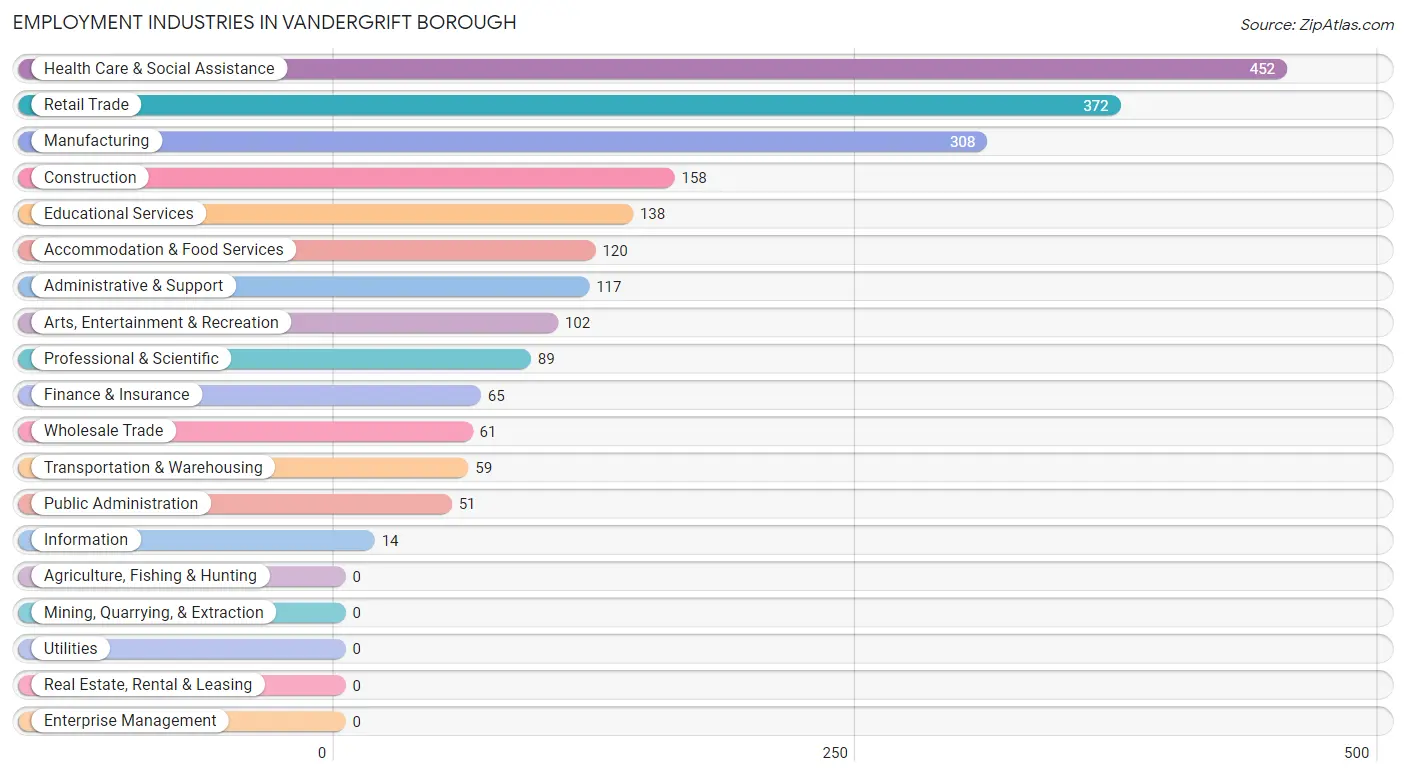
Employment Industries in Vandergrift borough
The major employment industries in Vandergrift borough include Health Care & Social Assistance (452 | 20.0%), Retail Trade (372 | 16.4%), Manufacturing (308 | 13.6%), Construction (158 | 7.0%), and Educational Services (138 | 6.1%).
Employment Industries by Sex in Vandergrift borough
The Vandergrift borough industries that see more men than women are Construction (100.0%), Public Administration (100.0%), and Transportation & Warehousing (83.1%), whereas the industries that tend to have a higher number of women are Administrative & Support (94.0%), Health Care & Social Assistance (84.5%), and Accommodation & Food Services (78.3%).
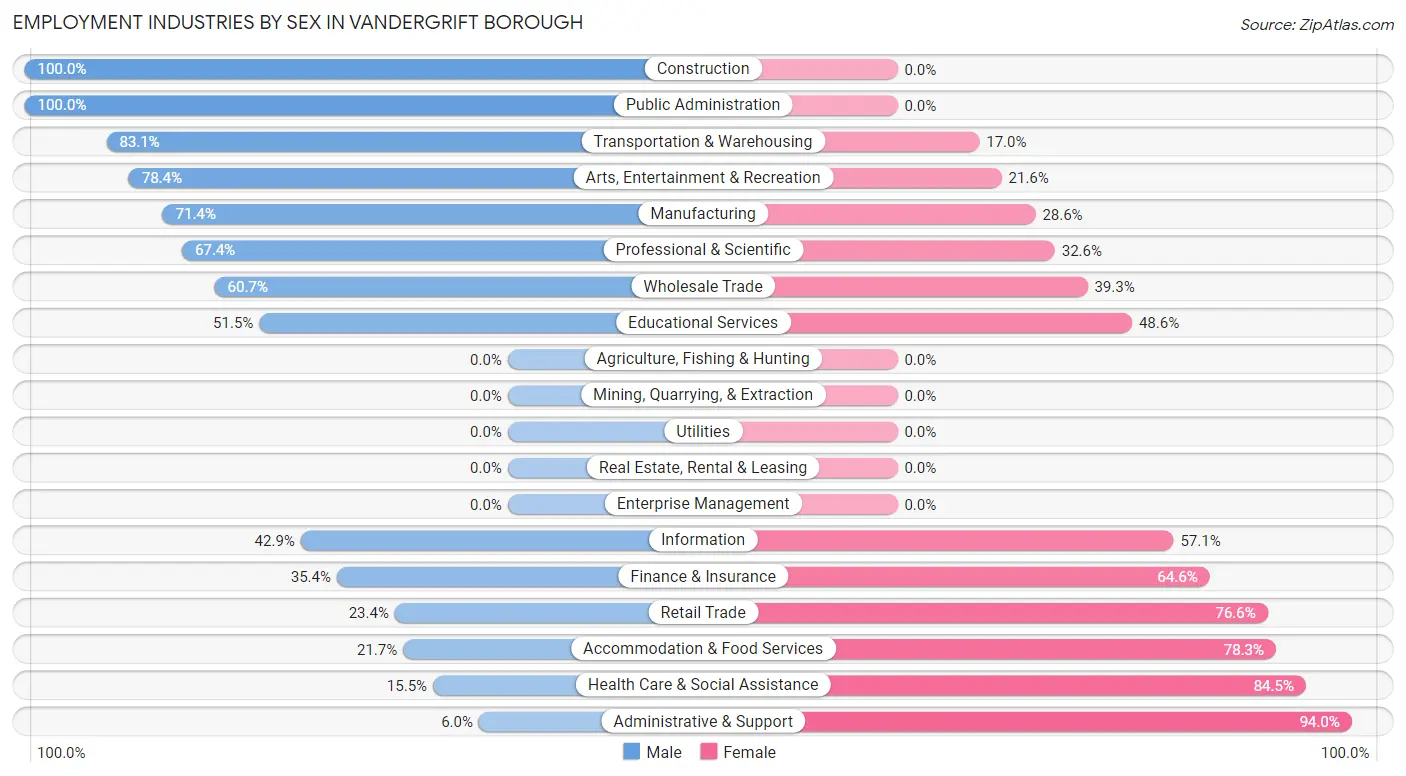
| Industry | Male | Female |
| Agriculture, Fishing & Hunting | 0 (0.0%) | 0 (0.0%) |
| Mining, Quarrying, & Extraction | 0 (0.0%) | 0 (0.0%) |
| Construction | 158 (100.0%) | 0 (0.0%) |
| Manufacturing | 220 (71.4%) | 88 (28.6%) |
| Wholesale Trade | 37 (60.7%) | 24 (39.3%) |
| Retail Trade | 87 (23.4%) | 285 (76.6%) |
| Transportation & Warehousing | 49 (83.1%) | 10 (17.0%) |
| Utilities | 0 (0.0%) | 0 (0.0%) |
| Information | 6 (42.9%) | 8 (57.1%) |
| Finance & Insurance | 23 (35.4%) | 42 (64.6%) |
| Real Estate, Rental & Leasing | 0 (0.0%) | 0 (0.0%) |
| Professional & Scientific | 60 (67.4%) | 29 (32.6%) |
| Enterprise Management | 0 (0.0%) | 0 (0.0%) |
| Administrative & Support | 7 (6.0%) | 110 (94.0%) |
| Educational Services | 71 (51.4%) | 67 (48.5%) |
| Health Care & Social Assistance | 70 (15.5%) | 382 (84.5%) |
| Arts, Entertainment & Recreation | 80 (78.4%) | 22 (21.6%) |
| Accommodation & Food Services | 26 (21.7%) | 94 (78.3%) |
| Public Administration | 51 (100.0%) | 0 (0.0%) |
| Total | 1,018 (44.9%) | 1,247 (55.1%) |
Education in Vandergrift borough
School Enrollment in Vandergrift borough
The most common levels of schooling among the 1,204 students in Vandergrift borough are high school (355 | 29.5%), elementary school (344 | 28.6%), and middle school (220 | 18.3%).
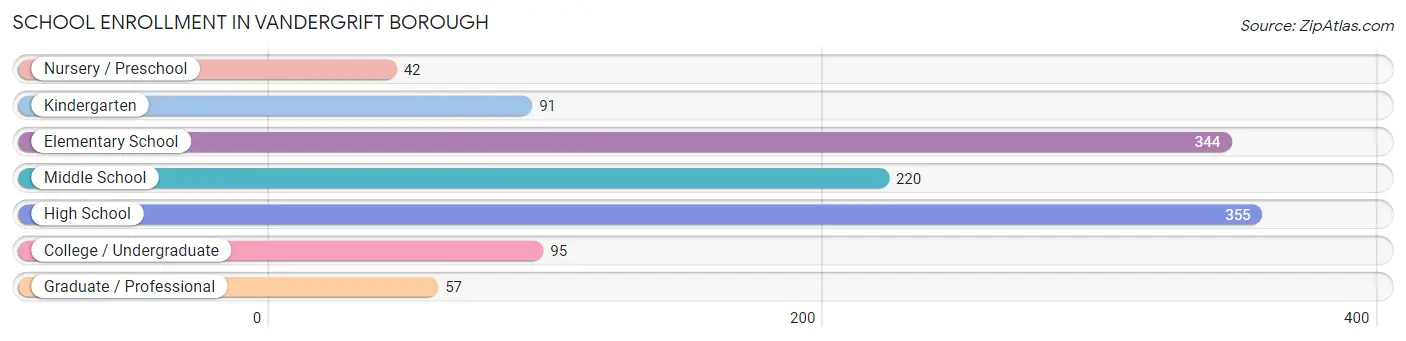
| School Level | # Students | % Students |
| Nursery / Preschool | 42 | 3.5% |
| Kindergarten | 91 | 7.6% |
| Elementary School | 344 | 28.6% |
| Middle School | 220 | 18.3% |
| High School | 355 | 29.5% |
| College / Undergraduate | 95 | 7.9% |
| Graduate / Professional | 57 | 4.7% |
| Total | 1,204 | 100.0% |
School Enrollment by Age by Funding Source in Vandergrift borough
Out of a total of 1,204 students who are enrolled in schools in Vandergrift borough, 52 (4.3%) attend a private institution, while the remaining 1,152 (95.7%) are enrolled in public schools. The age group of 20 to 24 year olds has the highest likelihood of being enrolled in private schools, with 52 (63.4% in the age bracket) enrolled. Conversely, the age group of 3 to 4 year olds has the lowest likelihood of being enrolled in a private school, with 36 (100.0% in the age bracket) attending a public institution.
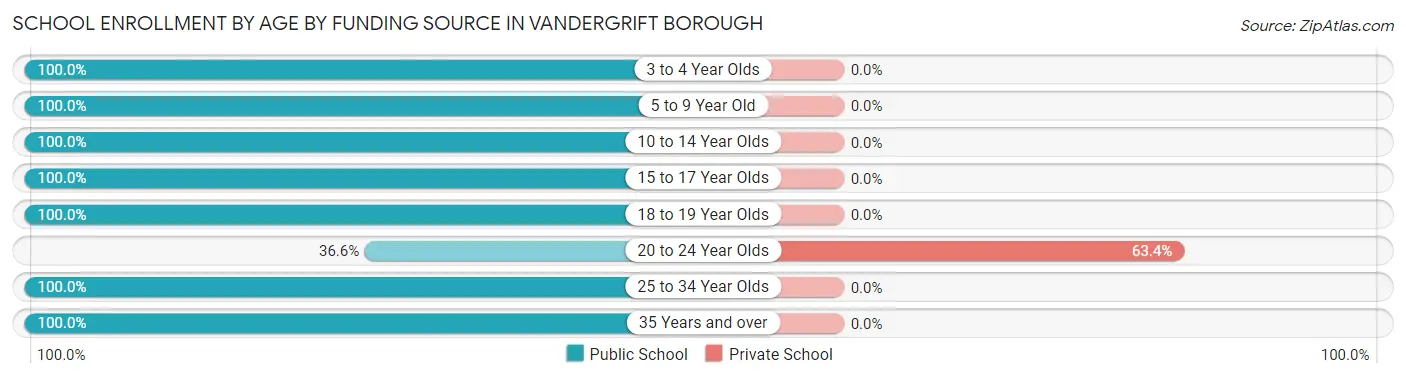
| Age Bracket | Public School | Private School |
| 3 to 4 Year Olds | 36 (100.0%) | 0 (0.0%) |
| 5 to 9 Year Old | 378 (100.0%) | 0 (0.0%) |
| 10 to 14 Year Olds | 294 (100.0%) | 0 (0.0%) |
| 15 to 17 Year Olds | 313 (100.0%) | 0 (0.0%) |
| 18 to 19 Year Olds | 59 (100.0%) | 0 (0.0%) |
| 20 to 24 Year Olds | 30 (36.6%) | 52 (63.4%) |
| 25 to 34 Year Olds | 14 (100.0%) | 0 (0.0%) |
| 35 Years and over | 28 (100.0%) | 0 (0.0%) |
| Total | 1,152 (95.7%) | 52 (4.3%) |
Educational Attainment by Field of Study in Vandergrift borough
Science & technology (108 | 18.7%), education (103 | 17.8%), business (86 | 14.9%), psychology (84 | 14.6%), and liberal arts & history (46 | 8.0%) are the most common fields of study among 577 individuals in Vandergrift borough who have obtained a bachelor's degree or higher.
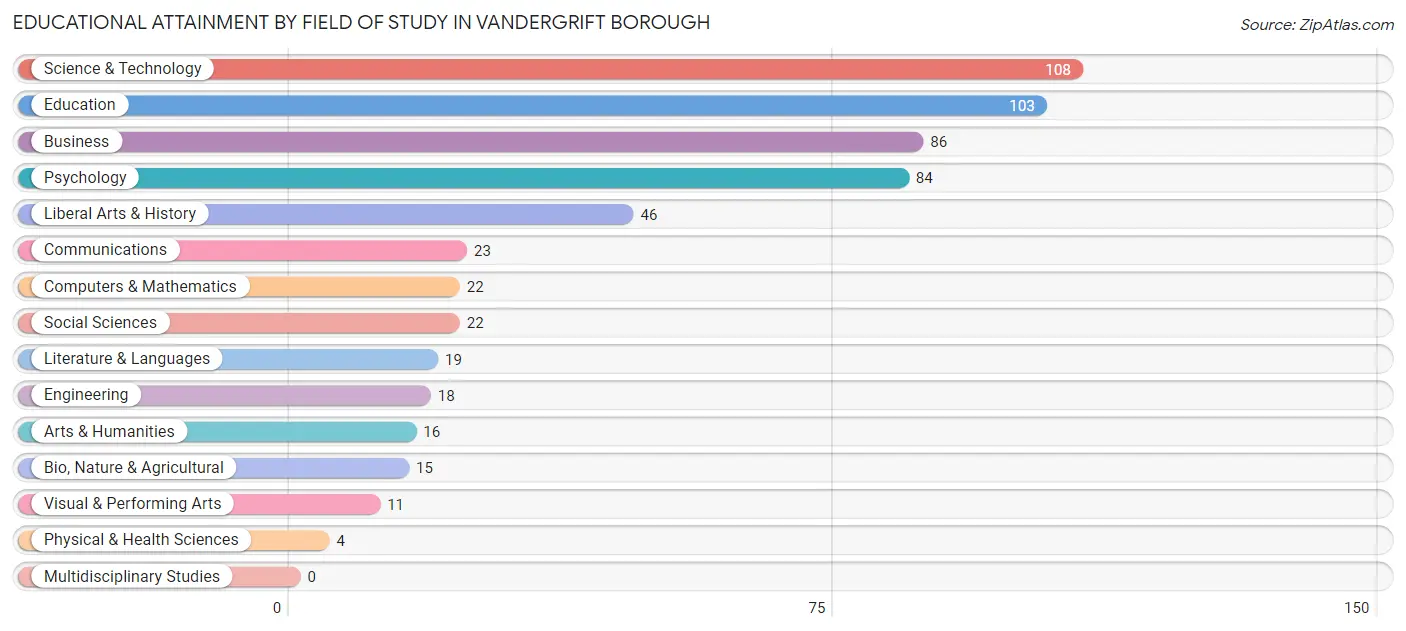
| Field of Study | # Graduates | % Graduates |
| Computers & Mathematics | 22 | 3.8% |
| Bio, Nature & Agricultural | 15 | 2.6% |
| Physical & Health Sciences | 4 | 0.7% |
| Psychology | 84 | 14.6% |
| Social Sciences | 22 | 3.8% |
| Engineering | 18 | 3.1% |
| Multidisciplinary Studies | 0 | 0.0% |
| Science & Technology | 108 | 18.7% |
| Business | 86 | 14.9% |
| Education | 103 | 17.8% |
| Literature & Languages | 19 | 3.3% |
| Liberal Arts & History | 46 | 8.0% |
| Visual & Performing Arts | 11 | 1.9% |
| Communications | 23 | 4.0% |
| Arts & Humanities | 16 | 2.8% |
| Total | 577 | 100.0% |
Transportation & Commute in Vandergrift borough
Vehicle Availability by Sex in Vandergrift borough
The most prevalent vehicle ownership categories in Vandergrift borough are males with 2 vehicles (416, accounting for 43.9%) and females with 2 vehicles (372, making up 33.6%).
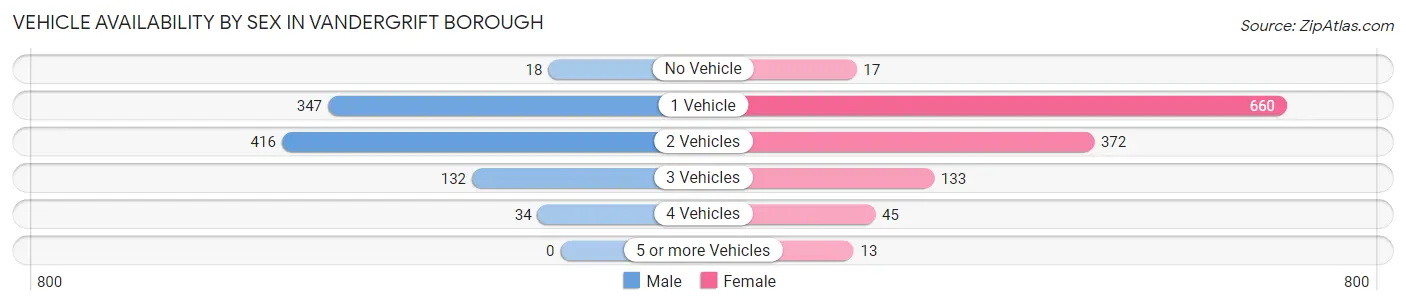
| Vehicles Available | Male | Female |
| No Vehicle | 18 (1.9%) | 17 (1.4%) |
| 1 Vehicle | 347 (36.6%) | 660 (53.2%) |
| 2 Vehicles | 416 (43.9%) | 372 (30.0%) |
| 3 Vehicles | 132 (13.9%) | 133 (10.7%) |
| 4 Vehicles | 34 (3.6%) | 45 (3.6%) |
| 5 or more Vehicles | 0 (0.0%) | 13 (1.1%) |
| Total | 947 (100.0%) | 1,240 (100.0%) |
Commute Time in Vandergrift borough
The most frequently occuring commute durations in Vandergrift borough are 30 to 34 minutes (320 commuters, 17.5%), 5 to 9 minutes (281 commuters, 15.4%), and 45 to 59 minutes (208 commuters, 11.4%).
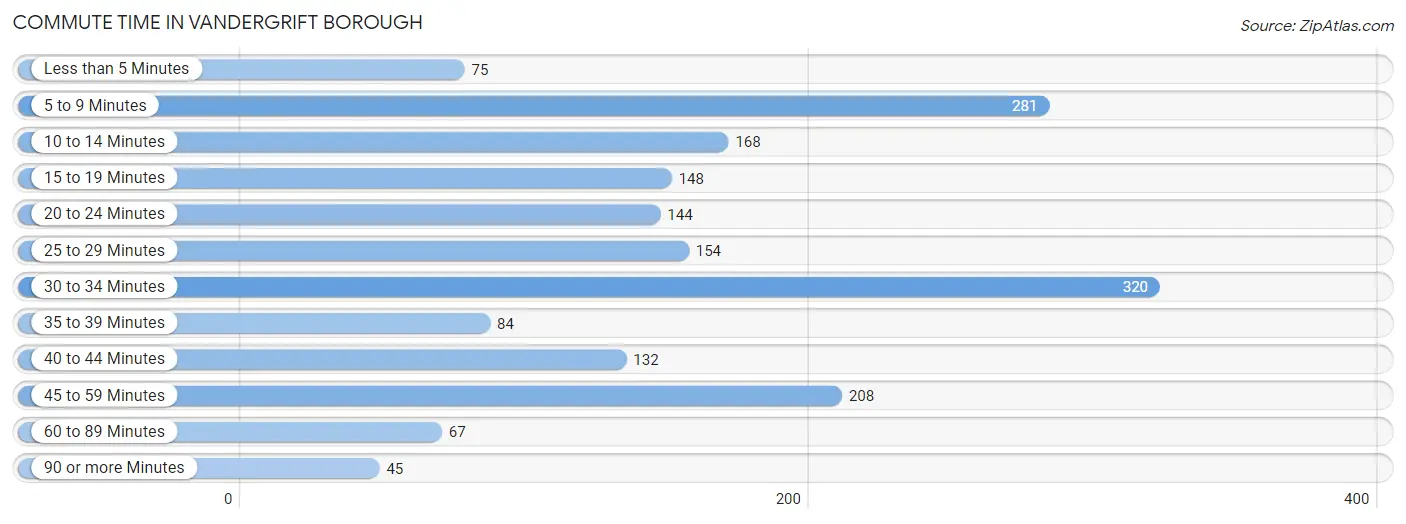
| Commute Time | # Commuters | % Commuters |
| Less than 5 Minutes | 75 | 4.1% |
| 5 to 9 Minutes | 281 | 15.4% |
| 10 to 14 Minutes | 168 | 9.2% |
| 15 to 19 Minutes | 148 | 8.1% |
| 20 to 24 Minutes | 144 | 7.9% |
| 25 to 29 Minutes | 154 | 8.4% |
| 30 to 34 Minutes | 320 | 17.5% |
| 35 to 39 Minutes | 84 | 4.6% |
| 40 to 44 Minutes | 132 | 7.2% |
| 45 to 59 Minutes | 208 | 11.4% |
| 60 to 89 Minutes | 67 | 3.7% |
| 90 or more Minutes | 45 | 2.5% |
Commute Time by Sex in Vandergrift borough
The most common commute times in Vandergrift borough are 30 to 34 minutes (139 commuters, 16.8%) for males and 5 to 9 minutes (226 commuters, 22.7%) for females.
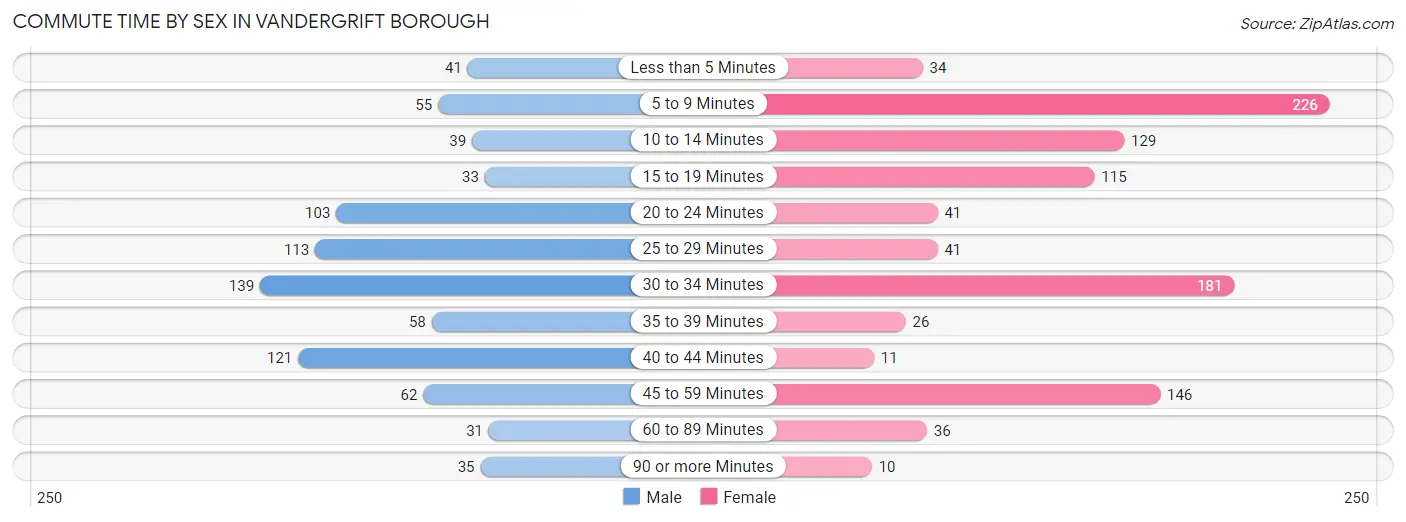
| Commute Time | Male | Female |
| Less than 5 Minutes | 41 (4.9%) | 34 (3.4%) |
| 5 to 9 Minutes | 55 (6.6%) | 226 (22.7%) |
| 10 to 14 Minutes | 39 (4.7%) | 129 (13.0%) |
| 15 to 19 Minutes | 33 (4.0%) | 115 (11.6%) |
| 20 to 24 Minutes | 103 (12.4%) | 41 (4.1%) |
| 25 to 29 Minutes | 113 (13.6%) | 41 (4.1%) |
| 30 to 34 Minutes | 139 (16.8%) | 181 (18.2%) |
| 35 to 39 Minutes | 58 (7.0%) | 26 (2.6%) |
| 40 to 44 Minutes | 121 (14.6%) | 11 (1.1%) |
| 45 to 59 Minutes | 62 (7.5%) | 146 (14.7%) |
| 60 to 89 Minutes | 31 (3.7%) | 36 (3.6%) |
| 90 or more Minutes | 35 (4.2%) | 10 (1.0%) |
Time of Departure to Work by Sex in Vandergrift borough
The most frequent times of departure to work in Vandergrift borough are 7:00 AM to 7:29 AM (154, 18.5%) for males and 12:00 PM to 3:59 PM (200, 20.1%) for females.
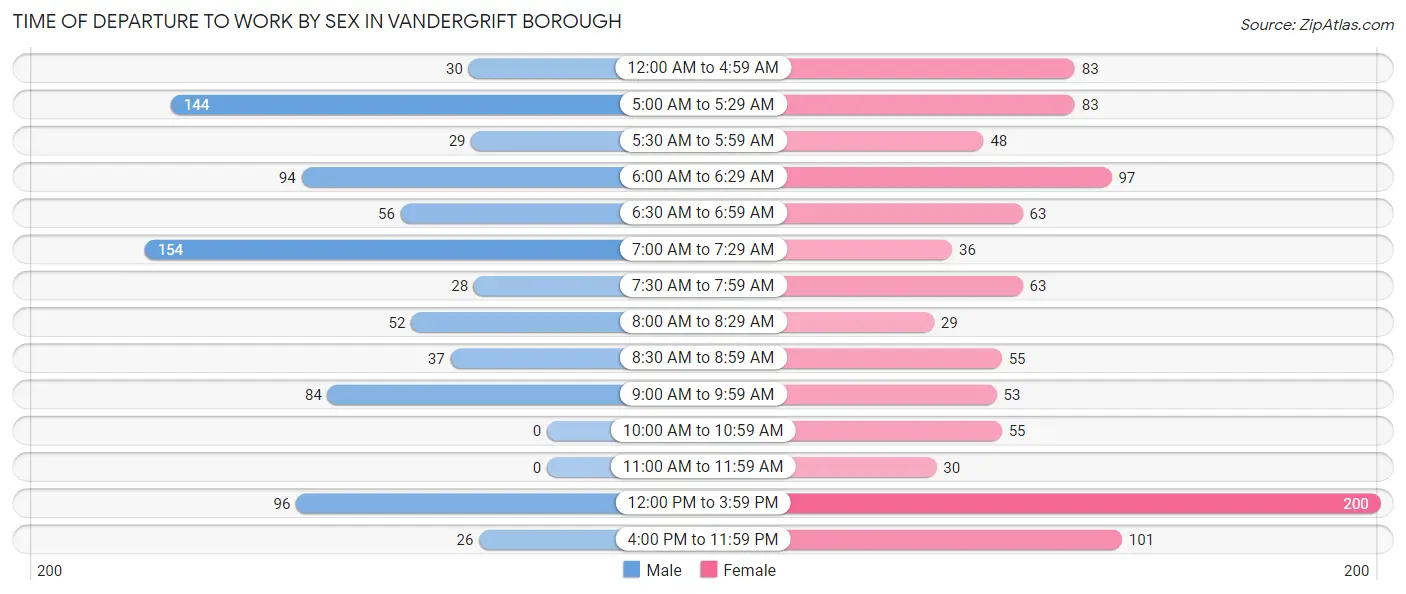
| Time of Departure | Male | Female |
| 12:00 AM to 4:59 AM | 30 (3.6%) | 83 (8.3%) |
| 5:00 AM to 5:29 AM | 144 (17.3%) | 83 (8.3%) |
| 5:30 AM to 5:59 AM | 29 (3.5%) | 48 (4.8%) |
| 6:00 AM to 6:29 AM | 94 (11.3%) | 97 (9.7%) |
| 6:30 AM to 6:59 AM | 56 (6.8%) | 63 (6.3%) |
| 7:00 AM to 7:29 AM | 154 (18.5%) | 36 (3.6%) |
| 7:30 AM to 7:59 AM | 28 (3.4%) | 63 (6.3%) |
| 8:00 AM to 8:29 AM | 52 (6.3%) | 29 (2.9%) |
| 8:30 AM to 8:59 AM | 37 (4.5%) | 55 (5.5%) |
| 9:00 AM to 9:59 AM | 84 (10.1%) | 53 (5.3%) |
| 10:00 AM to 10:59 AM | 0 (0.0%) | 55 (5.5%) |
| 11:00 AM to 11:59 AM | 0 (0.0%) | 30 (3.0%) |
| 12:00 PM to 3:59 PM | 96 (11.6%) | 200 (20.1%) |
| 4:00 PM to 11:59 PM | 26 (3.1%) | 101 (10.1%) |
| Total | 830 (100.0%) | 996 (100.0%) |
Housing Occupancy in Vandergrift borough
Occupancy by Ownership in Vandergrift borough
Of the total 2,200 dwellings in Vandergrift borough, owner-occupied units account for 1,155 (52.5%), while renter-occupied units make up 1,045 (47.5%).
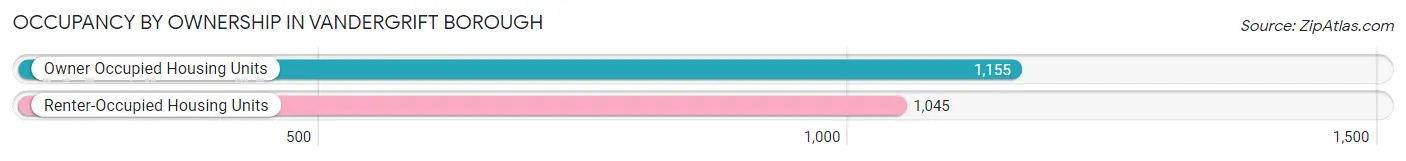
| Occupancy | # Housing Units | % Housing Units |
| Owner Occupied Housing Units | 1,155 | 52.5% |
| Renter-Occupied Housing Units | 1,045 | 47.5% |
| Total Occupied Housing Units | 2,200 | 100.0% |
Occupancy by Household Size in Vandergrift borough
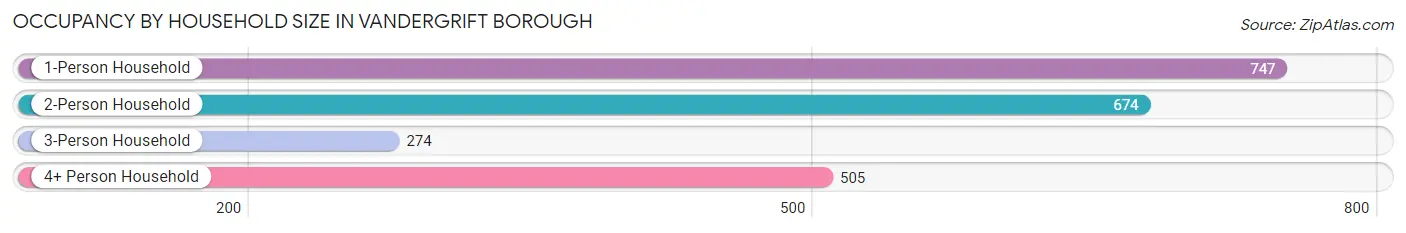
| Household Size | # Housing Units | % Housing Units |
| 1-Person Household | 747 | 34.0% |
| 2-Person Household | 674 | 30.6% |
| 3-Person Household | 274 | 12.4% |
| 4+ Person Household | 505 | 23.0% |
| Total Housing Units | 2,200 | 100.0% |
Occupancy by Ownership by Household Size in Vandergrift borough
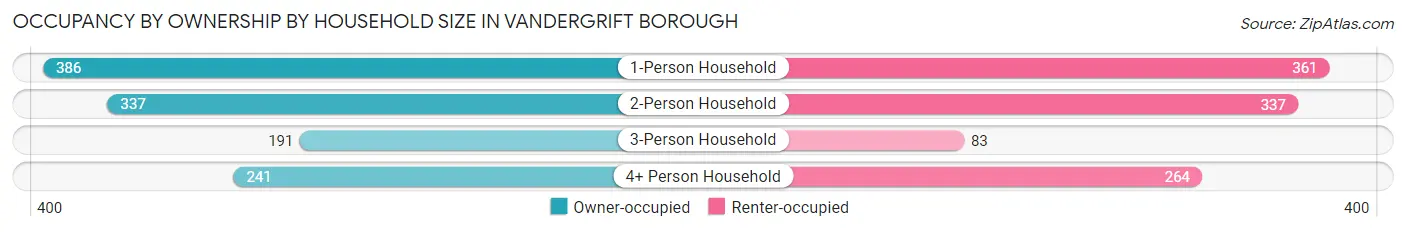
| Household Size | Owner-occupied | Renter-occupied |
| 1-Person Household | 386 (51.7%) | 361 (48.3%) |
| 2-Person Household | 337 (50.0%) | 337 (50.0%) |
| 3-Person Household | 191 (69.7%) | 83 (30.3%) |
| 4+ Person Household | 241 (47.7%) | 264 (52.3%) |
| Total Housing Units | 1,155 (52.5%) | 1,045 (47.5%) |
Occupancy by Educational Attainment in Vandergrift borough
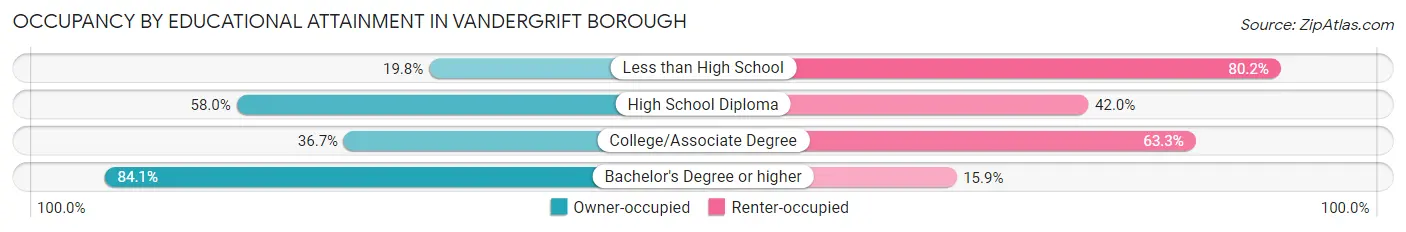
| Household Size | Owner-occupied | Renter-occupied |
| Less than High School | 21 (19.8%) | 85 (80.2%) |
| High School Diploma | 483 (58.0%) | 350 (42.0%) |
| College/Associate Degree | 317 (36.7%) | 547 (63.3%) |
| Bachelor's Degree or higher | 334 (84.1%) | 63 (15.9%) |
Occupancy by Age of Householder in Vandergrift borough
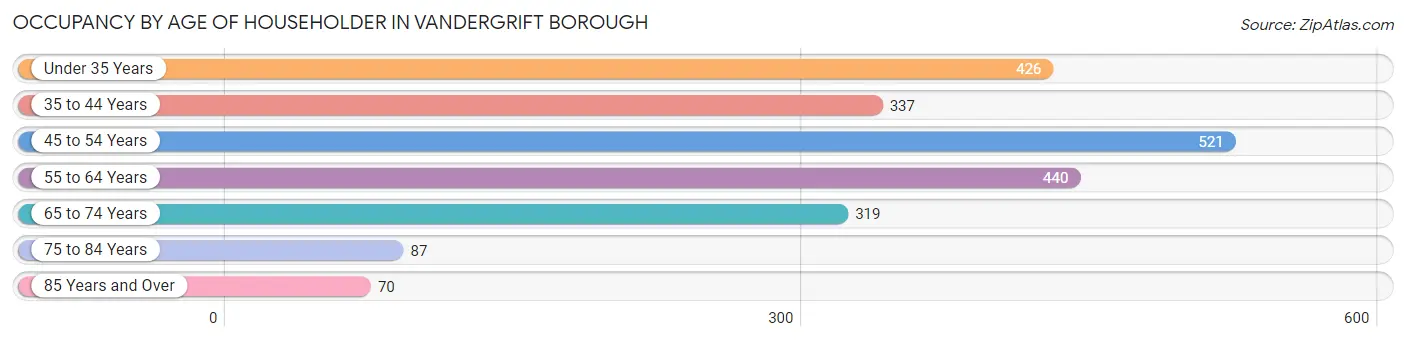
| Age Bracket | # Households | % Households |
| Under 35 Years | 426 | 19.4% |
| 35 to 44 Years | 337 | 15.3% |
| 45 to 54 Years | 521 | 23.7% |
| 55 to 64 Years | 440 | 20.0% |
| 65 to 74 Years | 319 | 14.5% |
| 75 to 84 Years | 87 | 4.0% |
| 85 Years and Over | 70 | 3.2% |
| Total | 2,200 | 100.0% |
Housing Finances in Vandergrift borough
Median Income by Occupancy in Vandergrift borough
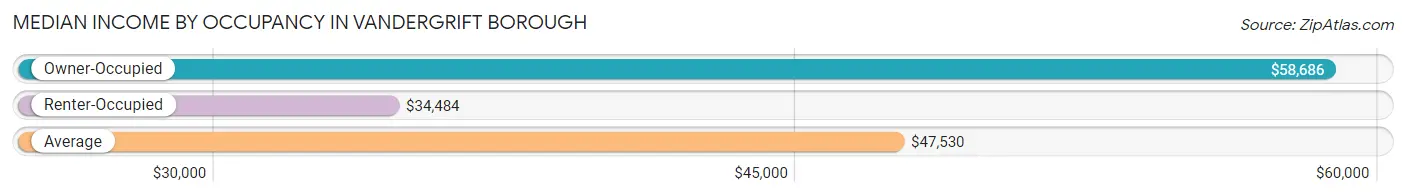
| Occupancy Type | # Households | Median Income |
| Owner-Occupied | 1,155 (52.5%) | $58,686 |
| Renter-Occupied | 1,045 (47.5%) | $34,484 |
| Average | 2,200 (100.0%) | $47,530 |
Occupancy by Householder Income Bracket in Vandergrift borough
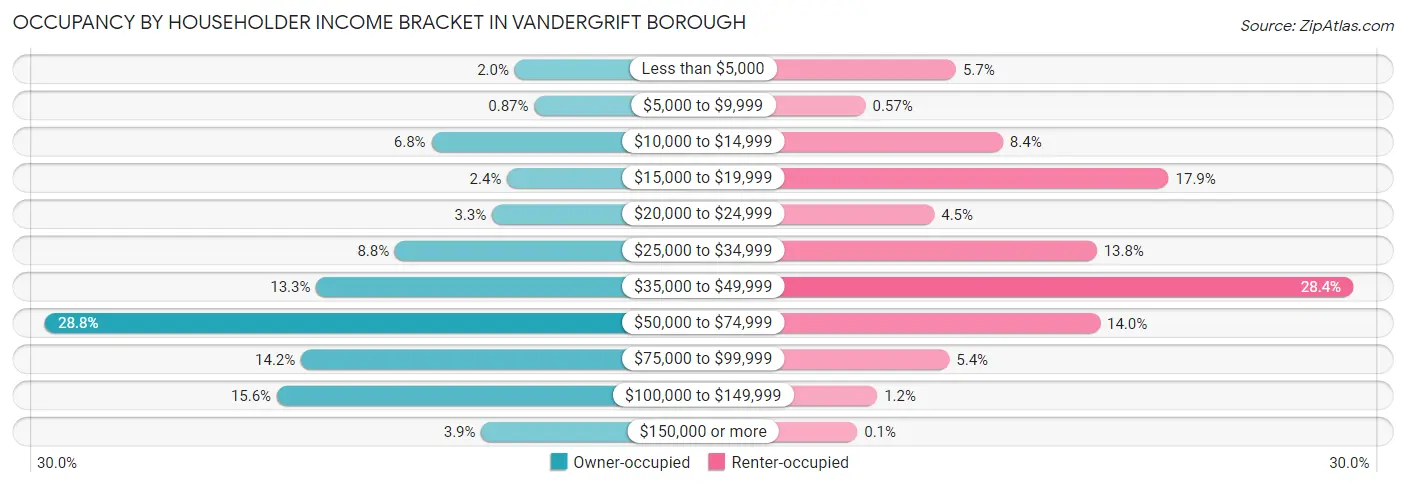
| Income Bracket | Owner-occupied | Renter-occupied |
| Less than $5,000 | 23 (2.0%) | 60 (5.7%) |
| $5,000 to $9,999 | 10 (0.9%) | 6 (0.6%) |
| $10,000 to $14,999 | 78 (6.8%) | 88 (8.4%) |
| $15,000 to $19,999 | 28 (2.4%) | 187 (17.9%) |
| $20,000 to $24,999 | 38 (3.3%) | 47 (4.5%) |
| $25,000 to $34,999 | 102 (8.8%) | 144 (13.8%) |
| $35,000 to $49,999 | 154 (13.3%) | 297 (28.4%) |
| $50,000 to $74,999 | 333 (28.8%) | 146 (14.0%) |
| $75,000 to $99,999 | 164 (14.2%) | 56 (5.4%) |
| $100,000 to $149,999 | 180 (15.6%) | 13 (1.2%) |
| $150,000 or more | 45 (3.9%) | 1 (0.1%) |
| Total | 1,155 (100.0%) | 1,045 (100.0%) |
Monthly Housing Cost Tiers in Vandergrift borough
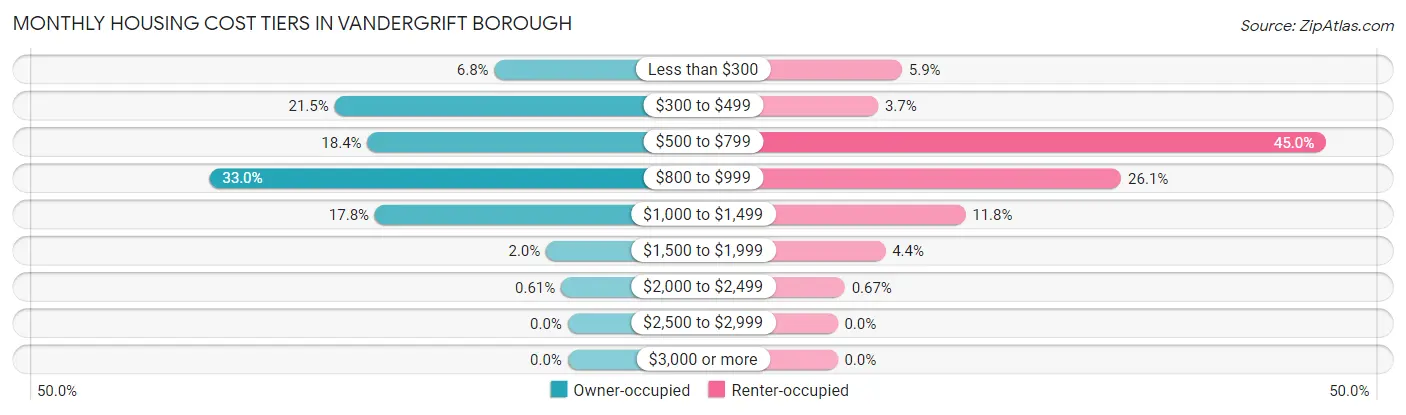
| Monthly Cost | Owner-occupied | Renter-occupied |
| Less than $300 | 78 (6.8%) | 62 (5.9%) |
| $300 to $499 | 248 (21.5%) | 39 (3.7%) |
| $500 to $799 | 213 (18.4%) | 470 (45.0%) |
| $800 to $999 | 381 (33.0%) | 273 (26.1%) |
| $1,000 to $1,499 | 205 (17.7%) | 123 (11.8%) |
| $1,500 to $1,999 | 23 (2.0%) | 46 (4.4%) |
| $2,000 to $2,499 | 7 (0.6%) | 7 (0.7%) |
| $2,500 to $2,999 | 0 (0.0%) | 0 (0.0%) |
| $3,000 or more | 0 (0.0%) | 0 (0.0%) |
| Total | 1,155 (100.0%) | 1,045 (100.0%) |
Physical Housing Characteristics in Vandergrift borough
Housing Structures in Vandergrift borough
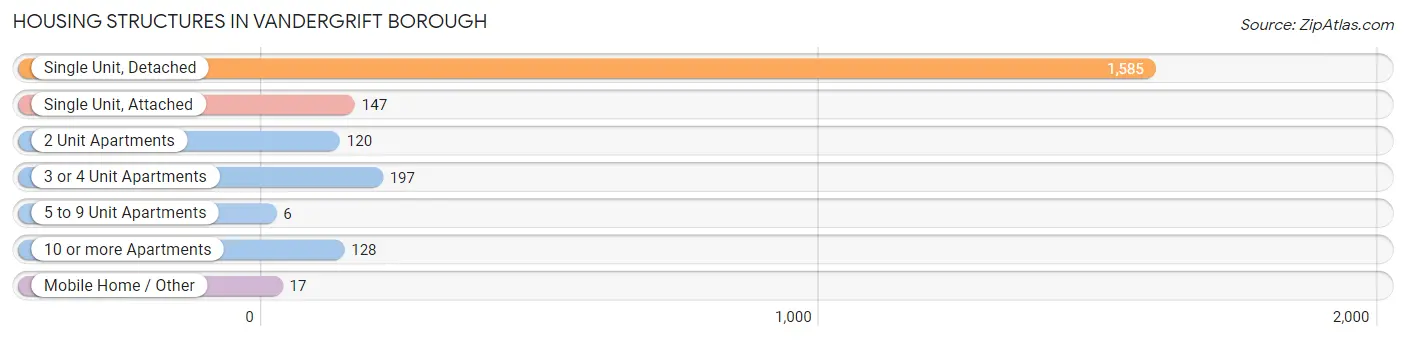
| Structure Type | # Housing Units | % Housing Units |
| Single Unit, Detached | 1,585 | 72.1% |
| Single Unit, Attached | 147 | 6.7% |
| 2 Unit Apartments | 120 | 5.4% |
| 3 or 4 Unit Apartments | 197 | 8.9% |
| 5 to 9 Unit Apartments | 6 | 0.3% |
| 10 or more Apartments | 128 | 5.8% |
| Mobile Home / Other | 17 | 0.8% |
| Total | 2,200 | 100.0% |
Housing Structures by Occupancy in Vandergrift borough
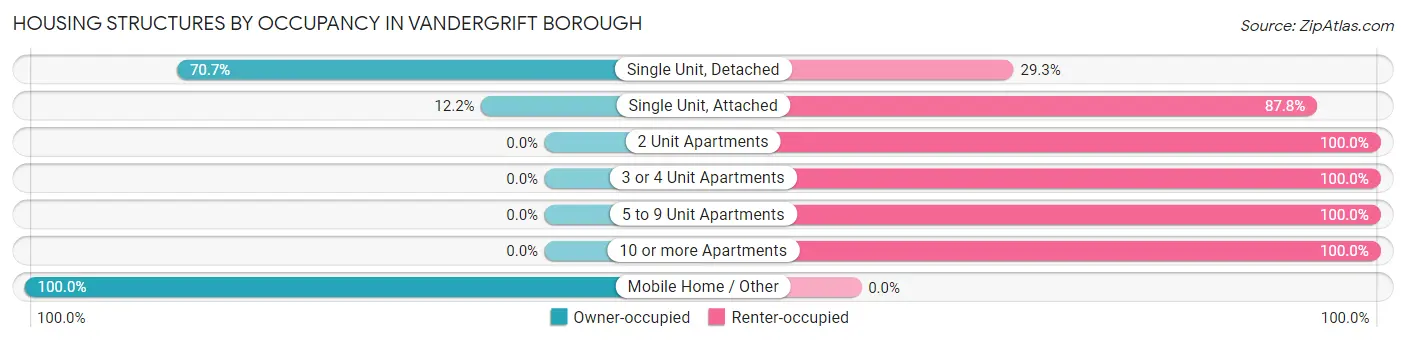
| Structure Type | Owner-occupied | Renter-occupied |
| Single Unit, Detached | 1,120 (70.7%) | 465 (29.3%) |
| Single Unit, Attached | 18 (12.2%) | 129 (87.8%) |
| 2 Unit Apartments | 0 (0.0%) | 120 (100.0%) |
| 3 or 4 Unit Apartments | 0 (0.0%) | 197 (100.0%) |
| 5 to 9 Unit Apartments | 0 (0.0%) | 6 (100.0%) |
| 10 or more Apartments | 0 (0.0%) | 128 (100.0%) |
| Mobile Home / Other | 17 (100.0%) | 0 (0.0%) |
| Total | 1,155 (52.5%) | 1,045 (47.5%) |
Housing Structures by Number of Rooms in Vandergrift borough
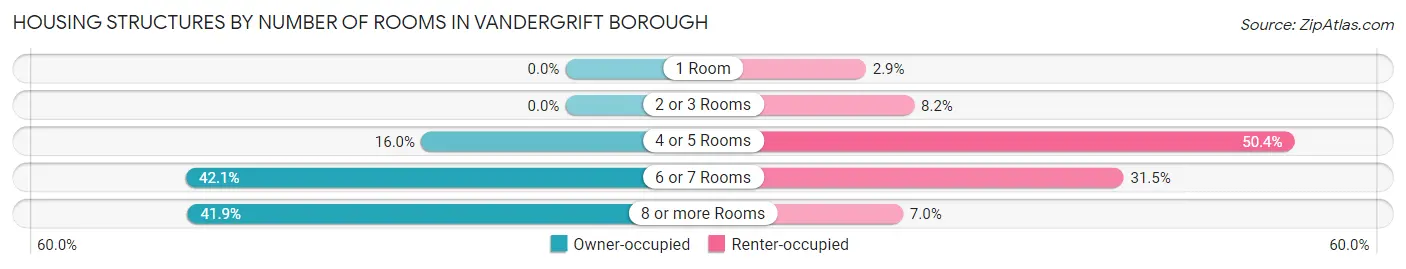
| Number of Rooms | Owner-occupied | Renter-occupied |
| 1 Room | 0 (0.0%) | 30 (2.9%) |
| 2 or 3 Rooms | 0 (0.0%) | 86 (8.2%) |
| 4 or 5 Rooms | 185 (16.0%) | 527 (50.4%) |
| 6 or 7 Rooms | 486 (42.1%) | 329 (31.5%) |
| 8 or more Rooms | 484 (41.9%) | 73 (7.0%) |
| Total | 1,155 (100.0%) | 1,045 (100.0%) |
Housing Structure by Heating Type in Vandergrift borough
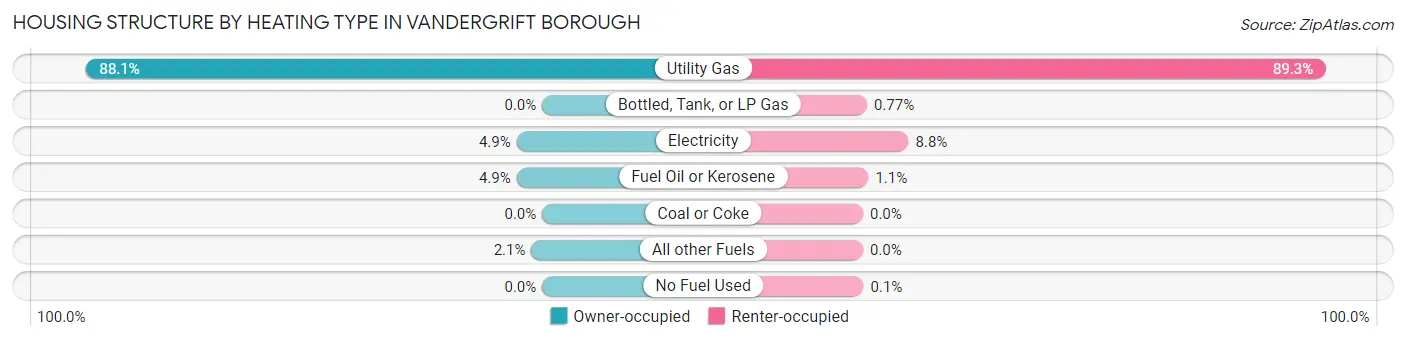
| Heating Type | Owner-occupied | Renter-occupied |
| Utility Gas | 1,017 (88.0%) | 933 (89.3%) |
| Bottled, Tank, or LP Gas | 0 (0.0%) | 8 (0.8%) |
| Electricity | 57 (4.9%) | 92 (8.8%) |
| Fuel Oil or Kerosene | 57 (4.9%) | 11 (1.1%) |
| Coal or Coke | 0 (0.0%) | 0 (0.0%) |
| All other Fuels | 24 (2.1%) | 0 (0.0%) |
| No Fuel Used | 0 (0.0%) | 1 (0.1%) |
| Total | 1,155 (100.0%) | 1,045 (100.0%) |
Household Vehicle Usage in Vandergrift borough
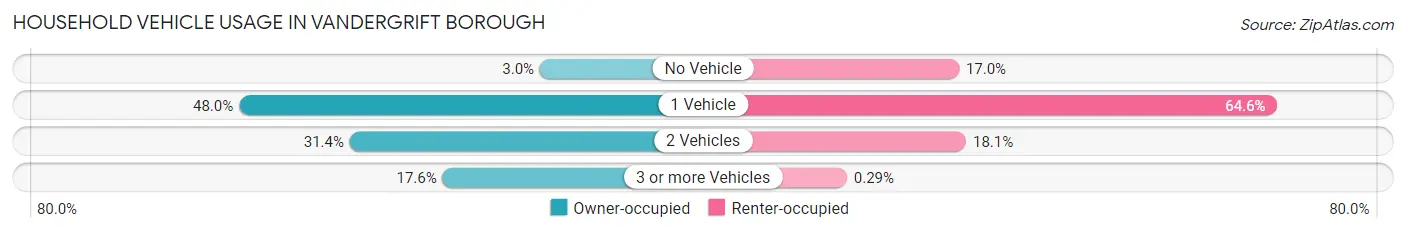
| Vehicles per Household | Owner-occupied | Renter-occupied |
| No Vehicle | 35 (3.0%) | 178 (17.0%) |
| 1 Vehicle | 554 (48.0%) | 675 (64.6%) |
| 2 Vehicles | 363 (31.4%) | 189 (18.1%) |
| 3 or more Vehicles | 203 (17.6%) | 3 (0.3%) |
| Total | 1,155 (100.0%) | 1,045 (100.0%) |
Real Estate & Mortgages in Vandergrift borough
Real Estate and Mortgage Overview in Vandergrift borough
| Characteristic | Without Mortgage | With Mortgage |
| Housing Units | 524 | 631 |
| Median Property Value | $69,500 | $91,800 |
| Median Household Income | $53,400 | $32 |
| Monthly Housing Costs | $438 | $0 |
| Real Estate Taxes | $1,207 | $14 |
Property Value by Mortgage Status in Vandergrift borough
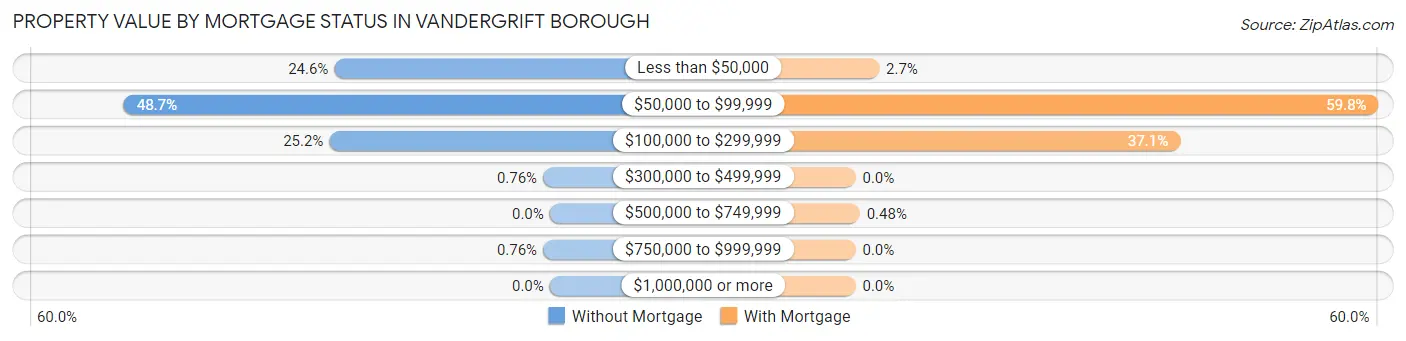
| Property Value | Without Mortgage | With Mortgage |
| Less than $50,000 | 129 (24.6%) | 17 (2.7%) |
| $50,000 to $99,999 | 255 (48.7%) | 377 (59.8%) |
| $100,000 to $299,999 | 132 (25.2%) | 234 (37.1%) |
| $300,000 to $499,999 | 4 (0.8%) | 0 (0.0%) |
| $500,000 to $749,999 | 0 (0.0%) | 3 (0.5%) |
| $750,000 to $999,999 | 4 (0.8%) | 0 (0.0%) |
| $1,000,000 or more | 0 (0.0%) | 0 (0.0%) |
| Total | 524 (100.0%) | 631 (100.0%) |
Household Income by Mortgage Status in Vandergrift borough
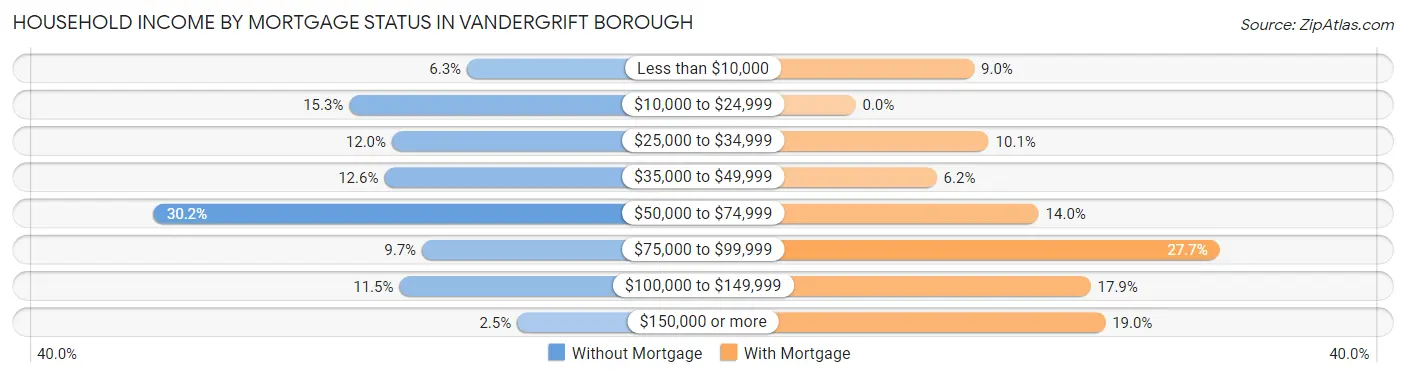
| Household Income | Without Mortgage | With Mortgage |
| Less than $10,000 | 33 (6.3%) | 57 (9.0%) |
| $10,000 to $24,999 | 80 (15.3%) | 0 (0.0%) |
| $25,000 to $34,999 | 63 (12.0%) | 64 (10.1%) |
| $35,000 to $49,999 | 66 (12.6%) | 39 (6.2%) |
| $50,000 to $74,999 | 158 (30.1%) | 88 (14.0%) |
| $75,000 to $99,999 | 51 (9.7%) | 175 (27.7%) |
| $100,000 to $149,999 | 60 (11.5%) | 113 (17.9%) |
| $150,000 or more | 13 (2.5%) | 120 (19.0%) |
| Total | 524 (100.0%) | 631 (100.0%) |
Property Value to Household Income Ratio in Vandergrift borough
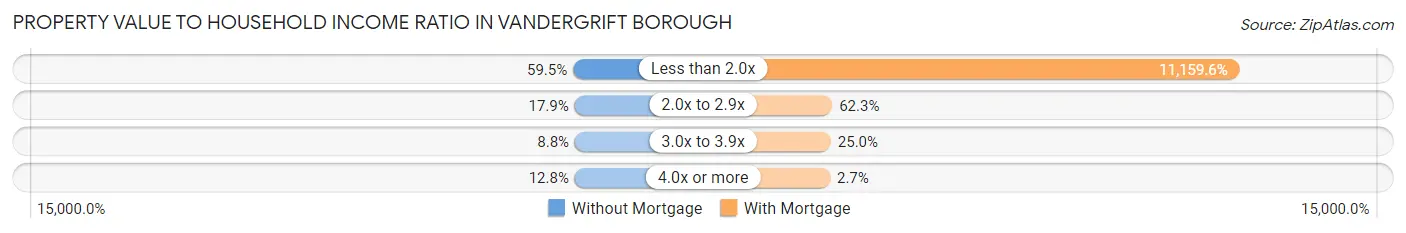
| Value-to-Income Ratio | Without Mortgage | With Mortgage |
| Less than 2.0x | 312 (59.5%) | 70,417 (11,159.6%) |
| 2.0x to 2.9x | 94 (17.9%) | 393 (62.3%) |
| 3.0x to 3.9x | 46 (8.8%) | 158 (25.0%) |
| 4.0x or more | 67 (12.8%) | 17 (2.7%) |
| Total | 524 (100.0%) | 631 (100.0%) |
Real Estate Taxes by Mortgage Status in Vandergrift borough
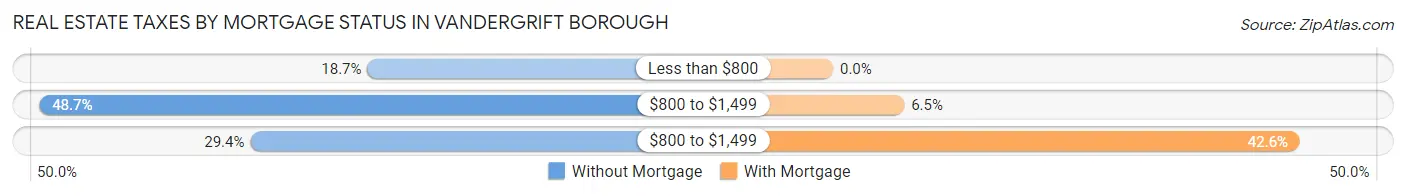
| Property Taxes | Without Mortgage | With Mortgage |
| Less than $800 | 98 (18.7%) | 0 (0.0%) |
| $800 to $1,499 | 255 (48.7%) | 41 (6.5%) |
| $800 to $1,499 | 154 (29.4%) | 269 (42.6%) |
| Total | 524 (100.0%) | 631 (100.0%) |
Health & Disability in Vandergrift borough
Health Insurance Coverage by Age in Vandergrift borough
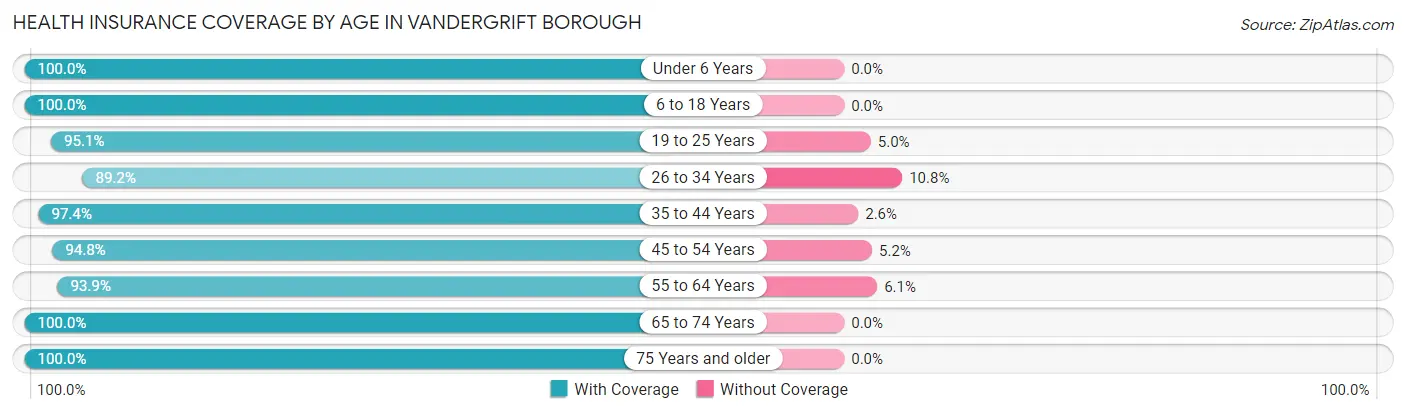
| Age Bracket | With Coverage | Without Coverage |
| Under 6 Years | 393 (100.0%) | 0 (0.0%) |
| 6 to 18 Years | 972 (100.0%) | 0 (0.0%) |
| 19 to 25 Years | 403 (95.1%) | 21 (5.0%) |
| 26 to 34 Years | 594 (89.2%) | 72 (10.8%) |
| 35 to 44 Years | 523 (97.4%) | 14 (2.6%) |
| 45 to 54 Years | 639 (94.8%) | 35 (5.2%) |
| 55 to 64 Years | 627 (93.9%) | 41 (6.1%) |
| 65 to 74 Years | 473 (100.0%) | 0 (0.0%) |
| 75 Years and older | 244 (100.0%) | 0 (0.0%) |
| Total | 4,868 (96.4%) | 183 (3.6%) |
Health Insurance Coverage by Citizenship Status in Vandergrift borough

| Citizenship Status | With Coverage | Without Coverage |
| Native Born | 393 (100.0%) | 0 (0.0%) |
| Foreign Born, Citizen | 972 (100.0%) | 0 (0.0%) |
| Foreign Born, not a Citizen | 403 (95.1%) | 21 (5.0%) |
Health Insurance Coverage by Household Income in Vandergrift borough
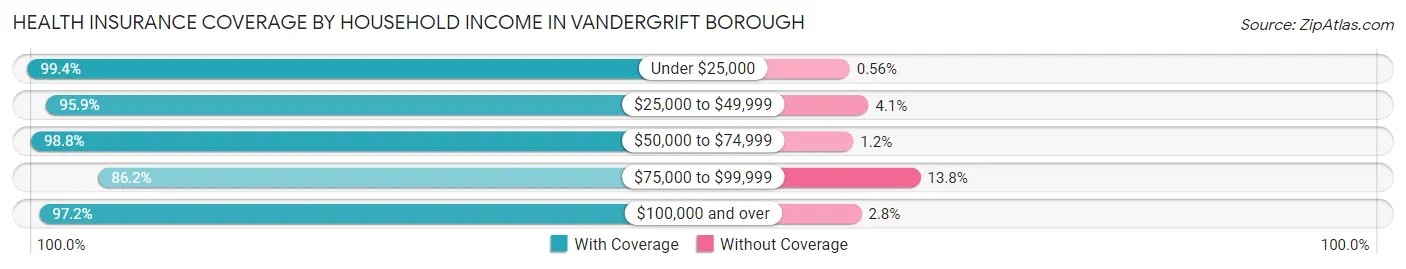
| Household Income | With Coverage | Without Coverage |
| Under $25,000 | 1,065 (99.4%) | 6 (0.6%) |
| $25,000 to $49,999 | 1,436 (95.9%) | 61 (4.1%) |
| $50,000 to $74,999 | 1,118 (98.8%) | 14 (1.2%) |
| $75,000 to $99,999 | 505 (86.2%) | 81 (13.8%) |
| $100,000 and over | 741 (97.2%) | 21 (2.8%) |
Public vs Private Health Insurance Coverage by Age in Vandergrift borough
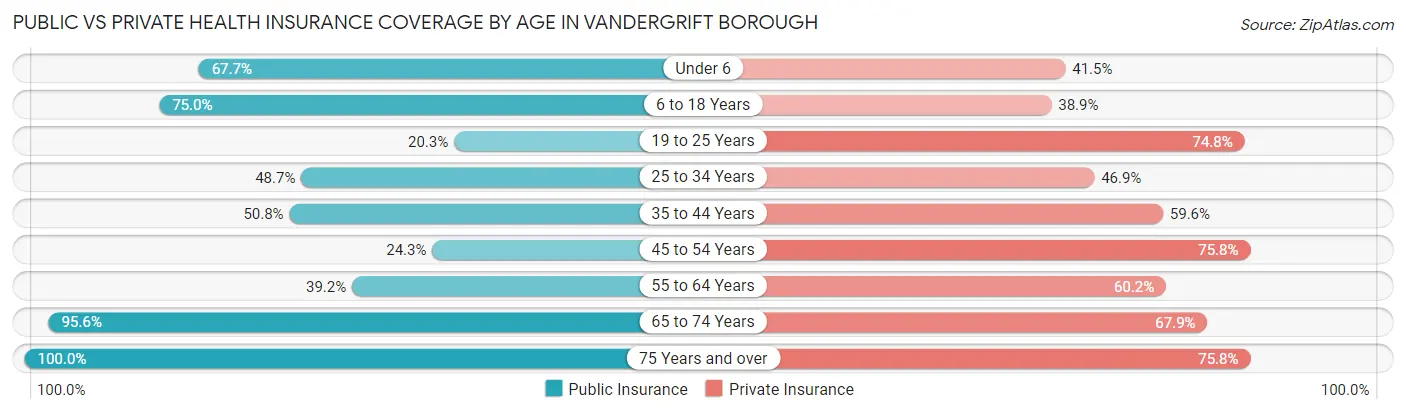
| Age Bracket | Public Insurance | Private Insurance |
| Under 6 | 266 (67.7%) | 163 (41.5%) |
| 6 to 18 Years | 729 (75.0%) | 378 (38.9%) |
| 19 to 25 Years | 86 (20.3%) | 317 (74.8%) |
| 25 to 34 Years | 324 (48.6%) | 312 (46.9%) |
| 35 to 44 Years | 273 (50.8%) | 320 (59.6%) |
| 45 to 54 Years | 164 (24.3%) | 511 (75.8%) |
| 55 to 64 Years | 262 (39.2%) | 402 (60.2%) |
| 65 to 74 Years | 452 (95.6%) | 321 (67.9%) |
| 75 Years and over | 244 (100.0%) | 185 (75.8%) |
| Total | 2,800 (55.4%) | 2,909 (57.6%) |
Disability Status by Sex by Age in Vandergrift borough
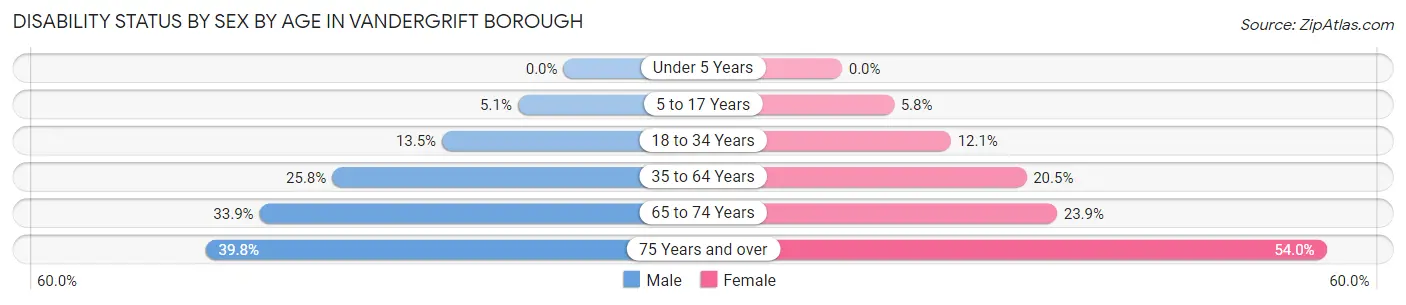
| Age Bracket | Male | Female |
| Under 5 Years | 0 (0.0%) | 0 (0.0%) |
| 5 to 17 Years | 28 (5.1%) | 27 (5.8%) |
| 18 to 34 Years | 78 (13.5%) | 66 (12.1%) |
| 35 to 64 Years | 188 (25.8%) | 236 (20.5%) |
| 65 to 74 Years | 88 (33.9%) | 51 (23.9%) |
| 75 Years and over | 47 (39.8%) | 68 (54.0%) |
Disability Class by Sex by Age in Vandergrift borough
Disability Class: Hearing Difficulty
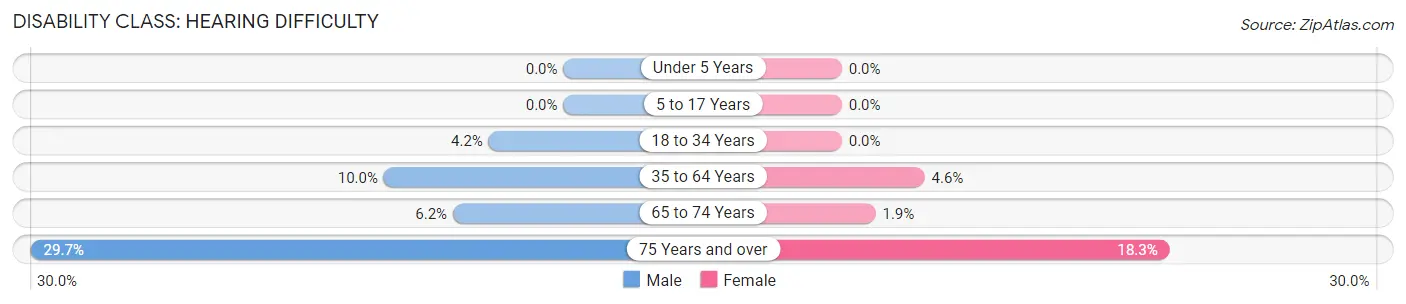
| Age Bracket | Male | Female |
| Under 5 Years | 0 (0.0%) | 0 (0.0%) |
| 5 to 17 Years | 0 (0.0%) | 0 (0.0%) |
| 18 to 34 Years | 24 (4.2%) | 0 (0.0%) |
| 35 to 64 Years | 73 (10.0%) | 53 (4.6%) |
| 65 to 74 Years | 16 (6.1%) | 4 (1.9%) |
| 75 Years and over | 35 (29.7%) | 23 (18.2%) |
Disability Class: Vision Difficulty
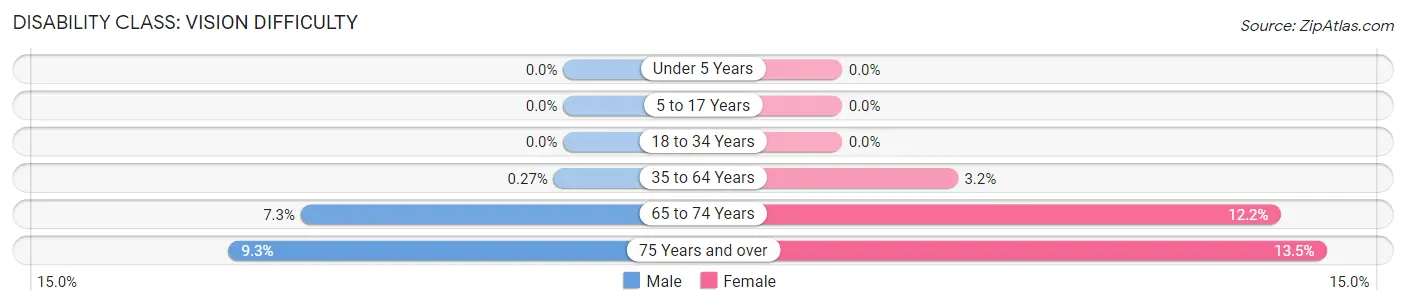
| Age Bracket | Male | Female |
| Under 5 Years | 0 (0.0%) | 0 (0.0%) |
| 5 to 17 Years | 0 (0.0%) | 0 (0.0%) |
| 18 to 34 Years | 0 (0.0%) | 0 (0.0%) |
| 35 to 64 Years | 2 (0.3%) | 37 (3.2%) |
| 65 to 74 Years | 19 (7.3%) | 26 (12.2%) |
| 75 Years and over | 11 (9.3%) | 17 (13.5%) |
Disability Class: Cognitive Difficulty
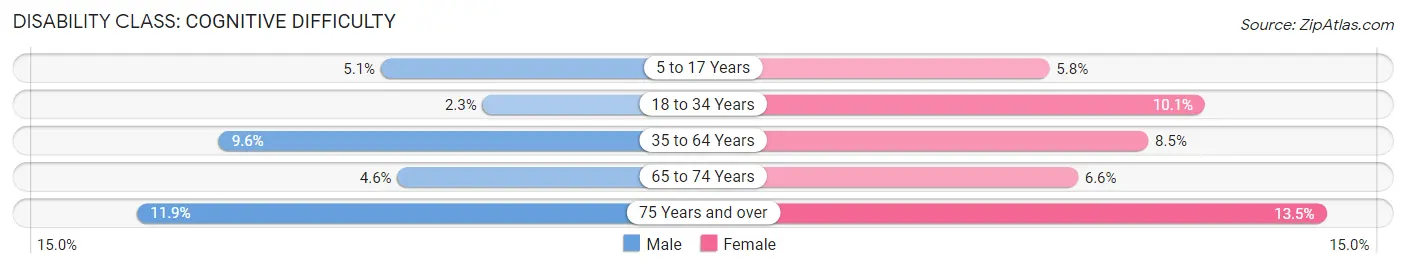
| Age Bracket | Male | Female |
| 5 to 17 Years | 28 (5.1%) | 27 (5.8%) |
| 18 to 34 Years | 13 (2.2%) | 55 (10.1%) |
| 35 to 64 Years | 70 (9.6%) | 98 (8.5%) |
| 65 to 74 Years | 12 (4.6%) | 14 (6.6%) |
| 75 Years and over | 14 (11.9%) | 17 (13.5%) |
Disability Class: Ambulatory Difficulty
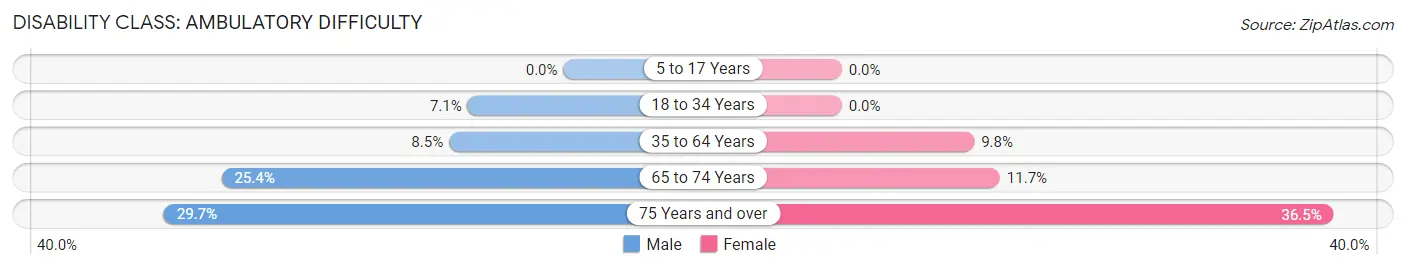
| Age Bracket | Male | Female |
| 5 to 17 Years | 0 (0.0%) | 0 (0.0%) |
| 18 to 34 Years | 41 (7.1%) | 0 (0.0%) |
| 35 to 64 Years | 62 (8.5%) | 113 (9.8%) |
| 65 to 74 Years | 66 (25.4%) | 25 (11.7%) |
| 75 Years and over | 35 (29.7%) | 46 (36.5%) |
Disability Class: Self-Care Difficulty
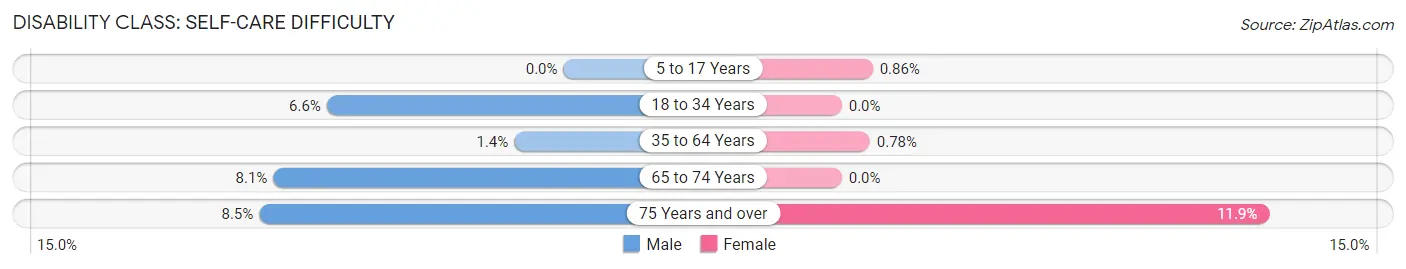
| Age Bracket | Male | Female |
| 5 to 17 Years | 0 (0.0%) | 4 (0.9%) |
| 18 to 34 Years | 38 (6.6%) | 0 (0.0%) |
| 35 to 64 Years | 10 (1.4%) | 9 (0.8%) |
| 65 to 74 Years | 21 (8.1%) | 0 (0.0%) |
| 75 Years and over | 10 (8.5%) | 15 (11.9%) |
Technology Access in Vandergrift borough
Computing Device Access in Vandergrift borough
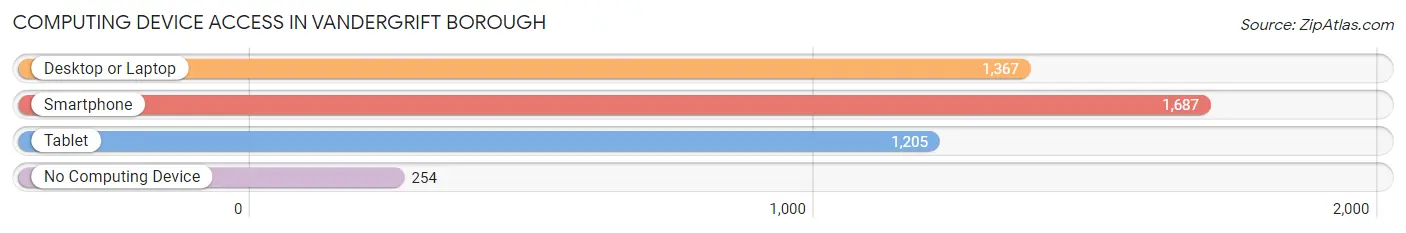
| Device Type | # Households | % Households |
| Desktop or Laptop | 1,367 | 62.1% |
| Smartphone | 1,687 | 76.7% |
| Tablet | 1,205 | 54.8% |
| No Computing Device | 254 | 11.6% |
| Total | 2,200 | 100.0% |
Internet Access in Vandergrift borough
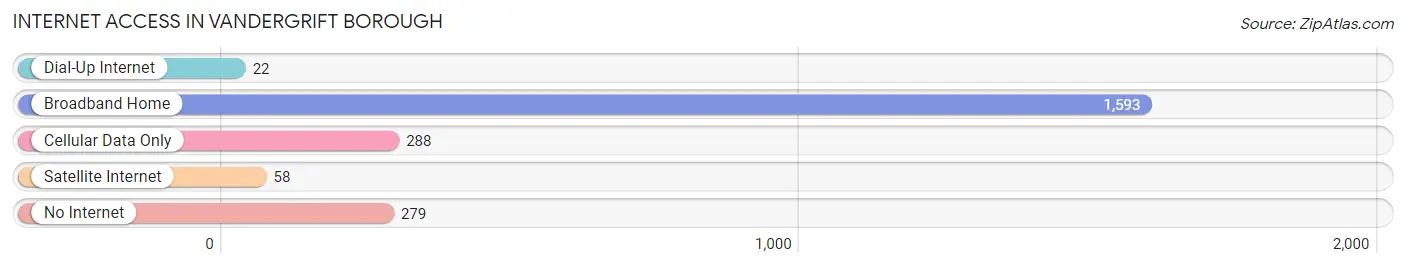
| Internet Type | # Households | % Households |
| Dial-Up Internet | 22 | 1.0% |
| Broadband Home | 1,593 | 72.4% |
| Cellular Data Only | 288 | 13.1% |
| Satellite Internet | 58 | 2.6% |
| No Internet | 279 | 12.7% |
| Total | 2,200 | 100.0% |
Vandergrift borough Summary
Vandergrift Borough is a small borough located in Westmoreland County, Pennsylvania. It is situated along the Kiskiminetas River, approximately 25 miles northeast of Pittsburgh. The borough was founded in 1895 and is named after Captain Jacob Vandergrift, a Revolutionary War veteran who settled in the area in 1790. As of the 2010 census, the population of Vandergrift was 4,719.
History
Vandergrift was founded in 1895 by the Pittsburgh Reduction Company, which was a subsidiary of the Aluminum Company of America (ALCOA). The company purchased land along the Kiskiminetas River and built a large aluminum plant. The plant was the first of its kind in the United States and was the largest aluminum plant in the world at the time. The company also built a town to house its workers, which was named Vandergrift in honor of Captain Jacob Vandergrift.
The town quickly grew and by 1900, it had a population of 1,500. The town was incorporated as a borough in 1901. The borough was designed to be a model industrial town, with wide streets, parks, and a library. The town also had its own police and fire departments.
In the early 20th century, Vandergrift was a thriving industrial town. The aluminum plant was the largest employer in the area and provided jobs for thousands of people. The town also had several other industries, including a steel mill, a glass factory, and a brickyard.
The town continued to grow and by the 1950s, the population had reached 10,000. However, the aluminum plant closed in the late 1950s and the town’s economy began to decline. The population dropped to 4,719 by the 2010 census.
Geography
Vandergrift is located in Westmoreland County, Pennsylvania. It is situated along the Kiskiminetas River, approximately 25 miles northeast of Pittsburgh. The borough has a total area of 1.2 square miles, all of which is land.
The borough is located in the Allegheny Plateau region of Pennsylvania. The terrain is mostly flat with some rolling hills. The climate is humid continental, with cold winters and hot, humid summers.
Economy
Vandergrift’s economy is largely based on manufacturing. The borough is home to several factories, including a steel mill, a glass factory, and a brickyard. The borough also has several retail stores and restaurants.
The borough’s largest employer is the Allegheny Valley School District, which employs over 1,000 people. Other major employers include the Vandergrift Borough Police Department, the Vandergrift Fire Department, and the Vandergrift Public Library.
Demographics
As of the 2010 census, the population of Vandergrift was 4,719. The racial makeup of the borough was 97.2% White, 0.7% African American, 0.2% Native American, 0.4% Asian, 0.1% Pacific Islander, 0.4% from other races, and 1.0% from two or more races. Hispanic or Latino of any race were 1.2% of the population.
The median household income in Vandergrift was $37,917, and the median family income was $45,938. The per capita income was $19,945. About 11.2% of families and 13.2% of the population were below the poverty line, including 18.2% of those under age 18 and 8.2% of those age 65 or over.
Common Questions
What is the Total Population of Vandergrift borough?
Total Population of Vandergrift borough is 5,051.
What is the Total Male Population of Vandergrift borough?
Total Male Population of Vandergrift borough is 2,365.
What is the Total Female Population of Vandergrift borough?
Total Female Population of Vandergrift borough is 2,686.
What is the Ratio of Males per 100 Females in Vandergrift borough?
There are 88.05 Males per 100 Females in Vandergrift borough.
What is the Ratio of Females per 100 Males in Vandergrift borough?
There are 113.57 Females per 100 Males in Vandergrift borough.
What is the Median Population Age in Vandergrift borough?
Median Population Age in Vandergrift borough is 35.7 Years.
What is the Average Family Size in Vandergrift borough
Average Family Size in Vandergrift borough is 2.9 People.
What is the Average Household Size in Vandergrift borough
Average Household Size in Vandergrift borough is 2.3 People.
What is Per Capita Income in Vandergrift borough?
Per Capita income in Vandergrift borough is $23,564.
What is the Median Family Income in Vandergrift borough?
Median Family Income in Vandergrift borough is $48,948.
What is the Median Household income in Vandergrift borough?
Median Household Income in Vandergrift borough is $47,530.
What is Income or Wage Gap in Vandergrift borough?
Income or Wage Gap in Vandergrift borough is 17.8%.
Women in Vandergrift borough earn 82.2 cents for every dollar earned by a man.
What is Inequality or Gini Index in Vandergrift borough?
Inequality or Gini Index in Vandergrift borough is 0.38.
How Large is the Labor Force in Vandergrift borough?
There are 2,519 People in the Labor Forcein in Vandergrift borough.
What is the Percentage of People in the Labor Force in Vandergrift borough?
64.7% of People are in the Labor Force in Vandergrift borough.
What is the Unemployment Rate in Vandergrift borough?
Unemployment Rate in Vandergrift borough is 10.2%.