Sugar Grove borough, PA
Sugar Grove borough Overview
581
TOTAL POPULATION
310
MALE POPULATION
271
FEMALE POPULATION
114.39
MALES / 100 FEMALES
87.42
FEMALES / 100 MALES
42.2
MEDIAN AGE
3.3
AVG FAMILY SIZE
2.7
AVG HOUSEHOLD SIZE
$32,825
PER CAPITA INCOME
$81,667
AVG FAMILY INCOME
$68,056
AVG HOUSEHOLD INCOME
43.6%
WAGE / INCOME GAP [ % ]
56.4¢/ $1
WAGE / INCOME GAP [ $ ]
$5,986
FAMILY INCOME DEFICIT
0.41
INEQUALITY / GINI INDEX
263
LABOR FORCE [ PEOPLE ]
57.3%
PERCENT IN LABOR FORCE
0.4%
UNEMPLOYMENT RATE
Race in Sugar Grove borough
The most populous races in Sugar Grove borough are White / Caucasian (494 | 85.0%), Two or more Races (79 | 13.6%), and Hispanic or Latino (35 | 6.0%).
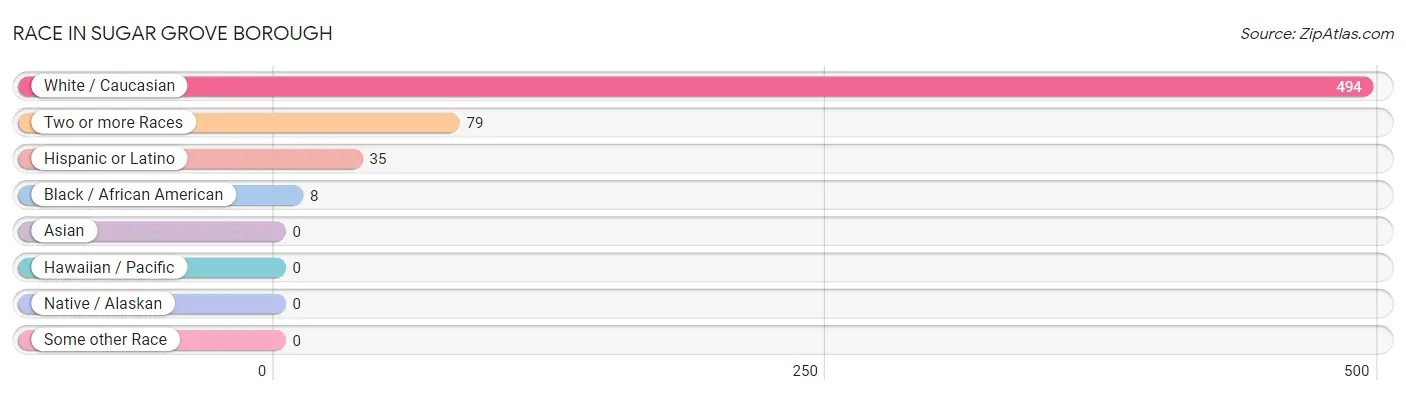
| Race | # Population | % Population |
| Asian | 0 | 0.0% |
| Black / African American | 8 | 1.4% |
| Hawaiian / Pacific | 0 | 0.0% |
| Hispanic or Latino | 35 | 6.0% |
| Native / Alaskan | 0 | 0.0% |
| White / Caucasian | 494 | 85.0% |
| Two or more Races | 79 | 13.6% |
| Some other Race | 0 | 0.0% |
| Total | 581 | 100.0% |
Ancestry in Sugar Grove borough
The most populous ancestries reported in Sugar Grove borough are German (81 | 13.9%), English (72 | 12.4%), Swedish (70 | 12.0%), Irish (47 | 8.1%), and Italian (31 | 5.3%), together accounting for 51.8% of all Sugar Grove borough residents.
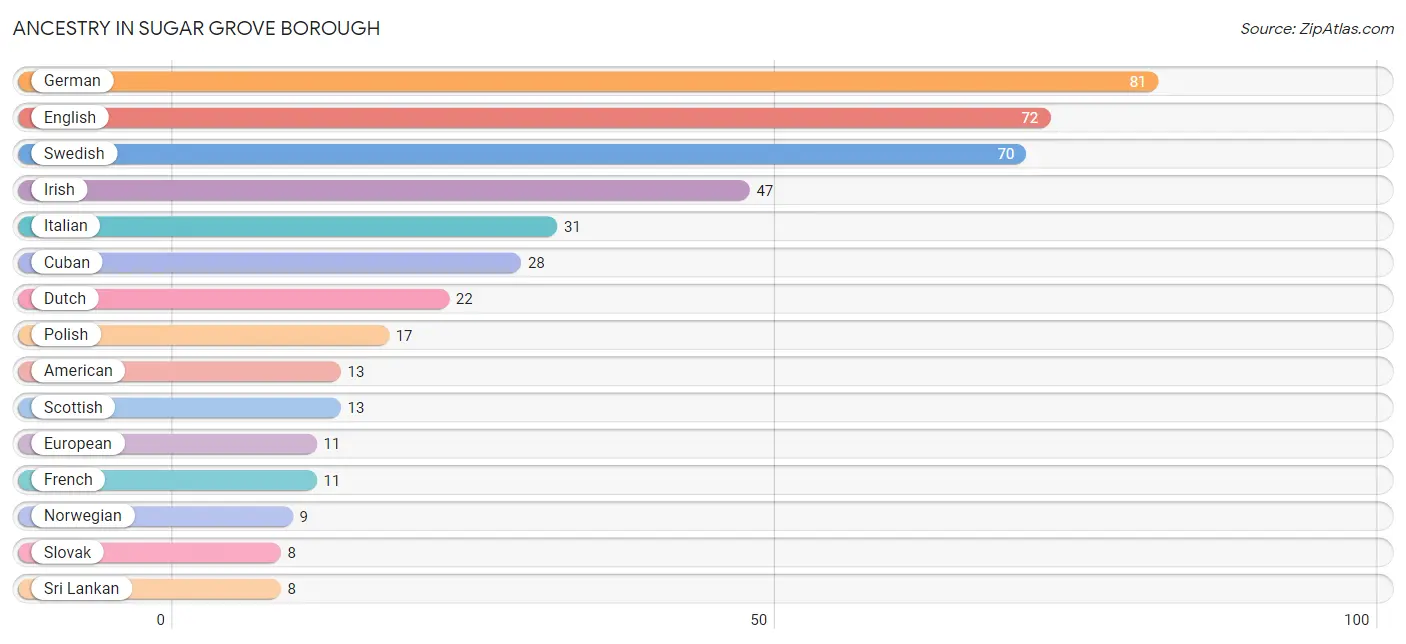
| Ancestry | # Population | % Population |
| American | 13 | 2.2% |
| British | 5 | 0.9% |
| Cuban | 28 | 4.8% |
| Danish | 6 | 1.0% |
| Dutch | 22 | 3.8% |
| English | 72 | 12.4% |
| European | 11 | 1.9% |
| Finnish | 3 | 0.5% |
| French | 11 | 1.9% |
| French Canadian | 3 | 0.5% |
| German | 81 | 13.9% |
| Greek | 4 | 0.7% |
| Hungarian | 2 | 0.3% |
| Irish | 47 | 8.1% |
| Iroquois | 2 | 0.3% |
| Italian | 31 | 5.3% |
| Norwegian | 9 | 1.5% |
| Pennsylvania German | 6 | 1.0% |
| Polish | 17 | 2.9% |
| Puerto Rican | 7 | 1.2% |
| Scotch-Irish | 4 | 0.7% |
| Scottish | 13 | 2.2% |
| Slovak | 8 | 1.4% |
| Slovene | 3 | 0.5% |
| Sri Lankan | 8 | 1.4% |
| Swedish | 70 | 12.0% | View All 26 Rows |
Immigrants in Sugar Grove borough
The most numerous immigrant groups reported in Sugar Grove borough came from Europe (7 | 1.2%), and Northern Europe (7 | 1.2%), together accounting for 2.4% of all Sugar Grove borough residents.
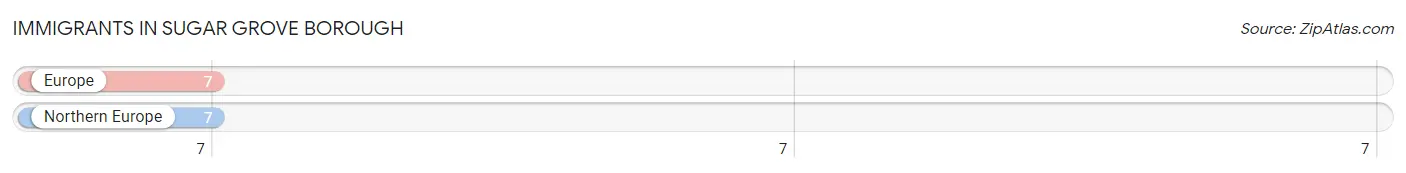
| Immigration Origin | # Population | % Population |
| Europe | 7 | 1.2% |
| Northern Europe | 7 | 1.2% | View All 2 Rows |
Sex and Age in Sugar Grove borough
Sex and Age in Sugar Grove borough
The most populous age groups in Sugar Grove borough are Under 5 Years (52 | 16.8%) for men and 30 to 34 Years (39 | 14.4%) for women.
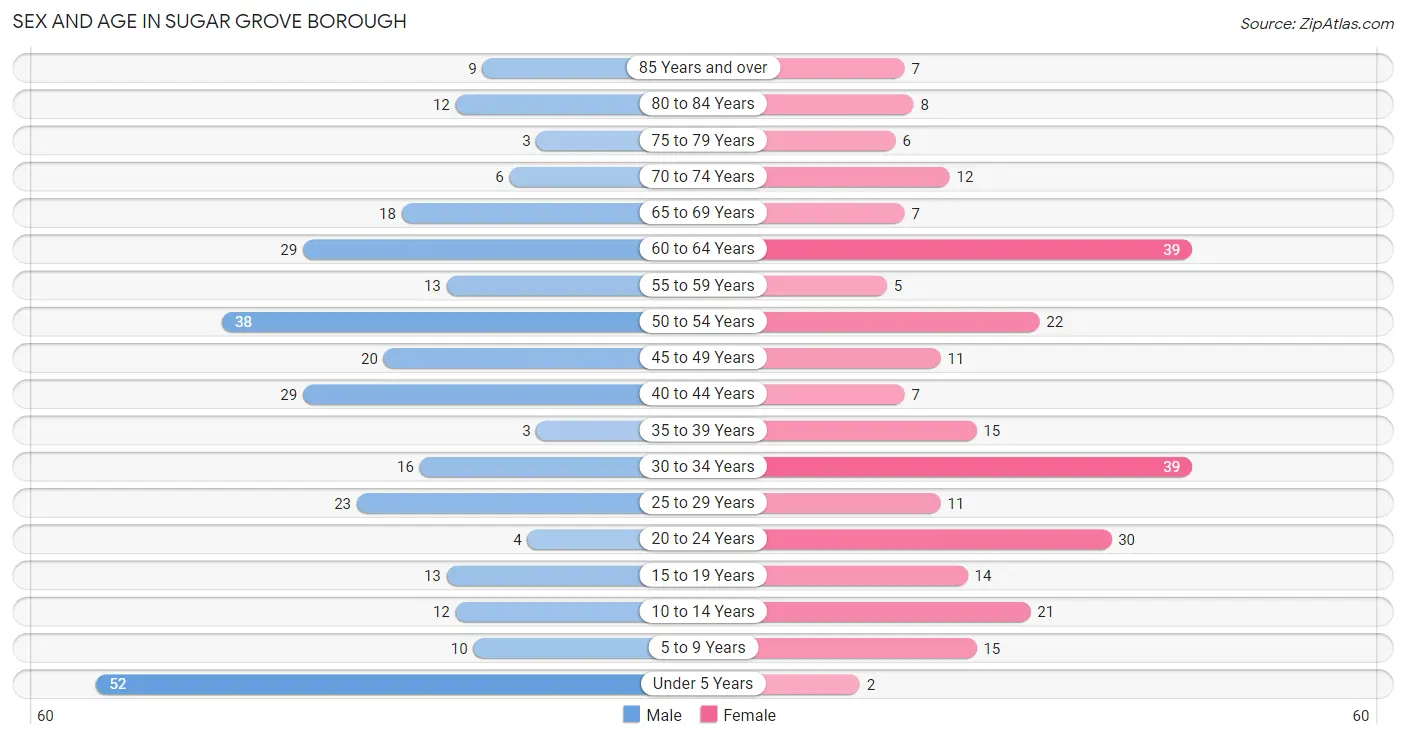
| Age Bracket | Male | Female |
| Under 5 Years | 52 (16.8%) | 2 (0.7%) |
| 5 to 9 Years | 10 (3.2%) | 15 (5.5%) |
| 10 to 14 Years | 12 (3.9%) | 21 (7.7%) |
| 15 to 19 Years | 13 (4.2%) | 14 (5.2%) |
| 20 to 24 Years | 4 (1.3%) | 30 (11.1%) |
| 25 to 29 Years | 23 (7.4%) | 11 (4.1%) |
| 30 to 34 Years | 16 (5.2%) | 39 (14.4%) |
| 35 to 39 Years | 3 (1.0%) | 15 (5.5%) |
| 40 to 44 Years | 29 (9.3%) | 7 (2.6%) |
| 45 to 49 Years | 20 (6.5%) | 11 (4.1%) |
| 50 to 54 Years | 38 (12.3%) | 22 (8.1%) |
| 55 to 59 Years | 13 (4.2%) | 5 (1.8%) |
| 60 to 64 Years | 29 (9.3%) | 39 (14.4%) |
| 65 to 69 Years | 18 (5.8%) | 7 (2.6%) |
| 70 to 74 Years | 6 (1.9%) | 12 (4.4%) |
| 75 to 79 Years | 3 (1.0%) | 6 (2.2%) |
| 80 to 84 Years | 12 (3.9%) | 8 (2.9%) |
| 85 Years and over | 9 (2.9%) | 7 (2.6%) |
| Total | 310 (100.0%) | 271 (100.0%) |
Families and Households in Sugar Grove borough
Median Family Size in Sugar Grove borough
The median family size in Sugar Grove borough is 3.30 persons per family, with married-couple families (129 | 89.6%) accounting for the largest median family size of 3.41 persons per family. On the other hand, single male/father families (9 | 6.2%) represent the smallest median family size with 2.11 persons per family.
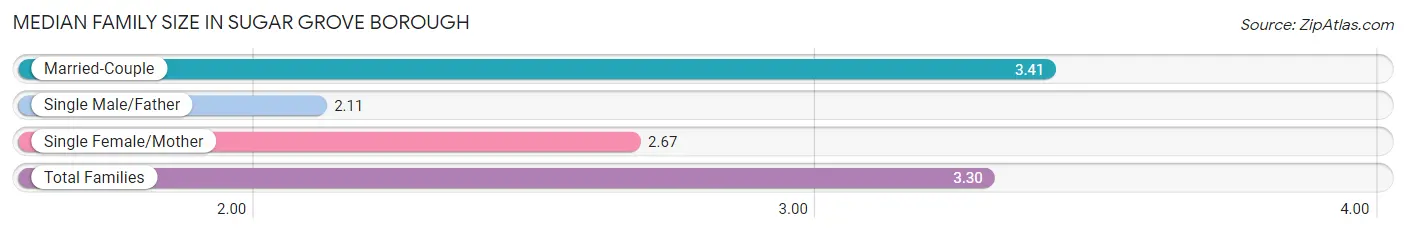
| Family Type | # Families | Family Size |
| Married-Couple | 129 (89.6%) | 3.41 |
| Single Male/Father | 9 (6.2%) | 2.11 |
| Single Female/Mother | 6 (4.2%) | 2.67 |
| Total Families | 144 (100.0%) | 3.30 |
Median Household Size in Sugar Grove borough
The median household size in Sugar Grove borough is 2.74 persons per household, with married-couple households (129 | 60.9%) accounting for the largest median household size of 3.61 persons per household. non-family households (68 | 32.1%) represent the smallest median household size with 1.16 persons per household.
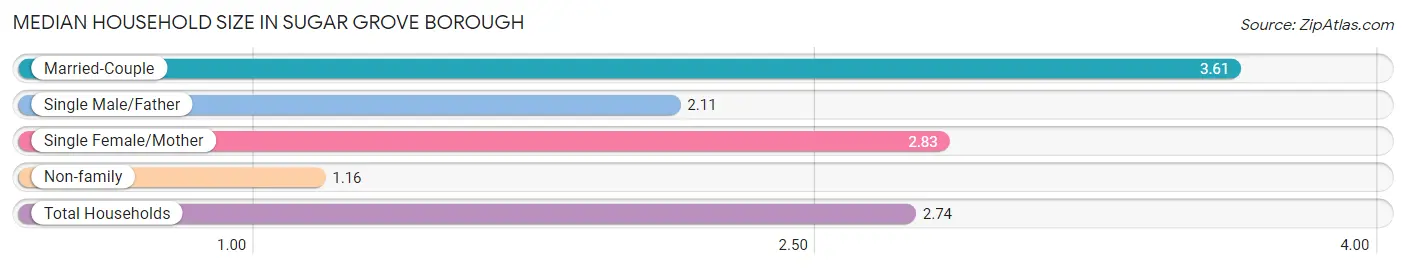
| Household Type | # Households | Household Size |
| Married-Couple | 129 (60.9%) | 3.61 |
| Single Male/Father | 9 (4.3%) | 2.11 |
| Single Female/Mother | 6 (2.8%) | 2.83 |
| Non-family | 68 (32.1%) | 1.16 |
| Total Households | 212 (100.0%) | 2.74 |
Household Size by Marriage Status in Sugar Grove borough
Out of a total of 212 households in Sugar Grove borough, 144 (67.9%) are family households, while 68 (32.1%) are nonfamily households. The most numerous type of family households are 2-person households, comprising 67, and the most common type of nonfamily households are 1-person households, comprising 61.
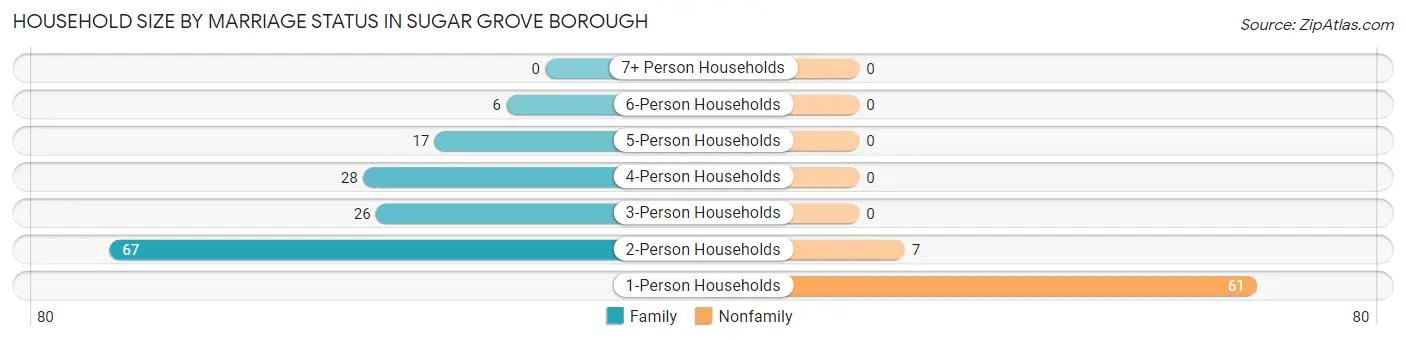
| Household Size | Family Households | Nonfamily Households |
| 1-Person Households | - | 61 (28.8%) |
| 2-Person Households | 67 (31.6%) | 7 (3.3%) |
| 3-Person Households | 26 (12.3%) | 0 (0.0%) |
| 4-Person Households | 28 (13.2%) | 0 (0.0%) |
| 5-Person Households | 17 (8.0%) | 0 (0.0%) |
| 6-Person Households | 6 (2.8%) | 0 (0.0%) |
| 7+ Person Households | 0 (0.0%) | 0 (0.0%) |
| Total | 144 (67.9%) | 68 (32.1%) |
Female Fertility in Sugar Grove borough
Fertility by Age in Sugar Grove borough
Average fertility rate in Sugar Grove borough is 47.0 births per 1,000 women. Women in the age bracket of 35 to 50 years have the highest fertility rate with 57.0 births per 1,000 women. Women in the age bracket of 20 to 34 years acount for 66.7% of all women with births.
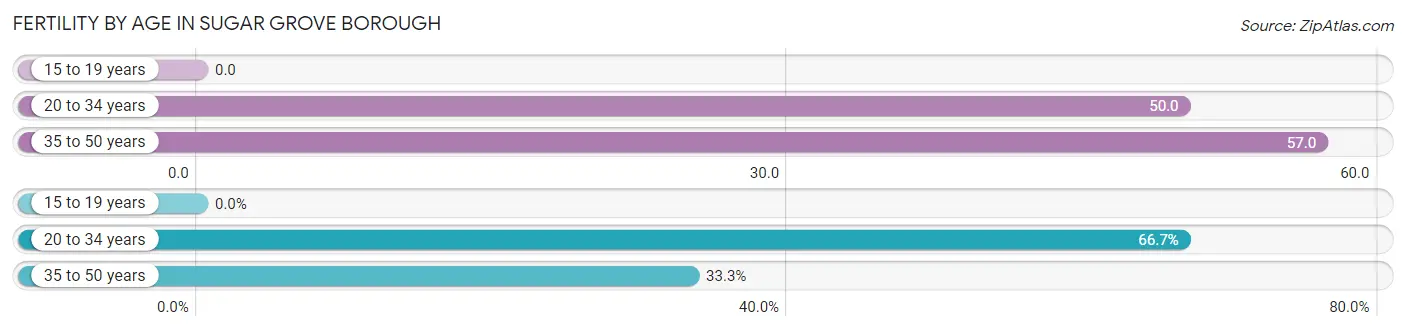
| Age Bracket | Women with Births | Births / 1,000 Women |
| 15 to 19 years | 0 (0.0%) | 0.0 |
| 20 to 34 years | 4 (66.7%) | 50.0 |
| 35 to 50 years | 2 (33.3%) | 57.0 |
| Total | 6 (100.0%) | 47.0 |
Fertility by Age by Marriage Status in Sugar Grove borough
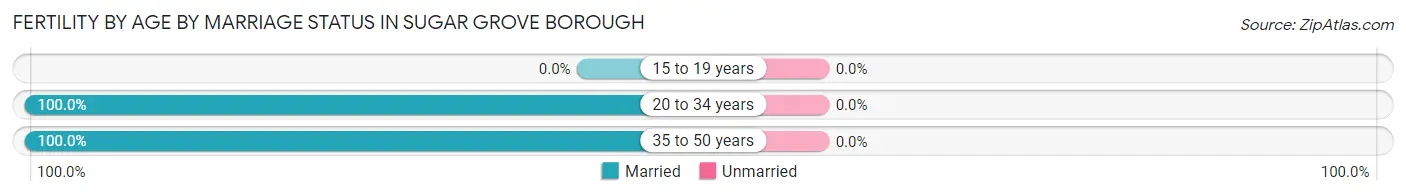
| Age Bracket | Married | Unmarried |
| 15 to 19 years | 0 (0.0%) | 0 (0.0%) |
| 20 to 34 years | 4 (100.0%) | 0 (0.0%) |
| 35 to 50 years | 2 (100.0%) | 0 (0.0%) |
| Total | 6 (100.0%) | 0 (0.0%) |
Fertility by Education in Sugar Grove borough
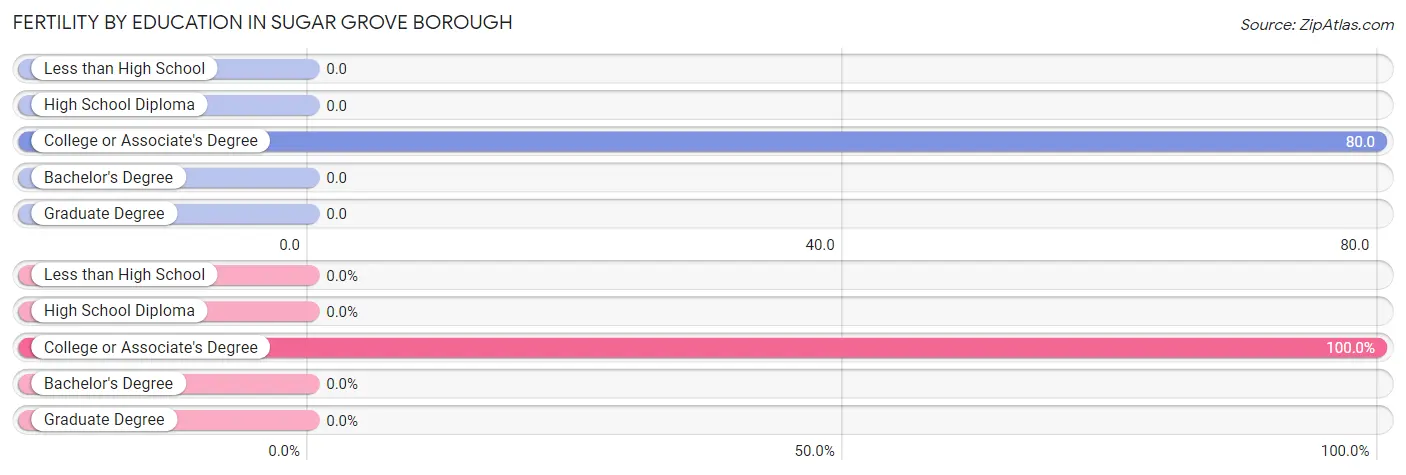
| Educational Attainment | Women with Births | Births / 1,000 Women |
| Less than High School | 0 (0.0%) | 0.0 |
| High School Diploma | 0 (0.0%) | 0.0 |
| College or Associate's Degree | 6 (100.0%) | 80.0 |
| Bachelor's Degree | 0 (0.0%) | 0.0 |
| Graduate Degree | 0 (0.0%) | 0.0 |
| Total | 6 (100.0%) | 47.0 |
Fertility by Education by Marriage Status in Sugar Grove borough
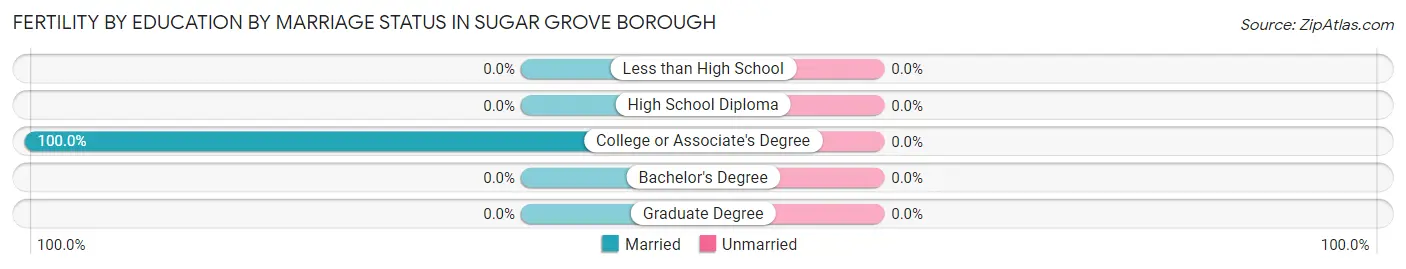
| Educational Attainment | Married | Unmarried |
| Less than High School | 0 (0.0%) | 0 (0.0%) |
| High School Diploma | 0 (0.0%) | 0 (0.0%) |
| College or Associate's Degree | 6 (100.0%) | 0 (0.0%) |
| Bachelor's Degree | 0 (0.0%) | 0 (0.0%) |
| Graduate Degree | 0 (0.0%) | 0 (0.0%) |
| Total | 6 (100.0%) | 0 (0.0%) |
Income in Sugar Grove borough
Income Overview in Sugar Grove borough
Per Capita Income in Sugar Grove borough is $32,825, while median incomes of families and households are $81,667 and $68,056 respectively.
| Characteristic | Number | Measure |
| Per Capita Income | 581 | $32,825 |
| Median Family Income | 144 | $81,667 |
| Mean Family Income | 144 | $100,738 |
| Median Household Income | 212 | $68,056 |
| Mean Household Income | 212 | $82,770 |
| Income Deficit | 144 | $5,986 |
| Wage / Income Gap (%) | 581 | 43.64% |
| Wage / Income Gap ($) | 581 | 56.36¢ per $1 |
| Gini / Inequality Index | 581 | 0.41 |
Earnings by Sex in Sugar Grove borough
Average Earnings in Sugar Grove borough are $41,622, $45,833 for men and $25,833 for women, a difference of 43.6%.
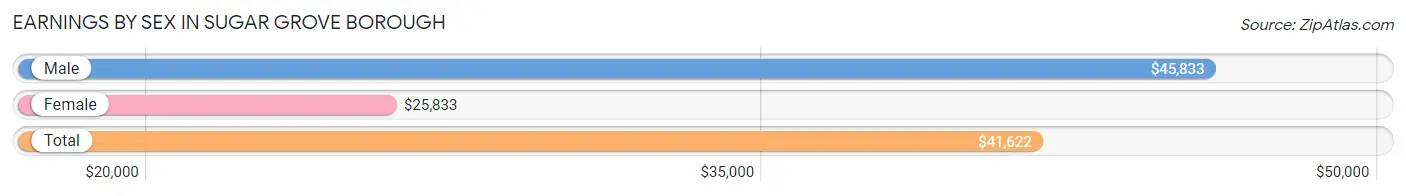
| Sex | Number | Average Earnings |
| Male | 180 (58.8%) | $45,833 |
| Female | 126 (41.2%) | $25,833 |
| Total | 306 (100.0%) | $41,622 |
Earnings by Sex by Income Bracket in Sugar Grove borough
The most common earnings brackets in Sugar Grove borough are $40,000 to $44,999 for men (27 | 15.0%) and $10,000 to $12,499 for women (24 | 19.1%).
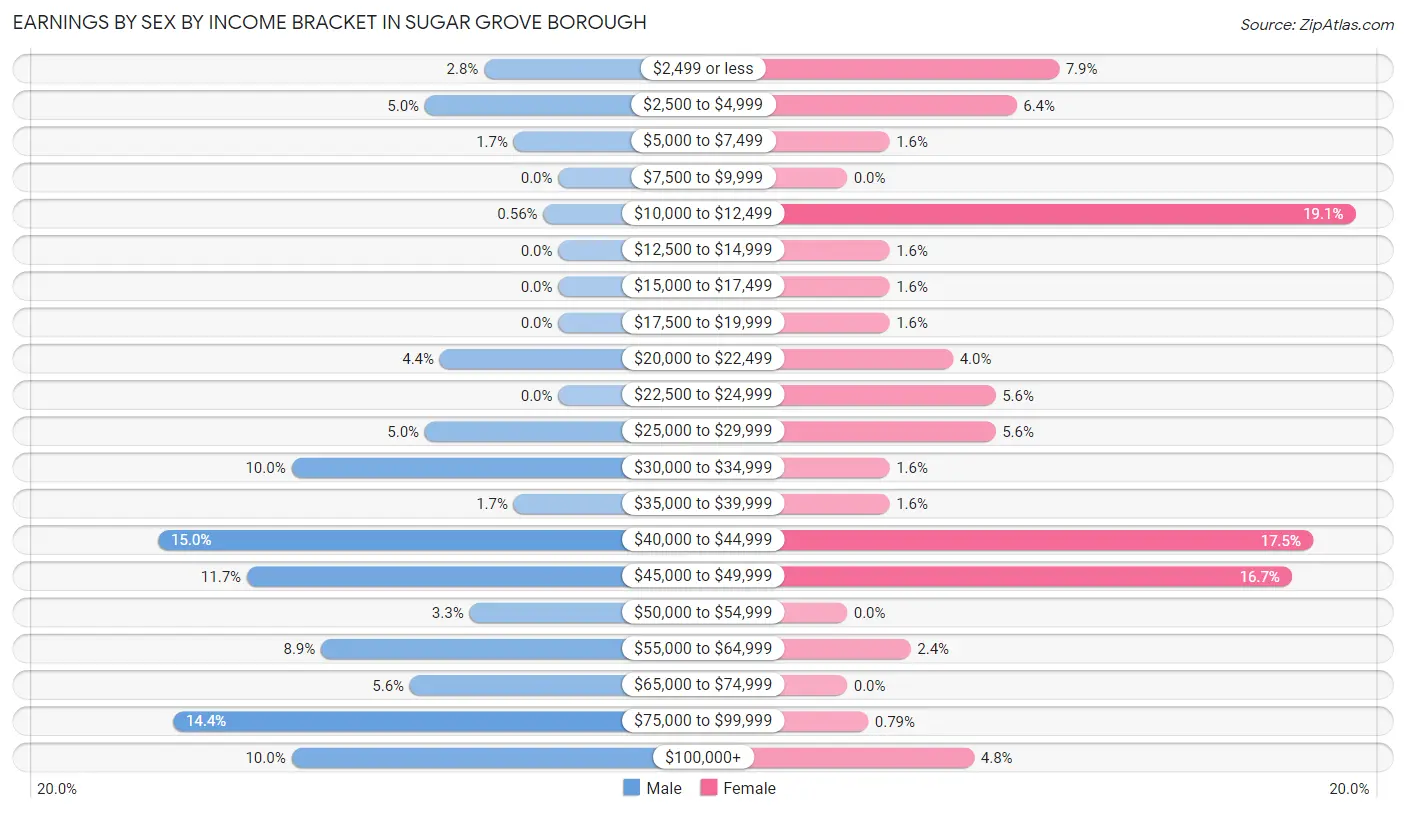
| Income | Male | Female |
| $2,499 or less | 5 (2.8%) | 10 (7.9%) |
| $2,500 to $4,999 | 9 (5.0%) | 8 (6.4%) |
| $5,000 to $7,499 | 3 (1.7%) | 2 (1.6%) |
| $7,500 to $9,999 | 0 (0.0%) | 0 (0.0%) |
| $10,000 to $12,499 | 1 (0.6%) | 24 (19.1%) |
| $12,500 to $14,999 | 0 (0.0%) | 2 (1.6%) |
| $15,000 to $17,499 | 0 (0.0%) | 2 (1.6%) |
| $17,500 to $19,999 | 0 (0.0%) | 2 (1.6%) |
| $20,000 to $22,499 | 8 (4.4%) | 5 (4.0%) |
| $22,500 to $24,999 | 0 (0.0%) | 7 (5.6%) |
| $25,000 to $29,999 | 9 (5.0%) | 7 (5.6%) |
| $30,000 to $34,999 | 18 (10.0%) | 2 (1.6%) |
| $35,000 to $39,999 | 3 (1.7%) | 2 (1.6%) |
| $40,000 to $44,999 | 27 (15.0%) | 22 (17.5%) |
| $45,000 to $49,999 | 21 (11.7%) | 21 (16.7%) |
| $50,000 to $54,999 | 6 (3.3%) | 0 (0.0%) |
| $55,000 to $64,999 | 16 (8.9%) | 3 (2.4%) |
| $65,000 to $74,999 | 10 (5.6%) | 0 (0.0%) |
| $75,000 to $99,999 | 26 (14.4%) | 1 (0.8%) |
| $100,000+ | 18 (10.0%) | 6 (4.8%) |
| Total | 180 (100.0%) | 126 (100.0%) |
Earnings by Sex by Educational Attainment in Sugar Grove borough
Average earnings in Sugar Grove borough are $45,893 for men and $40,625 for women, a difference of 11.5%. Men with an educational attainment of bachelor's degree enjoy the highest average annual earnings of $69,792, while those with high school diploma education earn the least with $42,037. Women with an educational attainment of graduate degree earn the most with the average annual earnings of $104,375, while those with college or associate's degree education have the smallest earnings of $26,250.
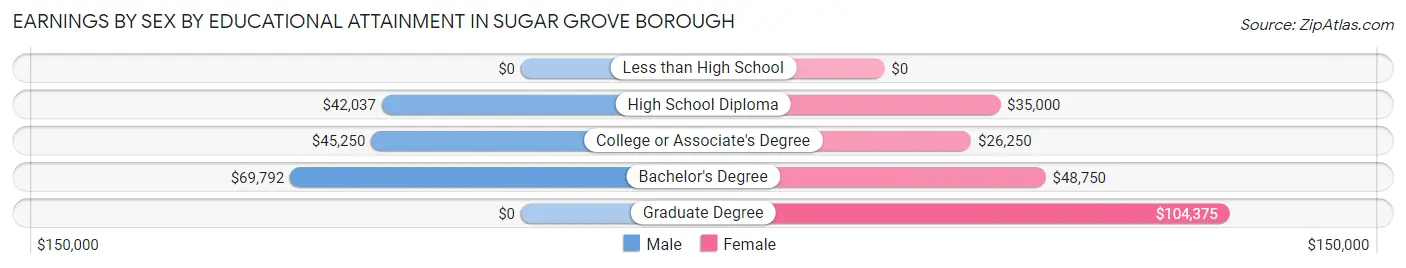
| Educational Attainment | Male Income | Female Income |
| Less than High School | - | - |
| High School Diploma | $42,037 | $35,000 |
| College or Associate's Degree | $45,250 | $26,250 |
| Bachelor's Degree | $69,792 | $48,750 |
| Graduate Degree | - | - |
| Total | $45,893 | $40,625 |
Family Income in Sugar Grove borough
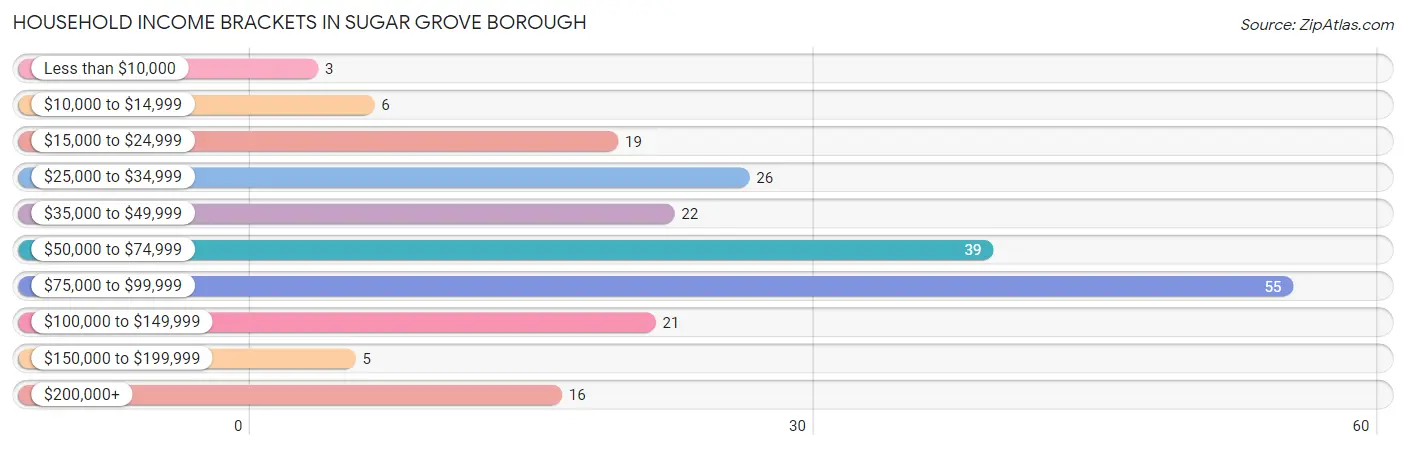
Family Income Brackets in Sugar Grove borough
According to the Sugar Grove borough family income data, there are 44 families falling into the $75,000 to $99,999 income range, which is the most common income bracket and makes up 30.6% of all families.
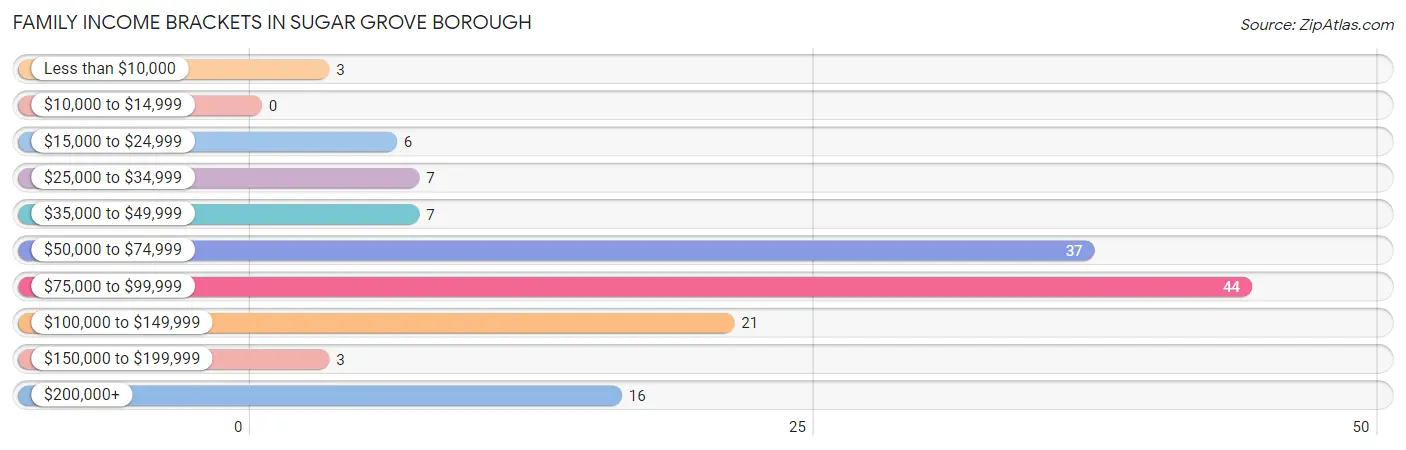
| Income Bracket | # Families | % Families |
| Less than $10,000 | 3 | 2.1% |
| $10,000 to $14,999 | 0 | 0.0% |
| $15,000 to $24,999 | 6 | 4.2% |
| $25,000 to $34,999 | 7 | 4.9% |
| $35,000 to $49,999 | 7 | 4.9% |
| $50,000 to $74,999 | 37 | 25.7% |
| $75,000 to $99,999 | 44 | 30.6% |
| $100,000 to $149,999 | 21 | 14.6% |
| $150,000 to $199,999 | 3 | 2.1% |
| $200,000+ | 16 | 11.1% |
Family Income by Famaliy Size in Sugar Grove borough
4-person families (16 | 11.1%) account for the highest median family income in Sugar Grove borough with $227,500 per family, while 4-person families (16 | 11.1%) have the highest median income of $56,875 per family member.
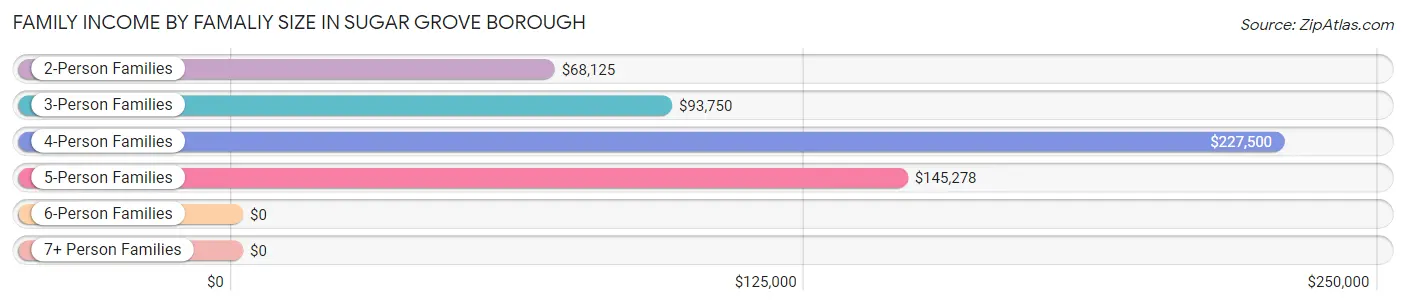
| Income Bracket | # Families | Median Income |
| 2-Person Families | 77 (53.5%) | $68,125 |
| 3-Person Families | 29 (20.1%) | $93,750 |
| 4-Person Families | 16 (11.1%) | $227,500 |
| 5-Person Families | 16 (11.1%) | $145,278 |
| 6-Person Families | 6 (4.2%) | $0 |
| 7+ Person Families | 0 (0.0%) | $0 |
| Total | 144 (100.0%) | $81,667 |
Family Income by Number of Earners in Sugar Grove borough
The median family income in Sugar Grove borough is $81,667, with families comprising 3+ earners (22) having the highest median family income of $97,500, while families with no earners (40) have the lowest median family income of $59,375, accounting for 15.3% and 27.8% of families, respectively.
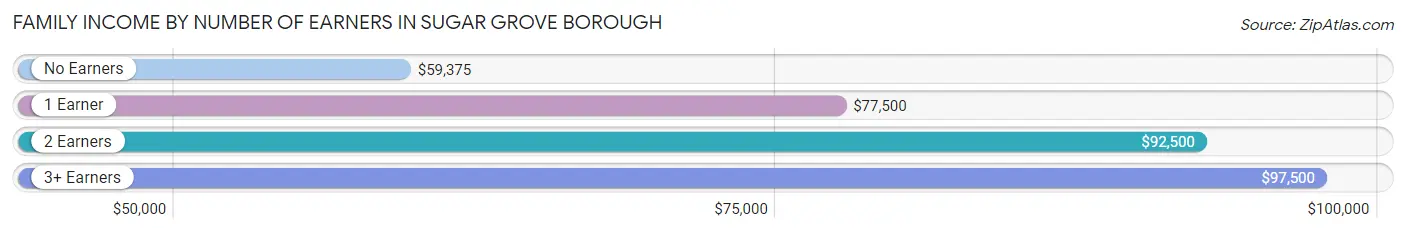
| Number of Earners | # Families | Median Income |
| No Earners | 40 (27.8%) | $59,375 |
| 1 Earner | 38 (26.4%) | $77,500 |
| 2 Earners | 44 (30.6%) | $92,500 |
| 3+ Earners | 22 (15.3%) | $97,500 |
| Total | 144 (100.0%) | $81,667 |
Household Income in Sugar Grove borough
Household Income Brackets in Sugar Grove borough
With 55 households falling in the category, the $75,000 to $99,999 income range is the most frequent in Sugar Grove borough, accounting for 25.9% of all households. In contrast, only 3 households (1.4%) fall into the less than $10,000 income bracket, making it the least populous group.
| Income Bracket | # Households | % Households |
| Less than $10,000 | 3 | 1.4% |
| $10,000 to $14,999 | 6 | 2.8% |
| $15,000 to $24,999 | 19 | 9.0% |
| $25,000 to $34,999 | 26 | 12.3% |
| $35,000 to $49,999 | 22 | 10.4% |
| $50,000 to $74,999 | 39 | 18.4% |
| $75,000 to $99,999 | 55 | 25.9% |
| $100,000 to $149,999 | 21 | 9.9% |
| $150,000 to $199,999 | 5 | 2.4% |
| $200,000+ | 16 | 7.5% |
Household Income by Householder Age in Sugar Grove borough
The median household income in Sugar Grove borough is $68,056, with the highest median household income of $69,722 found in the 45 to 64 years age bracket for the primary householder. A total of 94 households (44.3%) fall into this category.
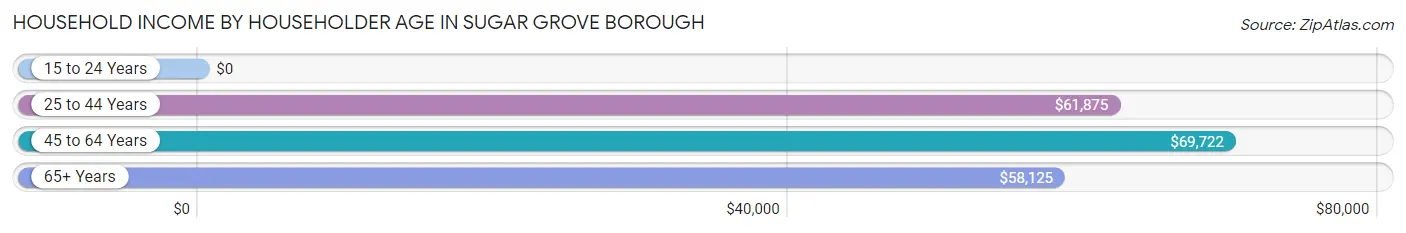
| Income Bracket | # Households | Median Income |
| 15 to 24 Years | 0 (0.0%) | $0 |
| 25 to 44 Years | 65 (30.7%) | $61,875 |
| 45 to 64 Years | 94 (44.3%) | $69,722 |
| 65+ Years | 53 (25.0%) | $58,125 |
| Total | 212 (100.0%) | $68,056 |
Poverty in Sugar Grove borough
Income Below Poverty by Sex and Age in Sugar Grove borough
With 5.5% poverty level for males and 9.4% for females among the residents of Sugar Grove borough, 16 and 17 year old males and 35 to 44 year old females are the most vulnerable to poverty, with 2 males (40.0%) and 6 females (27.3%) in their respective age groups living below the poverty level.
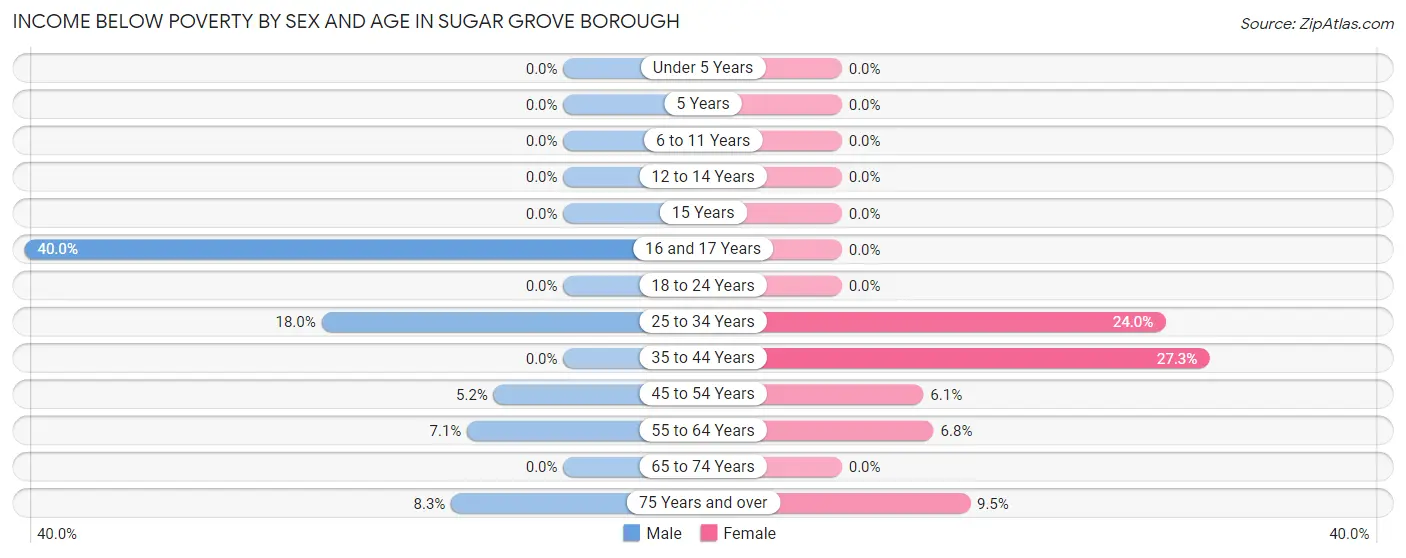
| Age Bracket | Male | Female |
| Under 5 Years | 0 (0.0%) | 0 (0.0%) |
| 5 Years | 0 (0.0%) | 0 (0.0%) |
| 6 to 11 Years | 0 (0.0%) | 0 (0.0%) |
| 12 to 14 Years | 0 (0.0%) | 0 (0.0%) |
| 15 Years | 0 (0.0%) | 0 (0.0%) |
| 16 and 17 Years | 2 (40.0%) | 0 (0.0%) |
| 18 to 24 Years | 0 (0.0%) | 0 (0.0%) |
| 25 to 34 Years | 7 (17.9%) | 12 (24.0%) |
| 35 to 44 Years | 0 (0.0%) | 6 (27.3%) |
| 45 to 54 Years | 3 (5.2%) | 2 (6.1%) |
| 55 to 64 Years | 3 (7.1%) | 3 (6.8%) |
| 65 to 74 Years | 0 (0.0%) | 0 (0.0%) |
| 75 Years and over | 2 (8.3%) | 2 (9.5%) |
| Total | 17 (5.5%) | 25 (9.4%) |
Income Above Poverty by Sex and Age in Sugar Grove borough
According to the poverty statistics in Sugar Grove borough, males aged under 5 years and females aged under 5 years are the age groups that are most secure financially, with 100.0% of males and 100.0% of females in these age groups living above the poverty line.
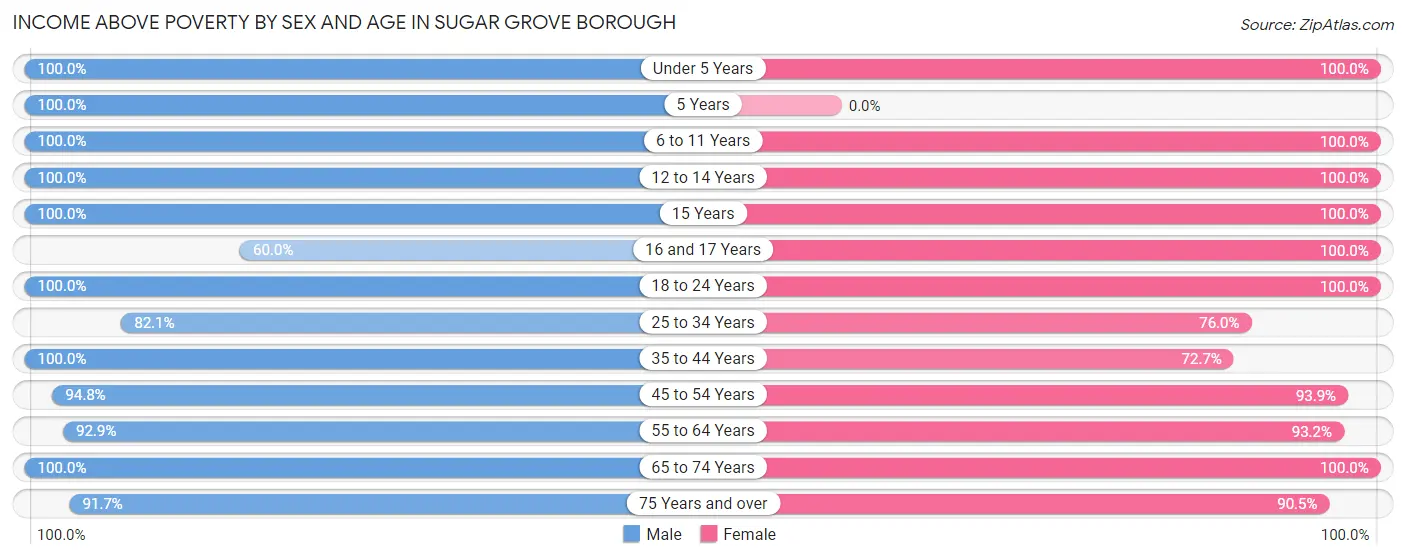
| Age Bracket | Male | Female |
| Under 5 Years | 52 (100.0%) | 2 (100.0%) |
| 5 Years | 6 (100.0%) | 0 (0.0%) |
| 6 to 11 Years | 7 (100.0%) | 25 (100.0%) |
| 12 to 14 Years | 9 (100.0%) | 6 (100.0%) |
| 15 Years | 5 (100.0%) | 5 (100.0%) |
| 16 and 17 Years | 3 (60.0%) | 7 (100.0%) |
| 18 to 24 Years | 7 (100.0%) | 32 (100.0%) |
| 25 to 34 Years | 32 (82.1%) | 38 (76.0%) |
| 35 to 44 Years | 32 (100.0%) | 16 (72.7%) |
| 45 to 54 Years | 55 (94.8%) | 31 (93.9%) |
| 55 to 64 Years | 39 (92.9%) | 41 (93.2%) |
| 65 to 74 Years | 24 (100.0%) | 19 (100.0%) |
| 75 Years and over | 22 (91.7%) | 19 (90.5%) |
| Total | 293 (94.5%) | 241 (90.6%) |
Income Below Poverty Among Married-Couple Families in Sugar Grove borough
The poverty statistics for married-couple families in Sugar Grove borough show that 5.4% or 7 of the total 129 families live below the poverty line. Families with no children have the highest poverty rate of 8.6%, comprising of 7 families. On the other hand, families with 1 or 2 children have the lowest poverty rate of 0.0%, which includes 0 families.
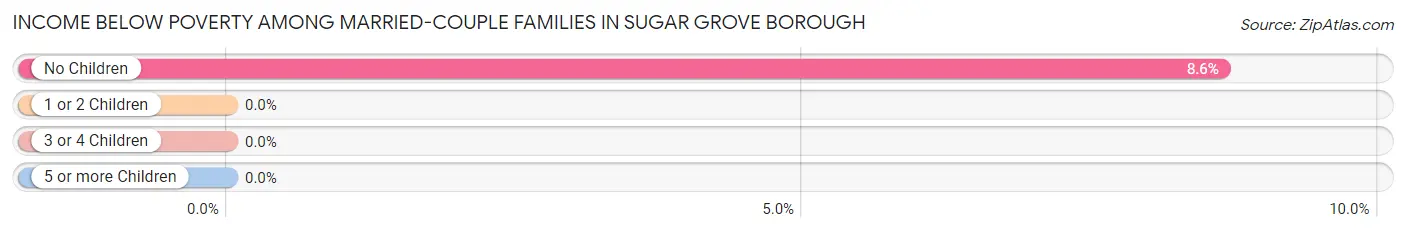
| Children | Above Poverty | Below Poverty |
| No Children | 74 (91.4%) | 7 (8.6%) |
| 1 or 2 Children | 32 (100.0%) | 0 (0.0%) |
| 3 or 4 Children | 16 (100.0%) | 0 (0.0%) |
| 5 or more Children | 0 (0.0%) | 0 (0.0%) |
| Total | 122 (94.6%) | 7 (5.4%) |
Income Below Poverty Among Single-Parent Households in Sugar Grove borough
| Children | Single Father | Single Mother |
| No Children | 0 (0.0%) | 0 (0.0%) |
| 1 or 2 Children | 0 (0.0%) | 0 (0.0%) |
| 3 or 4 Children | 0 (0.0%) | 0 (0.0%) |
| 5 or more Children | 0 (0.0%) | 0 (0.0%) |
| Total | 0 (0.0%) | 0 (0.0%) |
Income Below Poverty Among Married-Couple vs Single-Parent Households in Sugar Grove borough
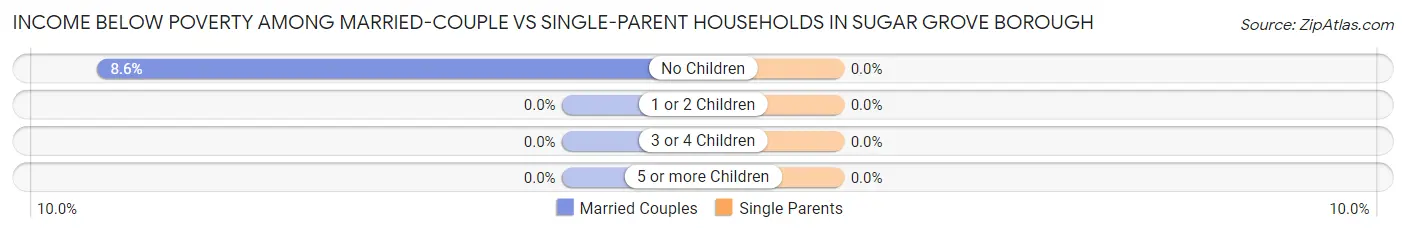
| Children | Married-Couple Families | Single-Parent Households |
| No Children | 7 (8.6%) | 0 (0.0%) |
| 1 or 2 Children | 0 (0.0%) | 0 (0.0%) |
| 3 or 4 Children | 0 (0.0%) | 0 (0.0%) |
| 5 or more Children | 0 (0.0%) | 0 (0.0%) |
| Total | 7 (5.4%) | 0 (0.0%) |
Employment Characteristics in Sugar Grove borough
Employment by Class of Employer in Sugar Grove borough
Among the 262 employed individuals in Sugar Grove borough, private company employees (167 | 63.7%), not-for-profit organizations (32 | 12.2%), and state government employees (22 | 8.4%) make up the most common classes of employment.
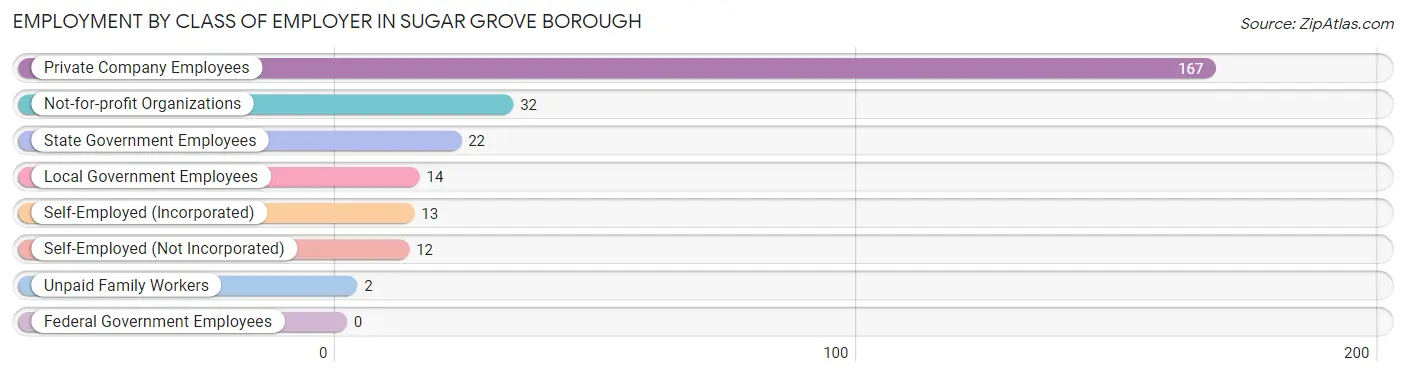
| Employer Class | # Employees | % Employees |
| Private Company Employees | 167 | 63.7% |
| Self-Employed (Incorporated) | 13 | 5.0% |
| Self-Employed (Not Incorporated) | 12 | 4.6% |
| Not-for-profit Organizations | 32 | 12.2% |
| Local Government Employees | 14 | 5.3% |
| State Government Employees | 22 | 8.4% |
| Federal Government Employees | 0 | 0.0% |
| Unpaid Family Workers | 2 | 0.8% |
| Total | 262 | 100.0% |
Employment Status by Age in Sugar Grove borough
According to the labor force statistics for Sugar Grove borough, out of the total population over 16 years of age (459), 57.3% or 263 individuals are in the labor force, with 0.4% or 1 of them unemployed. The age group with the highest labor force participation rate is 35 to 44 years, with 90.7% or 49 individuals in the labor force. Within the labor force, the 16 to 19 years age range has the highest percentage of unemployed individuals, with 14.3% or 1 of them being unemployed.
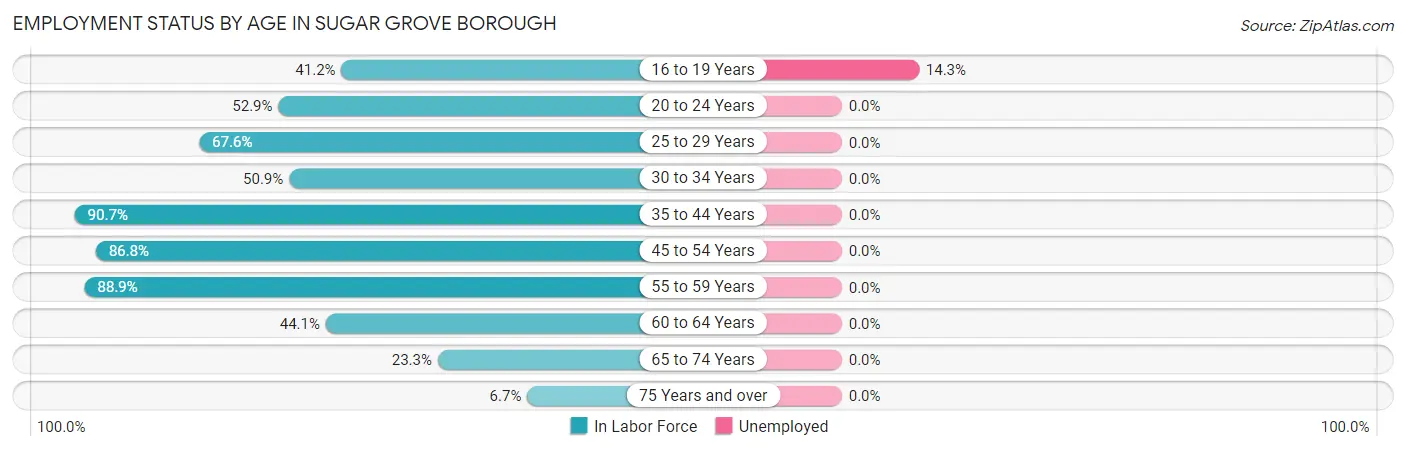
| Age Bracket | In Labor Force | Unemployed |
| 16 to 19 Years | 7 (41.2%) | 1 (14.3%) |
| 20 to 24 Years | 18 (52.9%) | 0 (0.0%) |
| 25 to 29 Years | 23 (67.6%) | 0 (0.0%) |
| 30 to 34 Years | 28 (50.9%) | 0 (0.0%) |
| 35 to 44 Years | 49 (90.7%) | 0 (0.0%) |
| 45 to 54 Years | 79 (86.8%) | 0 (0.0%) |
| 55 to 59 Years | 16 (88.9%) | 0 (0.0%) |
| 60 to 64 Years | 30 (44.1%) | 0 (0.0%) |
| 65 to 74 Years | 10 (23.3%) | 0 (0.0%) |
| 75 Years and over | 3 (6.7%) | 0 (0.0%) |
| Total | 263 (57.3%) | 1 (0.4%) |
Employment Status by Educational Attainment in Sugar Grove borough
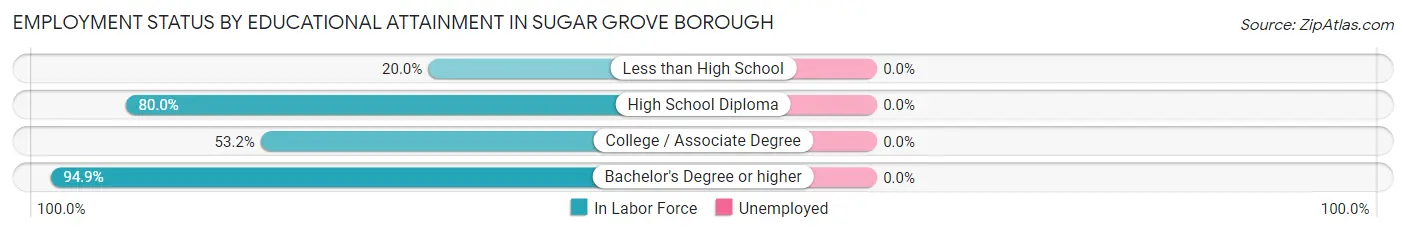
| Educational Attainment | In Labor Force | Unemployed |
| Less than High School | 2 (20.0%) | 0 (0.0%) |
| High School Diploma | 100 (80.0%) | 0 (0.0%) |
| College / Associate Degree | 67 (53.2%) | 0 (0.0%) |
| Bachelor's Degree or higher | 56 (94.9%) | 0 (0.0%) |
| Total | 225 (70.3%) | 0 (0.0%) |
Employment Occupations by Sex in Sugar Grove borough
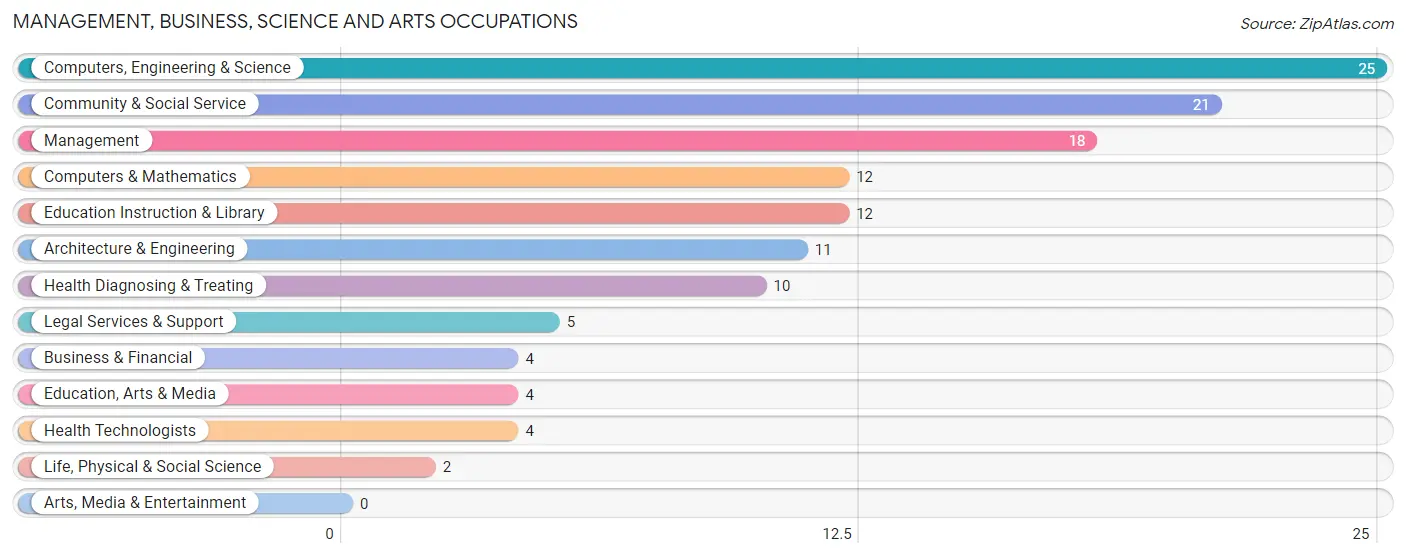
Management, Business, Science and Arts Occupations
The most common Management, Business, Science and Arts occupations in Sugar Grove borough are Computers, Engineering & Science (25 | 9.5%), Community & Social Service (21 | 8.0%), Management (18 | 6.9%), Computers & Mathematics (12 | 4.6%), and Education Instruction & Library (12 | 4.6%).
Management, Business, Science and Arts Occupations by Sex
Within the Management, Business, Science and Arts occupations in Sugar Grove borough, the most male-oriented occupations are Business & Financial (100.0%), Computers & Mathematics (100.0%), and Architecture & Engineering (100.0%), while the most female-oriented occupations are Life, Physical & Social Science (100.0%), Health Diagnosing & Treating (100.0%), and Health Technologists (100.0%).
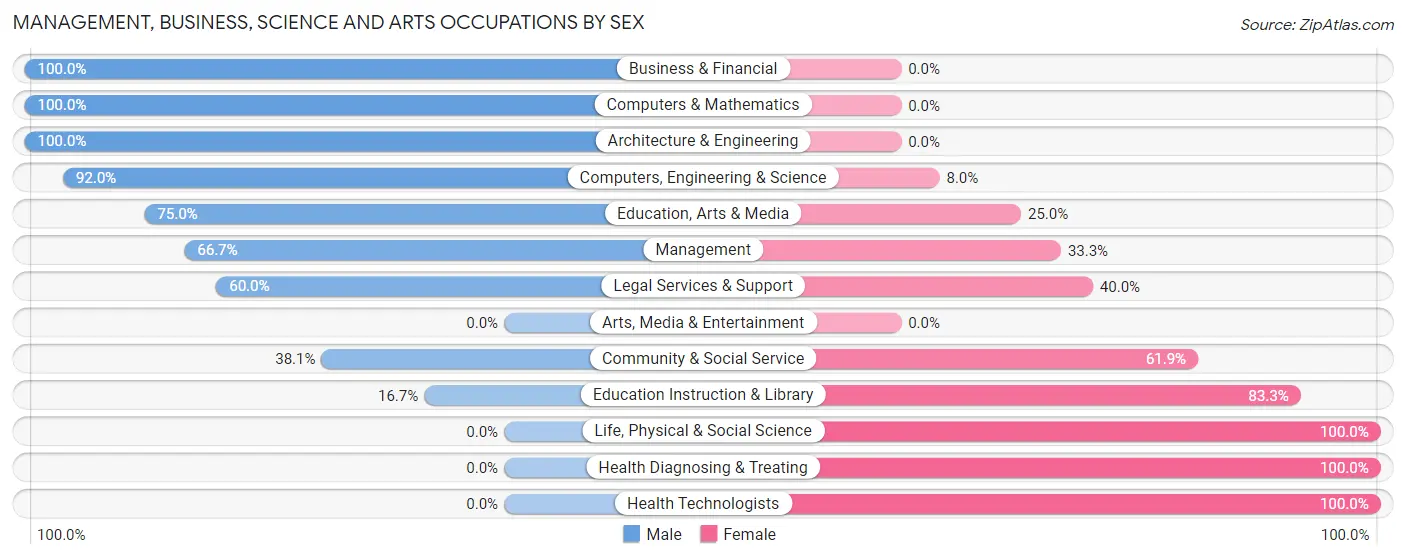
| Occupation | Male | Female |
| Management | 12 (66.7%) | 6 (33.3%) |
| Business & Financial | 4 (100.0%) | 0 (0.0%) |
| Computers, Engineering & Science | 23 (92.0%) | 2 (8.0%) |
| Computers & Mathematics | 12 (100.0%) | 0 (0.0%) |
| Architecture & Engineering | 11 (100.0%) | 0 (0.0%) |
| Life, Physical & Social Science | 0 (0.0%) | 2 (100.0%) |
| Community & Social Service | 8 (38.1%) | 13 (61.9%) |
| Education, Arts & Media | 3 (75.0%) | 1 (25.0%) |
| Legal Services & Support | 3 (60.0%) | 2 (40.0%) |
| Education Instruction & Library | 2 (16.7%) | 10 (83.3%) |
| Arts, Media & Entertainment | 0 (0.0%) | 0 (0.0%) |
| Health Diagnosing & Treating | 0 (0.0%) | 10 (100.0%) |
| Health Technologists | 0 (0.0%) | 4 (100.0%) |
| Total (Category) | 47 (60.3%) | 31 (39.7%) |
| Total (Overall) | 173 (66.0%) | 89 (34.0%) |
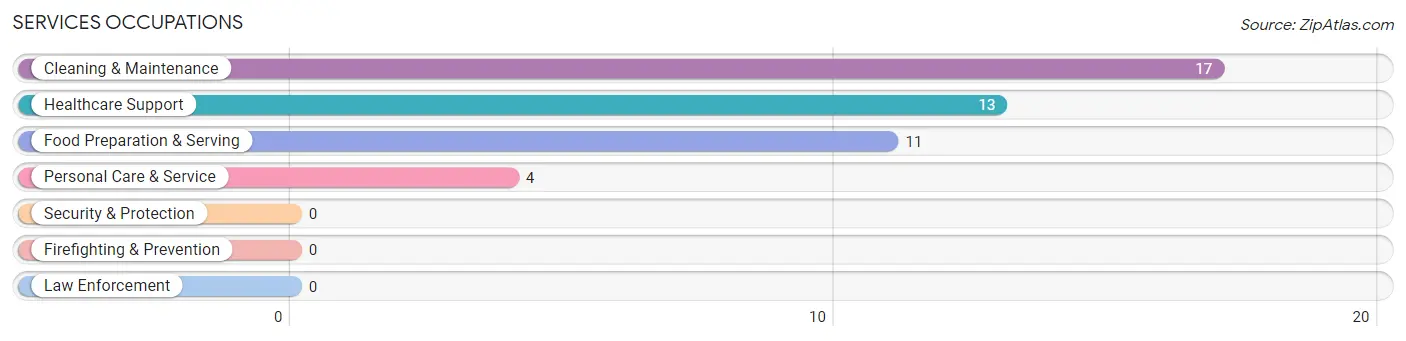
Services Occupations
The most common Services occupations in Sugar Grove borough are Cleaning & Maintenance (17 | 6.5%), Healthcare Support (13 | 5.0%), Food Preparation & Serving (11 | 4.2%), and Personal Care & Service (4 | 1.5%).
Services Occupations by Sex
Within the Services occupations in Sugar Grove borough, the most male-oriented occupations are Cleaning & Maintenance (100.0%), and Food Preparation & Serving (72.7%), while the most female-oriented occupations are Healthcare Support (100.0%), Personal Care & Service (100.0%), and Food Preparation & Serving (27.3%).
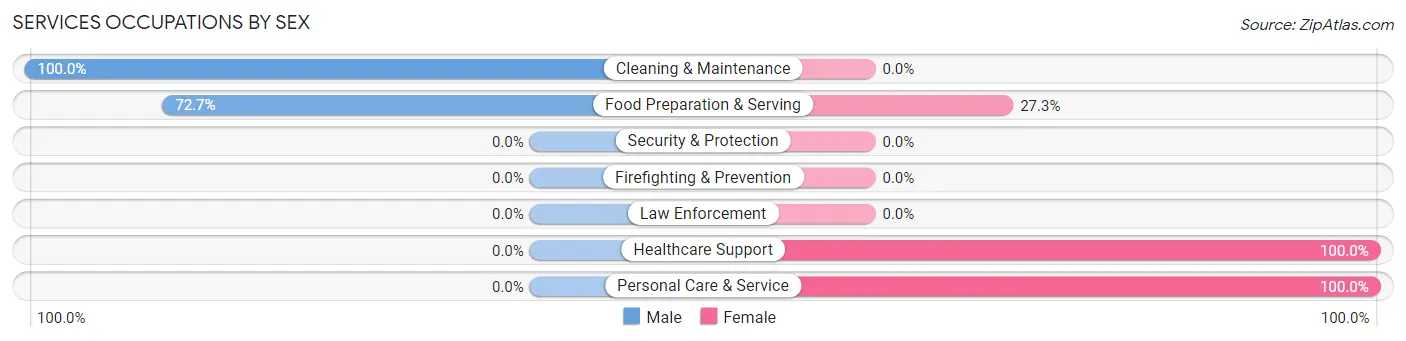
| Occupation | Male | Female |
| Healthcare Support | 0 (0.0%) | 13 (100.0%) |
| Security & Protection | 0 (0.0%) | 0 (0.0%) |
| Firefighting & Prevention | 0 (0.0%) | 0 (0.0%) |
| Law Enforcement | 0 (0.0%) | 0 (0.0%) |
| Food Preparation & Serving | 8 (72.7%) | 3 (27.3%) |
| Cleaning & Maintenance | 17 (100.0%) | 0 (0.0%) |
| Personal Care & Service | 0 (0.0%) | 4 (100.0%) |
| Total (Category) | 25 (55.6%) | 20 (44.4%) |
| Total (Overall) | 173 (66.0%) | 89 (34.0%) |
Sales and Office Occupations
The most common Sales and Office occupations in Sugar Grove borough are Office & Administration (29 | 11.1%), and Sales & Related (18 | 6.9%).

Sales and Office Occupations by Sex

| Occupation | Male | Female |
| Sales & Related | 16 (88.9%) | 2 (11.1%) |
| Office & Administration | 5 (17.2%) | 24 (82.8%) |
| Total (Category) | 21 (44.7%) | 26 (55.3%) |
| Total (Overall) | 173 (66.0%) | 89 (34.0%) |
Natural Resources, Construction and Maintenance Occupations
The most common Natural Resources, Construction and Maintenance occupations in Sugar Grove borough are Construction & Extraction (28 | 10.7%), and Installation, Maintenance & Repair (11 | 4.2%).

Natural Resources, Construction and Maintenance Occupations by Sex

| Occupation | Male | Female |
| Farming, Fishing & Forestry | 0 (0.0%) | 0 (0.0%) |
| Construction & Extraction | 28 (100.0%) | 0 (0.0%) |
| Installation, Maintenance & Repair | 11 (100.0%) | 0 (0.0%) |
| Total (Category) | 39 (100.0%) | 0 (0.0%) |
| Total (Overall) | 173 (66.0%) | 89 (34.0%) |
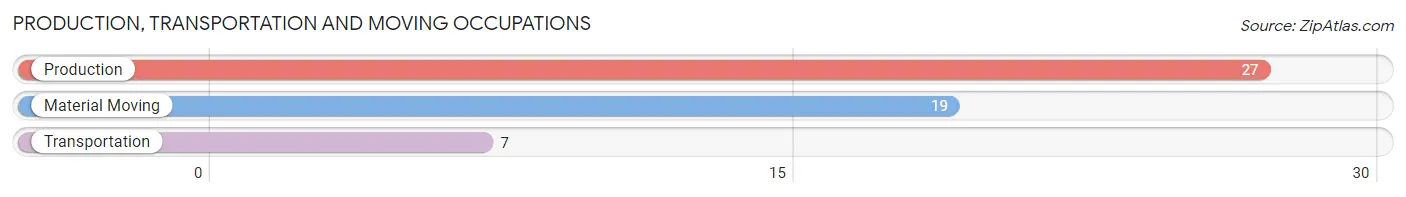
Production, Transportation and Moving Occupations
The most common Production, Transportation and Moving occupations in Sugar Grove borough are Production (27 | 10.3%), Material Moving (19 | 7.2%), and Transportation (7 | 2.7%).
Production, Transportation and Moving Occupations by Sex
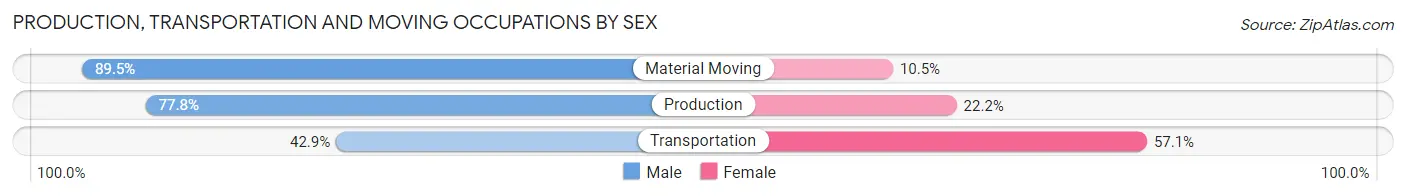
| Occupation | Male | Female |
| Production | 21 (77.8%) | 6 (22.2%) |
| Transportation | 3 (42.9%) | 4 (57.1%) |
| Material Moving | 17 (89.5%) | 2 (10.5%) |
| Total (Category) | 41 (77.4%) | 12 (22.6%) |
| Total (Overall) | 173 (66.0%) | 89 (34.0%) |
Employment Industries by Sex in Sugar Grove borough
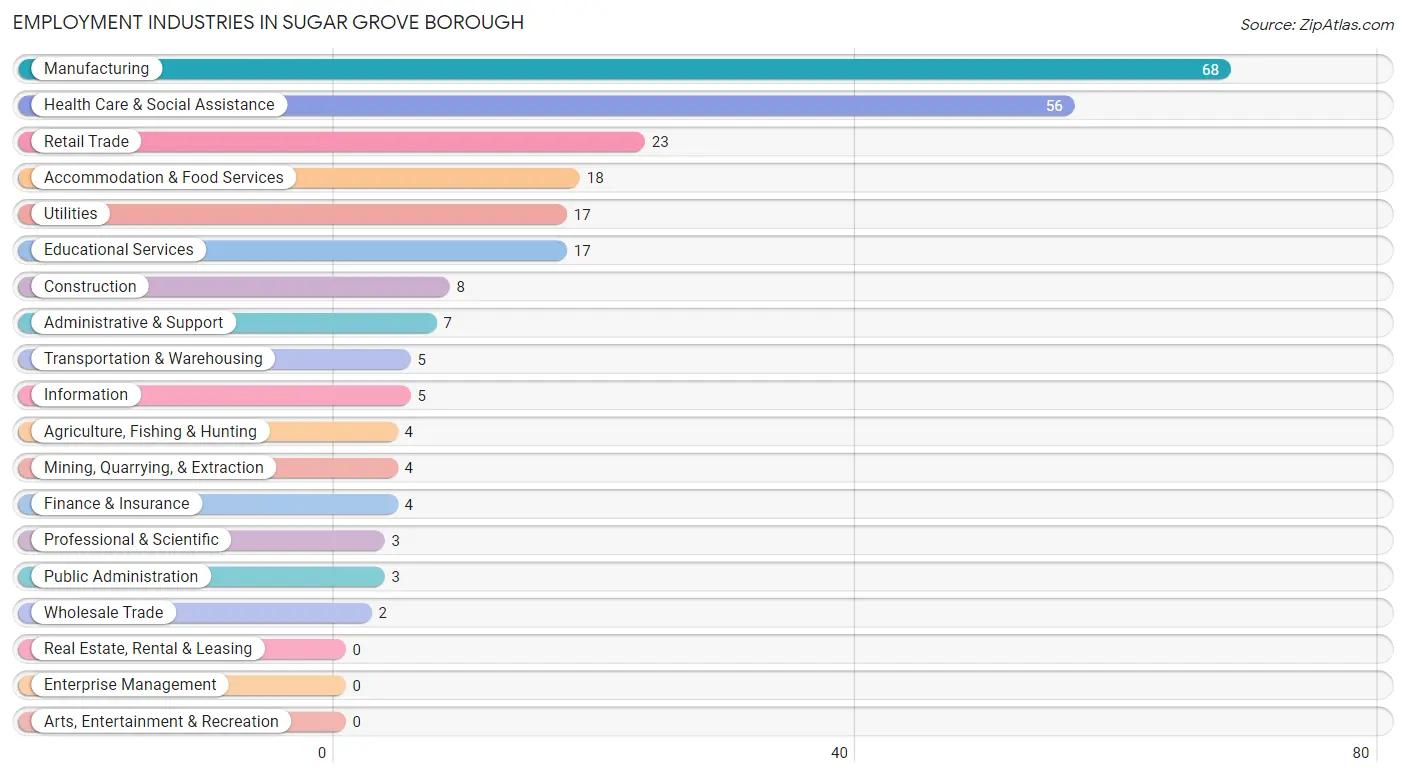
Employment Industries in Sugar Grove borough
The major employment industries in Sugar Grove borough include Manufacturing (68 | 26.0%), Health Care & Social Assistance (56 | 21.4%), Retail Trade (23 | 8.8%), Accommodation & Food Services (18 | 6.9%), and Utilities (17 | 6.5%).
Employment Industries by Sex in Sugar Grove borough
The Sugar Grove borough industries that see more men than women are Mining, Quarrying, & Extraction (100.0%), Construction (100.0%), and Wholesale Trade (100.0%), whereas the industries that tend to have a higher number of women are Health Care & Social Assistance (73.2%), Educational Services (70.6%), and Public Administration (66.7%).
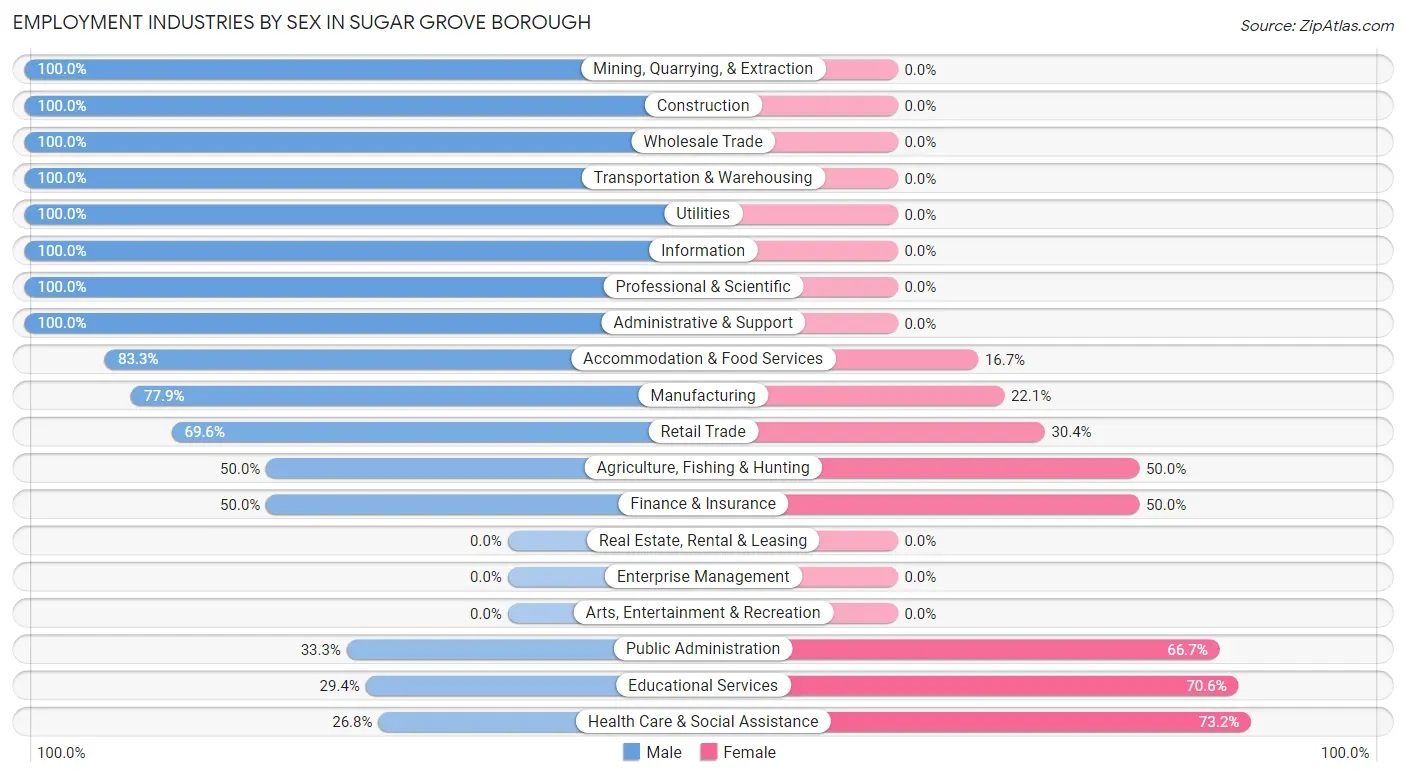
| Industry | Male | Female |
| Agriculture, Fishing & Hunting | 2 (50.0%) | 2 (50.0%) |
| Mining, Quarrying, & Extraction | 4 (100.0%) | 0 (0.0%) |
| Construction | 8 (100.0%) | 0 (0.0%) |
| Manufacturing | 53 (77.9%) | 15 (22.1%) |
| Wholesale Trade | 2 (100.0%) | 0 (0.0%) |
| Retail Trade | 16 (69.6%) | 7 (30.4%) |
| Transportation & Warehousing | 5 (100.0%) | 0 (0.0%) |
| Utilities | 17 (100.0%) | 0 (0.0%) |
| Information | 5 (100.0%) | 0 (0.0%) |
| Finance & Insurance | 2 (50.0%) | 2 (50.0%) |
| Real Estate, Rental & Leasing | 0 (0.0%) | 0 (0.0%) |
| Professional & Scientific | 3 (100.0%) | 0 (0.0%) |
| Enterprise Management | 0 (0.0%) | 0 (0.0%) |
| Administrative & Support | 7 (100.0%) | 0 (0.0%) |
| Educational Services | 5 (29.4%) | 12 (70.6%) |
| Health Care & Social Assistance | 15 (26.8%) | 41 (73.2%) |
| Arts, Entertainment & Recreation | 0 (0.0%) | 0 (0.0%) |
| Accommodation & Food Services | 15 (83.3%) | 3 (16.7%) |
| Public Administration | 1 (33.3%) | 2 (66.7%) |
| Total | 173 (66.0%) | 89 (34.0%) |
Education in Sugar Grove borough
School Enrollment in Sugar Grove borough
The most common levels of schooling among the 92 students in Sugar Grove borough are middle school (25 | 27.2%), high school (24 | 26.1%), and elementary school (12 | 13.0%).
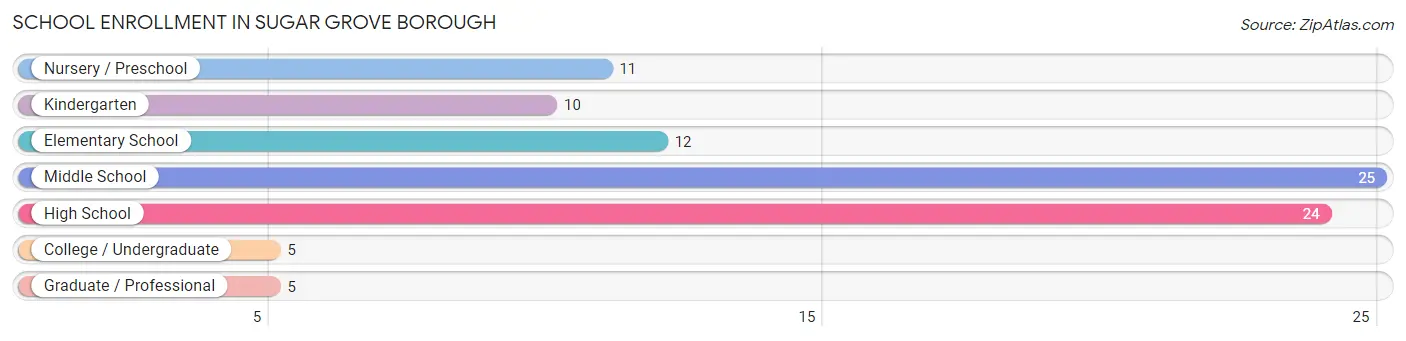
| School Level | # Students | % Students |
| Nursery / Preschool | 11 | 12.0% |
| Kindergarten | 10 | 10.9% |
| Elementary School | 12 | 13.0% |
| Middle School | 25 | 27.2% |
| High School | 24 | 26.1% |
| College / Undergraduate | 5 | 5.4% |
| Graduate / Professional | 5 | 5.4% |
| Total | 92 | 100.0% |
School Enrollment by Age by Funding Source in Sugar Grove borough
Out of a total of 92 students who are enrolled in schools in Sugar Grove borough, 20 (21.7%) attend a private institution, while the remaining 72 (78.3%) are enrolled in public schools. The age group of 3 to 4 year olds has the highest likelihood of being enrolled in private schools, with 5 (100.0% in the age bracket) enrolled. Conversely, the age group of 10 to 14 year olds has the lowest likelihood of being enrolled in a private school, with 30 (100.0% in the age bracket) attending a public institution.
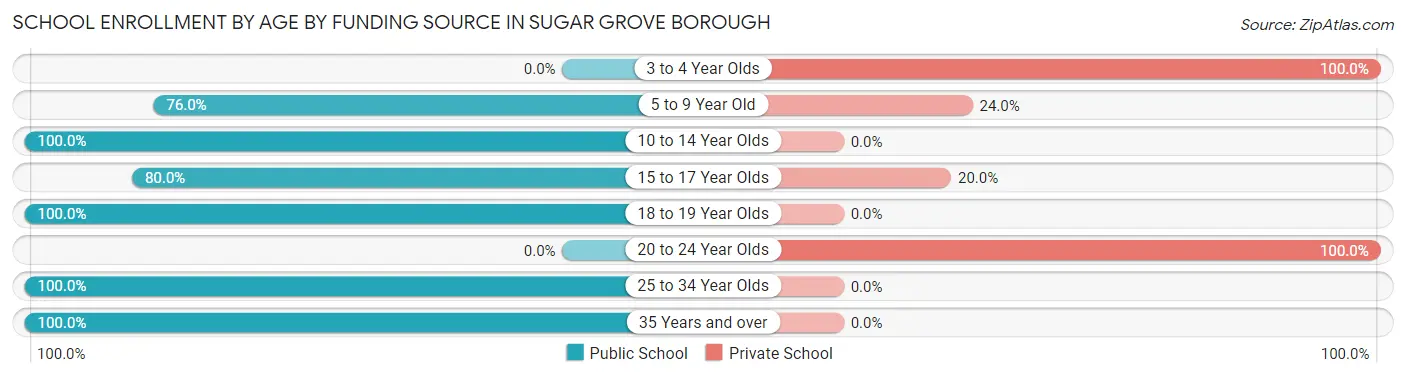
| Age Bracket | Public School | Private School |
| 3 to 4 Year Olds | 0 (0.0%) | 5 (100.0%) |
| 5 to 9 Year Old | 19 (76.0%) | 6 (24.0%) |
| 10 to 14 Year Olds | 30 (100.0%) | 0 (0.0%) |
| 15 to 17 Year Olds | 16 (80.0%) | 4 (20.0%) |
| 18 to 19 Year Olds | 2 (100.0%) | 0 (0.0%) |
| 20 to 24 Year Olds | 0 (0.0%) | 5 (100.0%) |
| 25 to 34 Year Olds | 3 (100.0%) | 0 (0.0%) |
| 35 Years and over | 2 (100.0%) | 0 (0.0%) |
| Total | 72 (78.3%) | 20 (21.7%) |
Educational Attainment by Field of Study in Sugar Grove borough
Education (20 | 24.4%), computers & mathematics (16 | 19.5%), science & technology (12 | 14.6%), physical & health sciences (9 | 11.0%), and psychology (8 | 9.8%) are the most common fields of study among 82 individuals in Sugar Grove borough who have obtained a bachelor's degree or higher.
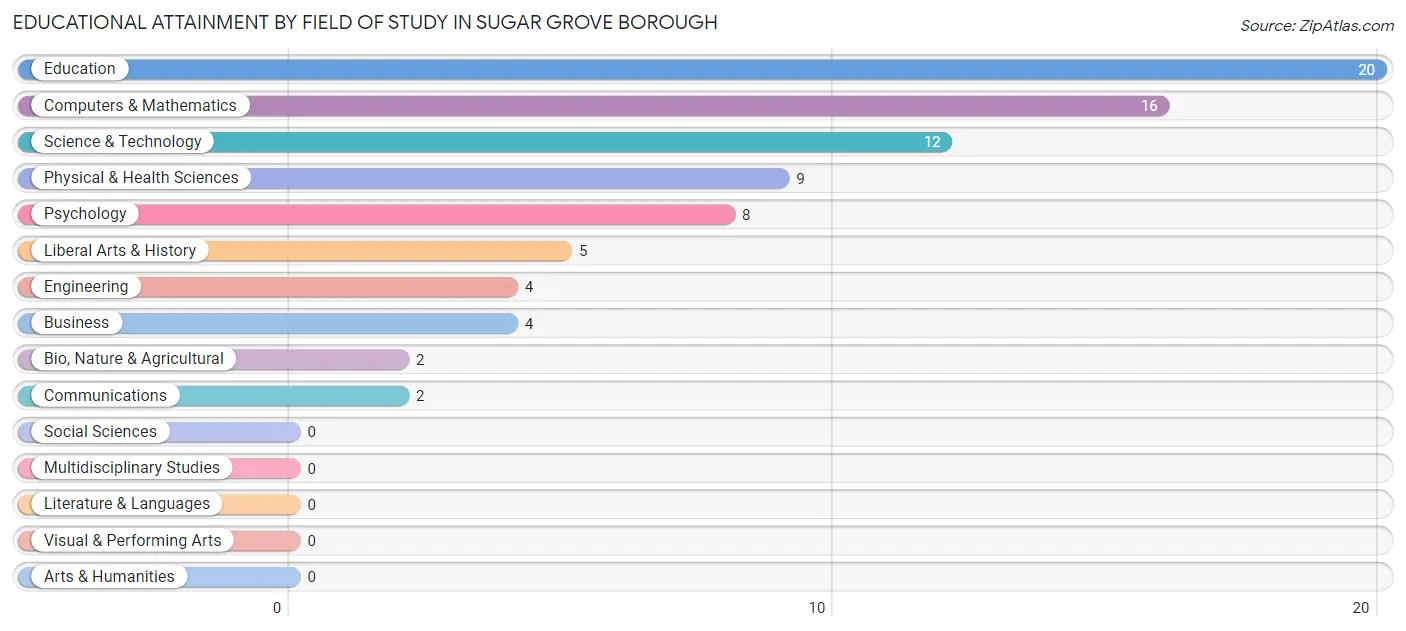
| Field of Study | # Graduates | % Graduates |
| Computers & Mathematics | 16 | 19.5% |
| Bio, Nature & Agricultural | 2 | 2.4% |
| Physical & Health Sciences | 9 | 11.0% |
| Psychology | 8 | 9.8% |
| Social Sciences | 0 | 0.0% |
| Engineering | 4 | 4.9% |
| Multidisciplinary Studies | 0 | 0.0% |
| Science & Technology | 12 | 14.6% |
| Business | 4 | 4.9% |
| Education | 20 | 24.4% |
| Literature & Languages | 0 | 0.0% |
| Liberal Arts & History | 5 | 6.1% |
| Visual & Performing Arts | 0 | 0.0% |
| Communications | 2 | 2.4% |
| Arts & Humanities | 0 | 0.0% |
| Total | 82 | 100.0% |
Transportation & Commute in Sugar Grove borough
Vehicle Availability by Sex in Sugar Grove borough
The most prevalent vehicle ownership categories in Sugar Grove borough are males with 2 vehicles (61, accounting for 35.3%) and females with 2 vehicles (38, making up 68.5%).
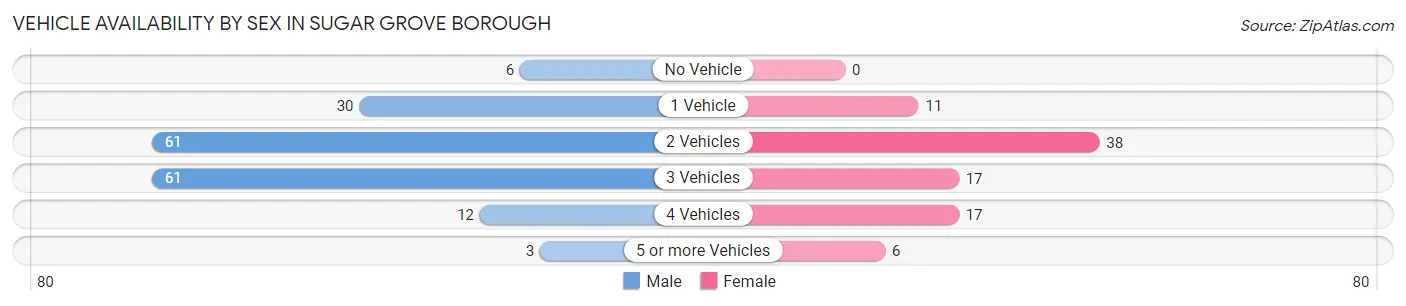
| Vehicles Available | Male | Female |
| No Vehicle | 6 (3.5%) | 0 (0.0%) |
| 1 Vehicle | 30 (17.3%) | 11 (12.4%) |
| 2 Vehicles | 61 (35.3%) | 38 (42.7%) |
| 3 Vehicles | 61 (35.3%) | 17 (19.1%) |
| 4 Vehicles | 12 (6.9%) | 17 (19.1%) |
| 5 or more Vehicles | 3 (1.7%) | 6 (6.7%) |
| Total | 173 (100.0%) | 89 (100.0%) |
Commute Time in Sugar Grove borough
The most frequently occuring commute durations in Sugar Grove borough are 20 to 24 minutes (48 commuters, 19.6%), 15 to 19 minutes (47 commuters, 19.2%), and 35 to 39 minutes (36 commuters, 14.7%).
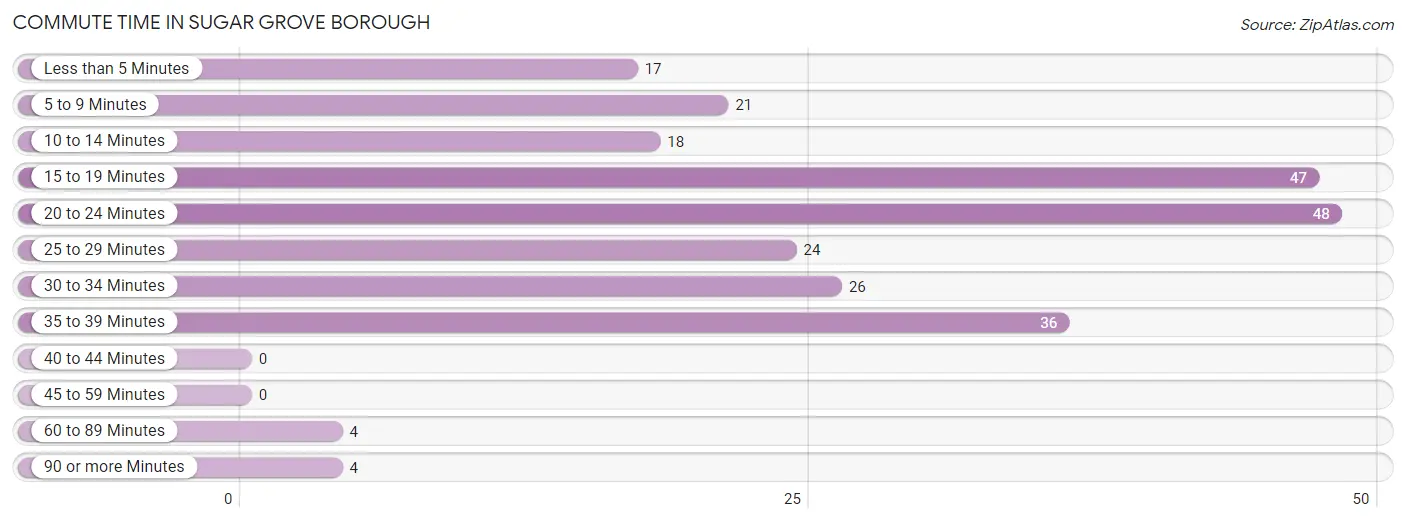
| Commute Time | # Commuters | % Commuters |
| Less than 5 Minutes | 17 | 6.9% |
| 5 to 9 Minutes | 21 | 8.6% |
| 10 to 14 Minutes | 18 | 7.3% |
| 15 to 19 Minutes | 47 | 19.2% |
| 20 to 24 Minutes | 48 | 19.6% |
| 25 to 29 Minutes | 24 | 9.8% |
| 30 to 34 Minutes | 26 | 10.6% |
| 35 to 39 Minutes | 36 | 14.7% |
| 40 to 44 Minutes | 0 | 0.0% |
| 45 to 59 Minutes | 0 | 0.0% |
| 60 to 89 Minutes | 4 | 1.6% |
| 90 or more Minutes | 4 | 1.6% |
Commute Time by Sex in Sugar Grove borough
The most common commute times in Sugar Grove borough are 15 to 19 minutes (40 commuters, 23.1%) for males and 20 to 24 minutes (21 commuters, 29.2%) for females.
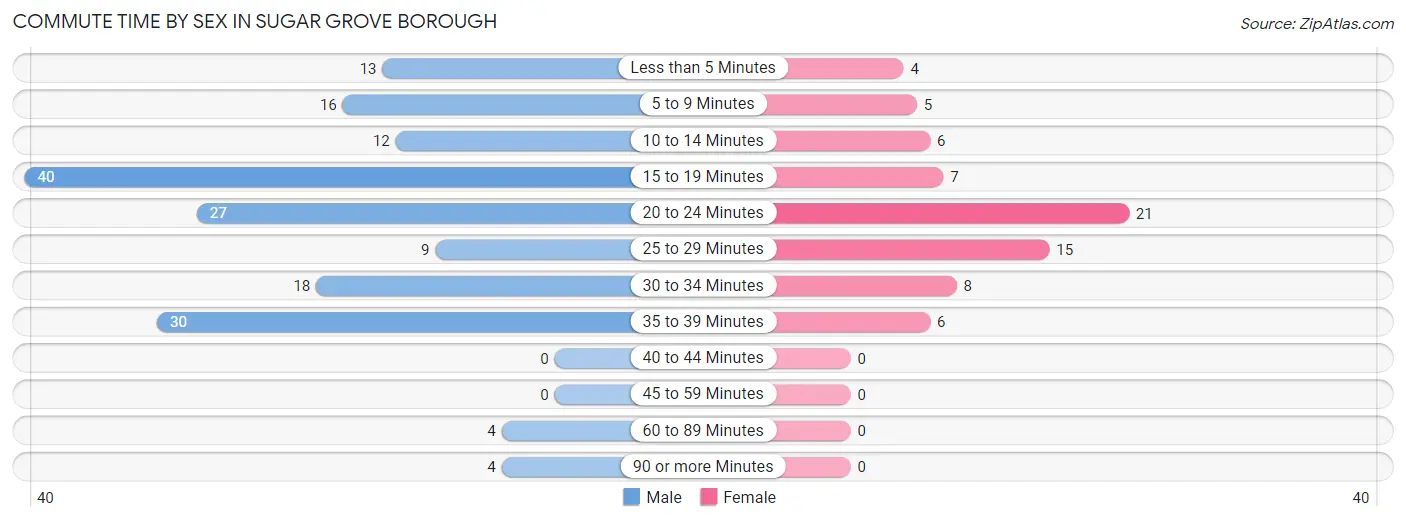
| Commute Time | Male | Female |
| Less than 5 Minutes | 13 (7.5%) | 4 (5.6%) |
| 5 to 9 Minutes | 16 (9.2%) | 5 (6.9%) |
| 10 to 14 Minutes | 12 (6.9%) | 6 (8.3%) |
| 15 to 19 Minutes | 40 (23.1%) | 7 (9.7%) |
| 20 to 24 Minutes | 27 (15.6%) | 21 (29.2%) |
| 25 to 29 Minutes | 9 (5.2%) | 15 (20.8%) |
| 30 to 34 Minutes | 18 (10.4%) | 8 (11.1%) |
| 35 to 39 Minutes | 30 (17.3%) | 6 (8.3%) |
| 40 to 44 Minutes | 0 (0.0%) | 0 (0.0%) |
| 45 to 59 Minutes | 0 (0.0%) | 0 (0.0%) |
| 60 to 89 Minutes | 4 (2.3%) | 0 (0.0%) |
| 90 or more Minutes | 4 (2.3%) | 0 (0.0%) |
Time of Departure to Work by Sex in Sugar Grove borough
The most frequent times of departure to work in Sugar Grove borough are 6:00 AM to 6:29 AM (54, 31.2%) for males and 7:30 AM to 7:59 AM (16, 22.2%) for females.
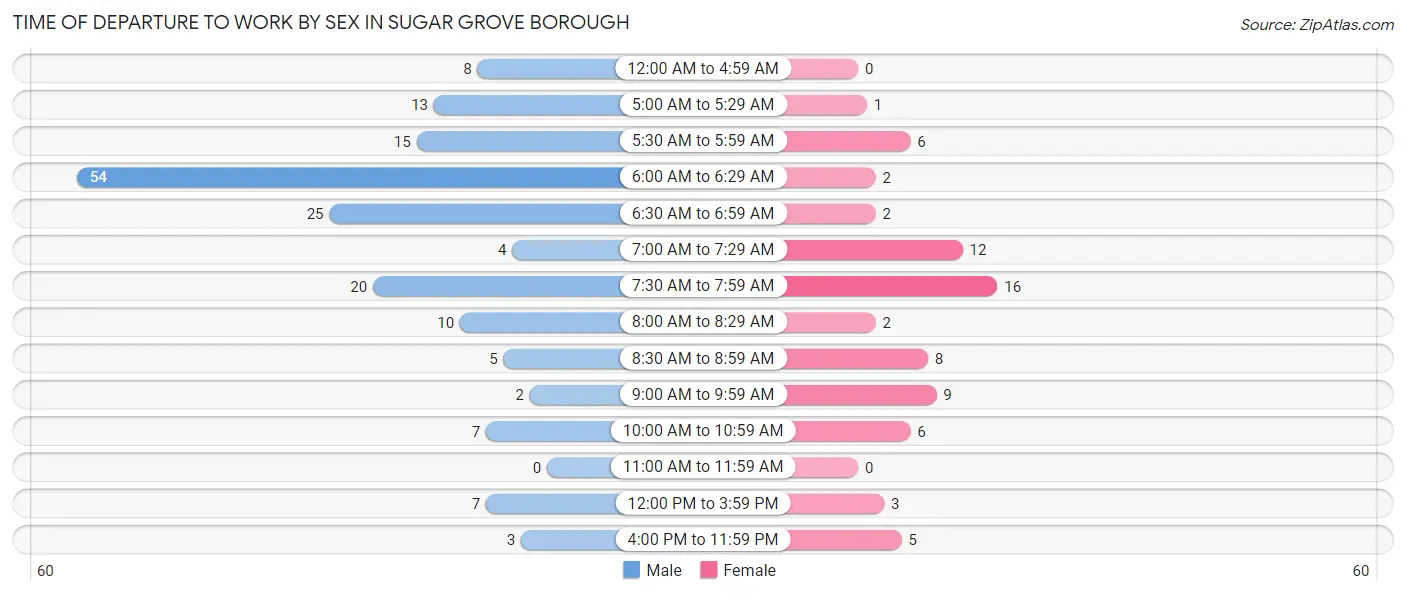
| Time of Departure | Male | Female |
| 12:00 AM to 4:59 AM | 8 (4.6%) | 0 (0.0%) |
| 5:00 AM to 5:29 AM | 13 (7.5%) | 1 (1.4%) |
| 5:30 AM to 5:59 AM | 15 (8.7%) | 6 (8.3%) |
| 6:00 AM to 6:29 AM | 54 (31.2%) | 2 (2.8%) |
| 6:30 AM to 6:59 AM | 25 (14.4%) | 2 (2.8%) |
| 7:00 AM to 7:29 AM | 4 (2.3%) | 12 (16.7%) |
| 7:30 AM to 7:59 AM | 20 (11.6%) | 16 (22.2%) |
| 8:00 AM to 8:29 AM | 10 (5.8%) | 2 (2.8%) |
| 8:30 AM to 8:59 AM | 5 (2.9%) | 8 (11.1%) |
| 9:00 AM to 9:59 AM | 2 (1.2%) | 9 (12.5%) |
| 10:00 AM to 10:59 AM | 7 (4.1%) | 6 (8.3%) |
| 11:00 AM to 11:59 AM | 0 (0.0%) | 0 (0.0%) |
| 12:00 PM to 3:59 PM | 7 (4.1%) | 3 (4.2%) |
| 4:00 PM to 11:59 PM | 3 (1.7%) | 5 (6.9%) |
| Total | 173 (100.0%) | 72 (100.0%) |
Housing Occupancy in Sugar Grove borough
Occupancy by Ownership in Sugar Grove borough
Of the total 212 dwellings in Sugar Grove borough, owner-occupied units account for 168 (79.2%), while renter-occupied units make up 44 (20.7%).
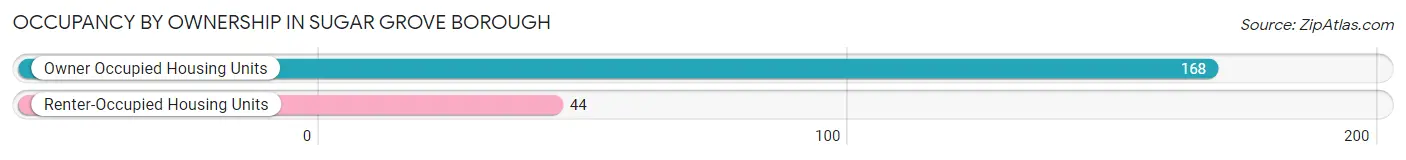
| Occupancy | # Housing Units | % Housing Units |
| Owner Occupied Housing Units | 168 | 79.2% |
| Renter-Occupied Housing Units | 44 | 20.7% |
| Total Occupied Housing Units | 212 | 100.0% |
Occupancy by Household Size in Sugar Grove borough
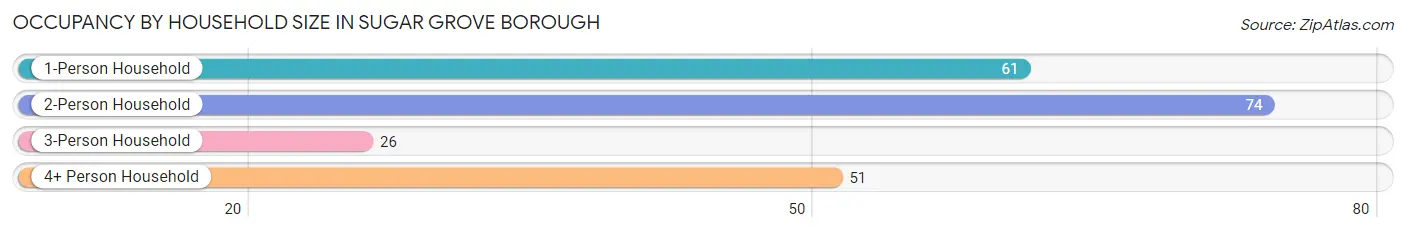
| Household Size | # Housing Units | % Housing Units |
| 1-Person Household | 61 | 28.8% |
| 2-Person Household | 74 | 34.9% |
| 3-Person Household | 26 | 12.3% |
| 4+ Person Household | 51 | 24.1% |
| Total Housing Units | 212 | 100.0% |
Occupancy by Ownership by Household Size in Sugar Grove borough
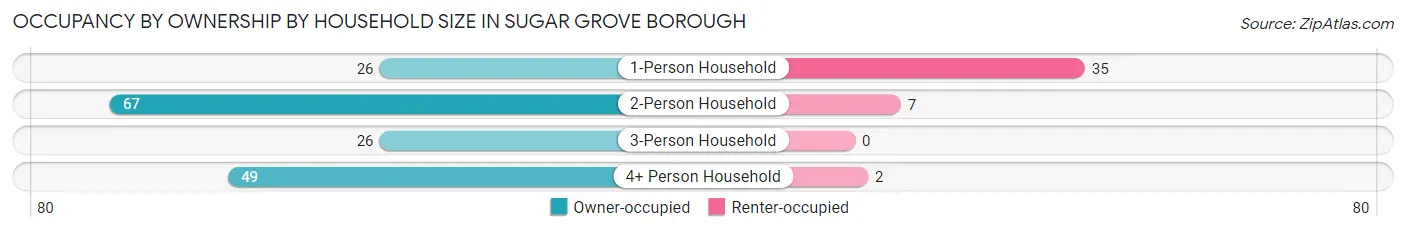
| Household Size | Owner-occupied | Renter-occupied |
| 1-Person Household | 26 (42.6%) | 35 (57.4%) |
| 2-Person Household | 67 (90.5%) | 7 (9.5%) |
| 3-Person Household | 26 (100.0%) | 0 (0.0%) |
| 4+ Person Household | 49 (96.1%) | 2 (3.9%) |
| Total Housing Units | 168 (79.2%) | 44 (20.7%) |
Occupancy by Educational Attainment in Sugar Grove borough
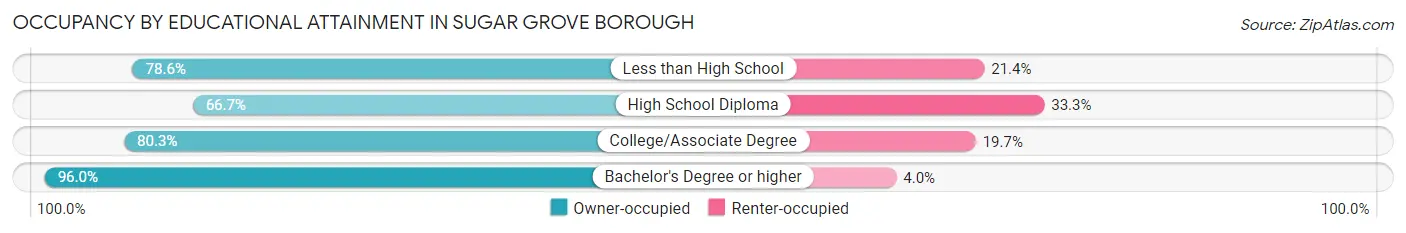
| Household Size | Owner-occupied | Renter-occupied |
| Less than High School | 11 (78.6%) | 3 (21.4%) |
| High School Diploma | 48 (66.7%) | 24 (33.3%) |
| College/Associate Degree | 61 (80.3%) | 15 (19.7%) |
| Bachelor's Degree or higher | 48 (96.0%) | 2 (4.0%) |
Occupancy by Age of Householder in Sugar Grove borough
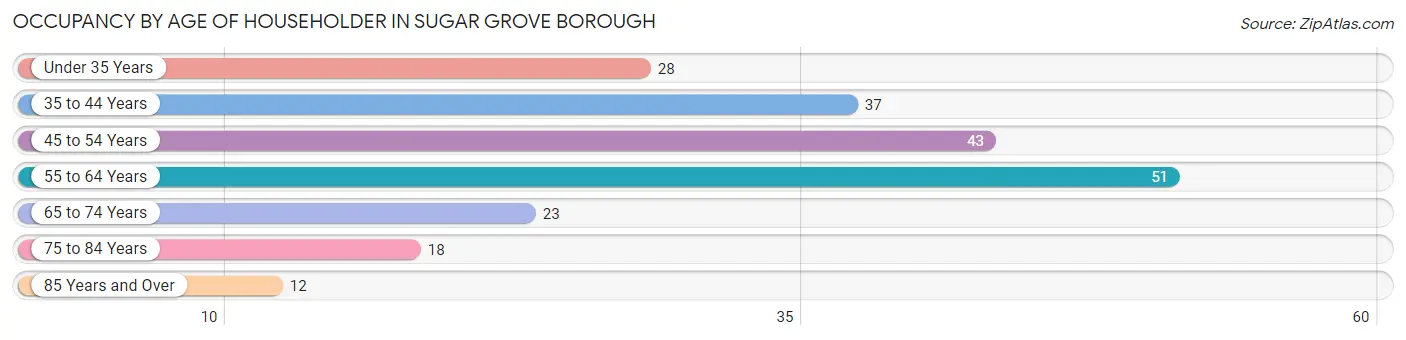
| Age Bracket | # Households | % Households |
| Under 35 Years | 28 | 13.2% |
| 35 to 44 Years | 37 | 17.4% |
| 45 to 54 Years | 43 | 20.3% |
| 55 to 64 Years | 51 | 24.1% |
| 65 to 74 Years | 23 | 10.8% |
| 75 to 84 Years | 18 | 8.5% |
| 85 Years and Over | 12 | 5.7% |
| Total | 212 | 100.0% |
Housing Finances in Sugar Grove borough
Median Income by Occupancy in Sugar Grove borough
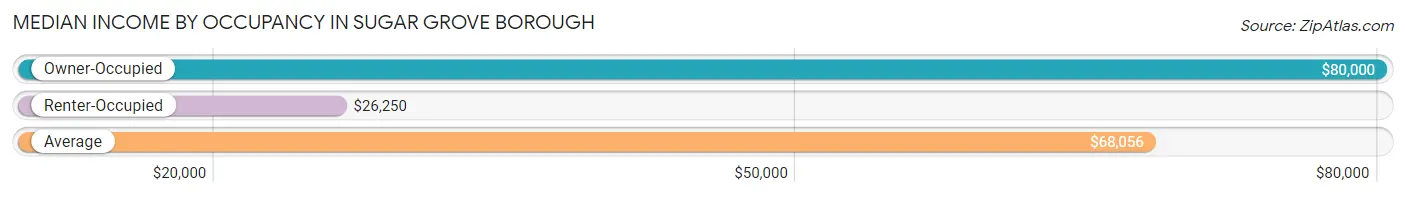
| Occupancy Type | # Households | Median Income |
| Owner-Occupied | 168 (79.2%) | $80,000 |
| Renter-Occupied | 44 (20.7%) | $26,250 |
| Average | 212 (100.0%) | $68,056 |
Occupancy by Householder Income Bracket in Sugar Grove borough
| Income Bracket | Owner-occupied | Renter-occupied |
| Less than $5,000 | 0 (0.0%) | 0 (0.0%) |
| $5,000 to $9,999 | 3 (1.8%) | 0 (0.0%) |
| $10,000 to $14,999 | 0 (0.0%) | 6 (13.6%) |
| $15,000 to $19,999 | 4 (2.4%) | 0 (0.0%) |
| $20,000 to $24,999 | 2 (1.2%) | 13 (29.5%) |
| $25,000 to $34,999 | 15 (8.9%) | 11 (25.0%) |
| $35,000 to $49,999 | 14 (8.3%) | 8 (18.2%) |
| $50,000 to $74,999 | 37 (22.0%) | 2 (4.5%) |
| $75,000 to $99,999 | 55 (32.7%) | 0 (0.0%) |
| $100,000 to $149,999 | 19 (11.3%) | 2 (4.5%) |
| $150,000 or more | 19 (11.3%) | 2 (4.5%) |
| Total | 168 (100.0%) | 44 (100.0%) |
Monthly Housing Cost Tiers in Sugar Grove borough
| Monthly Cost | Owner-occupied | Renter-occupied |
| Less than $300 | 16 (9.5%) | 0 (0.0%) |
| $300 to $499 | 39 (23.2%) | 0 (0.0%) |
| $500 to $799 | 25 (14.9%) | 27 (61.4%) |
| $800 to $999 | 14 (8.3%) | 3 (6.8%) |
| $1,000 to $1,499 | 56 (33.3%) | 2 (4.5%) |
| $1,500 to $1,999 | 15 (8.9%) | 0 (0.0%) |
| $2,000 to $2,499 | 3 (1.8%) | 0 (0.0%) |
| $2,500 to $2,999 | 0 (0.0%) | 0 (0.0%) |
| $3,000 or more | 0 (0.0%) | 0 (0.0%) |
| Total | 168 (100.0%) | 44 (100.0%) |
Physical Housing Characteristics in Sugar Grove borough
Housing Structures in Sugar Grove borough
| Structure Type | # Housing Units | % Housing Units |
| Single Unit, Detached | 157 | 74.1% |
| Single Unit, Attached | 1 | 0.5% |
| 2 Unit Apartments | 18 | 8.5% |
| 3 or 4 Unit Apartments | 15 | 7.1% |
| 5 to 9 Unit Apartments | 0 | 0.0% |
| 10 or more Apartments | 0 | 0.0% |
| Mobile Home / Other | 21 | 9.9% |
| Total | 212 | 100.0% |
Housing Structures by Occupancy in Sugar Grove borough
| Structure Type | Owner-occupied | Renter-occupied |
| Single Unit, Detached | 143 (91.1%) | 14 (8.9%) |
| Single Unit, Attached | 1 (100.0%) | 0 (0.0%) |
| 2 Unit Apartments | 10 (55.6%) | 8 (44.4%) |
| 3 or 4 Unit Apartments | 0 (0.0%) | 15 (100.0%) |
| 5 to 9 Unit Apartments | 0 (0.0%) | 0 (0.0%) |
| 10 or more Apartments | 0 (0.0%) | 0 (0.0%) |
| Mobile Home / Other | 14 (66.7%) | 7 (33.3%) |
| Total | 168 (79.2%) | 44 (20.7%) |
Housing Structures by Number of Rooms in Sugar Grove borough
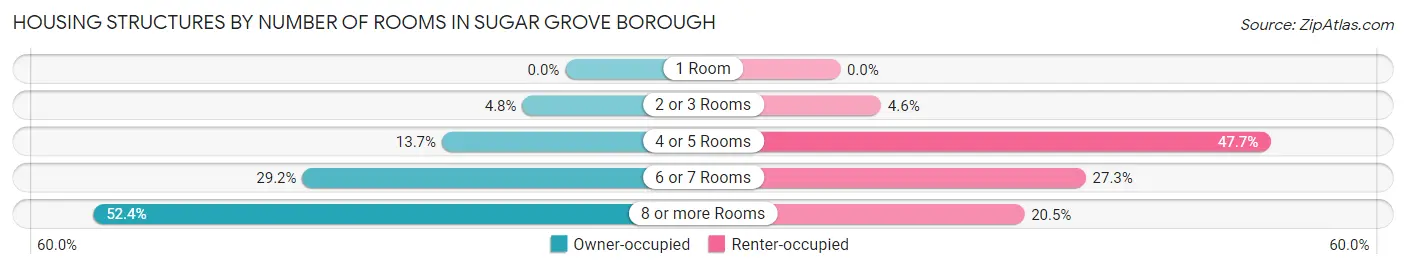
| Number of Rooms | Owner-occupied | Renter-occupied |
| 1 Room | 0 (0.0%) | 0 (0.0%) |
| 2 or 3 Rooms | 8 (4.8%) | 2 (4.5%) |
| 4 or 5 Rooms | 23 (13.7%) | 21 (47.7%) |
| 6 or 7 Rooms | 49 (29.2%) | 12 (27.3%) |
| 8 or more Rooms | 88 (52.4%) | 9 (20.4%) |
| Total | 168 (100.0%) | 44 (100.0%) |
Housing Structure by Heating Type in Sugar Grove borough
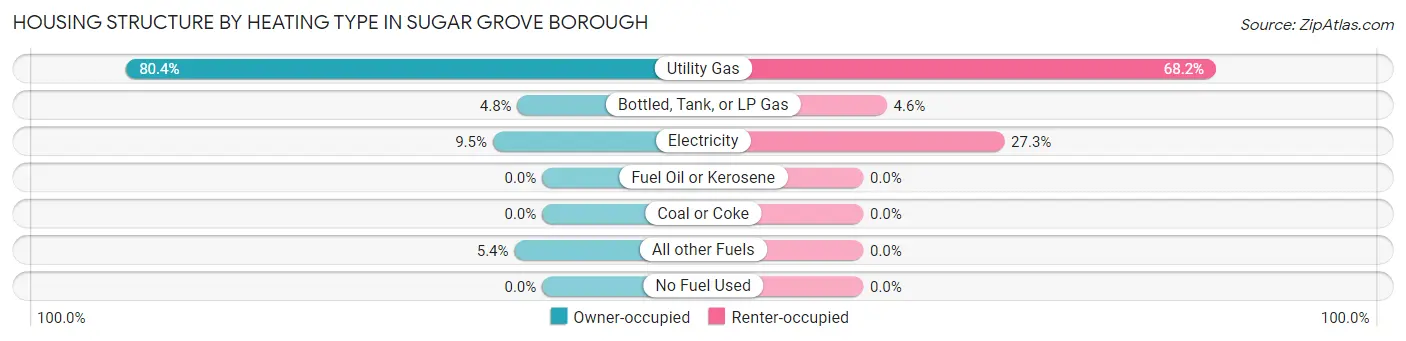
| Heating Type | Owner-occupied | Renter-occupied |
| Utility Gas | 135 (80.4%) | 30 (68.2%) |
| Bottled, Tank, or LP Gas | 8 (4.8%) | 2 (4.5%) |
| Electricity | 16 (9.5%) | 12 (27.3%) |
| Fuel Oil or Kerosene | 0 (0.0%) | 0 (0.0%) |
| Coal or Coke | 0 (0.0%) | 0 (0.0%) |
| All other Fuels | 9 (5.4%) | 0 (0.0%) |
| No Fuel Used | 0 (0.0%) | 0 (0.0%) |
| Total | 168 (100.0%) | 44 (100.0%) |
Household Vehicle Usage in Sugar Grove borough
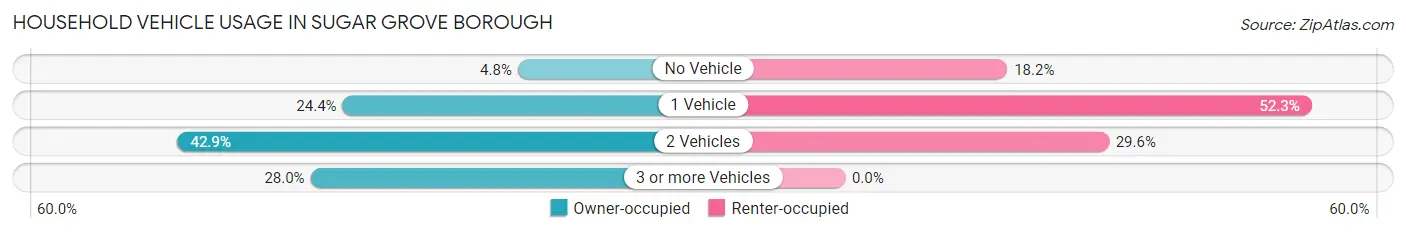
| Vehicles per Household | Owner-occupied | Renter-occupied |
| No Vehicle | 8 (4.8%) | 8 (18.2%) |
| 1 Vehicle | 41 (24.4%) | 23 (52.3%) |
| 2 Vehicles | 72 (42.9%) | 13 (29.5%) |
| 3 or more Vehicles | 47 (28.0%) | 0 (0.0%) |
| Total | 168 (100.0%) | 44 (100.0%) |
Real Estate & Mortgages in Sugar Grove borough
Real Estate and Mortgage Overview in Sugar Grove borough
| Characteristic | Without Mortgage | With Mortgage |
| Housing Units | 78 | 90 |
| Median Property Value | $123,300 | $124,200 |
| Median Household Income | $60,000 | $11 |
| Monthly Housing Costs | $441 | $0 |
| Real Estate Taxes | $1,413 | $0 |
Property Value by Mortgage Status in Sugar Grove borough
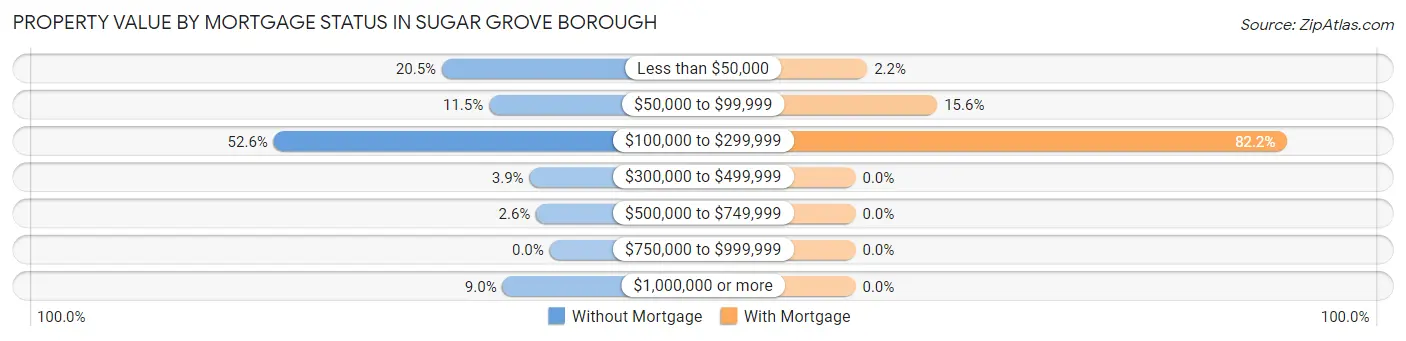
| Property Value | Without Mortgage | With Mortgage |
| Less than $50,000 | 16 (20.5%) | 2 (2.2%) |
| $50,000 to $99,999 | 9 (11.5%) | 14 (15.6%) |
| $100,000 to $299,999 | 41 (52.6%) | 74 (82.2%) |
| $300,000 to $499,999 | 3 (3.8%) | 0 (0.0%) |
| $500,000 to $749,999 | 2 (2.6%) | 0 (0.0%) |
| $750,000 to $999,999 | 0 (0.0%) | 0 (0.0%) |
| $1,000,000 or more | 7 (9.0%) | 0 (0.0%) |
| Total | 78 (100.0%) | 90 (100.0%) |
Household Income by Mortgage Status in Sugar Grove borough
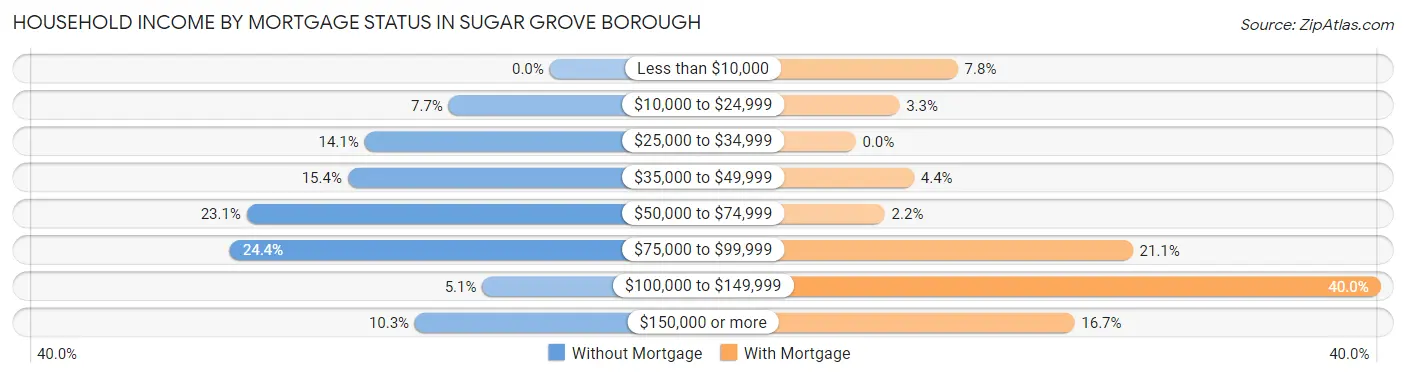
| Household Income | Without Mortgage | With Mortgage |
| Less than $10,000 | 0 (0.0%) | 7 (7.8%) |
| $10,000 to $24,999 | 6 (7.7%) | 3 (3.3%) |
| $25,000 to $34,999 | 11 (14.1%) | 0 (0.0%) |
| $35,000 to $49,999 | 12 (15.4%) | 4 (4.4%) |
| $50,000 to $74,999 | 18 (23.1%) | 2 (2.2%) |
| $75,000 to $99,999 | 19 (24.4%) | 19 (21.1%) |
| $100,000 to $149,999 | 4 (5.1%) | 36 (40.0%) |
| $150,000 or more | 8 (10.3%) | 15 (16.7%) |
| Total | 78 (100.0%) | 90 (100.0%) |
Property Value to Household Income Ratio in Sugar Grove borough
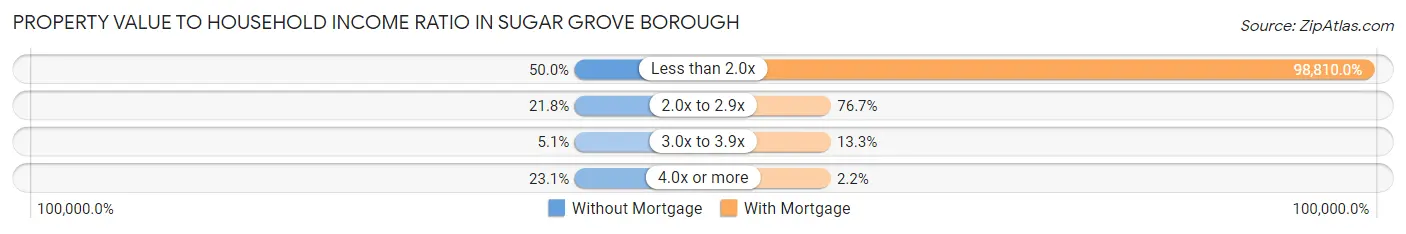
| Value-to-Income Ratio | Without Mortgage | With Mortgage |
| Less than 2.0x | 39 (50.0%) | 88,929 (98,810.0%) |
| 2.0x to 2.9x | 17 (21.8%) | 69 (76.7%) |
| 3.0x to 3.9x | 4 (5.1%) | 12 (13.3%) |
| 4.0x or more | 18 (23.1%) | 2 (2.2%) |
| Total | 78 (100.0%) | 90 (100.0%) |
Real Estate Taxes by Mortgage Status in Sugar Grove borough
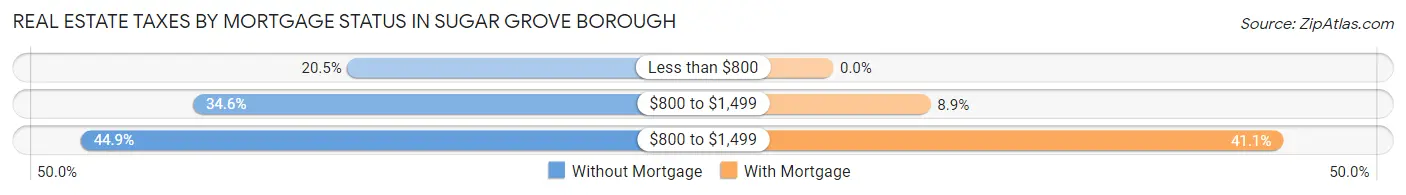
| Property Taxes | Without Mortgage | With Mortgage |
| Less than $800 | 16 (20.5%) | 0 (0.0%) |
| $800 to $1,499 | 27 (34.6%) | 8 (8.9%) |
| $800 to $1,499 | 35 (44.9%) | 37 (41.1%) |
| Total | 78 (100.0%) | 90 (100.0%) |
Health & Disability in Sugar Grove borough
Health Insurance Coverage by Age in Sugar Grove borough
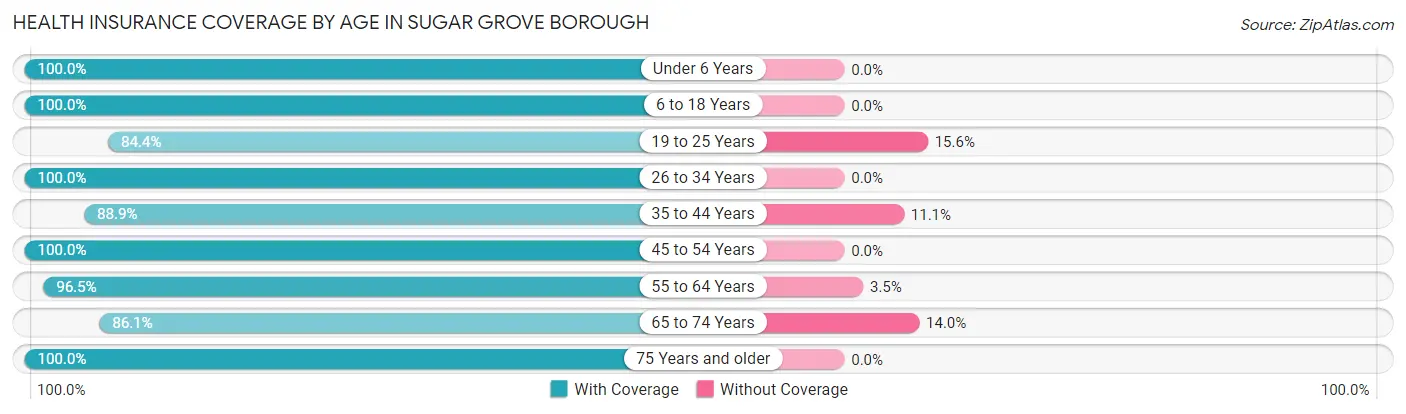
| Age Bracket | With Coverage | Without Coverage |
| Under 6 Years | 60 (100.0%) | 0 (0.0%) |
| 6 to 18 Years | 78 (100.0%) | 0 (0.0%) |
| 19 to 25 Years | 38 (84.4%) | 7 (15.6%) |
| 26 to 34 Years | 79 (100.0%) | 0 (0.0%) |
| 35 to 44 Years | 48 (88.9%) | 6 (11.1%) |
| 45 to 54 Years | 91 (100.0%) | 0 (0.0%) |
| 55 to 64 Years | 83 (96.5%) | 3 (3.5%) |
| 65 to 74 Years | 37 (86.1%) | 6 (14.0%) |
| 75 Years and older | 45 (100.0%) | 0 (0.0%) |
| Total | 559 (96.2%) | 22 (3.8%) |
Health Insurance Coverage by Citizenship Status in Sugar Grove borough

| Citizenship Status | With Coverage | Without Coverage |
| Native Born | 60 (100.0%) | 0 (0.0%) |
| Foreign Born, Citizen | 78 (100.0%) | 0 (0.0%) |
| Foreign Born, not a Citizen | 38 (84.4%) | 7 (15.6%) |
Health Insurance Coverage by Household Income in Sugar Grove borough
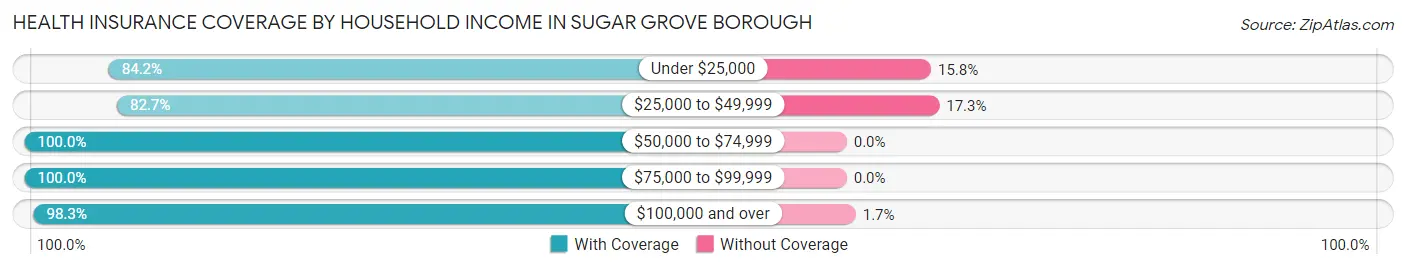
| Household Income | With Coverage | Without Coverage |
| Under $25,000 | 32 (84.2%) | 6 (15.8%) |
| $25,000 to $49,999 | 62 (82.7%) | 13 (17.3%) |
| $50,000 to $74,999 | 110 (100.0%) | 0 (0.0%) |
| $75,000 to $99,999 | 181 (100.0%) | 0 (0.0%) |
| $100,000 and over | 174 (98.3%) | 3 (1.7%) |
Public vs Private Health Insurance Coverage by Age in Sugar Grove borough
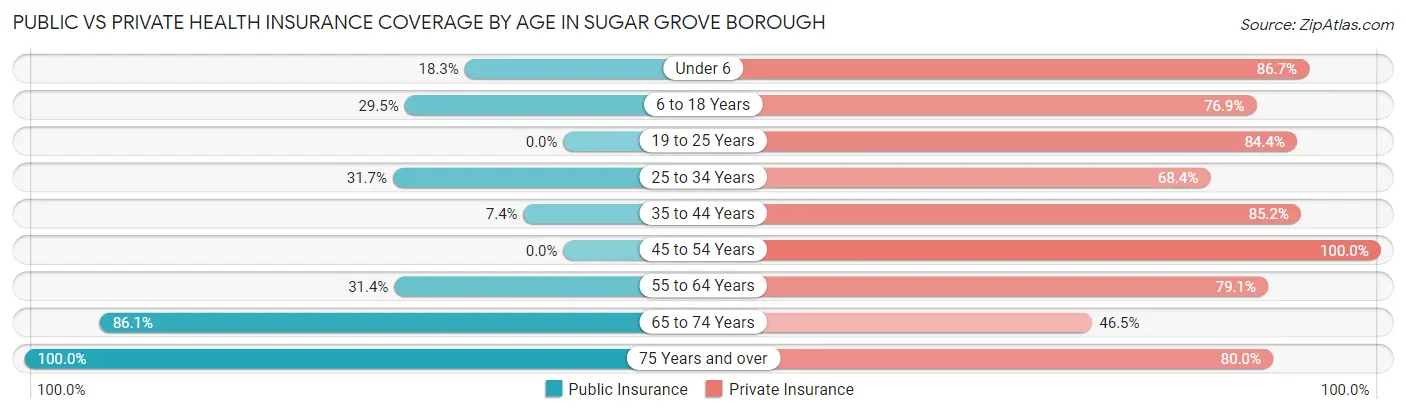
| Age Bracket | Public Insurance | Private Insurance |
| Under 6 | 11 (18.3%) | 52 (86.7%) |
| 6 to 18 Years | 23 (29.5%) | 60 (76.9%) |
| 19 to 25 Years | 0 (0.0%) | 38 (84.4%) |
| 25 to 34 Years | 25 (31.7%) | 54 (68.3%) |
| 35 to 44 Years | 4 (7.4%) | 46 (85.2%) |
| 45 to 54 Years | 0 (0.0%) | 91 (100.0%) |
| 55 to 64 Years | 27 (31.4%) | 68 (79.1%) |
| 65 to 74 Years | 37 (86.1%) | 20 (46.5%) |
| 75 Years and over | 45 (100.0%) | 36 (80.0%) |
| Total | 172 (29.6%) | 465 (80.0%) |
Disability Status by Sex by Age in Sugar Grove borough
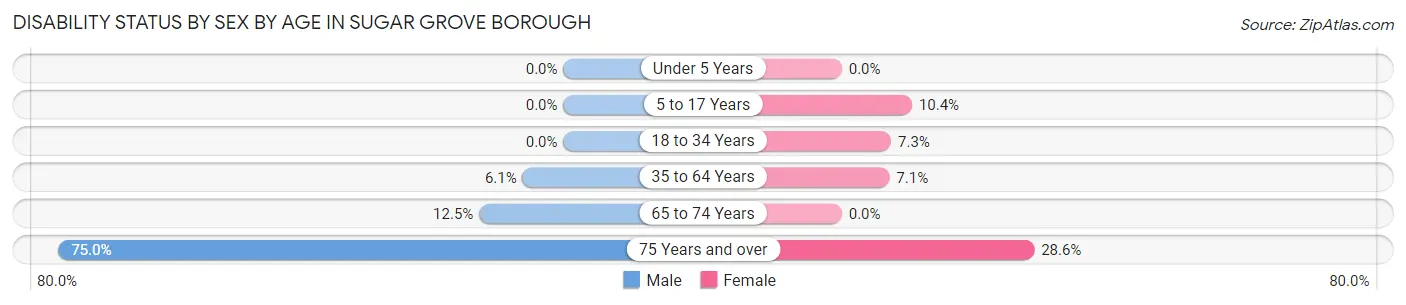
| Age Bracket | Male | Female |
| Under 5 Years | 0 (0.0%) | 0 (0.0%) |
| 5 to 17 Years | 0 (0.0%) | 5 (10.4%) |
| 18 to 34 Years | 0 (0.0%) | 6 (7.3%) |
| 35 to 64 Years | 8 (6.1%) | 7 (7.1%) |
| 65 to 74 Years | 3 (12.5%) | 0 (0.0%) |
| 75 Years and over | 18 (75.0%) | 6 (28.6%) |
Disability Class by Sex by Age in Sugar Grove borough
Disability Class: Hearing Difficulty
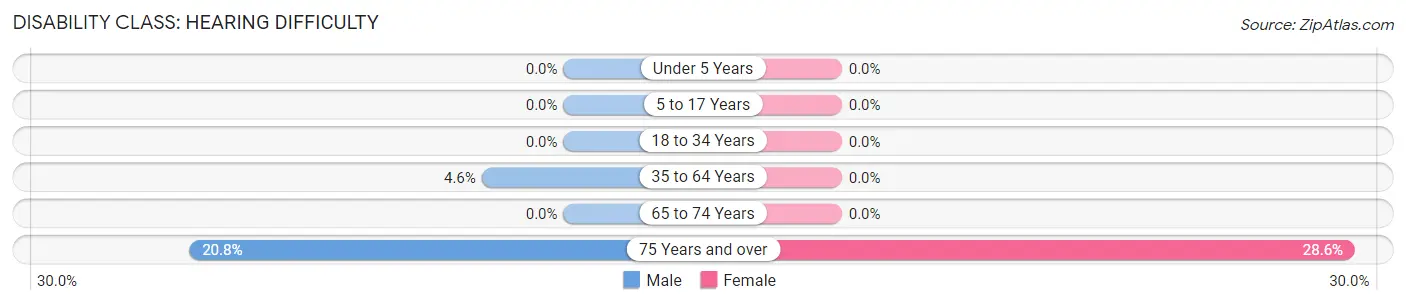
| Age Bracket | Male | Female |
| Under 5 Years | 0 (0.0%) | 0 (0.0%) |
| 5 to 17 Years | 0 (0.0%) | 0 (0.0%) |
| 18 to 34 Years | 0 (0.0%) | 0 (0.0%) |
| 35 to 64 Years | 6 (4.5%) | 0 (0.0%) |
| 65 to 74 Years | 0 (0.0%) | 0 (0.0%) |
| 75 Years and over | 5 (20.8%) | 6 (28.6%) |
Disability Class: Vision Difficulty
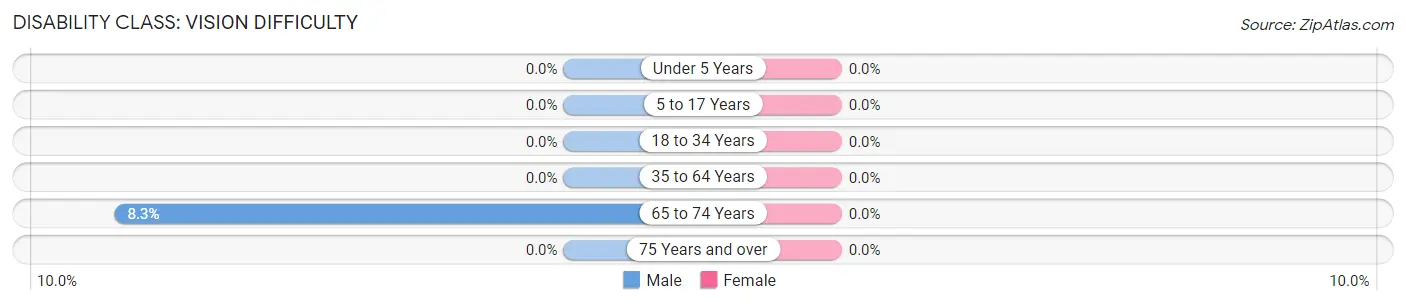
| Age Bracket | Male | Female |
| Under 5 Years | 0 (0.0%) | 0 (0.0%) |
| 5 to 17 Years | 0 (0.0%) | 0 (0.0%) |
| 18 to 34 Years | 0 (0.0%) | 0 (0.0%) |
| 35 to 64 Years | 0 (0.0%) | 0 (0.0%) |
| 65 to 74 Years | 2 (8.3%) | 0 (0.0%) |
| 75 Years and over | 0 (0.0%) | 0 (0.0%) |
Disability Class: Cognitive Difficulty
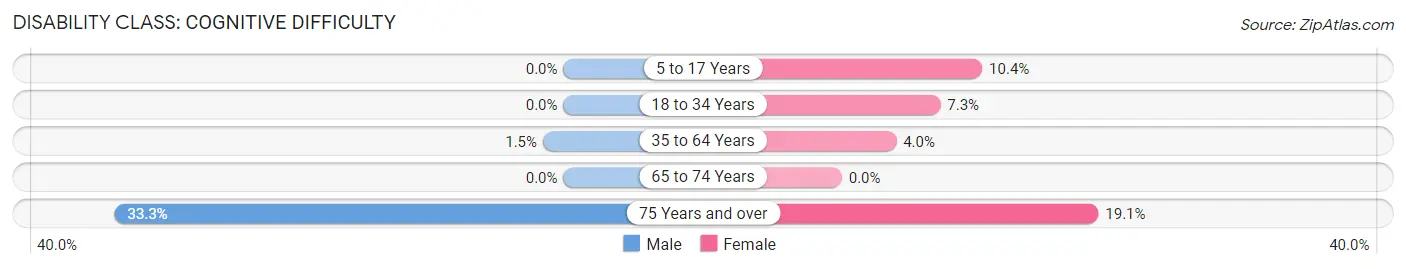
| Age Bracket | Male | Female |
| 5 to 17 Years | 0 (0.0%) | 5 (10.4%) |
| 18 to 34 Years | 0 (0.0%) | 6 (7.3%) |
| 35 to 64 Years | 2 (1.5%) | 4 (4.0%) |
| 65 to 74 Years | 0 (0.0%) | 0 (0.0%) |
| 75 Years and over | 8 (33.3%) | 4 (19.1%) |
Disability Class: Ambulatory Difficulty
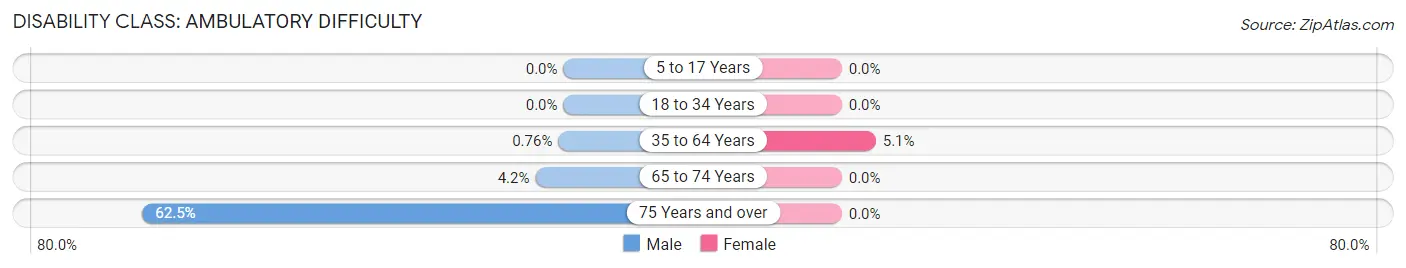
| Age Bracket | Male | Female |
| 5 to 17 Years | 0 (0.0%) | 0 (0.0%) |
| 18 to 34 Years | 0 (0.0%) | 0 (0.0%) |
| 35 to 64 Years | 1 (0.8%) | 5 (5.1%) |
| 65 to 74 Years | 1 (4.2%) | 0 (0.0%) |
| 75 Years and over | 15 (62.5%) | 0 (0.0%) |
Disability Class: Self-Care Difficulty
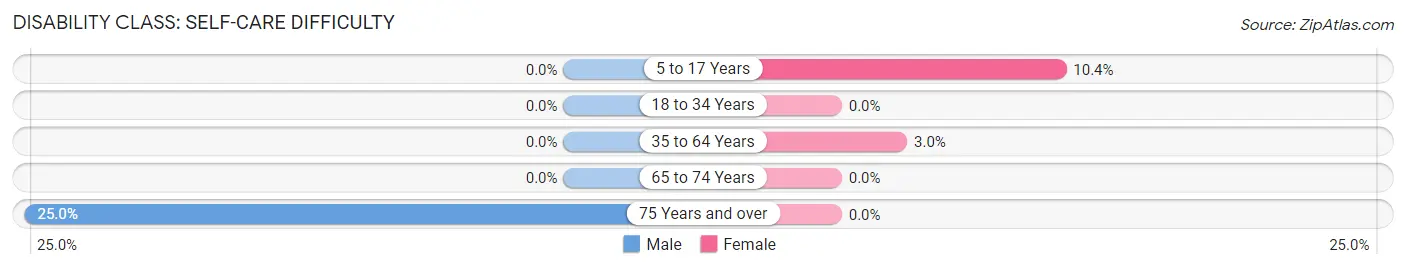
| Age Bracket | Male | Female |
| 5 to 17 Years | 0 (0.0%) | 5 (10.4%) |
| 18 to 34 Years | 0 (0.0%) | 0 (0.0%) |
| 35 to 64 Years | 0 (0.0%) | 3 (3.0%) |
| 65 to 74 Years | 0 (0.0%) | 0 (0.0%) |
| 75 Years and over | 6 (25.0%) | 0 (0.0%) |
Technology Access in Sugar Grove borough
Computing Device Access in Sugar Grove borough
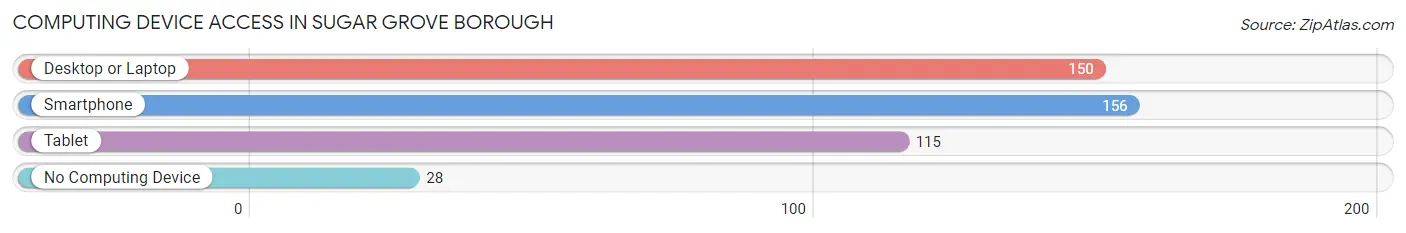
| Device Type | # Households | % Households |
| Desktop or Laptop | 150 | 70.8% |
| Smartphone | 156 | 73.6% |
| Tablet | 115 | 54.2% |
| No Computing Device | 28 | 13.2% |
| Total | 212 | 100.0% |
Internet Access in Sugar Grove borough
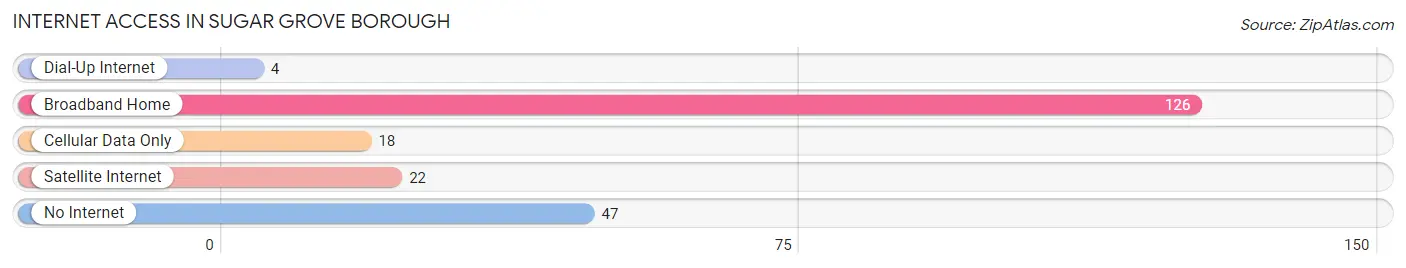
| Internet Type | # Households | % Households |
| Dial-Up Internet | 4 | 1.9% |
| Broadband Home | 126 | 59.4% |
| Cellular Data Only | 18 | 8.5% |
| Satellite Internet | 22 | 10.4% |
| No Internet | 47 | 22.2% |
| Total | 212 | 100.0% |
Sugar Grove borough Summary
Sugar Grove Borough is a small borough located in Warren County, Pennsylvania. It is situated in the northwestern corner of the state, approximately 30 miles south of the New York border. The borough is bordered by the townships of Conewango, Pleasant, and Freehold. As of the 2010 census, the population of Sugar Grove Borough was 1,093.
History
Sugar Grove Borough was first settled in the early 1800s by a group of settlers from New England. The area was originally known as “Sugar Grove” due to the abundance of maple trees in the area. The first post office was established in 1837 and the borough was officially incorporated in 1875.
The borough was an important stop on the Erie Railroad, which ran through the area from 1851 to 1952. The railroad was a major factor in the growth of the borough, as it allowed for the transportation of goods and people.
Geography
Sugar Grove Borough is located in the northwestern corner of Warren County, Pennsylvania. It is situated in the foothills of the Allegheny Mountains and is bordered by the townships of Conewango, Pleasant, and Freehold. The borough is approximately 30 miles south of the New York border.
The borough has a total area of 1.2 square miles, all of which is land. The terrain is mostly flat, with some rolling hills. The borough is located in a humid continental climate zone, with cold winters and hot, humid summers.
Economy
The economy of Sugar Grove Borough is largely based on agriculture and tourism. The borough is home to several small farms, which produce a variety of crops, including corn, soybeans, hay, and wheat. The borough is also home to several small businesses, including restaurants, retail stores, and service providers.
Tourism is an important part of the borough’s economy. The borough is home to several attractions, including the Sugar Grove Nature Center, which offers educational programs and outdoor activities. The borough is also home to several parks, including the Sugar Grove Park, which offers a variety of recreational activities.
Demographics
As of the 2010 census, the population of Sugar Grove Borough was 1,093. The population is predominantly white (97.2%), with a small percentage of African Americans (1.2%) and Hispanics (1.2%). The median household income is $41,250, and the median age is 43.
The borough is home to several churches, including the Sugar Grove United Methodist Church, the Sugar Grove Presbyterian Church, and the Sugar Grove Baptist Church. The borough is also home to several schools, including the Sugar Grove Elementary School, the Sugar Grove Middle School, and the Sugar Grove High School.
Common Questions
What is the Total Population of Sugar Grove borough?
Total Population of Sugar Grove borough is 581.
What is the Total Male Population of Sugar Grove borough?
Total Male Population of Sugar Grove borough is 310.
What is the Total Female Population of Sugar Grove borough?
Total Female Population of Sugar Grove borough is 271.
What is the Ratio of Males per 100 Females in Sugar Grove borough?
There are 114.39 Males per 100 Females in Sugar Grove borough.
What is the Ratio of Females per 100 Males in Sugar Grove borough?
There are 87.42 Females per 100 Males in Sugar Grove borough.
What is the Median Population Age in Sugar Grove borough?
Median Population Age in Sugar Grove borough is 42.2 Years.
What is the Average Family Size in Sugar Grove borough
Average Family Size in Sugar Grove borough is 3.3 People.
What is the Average Household Size in Sugar Grove borough
Average Household Size in Sugar Grove borough is 2.7 People.
What is Per Capita Income in Sugar Grove borough?
Per Capita income in Sugar Grove borough is $32,825.
What is the Median Family Income in Sugar Grove borough?
Median Family Income in Sugar Grove borough is $81,667.
What is the Median Household income in Sugar Grove borough?
Median Household Income in Sugar Grove borough is $68,056.
What is Income or Wage Gap in Sugar Grove borough?
Income or Wage Gap in Sugar Grove borough is 43.6%.
Women in Sugar Grove borough earn 56.4 cents for every dollar earned by a man.
What is Family Income Deficit in Sugar Grove borough?
Family Income Deficit in Sugar Grove borough is $5,986.
Families that are below poverty line in Sugar Grove borough earn $5,986 less on average than the poverty threshold level.
What is Inequality or Gini Index in Sugar Grove borough?
Inequality or Gini Index in Sugar Grove borough is 0.41.
How Large is the Labor Force in Sugar Grove borough?
There are 263 People in the Labor Forcein in Sugar Grove borough.
What is the Percentage of People in the Labor Force in Sugar Grove borough?
57.3% of People are in the Labor Force in Sugar Grove borough.
What is the Unemployment Rate in Sugar Grove borough?
Unemployment Rate in Sugar Grove borough is 0.4%.