State Line, PA
State Line Map
State Line Overview
3,395
TOTAL POPULATION
1,793
MALE POPULATION
1,602
FEMALE POPULATION
111.92
MALES / 100 FEMALES
89.35
FEMALES / 100 MALES
33.3
MEDIAN AGE
3.2
AVG FAMILY SIZE
2.8
AVG HOUSEHOLD SIZE
$32,738
PER CAPITA INCOME
$81,932
AVG FAMILY INCOME
$82,667
AVG HOUSEHOLD INCOME
12.1%
WAGE / INCOME GAP [ % ]
87.9¢/ $1
WAGE / INCOME GAP [ $ ]
0.33
INEQUALITY / GINI INDEX
1,830
LABOR FORCE [ PEOPLE ]
67.7%
PERCENT IN LABOR FORCE
1.0%
UNEMPLOYMENT RATE
State Line Zip Codes
State Line Area Codes
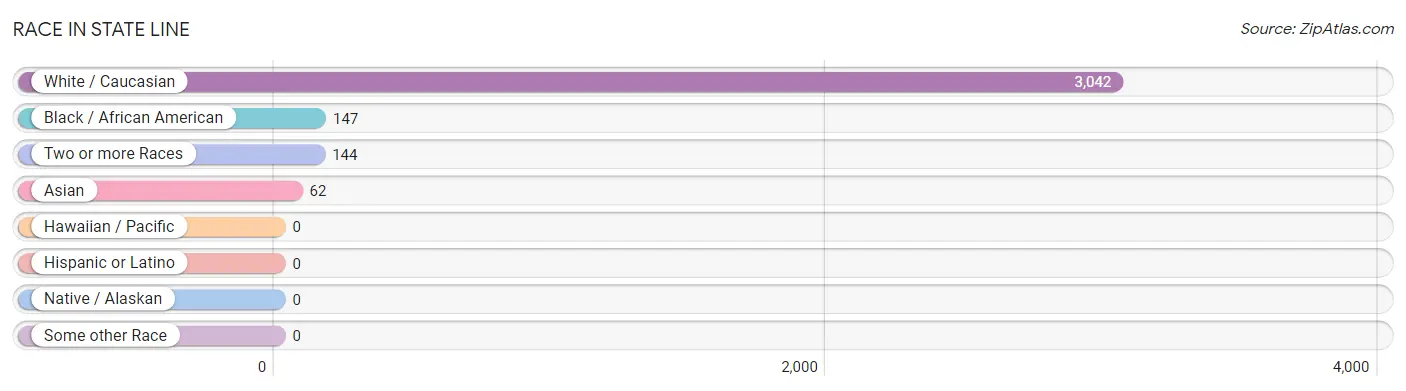
Race in State Line
The most populous races in State Line are White / Caucasian (3,042 | 89.6%), Black / African American (147 | 4.3%), and Two or more Races (144 | 4.2%).
| Race | # Population | % Population |
| Asian | 62 | 1.8% |
| Black / African American | 147 | 4.3% |
| Hawaiian / Pacific | 0 | 0.0% |
| Hispanic or Latino | 0 | 0.0% |
| Native / Alaskan | 0 | 0.0% |
| White / Caucasian | 3,042 | 89.6% |
| Two or more Races | 144 | 4.2% |
| Some other Race | 0 | 0.0% |
| Total | 3,395 | 100.0% |
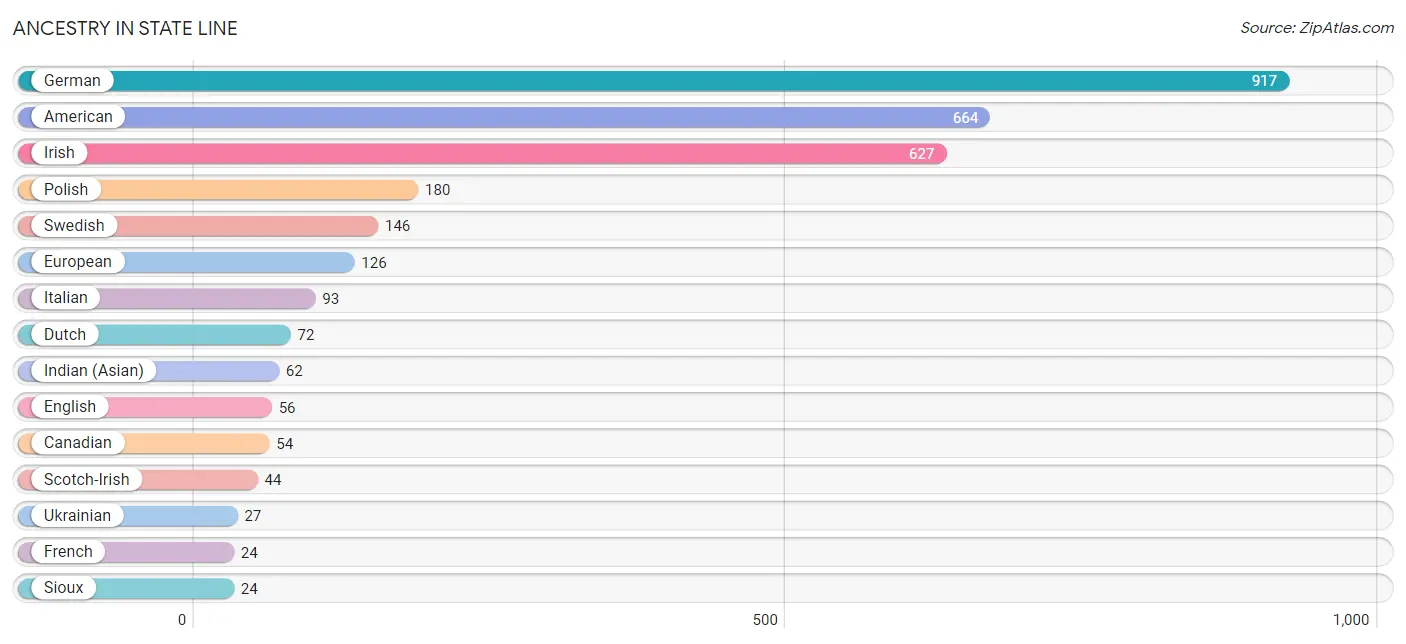
Ancestry in State Line
The most populous ancestries reported in State Line are German (917 | 27.0%), American (664 | 19.6%), Irish (627 | 18.5%), Polish (180 | 5.3%), and Swedish (146 | 4.3%), together accounting for 74.6% of all State Line residents.
| Ancestry | # Population | % Population |
| American | 664 | 19.6% |
| Canadian | 54 | 1.6% |
| Dutch | 72 | 2.1% |
| Eastern European | 14 | 0.4% |
| English | 56 | 1.7% |
| European | 126 | 3.7% |
| French | 24 | 0.7% |
| German | 917 | 27.0% |
| Indian (Asian) | 62 | 1.8% |
| Irish | 627 | 18.5% |
| Italian | 93 | 2.7% |
| Norwegian | 16 | 0.5% |
| Polish | 180 | 5.3% |
| Scotch-Irish | 44 | 1.3% |
| Scottish | 12 | 0.4% |
| Sioux | 24 | 0.7% |
| Swedish | 146 | 4.3% |
| Swiss | 16 | 0.5% |
| Ukrainian | 27 | 0.8% | View All 19 Rows |
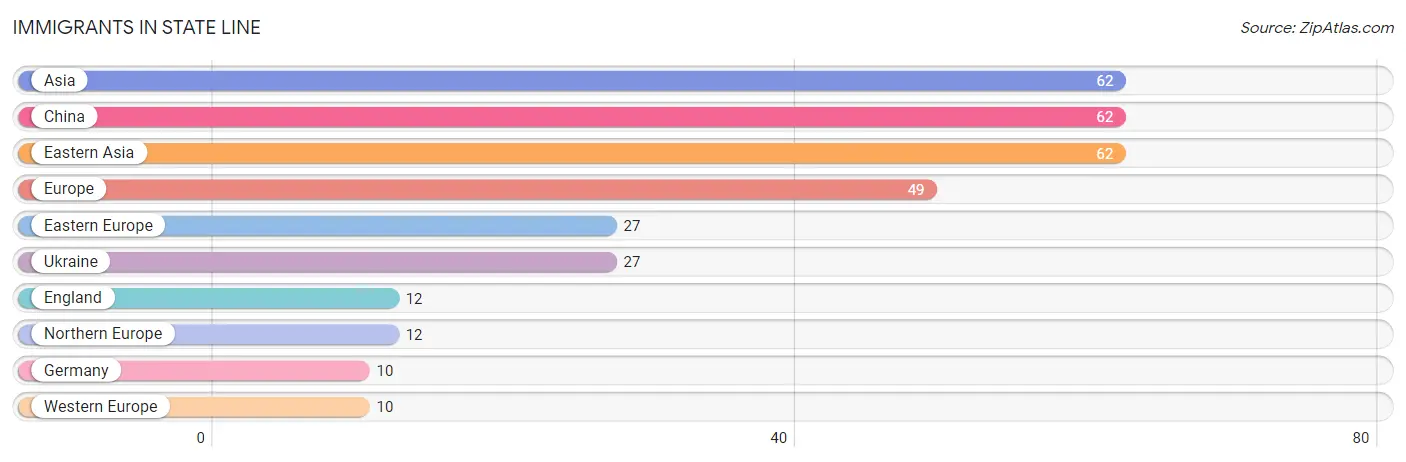
Immigrants in State Line
The most numerous immigrant groups reported in State Line came from Asia (62 | 1.8%), China (62 | 1.8%), Eastern Asia (62 | 1.8%), Europe (49 | 1.4%), and Eastern Europe (27 | 0.8%), together accounting for 7.7% of all State Line residents.
| Immigration Origin | # Population | % Population |
| Asia | 62 | 1.8% |
| China | 62 | 1.8% |
| Eastern Asia | 62 | 1.8% |
| Eastern Europe | 27 | 0.8% |
| England | 12 | 0.4% |
| Europe | 49 | 1.4% |
| Germany | 10 | 0.3% |
| Northern Europe | 12 | 0.4% |
| Ukraine | 27 | 0.8% |
| Western Europe | 10 | 0.3% | View All 10 Rows |
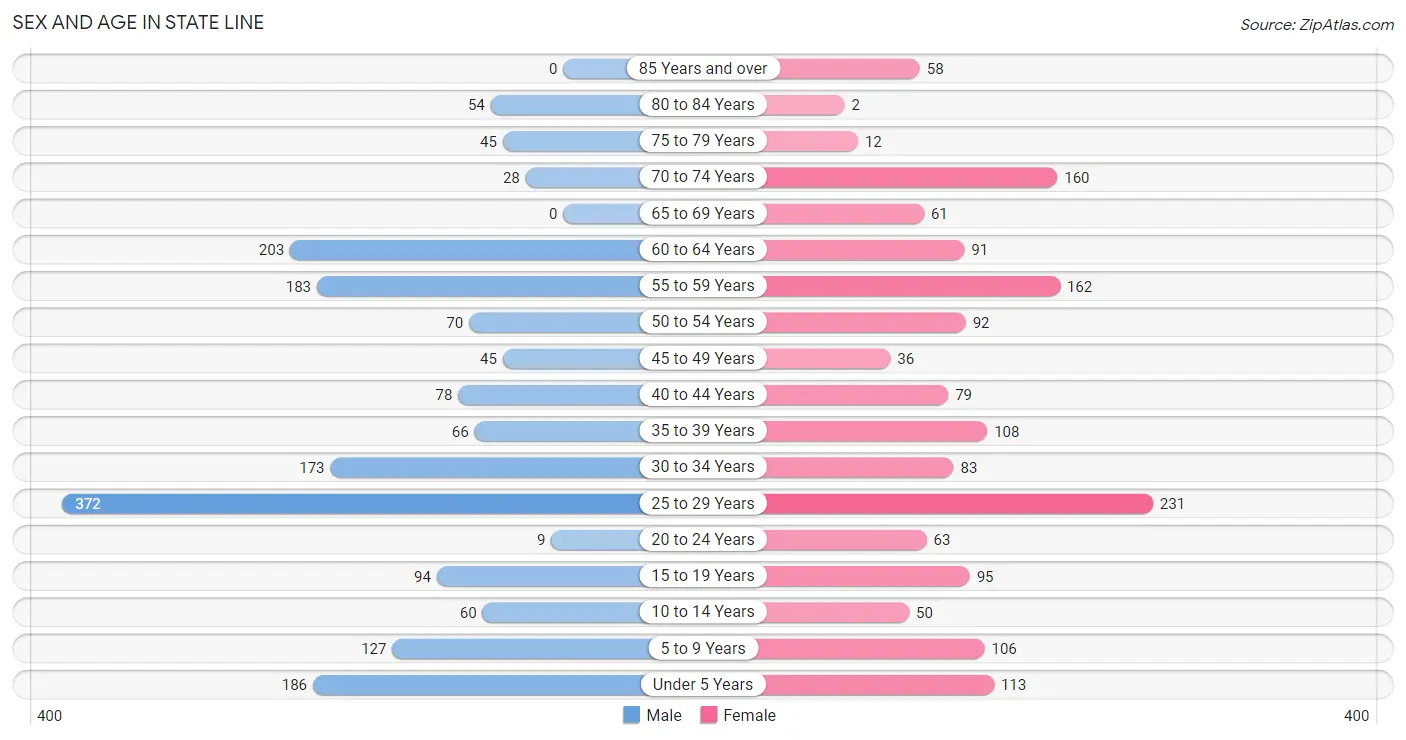
Sex and Age in State Line
Sex and Age in State Line
The most populous age groups in State Line are 25 to 29 Years (372 | 20.7%) for men and 25 to 29 Years (231 | 14.4%) for women.
| Age Bracket | Male | Female |
| Under 5 Years | 186 (10.4%) | 113 (7.0%) |
| 5 to 9 Years | 127 (7.1%) | 106 (6.6%) |
| 10 to 14 Years | 60 (3.4%) | 50 (3.1%) |
| 15 to 19 Years | 94 (5.2%) | 95 (5.9%) |
| 20 to 24 Years | 9 (0.5%) | 63 (3.9%) |
| 25 to 29 Years | 372 (20.7%) | 231 (14.4%) |
| 30 to 34 Years | 173 (9.7%) | 83 (5.2%) |
| 35 to 39 Years | 66 (3.7%) | 108 (6.7%) |
| 40 to 44 Years | 78 (4.3%) | 79 (4.9%) |
| 45 to 49 Years | 45 (2.5%) | 36 (2.2%) |
| 50 to 54 Years | 70 (3.9%) | 92 (5.7%) |
| 55 to 59 Years | 183 (10.2%) | 162 (10.1%) |
| 60 to 64 Years | 203 (11.3%) | 91 (5.7%) |
| 65 to 69 Years | 0 (0.0%) | 61 (3.8%) |
| 70 to 74 Years | 28 (1.6%) | 160 (10.0%) |
| 75 to 79 Years | 45 (2.5%) | 12 (0.7%) |
| 80 to 84 Years | 54 (3.0%) | 2 (0.1%) |
| 85 Years and over | 0 (0.0%) | 58 (3.6%) |
| Total | 1,793 (100.0%) | 1,602 (100.0%) |
Families and Households in State Line
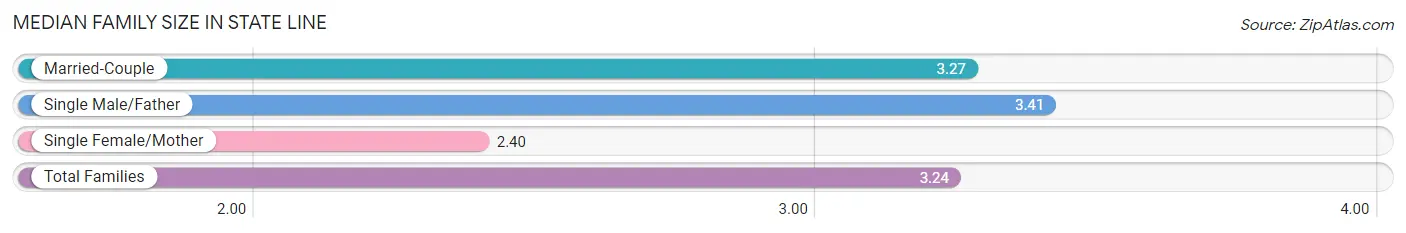
Median Family Size in State Line
The median family size in State Line is 3.24 persons per family, with single male/father families (99 | 10.6%) accounting for the largest median family size of 3.41 persons per family. On the other hand, single female/mother families (48 | 5.1%) represent the smallest median family size with 2.40 persons per family.
| Family Type | # Families | Family Size |
| Married-Couple | 790 (84.3%) | 3.27 |
| Single Male/Father | 99 (10.6%) | 3.41 |
| Single Female/Mother | 48 (5.1%) | 2.40 |
| Total Families | 937 (100.0%) | 3.24 |
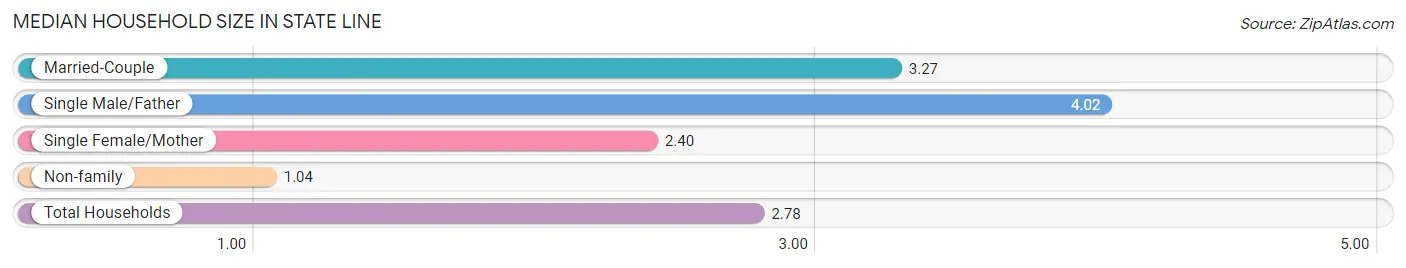
Median Household Size in State Line
The median household size in State Line is 2.78 persons per household, with single male/father households (99 | 8.1%) accounting for the largest median household size of 4.02 persons per household. non-family households (281 | 23.1%) represent the smallest median household size with 1.04 persons per household.
| Household Type | # Households | Household Size |
| Married-Couple | 790 (64.9%) | 3.27 |
| Single Male/Father | 99 (8.1%) | 4.02 |
| Single Female/Mother | 48 (3.9%) | 2.40 |
| Non-family | 281 (23.1%) | 1.04 |
| Total Households | 1,218 (100.0%) | 2.78 |
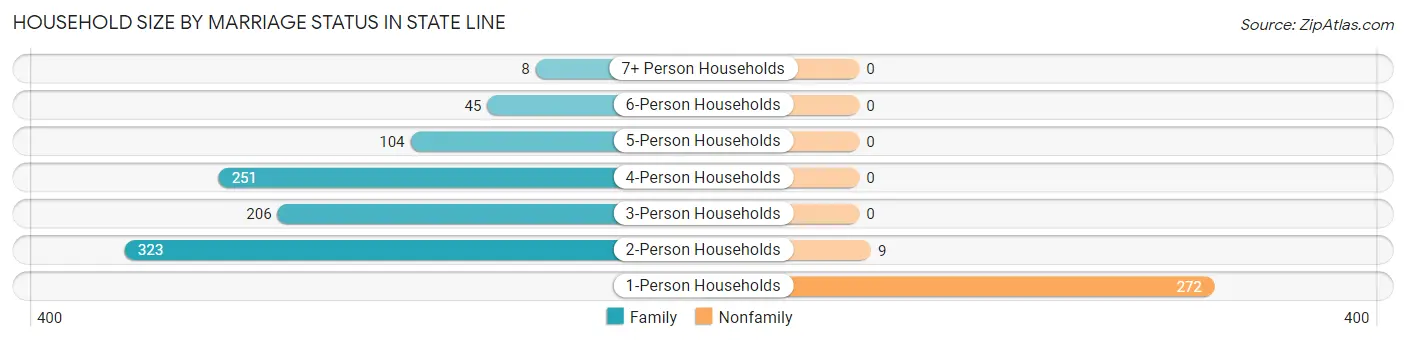
Household Size by Marriage Status in State Line
Out of a total of 1,218 households in State Line, 937 (76.9%) are family households, while 281 (23.1%) are nonfamily households. The most numerous type of family households are 2-person households, comprising 323, and the most common type of nonfamily households are 1-person households, comprising 272.
| Household Size | Family Households | Nonfamily Households |
| 1-Person Households | - | 272 (22.3%) |
| 2-Person Households | 323 (26.5%) | 9 (0.7%) |
| 3-Person Households | 206 (16.9%) | 0 (0.0%) |
| 4-Person Households | 251 (20.6%) | 0 (0.0%) |
| 5-Person Households | 104 (8.5%) | 0 (0.0%) |
| 6-Person Households | 45 (3.7%) | 0 (0.0%) |
| 7+ Person Households | 8 (0.7%) | 0 (0.0%) |
| Total | 937 (76.9%) | 281 (23.1%) |
Female Fertility in State Line
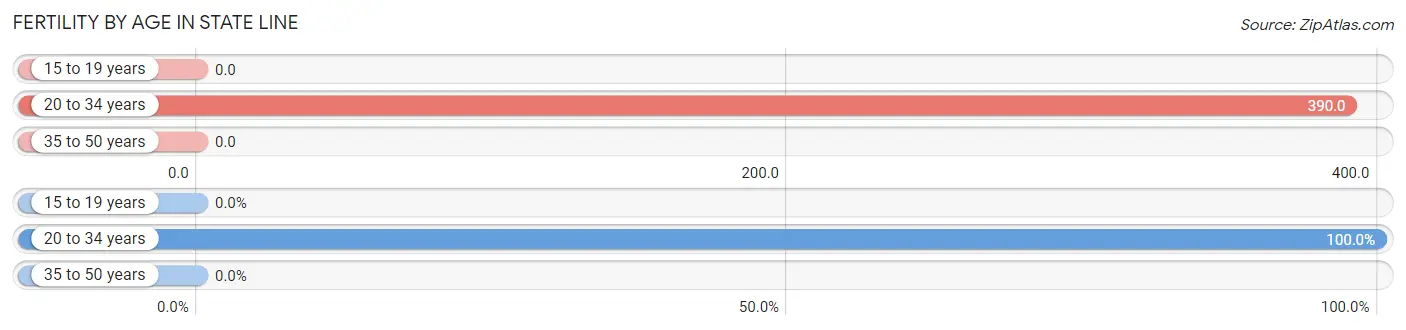
Fertility by Age in State Line
Average fertility rate in State Line is 212.0 births per 1,000 women. Women in the age bracket of 20 to 34 years have the highest fertility rate with 390.0 births per 1,000 women. Women in the age bracket of 20 to 34 years acount for 100.0% of all women with births.
| Age Bracket | Women with Births | Births / 1,000 Women |
| 15 to 19 years | 0 (0.0%) | 0.0 |
| 20 to 34 years | 147 (100.0%) | 390.0 |
| 35 to 50 years | 0 (0.0%) | 0.0 |
| Total | 147 (100.0%) | 212.0 |
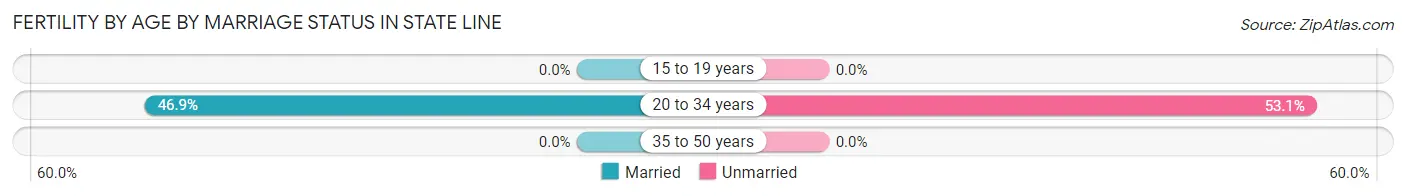
Fertility by Age by Marriage Status in State Line
46.9% of women with births (147) in State Line are married. The highest percentage of unmarried women with births falls into 20 to 34 years age bracket with 53.1% of them unmarried at the time of birth, while the lowest percentage of unmarried women with births belong to 20 to 34 years age bracket with 53.1% of them unmarried.
| Age Bracket | Married | Unmarried |
| 15 to 19 years | 0 (0.0%) | 0 (0.0%) |
| 20 to 34 years | 69 (46.9%) | 78 (53.1%) |
| 35 to 50 years | 0 (0.0%) | 0 (0.0%) |
| Total | 69 (46.9%) | 78 (53.1%) |
Fertility by Education in State Line
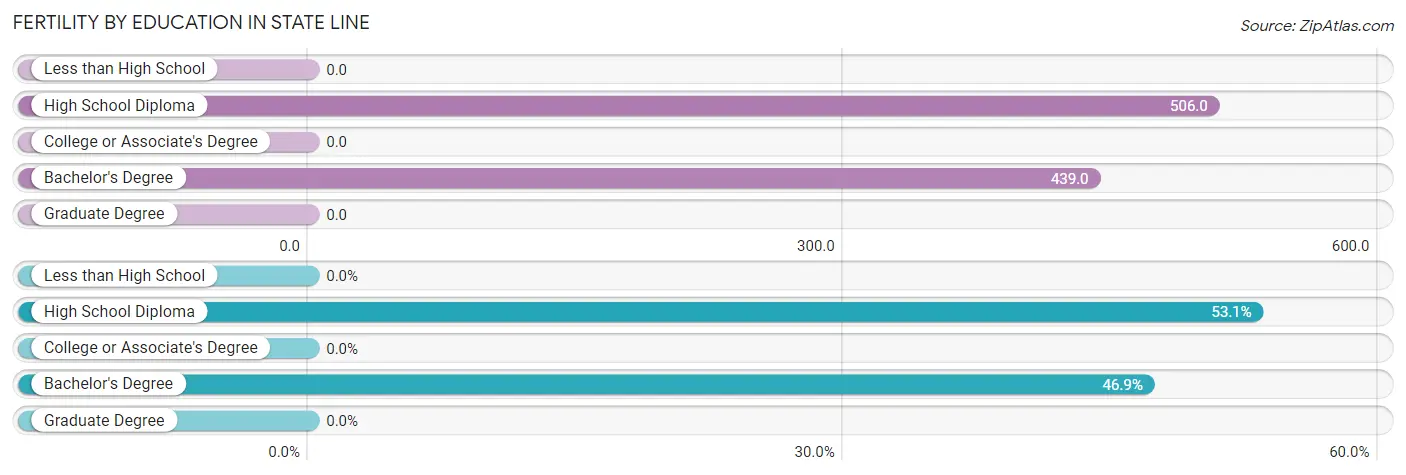
| Educational Attainment | Women with Births | Births / 1,000 Women |
| Less than High School | 0 (0.0%) | 0.0 |
| High School Diploma | 78 (53.1%) | 506.0 |
| College or Associate's Degree | 0 (0.0%) | 0.0 |
| Bachelor's Degree | 69 (46.9%) | 439.0 |
| Graduate Degree | 0 (0.0%) | 0.0 |
| Total | 147 (100.0%) | 212.0 |
Fertility by Education by Marriage Status in State Line
53.1% of women with births in State Line are unmarried. Women with the educational attainment of bachelor's degree are most likely to be married with 100.0% of them married at childbirth, while women with the educational attainment of high school diploma are least likely to be married with 100.0% of them unmarried at childbirth.
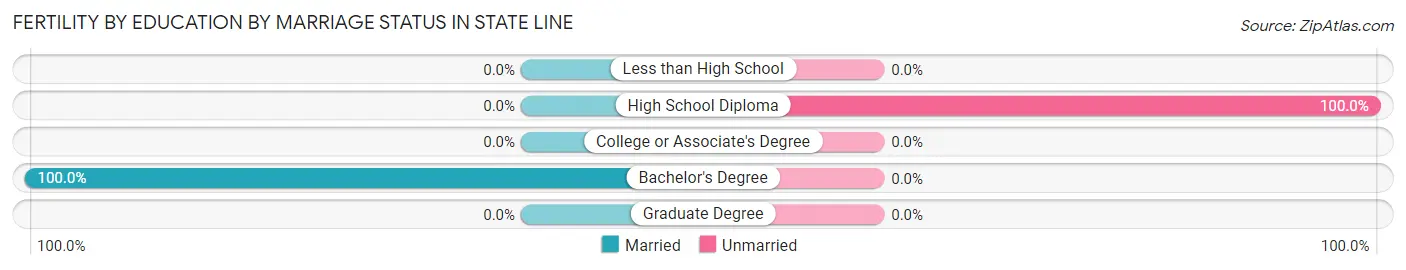
| Educational Attainment | Married | Unmarried |
| Less than High School | 0 (0.0%) | 0 (0.0%) |
| High School Diploma | 0 (0.0%) | 78 (100.0%) |
| College or Associate's Degree | 0 (0.0%) | 0 (0.0%) |
| Bachelor's Degree | 69 (100.0%) | 0 (0.0%) |
| Graduate Degree | 0 (0.0%) | 0 (0.0%) |
| Total | 69 (46.9%) | 78 (53.1%) |
Income in State Line
Income Overview in State Line
Per Capita Income in State Line is $32,738, while median incomes of families and households are $81,932 and $82,667 respectively.
| Characteristic | Number | Measure |
| Per Capita Income | 3,395 | $32,738 |
| Median Family Income | 937 | $81,932 |
| Mean Family Income | 937 | $96,472 |
| Median Household Income | 1,218 | $82,667 |
| Mean Household Income | 1,218 | $90,060 |
| Income Deficit | 937 | $0 |
| Wage / Income Gap (%) | 3,395 | 12.11% |
| Wage / Income Gap ($) | 3,395 | 87.89¢ per $1 |
| Gini / Inequality Index | 3,395 | 0.33 |
Earnings by Sex in State Line
Average Earnings in State Line are $47,439, $50,714 for men and $44,573 for women, a difference of 12.1%.
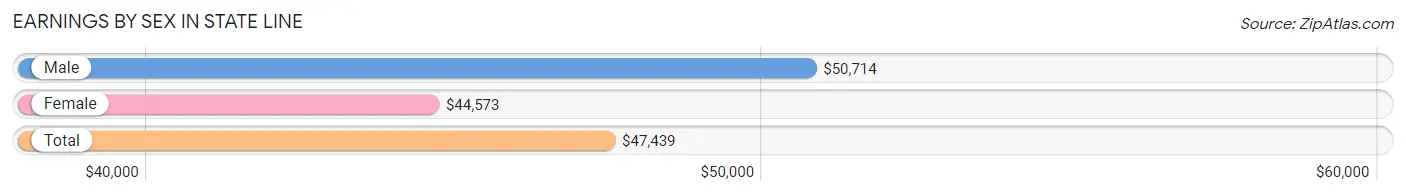
| Sex | Number | Average Earnings |
| Male | 1,130 (57.2%) | $50,714 |
| Female | 844 (42.8%) | $44,573 |
| Total | 1,974 (100.0%) | $47,439 |
Earnings by Sex by Income Bracket in State Line
The most common earnings brackets in State Line are $65,000 to $74,999 for men (189 | 16.7%) and $55,000 to $64,999 for women (141 | 16.7%).
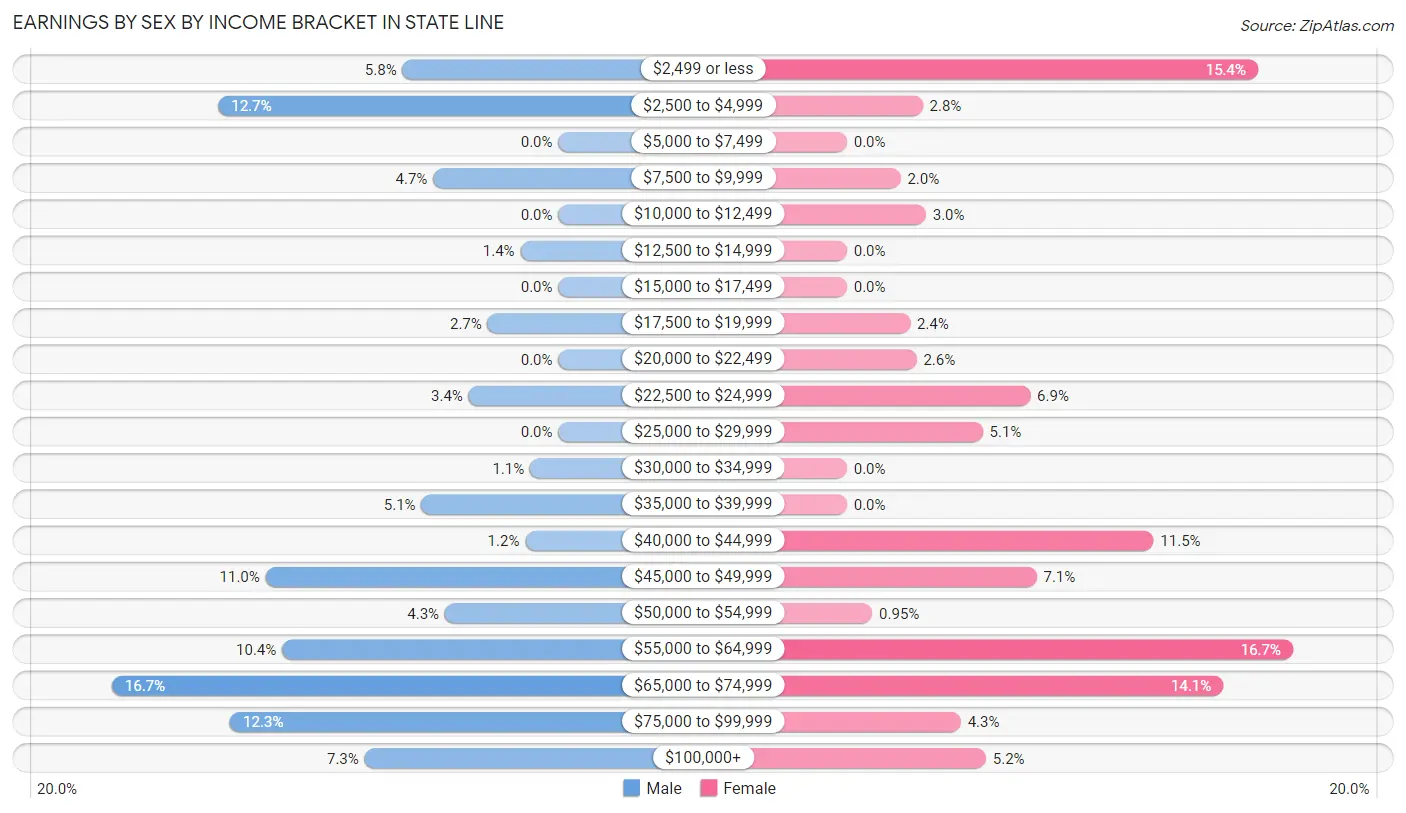
| Income | Male | Female |
| $2,499 or less | 66 (5.8%) | 130 (15.4%) |
| $2,500 to $4,999 | 144 (12.7%) | 24 (2.8%) |
| $5,000 to $7,499 | 0 (0.0%) | 0 (0.0%) |
| $7,500 to $9,999 | 53 (4.7%) | 17 (2.0%) |
| $10,000 to $12,499 | 0 (0.0%) | 25 (3.0%) |
| $12,500 to $14,999 | 16 (1.4%) | 0 (0.0%) |
| $15,000 to $17,499 | 0 (0.0%) | 0 (0.0%) |
| $17,500 to $19,999 | 30 (2.6%) | 20 (2.4%) |
| $20,000 to $22,499 | 0 (0.0%) | 22 (2.6%) |
| $22,500 to $24,999 | 38 (3.4%) | 58 (6.9%) |
| $25,000 to $29,999 | 0 (0.0%) | 43 (5.1%) |
| $30,000 to $34,999 | 12 (1.1%) | 0 (0.0%) |
| $35,000 to $39,999 | 58 (5.1%) | 0 (0.0%) |
| $40,000 to $44,999 | 14 (1.2%) | 97 (11.5%) |
| $45,000 to $49,999 | 124 (11.0%) | 60 (7.1%) |
| $50,000 to $54,999 | 48 (4.3%) | 8 (0.9%) |
| $55,000 to $64,999 | 117 (10.3%) | 141 (16.7%) |
| $65,000 to $74,999 | 189 (16.7%) | 119 (14.1%) |
| $75,000 to $99,999 | 139 (12.3%) | 36 (4.3%) |
| $100,000+ | 82 (7.3%) | 44 (5.2%) |
| Total | 1,130 (100.0%) | 844 (100.0%) |
Earnings by Sex by Educational Attainment in State Line
Average earnings in State Line are $54,038 for men and $46,694 for women, a difference of 13.6%. Men with an educational attainment of high school diploma enjoy the highest average annual earnings of $59,318, while those with high school diploma education earn the least with $59,318. Women with an educational attainment of graduate degree earn the most with the average annual earnings of $68,077, while those with bachelor's degree education have the smallest earnings of $56,232.
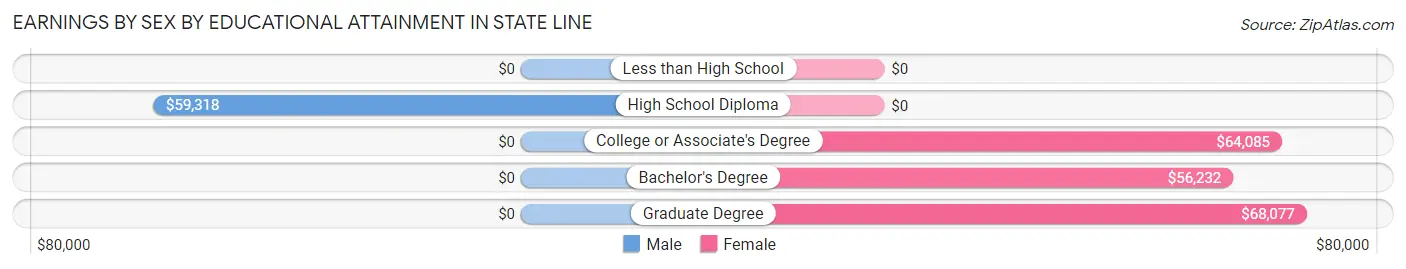
| Educational Attainment | Male Income | Female Income |
| Less than High School | - | - |
| High School Diploma | $59,318 | $0 |
| College or Associate's Degree | - | - |
| Bachelor's Degree | - | - |
| Graduate Degree | - | - |
| Total | $54,038 | $46,694 |
Family Income in State Line
Family Income Brackets in State Line
According to the State Line family income data, there are 251 families falling into the $50,000 to $74,999 income range, which is the most common income bracket and makes up 26.8% of all families.
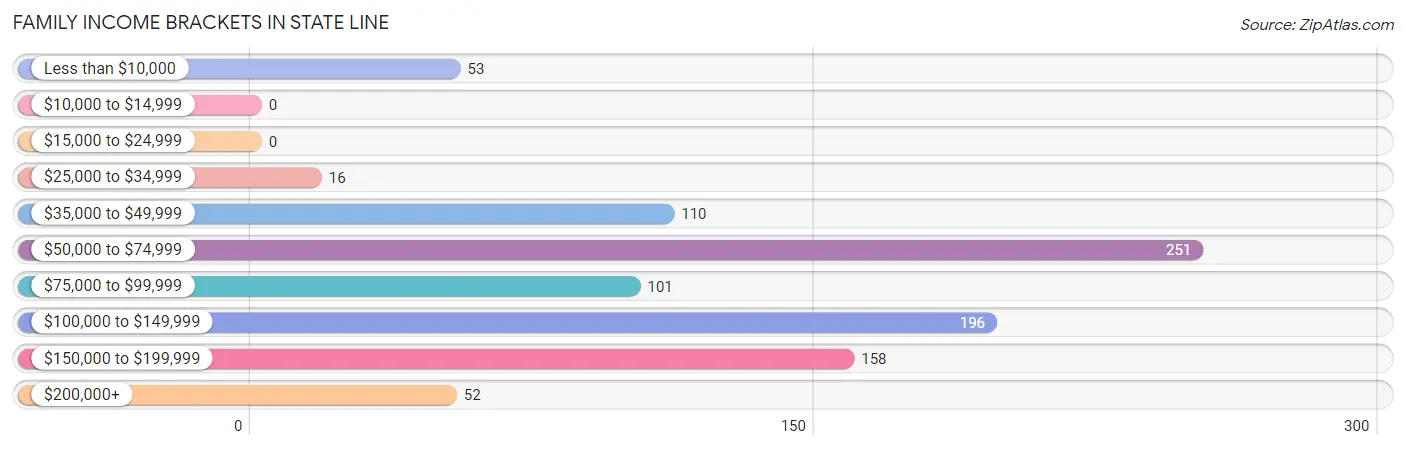
| Income Bracket | # Families | % Families |
| Less than $10,000 | 53 | 5.7% |
| $10,000 to $14,999 | 0 | 0.0% |
| $15,000 to $24,999 | 0 | 0.0% |
| $25,000 to $34,999 | 16 | 1.7% |
| $35,000 to $49,999 | 110 | 11.7% |
| $50,000 to $74,999 | 251 | 26.8% |
| $75,000 to $99,999 | 101 | 10.8% |
| $100,000 to $149,999 | 196 | 20.9% |
| $150,000 to $199,999 | 158 | 16.9% |
| $200,000+ | 52 | 5.5% |
Family Income by Famaliy Size in State Line
4-person families (198 | 21.1%) account for the highest median family income in State Line with $121,607 per family, while 2-person families (323 | 34.5%) have the highest median income of $38,906 per family member.
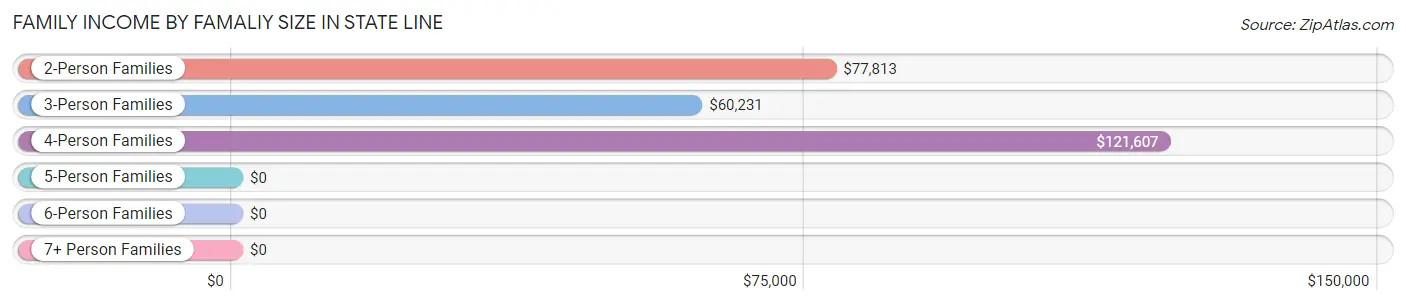
| Income Bracket | # Families | Median Income |
| 2-Person Families | 323 (34.5%) | $77,813 |
| 3-Person Families | 259 (27.6%) | $60,231 |
| 4-Person Families | 198 (21.1%) | $121,607 |
| 5-Person Families | 104 (11.1%) | $0 |
| 6-Person Families | 45 (4.8%) | $0 |
| 7+ Person Families | 8 (0.9%) | $0 |
| Total | 937 (100.0%) | $81,932 |
Family Income by Number of Earners in State Line
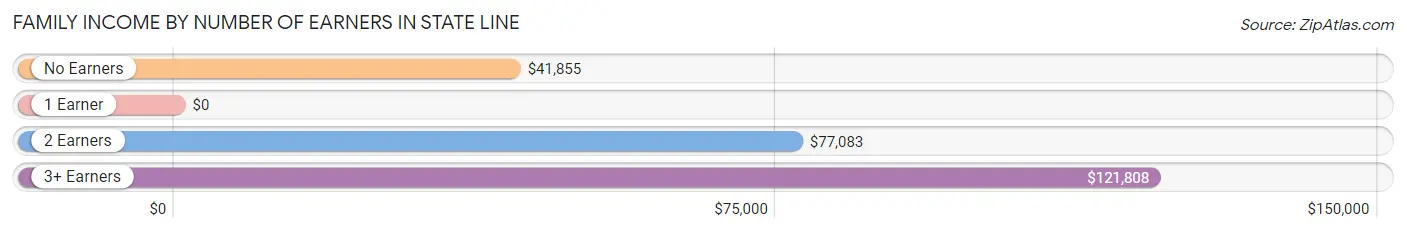
| Number of Earners | # Families | Median Income |
| No Earners | 95 (10.1%) | $41,855 |
| 1 Earner | 167 (17.8%) | $0 |
| 2 Earners | 478 (51.0%) | $77,083 |
| 3+ Earners | 197 (21.0%) | $121,808 |
| Total | 937 (100.0%) | $81,932 |
Household Income in State Line
Household Income Brackets in State Line
With 294 households falling in the category, the $50,000 to $74,999 income range is the most frequent in State Line, accounting for 24.1% of all households.
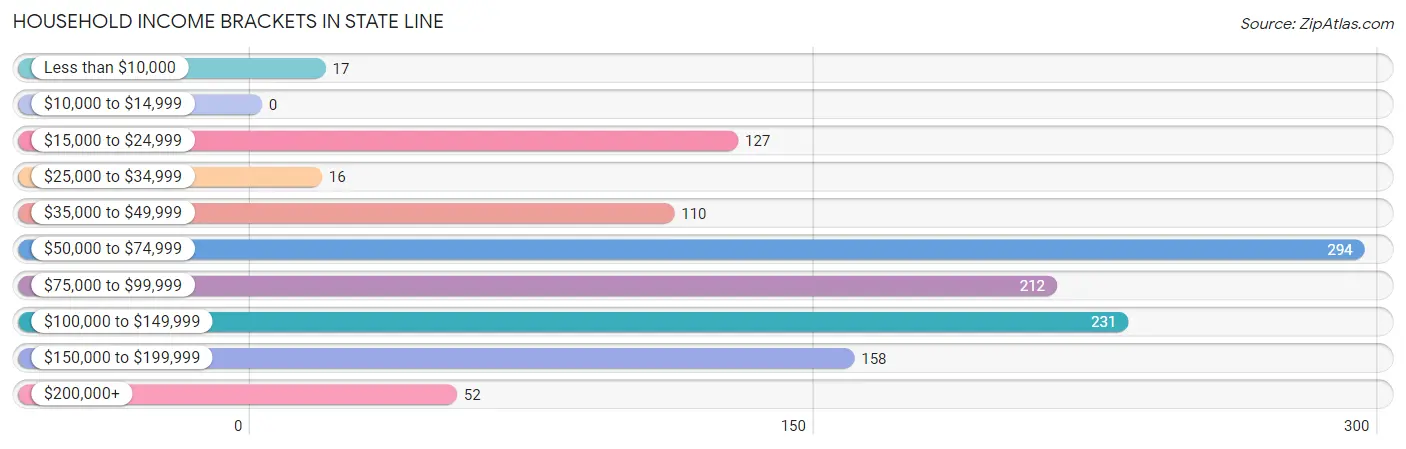
| Income Bracket | # Households | % Households |
| Less than $10,000 | 17 | 1.4% |
| $10,000 to $14,999 | 0 | 0.0% |
| $15,000 to $24,999 | 127 | 10.4% |
| $25,000 to $34,999 | 16 | 1.3% |
| $35,000 to $49,999 | 110 | 9.0% |
| $50,000 to $74,999 | 294 | 24.1% |
| $75,000 to $99,999 | 212 | 17.4% |
| $100,000 to $149,999 | 231 | 19.0% |
| $150,000 to $199,999 | 158 | 13.0% |
| $200,000+ | 52 | 4.3% |
Household Income by Householder Age in State Line
The median household income in State Line is $82,667, with the highest median household income of $88,108 found in the 25 to 44 years age bracket for the primary householder. A total of 494 households (40.6%) fall into this category.
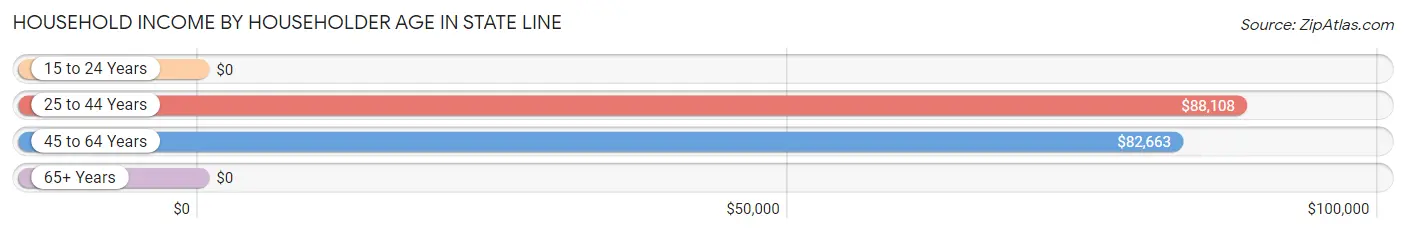
| Income Bracket | # Households | Median Income |
| 15 to 24 Years | 0 (0.0%) | $0 |
| 25 to 44 Years | 494 (40.6%) | $88,108 |
| 45 to 64 Years | 490 (40.2%) | $82,663 |
| 65+ Years | 234 (19.2%) | $0 |
| Total | 1,218 (100.0%) | $82,667 |
Poverty in State Line
Income Below Poverty by Sex and Age in State Line
With 7.4% poverty level for males and 10.1% for females among the residents of State Line, 5 year old males and under 5 year old females are the most vulnerable to poverty, with 13 males (100.0%) and 55 females (48.7%) in their respective age groups living below the poverty level.
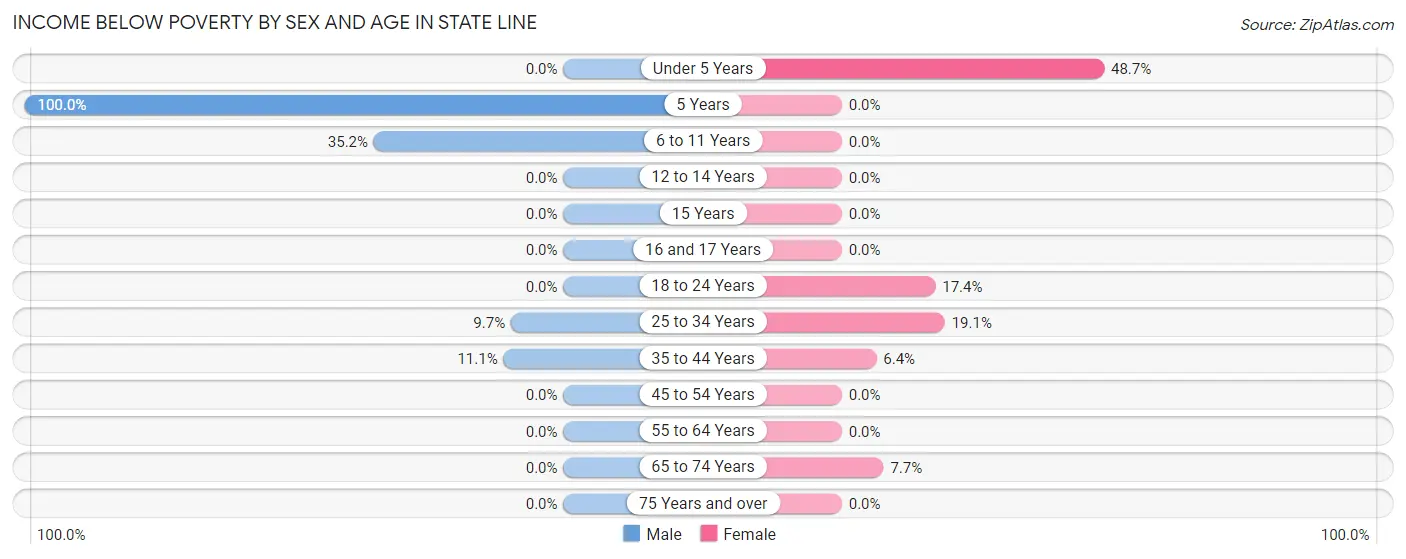
| Age Bracket | Male | Female |
| Under 5 Years | 0 (0.0%) | 55 (48.7%) |
| 5 Years | 13 (100.0%) | 0 (0.0%) |
| 6 to 11 Years | 51 (35.2%) | 0 (0.0%) |
| 12 to 14 Years | 0 (0.0%) | 0 (0.0%) |
| 15 Years | 0 (0.0%) | 0 (0.0%) |
| 16 and 17 Years | 0 (0.0%) | 0 (0.0%) |
| 18 to 24 Years | 0 (0.0%) | 17 (17.3%) |
| 25 to 34 Years | 53 (9.7%) | 60 (19.1%) |
| 35 to 44 Years | 16 (11.1%) | 12 (6.4%) |
| 45 to 54 Years | 0 (0.0%) | 0 (0.0%) |
| 55 to 64 Years | 0 (0.0%) | 0 (0.0%) |
| 65 to 74 Years | 0 (0.0%) | 17 (7.7%) |
| 75 Years and over | 0 (0.0%) | 0 (0.0%) |
| Total | 133 (7.4%) | 161 (10.1%) |
Income Above Poverty by Sex and Age in State Line
According to the poverty statistics in State Line, males aged under 5 years and females aged 5 years are the age groups that are most secure financially, with 100.0% of males and 100.0% of females in these age groups living above the poverty line.
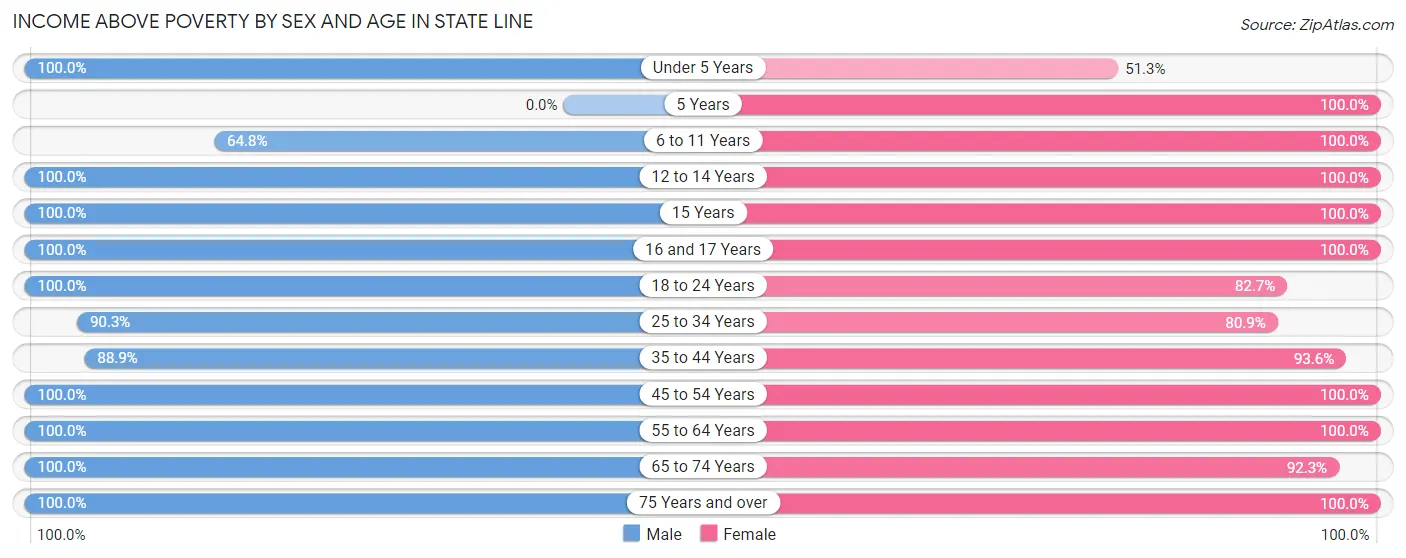
| Age Bracket | Male | Female |
| Under 5 Years | 186 (100.0%) | 58 (51.3%) |
| 5 Years | 0 (0.0%) | 25 (100.0%) |
| 6 to 11 Years | 94 (64.8%) | 118 (100.0%) |
| 12 to 14 Years | 29 (100.0%) | 13 (100.0%) |
| 15 Years | 37 (100.0%) | 13 (100.0%) |
| 16 and 17 Years | 9 (100.0%) | 47 (100.0%) |
| 18 to 24 Years | 57 (100.0%) | 81 (82.7%) |
| 25 to 34 Years | 492 (90.3%) | 254 (80.9%) |
| 35 to 44 Years | 128 (88.9%) | 175 (93.6%) |
| 45 to 54 Years | 115 (100.0%) | 128 (100.0%) |
| 55 to 64 Years | 386 (100.0%) | 253 (100.0%) |
| 65 to 74 Years | 28 (100.0%) | 203 (92.3%) |
| 75 Years and over | 99 (100.0%) | 66 (100.0%) |
| Total | 1,660 (92.6%) | 1,434 (89.9%) |
Income Below Poverty Among Married-Couple Families in State Line
The poverty statistics for married-couple families in State Line show that 2.0% or 16 of the total 790 families live below the poverty line. Families with 1 or 2 children have the highest poverty rate of 4.6%, comprising of 16 families. On the other hand, families with no children have the lowest poverty rate of 0.0%, which includes 0 families.
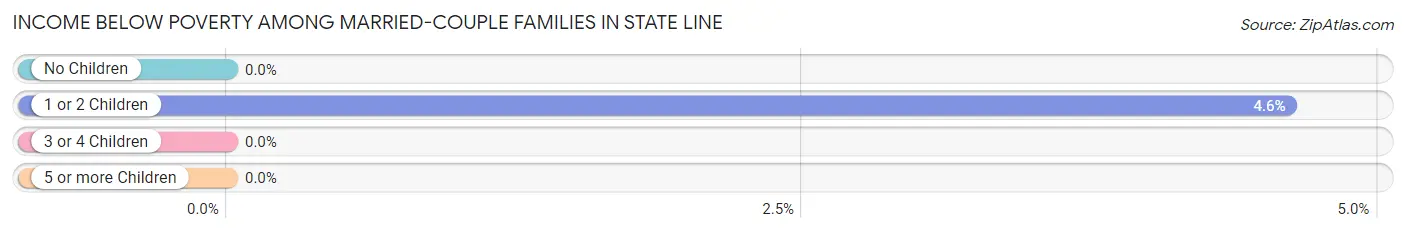
| Children | Above Poverty | Below Poverty |
| No Children | 415 (100.0%) | 0 (0.0%) |
| 1 or 2 Children | 331 (95.4%) | 16 (4.6%) |
| 3 or 4 Children | 20 (100.0%) | 0 (0.0%) |
| 5 or more Children | 8 (100.0%) | 0 (0.0%) |
| Total | 774 (98.0%) | 16 (2.0%) |
Income Below Poverty Among Single-Parent Households in State Line
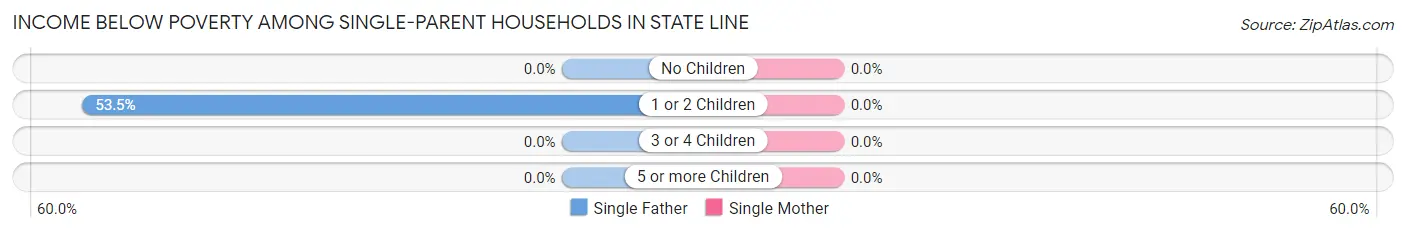
| Children | Single Father | Single Mother |
| No Children | 0 (0.0%) | 0 (0.0%) |
| 1 or 2 Children | 53 (53.5%) | 0 (0.0%) |
| 3 or 4 Children | 0 (0.0%) | 0 (0.0%) |
| 5 or more Children | 0 (0.0%) | 0 (0.0%) |
| Total | 53 (53.5%) | 0 (0.0%) |
Income Below Poverty Among Married-Couple vs Single-Parent Households in State Line
The poverty data for State Line shows that 16 of the married-couple family households (2.0%) and 53 of the single-parent households (36.0%) are living below the poverty level. Within the married-couple family households, those with 1 or 2 children have the highest poverty rate, with 16 households (4.6%) falling below the poverty line. Among the single-parent households, those with 1 or 2 children have the highest poverty rate, with 53 household (53.5%) living below poverty.
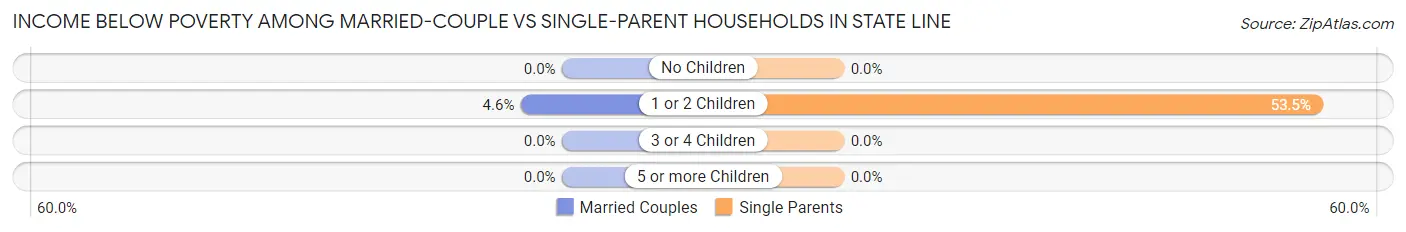
| Children | Married-Couple Families | Single-Parent Households |
| No Children | 0 (0.0%) | 0 (0.0%) |
| 1 or 2 Children | 16 (4.6%) | 53 (53.5%) |
| 3 or 4 Children | 0 (0.0%) | 0 (0.0%) |
| 5 or more Children | 0 (0.0%) | 0 (0.0%) |
| Total | 16 (2.0%) | 53 (36.0%) |
Employment Characteristics in State Line
Employment by Class of Employer in State Line
Among the 1,704 employed individuals in State Line, private company employees (1,060 | 62.2%), local government employees (243 | 14.3%), and not-for-profit organizations (160 | 9.4%) make up the most common classes of employment.
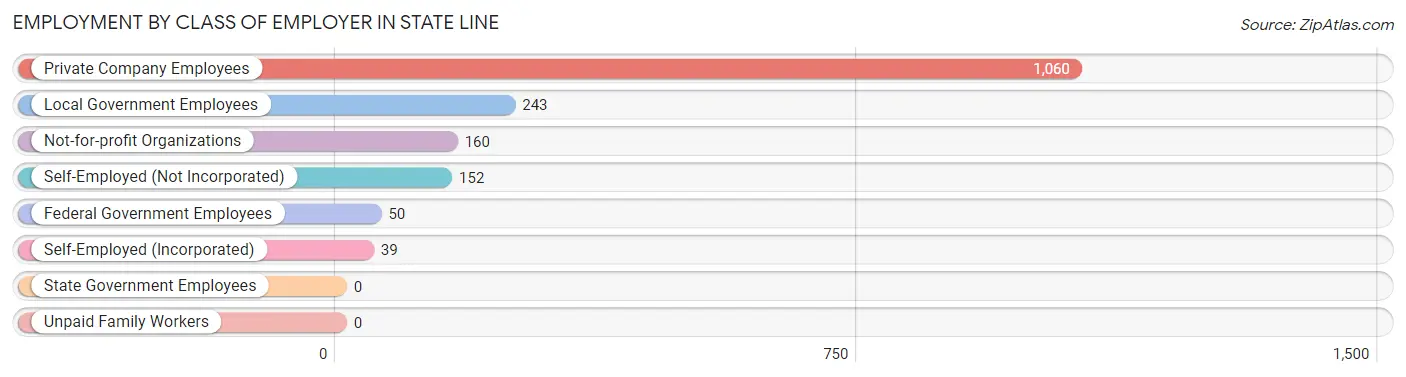
| Employer Class | # Employees | % Employees |
| Private Company Employees | 1,060 | 62.2% |
| Self-Employed (Incorporated) | 39 | 2.3% |
| Self-Employed (Not Incorporated) | 152 | 8.9% |
| Not-for-profit Organizations | 160 | 9.4% |
| Local Government Employees | 243 | 14.3% |
| State Government Employees | 0 | 0.0% |
| Federal Government Employees | 50 | 2.9% |
| Unpaid Family Workers | 0 | 0.0% |
| Total | 1,704 | 100.0% |
Employment Status by Age in State Line
According to the labor force statistics for State Line, out of the total population over 16 years of age (2,703), 67.7% or 1,830 individuals are in the labor force, with 1.0% or 18 of them unemployed. The age group with the highest labor force participation rate is 20 to 24 years, with 100.0% or 72 individuals in the labor force. Within the labor force, the 16 to 19 years age range has the highest percentage of unemployed individuals, with 13.0% or 9 of them being unemployed.
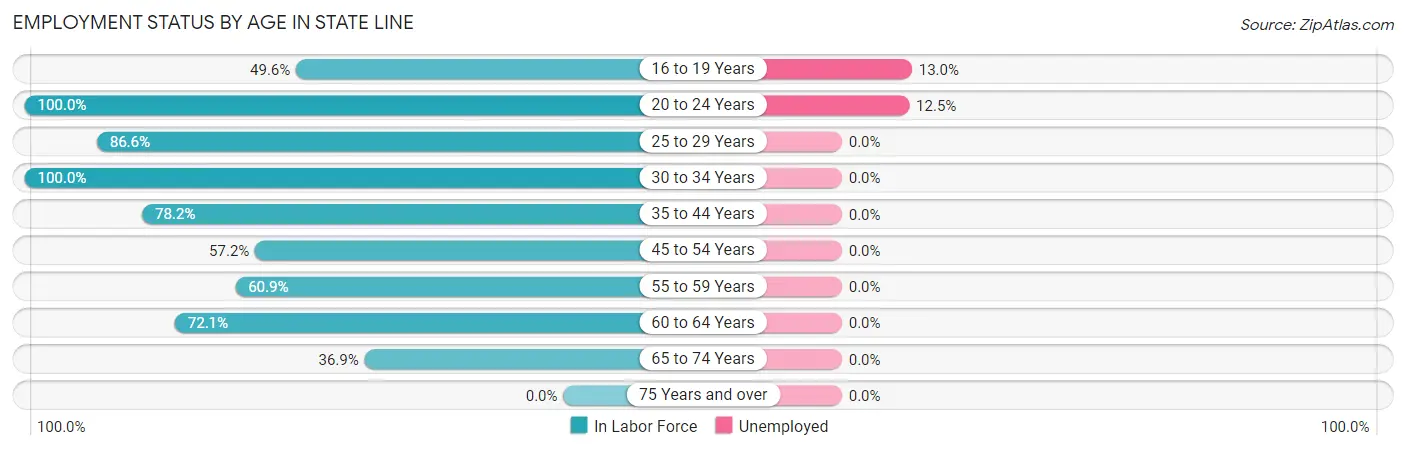
| Age Bracket | In Labor Force | Unemployed |
| 16 to 19 Years | 69 (49.6%) | 9 (13.0%) |
| 20 to 24 Years | 72 (100.0%) | 9 (12.5%) |
| 25 to 29 Years | 522 (86.6%) | 0 (0.0%) |
| 30 to 34 Years | 256 (100.0%) | 0 (0.0%) |
| 35 to 44 Years | 259 (78.2%) | 0 (0.0%) |
| 45 to 54 Years | 139 (57.2%) | 0 (0.0%) |
| 55 to 59 Years | 210 (60.9%) | 0 (0.0%) |
| 60 to 64 Years | 212 (72.1%) | 0 (0.0%) |
| 65 to 74 Years | 92 (36.9%) | 0 (0.0%) |
| 75 Years and over | 0 (0.0%) | 0 (0.0%) |
| Total | 1,830 (67.7%) | 18 (1.0%) |
Employment Status by Educational Attainment in State Line
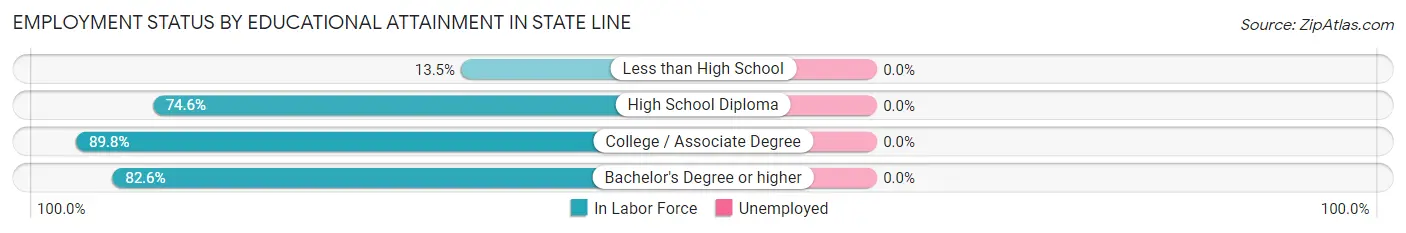
| Educational Attainment | In Labor Force | Unemployed |
| Less than High School | 12 (13.5%) | 0 (0.0%) |
| High School Diploma | 800 (74.6%) | 0 (0.0%) |
| College / Associate Degree | 430 (89.8%) | 0 (0.0%) |
| Bachelor's Degree or higher | 356 (82.6%) | 0 (0.0%) |
| Total | 1,598 (77.1%) | 0 (0.0%) |
Employment Occupations by Sex in State Line
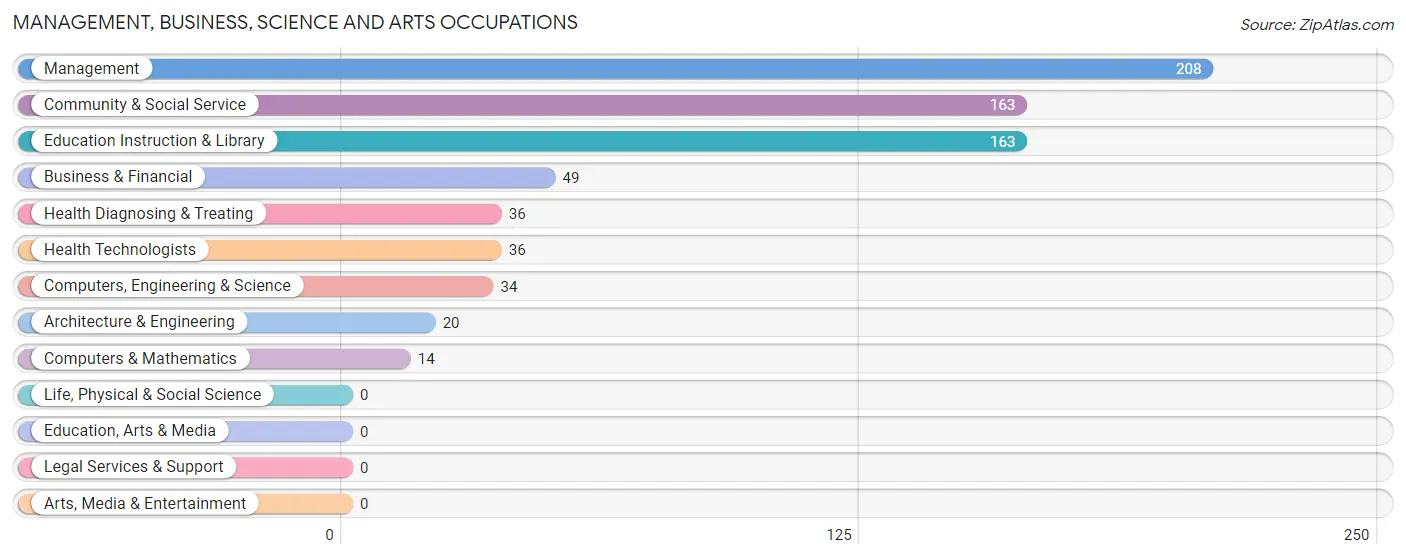
Management, Business, Science and Arts Occupations
The most common Management, Business, Science and Arts occupations in State Line are Management (208 | 11.5%), Community & Social Service (163 | 9.0%), Education Instruction & Library (163 | 9.0%), Business & Financial (49 | 2.7%), and Health Diagnosing & Treating (36 | 2.0%).
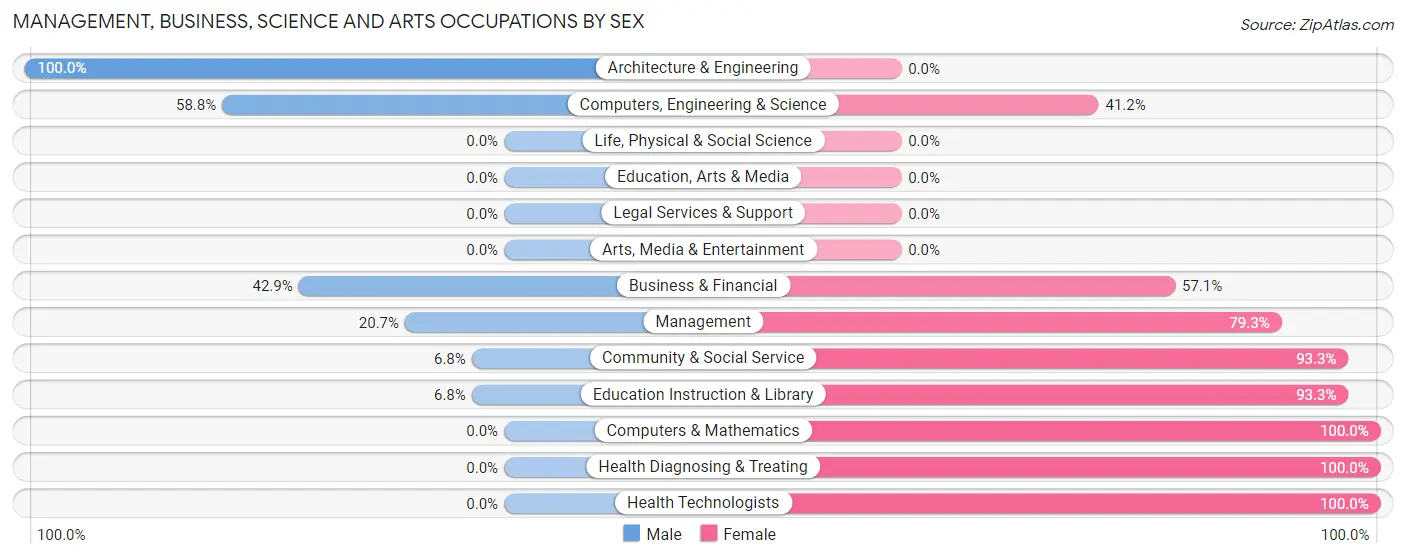
Management, Business, Science and Arts Occupations by Sex
Within the Management, Business, Science and Arts occupations in State Line, the most male-oriented occupations are Architecture & Engineering (100.0%), Computers, Engineering & Science (58.8%), and Business & Financial (42.9%), while the most female-oriented occupations are Computers & Mathematics (100.0%), Health Diagnosing & Treating (100.0%), and Health Technologists (100.0%).
| Occupation | Male | Female |
| Management | 43 (20.7%) | 165 (79.3%) |
| Business & Financial | 21 (42.9%) | 28 (57.1%) |
| Computers, Engineering & Science | 20 (58.8%) | 14 (41.2%) |
| Computers & Mathematics | 0 (0.0%) | 14 (100.0%) |
| Architecture & Engineering | 20 (100.0%) | 0 (0.0%) |
| Life, Physical & Social Science | 0 (0.0%) | 0 (0.0%) |
| Community & Social Service | 11 (6.8%) | 152 (93.2%) |
| Education, Arts & Media | 0 (0.0%) | 0 (0.0%) |
| Legal Services & Support | 0 (0.0%) | 0 (0.0%) |
| Education Instruction & Library | 11 (6.8%) | 152 (93.2%) |
| Arts, Media & Entertainment | 0 (0.0%) | 0 (0.0%) |
| Health Diagnosing & Treating | 0 (0.0%) | 36 (100.0%) |
| Health Technologists | 0 (0.0%) | 36 (100.0%) |
| Total (Category) | 95 (19.4%) | 395 (80.6%) |
| Total (Overall) | 1,082 (59.7%) | 731 (40.3%) |
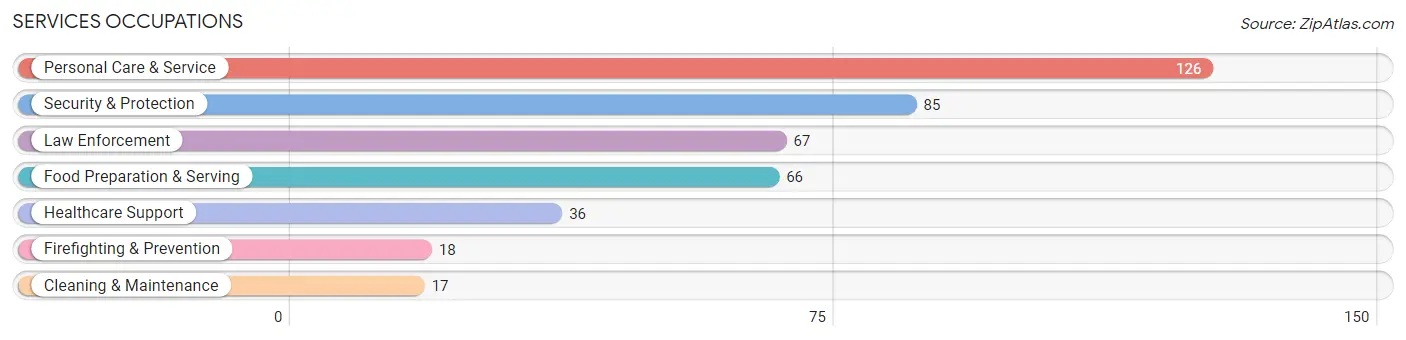
Services Occupations
The most common Services occupations in State Line are Personal Care & Service (126 | 7.0%), Security & Protection (85 | 4.7%), Law Enforcement (67 | 3.7%), Food Preparation & Serving (66 | 3.6%), and Healthcare Support (36 | 2.0%).
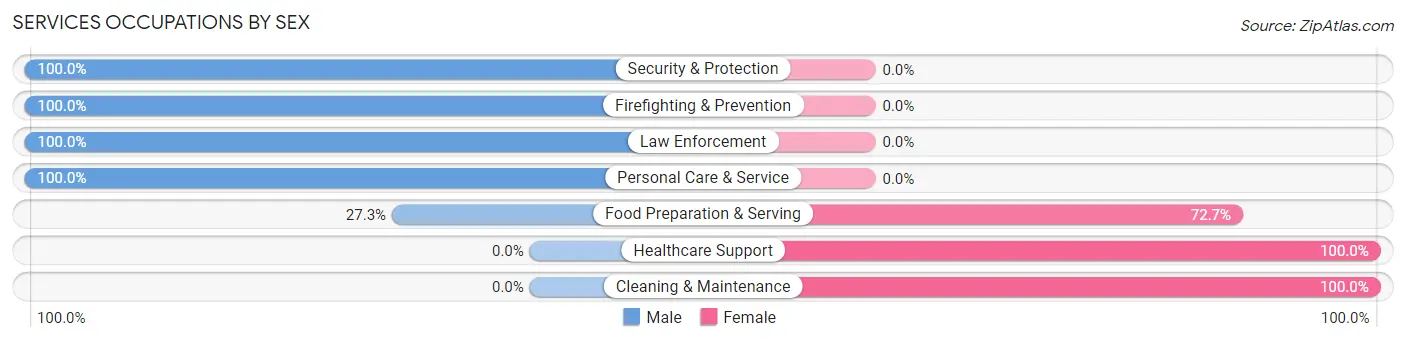
Services Occupations by Sex
Within the Services occupations in State Line, the most male-oriented occupations are Security & Protection (100.0%), Firefighting & Prevention (100.0%), and Law Enforcement (100.0%), while the most female-oriented occupations are Healthcare Support (100.0%), Cleaning & Maintenance (100.0%), and Food Preparation & Serving (72.7%).
| Occupation | Male | Female |
| Healthcare Support | 0 (0.0%) | 36 (100.0%) |
| Security & Protection | 85 (100.0%) | 0 (0.0%) |
| Firefighting & Prevention | 18 (100.0%) | 0 (0.0%) |
| Law Enforcement | 67 (100.0%) | 0 (0.0%) |
| Food Preparation & Serving | 18 (27.3%) | 48 (72.7%) |
| Cleaning & Maintenance | 0 (0.0%) | 17 (100.0%) |
| Personal Care & Service | 126 (100.0%) | 0 (0.0%) |
| Total (Category) | 229 (69.4%) | 101 (30.6%) |
| Total (Overall) | 1,082 (59.7%) | 731 (40.3%) |
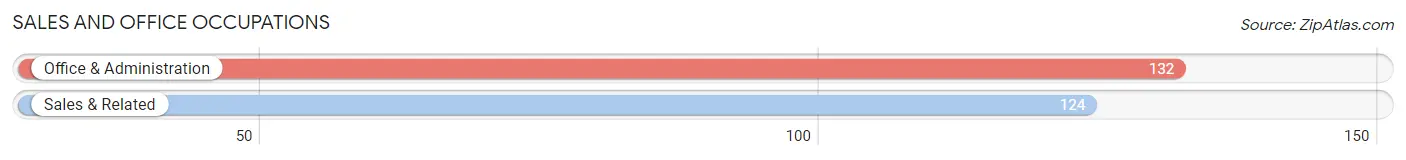
Sales and Office Occupations
The most common Sales and Office occupations in State Line are Office & Administration (132 | 7.3%), and Sales & Related (124 | 6.8%).
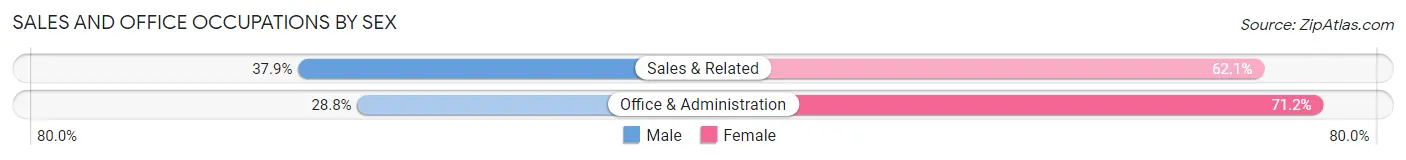
Sales and Office Occupations by Sex
| Occupation | Male | Female |
| Sales & Related | 47 (37.9%) | 77 (62.1%) |
| Office & Administration | 38 (28.8%) | 94 (71.2%) |
| Total (Category) | 85 (33.2%) | 171 (66.8%) |
| Total (Overall) | 1,082 (59.7%) | 731 (40.3%) |
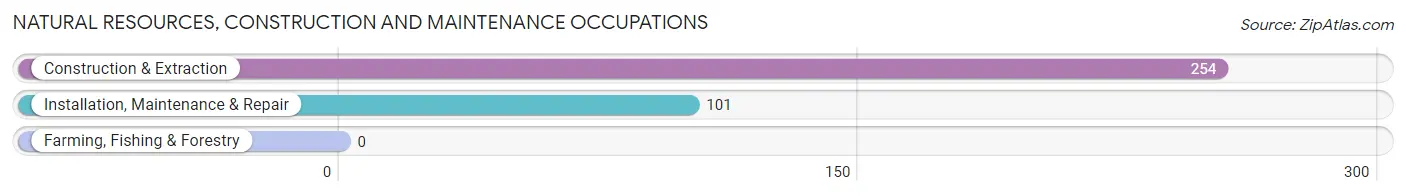
Natural Resources, Construction and Maintenance Occupations
The most common Natural Resources, Construction and Maintenance occupations in State Line are Construction & Extraction (254 | 14.0%), and Installation, Maintenance & Repair (101 | 5.6%).
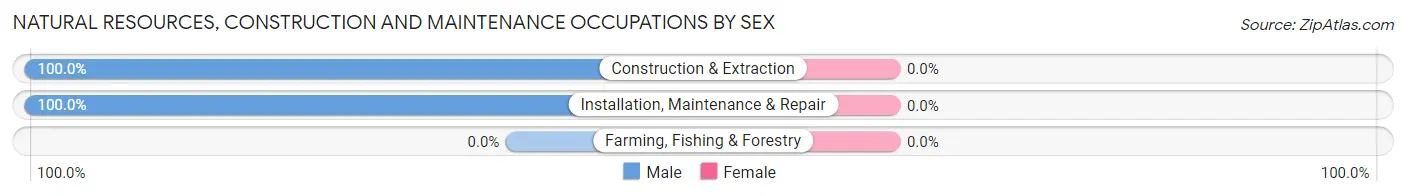
Natural Resources, Construction and Maintenance Occupations by Sex
| Occupation | Male | Female |
| Farming, Fishing & Forestry | 0 (0.0%) | 0 (0.0%) |
| Construction & Extraction | 254 (100.0%) | 0 (0.0%) |
| Installation, Maintenance & Repair | 101 (100.0%) | 0 (0.0%) |
| Total (Category) | 355 (100.0%) | 0 (0.0%) |
| Total (Overall) | 1,082 (59.7%) | 731 (40.3%) |
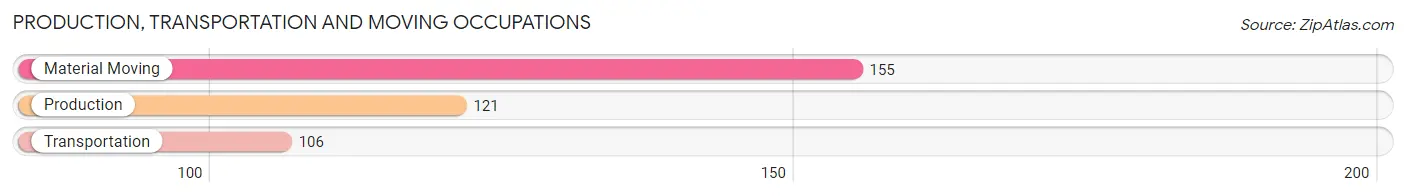
Production, Transportation and Moving Occupations
The most common Production, Transportation and Moving occupations in State Line are Material Moving (155 | 8.6%), Production (121 | 6.7%), and Transportation (106 | 5.9%).
Production, Transportation and Moving Occupations by Sex
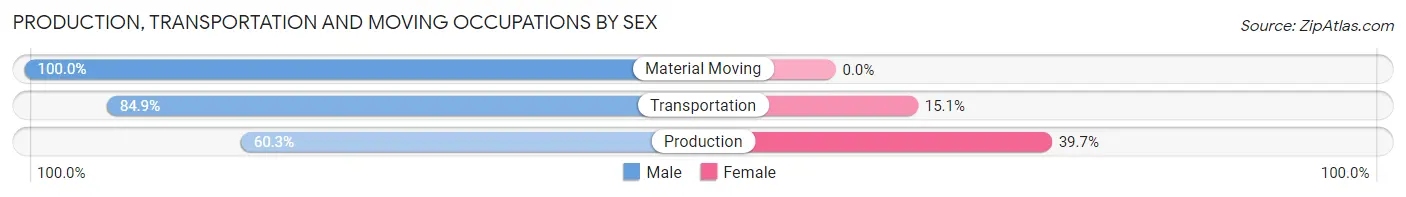
| Occupation | Male | Female |
| Production | 73 (60.3%) | 48 (39.7%) |
| Transportation | 90 (84.9%) | 16 (15.1%) |
| Material Moving | 155 (100.0%) | 0 (0.0%) |
| Total (Category) | 318 (83.3%) | 64 (16.8%) |
| Total (Overall) | 1,082 (59.7%) | 731 (40.3%) |
Employment Industries by Sex in State Line
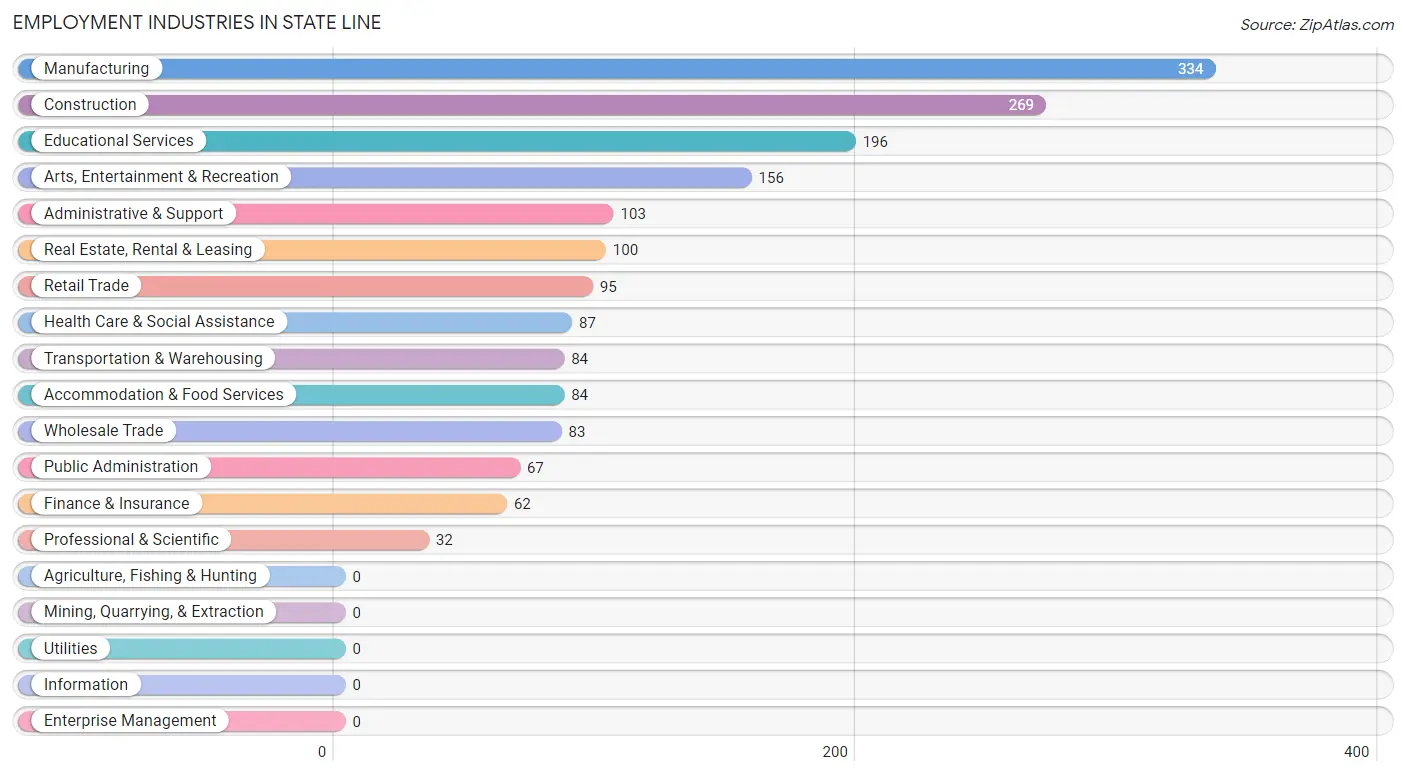
Employment Industries in State Line
The major employment industries in State Line include Manufacturing (334 | 18.4%), Construction (269 | 14.8%), Educational Services (196 | 10.8%), Arts, Entertainment & Recreation (156 | 8.6%), and Administrative & Support (103 | 5.7%).
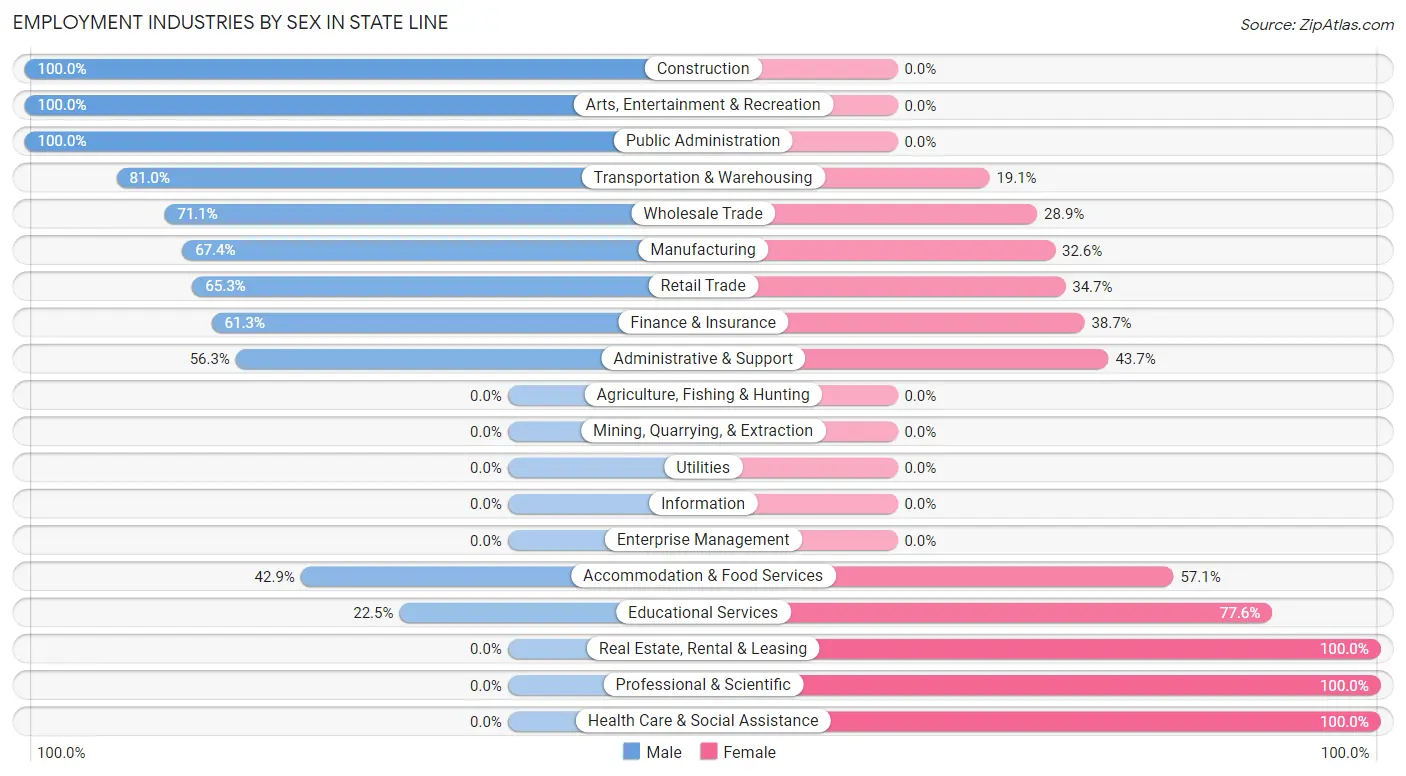
Employment Industries by Sex in State Line
The State Line industries that see more men than women are Construction (100.0%), Arts, Entertainment & Recreation (100.0%), and Public Administration (100.0%), whereas the industries that tend to have a higher number of women are Real Estate, Rental & Leasing (100.0%), Professional & Scientific (100.0%), and Health Care & Social Assistance (100.0%).
| Industry | Male | Female |
| Agriculture, Fishing & Hunting | 0 (0.0%) | 0 (0.0%) |
| Mining, Quarrying, & Extraction | 0 (0.0%) | 0 (0.0%) |
| Construction | 269 (100.0%) | 0 (0.0%) |
| Manufacturing | 225 (67.4%) | 109 (32.6%) |
| Wholesale Trade | 59 (71.1%) | 24 (28.9%) |
| Retail Trade | 62 (65.3%) | 33 (34.7%) |
| Transportation & Warehousing | 68 (80.9%) | 16 (19.1%) |
| Utilities | 0 (0.0%) | 0 (0.0%) |
| Information | 0 (0.0%) | 0 (0.0%) |
| Finance & Insurance | 38 (61.3%) | 24 (38.7%) |
| Real Estate, Rental & Leasing | 0 (0.0%) | 100 (100.0%) |
| Professional & Scientific | 0 (0.0%) | 32 (100.0%) |
| Enterprise Management | 0 (0.0%) | 0 (0.0%) |
| Administrative & Support | 58 (56.3%) | 45 (43.7%) |
| Educational Services | 44 (22.5%) | 152 (77.5%) |
| Health Care & Social Assistance | 0 (0.0%) | 87 (100.0%) |
| Arts, Entertainment & Recreation | 156 (100.0%) | 0 (0.0%) |
| Accommodation & Food Services | 36 (42.9%) | 48 (57.1%) |
| Public Administration | 67 (100.0%) | 0 (0.0%) |
| Total | 1,082 (59.7%) | 731 (40.3%) |
Education in State Line
School Enrollment in State Line
The most common levels of schooling among the 637 students in State Line are elementary school (232 | 36.4%), high school (160 | 25.1%), and graduate / professional (119 | 18.7%).

| School Level | # Students | % Students |
| Nursery / Preschool | 46 | 7.2% |
| Kindergarten | 13 | 2.0% |
| Elementary School | 232 | 36.4% |
| Middle School | 37 | 5.8% |
| High School | 160 | 25.1% |
| College / Undergraduate | 30 | 4.7% |
| Graduate / Professional | 119 | 18.7% |
| Total | 637 | 100.0% |
School Enrollment by Age by Funding Source in State Line
Out of a total of 637 students who are enrolled in schools in State Line, 191 (30.0%) attend a private institution, while the remaining 446 (70.0%) are enrolled in public schools. The age group of 3 to 4 year olds has the highest likelihood of being enrolled in private schools, with 46 (100.0% in the age bracket) enrolled. Conversely, the age group of 18 to 19 year olds has the lowest likelihood of being enrolled in a private school, with 48 (100.0% in the age bracket) attending a public institution.
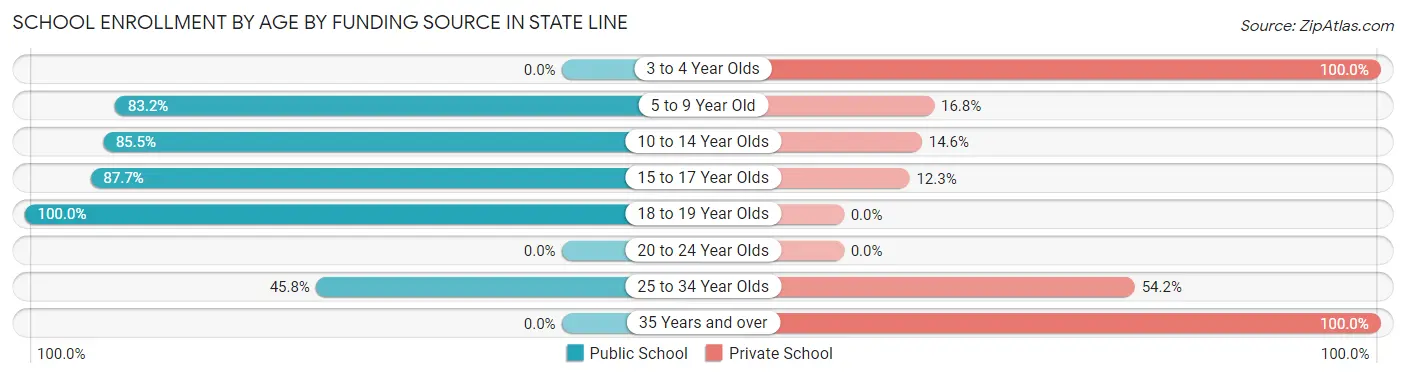
| Age Bracket | Public School | Private School |
| 3 to 4 Year Olds | 0 (0.0%) | 46 (100.0%) |
| 5 to 9 Year Old | 173 (83.2%) | 35 (16.8%) |
| 10 to 14 Year Olds | 94 (85.5%) | 16 (14.5%) |
| 15 to 17 Year Olds | 93 (87.7%) | 13 (12.3%) |
| 18 to 19 Year Olds | 48 (100.0%) | 0 (0.0%) |
| 20 to 24 Year Olds | 0 (0.0%) | 0 (0.0%) |
| 25 to 34 Year Olds | 38 (45.8%) | 45 (54.2%) |
| 35 Years and over | 0 (0.0%) | 36 (100.0%) |
| Total | 446 (70.0%) | 191 (30.0%) |
Educational Attainment by Field of Study in State Line
Education (223 | 45.8%), science & technology (62 | 12.7%), bio, nature & agricultural (45 | 9.2%), arts & humanities (45 | 9.2%), and business (39 | 8.0%) are the most common fields of study among 487 individuals in State Line who have obtained a bachelor's degree or higher.
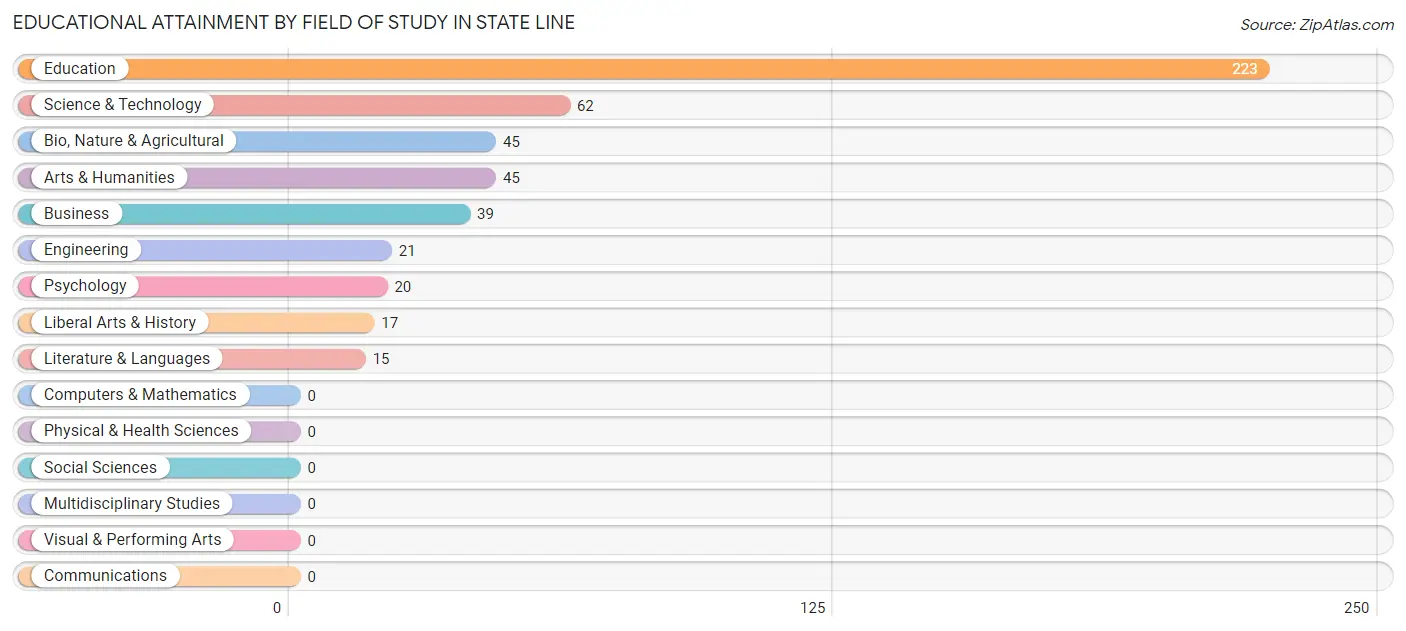
| Field of Study | # Graduates | % Graduates |
| Computers & Mathematics | 0 | 0.0% |
| Bio, Nature & Agricultural | 45 | 9.2% |
| Physical & Health Sciences | 0 | 0.0% |
| Psychology | 20 | 4.1% |
| Social Sciences | 0 | 0.0% |
| Engineering | 21 | 4.3% |
| Multidisciplinary Studies | 0 | 0.0% |
| Science & Technology | 62 | 12.7% |
| Business | 39 | 8.0% |
| Education | 223 | 45.8% |
| Literature & Languages | 15 | 3.1% |
| Liberal Arts & History | 17 | 3.5% |
| Visual & Performing Arts | 0 | 0.0% |
| Communications | 0 | 0.0% |
| Arts & Humanities | 45 | 9.2% |
| Total | 487 | 100.0% |
Transportation & Commute in State Line
Vehicle Availability by Sex in State Line
The most prevalent vehicle ownership categories in State Line are males with 2 vehicles (570, accounting for 56.8%) and females with 2 vehicles (386, making up 81.4%).
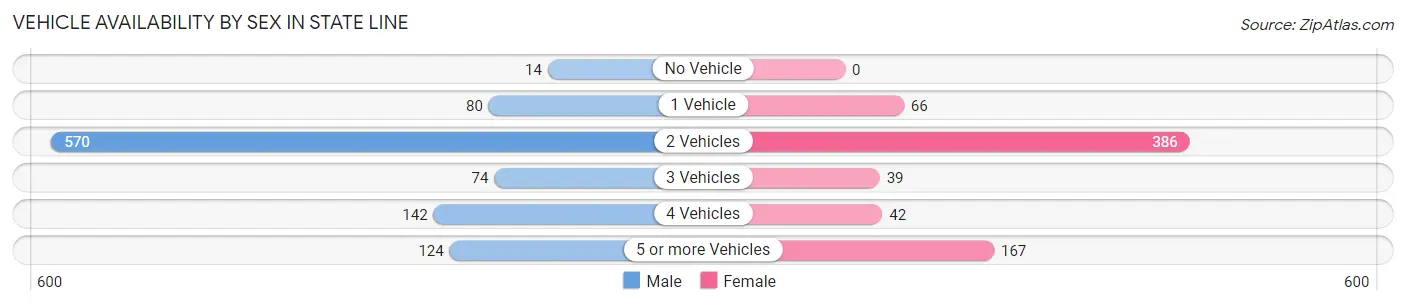
| Vehicles Available | Male | Female |
| No Vehicle | 14 (1.4%) | 0 (0.0%) |
| 1 Vehicle | 80 (8.0%) | 66 (9.4%) |
| 2 Vehicles | 570 (56.8%) | 386 (55.1%) |
| 3 Vehicles | 74 (7.4%) | 39 (5.6%) |
| 4 Vehicles | 142 (14.1%) | 42 (6.0%) |
| 5 or more Vehicles | 124 (12.3%) | 167 (23.9%) |
| Total | 1,004 (100.0%) | 700 (100.0%) |
Commute Time in State Line
The most frequently occuring commute durations in State Line are 25 to 29 minutes (361 commuters, 21.5%), 15 to 19 minutes (357 commuters, 21.2%), and 45 to 59 minutes (222 commuters, 13.2%).
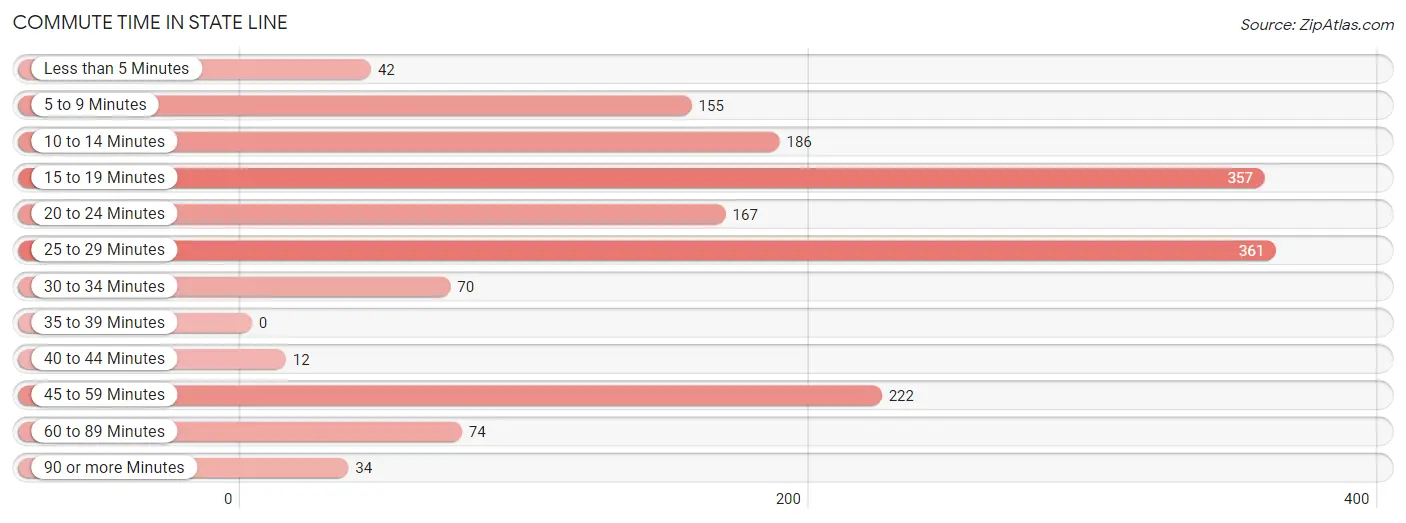
| Commute Time | # Commuters | % Commuters |
| Less than 5 Minutes | 42 | 2.5% |
| 5 to 9 Minutes | 155 | 9.2% |
| 10 to 14 Minutes | 186 | 11.1% |
| 15 to 19 Minutes | 357 | 21.2% |
| 20 to 24 Minutes | 167 | 9.9% |
| 25 to 29 Minutes | 361 | 21.5% |
| 30 to 34 Minutes | 70 | 4.2% |
| 35 to 39 Minutes | 0 | 0.0% |
| 40 to 44 Minutes | 12 | 0.7% |
| 45 to 59 Minutes | 222 | 13.2% |
| 60 to 89 Minutes | 74 | 4.4% |
| 90 or more Minutes | 34 | 2.0% |
Commute Time by Sex in State Line
The most common commute times in State Line are 15 to 19 minutes (266 commuters, 26.5%) for males and 25 to 29 minutes (185 commuters, 27.4%) for females.
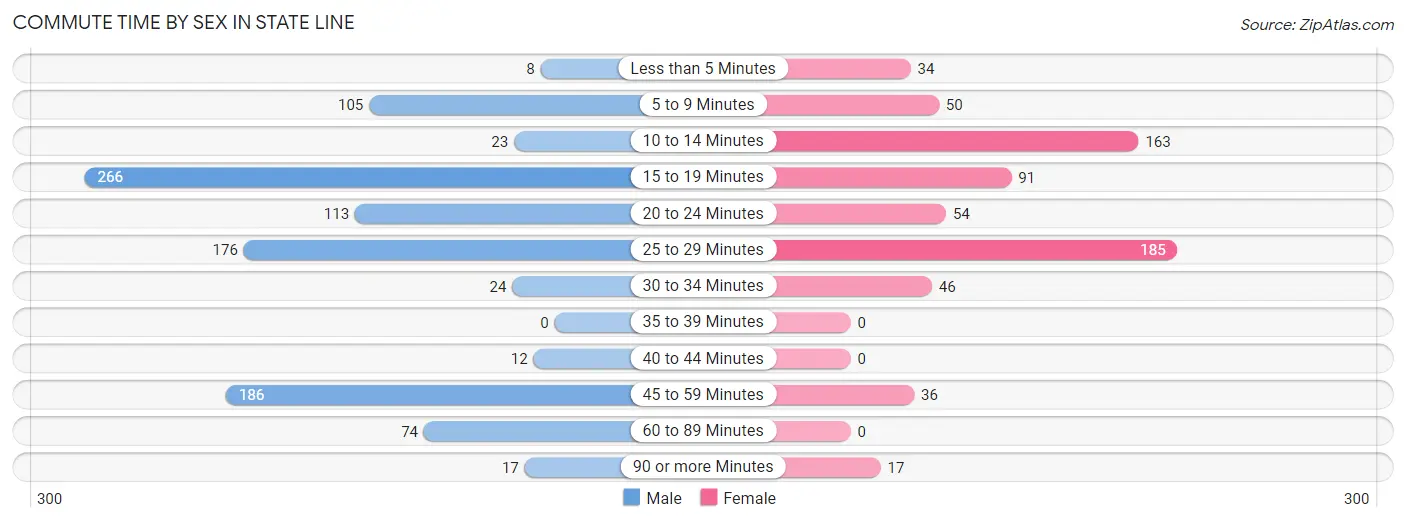
| Commute Time | Male | Female |
| Less than 5 Minutes | 8 (0.8%) | 34 (5.0%) |
| 5 to 9 Minutes | 105 (10.5%) | 50 (7.4%) |
| 10 to 14 Minutes | 23 (2.3%) | 163 (24.1%) |
| 15 to 19 Minutes | 266 (26.5%) | 91 (13.5%) |
| 20 to 24 Minutes | 113 (11.3%) | 54 (8.0%) |
| 25 to 29 Minutes | 176 (17.5%) | 185 (27.4%) |
| 30 to 34 Minutes | 24 (2.4%) | 46 (6.8%) |
| 35 to 39 Minutes | 0 (0.0%) | 0 (0.0%) |
| 40 to 44 Minutes | 12 (1.2%) | 0 (0.0%) |
| 45 to 59 Minutes | 186 (18.5%) | 36 (5.3%) |
| 60 to 89 Minutes | 74 (7.4%) | 0 (0.0%) |
| 90 or more Minutes | 17 (1.7%) | 17 (2.5%) |
Time of Departure to Work by Sex in State Line
The most frequent times of departure to work in State Line are 12:00 AM to 4:59 AM (419, 41.7%) for males and 12:00 PM to 3:59 PM (119, 17.6%) for females.
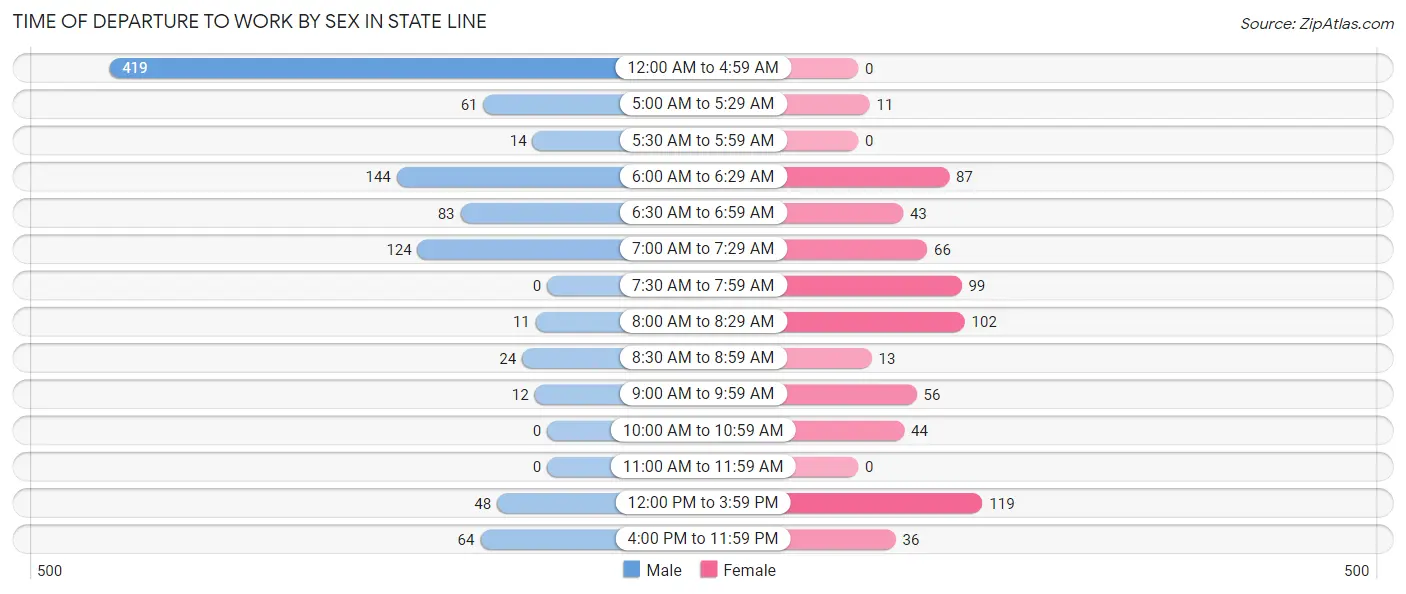
| Time of Departure | Male | Female |
| 12:00 AM to 4:59 AM | 419 (41.7%) | 0 (0.0%) |
| 5:00 AM to 5:29 AM | 61 (6.1%) | 11 (1.6%) |
| 5:30 AM to 5:59 AM | 14 (1.4%) | 0 (0.0%) |
| 6:00 AM to 6:29 AM | 144 (14.3%) | 87 (12.9%) |
| 6:30 AM to 6:59 AM | 83 (8.3%) | 43 (6.4%) |
| 7:00 AM to 7:29 AM | 124 (12.3%) | 66 (9.8%) |
| 7:30 AM to 7:59 AM | 0 (0.0%) | 99 (14.6%) |
| 8:00 AM to 8:29 AM | 11 (1.1%) | 102 (15.1%) |
| 8:30 AM to 8:59 AM | 24 (2.4%) | 13 (1.9%) |
| 9:00 AM to 9:59 AM | 12 (1.2%) | 56 (8.3%) |
| 10:00 AM to 10:59 AM | 0 (0.0%) | 44 (6.5%) |
| 11:00 AM to 11:59 AM | 0 (0.0%) | 0 (0.0%) |
| 12:00 PM to 3:59 PM | 48 (4.8%) | 119 (17.6%) |
| 4:00 PM to 11:59 PM | 64 (6.4%) | 36 (5.3%) |
| Total | 1,004 (100.0%) | 676 (100.0%) |
Housing Occupancy in State Line
Occupancy by Ownership in State Line
Of the total 1,218 dwellings in State Line, owner-occupied units account for 1,002 (82.3%), while renter-occupied units make up 216 (17.7%).
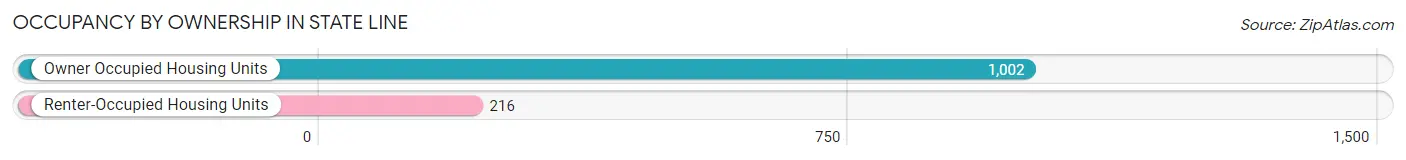
| Occupancy | # Housing Units | % Housing Units |
| Owner Occupied Housing Units | 1,002 | 82.3% |
| Renter-Occupied Housing Units | 216 | 17.7% |
| Total Occupied Housing Units | 1,218 | 100.0% |
Occupancy by Household Size in State Line
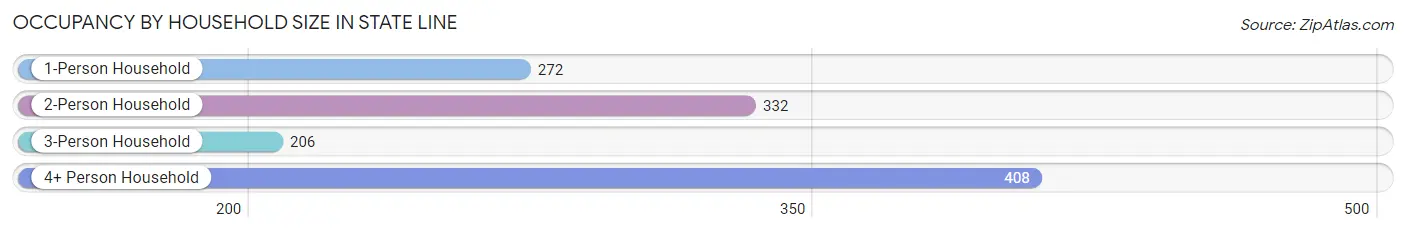
| Household Size | # Housing Units | % Housing Units |
| 1-Person Household | 272 | 22.3% |
| 2-Person Household | 332 | 27.3% |
| 3-Person Household | 206 | 16.9% |
| 4+ Person Household | 408 | 33.5% |
| Total Housing Units | 1,218 | 100.0% |
Occupancy by Ownership by Household Size in State Line
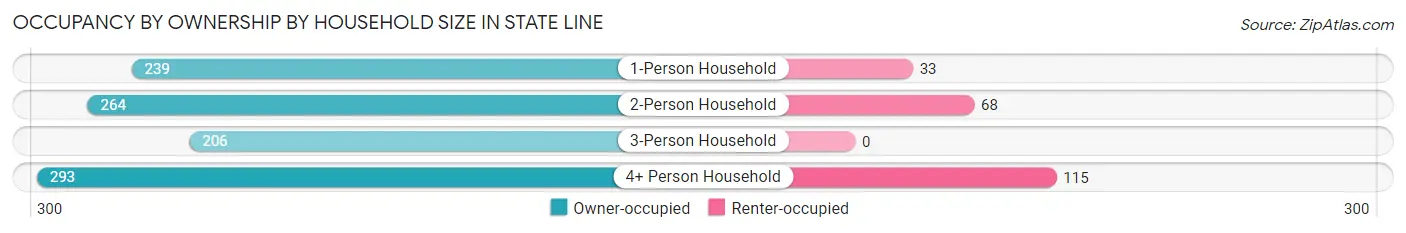
| Household Size | Owner-occupied | Renter-occupied |
| 1-Person Household | 239 (87.9%) | 33 (12.1%) |
| 2-Person Household | 264 (79.5%) | 68 (20.5%) |
| 3-Person Household | 206 (100.0%) | 0 (0.0%) |
| 4+ Person Household | 293 (71.8%) | 115 (28.2%) |
| Total Housing Units | 1,002 (82.3%) | 216 (17.7%) |
Occupancy by Educational Attainment in State Line

| Household Size | Owner-occupied | Renter-occupied |
| Less than High School | 24 (100.0%) | 0 (0.0%) |
| High School Diploma | 501 (82.7%) | 105 (17.3%) |
| College/Associate Degree | 213 (75.5%) | 69 (24.5%) |
| Bachelor's Degree or higher | 264 (86.3%) | 42 (13.7%) |
Occupancy by Age of Householder in State Line
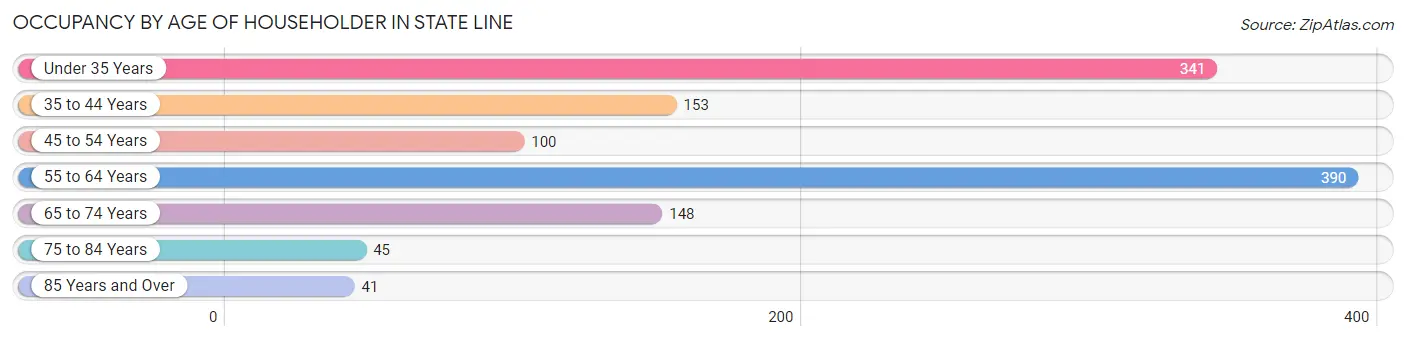
| Age Bracket | # Households | % Households |
| Under 35 Years | 341 | 28.0% |
| 35 to 44 Years | 153 | 12.6% |
| 45 to 54 Years | 100 | 8.2% |
| 55 to 64 Years | 390 | 32.0% |
| 65 to 74 Years | 148 | 12.1% |
| 75 to 84 Years | 45 | 3.7% |
| 85 Years and Over | 41 | 3.4% |
| Total | 1,218 | 100.0% |
Housing Finances in State Line
Median Income by Occupancy in State Line
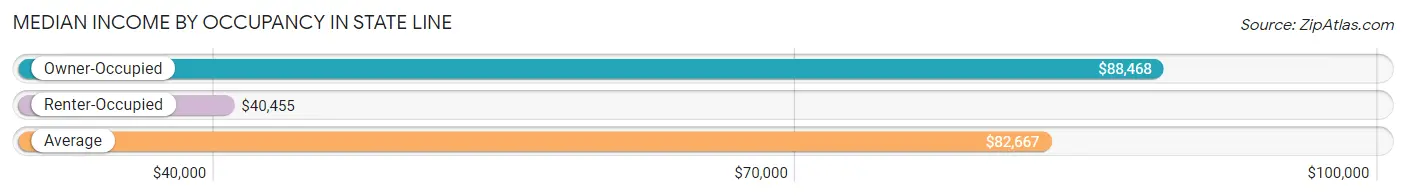
| Occupancy Type | # Households | Median Income |
| Owner-Occupied | 1,002 (82.3%) | $88,468 |
| Renter-Occupied | 216 (17.7%) | $40,455 |
| Average | 1,218 (100.0%) | $82,667 |
Occupancy by Householder Income Bracket in State Line
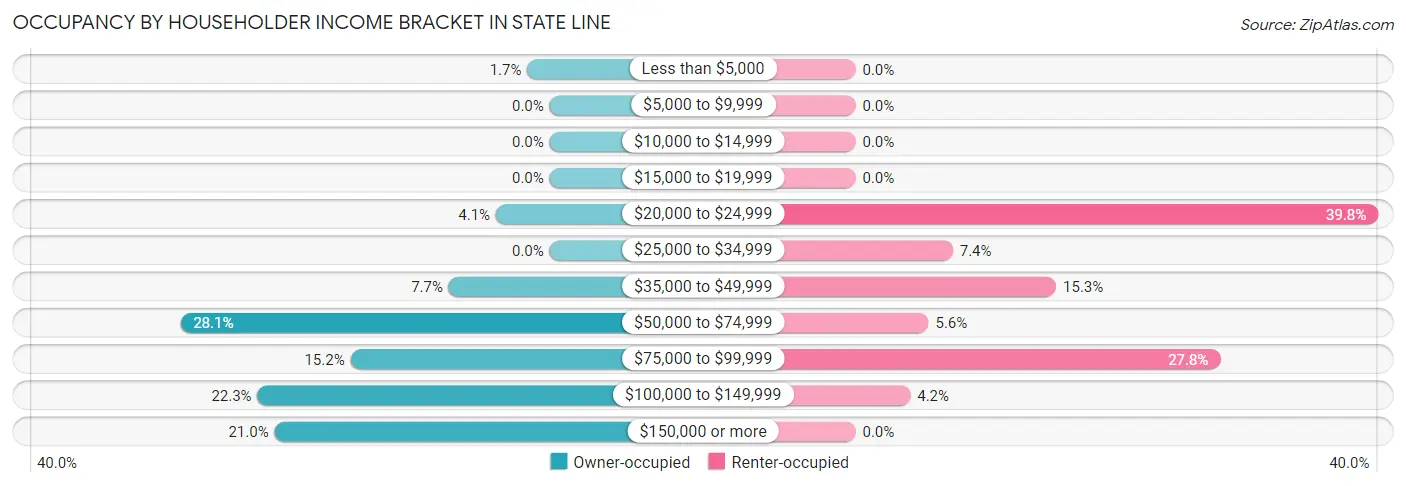
| Income Bracket | Owner-occupied | Renter-occupied |
| Less than $5,000 | 17 (1.7%) | 0 (0.0%) |
| $5,000 to $9,999 | 0 (0.0%) | 0 (0.0%) |
| $10,000 to $14,999 | 0 (0.0%) | 0 (0.0%) |
| $15,000 to $19,999 | 0 (0.0%) | 0 (0.0%) |
| $20,000 to $24,999 | 41 (4.1%) | 86 (39.8%) |
| $25,000 to $34,999 | 0 (0.0%) | 16 (7.4%) |
| $35,000 to $49,999 | 77 (7.7%) | 33 (15.3%) |
| $50,000 to $74,999 | 282 (28.1%) | 12 (5.6%) |
| $75,000 to $99,999 | 152 (15.2%) | 60 (27.8%) |
| $100,000 to $149,999 | 223 (22.3%) | 9 (4.2%) |
| $150,000 or more | 210 (21.0%) | 0 (0.0%) |
| Total | 1,002 (100.0%) | 216 (100.0%) |
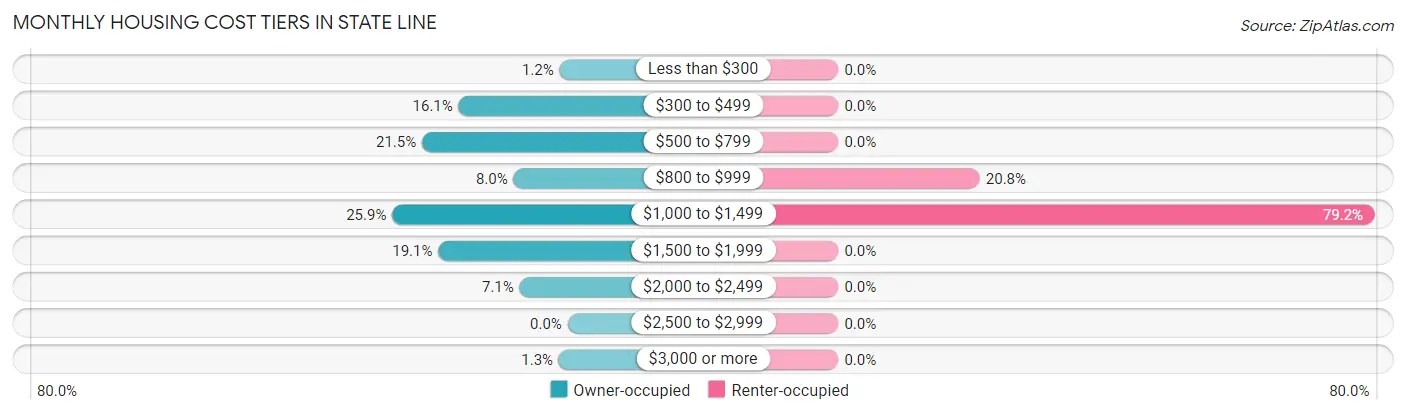
Monthly Housing Cost Tiers in State Line
| Monthly Cost | Owner-occupied | Renter-occupied |
| Less than $300 | 12 (1.2%) | 0 (0.0%) |
| $300 to $499 | 161 (16.1%) | 0 (0.0%) |
| $500 to $799 | 215 (21.5%) | 0 (0.0%) |
| $800 to $999 | 80 (8.0%) | 45 (20.8%) |
| $1,000 to $1,499 | 259 (25.9%) | 171 (79.2%) |
| $1,500 to $1,999 | 191 (19.1%) | 0 (0.0%) |
| $2,000 to $2,499 | 71 (7.1%) | 0 (0.0%) |
| $2,500 to $2,999 | 0 (0.0%) | 0 (0.0%) |
| $3,000 or more | 13 (1.3%) | 0 (0.0%) |
| Total | 1,002 (100.0%) | 216 (100.0%) |
Physical Housing Characteristics in State Line
Housing Structures in State Line
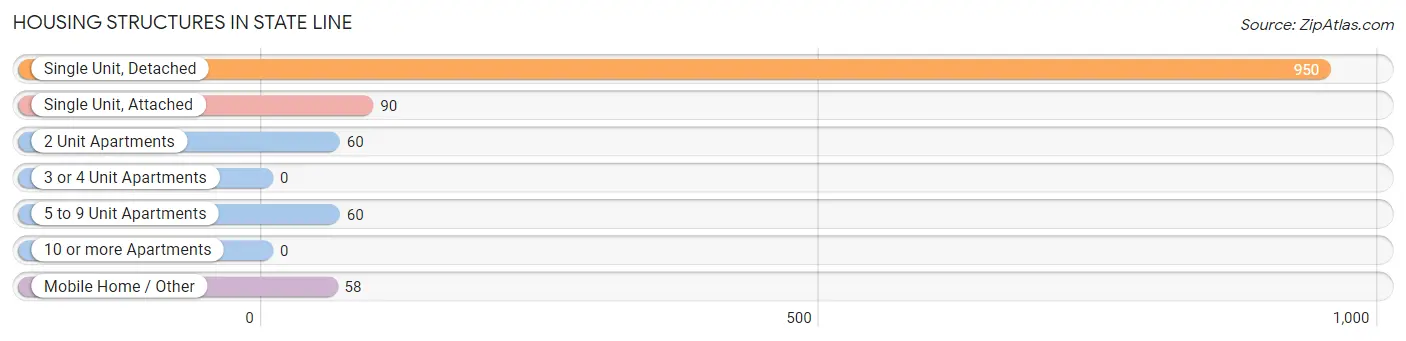
| Structure Type | # Housing Units | % Housing Units |
| Single Unit, Detached | 950 | 78.0% |
| Single Unit, Attached | 90 | 7.4% |
| 2 Unit Apartments | 60 | 4.9% |
| 3 or 4 Unit Apartments | 0 | 0.0% |
| 5 to 9 Unit Apartments | 60 | 4.9% |
| 10 or more Apartments | 0 | 0.0% |
| Mobile Home / Other | 58 | 4.8% |
| Total | 1,218 | 100.0% |
Housing Structures by Occupancy in State Line
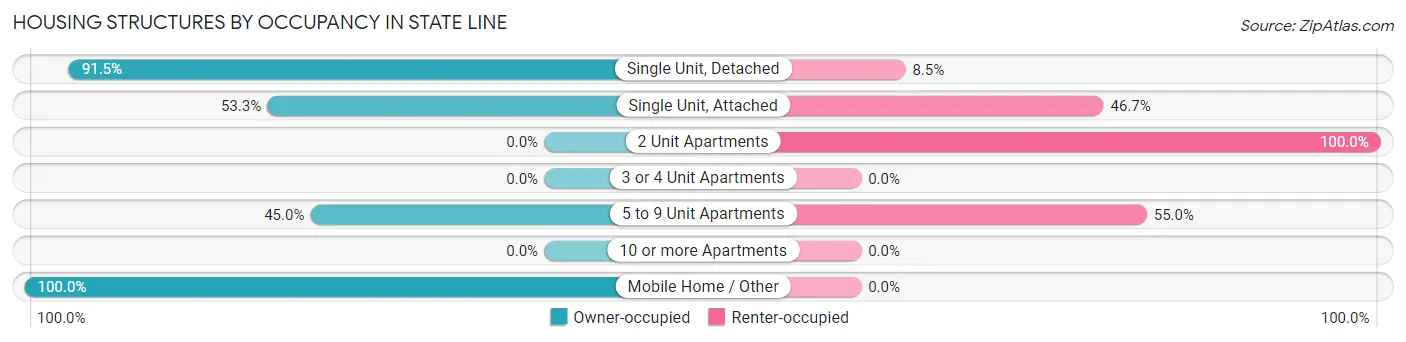
| Structure Type | Owner-occupied | Renter-occupied |
| Single Unit, Detached | 869 (91.5%) | 81 (8.5%) |
| Single Unit, Attached | 48 (53.3%) | 42 (46.7%) |
| 2 Unit Apartments | 0 (0.0%) | 60 (100.0%) |
| 3 or 4 Unit Apartments | 0 (0.0%) | 0 (0.0%) |
| 5 to 9 Unit Apartments | 27 (45.0%) | 33 (55.0%) |
| 10 or more Apartments | 0 (0.0%) | 0 (0.0%) |
| Mobile Home / Other | 58 (100.0%) | 0 (0.0%) |
| Total | 1,002 (82.3%) | 216 (17.7%) |
Housing Structures by Number of Rooms in State Line
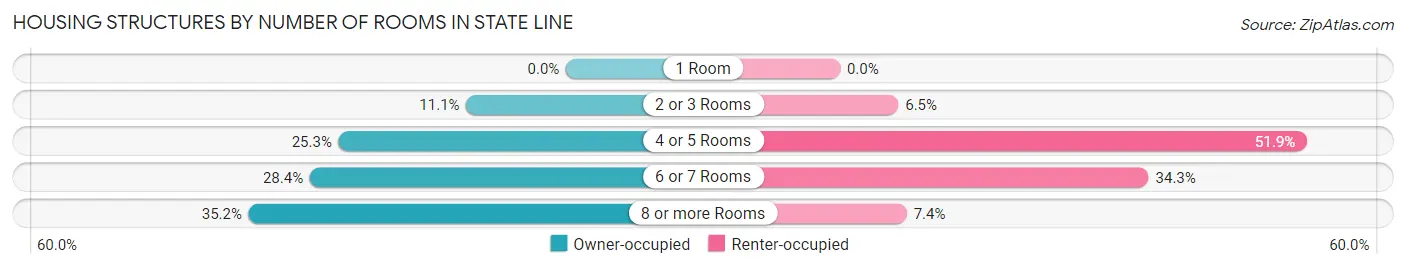
| Number of Rooms | Owner-occupied | Renter-occupied |
| 1 Room | 0 (0.0%) | 0 (0.0%) |
| 2 or 3 Rooms | 111 (11.1%) | 14 (6.5%) |
| 4 or 5 Rooms | 253 (25.3%) | 112 (51.8%) |
| 6 or 7 Rooms | 285 (28.4%) | 74 (34.3%) |
| 8 or more Rooms | 353 (35.2%) | 16 (7.4%) |
| Total | 1,002 (100.0%) | 216 (100.0%) |
Housing Structure by Heating Type in State Line
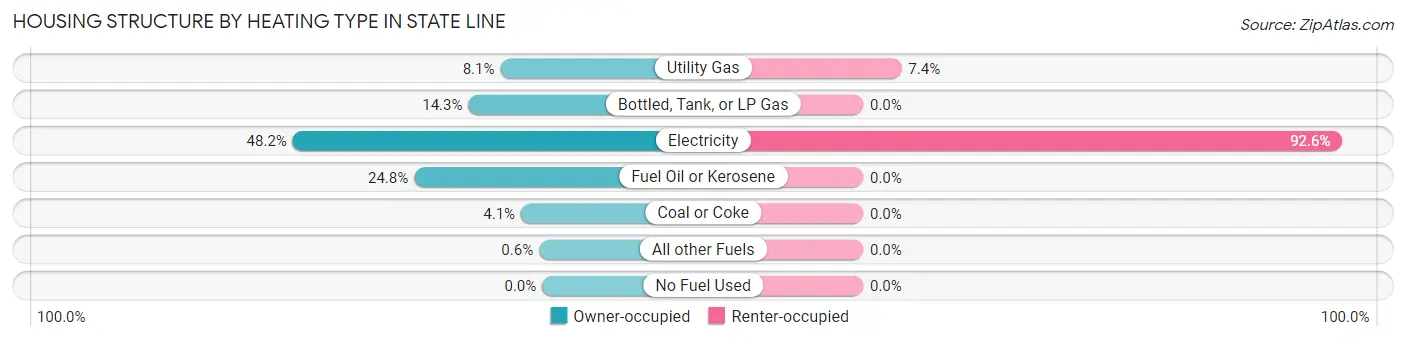
| Heating Type | Owner-occupied | Renter-occupied |
| Utility Gas | 81 (8.1%) | 16 (7.4%) |
| Bottled, Tank, or LP Gas | 143 (14.3%) | 0 (0.0%) |
| Electricity | 483 (48.2%) | 200 (92.6%) |
| Fuel Oil or Kerosene | 248 (24.7%) | 0 (0.0%) |
| Coal or Coke | 41 (4.1%) | 0 (0.0%) |
| All other Fuels | 6 (0.6%) | 0 (0.0%) |
| No Fuel Used | 0 (0.0%) | 0 (0.0%) |
| Total | 1,002 (100.0%) | 216 (100.0%) |
Household Vehicle Usage in State Line
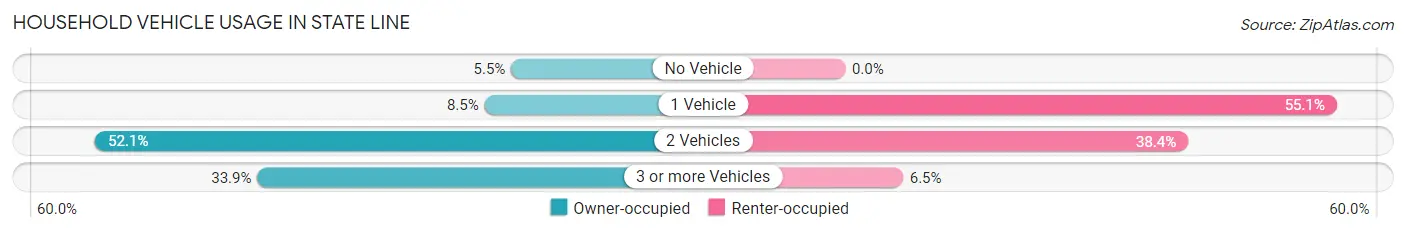
| Vehicles per Household | Owner-occupied | Renter-occupied |
| No Vehicle | 55 (5.5%) | 0 (0.0%) |
| 1 Vehicle | 85 (8.5%) | 119 (55.1%) |
| 2 Vehicles | 522 (52.1%) | 83 (38.4%) |
| 3 or more Vehicles | 340 (33.9%) | 14 (6.5%) |
| Total | 1,002 (100.0%) | 216 (100.0%) |
Real Estate & Mortgages in State Line
Real Estate and Mortgage Overview in State Line
| Characteristic | Without Mortgage | With Mortgage |
| Housing Units | 511 | 491 |
| Median Property Value | $283,600 | $218,900 |
| Median Household Income | $101,174 | $98 |
| Monthly Housing Costs | $583 | $13 |
| Real Estate Taxes | $2,685 | $27 |
Property Value by Mortgage Status in State Line

| Property Value | Without Mortgage | With Mortgage |
| Less than $50,000 | 13 (2.5%) | 0 (0.0%) |
| $50,000 to $99,999 | 0 (0.0%) | 0 (0.0%) |
| $100,000 to $299,999 | 311 (60.9%) | 426 (86.8%) |
| $300,000 to $499,999 | 187 (36.6%) | 59 (12.0%) |
| $500,000 to $749,999 | 0 (0.0%) | 6 (1.2%) |
| $750,000 to $999,999 | 0 (0.0%) | 0 (0.0%) |
| $1,000,000 or more | 0 (0.0%) | 0 (0.0%) |
| Total | 511 (100.0%) | 491 (100.0%) |
Household Income by Mortgage Status in State Line
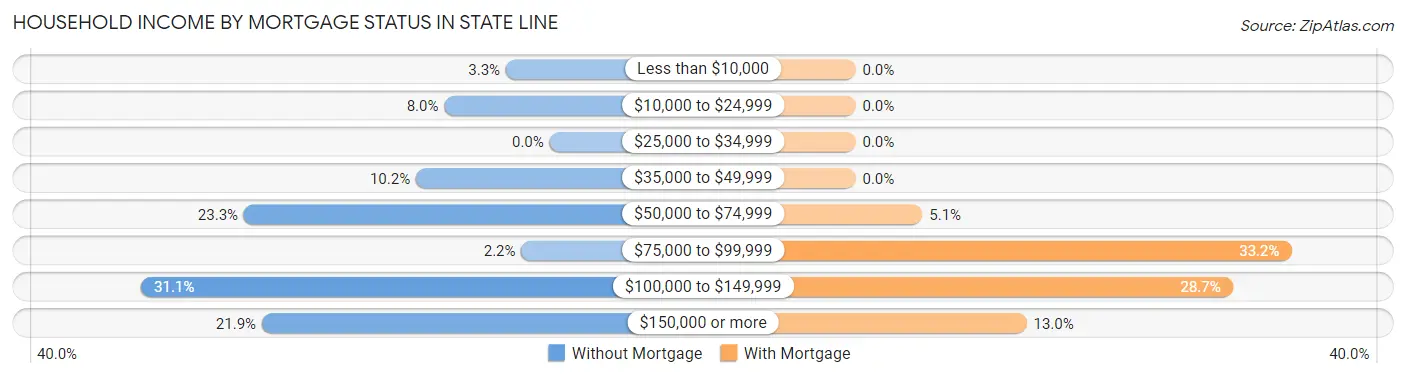
| Household Income | Without Mortgage | With Mortgage |
| Less than $10,000 | 17 (3.3%) | 0 (0.0%) |
| $10,000 to $24,999 | 41 (8.0%) | 0 (0.0%) |
| $25,000 to $34,999 | 0 (0.0%) | 0 (0.0%) |
| $35,000 to $49,999 | 52 (10.2%) | 0 (0.0%) |
| $50,000 to $74,999 | 119 (23.3%) | 25 (5.1%) |
| $75,000 to $99,999 | 11 (2.1%) | 163 (33.2%) |
| $100,000 to $149,999 | 159 (31.1%) | 141 (28.7%) |
| $150,000 or more | 112 (21.9%) | 64 (13.0%) |
| Total | 511 (100.0%) | 491 (100.0%) |
Property Value to Household Income Ratio in State Line
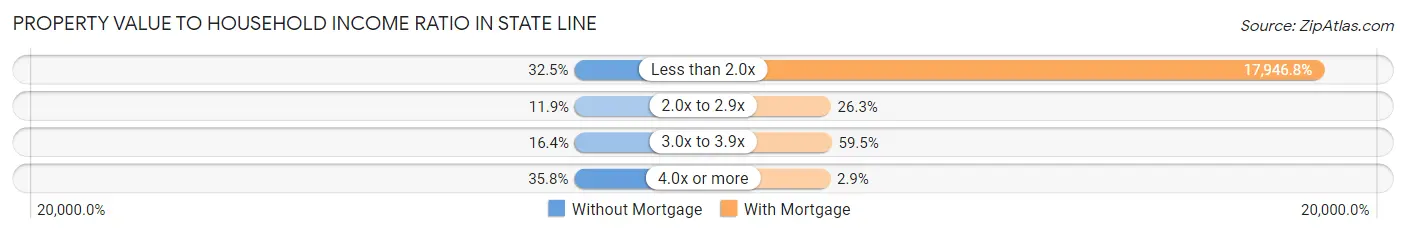
| Value-to-Income Ratio | Without Mortgage | With Mortgage |
| Less than 2.0x | 166 (32.5%) | 88,119 (17,946.8%) |
| 2.0x to 2.9x | 61 (11.9%) | 129 (26.3%) |
| 3.0x to 3.9x | 84 (16.4%) | 292 (59.5%) |
| 4.0x or more | 183 (35.8%) | 14 (2.9%) |
| Total | 511 (100.0%) | 491 (100.0%) |
Real Estate Taxes by Mortgage Status in State Line
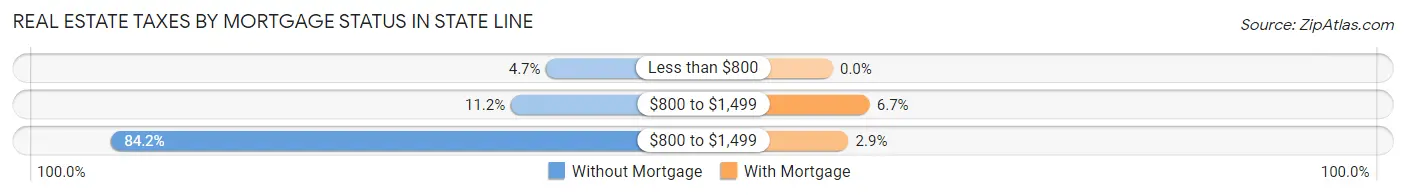
| Property Taxes | Without Mortgage | With Mortgage |
| Less than $800 | 24 (4.7%) | 0 (0.0%) |
| $800 to $1,499 | 57 (11.2%) | 33 (6.7%) |
| $800 to $1,499 | 430 (84.2%) | 14 (2.9%) |
| Total | 511 (100.0%) | 491 (100.0%) |
Health & Disability in State Line
Health Insurance Coverage by Age in State Line
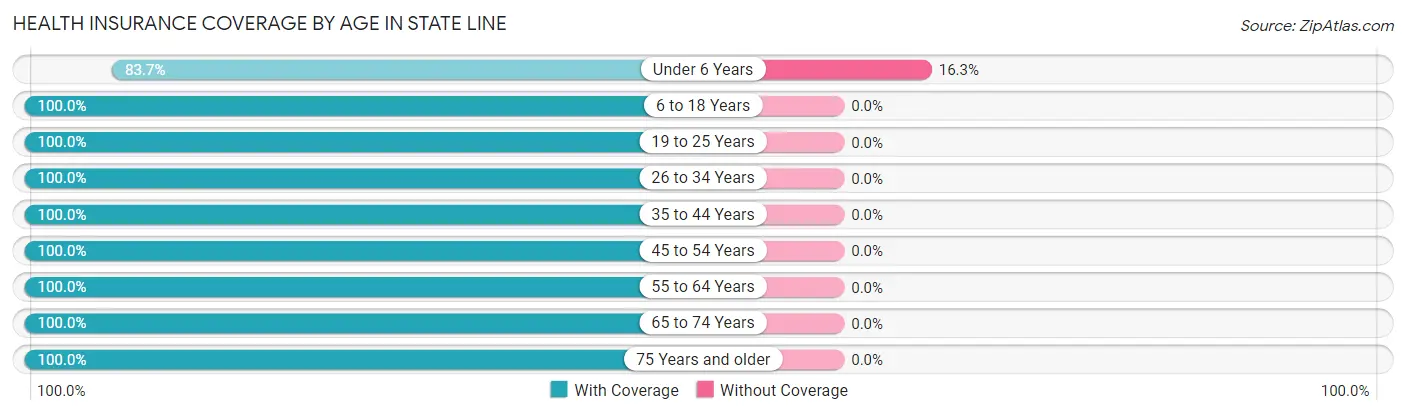
| Age Bracket | With Coverage | Without Coverage |
| Under 6 Years | 282 (83.7%) | 55 (16.3%) |
| 6 to 18 Years | 494 (100.0%) | 0 (0.0%) |
| 19 to 25 Years | 281 (100.0%) | 0 (0.0%) |
| 26 to 34 Years | 650 (100.0%) | 0 (0.0%) |
| 35 to 44 Years | 331 (100.0%) | 0 (0.0%) |
| 45 to 54 Years | 243 (100.0%) | 0 (0.0%) |
| 55 to 64 Years | 639 (100.0%) | 0 (0.0%) |
| 65 to 74 Years | 248 (100.0%) | 0 (0.0%) |
| 75 Years and older | 165 (100.0%) | 0 (0.0%) |
| Total | 3,333 (98.4%) | 55 (1.6%) |
Health Insurance Coverage by Citizenship Status in State Line
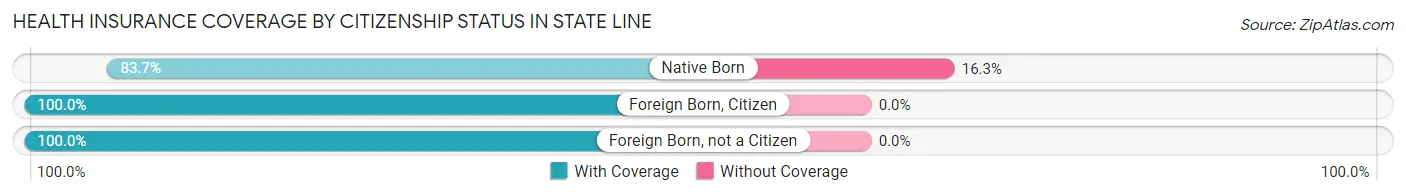
| Citizenship Status | With Coverage | Without Coverage |
| Native Born | 282 (83.7%) | 55 (16.3%) |
| Foreign Born, Citizen | 494 (100.0%) | 0 (0.0%) |
| Foreign Born, not a Citizen | 281 (100.0%) | 0 (0.0%) |
Health Insurance Coverage by Household Income in State Line
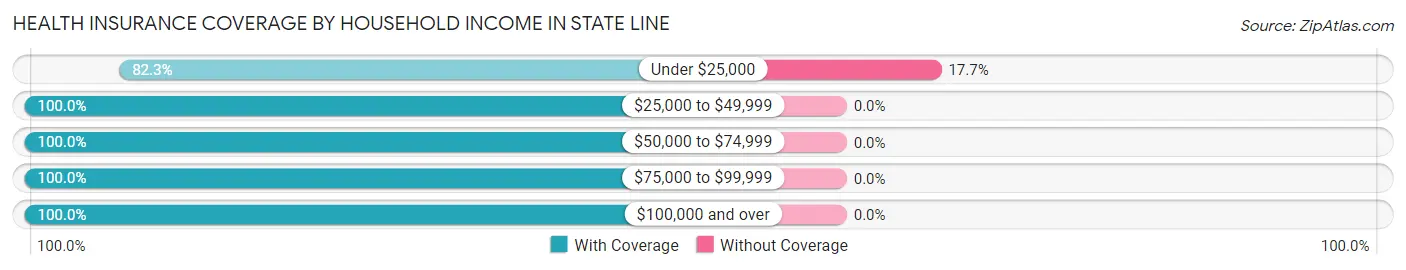
| Household Income | With Coverage | Without Coverage |
| Under $25,000 | 255 (82.3%) | 55 (17.7%) |
| $25,000 to $49,999 | 288 (100.0%) | 0 (0.0%) |
| $50,000 to $74,999 | 875 (100.0%) | 0 (0.0%) |
| $75,000 to $99,999 | 399 (100.0%) | 0 (0.0%) |
| $100,000 and over | 1,516 (100.0%) | 0 (0.0%) |
Public vs Private Health Insurance Coverage by Age in State Line
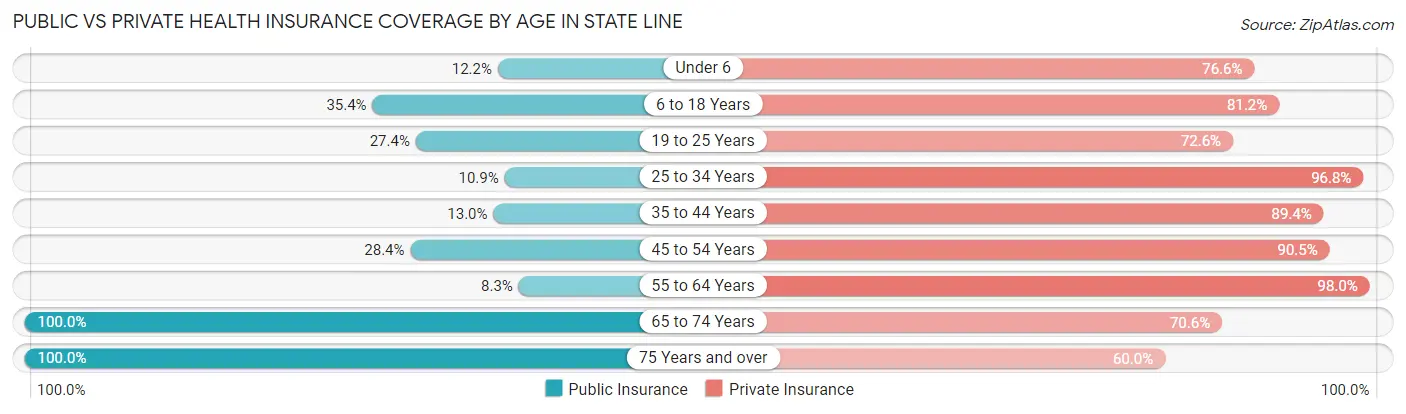
| Age Bracket | Public Insurance | Private Insurance |
| Under 6 | 41 (12.2%) | 258 (76.6%) |
| 6 to 18 Years | 175 (35.4%) | 401 (81.2%) |
| 19 to 25 Years | 77 (27.4%) | 204 (72.6%) |
| 25 to 34 Years | 71 (10.9%) | 629 (96.8%) |
| 35 to 44 Years | 43 (13.0%) | 296 (89.4%) |
| 45 to 54 Years | 69 (28.4%) | 220 (90.5%) |
| 55 to 64 Years | 53 (8.3%) | 626 (98.0%) |
| 65 to 74 Years | 248 (100.0%) | 175 (70.6%) |
| 75 Years and over | 165 (100.0%) | 99 (60.0%) |
| Total | 942 (27.8%) | 2,908 (85.8%) |
Disability Status by Sex by Age in State Line
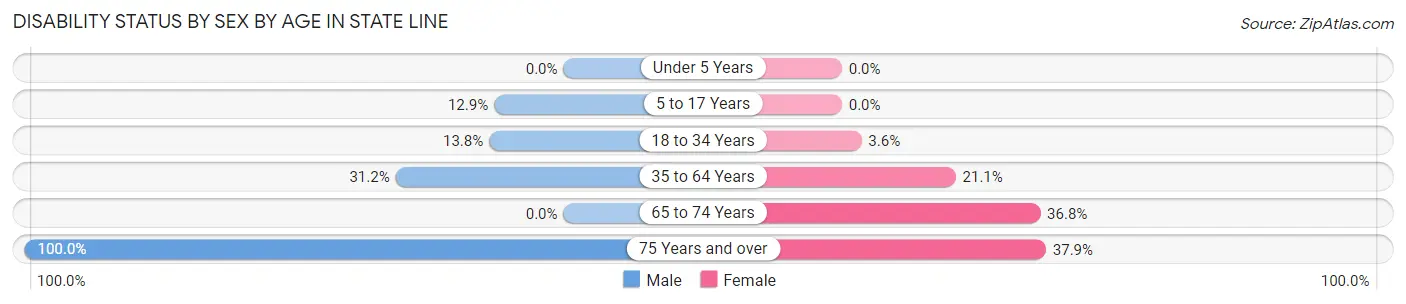
| Age Bracket | Male | Female |
| Under 5 Years | 0 (0.0%) | 0 (0.0%) |
| 5 to 17 Years | 30 (12.9%) | 0 (0.0%) |
| 18 to 34 Years | 83 (13.8%) | 15 (3.6%) |
| 35 to 64 Years | 201 (31.2%) | 120 (21.1%) |
| 65 to 74 Years | 0 (0.0%) | 81 (36.8%) |
| 75 Years and over | 99 (100.0%) | 25 (37.9%) |
Disability Class by Sex by Age in State Line
Disability Class: Hearing Difficulty
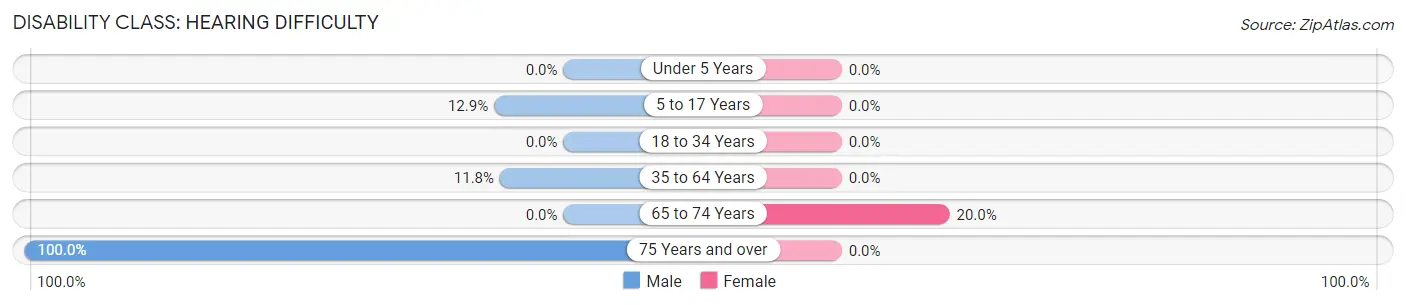
| Age Bracket | Male | Female |
| Under 5 Years | 0 (0.0%) | 0 (0.0%) |
| 5 to 17 Years | 30 (12.9%) | 0 (0.0%) |
| 18 to 34 Years | 0 (0.0%) | 0 (0.0%) |
| 35 to 64 Years | 76 (11.8%) | 0 (0.0%) |
| 65 to 74 Years | 0 (0.0%) | 44 (20.0%) |
| 75 Years and over | 99 (100.0%) | 0 (0.0%) |
Disability Class: Vision Difficulty
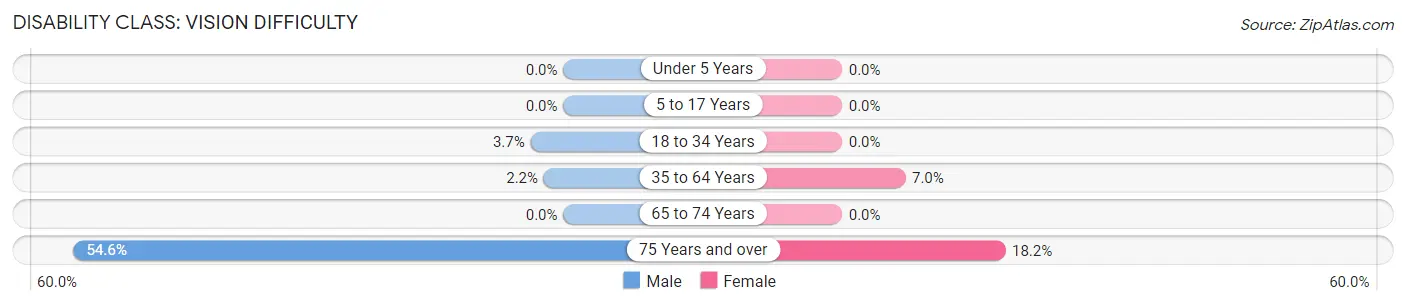
| Age Bracket | Male | Female |
| Under 5 Years | 0 (0.0%) | 0 (0.0%) |
| 5 to 17 Years | 0 (0.0%) | 0 (0.0%) |
| 18 to 34 Years | 22 (3.6%) | 0 (0.0%) |
| 35 to 64 Years | 14 (2.2%) | 40 (7.0%) |
| 65 to 74 Years | 0 (0.0%) | 0 (0.0%) |
| 75 Years and over | 54 (54.5%) | 12 (18.2%) |
Disability Class: Cognitive Difficulty
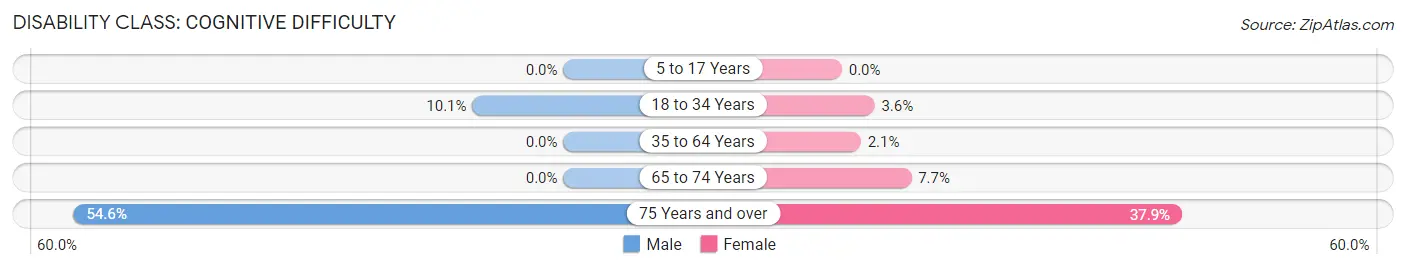
| Age Bracket | Male | Female |
| 5 to 17 Years | 0 (0.0%) | 0 (0.0%) |
| 18 to 34 Years | 61 (10.1%) | 15 (3.6%) |
| 35 to 64 Years | 0 (0.0%) | 12 (2.1%) |
| 65 to 74 Years | 0 (0.0%) | 17 (7.7%) |
| 75 Years and over | 54 (54.5%) | 25 (37.9%) |
Disability Class: Ambulatory Difficulty
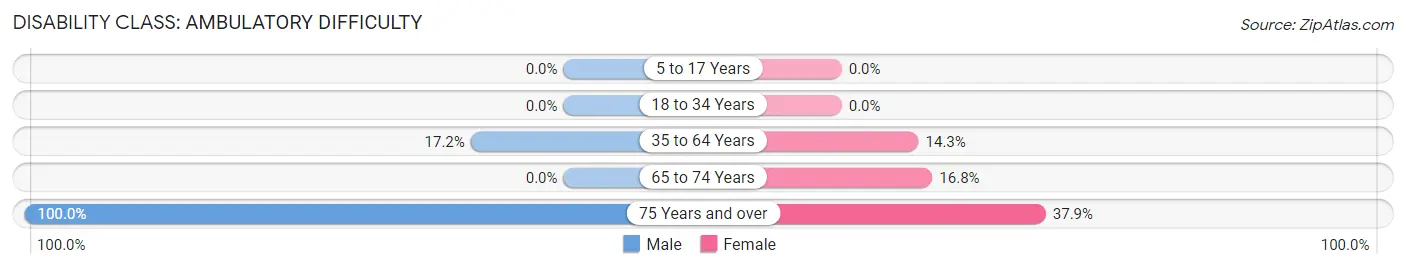
| Age Bracket | Male | Female |
| 5 to 17 Years | 0 (0.0%) | 0 (0.0%) |
| 18 to 34 Years | 0 (0.0%) | 0 (0.0%) |
| 35 to 64 Years | 111 (17.2%) | 81 (14.3%) |
| 65 to 74 Years | 0 (0.0%) | 37 (16.8%) |
| 75 Years and over | 99 (100.0%) | 25 (37.9%) |
Disability Class: Self-Care Difficulty
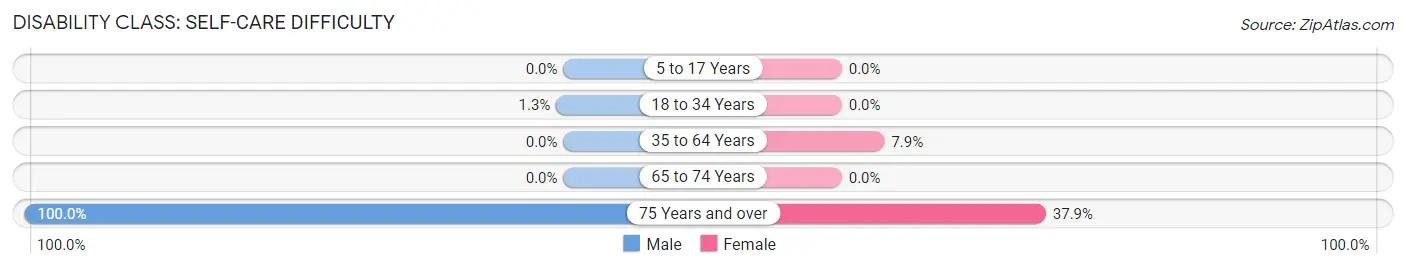
| Age Bracket | Male | Female |
| 5 to 17 Years | 0 (0.0%) | 0 (0.0%) |
| 18 to 34 Years | 8 (1.3%) | 0 (0.0%) |
| 35 to 64 Years | 0 (0.0%) | 45 (7.9%) |
| 65 to 74 Years | 0 (0.0%) | 0 (0.0%) |
| 75 Years and over | 99 (100.0%) | 25 (37.9%) |
Technology Access in State Line
Computing Device Access in State Line
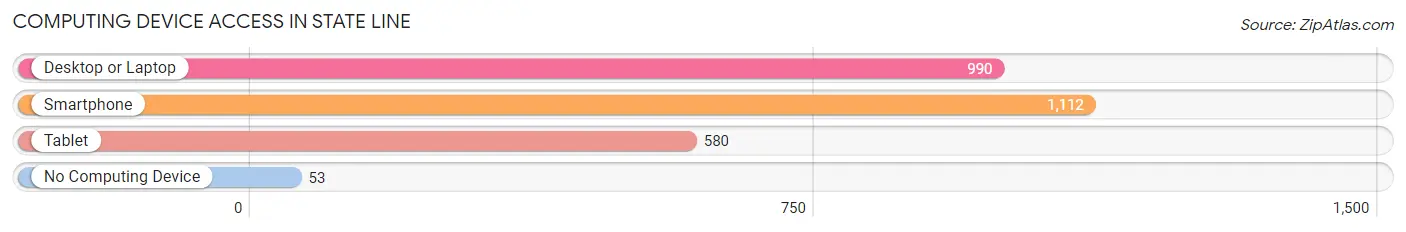
| Device Type | # Households | % Households |
| Desktop or Laptop | 990 | 81.3% |
| Smartphone | 1,112 | 91.3% |
| Tablet | 580 | 47.6% |
| No Computing Device | 53 | 4.3% |
| Total | 1,218 | 100.0% |
Internet Access in State Line
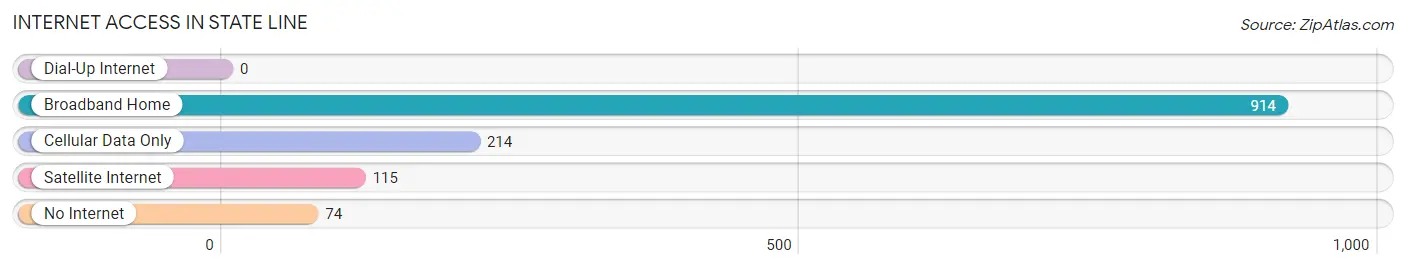
| Internet Type | # Households | % Households |
| Dial-Up Internet | 0 | 0.0% |
| Broadband Home | 914 | 75.0% |
| Cellular Data Only | 214 | 17.6% |
| Satellite Internet | 115 | 9.4% |
| No Internet | 74 | 6.1% |
| Total | 1,218 | 100.0% |
State Line Summary
State Line, Pennsylvania is a small borough located in York County, Pennsylvania. It is situated along the Mason-Dixon Line, which serves as the border between Pennsylvania and Maryland. The population of State Line was 1,093 at the 2010 census.
History
State Line was founded in 1790 by a group of settlers from Maryland. The town was originally known as “Mason’s Line”, named after the Mason-Dixon Line which serves as the border between Pennsylvania and Maryland. The town was later renamed “State Line” in 1820.
State Line was an important stop on the Underground Railroad, a network of secret routes and safe houses used by African-American slaves to escape to freedom in the northern United States and Canada. The town was also a major stop on the Baltimore and Ohio Railroad, which ran through the town from 1832 to 1871.
Geography
State Line is located at 39°45'45" North, 76°45'45" West (39.7625, -76.7625). The borough has a total area of 0.3 square miles, all of which is land.
The town is situated along the Mason-Dixon Line, which serves as the border between Pennsylvania and Maryland. The town is located in the Piedmont region of Pennsylvania, which is characterized by rolling hills and valleys.
Economy
State Line’s economy is largely based on agriculture and tourism. The town is home to several farms, which produce a variety of crops, including corn, soybeans, wheat, and hay.
The town is also a popular tourist destination, due to its proximity to the Mason-Dixon Line and its historical significance. The town is home to several historic sites, including the Mason-Dixon Line Monument, the State Line Inn, and the State Line Railroad Station.
Demographics
As of the 2010 census, the population of State Line was 1,093. The racial makeup of the town was 97.2% White, 0.7% African American, 0.2% Native American, 0.2% Asian, 0.1% from other races, and 1.7% from two or more races. Hispanic or Latino of any race were 0.7% of the population.
The median household income in State Line was $45,000, and the median family income was $50,000. The per capita income for the town was $20,000. About 8.3% of families and 10.2% of the population were below the poverty line, including 14.3% of those under age 18 and 6.3% of those age 65 or over.
Common Questions
What is the Total Population of State Line?
Total Population of State Line is 3,395.
What is the Total Male Population of State Line?
Total Male Population of State Line is 1,793.
What is the Total Female Population of State Line?
Total Female Population of State Line is 1,602.
What is the Ratio of Males per 100 Females in State Line?
There are 111.92 Males per 100 Females in State Line.
What is the Ratio of Females per 100 Males in State Line?
There are 89.35 Females per 100 Males in State Line.
What is the Median Population Age in State Line?
Median Population Age in State Line is 33.3 Years.
What is the Average Family Size in State Line
Average Family Size in State Line is 3.2 People.
What is the Average Household Size in State Line
Average Household Size in State Line is 2.8 People.
What is Per Capita Income in State Line?
Per Capita income in State Line is $32,738.
What is the Median Family Income in State Line?
Median Family Income in State Line is $81,932.
What is the Median Household income in State Line?
Median Household Income in State Line is $82,667.
What is Income or Wage Gap in State Line?
Income or Wage Gap in State Line is 12.1%.
Women in State Line earn 87.9 cents for every dollar earned by a man.
What is Inequality or Gini Index in State Line?
Inequality or Gini Index in State Line is 0.33.
How Large is the Labor Force in State Line?
There are 1,830 People in the Labor Forcein in State Line.
What is the Percentage of People in the Labor Force in State Line?
67.7% of People are in the Labor Force in State Line.
What is the Unemployment Rate in State Line?
Unemployment Rate in State Line is 1.0%.