St Clair borough, PA
St Clair borough Overview
2,765
TOTAL POPULATION
1,343
MALE POPULATION
1,422
FEMALE POPULATION
94.44
MALES / 100 FEMALES
105.88
FEMALES / 100 MALES
46.7
MEDIAN AGE
2.6
AVG FAMILY SIZE
2.2
AVG HOUSEHOLD SIZE
$31,276
PER CAPITA INCOME
$66,533
AVG FAMILY INCOME
$58,371
AVG HOUSEHOLD INCOME
42.2%
WAGE / INCOME GAP [ % ]
57.8¢/ $1
WAGE / INCOME GAP [ $ ]
$8,788
FAMILY INCOME DEFICIT
0.36
INEQUALITY / GINI INDEX
1,510
LABOR FORCE [ PEOPLE ]
62.7%
PERCENT IN LABOR FORCE
1.1%
UNEMPLOYMENT RATE
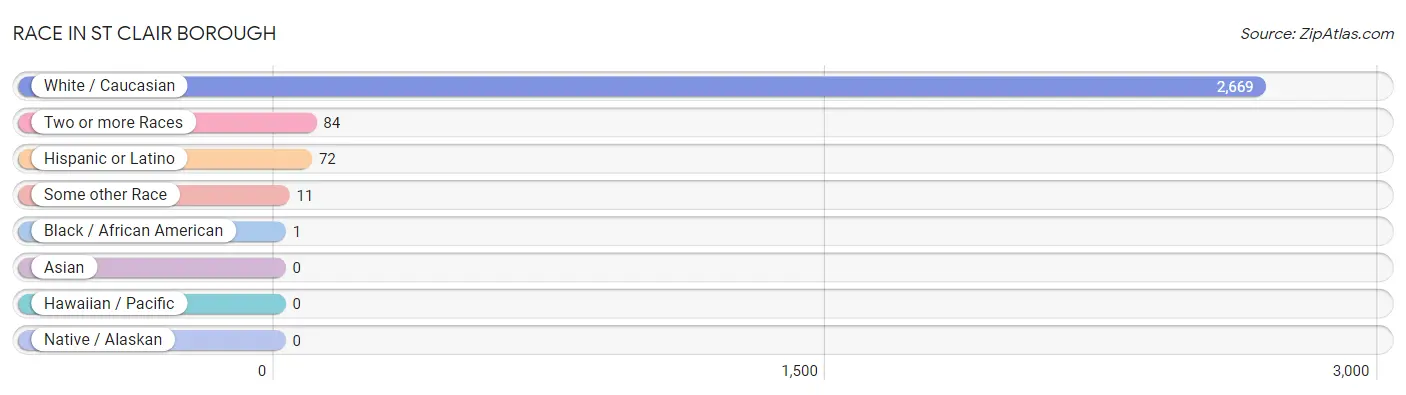
Race in St Clair borough
The most populous races in St Clair borough are White / Caucasian (2,669 | 96.5%), Two or more Races (84 | 3.0%), and Hispanic or Latino (72 | 2.6%).
| Race | # Population | % Population |
| Asian | 0 | 0.0% |
| Black / African American | 1 | 0.0% |
| Hawaiian / Pacific | 0 | 0.0% |
| Hispanic or Latino | 72 | 2.6% |
| Native / Alaskan | 0 | 0.0% |
| White / Caucasian | 2,669 | 96.5% |
| Two or more Races | 84 | 3.0% |
| Some other Race | 11 | 0.4% |
| Total | 2,765 | 100.0% |
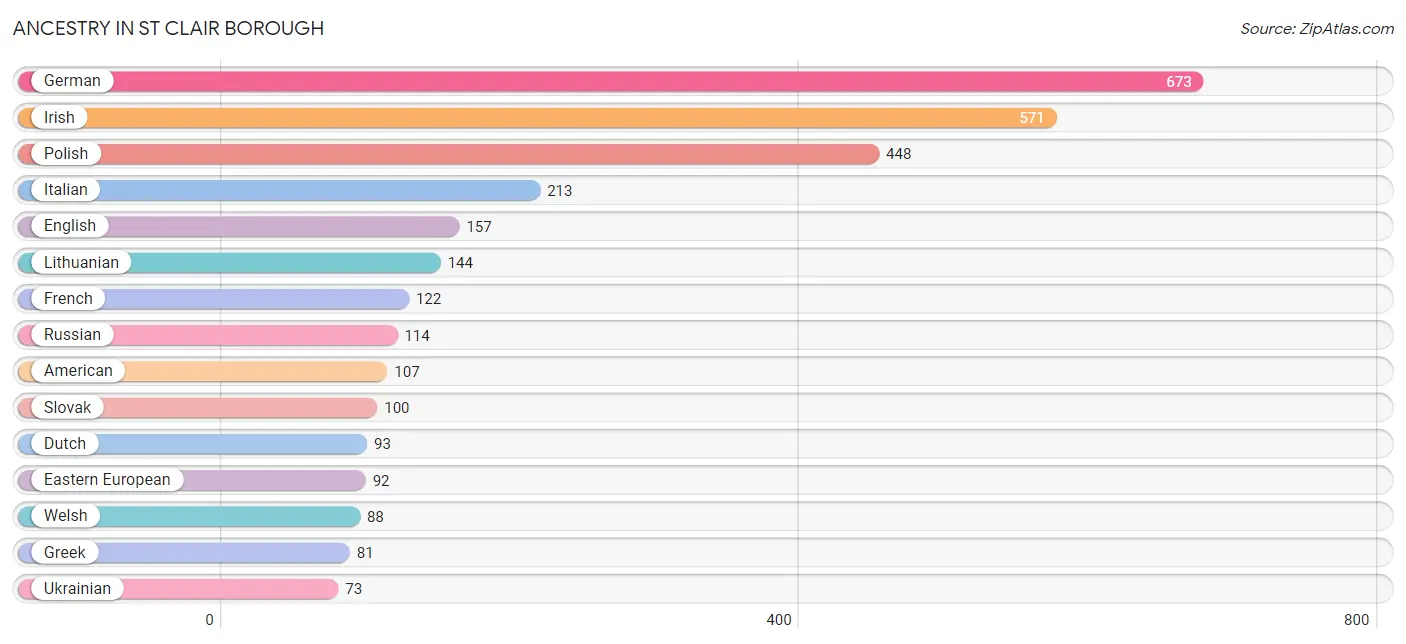
Ancestry in St Clair borough
The most populous ancestries reported in St Clair borough are German (673 | 24.3%), Irish (571 | 20.6%), Polish (448 | 16.2%), Italian (213 | 7.7%), and English (157 | 5.7%), together accounting for 74.6% of all St Clair borough residents.
| Ancestry | # Population | % Population |
| American | 107 | 3.9% |
| Arab | 17 | 0.6% |
| Austrian | 26 | 0.9% |
| British | 15 | 0.5% |
| Carpatho Rusyn | 28 | 1.0% |
| Colombian | 54 | 1.9% |
| Czech | 16 | 0.6% |
| Dutch | 93 | 3.4% |
| Eastern European | 92 | 3.3% |
| English | 157 | 5.7% |
| European | 47 | 1.7% |
| French | 122 | 4.4% |
| German | 673 | 24.3% |
| Greek | 81 | 2.9% |
| Hungarian | 46 | 1.7% |
| Irish | 571 | 20.6% |
| Italian | 213 | 7.7% |
| Lebanese | 17 | 0.6% |
| Lithuanian | 144 | 5.2% |
| Macedonian | 40 | 1.5% |
| Pennsylvania German | 8 | 0.3% |
| Polish | 448 | 16.2% |
| Puerto Rican | 18 | 0.6% |
| Russian | 114 | 4.1% |
| Slovak | 100 | 3.6% |
| South American | 54 | 1.9% |
| Ukrainian | 73 | 2.6% |
| Welsh | 88 | 3.2% | View All 28 Rows |
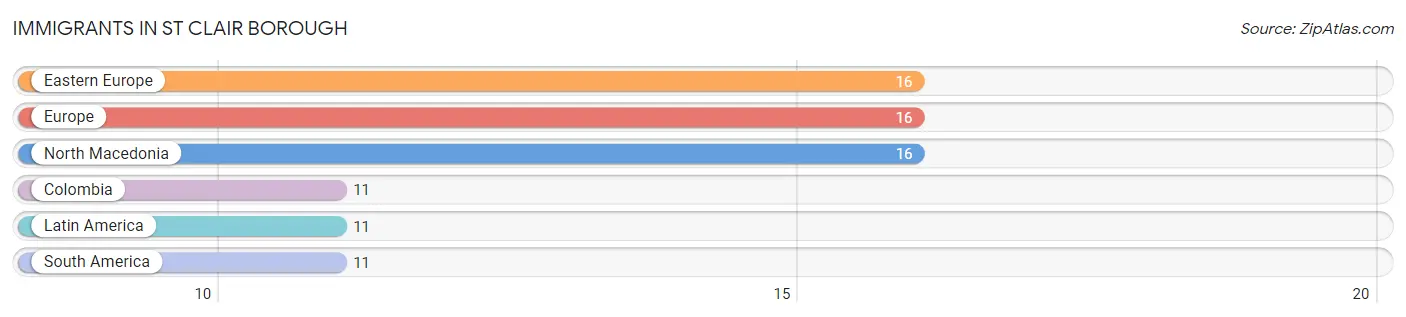
Immigrants in St Clair borough
The most numerous immigrant groups reported in St Clair borough came from Eastern Europe (16 | 0.6%), Europe (16 | 0.6%), North Macedonia (16 | 0.6%), Colombia (11 | 0.4%), and Latin America (11 | 0.4%), together accounting for 2.5% of all St Clair borough residents.
| Immigration Origin | # Population | % Population |
| Colombia | 11 | 0.4% |
| Eastern Europe | 16 | 0.6% |
| Europe | 16 | 0.6% |
| Latin America | 11 | 0.4% |
| North Macedonia | 16 | 0.6% |
| South America | 11 | 0.4% | View All 6 Rows |
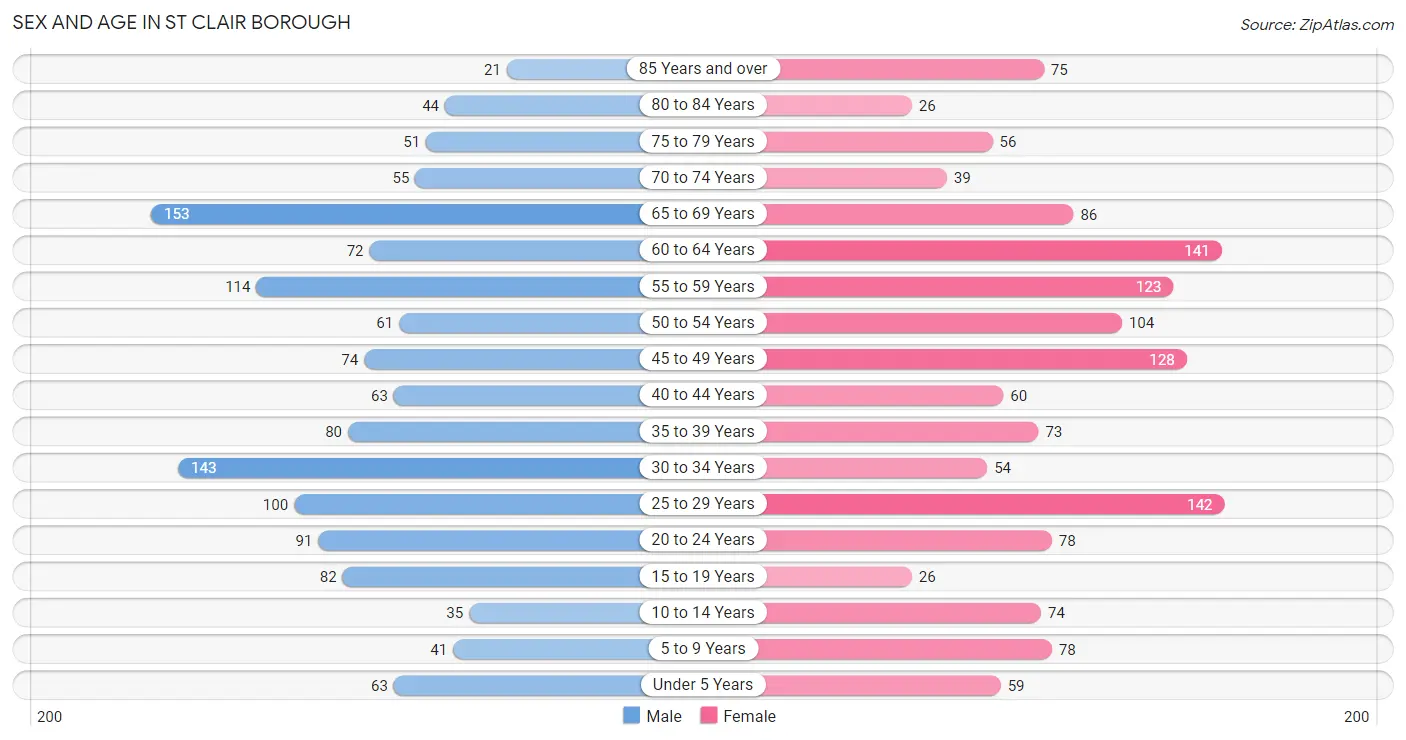
Sex and Age in St Clair borough
Sex and Age in St Clair borough
The most populous age groups in St Clair borough are 65 to 69 Years (153 | 11.4%) for men and 25 to 29 Years (142 | 10.0%) for women.
| Age Bracket | Male | Female |
| Under 5 Years | 63 (4.7%) | 59 (4.2%) |
| 5 to 9 Years | 41 (3.0%) | 78 (5.5%) |
| 10 to 14 Years | 35 (2.6%) | 74 (5.2%) |
| 15 to 19 Years | 82 (6.1%) | 26 (1.8%) |
| 20 to 24 Years | 91 (6.8%) | 78 (5.5%) |
| 25 to 29 Years | 100 (7.4%) | 142 (10.0%) |
| 30 to 34 Years | 143 (10.6%) | 54 (3.8%) |
| 35 to 39 Years | 80 (6.0%) | 73 (5.1%) |
| 40 to 44 Years | 63 (4.7%) | 60 (4.2%) |
| 45 to 49 Years | 74 (5.5%) | 128 (9.0%) |
| 50 to 54 Years | 61 (4.5%) | 104 (7.3%) |
| 55 to 59 Years | 114 (8.5%) | 123 (8.6%) |
| 60 to 64 Years | 72 (5.4%) | 141 (9.9%) |
| 65 to 69 Years | 153 (11.4%) | 86 (6.0%) |
| 70 to 74 Years | 55 (4.1%) | 39 (2.7%) |
| 75 to 79 Years | 51 (3.8%) | 56 (3.9%) |
| 80 to 84 Years | 44 (3.3%) | 26 (1.8%) |
| 85 Years and over | 21 (1.6%) | 75 (5.3%) |
| Total | 1,343 (100.0%) | 1,422 (100.0%) |
Families and Households in St Clair borough
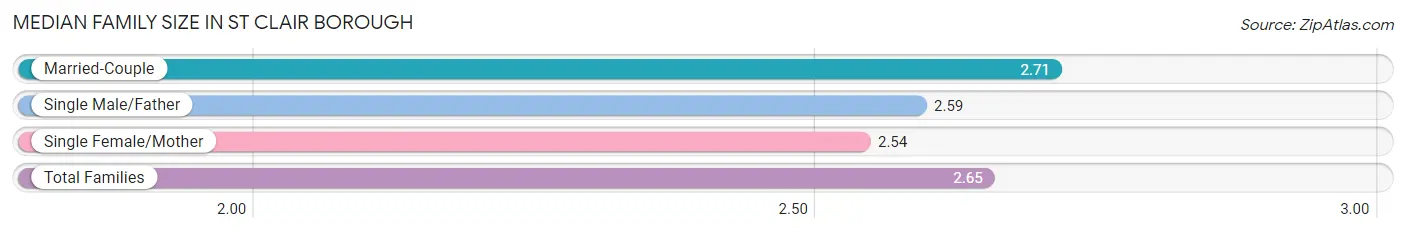
Median Family Size in St Clair borough
The median family size in St Clair borough is 2.65 persons per family, with married-couple families (439 | 59.9%) accounting for the largest median family size of 2.71 persons per family. On the other hand, single female/mother families (173 | 23.6%) represent the smallest median family size with 2.54 persons per family.
| Family Type | # Families | Family Size |
| Married-Couple | 439 (59.9%) | 2.71 |
| Single Male/Father | 121 (16.5%) | 2.59 |
| Single Female/Mother | 173 (23.6%) | 2.54 |
| Total Families | 733 (100.0%) | 2.65 |
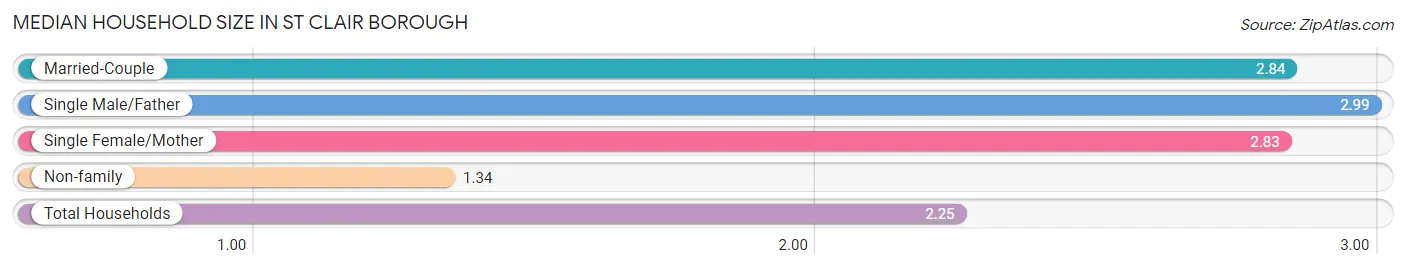
Median Household Size in St Clair borough
The median household size in St Clair borough is 2.25 persons per household, with single male/father households (121 | 9.9%) accounting for the largest median household size of 2.99 persons per household. non-family households (494 | 40.3%) represent the smallest median household size with 1.34 persons per household.
| Household Type | # Households | Household Size |
| Married-Couple | 439 (35.8%) | 2.84 |
| Single Male/Father | 121 (9.9%) | 2.99 |
| Single Female/Mother | 173 (14.1%) | 2.83 |
| Non-family | 494 (40.3%) | 1.34 |
| Total Households | 1,227 (100.0%) | 2.25 |
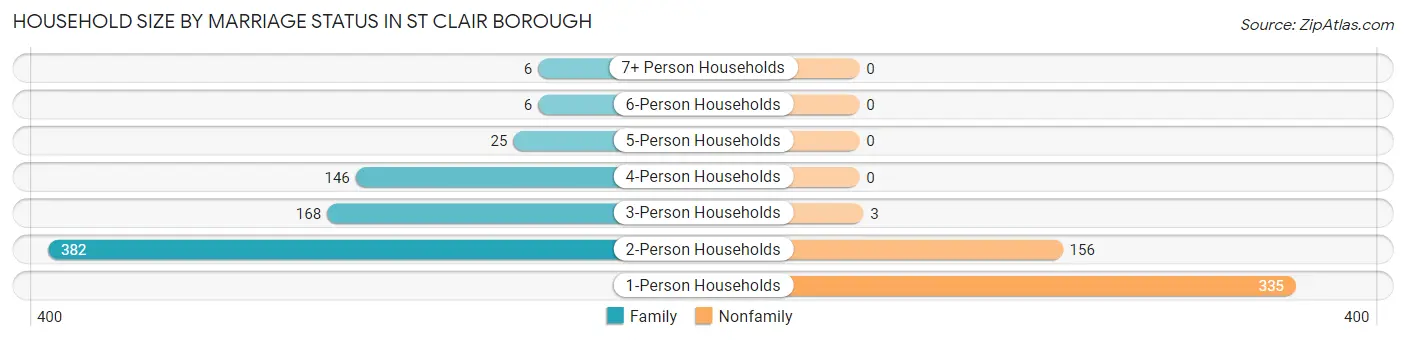
Household Size by Marriage Status in St Clair borough
Out of a total of 1,227 households in St Clair borough, 733 (59.7%) are family households, while 494 (40.3%) are nonfamily households. The most numerous type of family households are 2-person households, comprising 382, and the most common type of nonfamily households are 1-person households, comprising 335.
| Household Size | Family Households | Nonfamily Households |
| 1-Person Households | - | 335 (27.3%) |
| 2-Person Households | 382 (31.1%) | 156 (12.7%) |
| 3-Person Households | 168 (13.7%) | 3 (0.2%) |
| 4-Person Households | 146 (11.9%) | 0 (0.0%) |
| 5-Person Households | 25 (2.0%) | 0 (0.0%) |
| 6-Person Households | 6 (0.5%) | 0 (0.0%) |
| 7+ Person Households | 6 (0.5%) | 0 (0.0%) |
| Total | 733 (59.7%) | 494 (40.3%) |
Female Fertility in St Clair borough
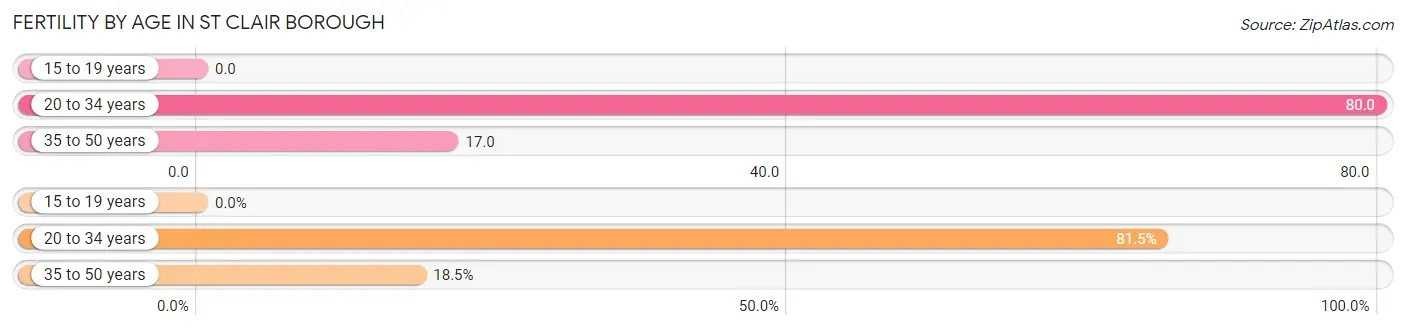
Fertility by Age in St Clair borough
Average fertility rate in St Clair borough is 45.0 births per 1,000 women. Women in the age bracket of 20 to 34 years have the highest fertility rate with 80.0 births per 1,000 women. Women in the age bracket of 20 to 34 years acount for 81.5% of all women with births.
| Age Bracket | Women with Births | Births / 1,000 Women |
| 15 to 19 years | 0 (0.0%) | 0.0 |
| 20 to 34 years | 22 (81.5%) | 80.0 |
| 35 to 50 years | 5 (18.5%) | 17.0 |
| Total | 27 (100.0%) | 45.0 |
Fertility by Age by Marriage Status in St Clair borough
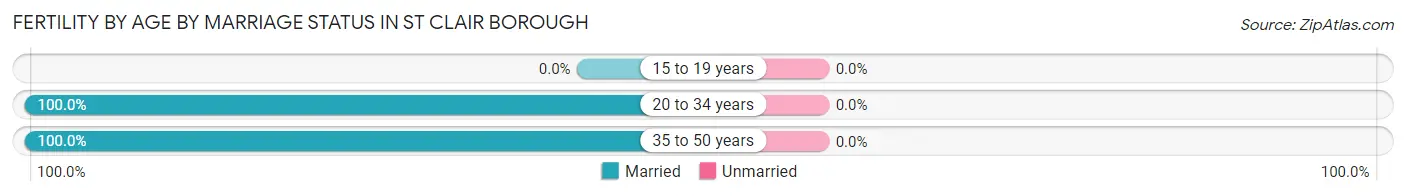
| Age Bracket | Married | Unmarried |
| 15 to 19 years | 0 (0.0%) | 0 (0.0%) |
| 20 to 34 years | 22 (100.0%) | 0 (0.0%) |
| 35 to 50 years | 5 (100.0%) | 0 (0.0%) |
| Total | 27 (100.0%) | 0 (0.0%) |
Fertility by Education in St Clair borough
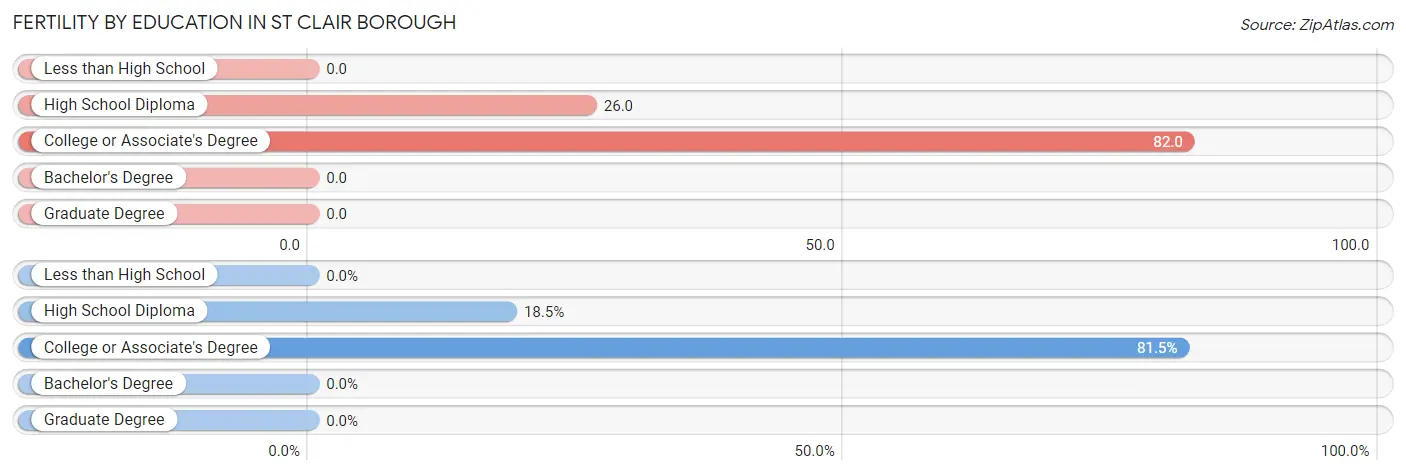
| Educational Attainment | Women with Births | Births / 1,000 Women |
| Less than High School | 0 (0.0%) | 0.0 |
| High School Diploma | 5 (18.5%) | 26.0 |
| College or Associate's Degree | 22 (81.5%) | 82.0 |
| Bachelor's Degree | 0 (0.0%) | 0.0 |
| Graduate Degree | 0 (0.0%) | 0.0 |
| Total | 27 (100.0%) | 45.0 |
Fertility by Education by Marriage Status in St Clair borough
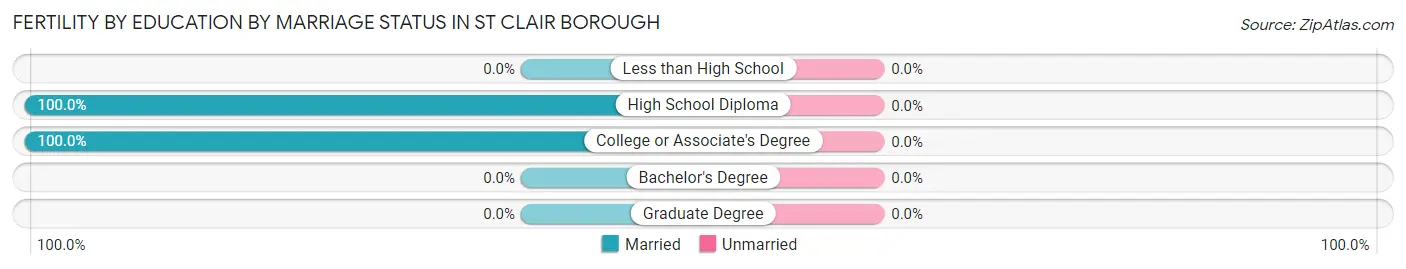
| Educational Attainment | Married | Unmarried |
| Less than High School | 0 (0.0%) | 0 (0.0%) |
| High School Diploma | 5 (100.0%) | 0 (0.0%) |
| College or Associate's Degree | 22 (100.0%) | 0 (0.0%) |
| Bachelor's Degree | 0 (0.0%) | 0 (0.0%) |
| Graduate Degree | 0 (0.0%) | 0 (0.0%) |
| Total | 27 (100.0%) | 0 (0.0%) |
Income in St Clair borough
Income Overview in St Clair borough
Per Capita Income in St Clair borough is $31,276, while median incomes of families and households are $66,533 and $58,371 respectively.
| Characteristic | Number | Measure |
| Per Capita Income | 2,765 | $31,276 |
| Median Family Income | 733 | $66,533 |
| Mean Family Income | 733 | $74,350 |
| Median Household Income | 1,227 | $58,371 |
| Mean Household Income | 1,227 | $69,146 |
| Income Deficit | 733 | $8,788 |
| Wage / Income Gap (%) | 2,765 | 42.16% |
| Wage / Income Gap ($) | 2,765 | 57.84¢ per $1 |
| Gini / Inequality Index | 2,765 | 0.36 |
Earnings by Sex in St Clair borough
Average Earnings in St Clair borough are $36,207, $45,313 for men and $26,210 for women, a difference of 42.2%.
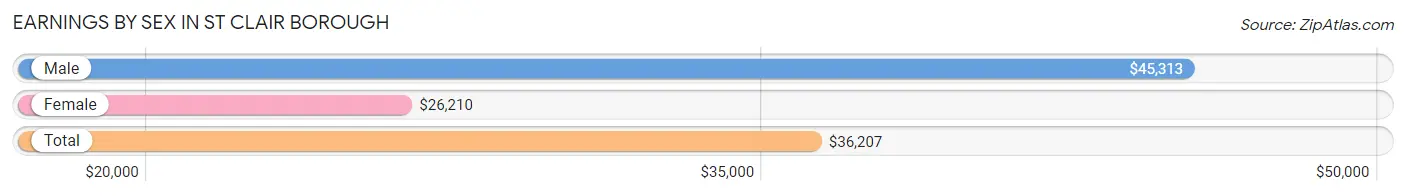
| Sex | Number | Average Earnings |
| Male | 792 (50.9%) | $45,313 |
| Female | 764 (49.1%) | $26,210 |
| Total | 1,556 (100.0%) | $36,207 |
Earnings by Sex by Income Bracket in St Clair borough
The most common earnings brackets in St Clair borough are $50,000 to $54,999 for men (89 | 11.2%) and $25,000 to $29,999 for women (109 | 14.3%).
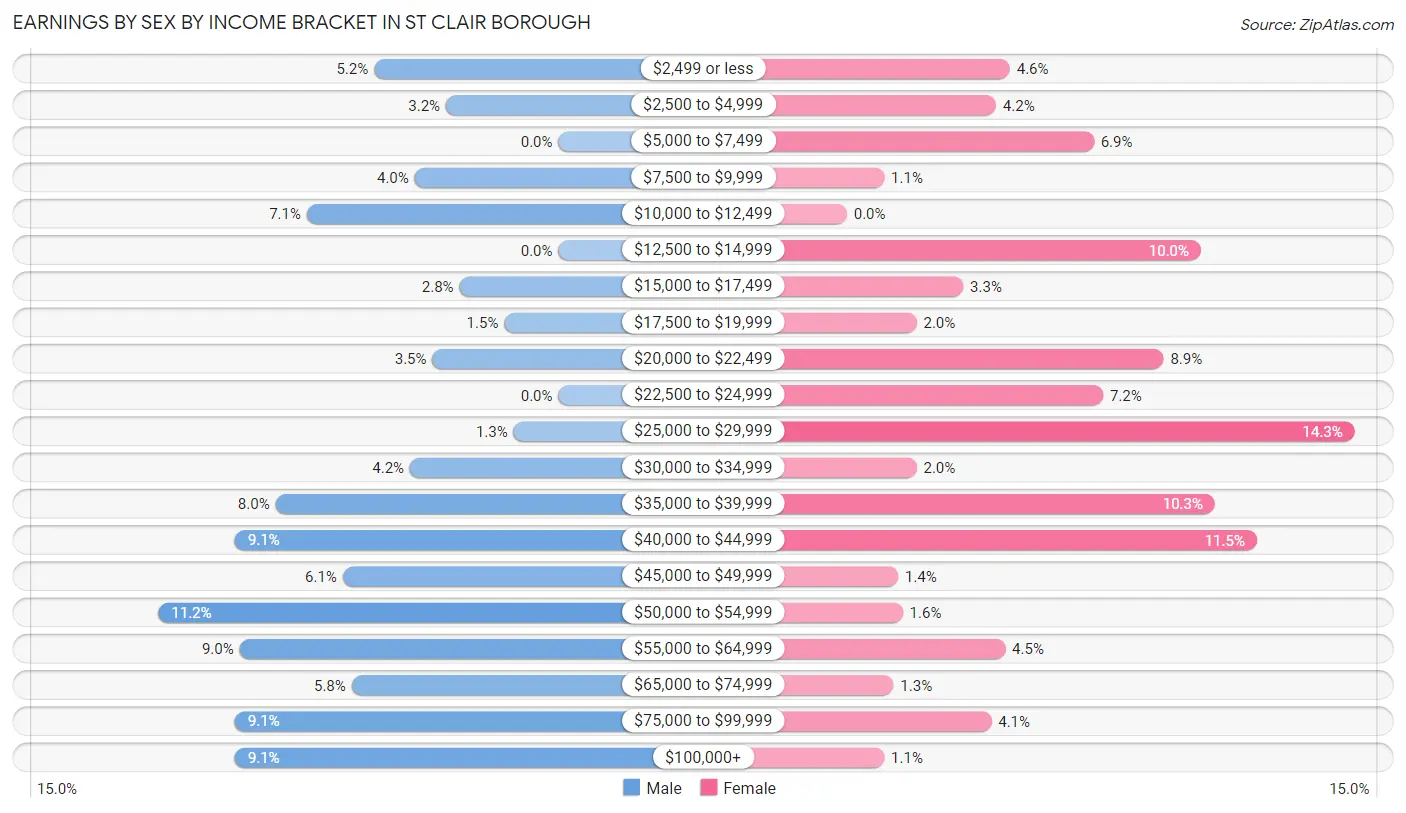
| Income | Male | Female |
| $2,499 or less | 41 (5.2%) | 35 (4.6%) |
| $2,500 to $4,999 | 25 (3.2%) | 32 (4.2%) |
| $5,000 to $7,499 | 0 (0.0%) | 53 (6.9%) |
| $7,500 to $9,999 | 32 (4.0%) | 8 (1.1%) |
| $10,000 to $12,499 | 56 (7.1%) | 0 (0.0%) |
| $12,500 to $14,999 | 0 (0.0%) | 76 (10.0%) |
| $15,000 to $17,499 | 22 (2.8%) | 25 (3.3%) |
| $17,500 to $19,999 | 12 (1.5%) | 15 (2.0%) |
| $20,000 to $22,499 | 28 (3.5%) | 68 (8.9%) |
| $22,500 to $24,999 | 0 (0.0%) | 55 (7.2%) |
| $25,000 to $29,999 | 10 (1.3%) | 109 (14.3%) |
| $30,000 to $34,999 | 33 (4.2%) | 15 (2.0%) |
| $35,000 to $39,999 | 63 (8.0%) | 79 (10.3%) |
| $40,000 to $44,999 | 72 (9.1%) | 88 (11.5%) |
| $45,000 to $49,999 | 48 (6.1%) | 11 (1.4%) |
| $50,000 to $54,999 | 89 (11.2%) | 12 (1.6%) |
| $55,000 to $64,999 | 71 (9.0%) | 34 (4.4%) |
| $65,000 to $74,999 | 46 (5.8%) | 10 (1.3%) |
| $75,000 to $99,999 | 72 (9.1%) | 31 (4.1%) |
| $100,000+ | 72 (9.1%) | 8 (1.1%) |
| Total | 792 (100.0%) | 764 (100.0%) |
Earnings by Sex by Educational Attainment in St Clair borough
Average earnings in St Clair borough are $49,453 for men and $27,772 for women, a difference of 43.8%. Men with an educational attainment of bachelor's degree enjoy the highest average annual earnings of $51,250, while those with high school diploma education earn the least with $47,083. Women with an educational attainment of graduate degree earn the most with the average annual earnings of $77,083, while those with less than high school education have the smallest earnings of $19,583.
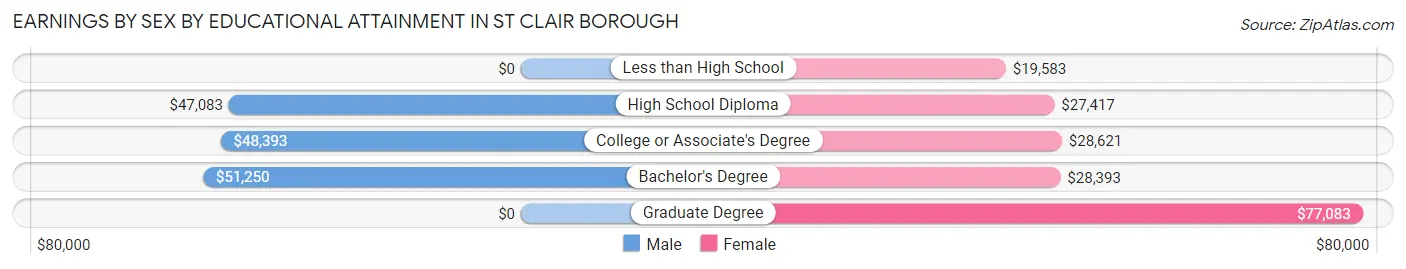
| Educational Attainment | Male Income | Female Income |
| Less than High School | - | - |
| High School Diploma | $47,083 | $27,417 |
| College or Associate's Degree | $48,393 | $28,621 |
| Bachelor's Degree | $51,250 | $28,393 |
| Graduate Degree | - | - |
| Total | $49,453 | $27,772 |
Family Income in St Clair borough
Family Income Brackets in St Clair borough
According to the St Clair borough family income data, there are 186 families falling into the $75,000 to $99,999 income range, which is the most common income bracket and makes up 25.4% of all families.
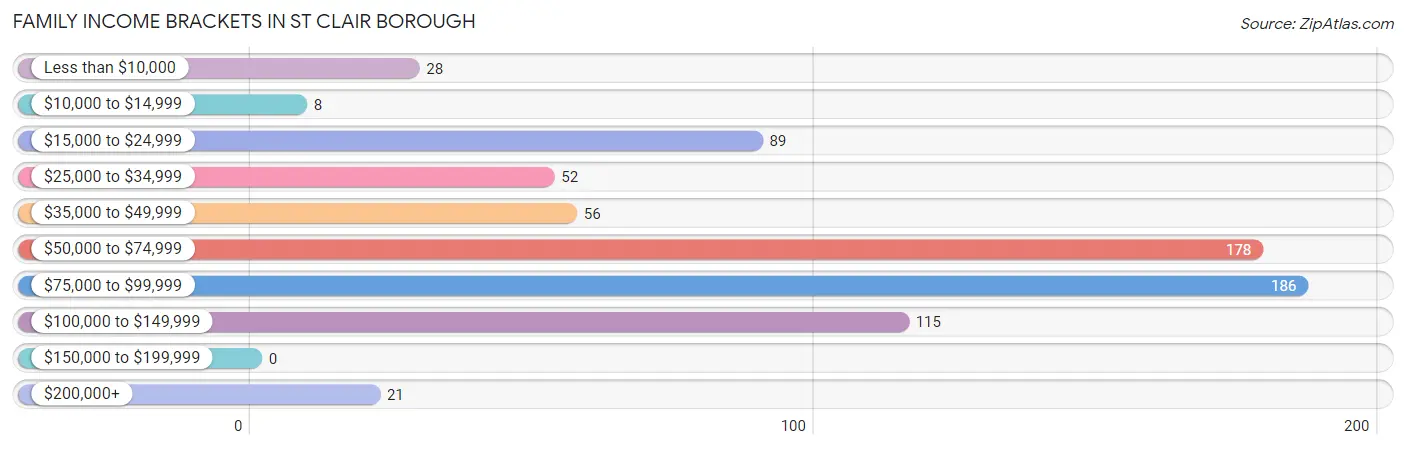
| Income Bracket | # Families | % Families |
| Less than $10,000 | 28 | 3.8% |
| $10,000 to $14,999 | 8 | 1.1% |
| $15,000 to $24,999 | 89 | 12.1% |
| $25,000 to $34,999 | 52 | 7.1% |
| $35,000 to $49,999 | 56 | 7.6% |
| $50,000 to $74,999 | 178 | 24.3% |
| $75,000 to $99,999 | 186 | 25.4% |
| $100,000 to $149,999 | 115 | 15.7% |
| $150,000 to $199,999 | 0 | 0.0% |
| $200,000+ | 21 | 2.9% |
Family Income by Famaliy Size in St Clair borough
5-person families (37 | 5.1%) account for the highest median family income in St Clair borough with $117,292 per family, while 2-person families (443 | 60.4%) have the highest median income of $33,096 per family member.
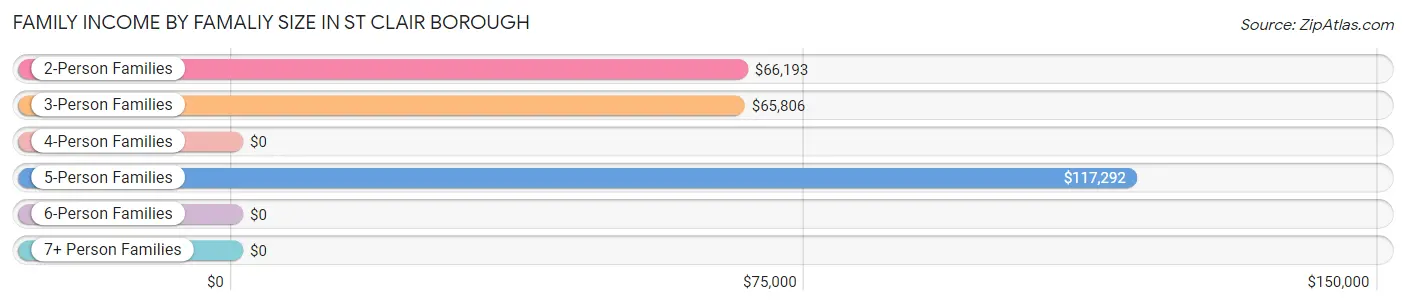
| Income Bracket | # Families | Median Income |
| 2-Person Families | 443 (60.4%) | $66,193 |
| 3-Person Families | 172 (23.5%) | $65,806 |
| 4-Person Families | 81 (11.1%) | $0 |
| 5-Person Families | 37 (5.1%) | $117,292 |
| 6-Person Families | 0 (0.0%) | $0 |
| 7+ Person Families | 0 (0.0%) | $0 |
| Total | 733 (100.0%) | $66,533 |
Family Income by Number of Earners in St Clair borough
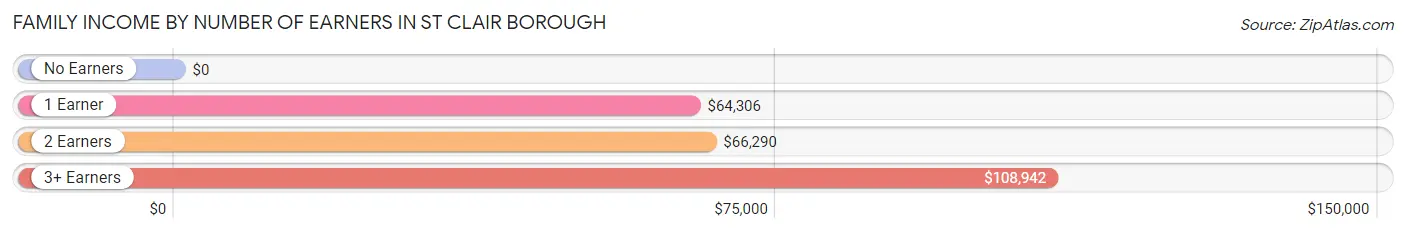
| Number of Earners | # Families | Median Income |
| No Earners | 104 (14.2%) | $0 |
| 1 Earner | 341 (46.5%) | $64,306 |
| 2 Earners | 198 (27.0%) | $66,290 |
| 3+ Earners | 90 (12.3%) | $108,942 |
| Total | 733 (100.0%) | $66,533 |
Household Income in St Clair borough
Household Income Brackets in St Clair borough
With 312 households falling in the category, the $50,000 to $74,999 income range is the most frequent in St Clair borough, accounting for 25.4% of all households. In contrast, only 20 households (1.6%) fall into the less than $10,000 income bracket, making it the least populous group.
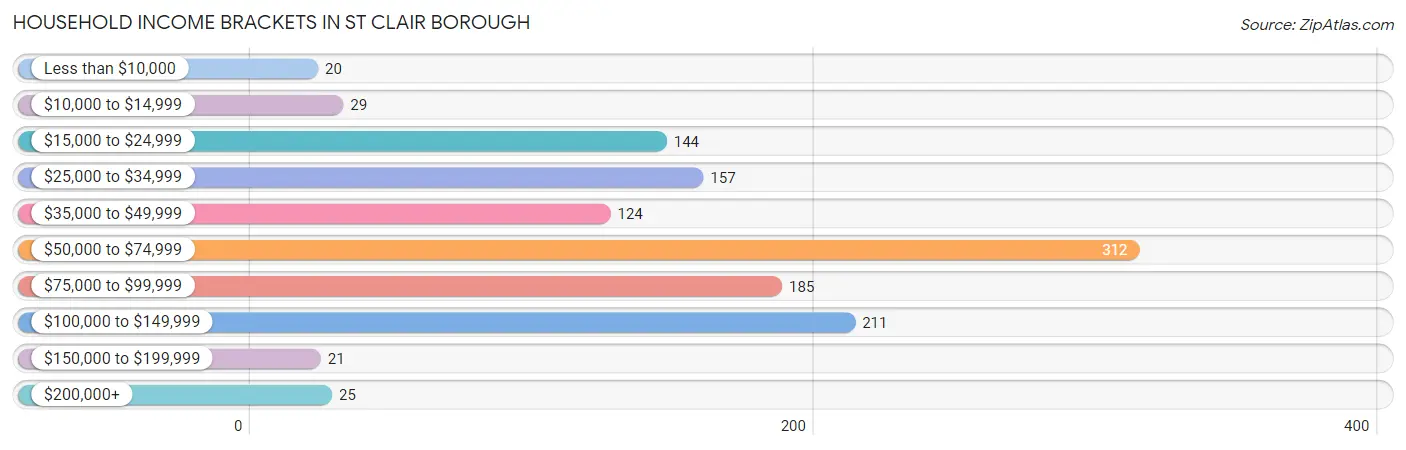
| Income Bracket | # Households | % Households |
| Less than $10,000 | 20 | 1.6% |
| $10,000 to $14,999 | 29 | 2.4% |
| $15,000 to $24,999 | 144 | 11.7% |
| $25,000 to $34,999 | 157 | 12.8% |
| $35,000 to $49,999 | 124 | 10.1% |
| $50,000 to $74,999 | 312 | 25.4% |
| $75,000 to $99,999 | 185 | 15.1% |
| $100,000 to $149,999 | 211 | 17.2% |
| $150,000 to $199,999 | 21 | 1.7% |
| $200,000+ | 25 | 2.0% |
Household Income by Householder Age in St Clair borough
The median household income in St Clair borough is $58,371, with the highest median household income of $63,882 found in the 45 to 64 years age bracket for the primary householder. A total of 560 households (45.6%) fall into this category. Meanwhile, the 15 to 24 years age bracket for the primary householder has the lowest median household income of $0, with 23 households (1.9%) in this group.
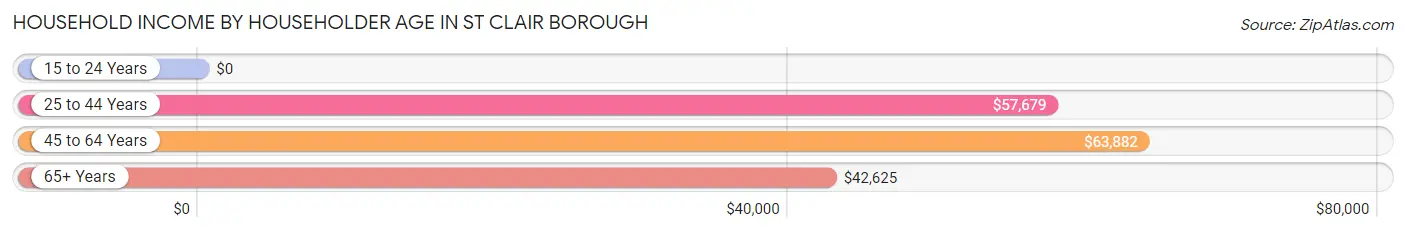
| Income Bracket | # Households | Median Income |
| 15 to 24 Years | 23 (1.9%) | $0 |
| 25 to 44 Years | 325 (26.5%) | $57,679 |
| 45 to 64 Years | 560 (45.6%) | $63,882 |
| 65+ Years | 319 (26.0%) | $42,625 |
| Total | 1,227 (100.0%) | $58,371 |
Poverty in St Clair borough
Income Below Poverty by Sex and Age in St Clair borough
With 6.2% poverty level for males and 16.7% for females among the residents of St Clair borough, 5 year old males and 35 to 44 year old females are the most vulnerable to poverty, with 7 males (100.0%) and 56 females (42.1%) in their respective age groups living below the poverty level.
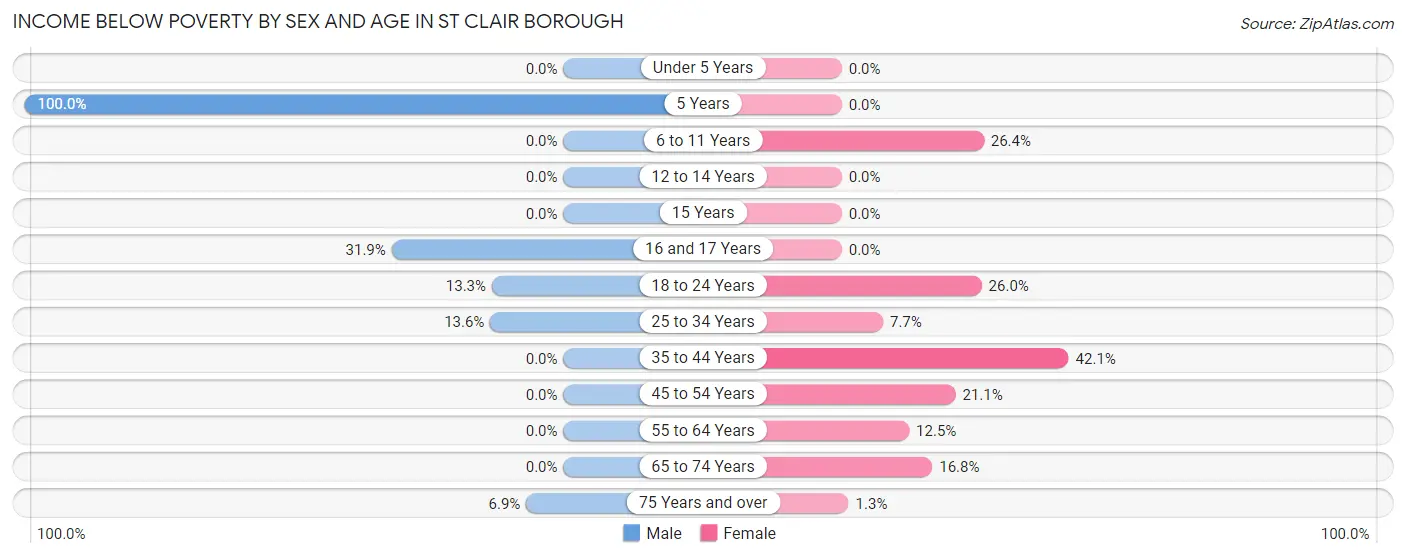
| Age Bracket | Male | Female |
| Under 5 Years | 0 (0.0%) | 0 (0.0%) |
| 5 Years | 7 (100.0%) | 0 (0.0%) |
| 6 to 11 Years | 0 (0.0%) | 34 (26.4%) |
| 12 to 14 Years | 0 (0.0%) | 0 (0.0%) |
| 15 Years | 0 (0.0%) | 0 (0.0%) |
| 16 and 17 Years | 22 (31.9%) | 0 (0.0%) |
| 18 to 24 Years | 13 (13.3%) | 27 (26.0%) |
| 25 to 34 Years | 33 (13.6%) | 15 (7.6%) |
| 35 to 44 Years | 0 (0.0%) | 56 (42.1%) |
| 45 to 54 Years | 0 (0.0%) | 49 (21.1%) |
| 55 to 64 Years | 0 (0.0%) | 33 (12.5%) |
| 65 to 74 Years | 0 (0.0%) | 21 (16.8%) |
| 75 Years and over | 8 (6.9%) | 2 (1.3%) |
| Total | 83 (6.2%) | 237 (16.7%) |
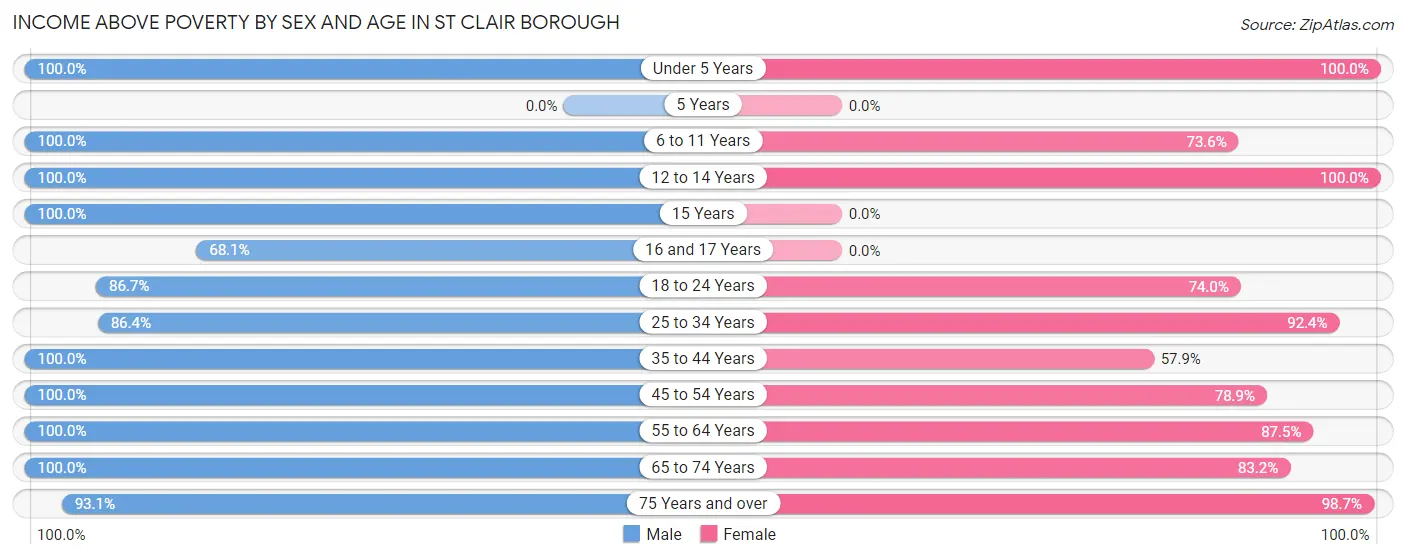
Income Above Poverty by Sex and Age in St Clair borough
According to the poverty statistics in St Clair borough, males aged under 5 years and females aged under 5 years are the age groups that are most secure financially, with 100.0% of males and 100.0% of females in these age groups living above the poverty line.
| Age Bracket | Male | Female |
| Under 5 Years | 63 (100.0%) | 59 (100.0%) |
| 5 Years | 0 (0.0%) | 0 (0.0%) |
| 6 to 11 Years | 52 (100.0%) | 95 (73.6%) |
| 12 to 14 Years | 17 (100.0%) | 22 (100.0%) |
| 15 Years | 6 (100.0%) | 0 (0.0%) |
| 16 and 17 Years | 47 (68.1%) | 0 (0.0%) |
| 18 to 24 Years | 85 (86.7%) | 77 (74.0%) |
| 25 to 34 Years | 210 (86.4%) | 181 (92.3%) |
| 35 to 44 Years | 143 (100.0%) | 77 (57.9%) |
| 45 to 54 Years | 135 (100.0%) | 183 (78.9%) |
| 55 to 64 Years | 186 (100.0%) | 231 (87.5%) |
| 65 to 74 Years | 208 (100.0%) | 104 (83.2%) |
| 75 Years and over | 108 (93.1%) | 155 (98.7%) |
| Total | 1,260 (93.8%) | 1,184 (83.3%) |
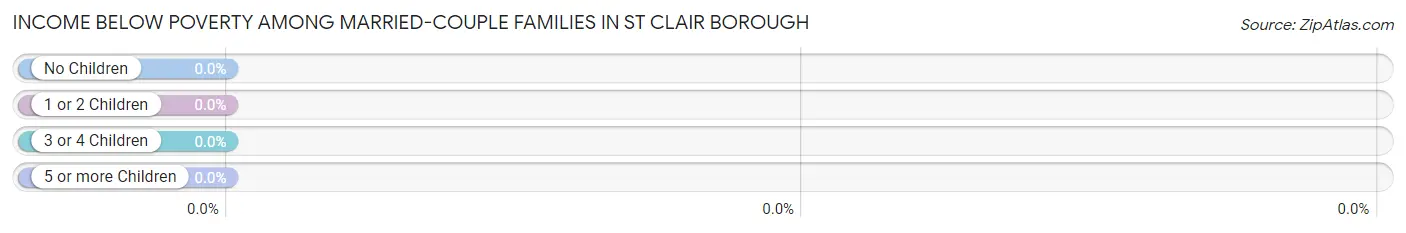
Income Below Poverty Among Married-Couple Families in St Clair borough
| Children | Above Poverty | Below Poverty |
| No Children | 300 (100.0%) | 0 (0.0%) |
| 1 or 2 Children | 126 (100.0%) | 0 (0.0%) |
| 3 or 4 Children | 13 (100.0%) | 0 (0.0%) |
| 5 or more Children | 0 (0.0%) | 0 (0.0%) |
| Total | 439 (100.0%) | 0 (0.0%) |
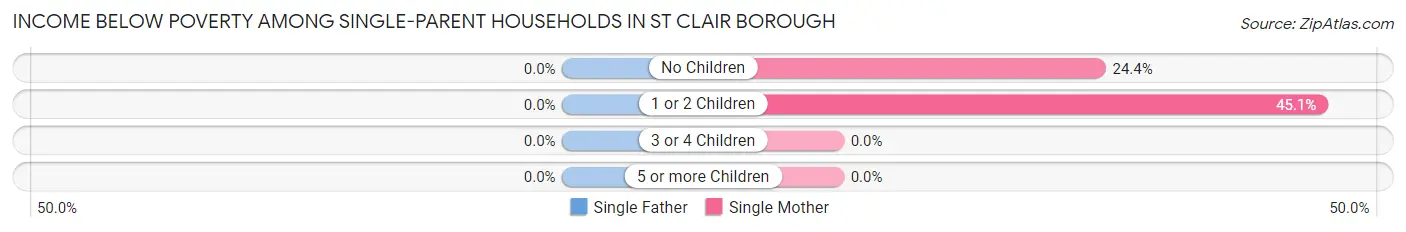
Income Below Poverty Among Single-Parent Households in St Clair borough
| Children | Single Father | Single Mother |
| No Children | 0 (0.0%) | 20 (24.4%) |
| 1 or 2 Children | 0 (0.0%) | 37 (45.1%) |
| 3 or 4 Children | 0 (0.0%) | 0 (0.0%) |
| 5 or more Children | 0 (0.0%) | 0 (0.0%) |
| Total | 0 (0.0%) | 57 (33.0%) |
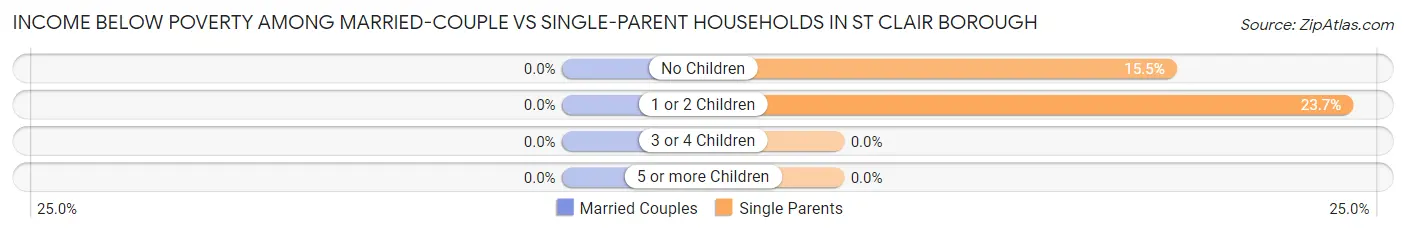
Income Below Poverty Among Married-Couple vs Single-Parent Households in St Clair borough
| Children | Married-Couple Families | Single-Parent Households |
| No Children | 0 (0.0%) | 20 (15.5%) |
| 1 or 2 Children | 0 (0.0%) | 37 (23.7%) |
| 3 or 4 Children | 0 (0.0%) | 0 (0.0%) |
| 5 or more Children | 0 (0.0%) | 0 (0.0%) |
| Total | 0 (0.0%) | 57 (19.4%) |
Employment Characteristics in St Clair borough
Employment by Class of Employer in St Clair borough
Among the 1,408 employed individuals in St Clair borough, private company employees (1,117 | 79.3%), not-for-profit organizations (103 | 7.3%), and local government employees (74 | 5.3%) make up the most common classes of employment.
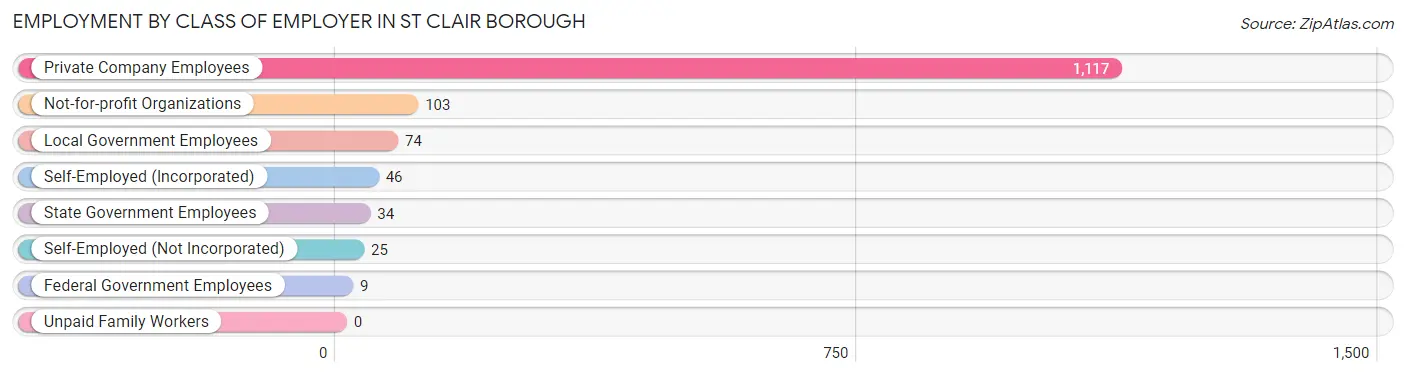
| Employer Class | # Employees | % Employees |
| Private Company Employees | 1,117 | 79.3% |
| Self-Employed (Incorporated) | 46 | 3.3% |
| Self-Employed (Not Incorporated) | 25 | 1.8% |
| Not-for-profit Organizations | 103 | 7.3% |
| Local Government Employees | 74 | 5.3% |
| State Government Employees | 34 | 2.4% |
| Federal Government Employees | 9 | 0.6% |
| Unpaid Family Workers | 0 | 0.0% |
| Total | 1,408 | 100.0% |
Employment Status by Age in St Clair borough
According to the labor force statistics for St Clair borough, out of the total population over 16 years of age (2,409), 62.7% or 1,510 individuals are in the labor force, with 1.1% or 17 of them unemployed. The age group with the highest labor force participation rate is 35 to 44 years, with 96.4% or 266 individuals in the labor force. Within the labor force, the 16 to 19 years age range has the highest percentage of unemployed individuals, with 21.2% or 7 of them being unemployed.
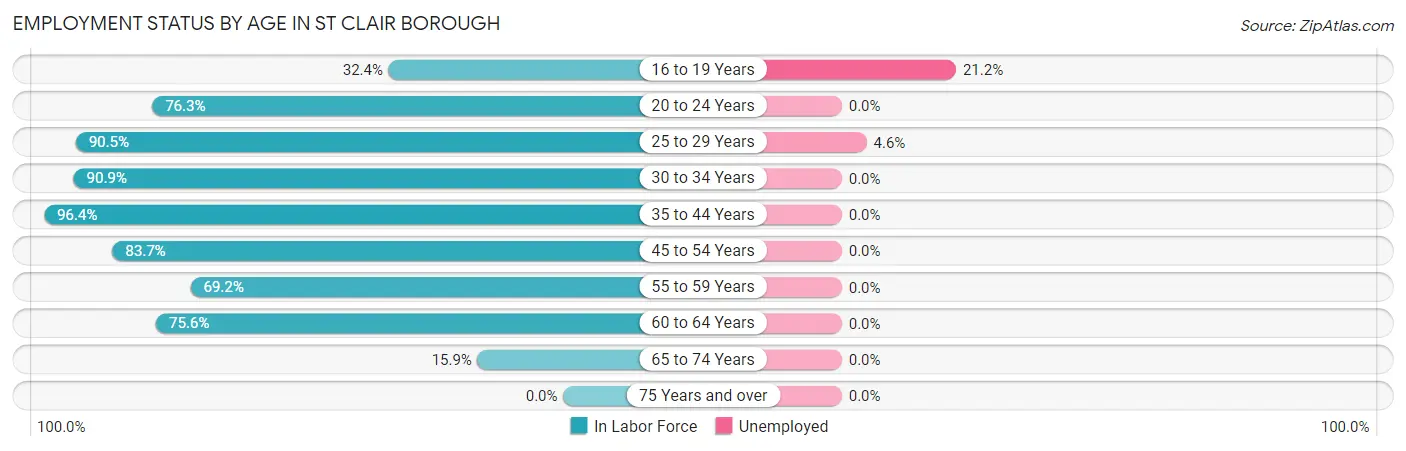
| Age Bracket | In Labor Force | Unemployed |
| 16 to 19 Years | 33 (32.4%) | 7 (21.2%) |
| 20 to 24 Years | 129 (76.3%) | 0 (0.0%) |
| 25 to 29 Years | 219 (90.5%) | 10 (4.6%) |
| 30 to 34 Years | 179 (90.9%) | 0 (0.0%) |
| 35 to 44 Years | 266 (96.4%) | 0 (0.0%) |
| 45 to 54 Years | 307 (83.7%) | 0 (0.0%) |
| 55 to 59 Years | 164 (69.2%) | 0 (0.0%) |
| 60 to 64 Years | 161 (75.6%) | 0 (0.0%) |
| 65 to 74 Years | 53 (15.9%) | 0 (0.0%) |
| 75 Years and over | 0 (0.0%) | 0 (0.0%) |
| Total | 1,510 (62.7%) | 17 (1.1%) |
Employment Status by Educational Attainment in St Clair borough
According to labor force statistics for St Clair borough, 84.6% of individuals (1,296) out of the total population between 25 and 64 years of age (1,532) are in the labor force, with 0.8% or 10 of them being unemployed. The group with the highest labor force participation rate are those with the educational attainment of bachelor's degree or higher, with 100.0% or 278 individuals in the labor force. Within the labor force, individuals with high school diploma education have the highest percentage of unemployment, with 1.6% or 10 of them being unemployed.
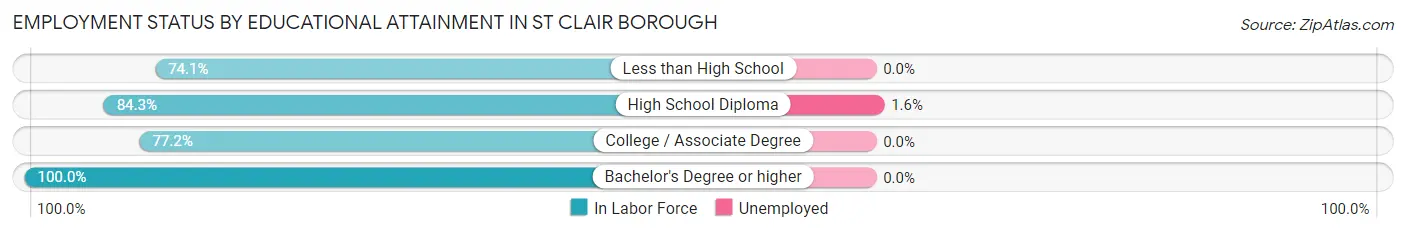
| Educational Attainment | In Labor Force | Unemployed |
| Less than High School | 63 (74.1%) | 0 (0.0%) |
| High School Diploma | 627 (84.3%) | 12 (1.6%) |
| College / Associate Degree | 328 (77.2%) | 0 (0.0%) |
| Bachelor's Degree or higher | 278 (100.0%) | 0 (0.0%) |
| Total | 1,296 (84.6%) | 12 (0.8%) |
Employment Occupations by Sex in St Clair borough
Management, Business, Science and Arts Occupations
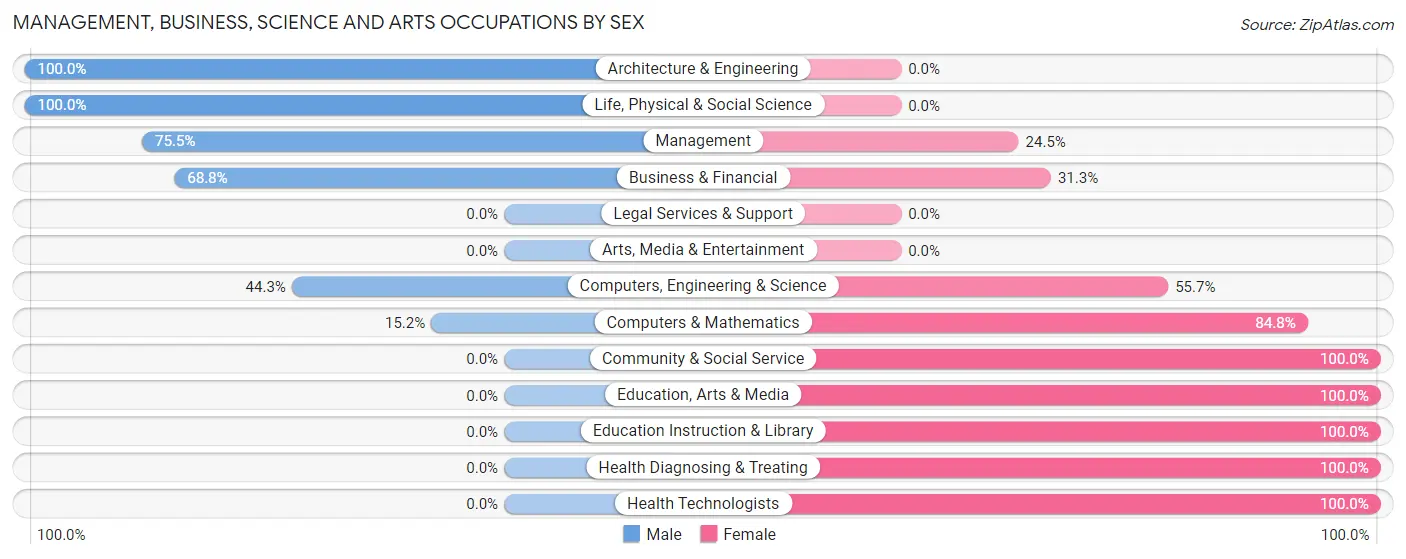
The most common Management, Business, Science and Arts occupations in St Clair borough are Management (102 | 6.8%), Health Diagnosing & Treating (80 | 5.3%), Computers, Engineering & Science (70 | 4.7%), Business & Financial (64 | 4.3%), and Community & Social Service (61 | 4.1%).
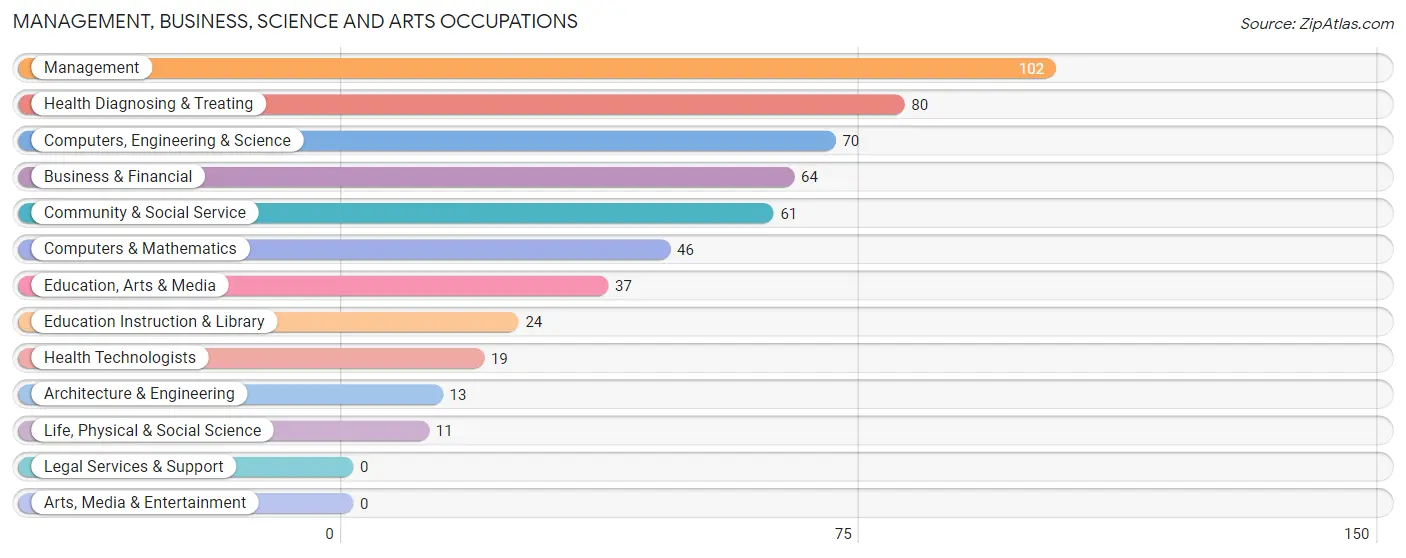
Management, Business, Science and Arts Occupations by Sex
Within the Management, Business, Science and Arts occupations in St Clair borough, the most male-oriented occupations are Architecture & Engineering (100.0%), Life, Physical & Social Science (100.0%), and Management (75.5%), while the most female-oriented occupations are Community & Social Service (100.0%), Education, Arts & Media (100.0%), and Education Instruction & Library (100.0%).
| Occupation | Male | Female |
| Management | 77 (75.5%) | 25 (24.5%) |
| Business & Financial | 44 (68.8%) | 20 (31.2%) |
| Computers, Engineering & Science | 31 (44.3%) | 39 (55.7%) |
| Computers & Mathematics | 7 (15.2%) | 39 (84.8%) |
| Architecture & Engineering | 13 (100.0%) | 0 (0.0%) |
| Life, Physical & Social Science | 11 (100.0%) | 0 (0.0%) |
| Community & Social Service | 0 (0.0%) | 61 (100.0%) |
| Education, Arts & Media | 0 (0.0%) | 37 (100.0%) |
| Legal Services & Support | 0 (0.0%) | 0 (0.0%) |
| Education Instruction & Library | 0 (0.0%) | 24 (100.0%) |
| Arts, Media & Entertainment | 0 (0.0%) | 0 (0.0%) |
| Health Diagnosing & Treating | 0 (0.0%) | 80 (100.0%) |
| Health Technologists | 0 (0.0%) | 19 (100.0%) |
| Total (Category) | 152 (40.3%) | 225 (59.7%) |
| Total (Overall) | 758 (50.7%) | 736 (49.3%) |
Services Occupations
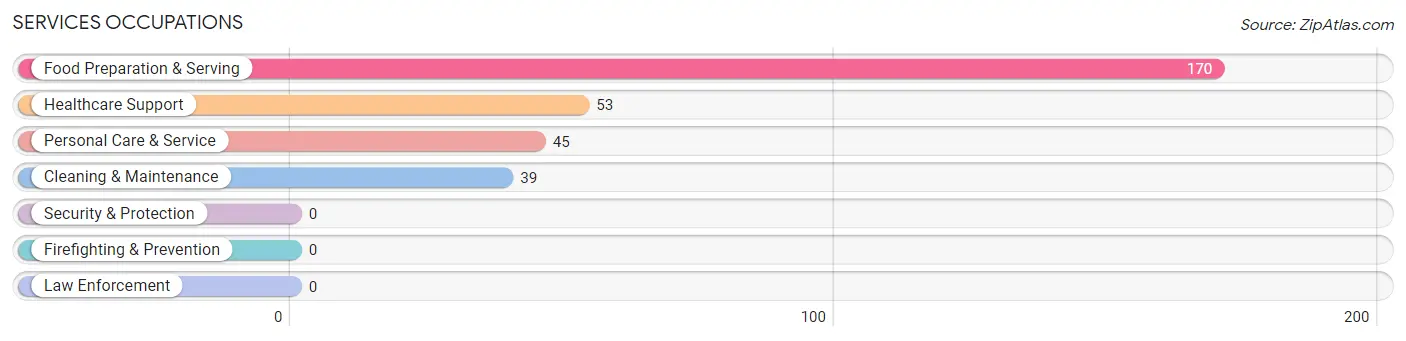
The most common Services occupations in St Clair borough are Food Preparation & Serving (170 | 11.4%), Healthcare Support (53 | 3.5%), Personal Care & Service (45 | 3.0%), and Cleaning & Maintenance (39 | 2.6%).
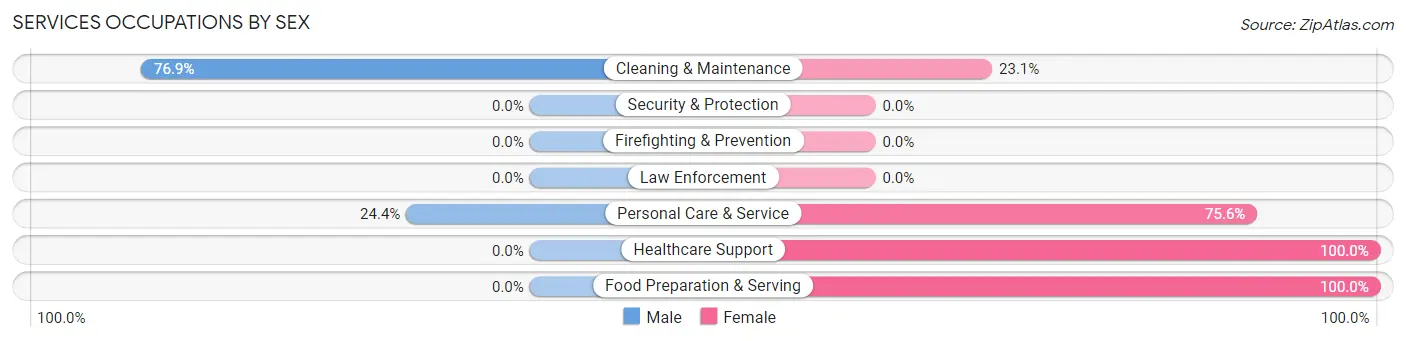
Services Occupations by Sex
Within the Services occupations in St Clair borough, the most male-oriented occupations are Cleaning & Maintenance (76.9%), and Personal Care & Service (24.4%), while the most female-oriented occupations are Healthcare Support (100.0%), Food Preparation & Serving (100.0%), and Personal Care & Service (75.6%).
| Occupation | Male | Female |
| Healthcare Support | 0 (0.0%) | 53 (100.0%) |
| Security & Protection | 0 (0.0%) | 0 (0.0%) |
| Firefighting & Prevention | 0 (0.0%) | 0 (0.0%) |
| Law Enforcement | 0 (0.0%) | 0 (0.0%) |
| Food Preparation & Serving | 0 (0.0%) | 170 (100.0%) |
| Cleaning & Maintenance | 30 (76.9%) | 9 (23.1%) |
| Personal Care & Service | 11 (24.4%) | 34 (75.6%) |
| Total (Category) | 41 (13.4%) | 266 (86.6%) |
| Total (Overall) | 758 (50.7%) | 736 (49.3%) |
Sales and Office Occupations
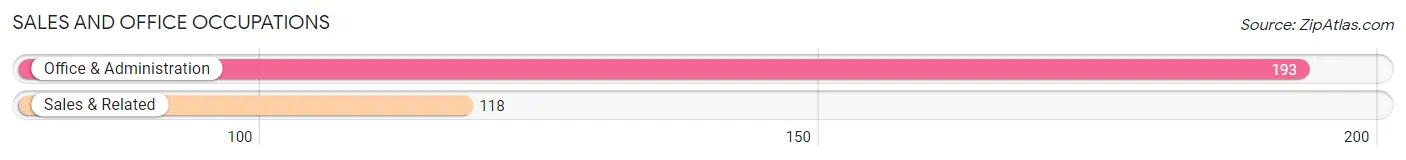
The most common Sales and Office occupations in St Clair borough are Office & Administration (193 | 12.9%), and Sales & Related (118 | 7.9%).
Sales and Office Occupations by Sex
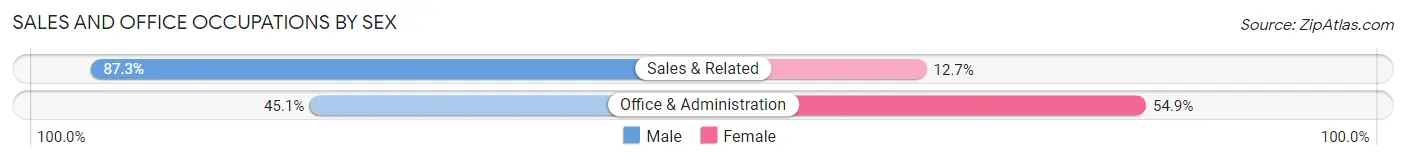
| Occupation | Male | Female |
| Sales & Related | 103 (87.3%) | 15 (12.7%) |
| Office & Administration | 87 (45.1%) | 106 (54.9%) |
| Total (Category) | 190 (61.1%) | 121 (38.9%) |
| Total (Overall) | 758 (50.7%) | 736 (49.3%) |
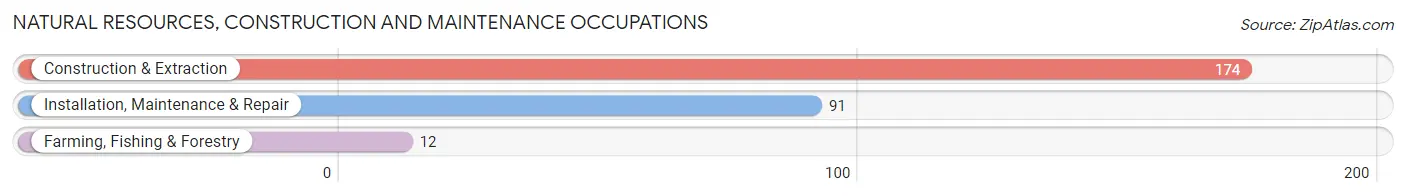
Natural Resources, Construction and Maintenance Occupations
The most common Natural Resources, Construction and Maintenance occupations in St Clair borough are Construction & Extraction (174 | 11.7%), Installation, Maintenance & Repair (91 | 6.1%), and Farming, Fishing & Forestry (12 | 0.8%).
Natural Resources, Construction and Maintenance Occupations by Sex
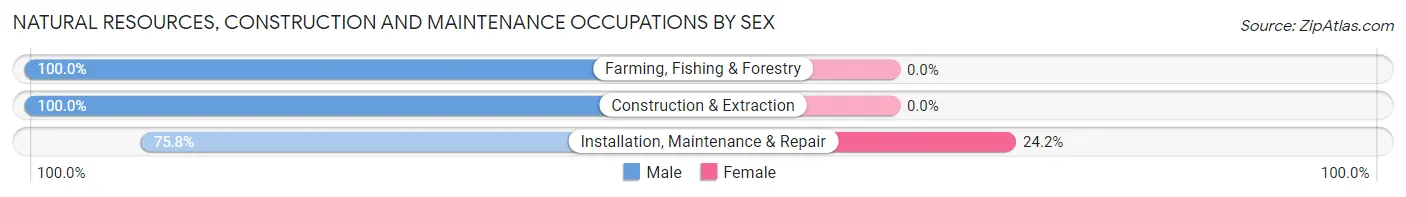
| Occupation | Male | Female |
| Farming, Fishing & Forestry | 12 (100.0%) | 0 (0.0%) |
| Construction & Extraction | 174 (100.0%) | 0 (0.0%) |
| Installation, Maintenance & Repair | 69 (75.8%) | 22 (24.2%) |
| Total (Category) | 255 (92.1%) | 22 (7.9%) |
| Total (Overall) | 758 (50.7%) | 736 (49.3%) |
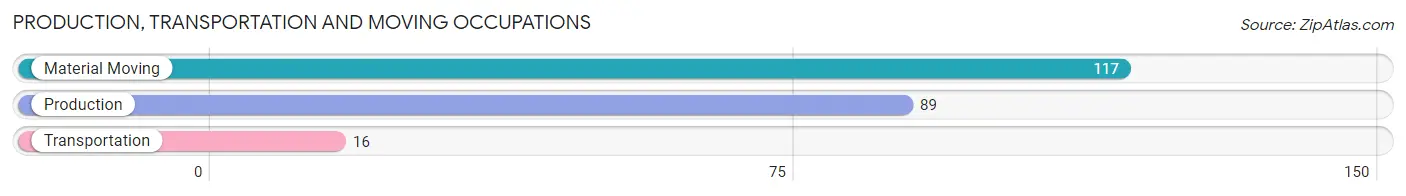
Production, Transportation and Moving Occupations
The most common Production, Transportation and Moving occupations in St Clair borough are Material Moving (117 | 7.8%), Production (89 | 6.0%), and Transportation (16 | 1.1%).
Production, Transportation and Moving Occupations by Sex
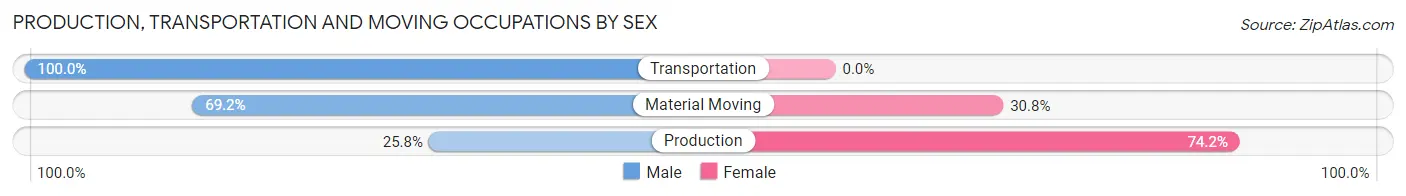
| Occupation | Male | Female |
| Production | 23 (25.8%) | 66 (74.2%) |
| Transportation | 16 (100.0%) | 0 (0.0%) |
| Material Moving | 81 (69.2%) | 36 (30.8%) |
| Total (Category) | 120 (54.0%) | 102 (46.0%) |
| Total (Overall) | 758 (50.7%) | 736 (49.3%) |
Employment Industries by Sex in St Clair borough
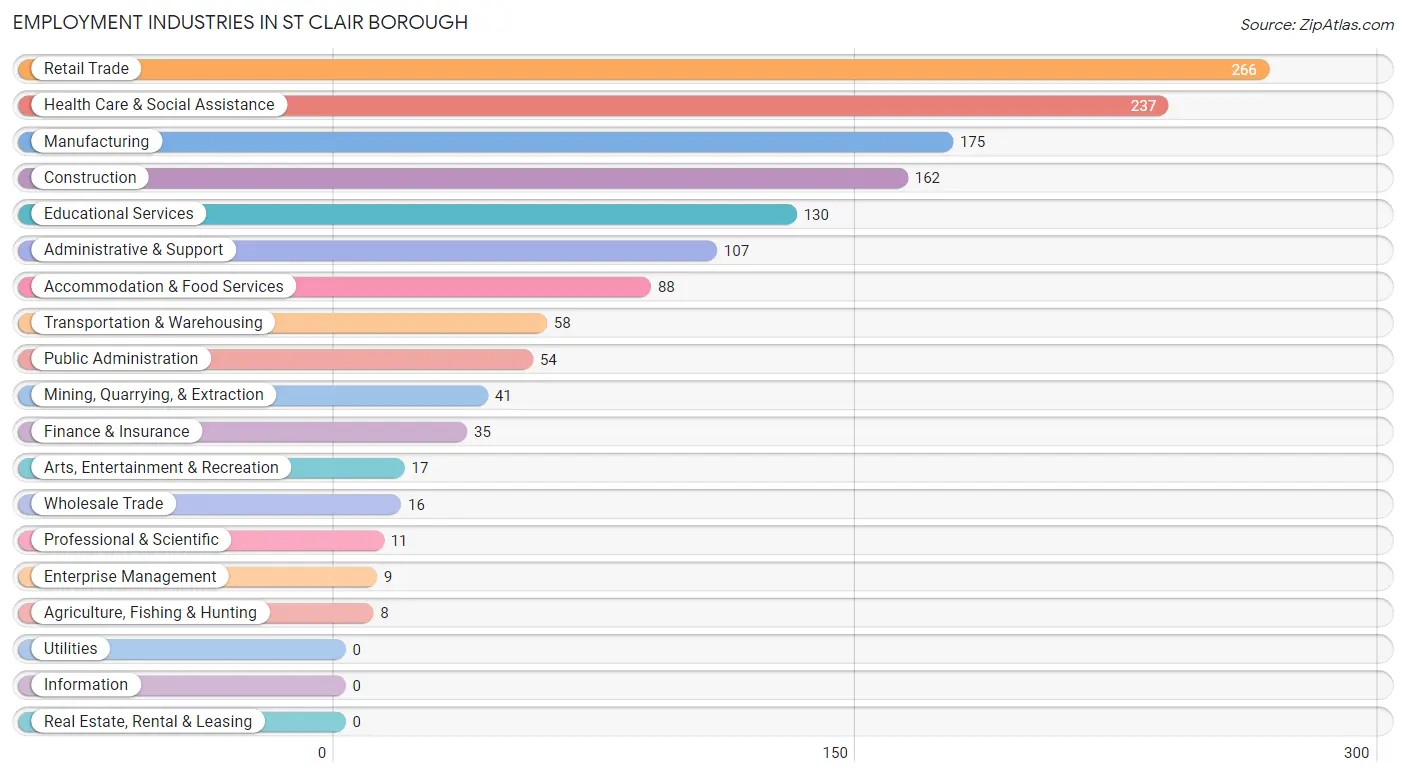
Employment Industries in St Clair borough
The major employment industries in St Clair borough include Retail Trade (266 | 17.8%), Health Care & Social Assistance (237 | 15.9%), Manufacturing (175 | 11.7%), Construction (162 | 10.8%), and Educational Services (130 | 8.7%).
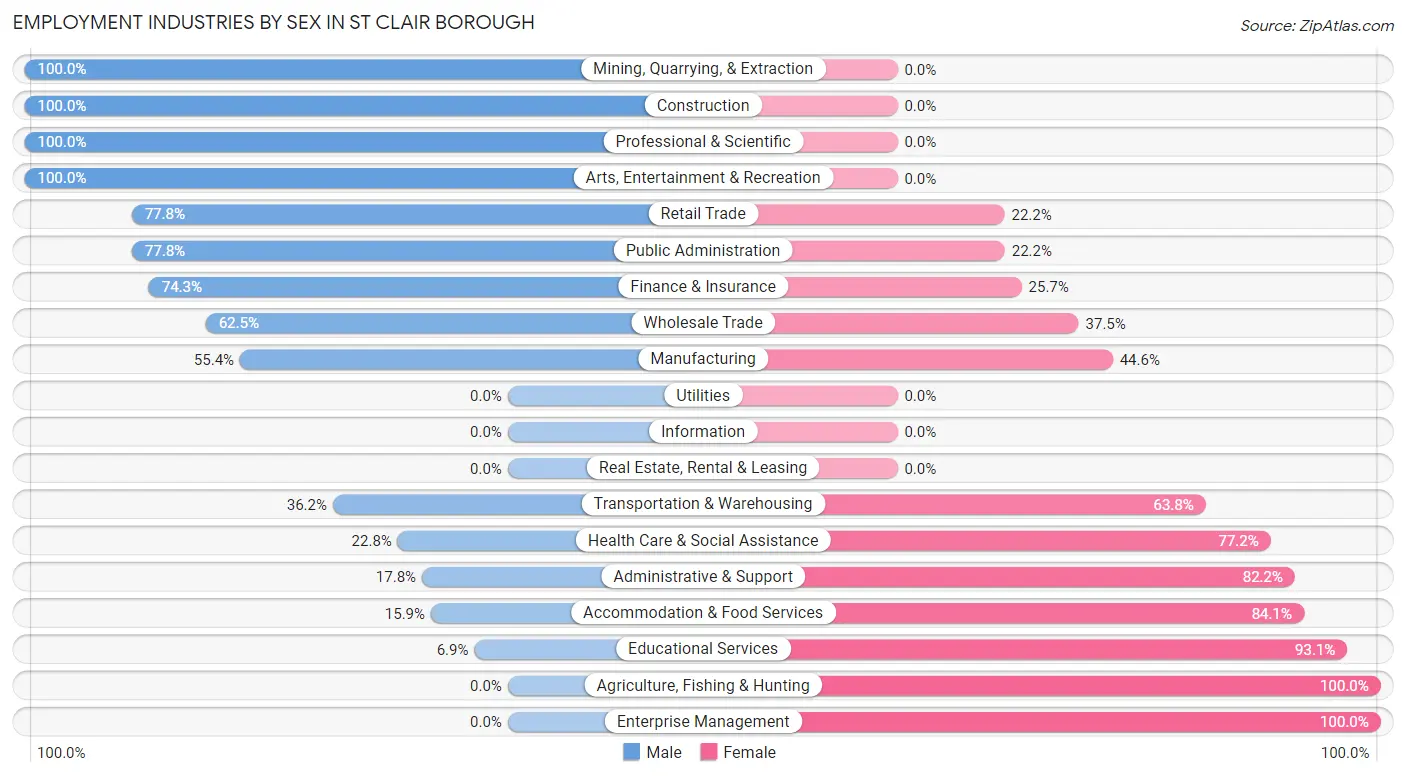
Employment Industries by Sex in St Clair borough
The St Clair borough industries that see more men than women are Mining, Quarrying, & Extraction (100.0%), Construction (100.0%), and Professional & Scientific (100.0%), whereas the industries that tend to have a higher number of women are Agriculture, Fishing & Hunting (100.0%), Enterprise Management (100.0%), and Educational Services (93.1%).
| Industry | Male | Female |
| Agriculture, Fishing & Hunting | 0 (0.0%) | 8 (100.0%) |
| Mining, Quarrying, & Extraction | 41 (100.0%) | 0 (0.0%) |
| Construction | 162 (100.0%) | 0 (0.0%) |
| Manufacturing | 97 (55.4%) | 78 (44.6%) |
| Wholesale Trade | 10 (62.5%) | 6 (37.5%) |
| Retail Trade | 207 (77.8%) | 59 (22.2%) |
| Transportation & Warehousing | 21 (36.2%) | 37 (63.8%) |
| Utilities | 0 (0.0%) | 0 (0.0%) |
| Information | 0 (0.0%) | 0 (0.0%) |
| Finance & Insurance | 26 (74.3%) | 9 (25.7%) |
| Real Estate, Rental & Leasing | 0 (0.0%) | 0 (0.0%) |
| Professional & Scientific | 11 (100.0%) | 0 (0.0%) |
| Enterprise Management | 0 (0.0%) | 9 (100.0%) |
| Administrative & Support | 19 (17.8%) | 88 (82.2%) |
| Educational Services | 9 (6.9%) | 121 (93.1%) |
| Health Care & Social Assistance | 54 (22.8%) | 183 (77.2%) |
| Arts, Entertainment & Recreation | 17 (100.0%) | 0 (0.0%) |
| Accommodation & Food Services | 14 (15.9%) | 74 (84.1%) |
| Public Administration | 42 (77.8%) | 12 (22.2%) |
| Total | 758 (50.7%) | 736 (49.3%) |
Education in St Clair borough
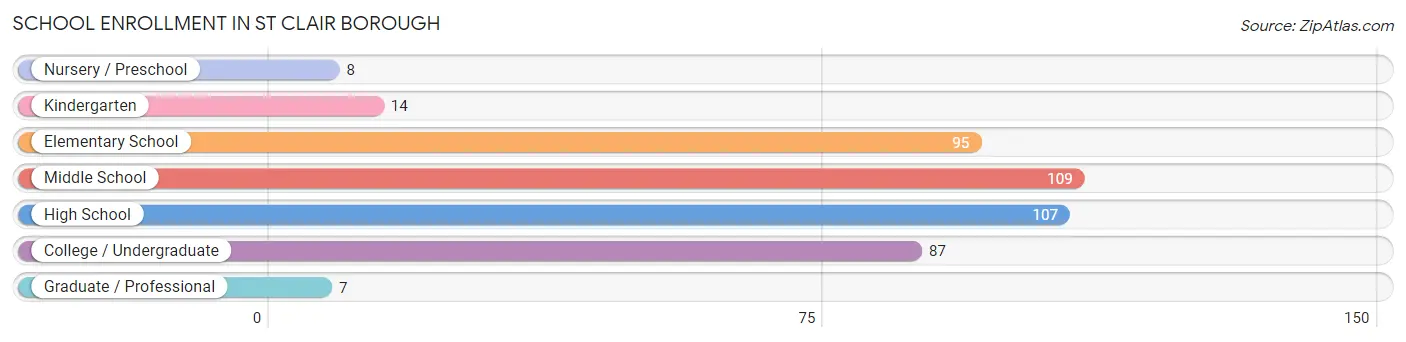
School Enrollment in St Clair borough
The most common levels of schooling among the 427 students in St Clair borough are middle school (109 | 25.5%), high school (107 | 25.1%), and elementary school (95 | 22.3%).
| School Level | # Students | % Students |
| Nursery / Preschool | 8 | 1.9% |
| Kindergarten | 14 | 3.3% |
| Elementary School | 95 | 22.3% |
| Middle School | 109 | 25.5% |
| High School | 107 | 25.1% |
| College / Undergraduate | 87 | 20.4% |
| Graduate / Professional | 7 | 1.6% |
| Total | 427 | 100.0% |
School Enrollment by Age by Funding Source in St Clair borough
Out of a total of 427 students who are enrolled in schools in St Clair borough, 24 (5.6%) attend a private institution, while the remaining 403 (94.4%) are enrolled in public schools. The age group of 3 to 4 year olds has the highest likelihood of being enrolled in private schools, with 8 (100.0% in the age bracket) enrolled. Conversely, the age group of 10 to 14 year olds has the lowest likelihood of being enrolled in a private school, with 109 (100.0% in the age bracket) attending a public institution.
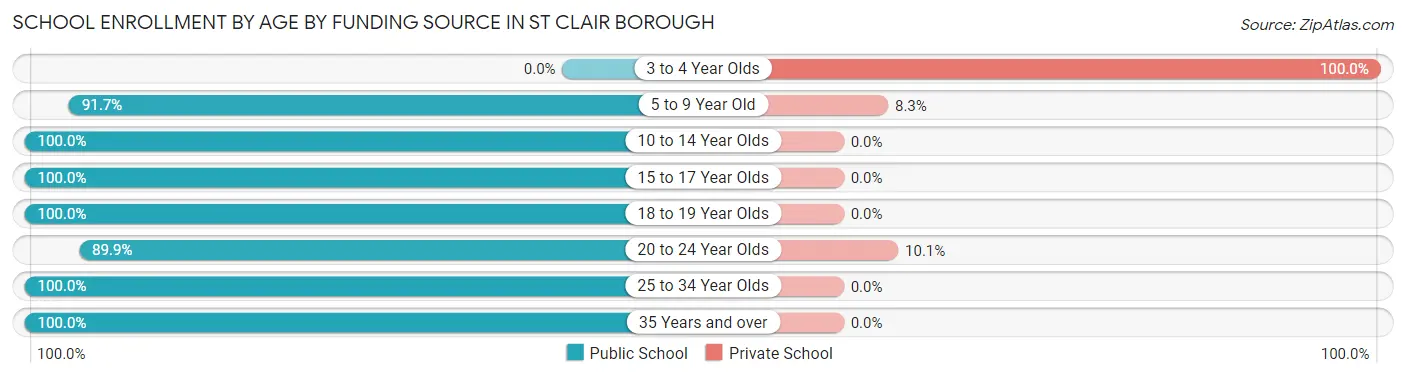
| Age Bracket | Public School | Private School |
| 3 to 4 Year Olds | 0 (0.0%) | 8 (100.0%) |
| 5 to 9 Year Old | 100 (91.7%) | 9 (8.3%) |
| 10 to 14 Year Olds | 109 (100.0%) | 0 (0.0%) |
| 15 to 17 Year Olds | 75 (100.0%) | 0 (0.0%) |
| 18 to 19 Year Olds | 26 (100.0%) | 0 (0.0%) |
| 20 to 24 Year Olds | 62 (89.9%) | 7 (10.1%) |
| 25 to 34 Year Olds | 25 (100.0%) | 0 (0.0%) |
| 35 Years and over | 6 (100.0%) | 0 (0.0%) |
| Total | 403 (94.4%) | 24 (5.6%) |
Educational Attainment by Field of Study in St Clair borough
Arts & humanities (108 | 24.1%), education (90 | 20.1%), business (81 | 18.1%), communications (51 | 11.4%), and psychology (36 | 8.0%) are the most common fields of study among 448 individuals in St Clair borough who have obtained a bachelor's degree or higher.
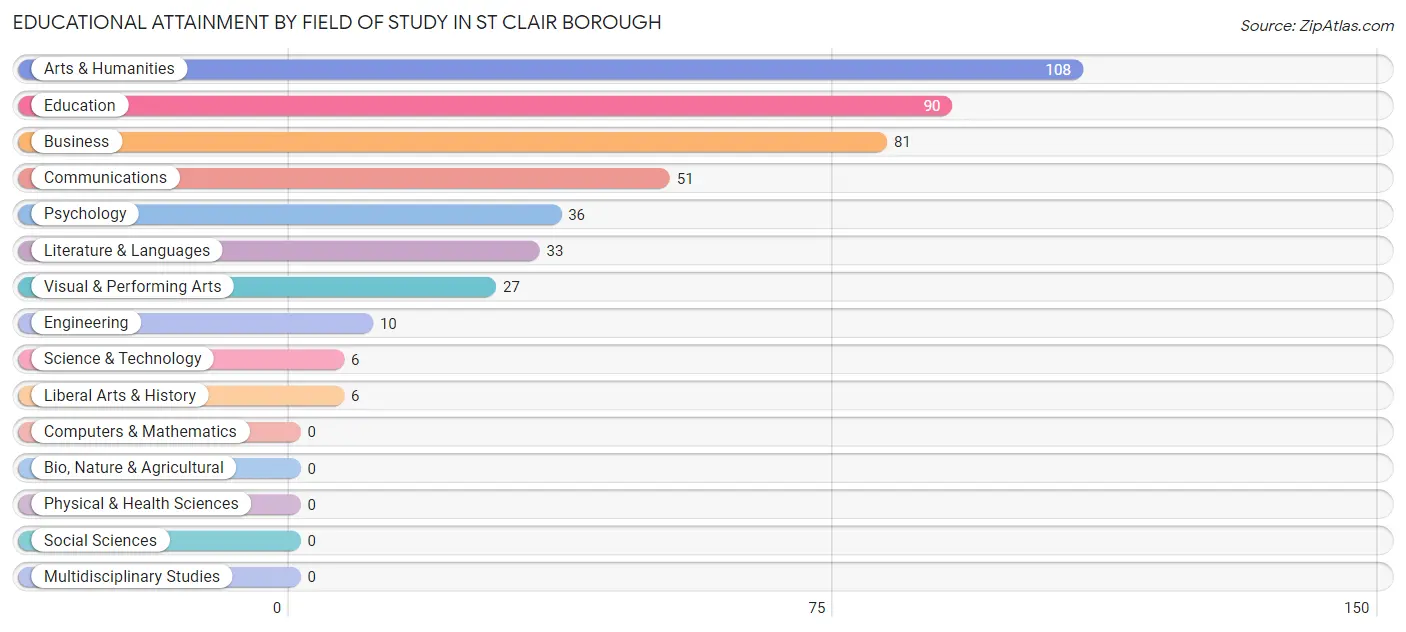
| Field of Study | # Graduates | % Graduates |
| Computers & Mathematics | 0 | 0.0% |
| Bio, Nature & Agricultural | 0 | 0.0% |
| Physical & Health Sciences | 0 | 0.0% |
| Psychology | 36 | 8.0% |
| Social Sciences | 0 | 0.0% |
| Engineering | 10 | 2.2% |
| Multidisciplinary Studies | 0 | 0.0% |
| Science & Technology | 6 | 1.3% |
| Business | 81 | 18.1% |
| Education | 90 | 20.1% |
| Literature & Languages | 33 | 7.4% |
| Liberal Arts & History | 6 | 1.3% |
| Visual & Performing Arts | 27 | 6.0% |
| Communications | 51 | 11.4% |
| Arts & Humanities | 108 | 24.1% |
| Total | 448 | 100.0% |
Transportation & Commute in St Clair borough
Vehicle Availability by Sex in St Clair borough
The most prevalent vehicle ownership categories in St Clair borough are males with 2 vehicles (352, accounting for 46.4%) and females with 2 vehicles (239, making up 54.2%).
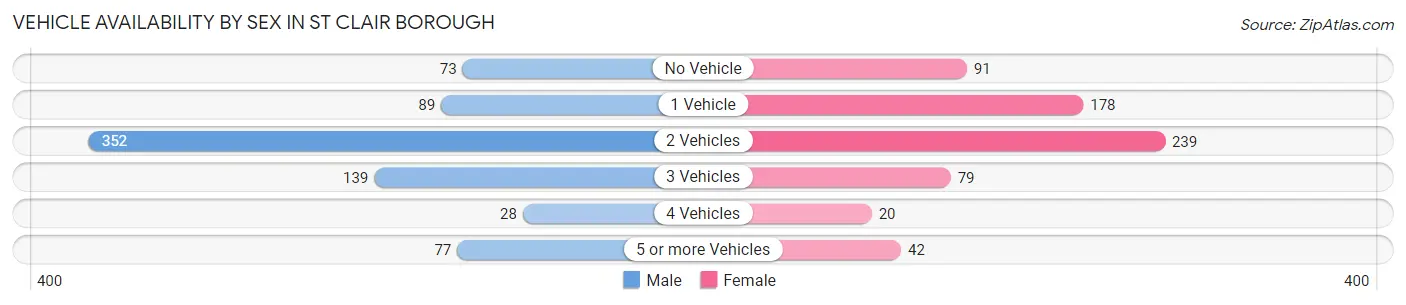
| Vehicles Available | Male | Female |
| No Vehicle | 73 (9.6%) | 91 (14.0%) |
| 1 Vehicle | 89 (11.7%) | 178 (27.4%) |
| 2 Vehicles | 352 (46.4%) | 239 (36.8%) |
| 3 Vehicles | 139 (18.3%) | 79 (12.2%) |
| 4 Vehicles | 28 (3.7%) | 20 (3.1%) |
| 5 or more Vehicles | 77 (10.2%) | 42 (6.5%) |
| Total | 758 (100.0%) | 649 (100.0%) |
Commute Time in St Clair borough
The most frequently occuring commute durations in St Clair borough are 15 to 19 minutes (325 commuters, 23.9%), 5 to 9 minutes (180 commuters, 13.3%), and 10 to 14 minutes (146 commuters, 10.7%).
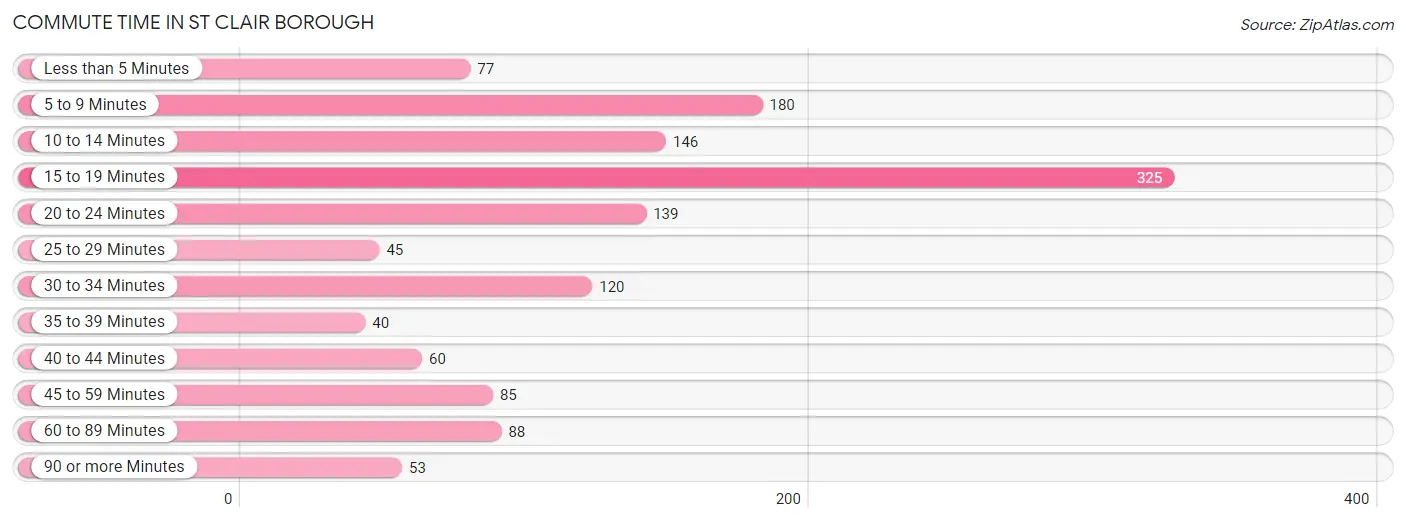
| Commute Time | # Commuters | % Commuters |
| Less than 5 Minutes | 77 | 5.7% |
| 5 to 9 Minutes | 180 | 13.3% |
| 10 to 14 Minutes | 146 | 10.7% |
| 15 to 19 Minutes | 325 | 23.9% |
| 20 to 24 Minutes | 139 | 10.2% |
| 25 to 29 Minutes | 45 | 3.3% |
| 30 to 34 Minutes | 120 | 8.8% |
| 35 to 39 Minutes | 40 | 2.9% |
| 40 to 44 Minutes | 60 | 4.4% |
| 45 to 59 Minutes | 85 | 6.3% |
| 60 to 89 Minutes | 88 | 6.5% |
| 90 or more Minutes | 53 | 3.9% |
Commute Time by Sex in St Clair borough
The most common commute times in St Clair borough are 15 to 19 minutes (156 commuters, 21.0%) for males and 15 to 19 minutes (169 commuters, 27.4%) for females.
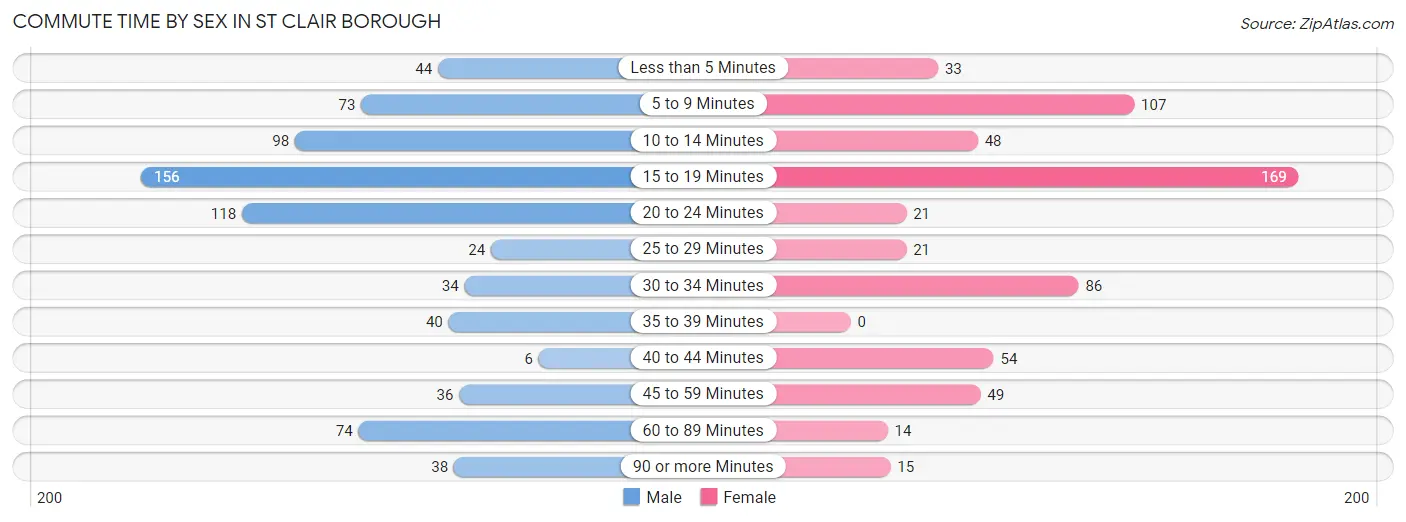
| Commute Time | Male | Female |
| Less than 5 Minutes | 44 (5.9%) | 33 (5.3%) |
| 5 to 9 Minutes | 73 (9.9%) | 107 (17.3%) |
| 10 to 14 Minutes | 98 (13.2%) | 48 (7.8%) |
| 15 to 19 Minutes | 156 (21.0%) | 169 (27.4%) |
| 20 to 24 Minutes | 118 (15.9%) | 21 (3.4%) |
| 25 to 29 Minutes | 24 (3.2%) | 21 (3.4%) |
| 30 to 34 Minutes | 34 (4.6%) | 86 (13.9%) |
| 35 to 39 Minutes | 40 (5.4%) | 0 (0.0%) |
| 40 to 44 Minutes | 6 (0.8%) | 54 (8.7%) |
| 45 to 59 Minutes | 36 (4.9%) | 49 (7.9%) |
| 60 to 89 Minutes | 74 (10.0%) | 14 (2.3%) |
| 90 or more Minutes | 38 (5.1%) | 15 (2.4%) |
Time of Departure to Work by Sex in St Clair borough
The most frequent times of departure to work in St Clair borough are 8:00 AM to 8:29 AM (126, 17.0%) for males and 7:30 AM to 7:59 AM (144, 23.3%) for females.
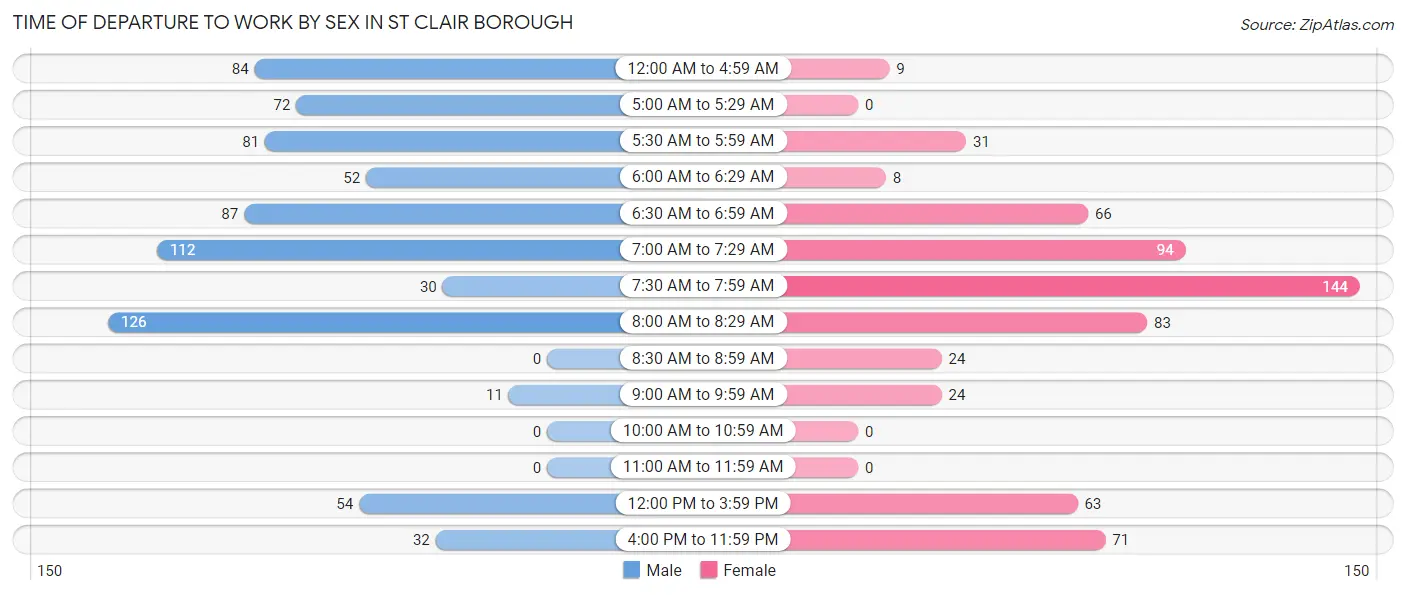
| Time of Departure | Male | Female |
| 12:00 AM to 4:59 AM | 84 (11.3%) | 9 (1.5%) |
| 5:00 AM to 5:29 AM | 72 (9.7%) | 0 (0.0%) |
| 5:30 AM to 5:59 AM | 81 (10.9%) | 31 (5.0%) |
| 6:00 AM to 6:29 AM | 52 (7.0%) | 8 (1.3%) |
| 6:30 AM to 6:59 AM | 87 (11.7%) | 66 (10.7%) |
| 7:00 AM to 7:29 AM | 112 (15.1%) | 94 (15.2%) |
| 7:30 AM to 7:59 AM | 30 (4.1%) | 144 (23.3%) |
| 8:00 AM to 8:29 AM | 126 (17.0%) | 83 (13.5%) |
| 8:30 AM to 8:59 AM | 0 (0.0%) | 24 (3.9%) |
| 9:00 AM to 9:59 AM | 11 (1.5%) | 24 (3.9%) |
| 10:00 AM to 10:59 AM | 0 (0.0%) | 0 (0.0%) |
| 11:00 AM to 11:59 AM | 0 (0.0%) | 0 (0.0%) |
| 12:00 PM to 3:59 PM | 54 (7.3%) | 63 (10.2%) |
| 4:00 PM to 11:59 PM | 32 (4.3%) | 71 (11.5%) |
| Total | 741 (100.0%) | 617 (100.0%) |
Housing Occupancy in St Clair borough
Occupancy by Ownership in St Clair borough
Of the total 1,227 dwellings in St Clair borough, owner-occupied units account for 950 (77.4%), while renter-occupied units make up 277 (22.6%).
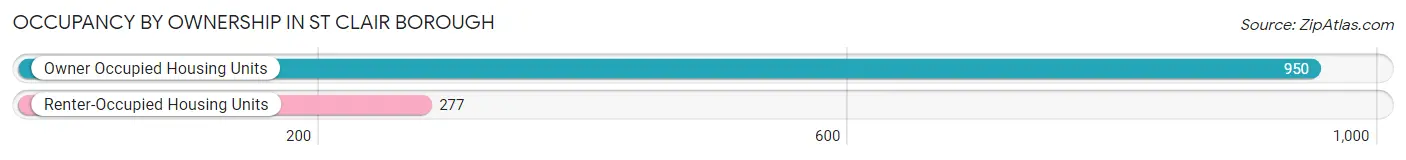
| Occupancy | # Housing Units | % Housing Units |
| Owner Occupied Housing Units | 950 | 77.4% |
| Renter-Occupied Housing Units | 277 | 22.6% |
| Total Occupied Housing Units | 1,227 | 100.0% |
Occupancy by Household Size in St Clair borough
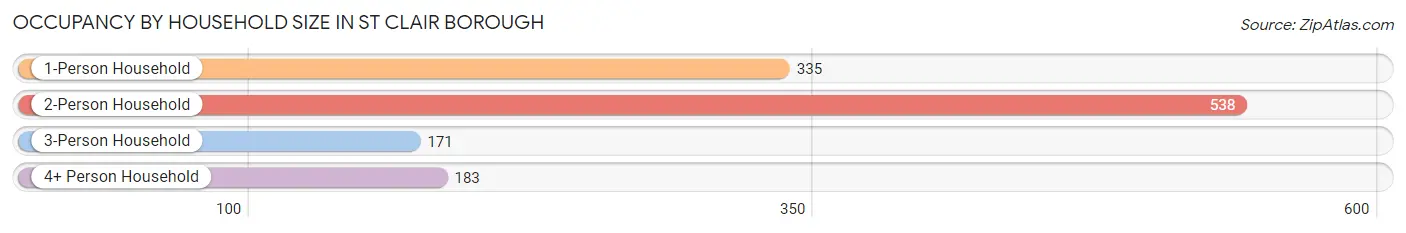
| Household Size | # Housing Units | % Housing Units |
| 1-Person Household | 335 | 27.3% |
| 2-Person Household | 538 | 43.9% |
| 3-Person Household | 171 | 13.9% |
| 4+ Person Household | 183 | 14.9% |
| Total Housing Units | 1,227 | 100.0% |
Occupancy by Ownership by Household Size in St Clair borough
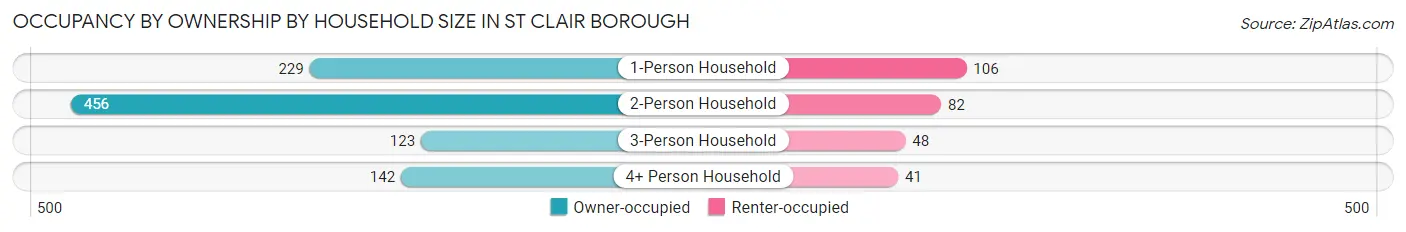
| Household Size | Owner-occupied | Renter-occupied |
| 1-Person Household | 229 (68.4%) | 106 (31.6%) |
| 2-Person Household | 456 (84.8%) | 82 (15.2%) |
| 3-Person Household | 123 (71.9%) | 48 (28.1%) |
| 4+ Person Household | 142 (77.6%) | 41 (22.4%) |
| Total Housing Units | 950 (77.4%) | 277 (22.6%) |
Occupancy by Educational Attainment in St Clair borough
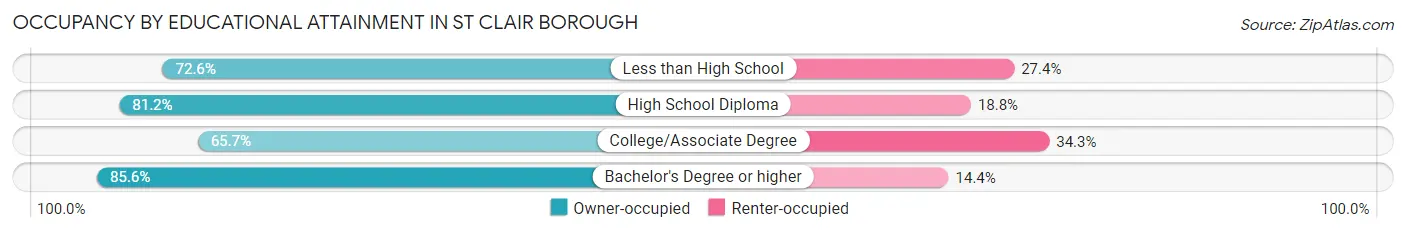
| Household Size | Owner-occupied | Renter-occupied |
| Less than High School | 69 (72.6%) | 26 (27.4%) |
| High School Diploma | 523 (81.2%) | 121 (18.8%) |
| College/Associate Degree | 197 (65.7%) | 103 (34.3%) |
| Bachelor's Degree or higher | 161 (85.6%) | 27 (14.4%) |
Occupancy by Age of Householder in St Clair borough
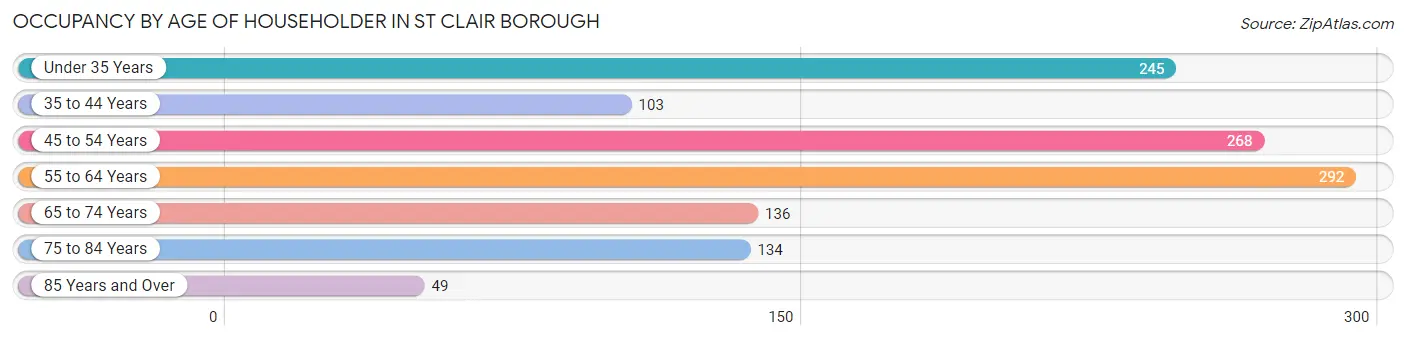
| Age Bracket | # Households | % Households |
| Under 35 Years | 245 | 20.0% |
| 35 to 44 Years | 103 | 8.4% |
| 45 to 54 Years | 268 | 21.8% |
| 55 to 64 Years | 292 | 23.8% |
| 65 to 74 Years | 136 | 11.1% |
| 75 to 84 Years | 134 | 10.9% |
| 85 Years and Over | 49 | 4.0% |
| Total | 1,227 | 100.0% |
Housing Finances in St Clair borough
Median Income by Occupancy in St Clair borough
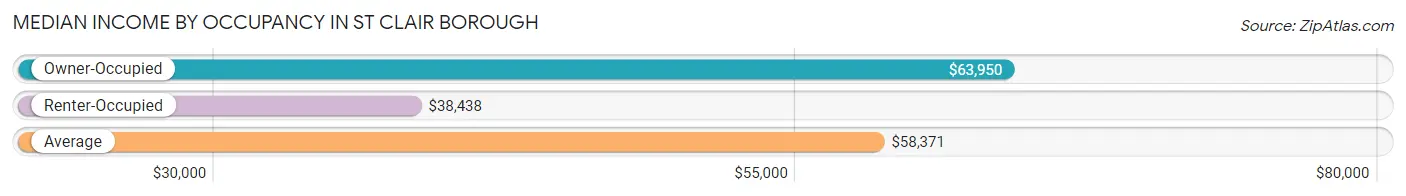
| Occupancy Type | # Households | Median Income |
| Owner-Occupied | 950 (77.4%) | $63,950 |
| Renter-Occupied | 277 (22.6%) | $38,438 |
| Average | 1,227 (100.0%) | $58,371 |
Occupancy by Householder Income Bracket in St Clair borough
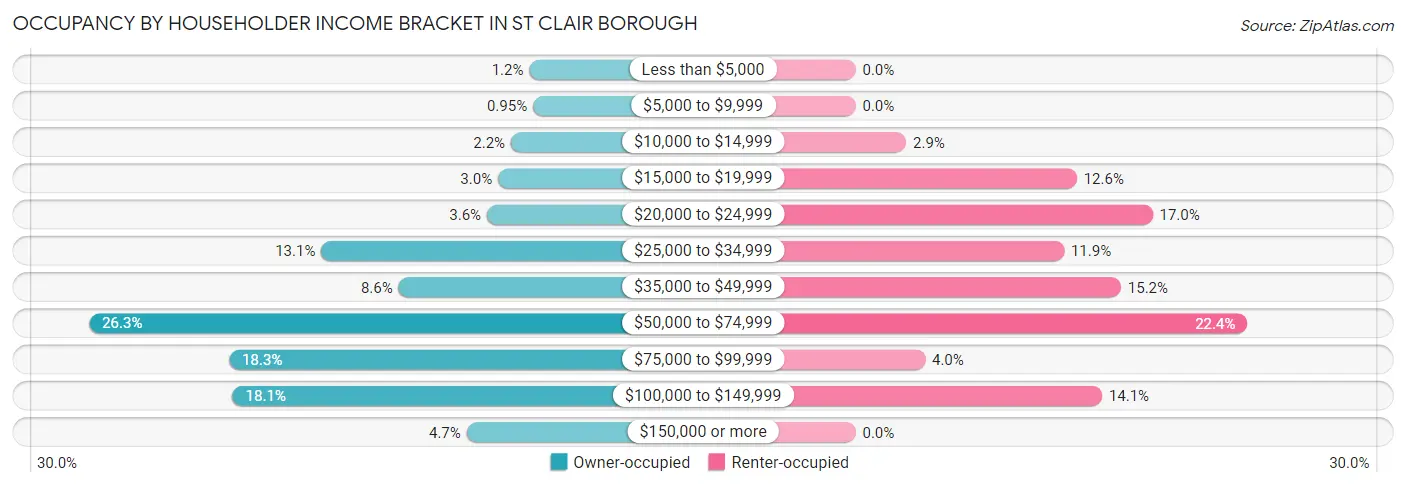
| Income Bracket | Owner-occupied | Renter-occupied |
| Less than $5,000 | 11 (1.2%) | 0 (0.0%) |
| $5,000 to $9,999 | 9 (0.9%) | 0 (0.0%) |
| $10,000 to $14,999 | 21 (2.2%) | 8 (2.9%) |
| $15,000 to $19,999 | 28 (2.9%) | 35 (12.6%) |
| $20,000 to $24,999 | 34 (3.6%) | 47 (17.0%) |
| $25,000 to $34,999 | 124 (13.1%) | 33 (11.9%) |
| $35,000 to $49,999 | 82 (8.6%) | 42 (15.2%) |
| $50,000 to $74,999 | 250 (26.3%) | 62 (22.4%) |
| $75,000 to $99,999 | 174 (18.3%) | 11 (4.0%) |
| $100,000 to $149,999 | 172 (18.1%) | 39 (14.1%) |
| $150,000 or more | 45 (4.7%) | 0 (0.0%) |
| Total | 950 (100.0%) | 277 (100.0%) |
Monthly Housing Cost Tiers in St Clair borough
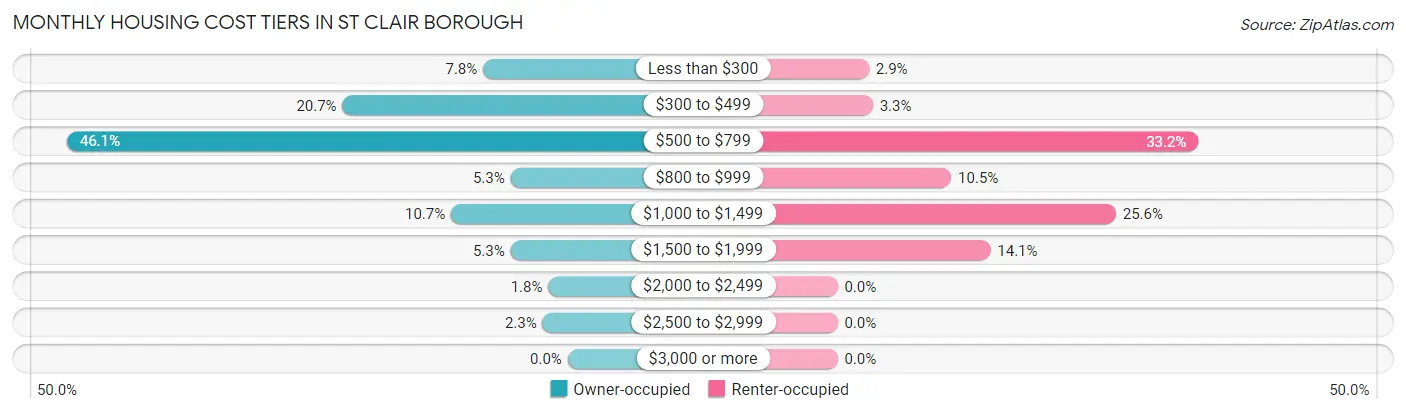
| Monthly Cost | Owner-occupied | Renter-occupied |
| Less than $300 | 74 (7.8%) | 8 (2.9%) |
| $300 to $499 | 197 (20.7%) | 9 (3.3%) |
| $500 to $799 | 438 (46.1%) | 92 (33.2%) |
| $800 to $999 | 50 (5.3%) | 29 (10.5%) |
| $1,000 to $1,499 | 102 (10.7%) | 71 (25.6%) |
| $1,500 to $1,999 | 50 (5.3%) | 39 (14.1%) |
| $2,000 to $2,499 | 17 (1.8%) | 0 (0.0%) |
| $2,500 to $2,999 | 22 (2.3%) | 0 (0.0%) |
| $3,000 or more | 0 (0.0%) | 0 (0.0%) |
| Total | 950 (100.0%) | 277 (100.0%) |
Physical Housing Characteristics in St Clair borough
Housing Structures in St Clair borough
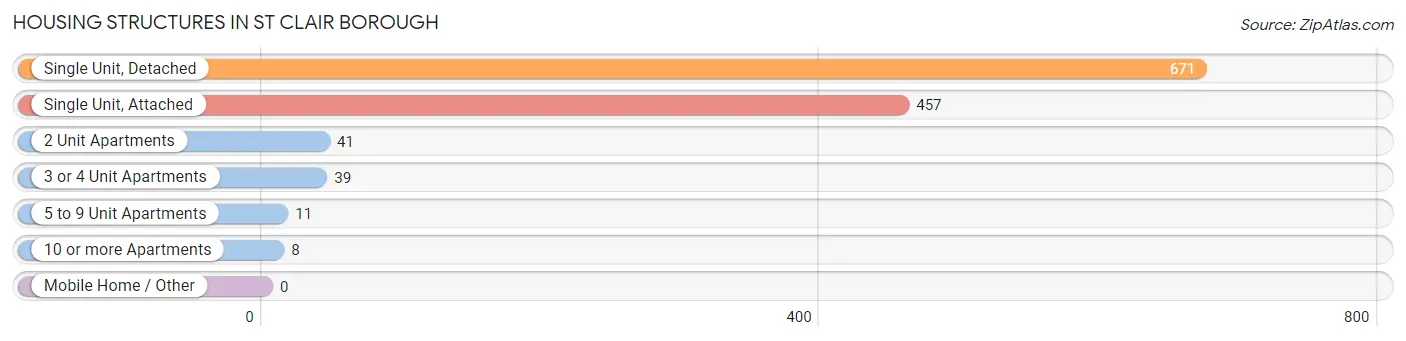
| Structure Type | # Housing Units | % Housing Units |
| Single Unit, Detached | 671 | 54.7% |
| Single Unit, Attached | 457 | 37.2% |
| 2 Unit Apartments | 41 | 3.3% |
| 3 or 4 Unit Apartments | 39 | 3.2% |
| 5 to 9 Unit Apartments | 11 | 0.9% |
| 10 or more Apartments | 8 | 0.6% |
| Mobile Home / Other | 0 | 0.0% |
| Total | 1,227 | 100.0% |
Housing Structures by Occupancy in St Clair borough
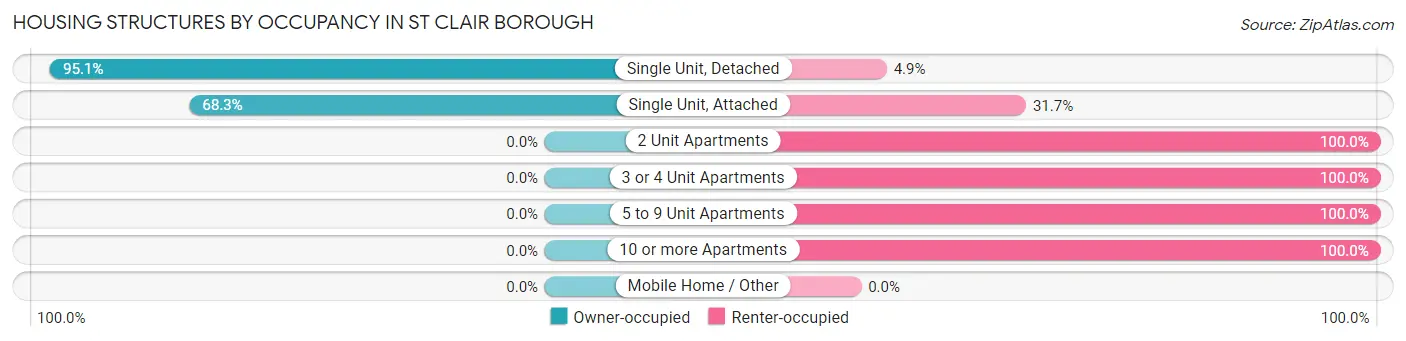
| Structure Type | Owner-occupied | Renter-occupied |
| Single Unit, Detached | 638 (95.1%) | 33 (4.9%) |
| Single Unit, Attached | 312 (68.3%) | 145 (31.7%) |
| 2 Unit Apartments | 0 (0.0%) | 41 (100.0%) |
| 3 or 4 Unit Apartments | 0 (0.0%) | 39 (100.0%) |
| 5 to 9 Unit Apartments | 0 (0.0%) | 11 (100.0%) |
| 10 or more Apartments | 0 (0.0%) | 8 (100.0%) |
| Mobile Home / Other | 0 (0.0%) | 0 (0.0%) |
| Total | 950 (77.4%) | 277 (22.6%) |
Housing Structures by Number of Rooms in St Clair borough
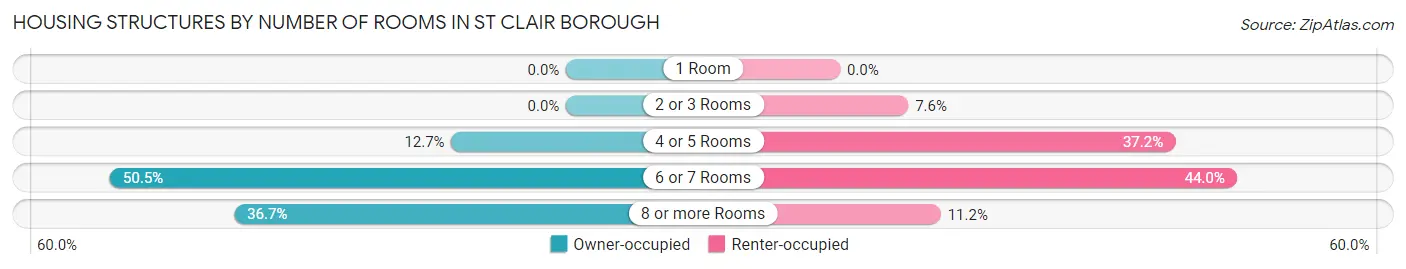
| Number of Rooms | Owner-occupied | Renter-occupied |
| 1 Room | 0 (0.0%) | 0 (0.0%) |
| 2 or 3 Rooms | 0 (0.0%) | 21 (7.6%) |
| 4 or 5 Rooms | 121 (12.7%) | 103 (37.2%) |
| 6 or 7 Rooms | 480 (50.5%) | 122 (44.0%) |
| 8 or more Rooms | 349 (36.7%) | 31 (11.2%) |
| Total | 950 (100.0%) | 277 (100.0%) |
Housing Structure by Heating Type in St Clair borough
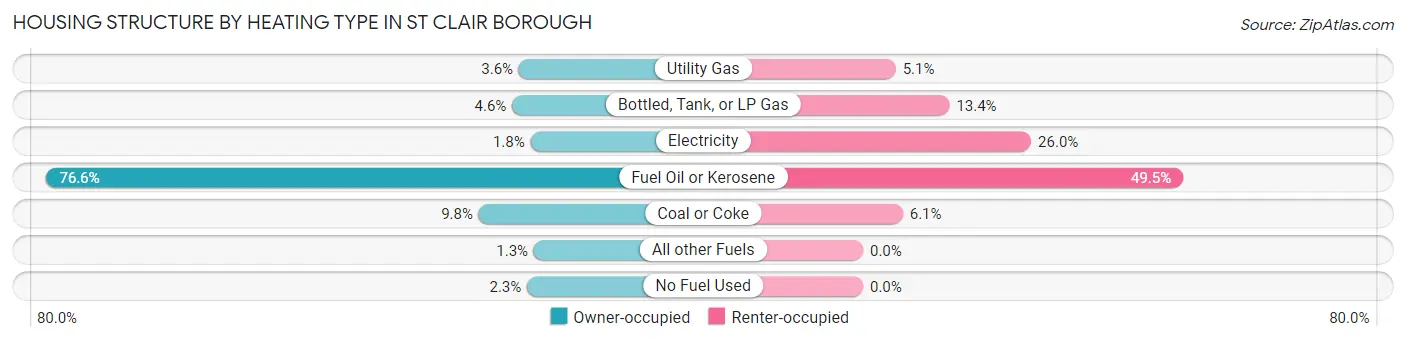
| Heating Type | Owner-occupied | Renter-occupied |
| Utility Gas | 34 (3.6%) | 14 (5.1%) |
| Bottled, Tank, or LP Gas | 44 (4.6%) | 37 (13.4%) |
| Electricity | 17 (1.8%) | 72 (26.0%) |
| Fuel Oil or Kerosene | 728 (76.6%) | 137 (49.5%) |
| Coal or Coke | 93 (9.8%) | 17 (6.1%) |
| All other Fuels | 12 (1.3%) | 0 (0.0%) |
| No Fuel Used | 22 (2.3%) | 0 (0.0%) |
| Total | 950 (100.0%) | 277 (100.0%) |
Household Vehicle Usage in St Clair borough
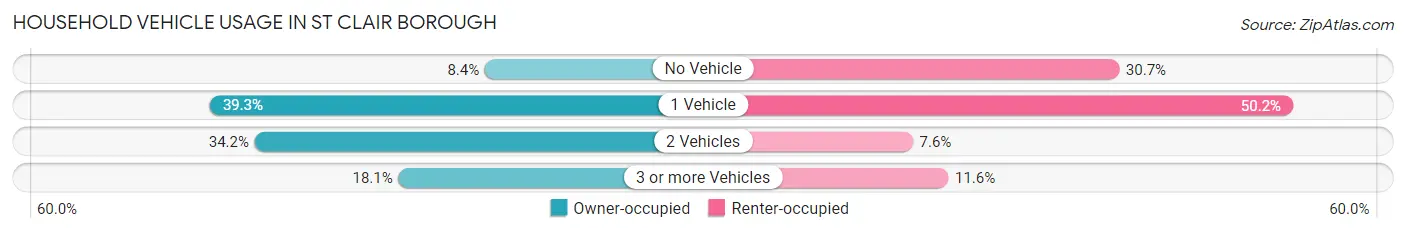
| Vehicles per Household | Owner-occupied | Renter-occupied |
| No Vehicle | 80 (8.4%) | 85 (30.7%) |
| 1 Vehicle | 373 (39.3%) | 139 (50.2%) |
| 2 Vehicles | 325 (34.2%) | 21 (7.6%) |
| 3 or more Vehicles | 172 (18.1%) | 32 (11.6%) |
| Total | 950 (100.0%) | 277 (100.0%) |
Real Estate & Mortgages in St Clair borough
Real Estate and Mortgage Overview in St Clair borough
| Characteristic | Without Mortgage | With Mortgage |
| Housing Units | 590 | 360 |
| Median Property Value | $60,200 | $76,900 |
| Median Household Income | $64,342 | $27 |
| Monthly Housing Costs | $522 | $0 |
| Real Estate Taxes | $1,230 | $0 |
Property Value by Mortgage Status in St Clair borough
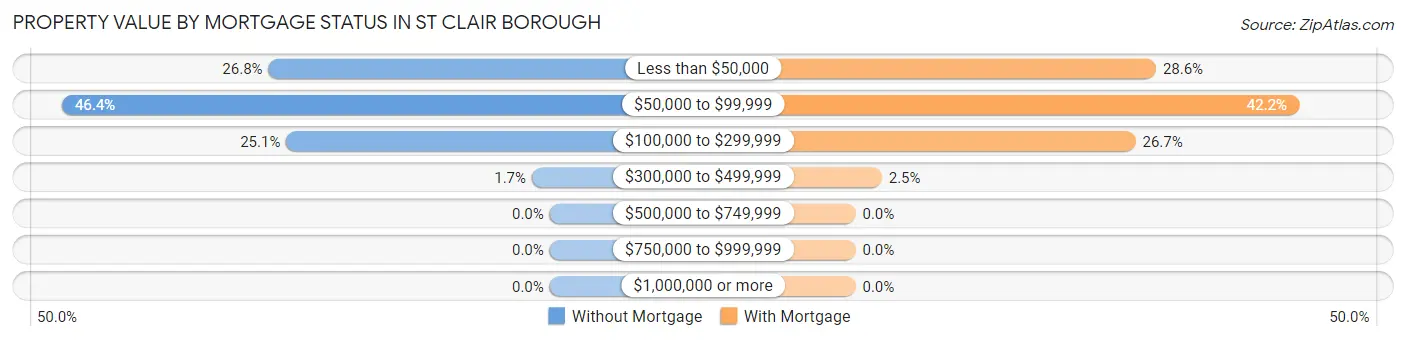
| Property Value | Without Mortgage | With Mortgage |
| Less than $50,000 | 158 (26.8%) | 103 (28.6%) |
| $50,000 to $99,999 | 274 (46.4%) | 152 (42.2%) |
| $100,000 to $299,999 | 148 (25.1%) | 96 (26.7%) |
| $300,000 to $499,999 | 10 (1.7%) | 9 (2.5%) |
| $500,000 to $749,999 | 0 (0.0%) | 0 (0.0%) |
| $750,000 to $999,999 | 0 (0.0%) | 0 (0.0%) |
| $1,000,000 or more | 0 (0.0%) | 0 (0.0%) |
| Total | 590 (100.0%) | 360 (100.0%) |
Household Income by Mortgage Status in St Clair borough
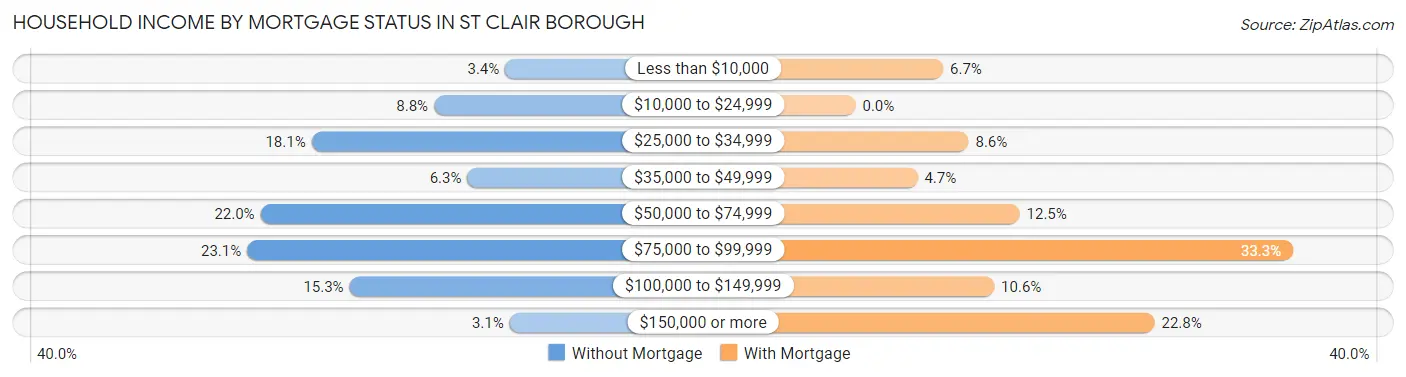
| Household Income | Without Mortgage | With Mortgage |
| Less than $10,000 | 20 (3.4%) | 24 (6.7%) |
| $10,000 to $24,999 | 52 (8.8%) | 0 (0.0%) |
| $25,000 to $34,999 | 107 (18.1%) | 31 (8.6%) |
| $35,000 to $49,999 | 37 (6.3%) | 17 (4.7%) |
| $50,000 to $74,999 | 130 (22.0%) | 45 (12.5%) |
| $75,000 to $99,999 | 136 (23.1%) | 120 (33.3%) |
| $100,000 to $149,999 | 90 (15.2%) | 38 (10.6%) |
| $150,000 or more | 18 (3.0%) | 82 (22.8%) |
| Total | 590 (100.0%) | 360 (100.0%) |
Property Value to Household Income Ratio in St Clair borough
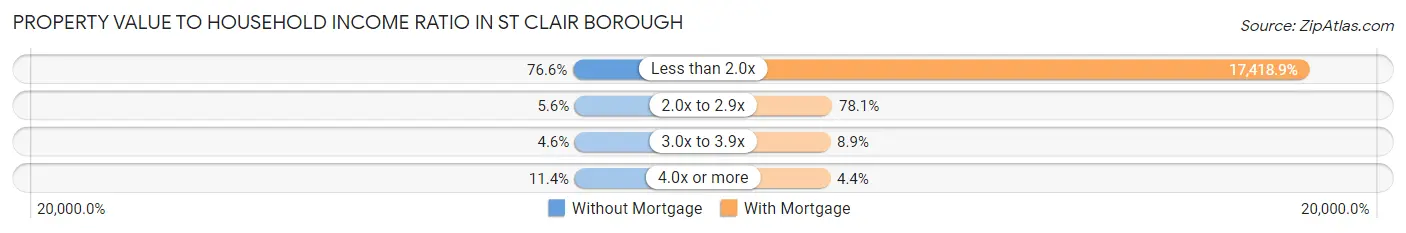
| Value-to-Income Ratio | Without Mortgage | With Mortgage |
| Less than 2.0x | 452 (76.6%) | 62,708 (17,418.9%) |
| 2.0x to 2.9x | 33 (5.6%) | 281 (78.1%) |
| 3.0x to 3.9x | 27 (4.6%) | 32 (8.9%) |
| 4.0x or more | 67 (11.4%) | 16 (4.4%) |
| Total | 590 (100.0%) | 360 (100.0%) |
Real Estate Taxes by Mortgage Status in St Clair borough
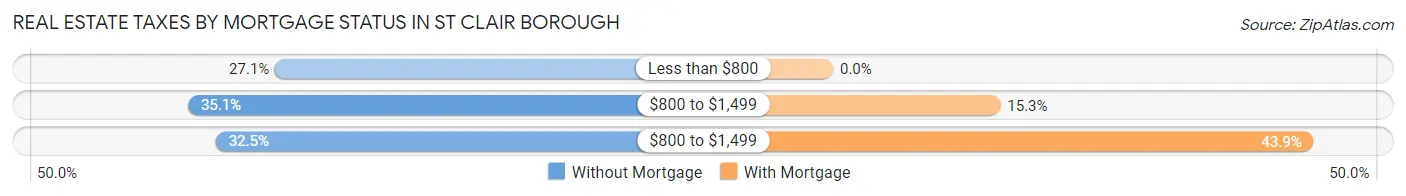
| Property Taxes | Without Mortgage | With Mortgage |
| Less than $800 | 160 (27.1%) | 0 (0.0%) |
| $800 to $1,499 | 207 (35.1%) | 55 (15.3%) |
| $800 to $1,499 | 192 (32.5%) | 158 (43.9%) |
| Total | 590 (100.0%) | 360 (100.0%) |
Health & Disability in St Clair borough
Health Insurance Coverage by Age in St Clair borough
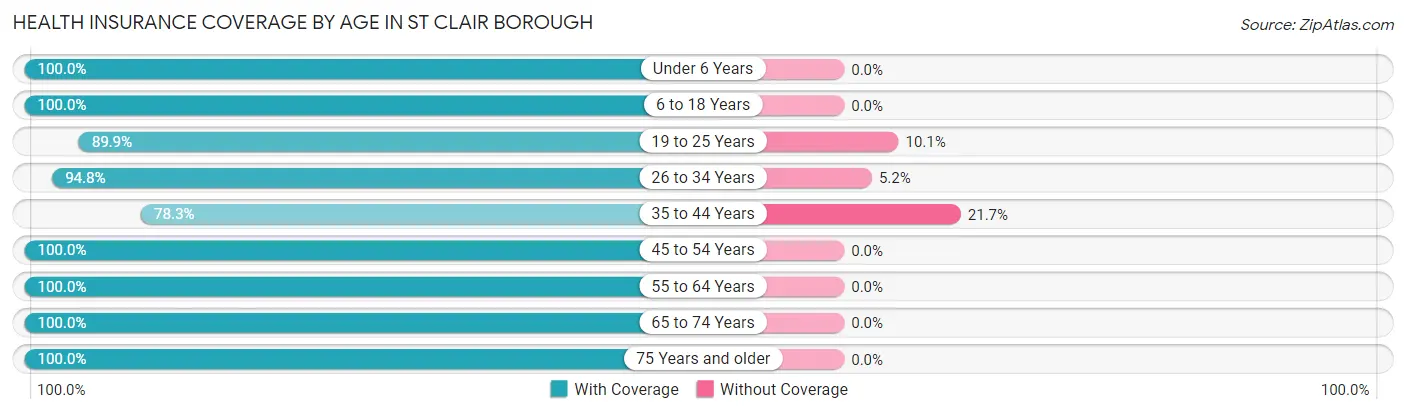
| Age Bracket | With Coverage | Without Coverage |
| Under 6 Years | 129 (100.0%) | 0 (0.0%) |
| 6 to 18 Years | 322 (100.0%) | 0 (0.0%) |
| 19 to 25 Years | 222 (89.9%) | 25 (10.1%) |
| 26 to 34 Years | 349 (94.8%) | 19 (5.2%) |
| 35 to 44 Years | 216 (78.3%) | 60 (21.7%) |
| 45 to 54 Years | 367 (100.0%) | 0 (0.0%) |
| 55 to 64 Years | 450 (100.0%) | 0 (0.0%) |
| 65 to 74 Years | 333 (100.0%) | 0 (0.0%) |
| 75 Years and older | 273 (100.0%) | 0 (0.0%) |
| Total | 2,661 (96.2%) | 104 (3.8%) |
Health Insurance Coverage by Citizenship Status in St Clair borough
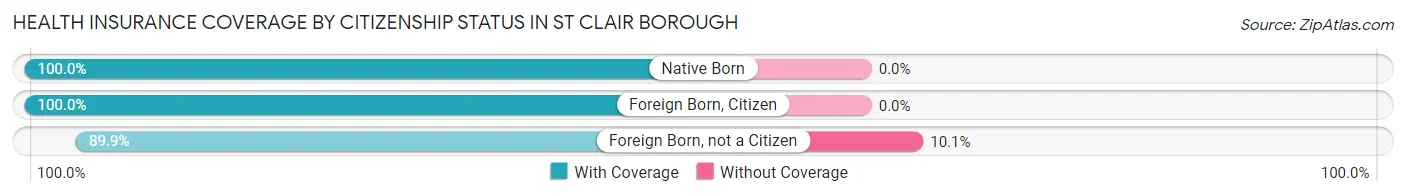
| Citizenship Status | With Coverage | Without Coverage |
| Native Born | 129 (100.0%) | 0 (0.0%) |
| Foreign Born, Citizen | 322 (100.0%) | 0 (0.0%) |
| Foreign Born, not a Citizen | 222 (89.9%) | 25 (10.1%) |
Health Insurance Coverage by Household Income in St Clair borough
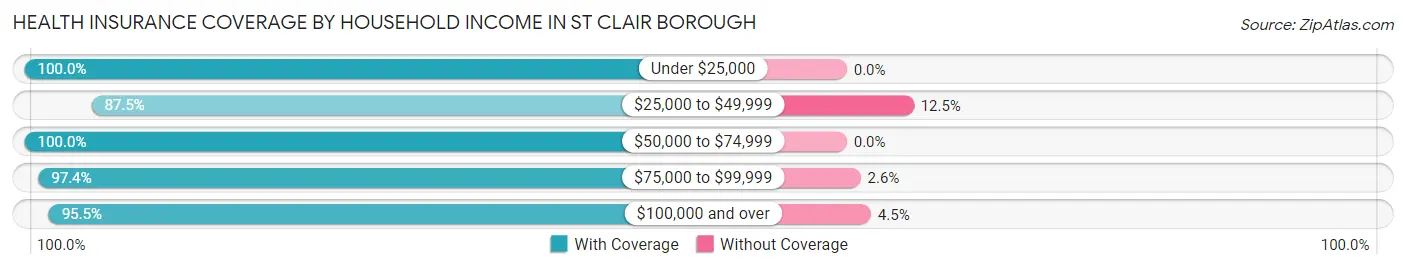
| Household Income | With Coverage | Without Coverage |
| Under $25,000 | 318 (100.0%) | 0 (0.0%) |
| $25,000 to $49,999 | 391 (87.5%) | 56 (12.5%) |
| $50,000 to $74,999 | 751 (100.0%) | 0 (0.0%) |
| $75,000 to $99,999 | 415 (97.4%) | 11 (2.6%) |
| $100,000 and over | 781 (95.5%) | 37 (4.5%) |
Public vs Private Health Insurance Coverage by Age in St Clair borough
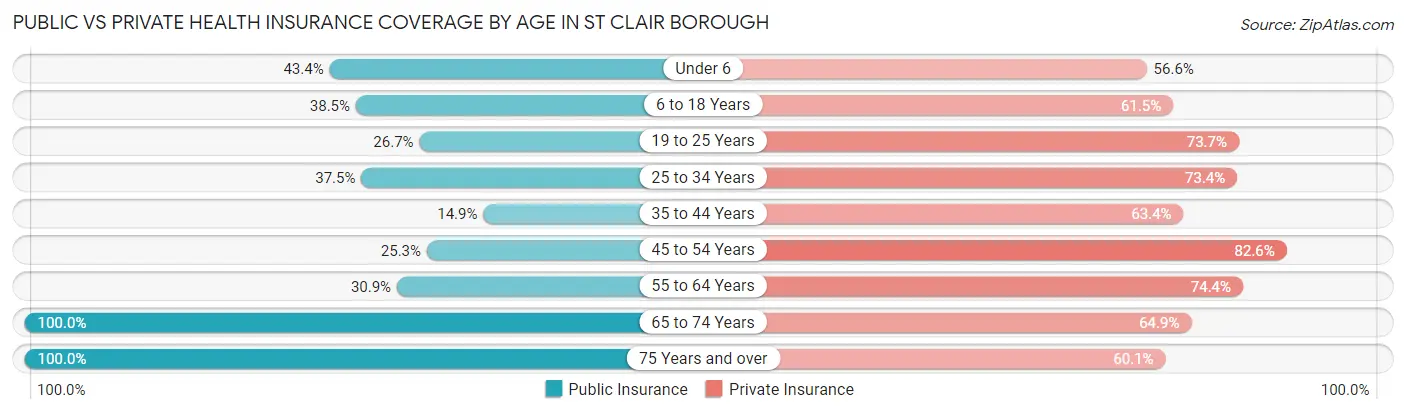
| Age Bracket | Public Insurance | Private Insurance |
| Under 6 | 56 (43.4%) | 73 (56.6%) |
| 6 to 18 Years | 124 (38.5%) | 198 (61.5%) |
| 19 to 25 Years | 66 (26.7%) | 182 (73.7%) |
| 25 to 34 Years | 138 (37.5%) | 270 (73.4%) |
| 35 to 44 Years | 41 (14.9%) | 175 (63.4%) |
| 45 to 54 Years | 93 (25.3%) | 303 (82.6%) |
| 55 to 64 Years | 139 (30.9%) | 335 (74.4%) |
| 65 to 74 Years | 333 (100.0%) | 216 (64.9%) |
| 75 Years and over | 273 (100.0%) | 164 (60.1%) |
| Total | 1,263 (45.7%) | 1,916 (69.3%) |
Disability Status by Sex by Age in St Clair borough
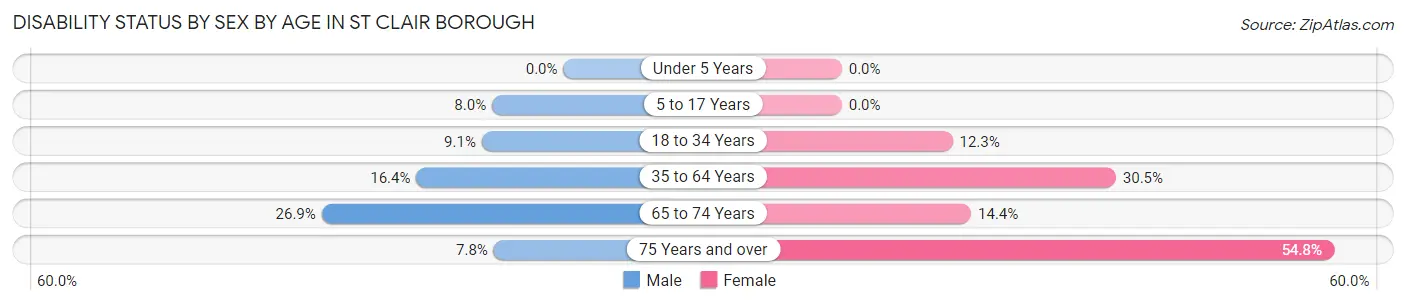
| Age Bracket | Male | Female |
| Under 5 Years | 0 (0.0%) | 0 (0.0%) |
| 5 to 17 Years | 12 (8.0%) | 0 (0.0%) |
| 18 to 34 Years | 31 (9.1%) | 37 (12.3%) |
| 35 to 64 Years | 76 (16.4%) | 192 (30.5%) |
| 65 to 74 Years | 56 (26.9%) | 18 (14.4%) |
| 75 Years and over | 9 (7.8%) | 86 (54.8%) |
Disability Class by Sex by Age in St Clair borough
Disability Class: Hearing Difficulty
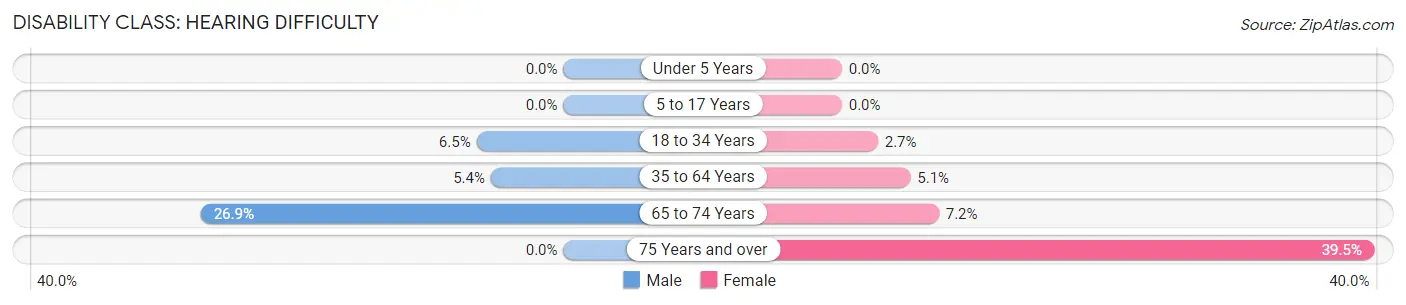
| Age Bracket | Male | Female |
| Under 5 Years | 0 (0.0%) | 0 (0.0%) |
| 5 to 17 Years | 0 (0.0%) | 0 (0.0%) |
| 18 to 34 Years | 22 (6.5%) | 8 (2.7%) |
| 35 to 64 Years | 25 (5.4%) | 32 (5.1%) |
| 65 to 74 Years | 56 (26.9%) | 9 (7.2%) |
| 75 Years and over | 0 (0.0%) | 62 (39.5%) |
Disability Class: Vision Difficulty
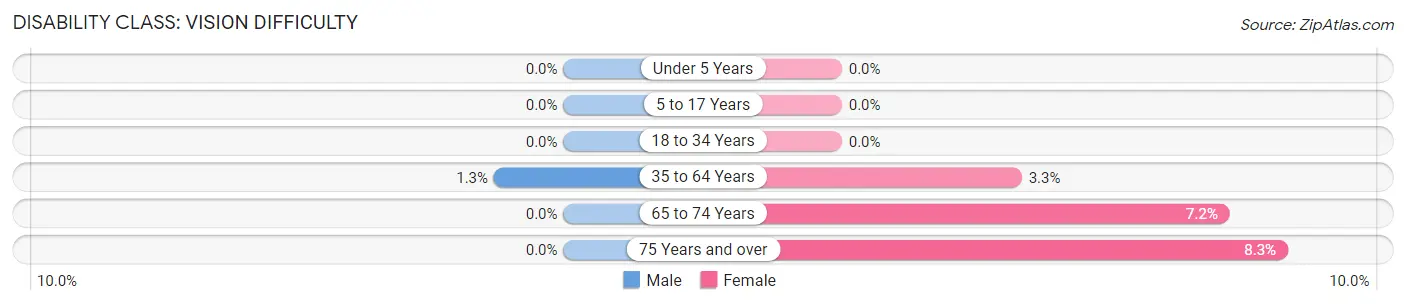
| Age Bracket | Male | Female |
| Under 5 Years | 0 (0.0%) | 0 (0.0%) |
| 5 to 17 Years | 0 (0.0%) | 0 (0.0%) |
| 18 to 34 Years | 0 (0.0%) | 0 (0.0%) |
| 35 to 64 Years | 6 (1.3%) | 21 (3.3%) |
| 65 to 74 Years | 0 (0.0%) | 9 (7.2%) |
| 75 Years and over | 0 (0.0%) | 13 (8.3%) |
Disability Class: Cognitive Difficulty
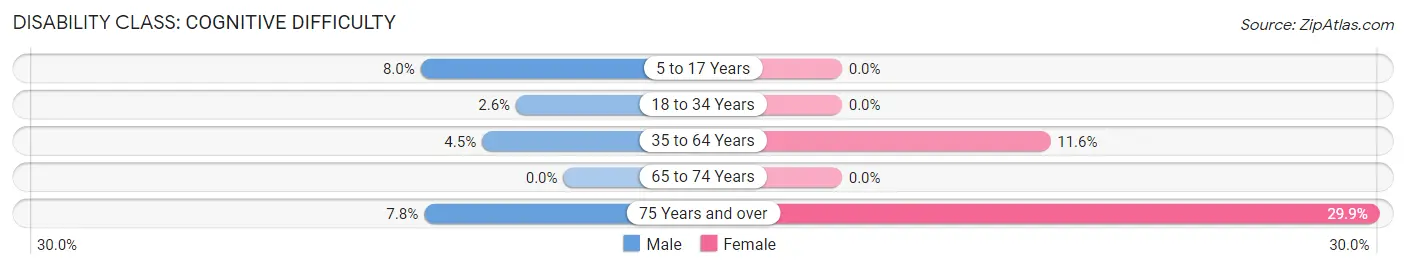
| Age Bracket | Male | Female |
| 5 to 17 Years | 12 (8.0%) | 0 (0.0%) |
| 18 to 34 Years | 9 (2.6%) | 0 (0.0%) |
| 35 to 64 Years | 21 (4.5%) | 73 (11.6%) |
| 65 to 74 Years | 0 (0.0%) | 0 (0.0%) |
| 75 Years and over | 9 (7.8%) | 47 (29.9%) |
Disability Class: Ambulatory Difficulty
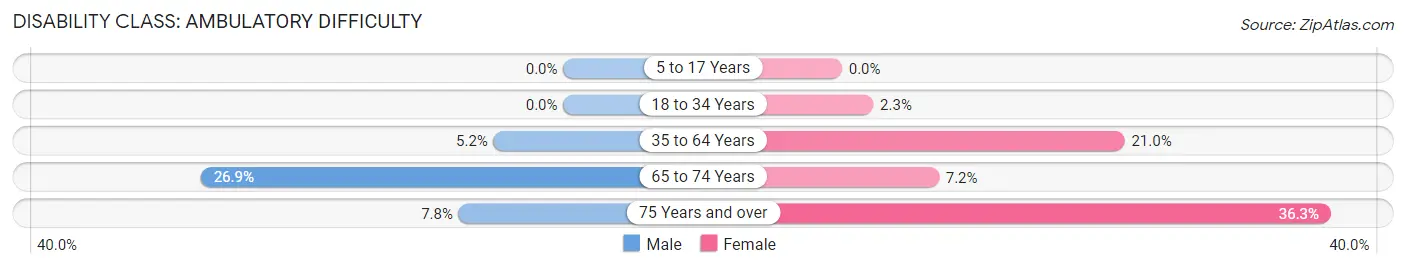
| Age Bracket | Male | Female |
| 5 to 17 Years | 0 (0.0%) | 0 (0.0%) |
| 18 to 34 Years | 0 (0.0%) | 7 (2.3%) |
| 35 to 64 Years | 24 (5.2%) | 132 (21.0%) |
| 65 to 74 Years | 56 (26.9%) | 9 (7.2%) |
| 75 Years and over | 9 (7.8%) | 57 (36.3%) |
Disability Class: Self-Care Difficulty
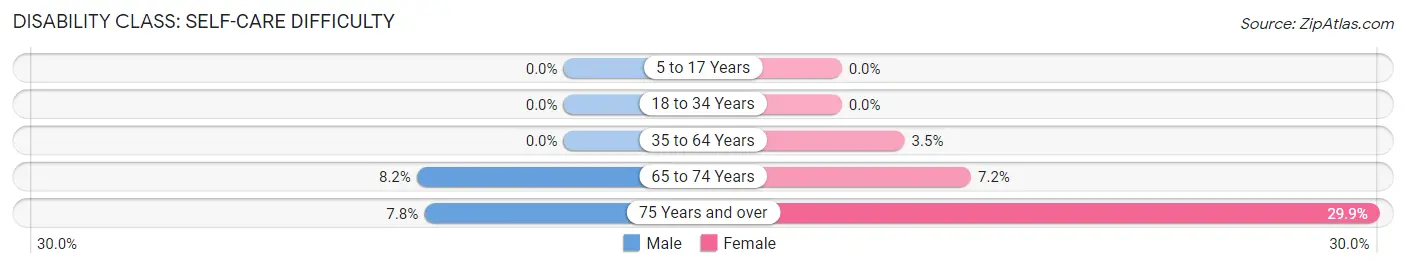
| Age Bracket | Male | Female |
| 5 to 17 Years | 0 (0.0%) | 0 (0.0%) |
| 18 to 34 Years | 0 (0.0%) | 0 (0.0%) |
| 35 to 64 Years | 0 (0.0%) | 22 (3.5%) |
| 65 to 74 Years | 17 (8.2%) | 9 (7.2%) |
| 75 Years and over | 9 (7.8%) | 47 (29.9%) |
Technology Access in St Clair borough
Computing Device Access in St Clair borough
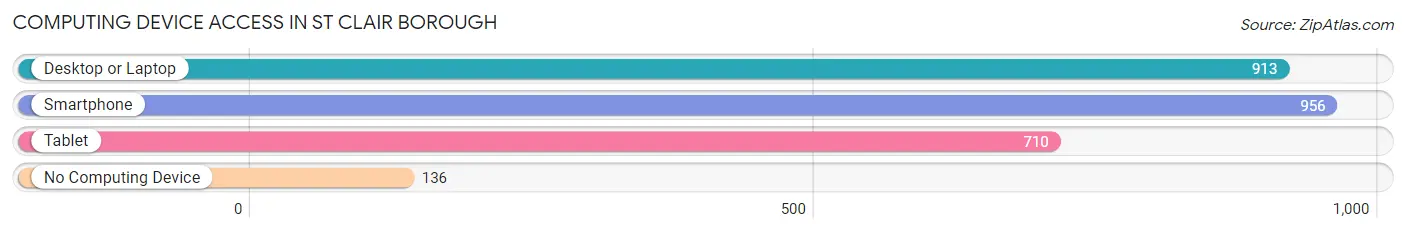
| Device Type | # Households | % Households |
| Desktop or Laptop | 913 | 74.4% |
| Smartphone | 956 | 77.9% |
| Tablet | 710 | 57.9% |
| No Computing Device | 136 | 11.1% |
| Total | 1,227 | 100.0% |
Internet Access in St Clair borough
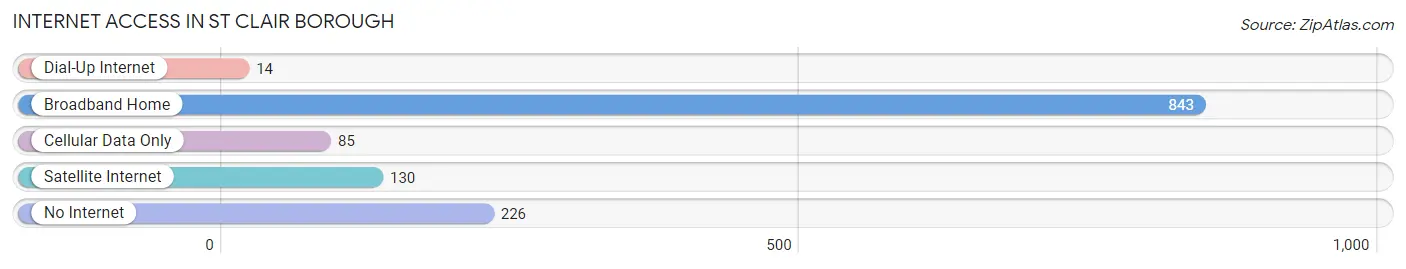
| Internet Type | # Households | % Households |
| Dial-Up Internet | 14 | 1.1% |
| Broadband Home | 843 | 68.7% |
| Cellular Data Only | 85 | 6.9% |
| Satellite Internet | 130 | 10.6% |
| No Internet | 226 | 18.4% |
| Total | 1,227 | 100.0% |
St Clair borough Summary
St Clair Borough is a small borough located in Schuylkill County, Pennsylvania. It is situated in the southeastern corner of the county, and is bordered by the townships of North Manheim, West Brunswick, and East Brunswick. The population of St Clair Borough was 1,845 at the 2010 census.
History
St Clair Borough was founded in 1845 by a group of German immigrants who had settled in the area. The town was named after the St. Clair family, who had owned the land prior to the settlement. The town was incorporated in 1851, and the first mayor was elected in 1852.
The town grew steadily throughout the 19th century, and by the early 20th century, it had become a thriving industrial center. The town was home to several coal mines, as well as a number of factories and businesses. The town also had a thriving retail sector, with several stores and shops.
The town experienced a period of decline in the mid-20th century, as the coal industry declined and the factories and businesses closed. However, the town has seen a resurgence in recent years, with new businesses and industries moving into the area.
Geography
St Clair Borough is located in the southeastern corner of Schuylkill County, Pennsylvania. It is bordered by the townships of North Manheim, West Brunswick, and East Brunswick. The borough is situated in the Appalachian Mountains, and is surrounded by rolling hills and forests.
The borough is located at an elevation of 1,400 feet (427 m) above sea level. The climate is humid continental, with cold winters and hot, humid summers. The average annual temperature is 48°F (9°C), and the average annual precipitation is 40 inches (1,016 mm).
Economy
St Clair Borough has a diverse economy, with a mix of manufacturing, retail, and service industries. The town is home to several factories and businesses, including a paper mill, a plastics manufacturer, and a printing company. The town also has a number of retail stores and shops, as well as several restaurants and bars.
The town is also home to a number of small businesses, including a hardware store, a bakery, and a florist. The town is also home to a number of professional services, such as lawyers, accountants, and doctors.
Demographics
As of the 2010 census, the population of St Clair Borough was 1,845. The racial makeup of the town was 97.3% White, 0.9% African American, 0.2% Native American, 0.3% Asian, 0.1% Pacific Islander, 0.3% from other races, and 0.9% from two or more races. Hispanic or Latino of any race were 1.2% of the population.
The median income for a household in the borough was $37,917, and the median income for a family was $45,625. The per capita income for the borough was $19,945. About 11.2% of families and 13.2% of the population were below the poverty line, including 17.2% of those under age 18 and 8.2% of those age 65 or over.
Common Questions
What is the Total Population of St Clair borough?
Total Population of St Clair borough is 2,765.
What is the Total Male Population of St Clair borough?
Total Male Population of St Clair borough is 1,343.
What is the Total Female Population of St Clair borough?
Total Female Population of St Clair borough is 1,422.
What is the Ratio of Males per 100 Females in St Clair borough?
There are 94.44 Males per 100 Females in St Clair borough.
What is the Ratio of Females per 100 Males in St Clair borough?
There are 105.88 Females per 100 Males in St Clair borough.
What is the Median Population Age in St Clair borough?
Median Population Age in St Clair borough is 46.7 Years.
What is the Average Family Size in St Clair borough
Average Family Size in St Clair borough is 2.6 People.
What is the Average Household Size in St Clair borough
Average Household Size in St Clair borough is 2.2 People.
What is Per Capita Income in St Clair borough?
Per Capita income in St Clair borough is $31,276.
What is the Median Family Income in St Clair borough?
Median Family Income in St Clair borough is $66,533.
What is the Median Household income in St Clair borough?
Median Household Income in St Clair borough is $58,371.
What is Income or Wage Gap in St Clair borough?
Income or Wage Gap in St Clair borough is 42.2%.
Women in St Clair borough earn 57.8 cents for every dollar earned by a man.
What is Family Income Deficit in St Clair borough?
Family Income Deficit in St Clair borough is $8,788.
Families that are below poverty line in St Clair borough earn $8,788 less on average than the poverty threshold level.
What is Inequality or Gini Index in St Clair borough?
Inequality or Gini Index in St Clair borough is 0.36.
How Large is the Labor Force in St Clair borough?
There are 1,510 People in the Labor Forcein in St Clair borough.
What is the Percentage of People in the Labor Force in St Clair borough?
62.7% of People are in the Labor Force in St Clair borough.
What is the Unemployment Rate in St Clair borough?
Unemployment Rate in St Clair borough is 1.1%.