Pennsbury Village borough, PA
Pennsbury Village borough Overview
633
TOTAL POPULATION
271
MALE POPULATION
362
FEMALE POPULATION
74.86
MALES / 100 FEMALES
133.58
FEMALES / 100 MALES
40.7
MEDIAN AGE
2.3
AVG FAMILY SIZE
1.4
AVG HOUSEHOLD SIZE
$64,484
PER CAPITA INCOME
$109,500
AVG FAMILY INCOME
$70,179
AVG HOUSEHOLD INCOME
4.4%
WAGE / INCOME GAP [ % ]
95.6¢/ $1
WAGE / INCOME GAP [ $ ]
0.40
INEQUALITY / GINI INDEX
496
LABOR FORCE [ PEOPLE ]
82.4%
PERCENT IN LABOR FORCE
1.6%
UNEMPLOYMENT RATE
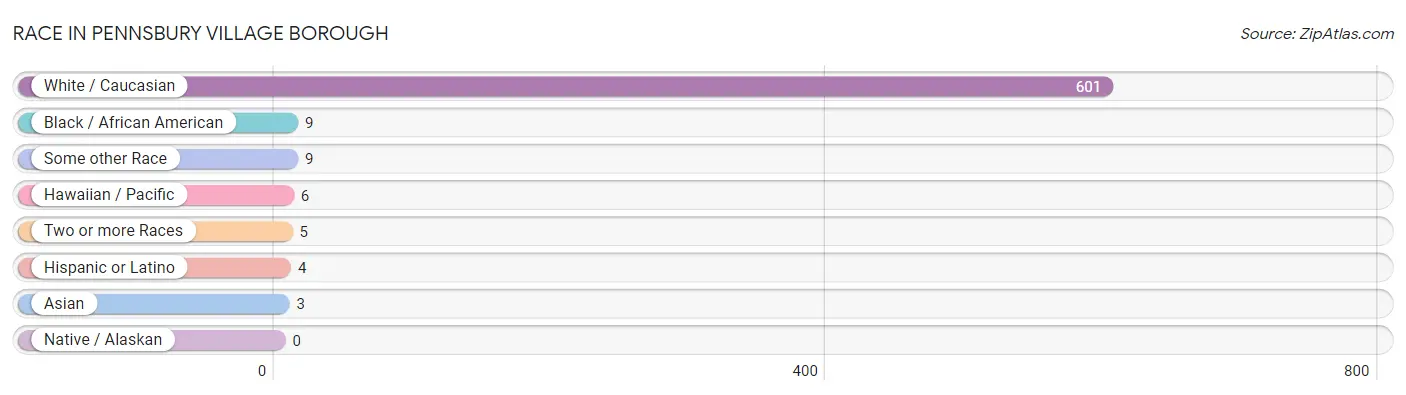
Race in Pennsbury Village borough
The most populous races in Pennsbury Village borough are White / Caucasian (601 | 94.9%), Black / African American (9 | 1.4%), and Some other Race (9 | 1.4%).
| Race | # Population | % Population |
| Asian | 3 | 0.5% |
| Black / African American | 9 | 1.4% |
| Hawaiian / Pacific | 6 | 0.9% |
| Hispanic or Latino | 4 | 0.6% |
| Native / Alaskan | 0 | 0.0% |
| White / Caucasian | 601 | 94.9% |
| Two or more Races | 5 | 0.8% |
| Some other Race | 9 | 1.4% |
| Total | 633 | 100.0% |
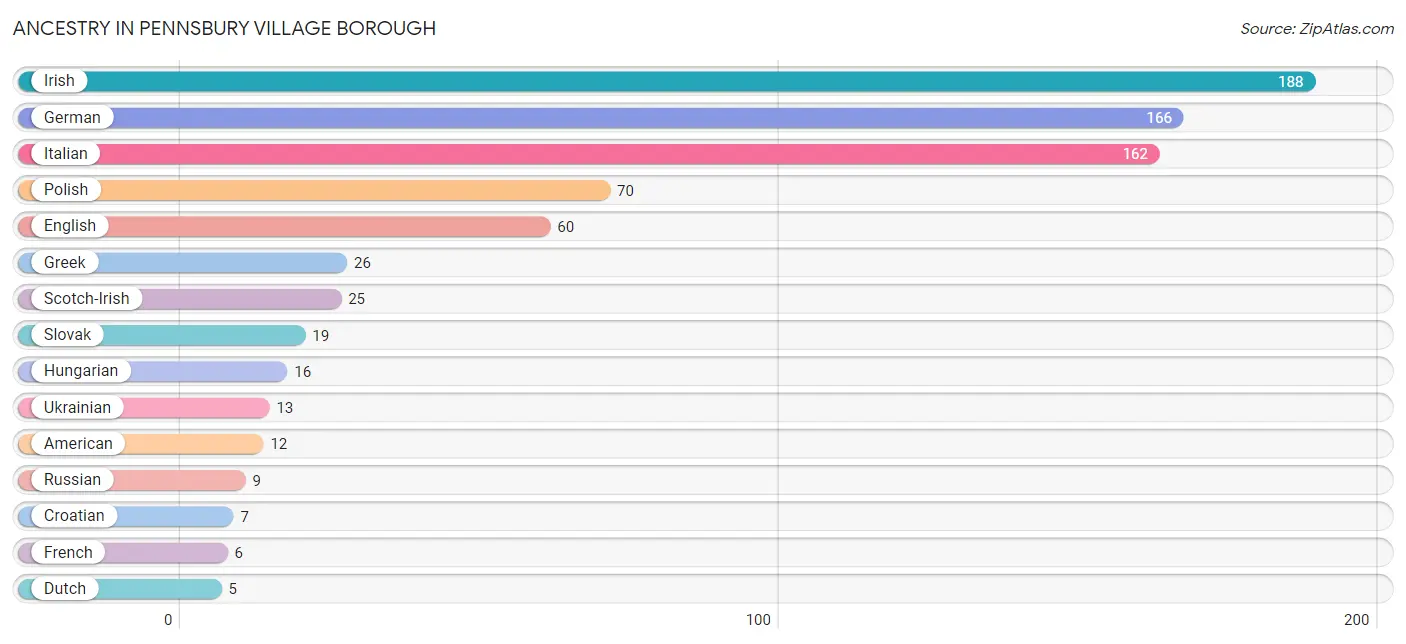
Ancestry in Pennsbury Village borough
The most populous ancestries reported in Pennsbury Village borough are Irish (188 | 29.7%), German (166 | 26.2%), Italian (162 | 25.6%), Polish (70 | 11.1%), and English (60 | 9.5%), together accounting for 102.0% of all Pennsbury Village borough residents.
| Ancestry | # Population | % Population |
| American | 12 | 1.9% |
| British | 3 | 0.5% |
| Croatian | 7 | 1.1% |
| Czech | 4 | 0.6% |
| Czechoslovakian | 4 | 0.6% |
| Dutch | 5 | 0.8% |
| Ecuadorian | 4 | 0.6% |
| English | 60 | 9.5% |
| European | 4 | 0.6% |
| French | 6 | 0.9% |
| French Canadian | 3 | 0.5% |
| German | 166 | 26.2% |
| Greek | 26 | 4.1% |
| Hungarian | 16 | 2.5% |
| Irish | 188 | 29.7% |
| Italian | 162 | 25.6% |
| Lithuanian | 3 | 0.5% |
| Pakistani | 3 | 0.5% |
| Polish | 70 | 11.1% |
| Russian | 9 | 1.4% |
| Scotch-Irish | 25 | 4.0% |
| Scottish | 3 | 0.5% |
| Serbian | 5 | 0.8% |
| Slovak | 19 | 3.0% |
| South American | 4 | 0.6% |
| Swedish | 3 | 0.5% |
| Swiss | 5 | 0.8% |
| Ukrainian | 13 | 2.1% |
| Welsh | 3 | 0.5% | View All 29 Rows |
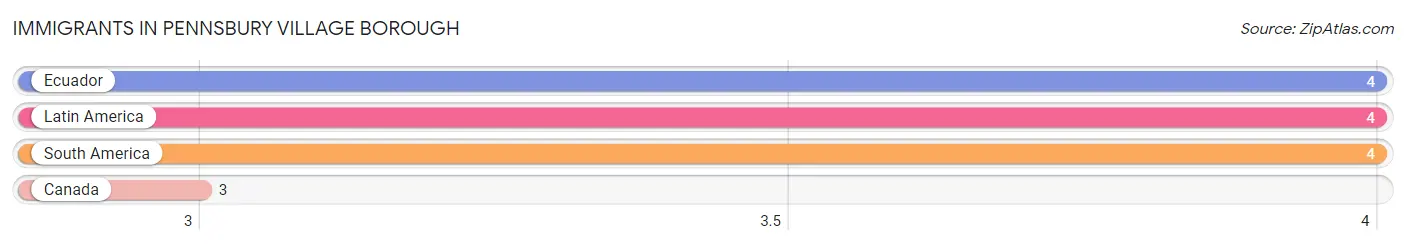
Immigrants in Pennsbury Village borough
The most numerous immigrant groups reported in Pennsbury Village borough came from Ecuador (4 | 0.6%), Latin America (4 | 0.6%), South America (4 | 0.6%), and Canada (3 | 0.5%), together accounting for 2.4% of all Pennsbury Village borough residents.
| Immigration Origin | # Population | % Population |
| Canada | 3 | 0.5% |
| Ecuador | 4 | 0.6% |
| Latin America | 4 | 0.6% |
| South America | 4 | 0.6% | View All 4 Rows |
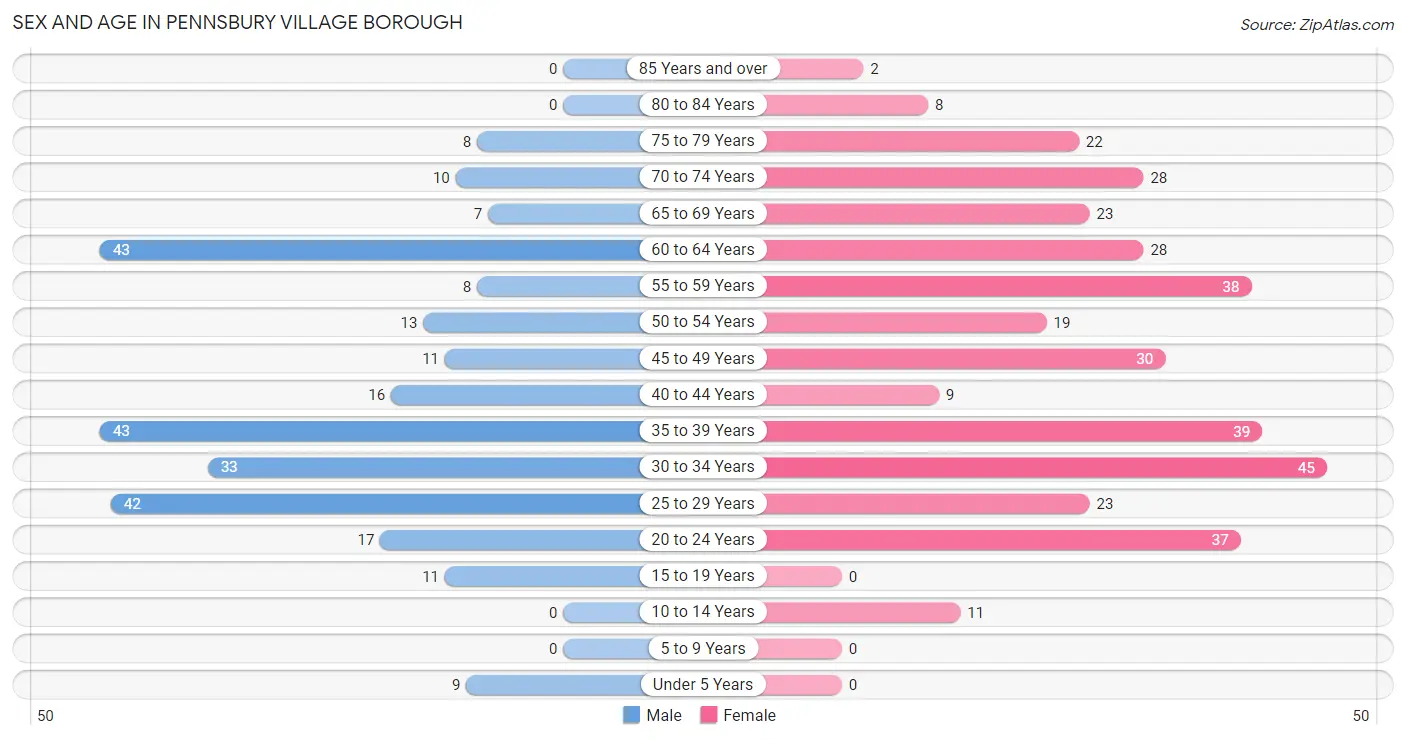
Sex and Age in Pennsbury Village borough
Sex and Age in Pennsbury Village borough
The most populous age groups in Pennsbury Village borough are 35 to 39 Years (43 | 15.9%) for men and 30 to 34 Years (45 | 12.4%) for women.
| Age Bracket | Male | Female |
| Under 5 Years | 9 (3.3%) | 0 (0.0%) |
| 5 to 9 Years | 0 (0.0%) | 0 (0.0%) |
| 10 to 14 Years | 0 (0.0%) | 11 (3.0%) |
| 15 to 19 Years | 11 (4.1%) | 0 (0.0%) |
| 20 to 24 Years | 17 (6.3%) | 37 (10.2%) |
| 25 to 29 Years | 42 (15.5%) | 23 (6.4%) |
| 30 to 34 Years | 33 (12.2%) | 45 (12.4%) |
| 35 to 39 Years | 43 (15.9%) | 39 (10.8%) |
| 40 to 44 Years | 16 (5.9%) | 9 (2.5%) |
| 45 to 49 Years | 11 (4.1%) | 30 (8.3%) |
| 50 to 54 Years | 13 (4.8%) | 19 (5.2%) |
| 55 to 59 Years | 8 (2.9%) | 38 (10.5%) |
| 60 to 64 Years | 43 (15.9%) | 28 (7.7%) |
| 65 to 69 Years | 7 (2.6%) | 23 (6.4%) |
| 70 to 74 Years | 10 (3.7%) | 28 (7.7%) |
| 75 to 79 Years | 8 (2.9%) | 22 (6.1%) |
| 80 to 84 Years | 0 (0.0%) | 8 (2.2%) |
| 85 Years and over | 0 (0.0%) | 2 (0.5%) |
| Total | 271 (100.0%) | 362 (100.0%) |
Families and Households in Pennsbury Village borough
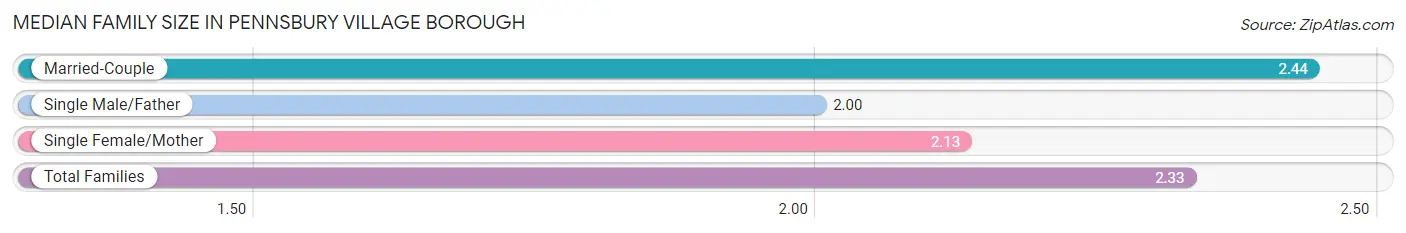
Median Family Size in Pennsbury Village borough
The median family size in Pennsbury Village borough is 2.33 persons per family, with married-couple families (54 | 65.8%) accounting for the largest median family size of 2.44 persons per family. On the other hand, single male/father families (4 | 4.9%) represent the smallest median family size with 2.00 persons per family.
| Family Type | # Families | Family Size |
| Married-Couple | 54 (65.8%) | 2.44 |
| Single Male/Father | 4 (4.9%) | 2.00 |
| Single Female/Mother | 24 (29.3%) | 2.13 |
| Total Families | 82 (100.0%) | 2.33 |
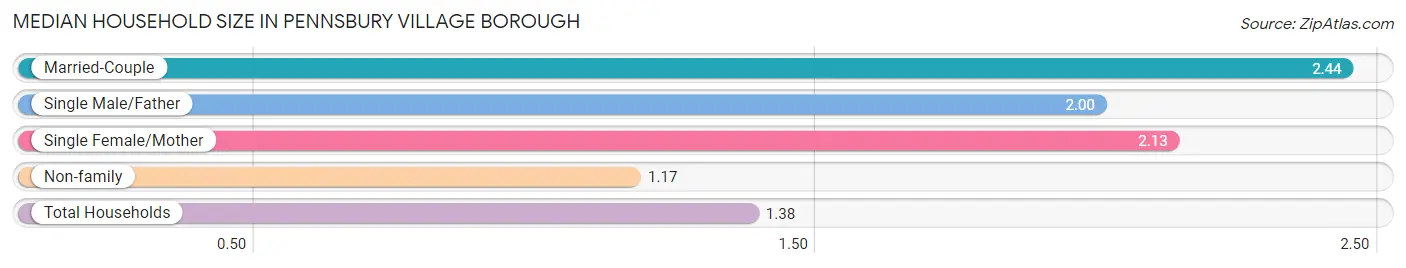
Median Household Size in Pennsbury Village borough
The median household size in Pennsbury Village borough is 1.38 persons per household, with married-couple households (54 | 11.8%) accounting for the largest median household size of 2.44 persons per household. non-family households (377 | 82.1%) represent the smallest median household size with 1.17 persons per household.
| Household Type | # Households | Household Size |
| Married-Couple | 54 (11.8%) | 2.44 |
| Single Male/Father | 4 (0.9%) | 2.00 |
| Single Female/Mother | 24 (5.2%) | 2.13 |
| Non-family | 377 (82.1%) | 1.17 |
| Total Households | 459 (100.0%) | 1.38 |
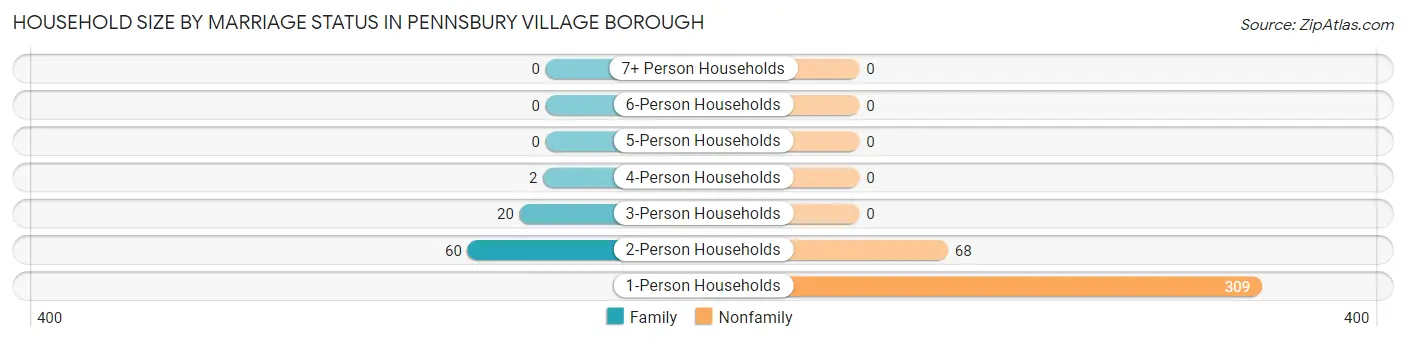
Household Size by Marriage Status in Pennsbury Village borough
Out of a total of 459 households in Pennsbury Village borough, 82 (17.9%) are family households, while 377 (82.1%) are nonfamily households. The most numerous type of family households are 2-person households, comprising 60, and the most common type of nonfamily households are 1-person households, comprising 309.
| Household Size | Family Households | Nonfamily Households |
| 1-Person Households | - | 309 (67.3%) |
| 2-Person Households | 60 (13.1%) | 68 (14.8%) |
| 3-Person Households | 20 (4.4%) | 0 (0.0%) |
| 4-Person Households | 2 (0.4%) | 0 (0.0%) |
| 5-Person Households | 0 (0.0%) | 0 (0.0%) |
| 6-Person Households | 0 (0.0%) | 0 (0.0%) |
| 7+ Person Households | 0 (0.0%) | 0 (0.0%) |
| Total | 82 (17.9%) | 377 (82.1%) |
Female Fertility in Pennsbury Village borough
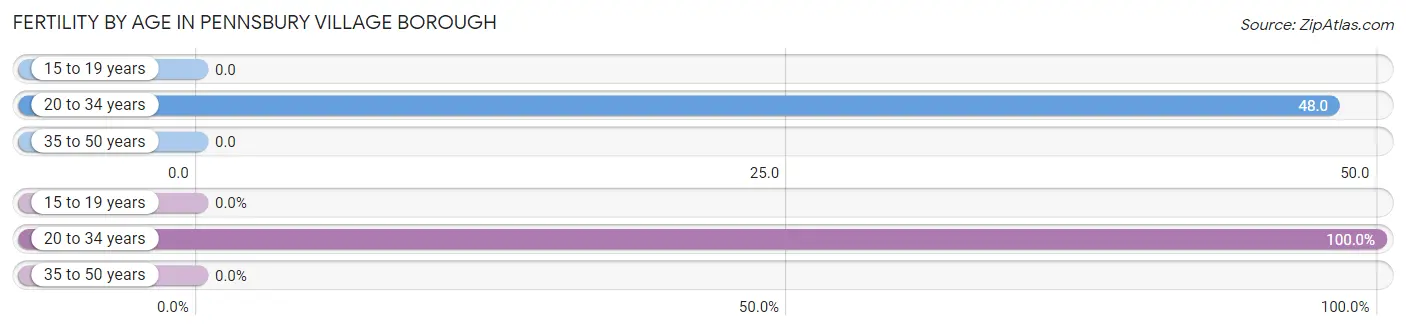
Fertility by Age in Pennsbury Village borough
Average fertility rate in Pennsbury Village borough is 27.0 births per 1,000 women. Women in the age bracket of 20 to 34 years have the highest fertility rate with 48.0 births per 1,000 women. Women in the age bracket of 20 to 34 years acount for 100.0% of all women with births.
| Age Bracket | Women with Births | Births / 1,000 Women |
| 15 to 19 years | 0 (0.0%) | 0.0 |
| 20 to 34 years | 5 (100.0%) | 48.0 |
| 35 to 50 years | 0 (0.0%) | 0.0 |
| Total | 5 (100.0%) | 27.0 |
Fertility by Age by Marriage Status in Pennsbury Village borough
60.0% of women with births (5) in Pennsbury Village borough are married. The highest percentage of unmarried women with births falls into 20 to 34 years age bracket with 40.0% of them unmarried at the time of birth, while the lowest percentage of unmarried women with births belong to 20 to 34 years age bracket with 40.0% of them unmarried.
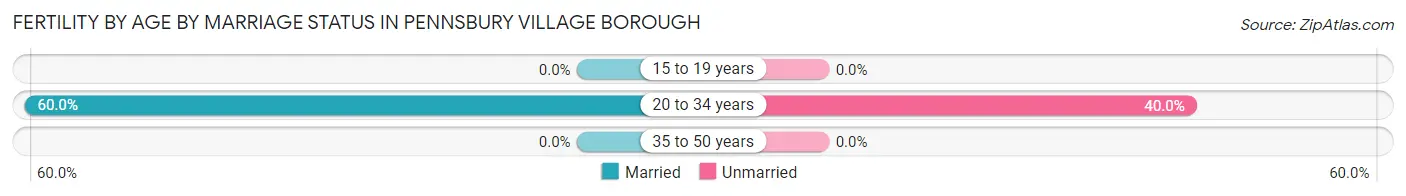
| Age Bracket | Married | Unmarried |
| 15 to 19 years | 0 (0.0%) | 0 (0.0%) |
| 20 to 34 years | 3 (60.0%) | 2 (40.0%) |
| 35 to 50 years | 0 (0.0%) | 0 (0.0%) |
| Total | 3 (60.0%) | 2 (40.0%) |
Fertility by Education in Pennsbury Village borough
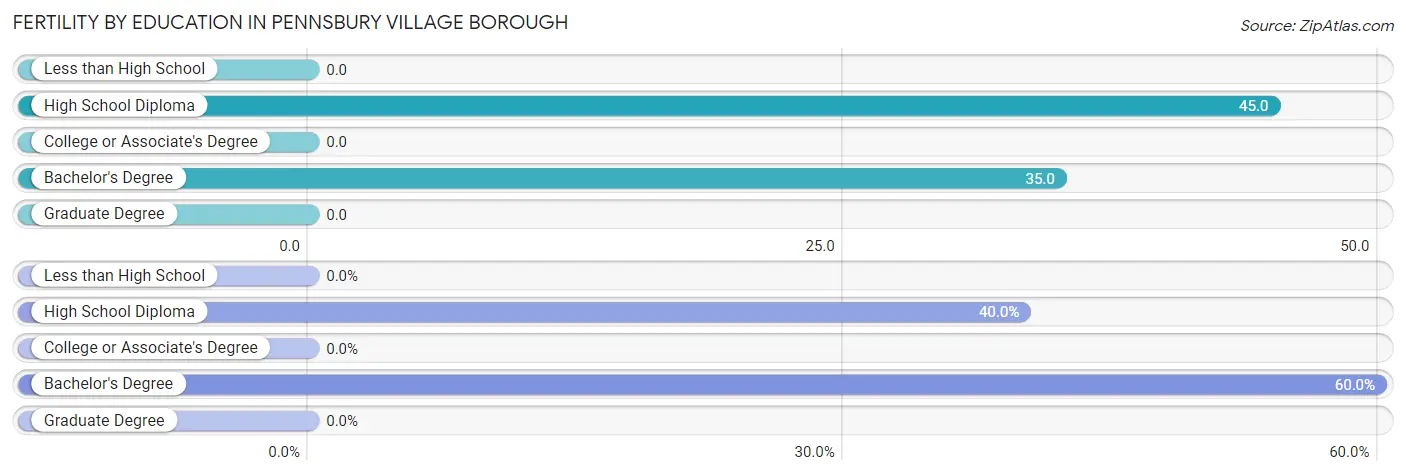
| Educational Attainment | Women with Births | Births / 1,000 Women |
| Less than High School | 0 (0.0%) | 0.0 |
| High School Diploma | 2 (40.0%) | 45.0 |
| College or Associate's Degree | 0 (0.0%) | 0.0 |
| Bachelor's Degree | 3 (60.0%) | 35.0 |
| Graduate Degree | 0 (0.0%) | 0.0 |
| Total | 5 (100.0%) | 27.0 |
Fertility by Education by Marriage Status in Pennsbury Village borough
40.0% of women with births in Pennsbury Village borough are unmarried. Women with the educational attainment of bachelor's degree are most likely to be married with 100.0% of them married at childbirth, while women with the educational attainment of high school diploma are least likely to be married with 100.0% of them unmarried at childbirth.
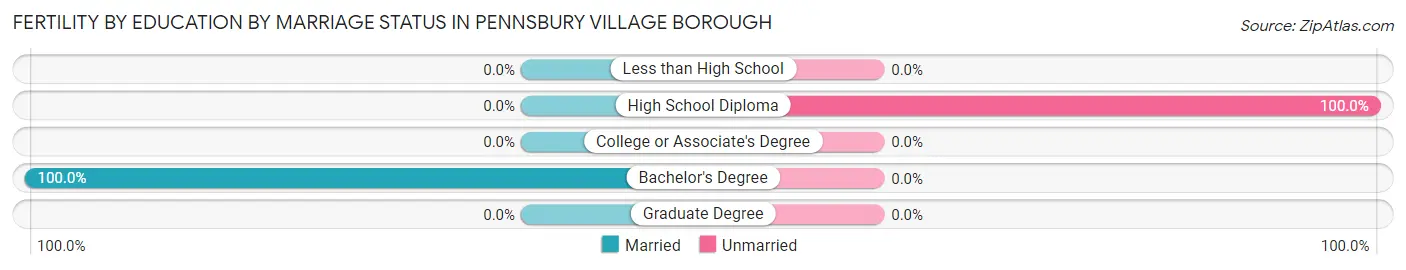
| Educational Attainment | Married | Unmarried |
| Less than High School | 0 (0.0%) | 0 (0.0%) |
| High School Diploma | 0 (0.0%) | 2 (100.0%) |
| College or Associate's Degree | 0 (0.0%) | 0 (0.0%) |
| Bachelor's Degree | 3 (100.0%) | 0 (0.0%) |
| Graduate Degree | 0 (0.0%) | 0 (0.0%) |
| Total | 3 (60.0%) | 2 (40.0%) |
Income in Pennsbury Village borough
Income Overview in Pennsbury Village borough
Per Capita Income in Pennsbury Village borough is $64,484, while median incomes of families and households are $109,500 and $70,179 respectively.
| Characteristic | Number | Measure |
| Per Capita Income | 633 | $64,484 |
| Median Family Income | 82 | $109,500 |
| Mean Family Income | 82 | $123,330 |
| Median Household Income | 459 | $70,179 |
| Mean Household Income | 459 | $89,061 |
| Income Deficit | 82 | $0 |
| Wage / Income Gap (%) | 633 | 4.38% |
| Wage / Income Gap ($) | 633 | 95.62¢ per $1 |
| Gini / Inequality Index | 633 | 0.40 |
Earnings by Sex in Pennsbury Village borough
Average Earnings in Pennsbury Village borough are $60,125, $61,875 for men and $59,167 for women, a difference of 4.4%.
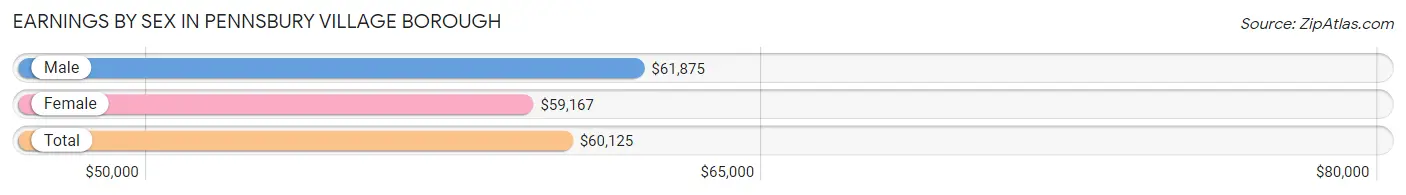
| Sex | Number | Average Earnings |
| Male | 211 (41.9%) | $61,875 |
| Female | 292 (58.1%) | $59,167 |
| Total | 503 (100.0%) | $60,125 |
Earnings by Sex by Income Bracket in Pennsbury Village borough
The most common earnings brackets in Pennsbury Village borough are $100,000+ for men (47 | 22.3%) and $75,000 to $99,999 for women (50 | 17.1%).
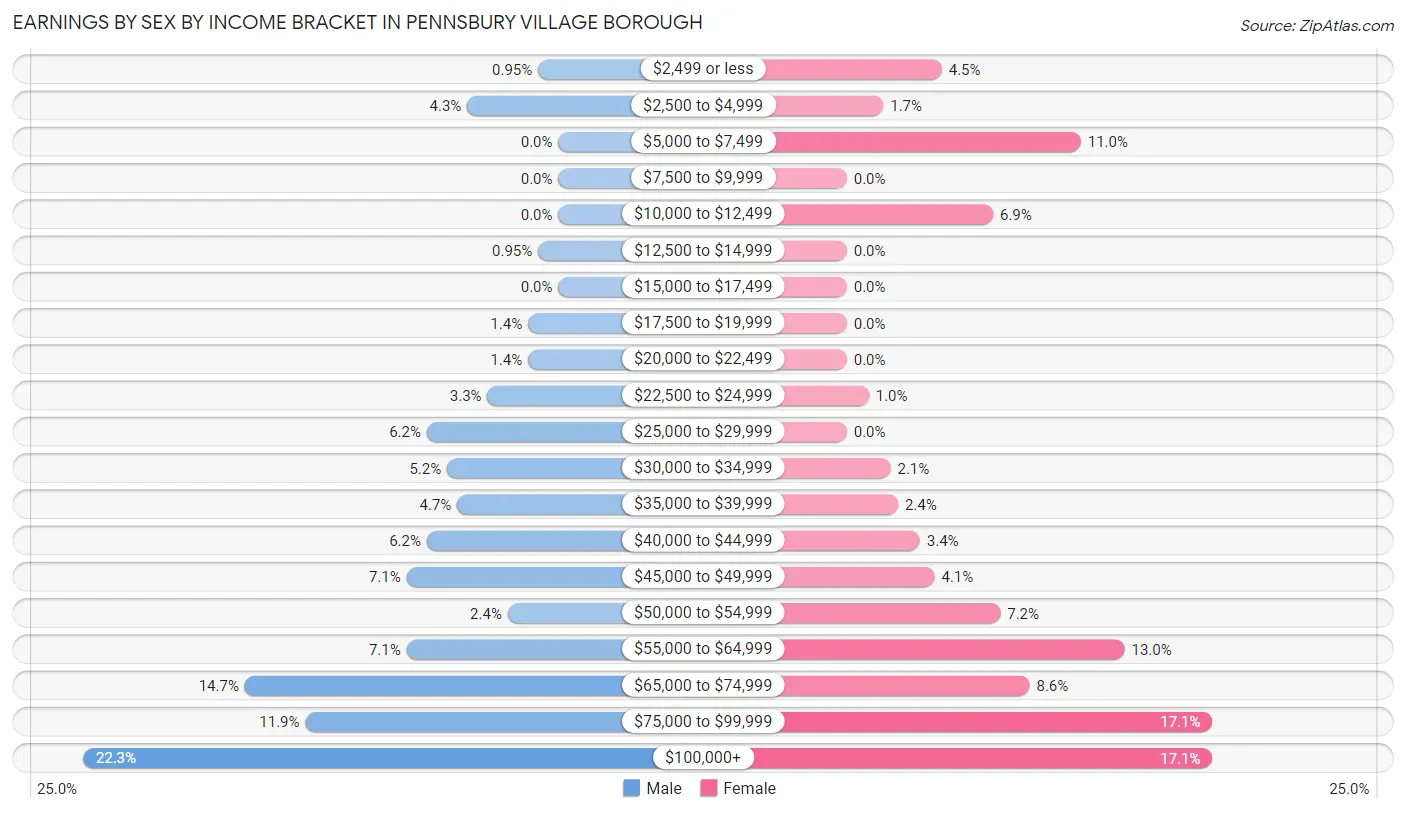
| Income | Male | Female |
| $2,499 or less | 2 (0.9%) | 13 (4.4%) |
| $2,500 to $4,999 | 9 (4.3%) | 5 (1.7%) |
| $5,000 to $7,499 | 0 (0.0%) | 32 (11.0%) |
| $7,500 to $9,999 | 0 (0.0%) | 0 (0.0%) |
| $10,000 to $12,499 | 0 (0.0%) | 20 (6.9%) |
| $12,500 to $14,999 | 2 (0.9%) | 0 (0.0%) |
| $15,000 to $17,499 | 0 (0.0%) | 0 (0.0%) |
| $17,500 to $19,999 | 3 (1.4%) | 0 (0.0%) |
| $20,000 to $22,499 | 3 (1.4%) | 0 (0.0%) |
| $22,500 to $24,999 | 7 (3.3%) | 3 (1.0%) |
| $25,000 to $29,999 | 13 (6.2%) | 0 (0.0%) |
| $30,000 to $34,999 | 11 (5.2%) | 6 (2.1%) |
| $35,000 to $39,999 | 10 (4.7%) | 7 (2.4%) |
| $40,000 to $44,999 | 13 (6.2%) | 10 (3.4%) |
| $45,000 to $49,999 | 15 (7.1%) | 12 (4.1%) |
| $50,000 to $54,999 | 5 (2.4%) | 21 (7.2%) |
| $55,000 to $64,999 | 15 (7.1%) | 38 (13.0%) |
| $65,000 to $74,999 | 31 (14.7%) | 25 (8.6%) |
| $75,000 to $99,999 | 25 (11.8%) | 50 (17.1%) |
| $100,000+ | 47 (22.3%) | 50 (17.1%) |
| Total | 211 (100.0%) | 292 (100.0%) |
Earnings by Sex by Educational Attainment in Pennsbury Village borough
Average earnings in Pennsbury Village borough are $67,583 for men and $64,196 for women, a difference of 5.0%. Men with an educational attainment of graduate degree enjoy the highest average annual earnings of $84,000, while those with bachelor's degree education earn the least with $51,500. Women with an educational attainment of graduate degree earn the most with the average annual earnings of $118,750, while those with high school diploma education have the smallest earnings of $58,250.
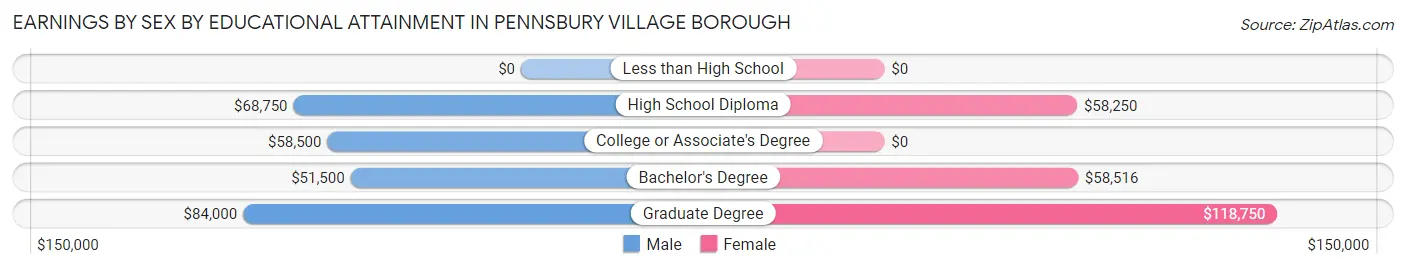
| Educational Attainment | Male Income | Female Income |
| Less than High School | - | - |
| High School Diploma | $68,750 | $58,250 |
| College or Associate's Degree | $58,500 | $0 |
| Bachelor's Degree | $51,500 | $58,516 |
| Graduate Degree | $84,000 | $118,750 |
| Total | $67,583 | $64,196 |
Family Income in Pennsbury Village borough
Family Income Brackets in Pennsbury Village borough
According to the Pennsbury Village borough family income data, there are 31 families falling into the $100,000 to $149,999 income range, which is the most common income bracket and makes up 37.8% of all families.
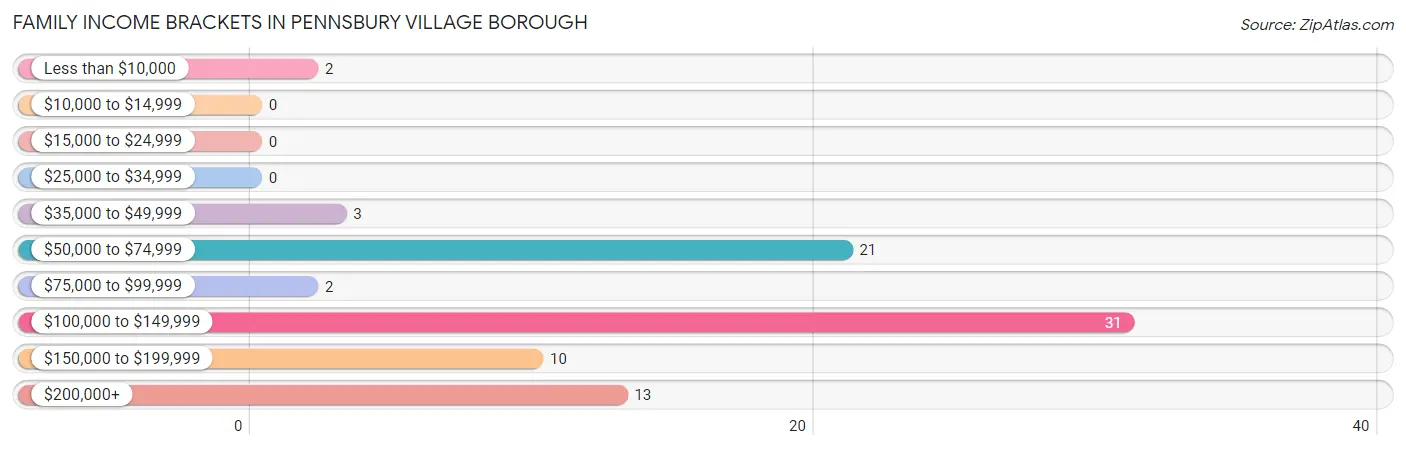
| Income Bracket | # Families | % Families |
| Less than $10,000 | 2 | 2.4% |
| $10,000 to $14,999 | 0 | 0.0% |
| $15,000 to $24,999 | 0 | 0.0% |
| $25,000 to $34,999 | 0 | 0.0% |
| $35,000 to $49,999 | 3 | 3.7% |
| $50,000 to $74,999 | 21 | 25.6% |
| $75,000 to $99,999 | 2 | 2.4% |
| $100,000 to $149,999 | 31 | 37.8% |
| $150,000 to $199,999 | 10 | 12.2% |
| $200,000+ | 13 | 15.9% |
Family Income by Famaliy Size in Pennsbury Village borough
3-person families (20 | 24.4%) account for the highest median family income in Pennsbury Village borough with $250,001 per family, while 3-person families (20 | 24.4%) have the highest median income of $83,334 per family member.
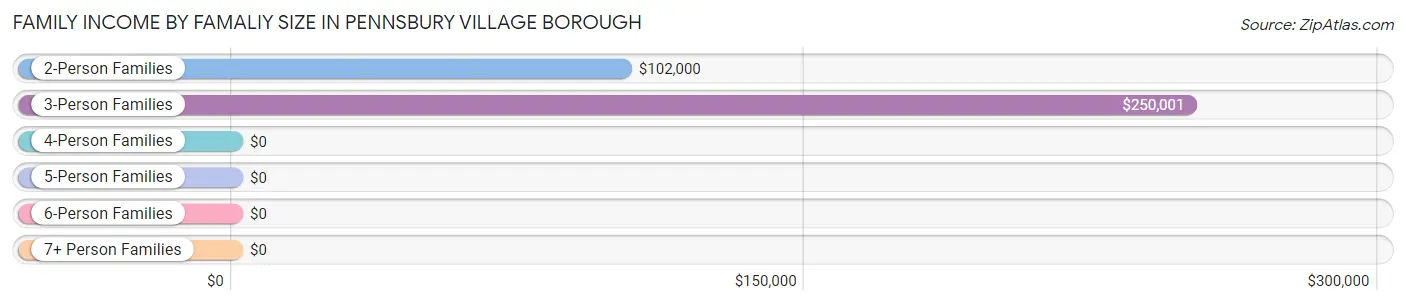
| Income Bracket | # Families | Median Income |
| 2-Person Families | 60 (73.2%) | $102,000 |
| 3-Person Families | 20 (24.4%) | $250,001 |
| 4-Person Families | 2 (2.4%) | $0 |
| 5-Person Families | 0 (0.0%) | $0 |
| 6-Person Families | 0 (0.0%) | $0 |
| 7+ Person Families | 0 (0.0%) | $0 |
| Total | 82 (100.0%) | $109,500 |
Family Income by Number of Earners in Pennsbury Village borough
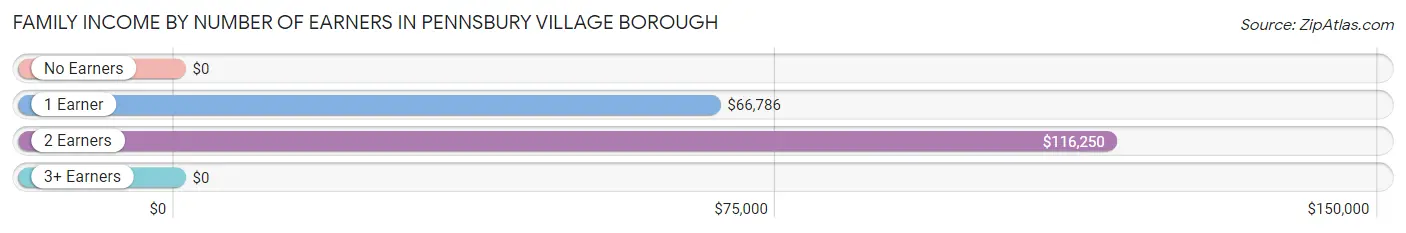
| Number of Earners | # Families | Median Income |
| No Earners | 4 (4.9%) | $0 |
| 1 Earner | 28 (34.2%) | $66,786 |
| 2 Earners | 45 (54.9%) | $116,250 |
| 3+ Earners | 5 (6.1%) | $0 |
| Total | 82 (100.0%) | $109,500 |
Household Income in Pennsbury Village borough
Household Income Brackets in Pennsbury Village borough
With 98 households falling in the category, the $50,000 to $74,999 income range is the most frequent in Pennsbury Village borough, accounting for 21.3% of all households. In contrast, only 17 households (3.7%) fall into the less than $10,000 income bracket, making it the least populous group.
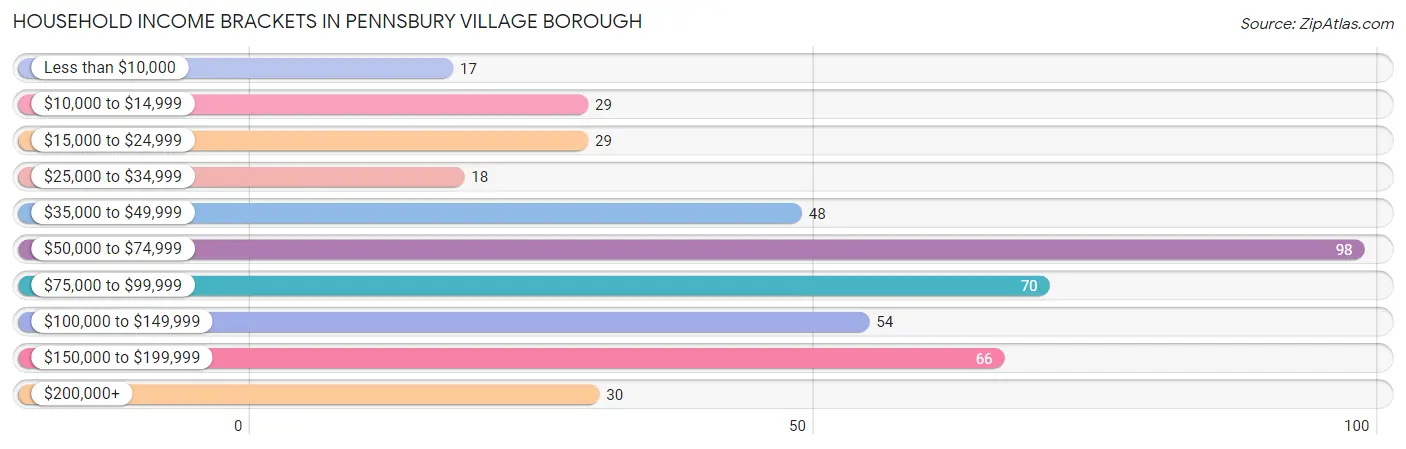
| Income Bracket | # Households | % Households |
| Less than $10,000 | 17 | 3.7% |
| $10,000 to $14,999 | 29 | 6.3% |
| $15,000 to $24,999 | 29 | 6.3% |
| $25,000 to $34,999 | 18 | 3.9% |
| $35,000 to $49,999 | 48 | 10.5% |
| $50,000 to $74,999 | 98 | 21.4% |
| $75,000 to $99,999 | 70 | 15.3% |
| $100,000 to $149,999 | 54 | 11.8% |
| $150,000 to $199,999 | 66 | 14.4% |
| $200,000+ | 30 | 6.5% |
Household Income by Householder Age in Pennsbury Village borough
The median household income in Pennsbury Village borough is $70,179, with the highest median household income of $100,000 found in the 25 to 44 years age bracket for the primary householder. A total of 166 households (36.2%) fall into this category. Meanwhile, the 15 to 24 years age bracket for the primary householder has the lowest median household income of $11,078, with 43 households (9.4%) in this group.
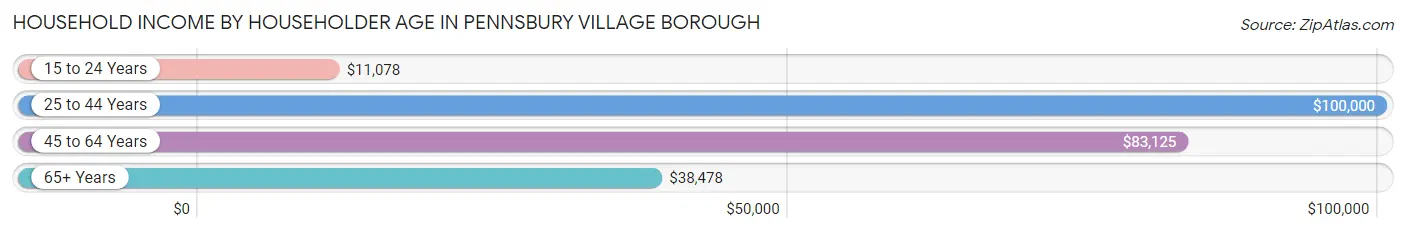
| Income Bracket | # Households | Median Income |
| 15 to 24 Years | 43 (9.4%) | $11,078 |
| 25 to 44 Years | 166 (36.2%) | $100,000 |
| 45 to 64 Years | 156 (34.0%) | $83,125 |
| 65+ Years | 94 (20.5%) | $38,478 |
| Total | 459 (100.0%) | $70,179 |
Poverty in Pennsbury Village borough
Income Below Poverty by Sex and Age in Pennsbury Village borough
With 9.2% poverty level for males and 10.5% for females among the residents of Pennsbury Village borough, 18 to 24 year old males and 18 to 24 year old females are the most vulnerable to poverty, with 14 males (82.4%) and 31 females (83.8%) in their respective age groups living below the poverty level.
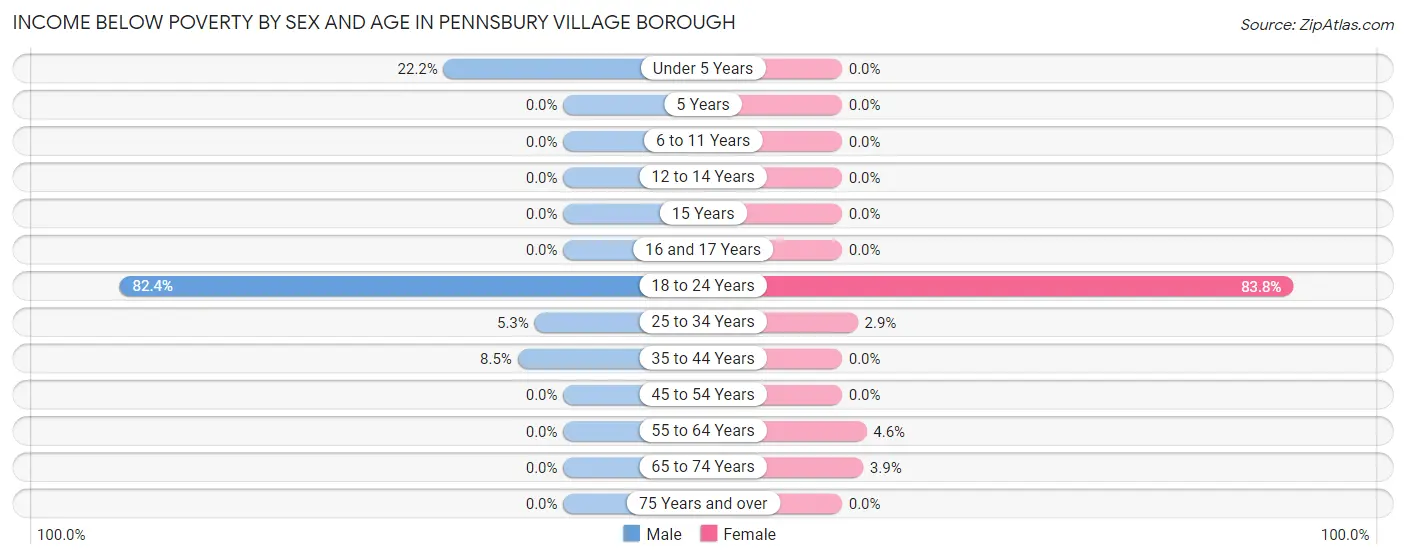
| Age Bracket | Male | Female |
| Under 5 Years | 2 (22.2%) | 0 (0.0%) |
| 5 Years | 0 (0.0%) | 0 (0.0%) |
| 6 to 11 Years | 0 (0.0%) | 0 (0.0%) |
| 12 to 14 Years | 0 (0.0%) | 0 (0.0%) |
| 15 Years | 0 (0.0%) | 0 (0.0%) |
| 16 and 17 Years | 0 (0.0%) | 0 (0.0%) |
| 18 to 24 Years | 14 (82.4%) | 31 (83.8%) |
| 25 to 34 Years | 4 (5.3%) | 2 (2.9%) |
| 35 to 44 Years | 5 (8.5%) | 0 (0.0%) |
| 45 to 54 Years | 0 (0.0%) | 0 (0.0%) |
| 55 to 64 Years | 0 (0.0%) | 3 (4.5%) |
| 65 to 74 Years | 0 (0.0%) | 2 (3.9%) |
| 75 Years and over | 0 (0.0%) | 0 (0.0%) |
| Total | 25 (9.2%) | 38 (10.5%) |
Income Above Poverty by Sex and Age in Pennsbury Village borough
According to the poverty statistics in Pennsbury Village borough, males aged 15 years and females aged 12 to 14 years are the age groups that are most secure financially, with 100.0% of males and 100.0% of females in these age groups living above the poverty line.
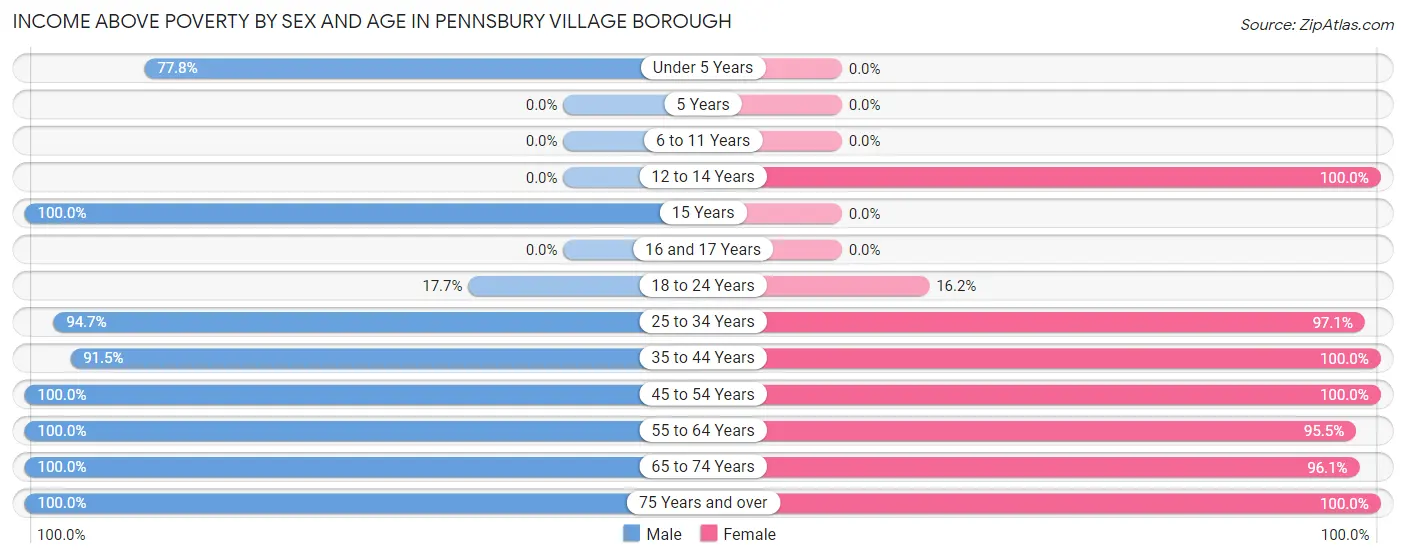
| Age Bracket | Male | Female |
| Under 5 Years | 7 (77.8%) | 0 (0.0%) |
| 5 Years | 0 (0.0%) | 0 (0.0%) |
| 6 to 11 Years | 0 (0.0%) | 0 (0.0%) |
| 12 to 14 Years | 0 (0.0%) | 11 (100.0%) |
| 15 Years | 11 (100.0%) | 0 (0.0%) |
| 16 and 17 Years | 0 (0.0%) | 0 (0.0%) |
| 18 to 24 Years | 3 (17.6%) | 6 (16.2%) |
| 25 to 34 Years | 71 (94.7%) | 66 (97.1%) |
| 35 to 44 Years | 54 (91.5%) | 48 (100.0%) |
| 45 to 54 Years | 24 (100.0%) | 49 (100.0%) |
| 55 to 64 Years | 51 (100.0%) | 63 (95.5%) |
| 65 to 74 Years | 17 (100.0%) | 49 (96.1%) |
| 75 Years and over | 8 (100.0%) | 32 (100.0%) |
| Total | 246 (90.8%) | 324 (89.5%) |
Income Below Poverty Among Married-Couple Families in Pennsbury Village borough
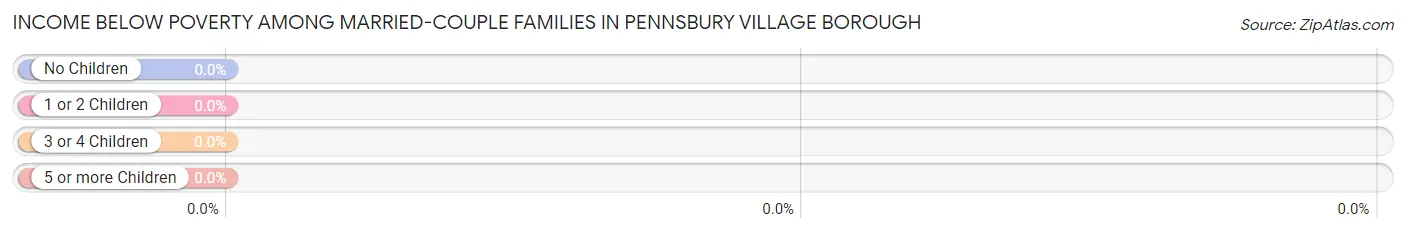
| Children | Above Poverty | Below Poverty |
| No Children | 39 (100.0%) | 0 (0.0%) |
| 1 or 2 Children | 15 (100.0%) | 0 (0.0%) |
| 3 or 4 Children | 0 (0.0%) | 0 (0.0%) |
| 5 or more Children | 0 (0.0%) | 0 (0.0%) |
| Total | 54 (100.0%) | 0 (0.0%) |
Income Below Poverty Among Single-Parent Households in Pennsbury Village borough
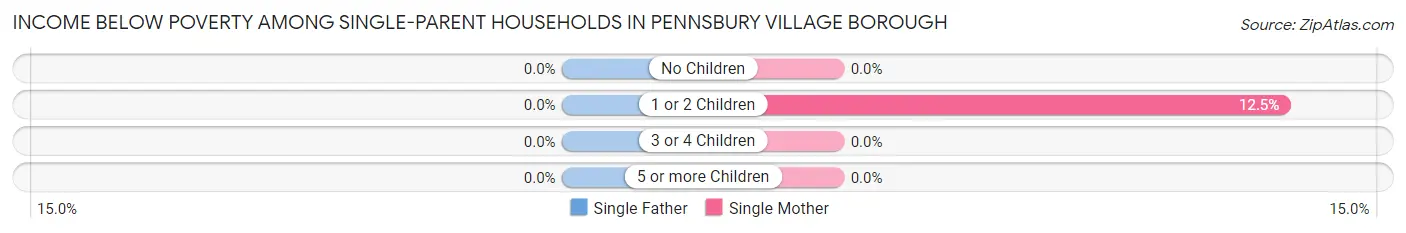
| Children | Single Father | Single Mother |
| No Children | 0 (0.0%) | 0 (0.0%) |
| 1 or 2 Children | 0 (0.0%) | 2 (12.5%) |
| 3 or 4 Children | 0 (0.0%) | 0 (0.0%) |
| 5 or more Children | 0 (0.0%) | 0 (0.0%) |
| Total | 0 (0.0%) | 2 (8.3%) |
Income Below Poverty Among Married-Couple vs Single-Parent Households in Pennsbury Village borough
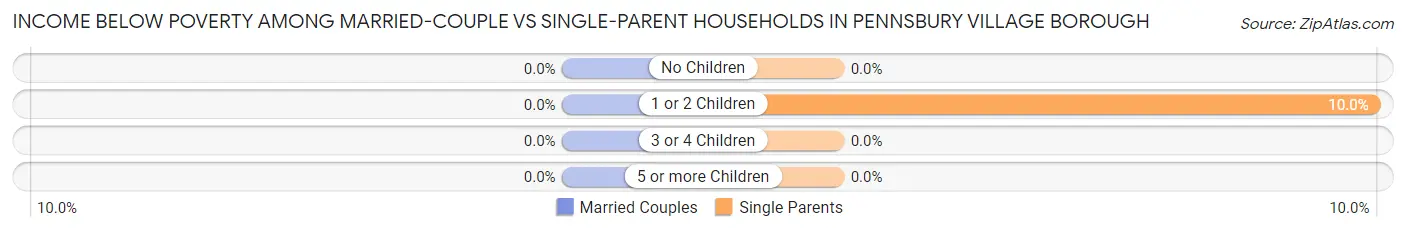
| Children | Married-Couple Families | Single-Parent Households |
| No Children | 0 (0.0%) | 0 (0.0%) |
| 1 or 2 Children | 0 (0.0%) | 2 (10.0%) |
| 3 or 4 Children | 0 (0.0%) | 0 (0.0%) |
| 5 or more Children | 0 (0.0%) | 0 (0.0%) |
| Total | 0 (0.0%) | 2 (7.1%) |
Employment Characteristics in Pennsbury Village borough
Employment by Class of Employer in Pennsbury Village borough
Among the 488 employed individuals in Pennsbury Village borough, private company employees (385 | 78.9%), not-for-profit organizations (69 | 14.1%), and state government employees (15 | 3.1%) make up the most common classes of employment.
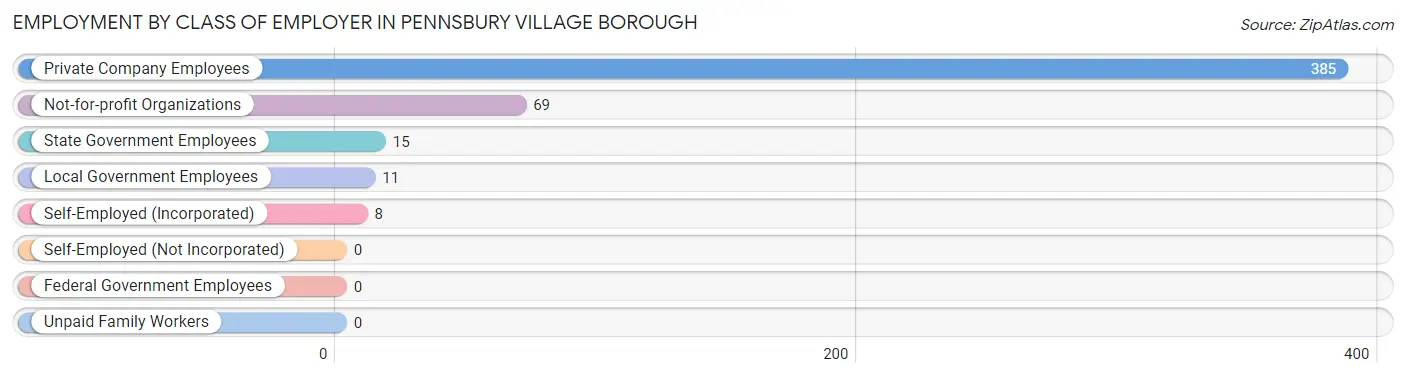
| Employer Class | # Employees | % Employees |
| Private Company Employees | 385 | 78.9% |
| Self-Employed (Incorporated) | 8 | 1.6% |
| Self-Employed (Not Incorporated) | 0 | 0.0% |
| Not-for-profit Organizations | 69 | 14.1% |
| Local Government Employees | 11 | 2.2% |
| State Government Employees | 15 | 3.1% |
| Federal Government Employees | 0 | 0.0% |
| Unpaid Family Workers | 0 | 0.0% |
| Total | 488 | 100.0% |
Employment Status by Age in Pennsbury Village borough
According to the labor force statistics for Pennsbury Village borough, out of the total population over 16 years of age (602), 82.4% or 496 individuals are in the labor force, with 1.6% or 8 of them unemployed. The age group with the highest labor force participation rate is 35 to 44 years, with 100.0% or 107 individuals in the labor force. Within the labor force, the 65 to 74 years age range has the highest percentage of unemployed individuals, with 8.6% or 3 of them being unemployed.
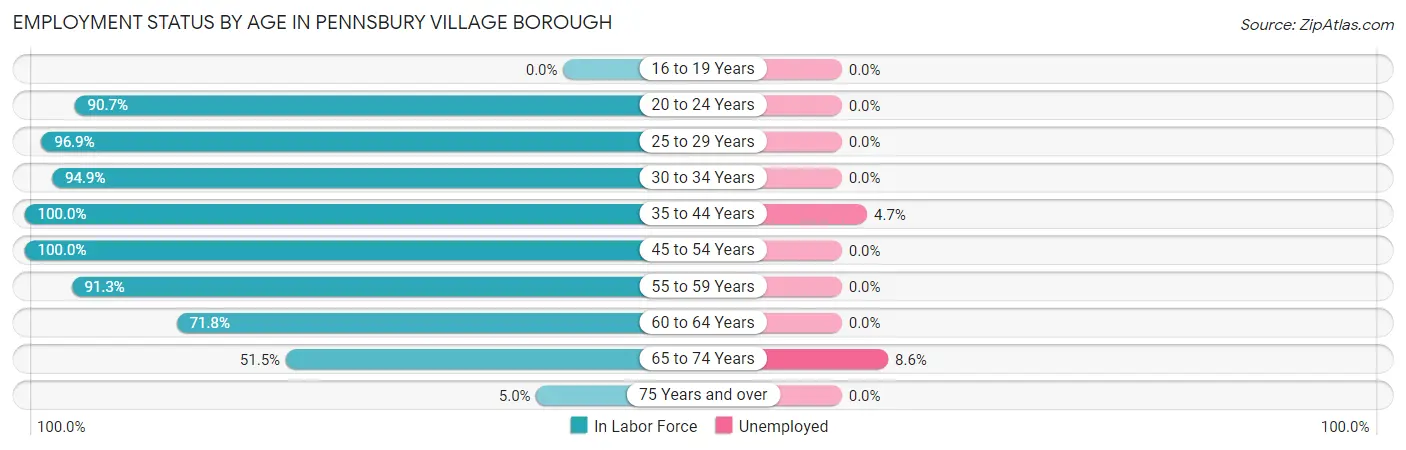
| Age Bracket | In Labor Force | Unemployed |
| 16 to 19 Years | 0 (0.0%) | 0 (0.0%) |
| 20 to 24 Years | 49 (90.7%) | 0 (0.0%) |
| 25 to 29 Years | 63 (96.9%) | 0 (0.0%) |
| 30 to 34 Years | 74 (94.9%) | 0 (0.0%) |
| 35 to 44 Years | 107 (100.0%) | 5 (4.7%) |
| 45 to 54 Years | 73 (100.0%) | 0 (0.0%) |
| 55 to 59 Years | 42 (91.3%) | 0 (0.0%) |
| 60 to 64 Years | 51 (71.8%) | 0 (0.0%) |
| 65 to 74 Years | 35 (51.5%) | 3 (8.6%) |
| 75 Years and over | 2 (5.0%) | 0 (0.0%) |
| Total | 496 (82.4%) | 8 (1.6%) |
Employment Status by Educational Attainment in Pennsbury Village borough
According to labor force statistics for Pennsbury Village borough, 93.2% of individuals (410) out of the total population between 25 and 64 years of age (440) are in the labor force, with 1.2% or 5 of them being unemployed. The group with the highest labor force participation rate are those with the educational attainment of bachelor's degree or higher, with 97.0% or 292 individuals in the labor force. Within the labor force, individuals with high school diploma education have the highest percentage of unemployment, with 3.5% or 2 of them being unemployed.
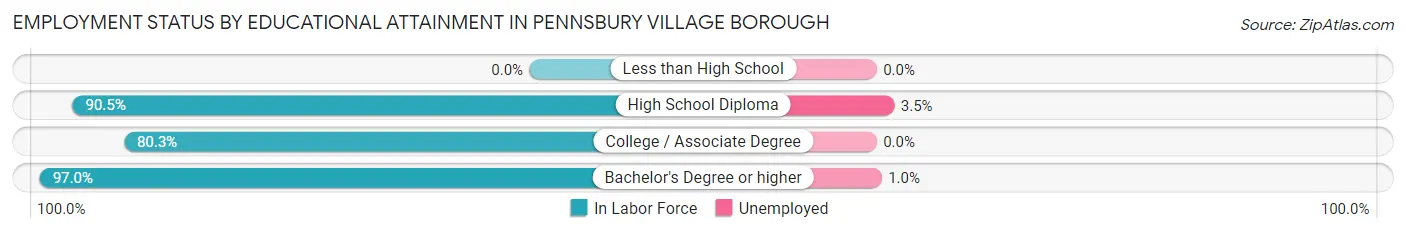
| Educational Attainment | In Labor Force | Unemployed |
| Less than High School | 0 (0.0%) | 0 (0.0%) |
| High School Diploma | 57 (90.5%) | 2 (3.5%) |
| College / Associate Degree | 61 (80.3%) | 0 (0.0%) |
| Bachelor's Degree or higher | 292 (97.0%) | 3 (1.0%) |
| Total | 410 (93.2%) | 5 (1.2%) |
Employment Occupations by Sex in Pennsbury Village borough
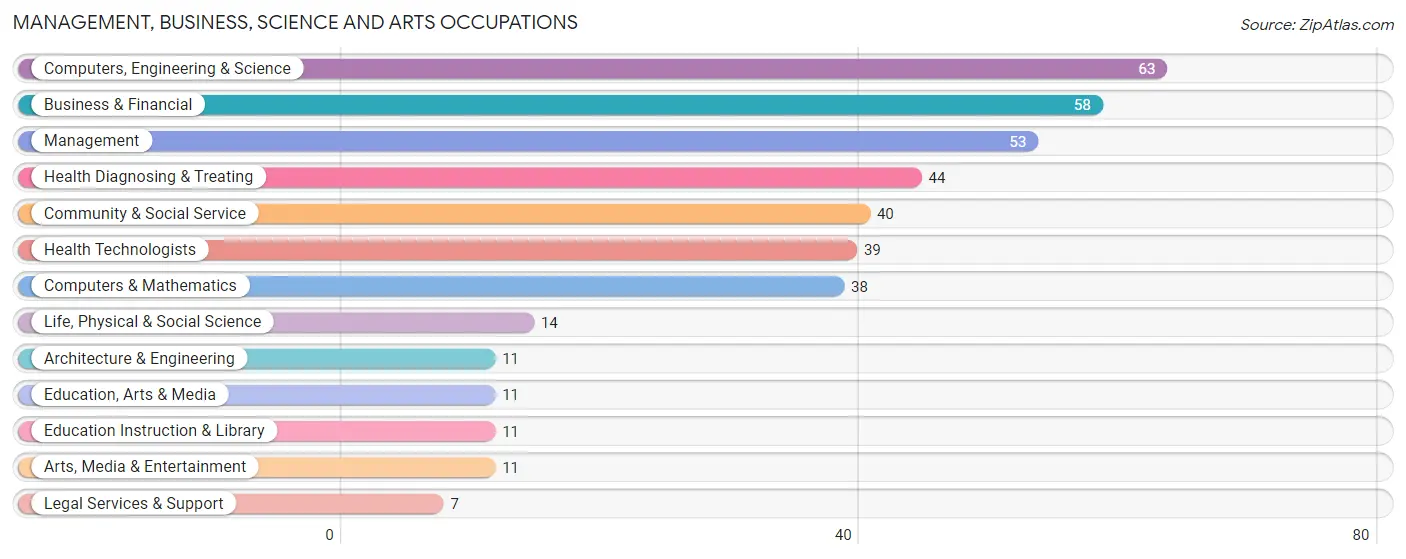
Management, Business, Science and Arts Occupations
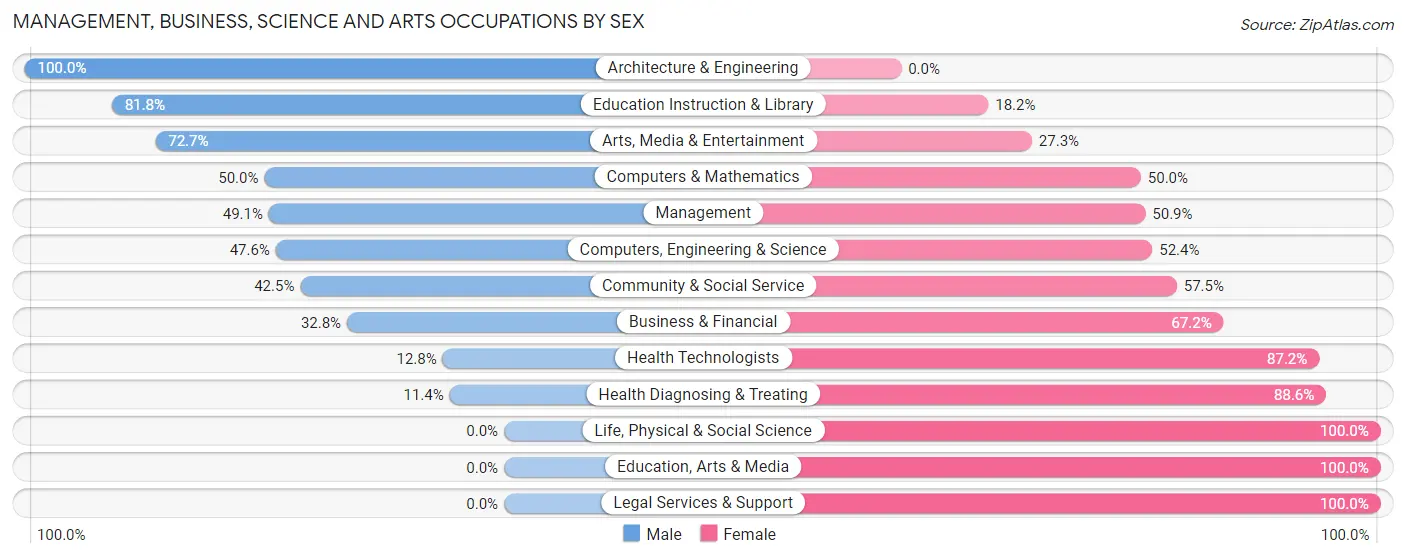
The most common Management, Business, Science and Arts occupations in Pennsbury Village borough are Computers, Engineering & Science (63 | 12.9%), Business & Financial (58 | 11.9%), Management (53 | 10.9%), Health Diagnosing & Treating (44 | 9.0%), and Community & Social Service (40 | 8.2%).
Management, Business, Science and Arts Occupations by Sex
Within the Management, Business, Science and Arts occupations in Pennsbury Village borough, the most male-oriented occupations are Architecture & Engineering (100.0%), Education Instruction & Library (81.8%), and Arts, Media & Entertainment (72.7%), while the most female-oriented occupations are Life, Physical & Social Science (100.0%), Education, Arts & Media (100.0%), and Legal Services & Support (100.0%).
| Occupation | Male | Female |
| Management | 26 (49.1%) | 27 (50.9%) |
| Business & Financial | 19 (32.8%) | 39 (67.2%) |
| Computers, Engineering & Science | 30 (47.6%) | 33 (52.4%) |
| Computers & Mathematics | 19 (50.0%) | 19 (50.0%) |
| Architecture & Engineering | 11 (100.0%) | 0 (0.0%) |
| Life, Physical & Social Science | 0 (0.0%) | 14 (100.0%) |
| Community & Social Service | 17 (42.5%) | 23 (57.5%) |
| Education, Arts & Media | 0 (0.0%) | 11 (100.0%) |
| Legal Services & Support | 0 (0.0%) | 7 (100.0%) |
| Education Instruction & Library | 9 (81.8%) | 2 (18.2%) |
| Arts, Media & Entertainment | 8 (72.7%) | 3 (27.3%) |
| Health Diagnosing & Treating | 5 (11.4%) | 39 (88.6%) |
| Health Technologists | 5 (12.8%) | 34 (87.2%) |
| Total (Category) | 97 (37.6%) | 161 (62.4%) |
| Total (Overall) | 206 (42.2%) | 282 (57.8%) |
Services Occupations
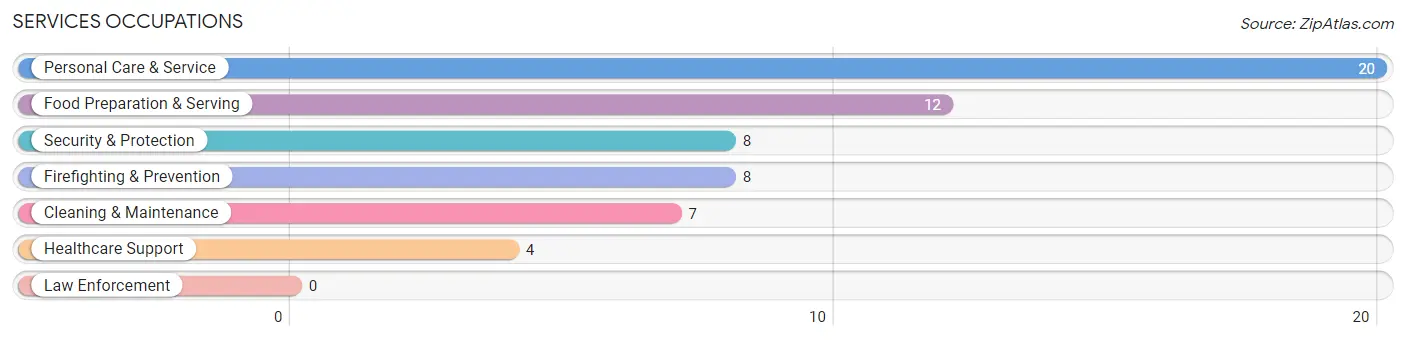
The most common Services occupations in Pennsbury Village borough are Personal Care & Service (20 | 4.1%), Food Preparation & Serving (12 | 2.5%), Security & Protection (8 | 1.6%), Firefighting & Prevention (8 | 1.6%), and Cleaning & Maintenance (7 | 1.4%).
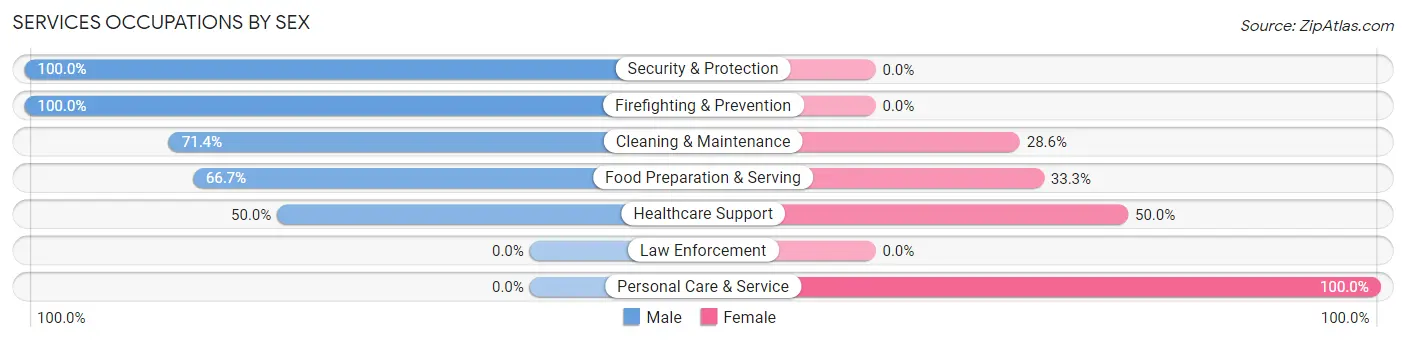
Services Occupations by Sex
Within the Services occupations in Pennsbury Village borough, the most male-oriented occupations are Security & Protection (100.0%), Firefighting & Prevention (100.0%), and Cleaning & Maintenance (71.4%), while the most female-oriented occupations are Personal Care & Service (100.0%), Healthcare Support (50.0%), and Food Preparation & Serving (33.3%).
| Occupation | Male | Female |
| Healthcare Support | 2 (50.0%) | 2 (50.0%) |
| Security & Protection | 8 (100.0%) | 0 (0.0%) |
| Firefighting & Prevention | 8 (100.0%) | 0 (0.0%) |
| Law Enforcement | 0 (0.0%) | 0 (0.0%) |
| Food Preparation & Serving | 8 (66.7%) | 4 (33.3%) |
| Cleaning & Maintenance | 5 (71.4%) | 2 (28.6%) |
| Personal Care & Service | 0 (0.0%) | 20 (100.0%) |
| Total (Category) | 23 (45.1%) | 28 (54.9%) |
| Total (Overall) | 206 (42.2%) | 282 (57.8%) |
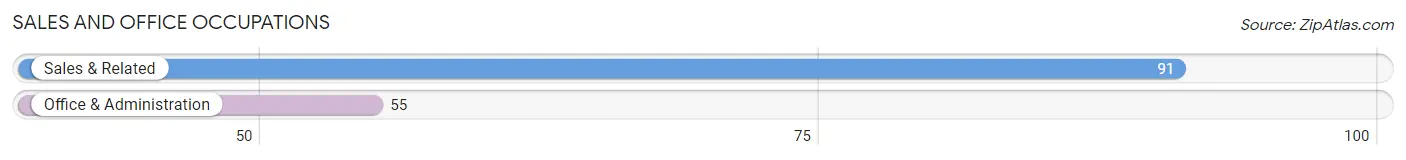
Sales and Office Occupations
The most common Sales and Office occupations in Pennsbury Village borough are Sales & Related (91 | 18.6%), and Office & Administration (55 | 11.3%).
Sales and Office Occupations by Sex
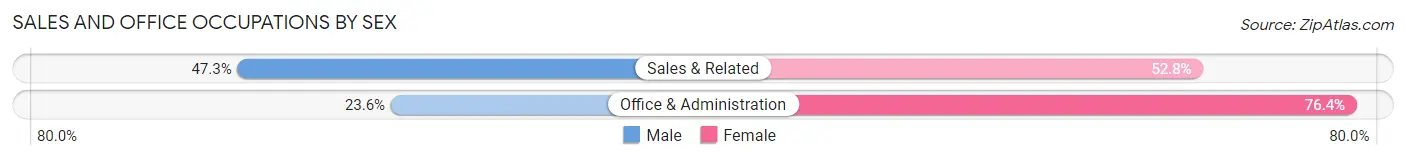
| Occupation | Male | Female |
| Sales & Related | 43 (47.2%) | 48 (52.7%) |
| Office & Administration | 13 (23.6%) | 42 (76.4%) |
| Total (Category) | 56 (38.4%) | 90 (61.6%) |
| Total (Overall) | 206 (42.2%) | 282 (57.8%) |
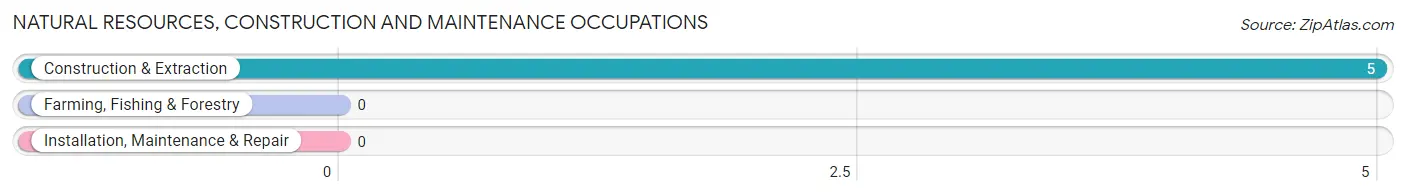
Natural Resources, Construction and Maintenance Occupations
The most common Natural Resources, Construction and Maintenance occupations in Pennsbury Village borough are , and Construction & Extraction (5 | 1.0%).
Natural Resources, Construction and Maintenance Occupations by Sex
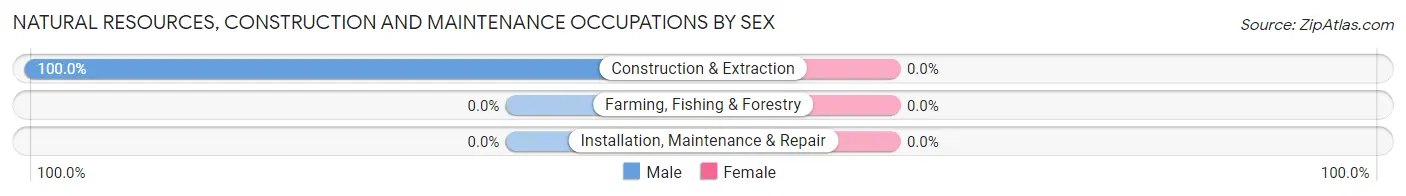
| Occupation | Male | Female |
| Farming, Fishing & Forestry | 0 (0.0%) | 0 (0.0%) |
| Construction & Extraction | 5 (100.0%) | 0 (0.0%) |
| Installation, Maintenance & Repair | 0 (0.0%) | 0 (0.0%) |
| Total (Category) | 5 (100.0%) | 0 (0.0%) |
| Total (Overall) | 206 (42.2%) | 282 (57.8%) |
Production, Transportation and Moving Occupations
The most common Production, Transportation and Moving occupations in Pennsbury Village borough are Transportation (14 | 2.9%), Material Moving (10 | 2.1%), and Production (4 | 0.8%).
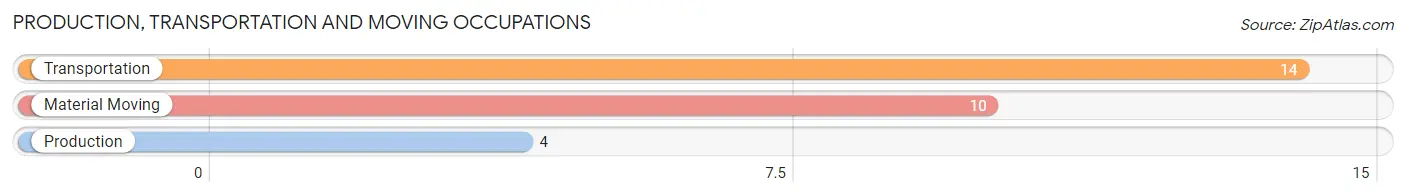
Production, Transportation and Moving Occupations by Sex
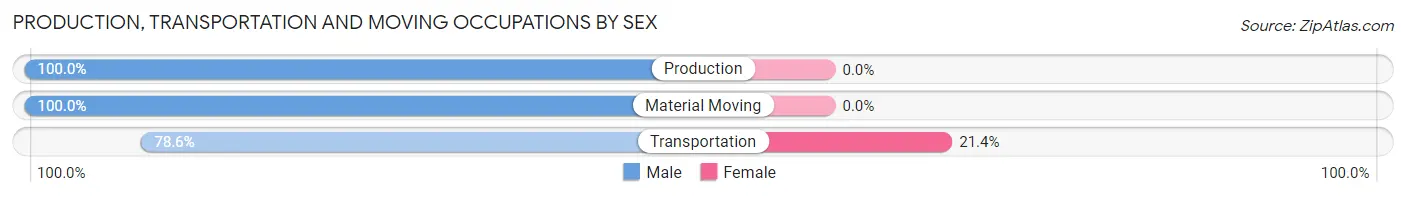
| Occupation | Male | Female |
| Production | 4 (100.0%) | 0 (0.0%) |
| Transportation | 11 (78.6%) | 3 (21.4%) |
| Material Moving | 10 (100.0%) | 0 (0.0%) |
| Total (Category) | 25 (89.3%) | 3 (10.7%) |
| Total (Overall) | 206 (42.2%) | 282 (57.8%) |
Employment Industries by Sex in Pennsbury Village borough
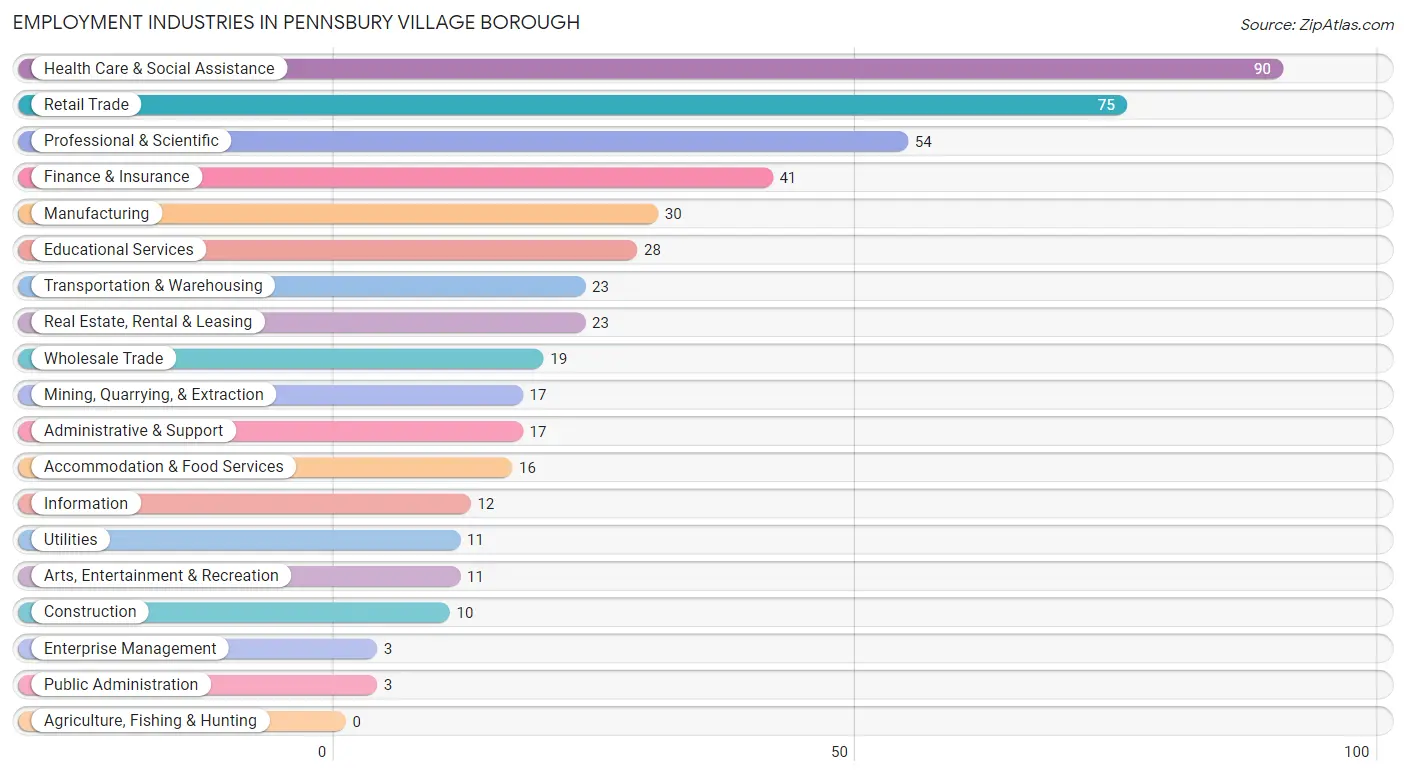
Employment Industries in Pennsbury Village borough
The major employment industries in Pennsbury Village borough include Health Care & Social Assistance (90 | 18.4%), Retail Trade (75 | 15.4%), Professional & Scientific (54 | 11.1%), Finance & Insurance (41 | 8.4%), and Manufacturing (30 | 6.1%).
Employment Industries by Sex in Pennsbury Village borough
The Pennsbury Village borough industries that see more men than women are Construction (100.0%), Enterprise Management (100.0%), and Arts, Entertainment & Recreation (100.0%), whereas the industries that tend to have a higher number of women are Mining, Quarrying, & Extraction (100.0%), Real Estate, Rental & Leasing (100.0%), and Public Administration (100.0%).
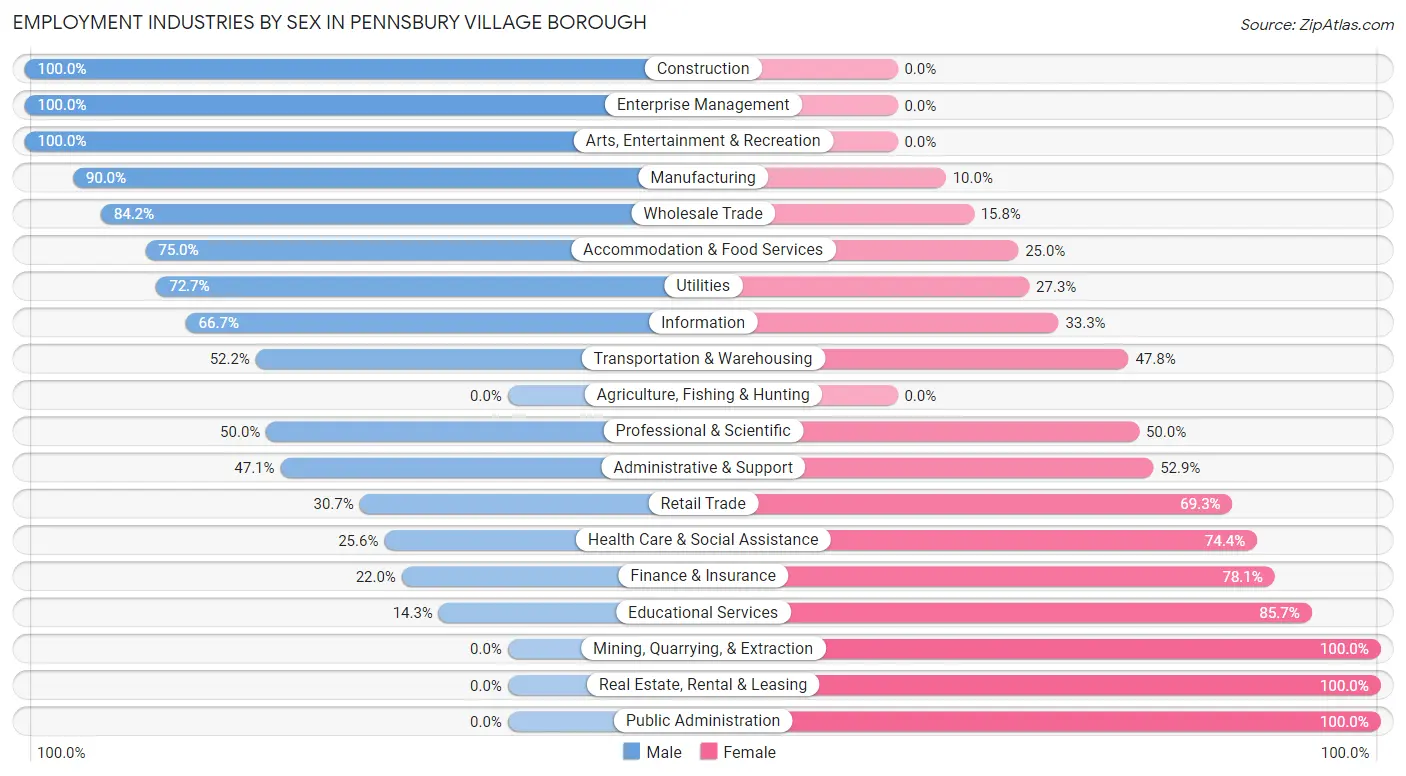
| Industry | Male | Female |
| Agriculture, Fishing & Hunting | 0 (0.0%) | 0 (0.0%) |
| Mining, Quarrying, & Extraction | 0 (0.0%) | 17 (100.0%) |
| Construction | 10 (100.0%) | 0 (0.0%) |
| Manufacturing | 27 (90.0%) | 3 (10.0%) |
| Wholesale Trade | 16 (84.2%) | 3 (15.8%) |
| Retail Trade | 23 (30.7%) | 52 (69.3%) |
| Transportation & Warehousing | 12 (52.2%) | 11 (47.8%) |
| Utilities | 8 (72.7%) | 3 (27.3%) |
| Information | 8 (66.7%) | 4 (33.3%) |
| Finance & Insurance | 9 (22.0%) | 32 (78.0%) |
| Real Estate, Rental & Leasing | 0 (0.0%) | 23 (100.0%) |
| Professional & Scientific | 27 (50.0%) | 27 (50.0%) |
| Enterprise Management | 3 (100.0%) | 0 (0.0%) |
| Administrative & Support | 8 (47.1%) | 9 (52.9%) |
| Educational Services | 4 (14.3%) | 24 (85.7%) |
| Health Care & Social Assistance | 23 (25.6%) | 67 (74.4%) |
| Arts, Entertainment & Recreation | 11 (100.0%) | 0 (0.0%) |
| Accommodation & Food Services | 12 (75.0%) | 4 (25.0%) |
| Public Administration | 0 (0.0%) | 3 (100.0%) |
| Total | 206 (42.2%) | 282 (57.8%) |
Education in Pennsbury Village borough
School Enrollment in Pennsbury Village borough
The most common levels of schooling among the 67 students in Pennsbury Village borough are college / undergraduate (41 | 61.2%), middle school (11 | 16.4%), and high school (11 | 16.4%).
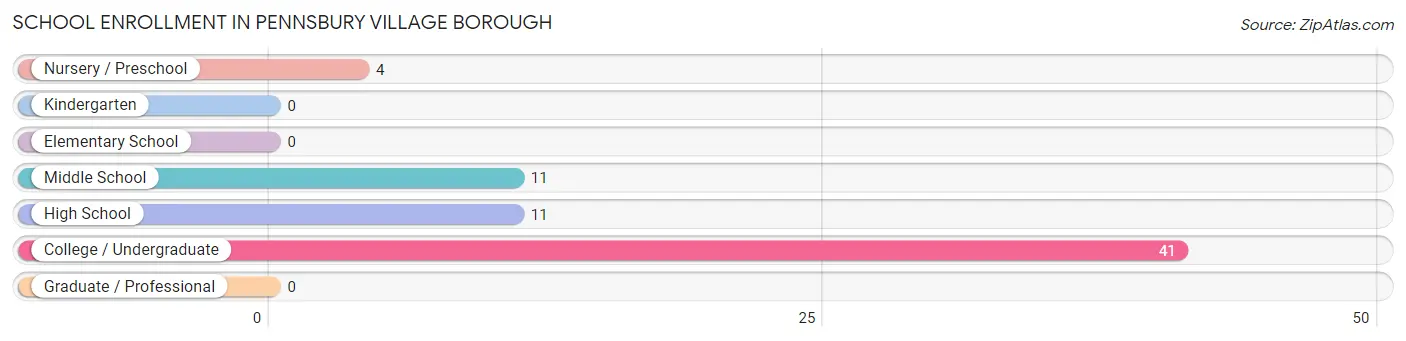
| School Level | # Students | % Students |
| Nursery / Preschool | 4 | 6.0% |
| Kindergarten | 0 | 0.0% |
| Elementary School | 0 | 0.0% |
| Middle School | 11 | 16.4% |
| High School | 11 | 16.4% |
| College / Undergraduate | 41 | 61.2% |
| Graduate / Professional | 0 | 0.0% |
| Total | 67 | 100.0% |
School Enrollment by Age by Funding Source in Pennsbury Village borough
Out of a total of 67 students who are enrolled in schools in Pennsbury Village borough, 20 (29.9%) attend a private institution, while the remaining 47 (70.1%) are enrolled in public schools. The age group of 3 to 4 year olds has the highest likelihood of being enrolled in private schools, with 4 (100.0% in the age bracket) enrolled. Conversely, the age group of 10 to 14 year olds has the lowest likelihood of being enrolled in a private school, with 11 (100.0% in the age bracket) attending a public institution.
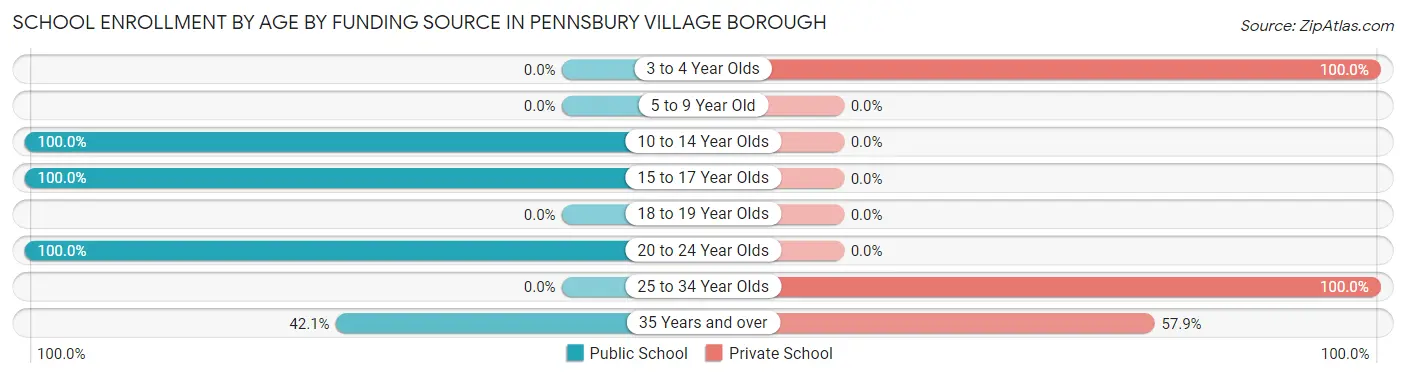
| Age Bracket | Public School | Private School |
| 3 to 4 Year Olds | 0 (0.0%) | 4 (100.0%) |
| 5 to 9 Year Old | 0 (0.0%) | 0 (0.0%) |
| 10 to 14 Year Olds | 11 (100.0%) | 0 (0.0%) |
| 15 to 17 Year Olds | 11 (100.0%) | 0 (0.0%) |
| 18 to 19 Year Olds | 0 (0.0%) | 0 (0.0%) |
| 20 to 24 Year Olds | 17 (100.0%) | 0 (0.0%) |
| 25 to 34 Year Olds | 0 (0.0%) | 5 (100.0%) |
| 35 Years and over | 8 (42.1%) | 11 (57.9%) |
| Total | 47 (70.1%) | 20 (29.9%) |
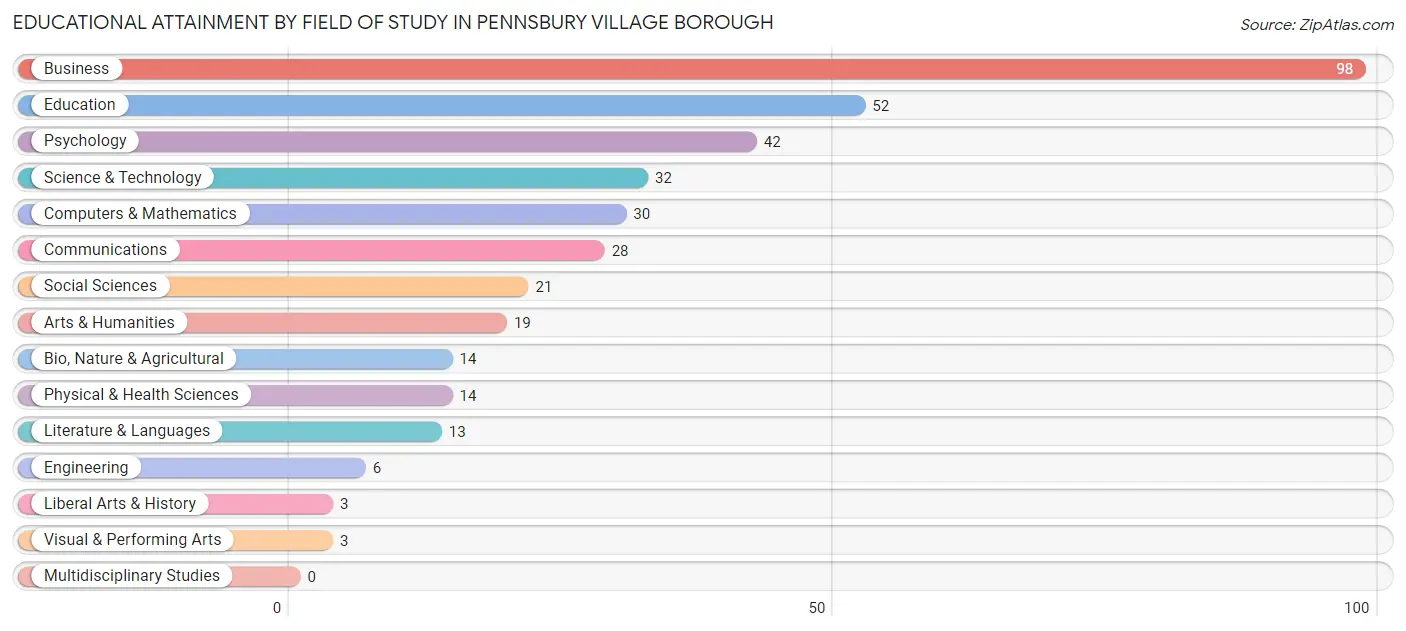
Educational Attainment by Field of Study in Pennsbury Village borough
Business (98 | 26.1%), education (52 | 13.9%), psychology (42 | 11.2%), science & technology (32 | 8.5%), and computers & mathematics (30 | 8.0%) are the most common fields of study among 375 individuals in Pennsbury Village borough who have obtained a bachelor's degree or higher.
| Field of Study | # Graduates | % Graduates |
| Computers & Mathematics | 30 | 8.0% |
| Bio, Nature & Agricultural | 14 | 3.7% |
| Physical & Health Sciences | 14 | 3.7% |
| Psychology | 42 | 11.2% |
| Social Sciences | 21 | 5.6% |
| Engineering | 6 | 1.6% |
| Multidisciplinary Studies | 0 | 0.0% |
| Science & Technology | 32 | 8.5% |
| Business | 98 | 26.1% |
| Education | 52 | 13.9% |
| Literature & Languages | 13 | 3.5% |
| Liberal Arts & History | 3 | 0.8% |
| Visual & Performing Arts | 3 | 0.8% |
| Communications | 28 | 7.5% |
| Arts & Humanities | 19 | 5.1% |
| Total | 375 | 100.0% |
Transportation & Commute in Pennsbury Village borough
Vehicle Availability by Sex in Pennsbury Village borough
The most prevalent vehicle ownership categories in Pennsbury Village borough are males with 1 vehicle (99, accounting for 48.1%) and females with 1 vehicle (195, making up 35.1%).
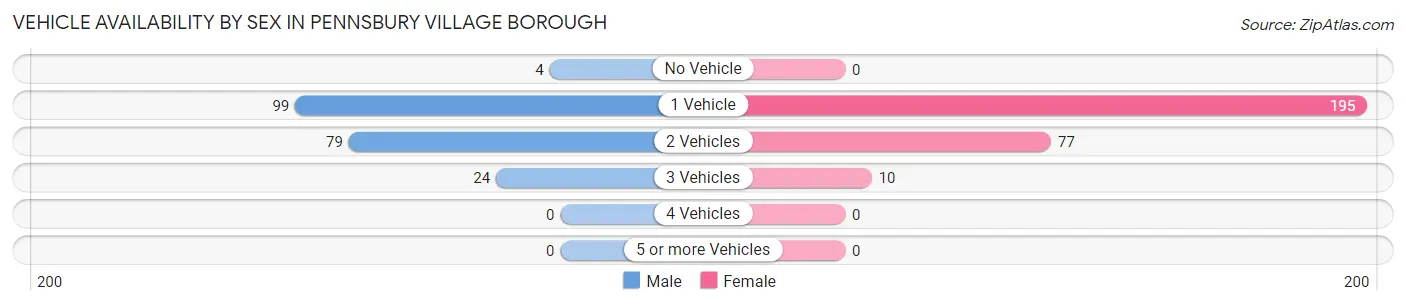
| Vehicles Available | Male | Female |
| No Vehicle | 4 (1.9%) | 0 (0.0%) |
| 1 Vehicle | 99 (48.1%) | 195 (69.2%) |
| 2 Vehicles | 79 (38.4%) | 77 (27.3%) |
| 3 Vehicles | 24 (11.7%) | 10 (3.5%) |
| 4 Vehicles | 0 (0.0%) | 0 (0.0%) |
| 5 or more Vehicles | 0 (0.0%) | 0 (0.0%) |
| Total | 206 (100.0%) | 282 (100.0%) |
Commute Time in Pennsbury Village borough
The most frequently occuring commute durations in Pennsbury Village borough are 20 to 24 minutes (109 commuters, 27.0%), 10 to 14 minutes (79 commuters, 19.6%), and 30 to 34 minutes (62 commuters, 15.3%).
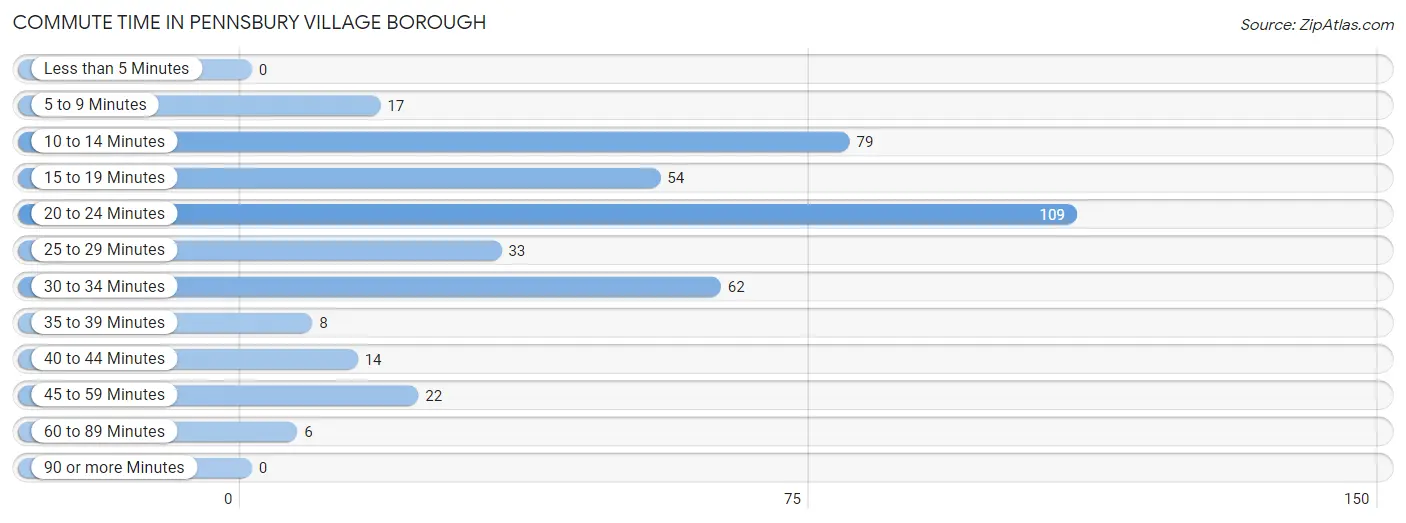
| Commute Time | # Commuters | % Commuters |
| Less than 5 Minutes | 0 | 0.0% |
| 5 to 9 Minutes | 17 | 4.2% |
| 10 to 14 Minutes | 79 | 19.6% |
| 15 to 19 Minutes | 54 | 13.4% |
| 20 to 24 Minutes | 109 | 27.0% |
| 25 to 29 Minutes | 33 | 8.2% |
| 30 to 34 Minutes | 62 | 15.3% |
| 35 to 39 Minutes | 8 | 2.0% |
| 40 to 44 Minutes | 14 | 3.5% |
| 45 to 59 Minutes | 22 | 5.4% |
| 60 to 89 Minutes | 6 | 1.5% |
| 90 or more Minutes | 0 | 0.0% |
Commute Time by Sex in Pennsbury Village borough
The most common commute times in Pennsbury Village borough are 20 to 24 minutes (48 commuters, 27.6%) for males and 20 to 24 minutes (61 commuters, 26.5%) for females.
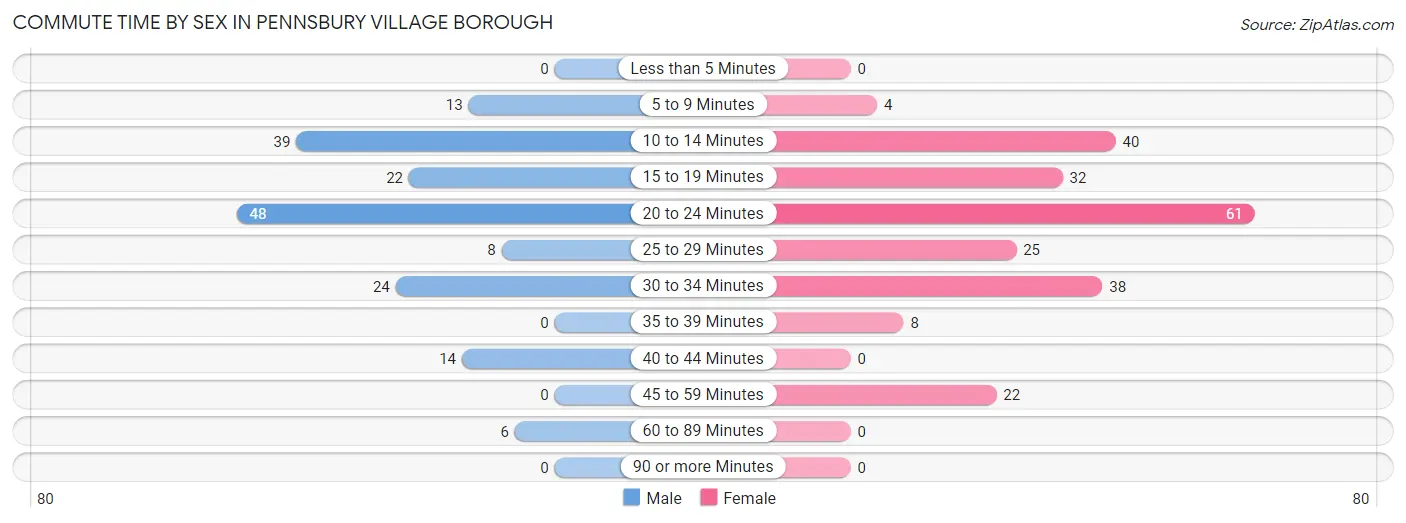
| Commute Time | Male | Female |
| Less than 5 Minutes | 0 (0.0%) | 0 (0.0%) |
| 5 to 9 Minutes | 13 (7.5%) | 4 (1.7%) |
| 10 to 14 Minutes | 39 (22.4%) | 40 (17.4%) |
| 15 to 19 Minutes | 22 (12.6%) | 32 (13.9%) |
| 20 to 24 Minutes | 48 (27.6%) | 61 (26.5%) |
| 25 to 29 Minutes | 8 (4.6%) | 25 (10.9%) |
| 30 to 34 Minutes | 24 (13.8%) | 38 (16.5%) |
| 35 to 39 Minutes | 0 (0.0%) | 8 (3.5%) |
| 40 to 44 Minutes | 14 (8.1%) | 0 (0.0%) |
| 45 to 59 Minutes | 0 (0.0%) | 22 (9.6%) |
| 60 to 89 Minutes | 6 (3.5%) | 0 (0.0%) |
| 90 or more Minutes | 0 (0.0%) | 0 (0.0%) |
Time of Departure to Work by Sex in Pennsbury Village borough
The most frequent times of departure to work in Pennsbury Village borough are 12:00 PM to 3:59 PM (35, 20.1%) for males and 6:00 AM to 6:29 AM (39, 17.0%) for females.
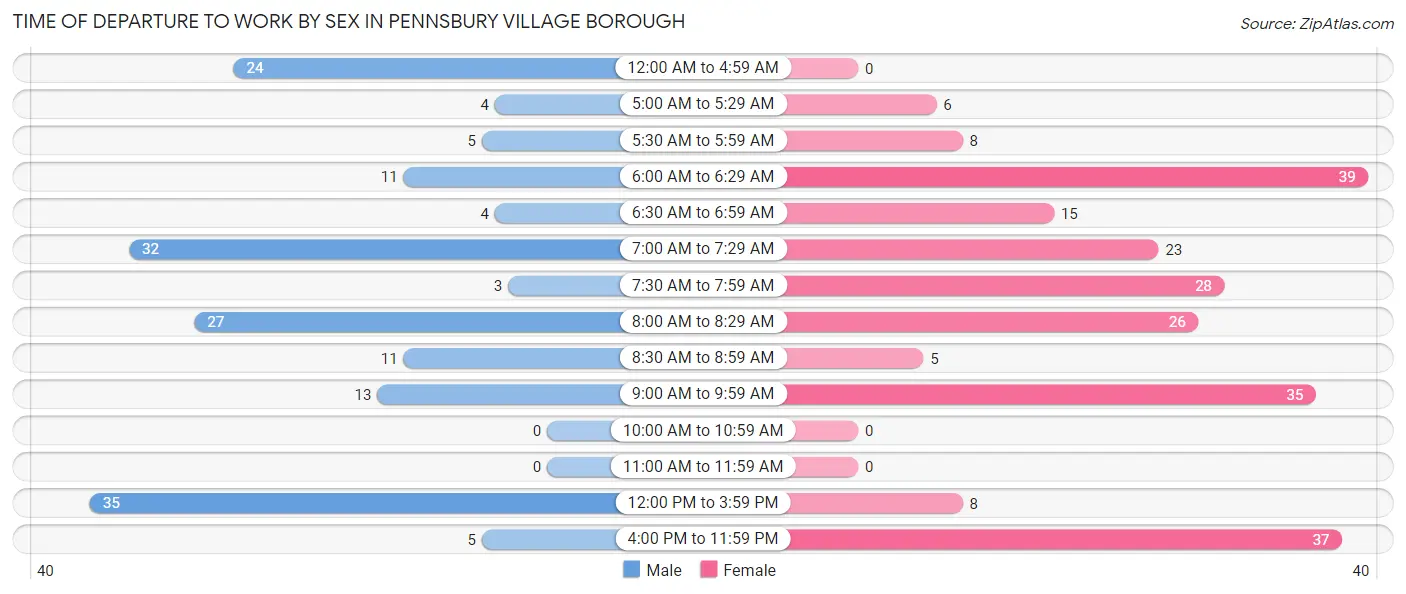
| Time of Departure | Male | Female |
| 12:00 AM to 4:59 AM | 24 (13.8%) | 0 (0.0%) |
| 5:00 AM to 5:29 AM | 4 (2.3%) | 6 (2.6%) |
| 5:30 AM to 5:59 AM | 5 (2.9%) | 8 (3.5%) |
| 6:00 AM to 6:29 AM | 11 (6.3%) | 39 (17.0%) |
| 6:30 AM to 6:59 AM | 4 (2.3%) | 15 (6.5%) |
| 7:00 AM to 7:29 AM | 32 (18.4%) | 23 (10.0%) |
| 7:30 AM to 7:59 AM | 3 (1.7%) | 28 (12.2%) |
| 8:00 AM to 8:29 AM | 27 (15.5%) | 26 (11.3%) |
| 8:30 AM to 8:59 AM | 11 (6.3%) | 5 (2.2%) |
| 9:00 AM to 9:59 AM | 13 (7.5%) | 35 (15.2%) |
| 10:00 AM to 10:59 AM | 0 (0.0%) | 0 (0.0%) |
| 11:00 AM to 11:59 AM | 0 (0.0%) | 0 (0.0%) |
| 12:00 PM to 3:59 PM | 35 (20.1%) | 8 (3.5%) |
| 4:00 PM to 11:59 PM | 5 (2.9%) | 37 (16.1%) |
| Total | 174 (100.0%) | 230 (100.0%) |
Housing Occupancy in Pennsbury Village borough
Occupancy by Ownership in Pennsbury Village borough
Of the total 459 dwellings in Pennsbury Village borough, owner-occupied units account for 318 (69.3%), while renter-occupied units make up 141 (30.7%).
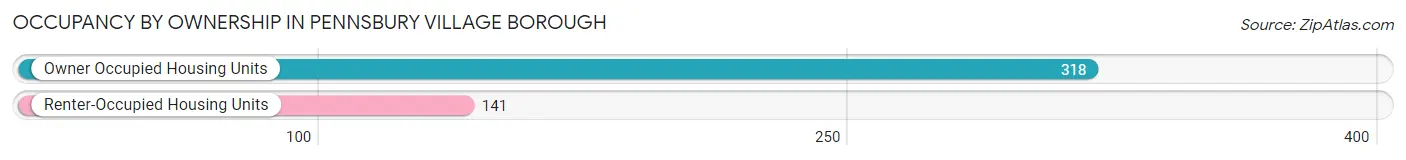
| Occupancy | # Housing Units | % Housing Units |
| Owner Occupied Housing Units | 318 | 69.3% |
| Renter-Occupied Housing Units | 141 | 30.7% |
| Total Occupied Housing Units | 459 | 100.0% |
Occupancy by Household Size in Pennsbury Village borough
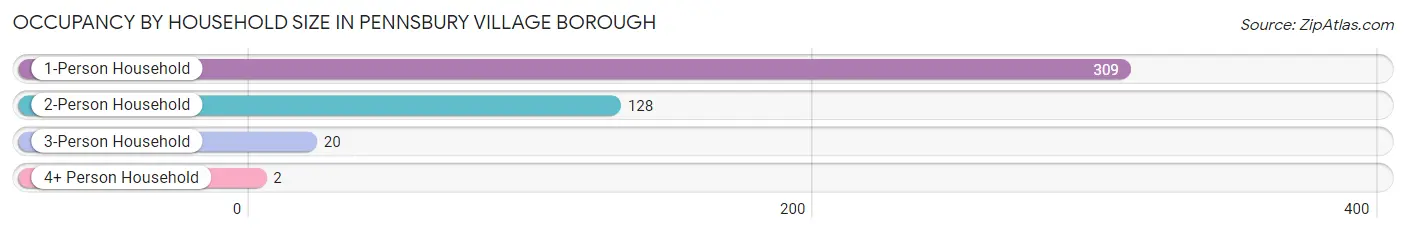
| Household Size | # Housing Units | % Housing Units |
| 1-Person Household | 309 | 67.3% |
| 2-Person Household | 128 | 27.9% |
| 3-Person Household | 20 | 4.4% |
| 4+ Person Household | 2 | 0.4% |
| Total Housing Units | 459 | 100.0% |
Occupancy by Ownership by Household Size in Pennsbury Village borough
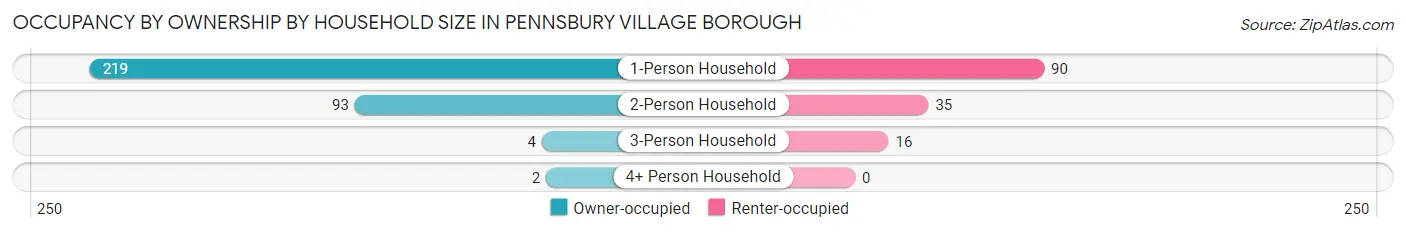
| Household Size | Owner-occupied | Renter-occupied |
| 1-Person Household | 219 (70.9%) | 90 (29.1%) |
| 2-Person Household | 93 (72.7%) | 35 (27.3%) |
| 3-Person Household | 4 (20.0%) | 16 (80.0%) |
| 4+ Person Household | 2 (100.0%) | 0 (0.0%) |
| Total Housing Units | 318 (69.3%) | 141 (30.7%) |
Occupancy by Educational Attainment in Pennsbury Village borough
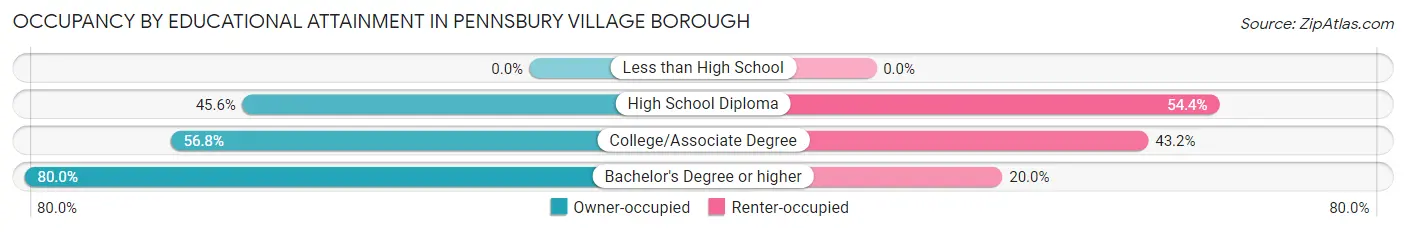
| Household Size | Owner-occupied | Renter-occupied |
| Less than High School | 0 (0.0%) | 0 (0.0%) |
| High School Diploma | 36 (45.6%) | 43 (54.4%) |
| College/Associate Degree | 54 (56.8%) | 41 (43.2%) |
| Bachelor's Degree or higher | 228 (80.0%) | 57 (20.0%) |
Occupancy by Age of Householder in Pennsbury Village borough
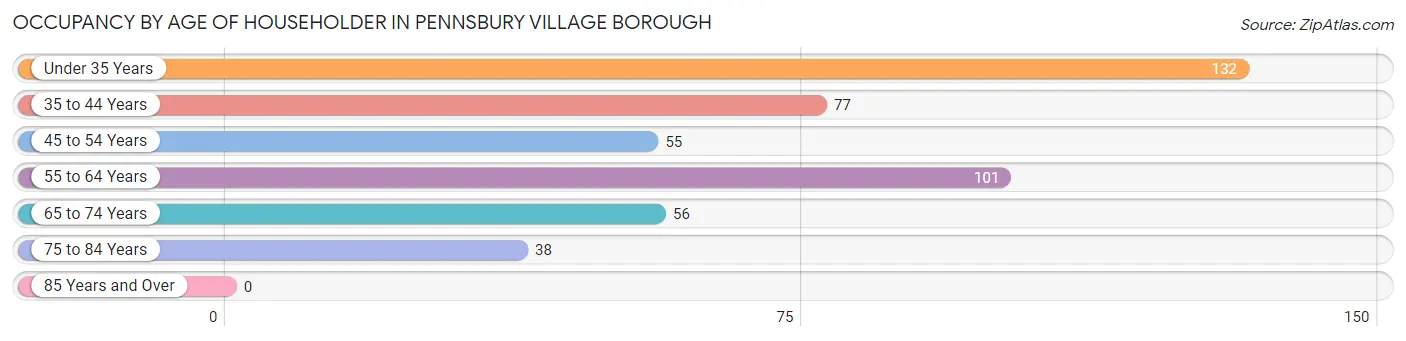
| Age Bracket | # Households | % Households |
| Under 35 Years | 132 | 28.8% |
| 35 to 44 Years | 77 | 16.8% |
| 45 to 54 Years | 55 | 12.0% |
| 55 to 64 Years | 101 | 22.0% |
| 65 to 74 Years | 56 | 12.2% |
| 75 to 84 Years | 38 | 8.3% |
| 85 Years and Over | 0 | 0.0% |
| Total | 459 | 100.0% |
Housing Finances in Pennsbury Village borough
Median Income by Occupancy in Pennsbury Village borough
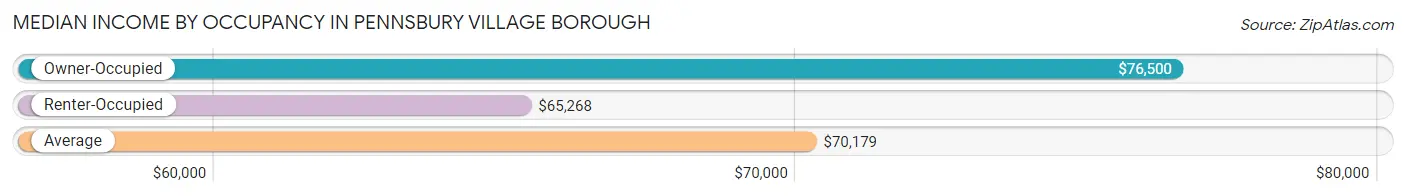
| Occupancy Type | # Households | Median Income |
| Owner-Occupied | 318 (69.3%) | $76,500 |
| Renter-Occupied | 141 (30.7%) | $65,268 |
| Average | 459 (100.0%) | $70,179 |
Occupancy by Householder Income Bracket in Pennsbury Village borough
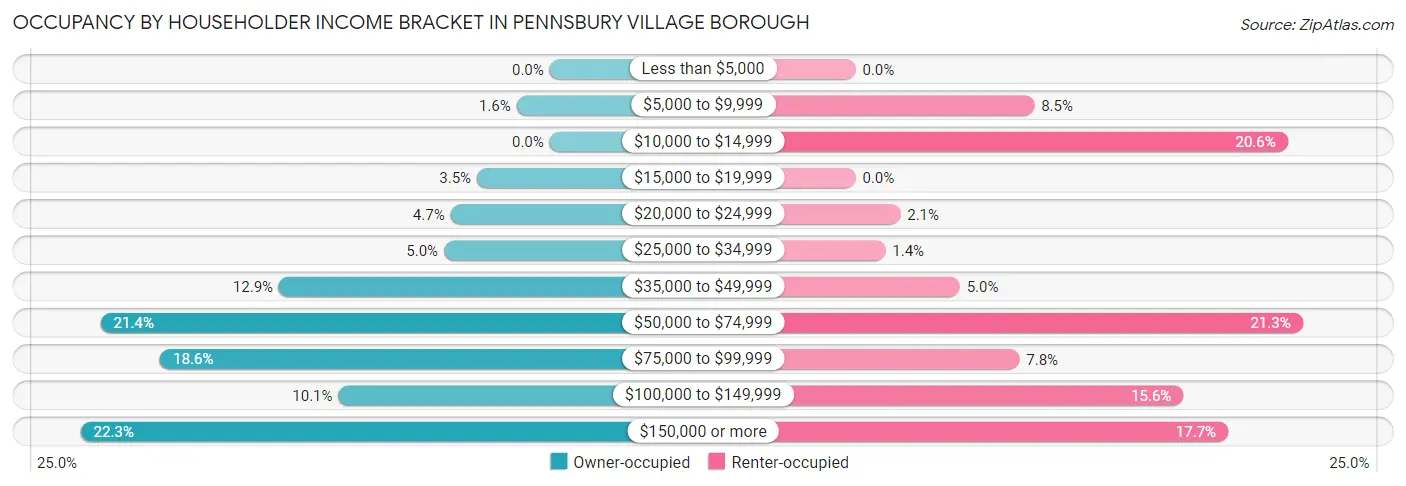
| Income Bracket | Owner-occupied | Renter-occupied |
| Less than $5,000 | 0 (0.0%) | 0 (0.0%) |
| $5,000 to $9,999 | 5 (1.6%) | 12 (8.5%) |
| $10,000 to $14,999 | 0 (0.0%) | 29 (20.6%) |
| $15,000 to $19,999 | 11 (3.5%) | 0 (0.0%) |
| $20,000 to $24,999 | 15 (4.7%) | 3 (2.1%) |
| $25,000 to $34,999 | 16 (5.0%) | 2 (1.4%) |
| $35,000 to $49,999 | 41 (12.9%) | 7 (5.0%) |
| $50,000 to $74,999 | 68 (21.4%) | 30 (21.3%) |
| $75,000 to $99,999 | 59 (18.5%) | 11 (7.8%) |
| $100,000 to $149,999 | 32 (10.1%) | 22 (15.6%) |
| $150,000 or more | 71 (22.3%) | 25 (17.7%) |
| Total | 318 (100.0%) | 141 (100.0%) |
Monthly Housing Cost Tiers in Pennsbury Village borough
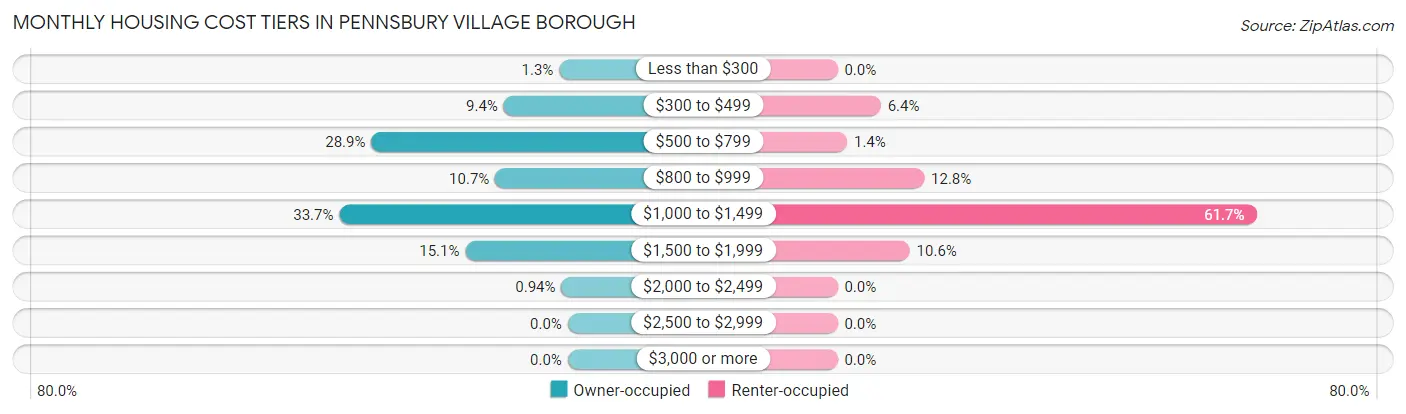
| Monthly Cost | Owner-occupied | Renter-occupied |
| Less than $300 | 4 (1.3%) | 0 (0.0%) |
| $300 to $499 | 30 (9.4%) | 9 (6.4%) |
| $500 to $799 | 92 (28.9%) | 2 (1.4%) |
| $800 to $999 | 34 (10.7%) | 18 (12.8%) |
| $1,000 to $1,499 | 107 (33.7%) | 87 (61.7%) |
| $1,500 to $1,999 | 48 (15.1%) | 15 (10.6%) |
| $2,000 to $2,499 | 3 (0.9%) | 0 (0.0%) |
| $2,500 to $2,999 | 0 (0.0%) | 0 (0.0%) |
| $3,000 or more | 0 (0.0%) | 0 (0.0%) |
| Total | 318 (100.0%) | 141 (100.0%) |
Physical Housing Characteristics in Pennsbury Village borough
Housing Structures in Pennsbury Village borough
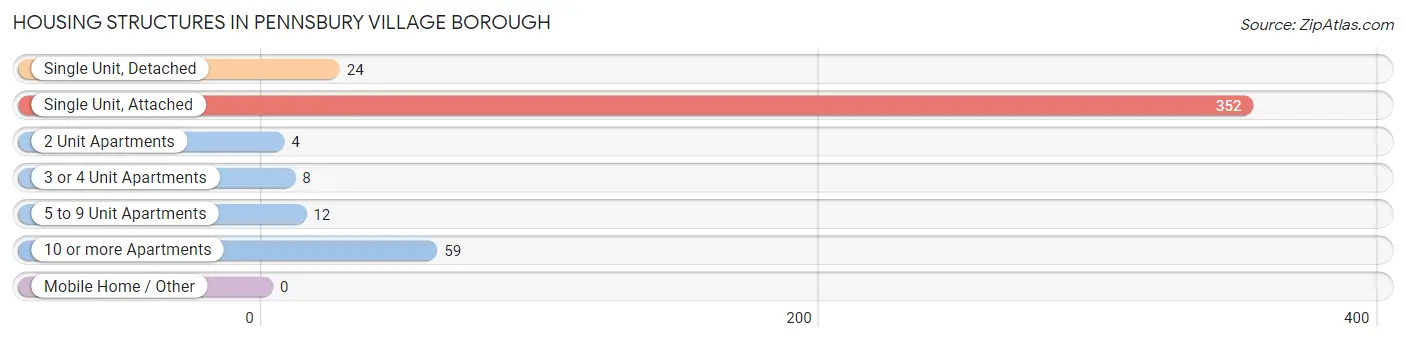
| Structure Type | # Housing Units | % Housing Units |
| Single Unit, Detached | 24 | 5.2% |
| Single Unit, Attached | 352 | 76.7% |
| 2 Unit Apartments | 4 | 0.9% |
| 3 or 4 Unit Apartments | 8 | 1.7% |
| 5 to 9 Unit Apartments | 12 | 2.6% |
| 10 or more Apartments | 59 | 12.9% |
| Mobile Home / Other | 0 | 0.0% |
| Total | 459 | 100.0% |
Housing Structures by Occupancy in Pennsbury Village borough
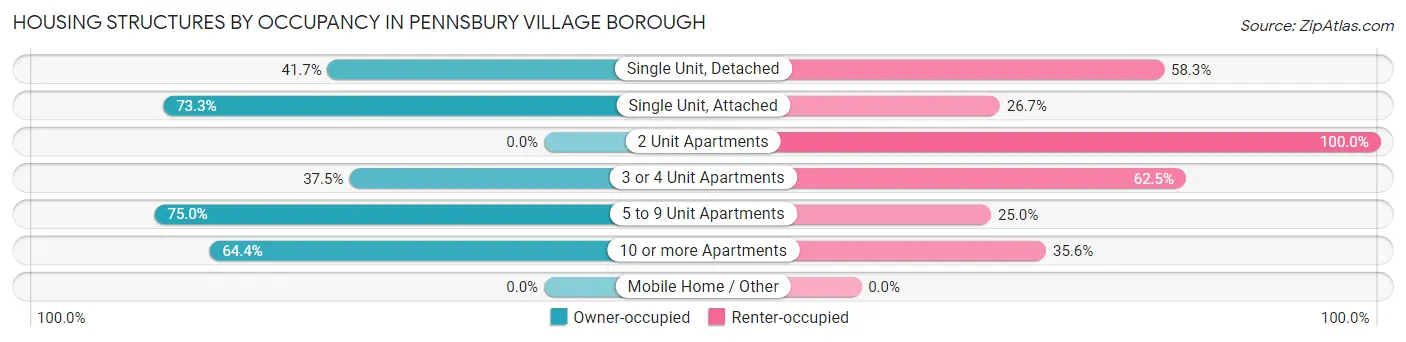
| Structure Type | Owner-occupied | Renter-occupied |
| Single Unit, Detached | 10 (41.7%) | 14 (58.3%) |
| Single Unit, Attached | 258 (73.3%) | 94 (26.7%) |
| 2 Unit Apartments | 0 (0.0%) | 4 (100.0%) |
| 3 or 4 Unit Apartments | 3 (37.5%) | 5 (62.5%) |
| 5 to 9 Unit Apartments | 9 (75.0%) | 3 (25.0%) |
| 10 or more Apartments | 38 (64.4%) | 21 (35.6%) |
| Mobile Home / Other | 0 (0.0%) | 0 (0.0%) |
| Total | 318 (69.3%) | 141 (30.7%) |
Housing Structures by Number of Rooms in Pennsbury Village borough
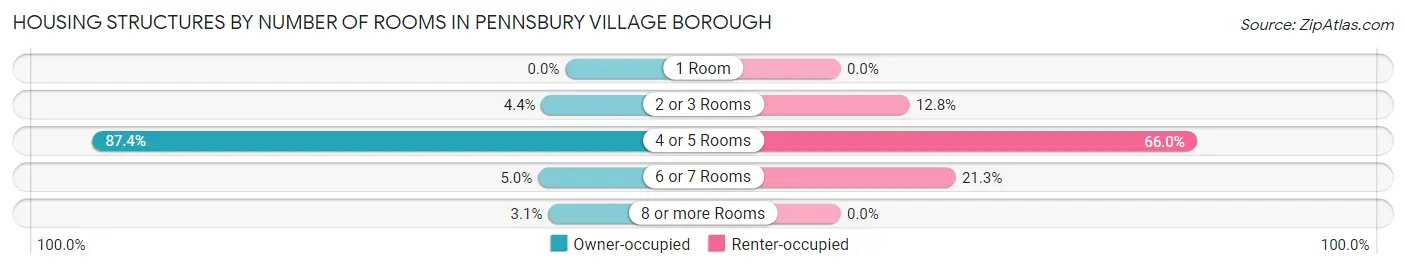
| Number of Rooms | Owner-occupied | Renter-occupied |
| 1 Room | 0 (0.0%) | 0 (0.0%) |
| 2 or 3 Rooms | 14 (4.4%) | 18 (12.8%) |
| 4 or 5 Rooms | 278 (87.4%) | 93 (66.0%) |
| 6 or 7 Rooms | 16 (5.0%) | 30 (21.3%) |
| 8 or more Rooms | 10 (3.1%) | 0 (0.0%) |
| Total | 318 (100.0%) | 141 (100.0%) |
Housing Structure by Heating Type in Pennsbury Village borough
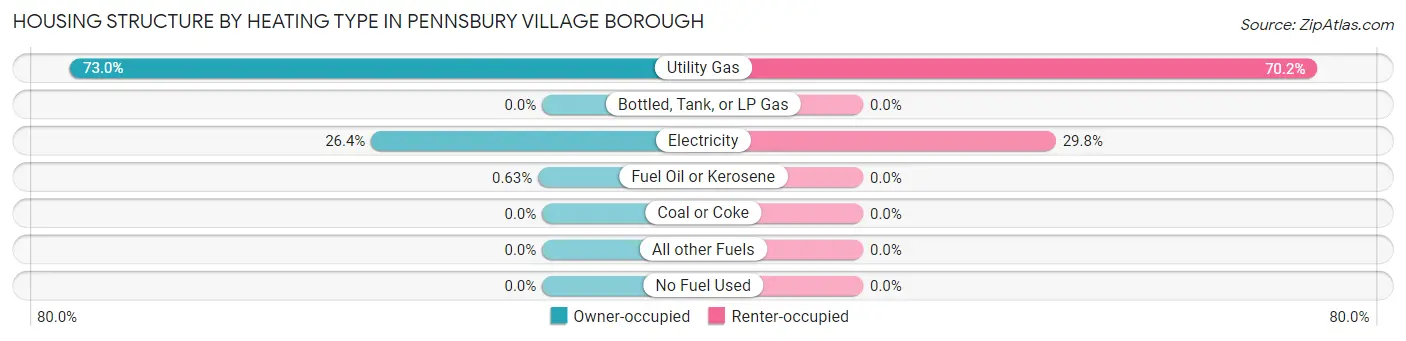
| Heating Type | Owner-occupied | Renter-occupied |
| Utility Gas | 232 (73.0%) | 99 (70.2%) |
| Bottled, Tank, or LP Gas | 0 (0.0%) | 0 (0.0%) |
| Electricity | 84 (26.4%) | 42 (29.8%) |
| Fuel Oil or Kerosene | 2 (0.6%) | 0 (0.0%) |
| Coal or Coke | 0 (0.0%) | 0 (0.0%) |
| All other Fuels | 0 (0.0%) | 0 (0.0%) |
| No Fuel Used | 0 (0.0%) | 0 (0.0%) |
| Total | 318 (100.0%) | 141 (100.0%) |
Household Vehicle Usage in Pennsbury Village borough
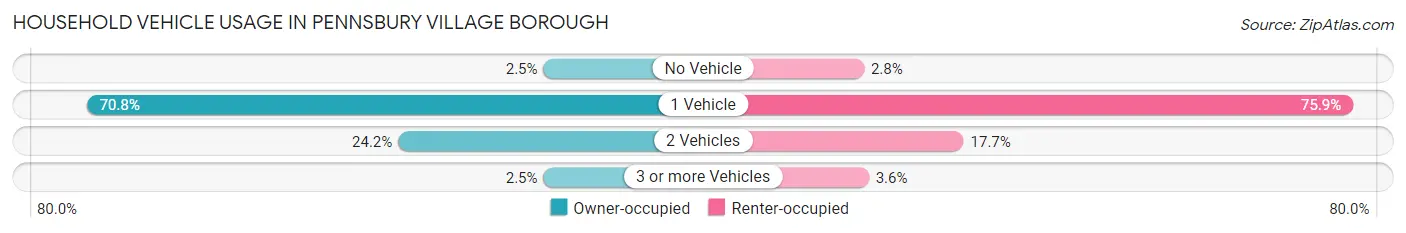
| Vehicles per Household | Owner-occupied | Renter-occupied |
| No Vehicle | 8 (2.5%) | 4 (2.8%) |
| 1 Vehicle | 225 (70.8%) | 107 (75.9%) |
| 2 Vehicles | 77 (24.2%) | 25 (17.7%) |
| 3 or more Vehicles | 8 (2.5%) | 5 (3.5%) |
| Total | 318 (100.0%) | 141 (100.0%) |
Real Estate & Mortgages in Pennsbury Village borough
Real Estate and Mortgage Overview in Pennsbury Village borough
| Characteristic | Without Mortgage | With Mortgage |
| Housing Units | 113 | 205 |
| Median Property Value | $133,100 | $145,800 |
| Median Household Income | $42,083 | $56 |
| Monthly Housing Costs | $598 | $0 |
| Real Estate Taxes | $2,408 | $10 |
Property Value by Mortgage Status in Pennsbury Village borough
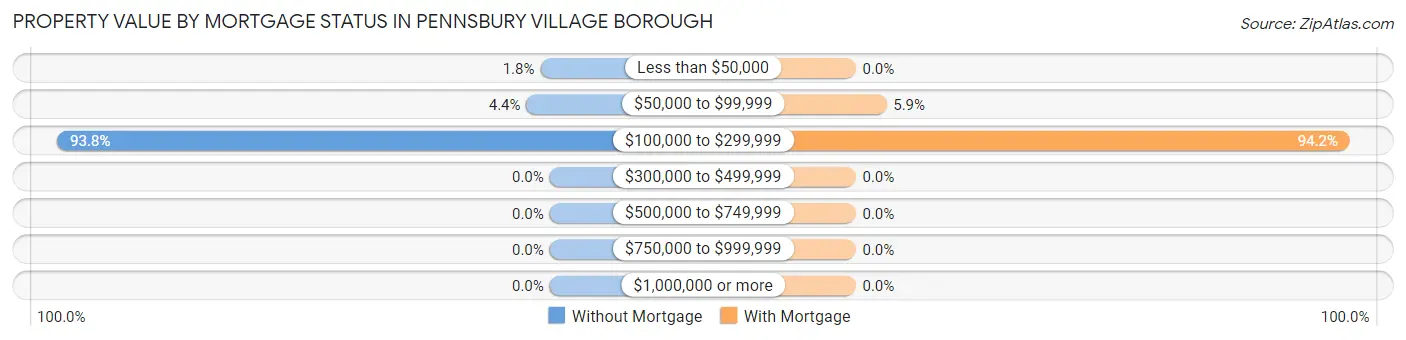
| Property Value | Without Mortgage | With Mortgage |
| Less than $50,000 | 2 (1.8%) | 0 (0.0%) |
| $50,000 to $99,999 | 5 (4.4%) | 12 (5.9%) |
| $100,000 to $299,999 | 106 (93.8%) | 193 (94.2%) |
| $300,000 to $499,999 | 0 (0.0%) | 0 (0.0%) |
| $500,000 to $749,999 | 0 (0.0%) | 0 (0.0%) |
| $750,000 to $999,999 | 0 (0.0%) | 0 (0.0%) |
| $1,000,000 or more | 0 (0.0%) | 0 (0.0%) |
| Total | 113 (100.0%) | 205 (100.0%) |
Household Income by Mortgage Status in Pennsbury Village borough
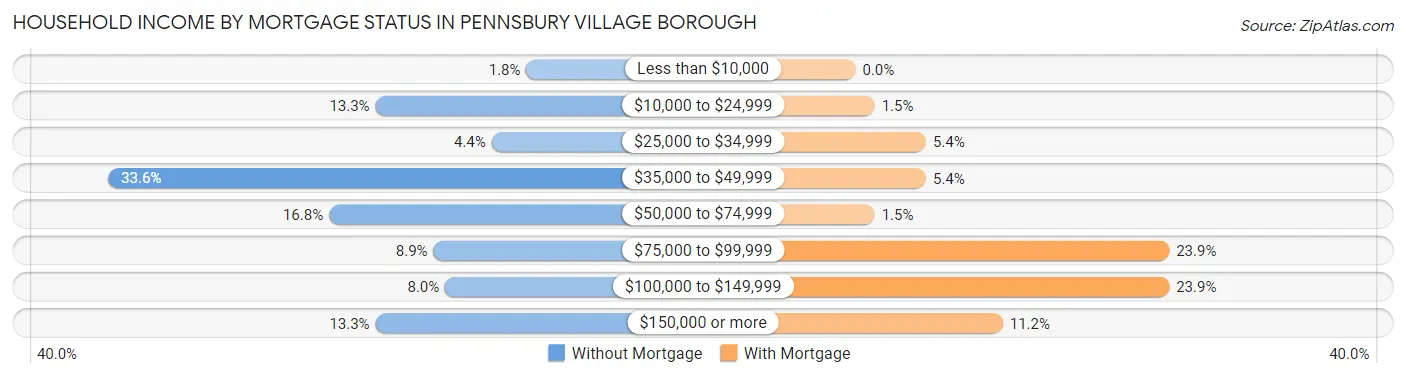
| Household Income | Without Mortgage | With Mortgage |
| Less than $10,000 | 2 (1.8%) | 0 (0.0%) |
| $10,000 to $24,999 | 15 (13.3%) | 3 (1.5%) |
| $25,000 to $34,999 | 5 (4.4%) | 11 (5.4%) |
| $35,000 to $49,999 | 38 (33.6%) | 11 (5.4%) |
| $50,000 to $74,999 | 19 (16.8%) | 3 (1.5%) |
| $75,000 to $99,999 | 10 (8.8%) | 49 (23.9%) |
| $100,000 to $149,999 | 9 (8.0%) | 49 (23.9%) |
| $150,000 or more | 15 (13.3%) | 23 (11.2%) |
| Total | 113 (100.0%) | 205 (100.0%) |
Property Value to Household Income Ratio in Pennsbury Village borough
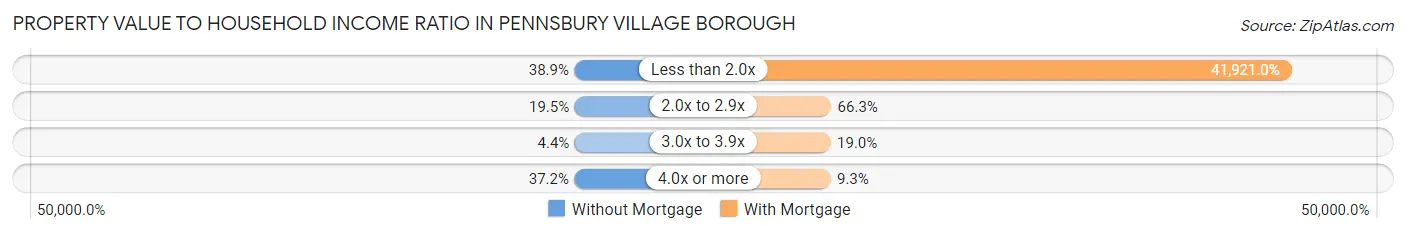
| Value-to-Income Ratio | Without Mortgage | With Mortgage |
| Less than 2.0x | 44 (38.9%) | 85,938 (41,921.0%) |
| 2.0x to 2.9x | 22 (19.5%) | 136 (66.3%) |
| 3.0x to 3.9x | 5 (4.4%) | 39 (19.0%) |
| 4.0x or more | 42 (37.2%) | 19 (9.3%) |
| Total | 113 (100.0%) | 205 (100.0%) |
Real Estate Taxes by Mortgage Status in Pennsbury Village borough
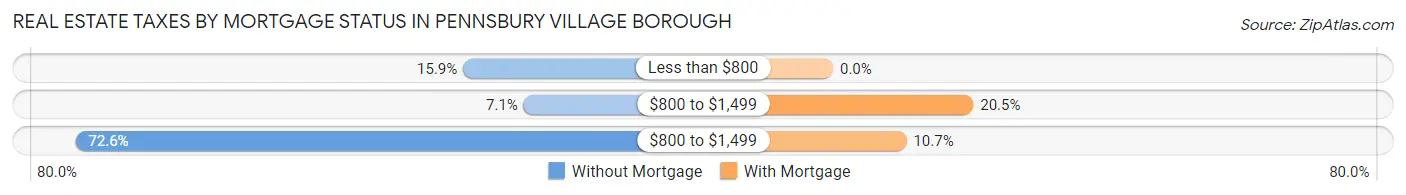
| Property Taxes | Without Mortgage | With Mortgage |
| Less than $800 | 18 (15.9%) | 0 (0.0%) |
| $800 to $1,499 | 8 (7.1%) | 42 (20.5%) |
| $800 to $1,499 | 82 (72.6%) | 22 (10.7%) |
| Total | 113 (100.0%) | 205 (100.0%) |
Health & Disability in Pennsbury Village borough
Health Insurance Coverage by Age in Pennsbury Village borough
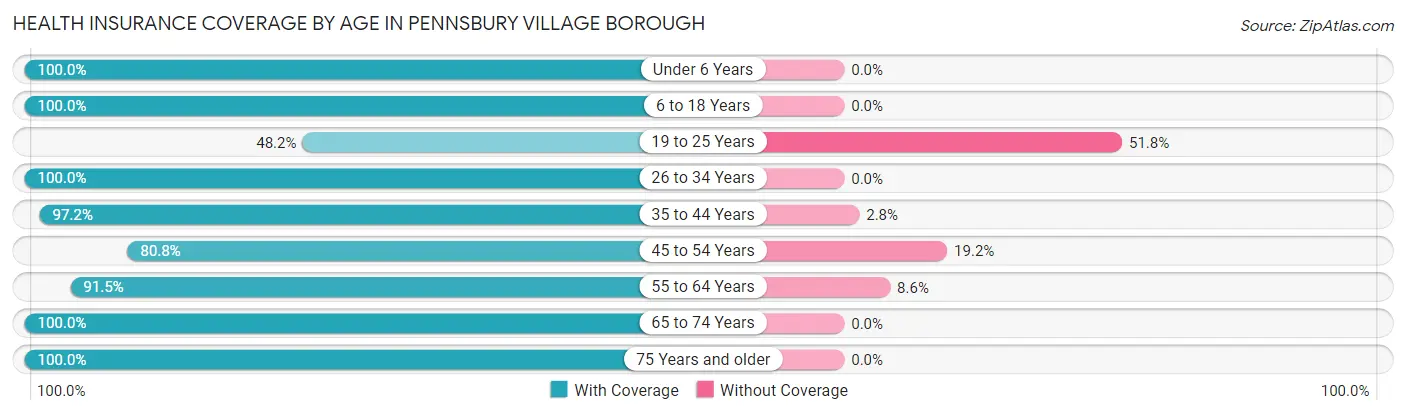
| Age Bracket | With Coverage | Without Coverage |
| Under 6 Years | 9 (100.0%) | 0 (0.0%) |
| 6 to 18 Years | 22 (100.0%) | 0 (0.0%) |
| 19 to 25 Years | 27 (48.2%) | 29 (51.8%) |
| 26 to 34 Years | 141 (100.0%) | 0 (0.0%) |
| 35 to 44 Years | 104 (97.2%) | 3 (2.8%) |
| 45 to 54 Years | 59 (80.8%) | 14 (19.2%) |
| 55 to 64 Years | 107 (91.4%) | 10 (8.6%) |
| 65 to 74 Years | 68 (100.0%) | 0 (0.0%) |
| 75 Years and older | 40 (100.0%) | 0 (0.0%) |
| Total | 577 (91.1%) | 56 (8.8%) |
Health Insurance Coverage by Citizenship Status in Pennsbury Village borough
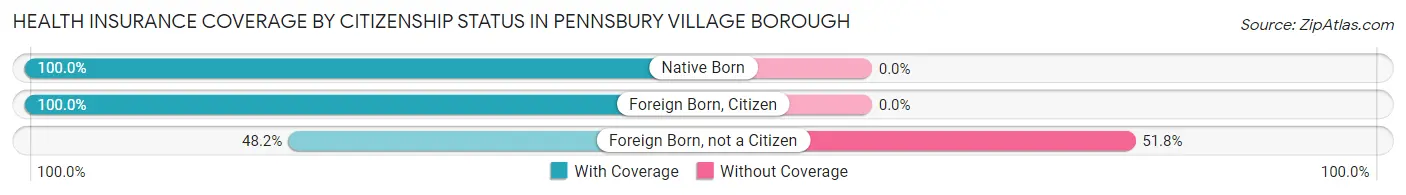
| Citizenship Status | With Coverage | Without Coverage |
| Native Born | 9 (100.0%) | 0 (0.0%) |
| Foreign Born, Citizen | 22 (100.0%) | 0 (0.0%) |
| Foreign Born, not a Citizen | 27 (48.2%) | 29 (51.8%) |
Health Insurance Coverage by Household Income in Pennsbury Village borough
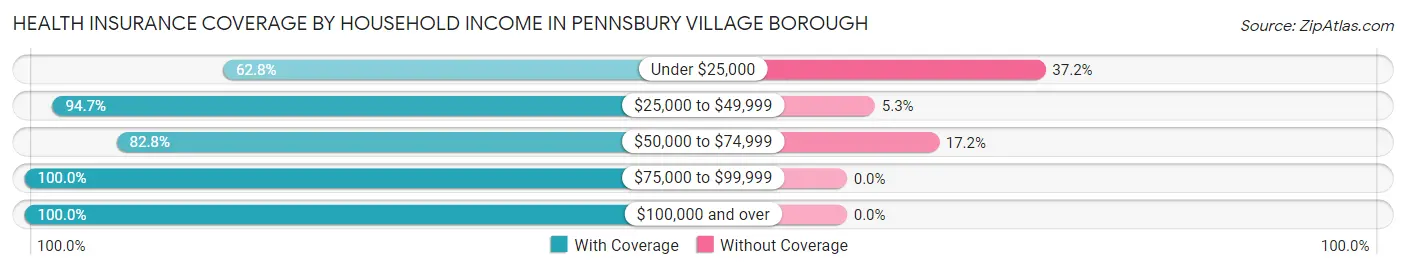
| Household Income | With Coverage | Without Coverage |
| Under $25,000 | 54 (62.8%) | 32 (37.2%) |
| $25,000 to $49,999 | 72 (94.7%) | 4 (5.3%) |
| $50,000 to $74,999 | 96 (82.8%) | 20 (17.2%) |
| $75,000 to $99,999 | 92 (100.0%) | 0 (0.0%) |
| $100,000 and over | 263 (100.0%) | 0 (0.0%) |
Public vs Private Health Insurance Coverage by Age in Pennsbury Village borough
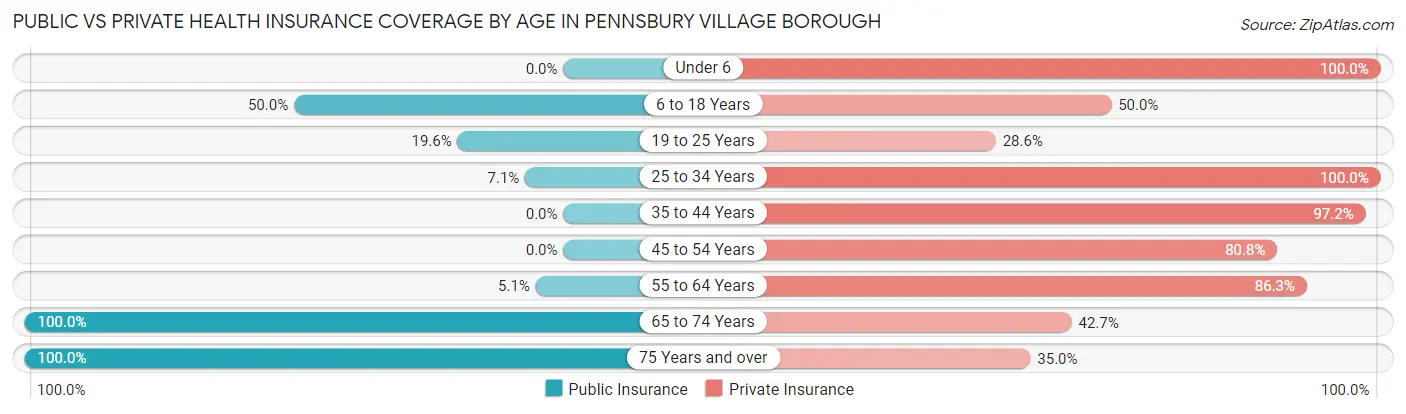
| Age Bracket | Public Insurance | Private Insurance |
| Under 6 | 0 (0.0%) | 9 (100.0%) |
| 6 to 18 Years | 11 (50.0%) | 11 (50.0%) |
| 19 to 25 Years | 11 (19.6%) | 16 (28.6%) |
| 25 to 34 Years | 10 (7.1%) | 141 (100.0%) |
| 35 to 44 Years | 0 (0.0%) | 104 (97.2%) |
| 45 to 54 Years | 0 (0.0%) | 59 (80.8%) |
| 55 to 64 Years | 6 (5.1%) | 101 (86.3%) |
| 65 to 74 Years | 68 (100.0%) | 29 (42.6%) |
| 75 Years and over | 40 (100.0%) | 14 (35.0%) |
| Total | 146 (23.1%) | 484 (76.5%) |
Disability Status by Sex by Age in Pennsbury Village borough
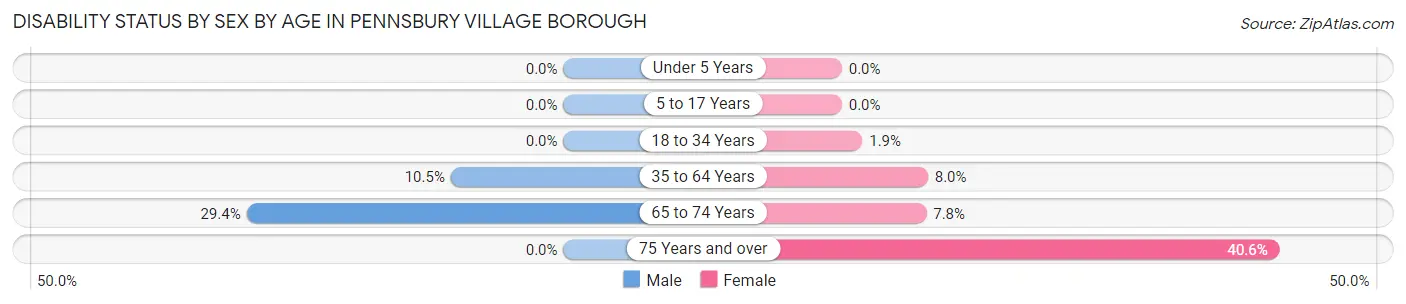
| Age Bracket | Male | Female |
| Under 5 Years | 0 (0.0%) | 0 (0.0%) |
| 5 to 17 Years | 0 (0.0%) | 0 (0.0%) |
| 18 to 34 Years | 0 (0.0%) | 2 (1.9%) |
| 35 to 64 Years | 14 (10.4%) | 13 (8.0%) |
| 65 to 74 Years | 5 (29.4%) | 4 (7.8%) |
| 75 Years and over | 0 (0.0%) | 13 (40.6%) |
Disability Class by Sex by Age in Pennsbury Village borough
Disability Class: Hearing Difficulty
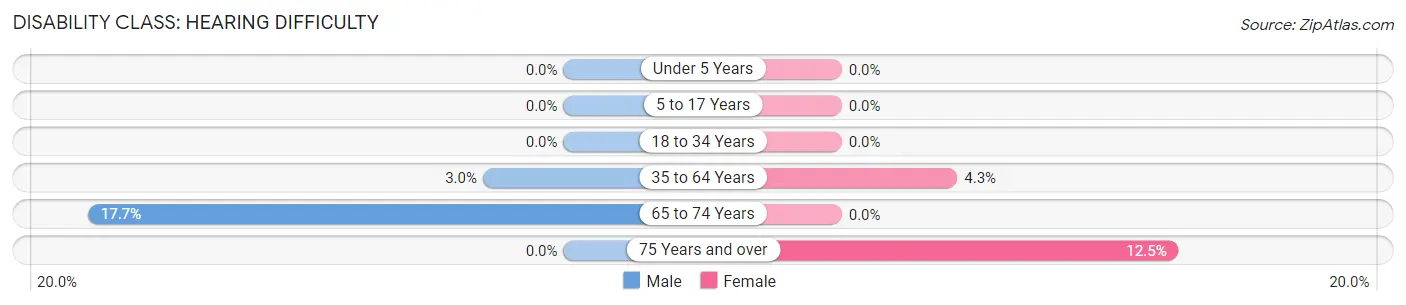
| Age Bracket | Male | Female |
| Under 5 Years | 0 (0.0%) | 0 (0.0%) |
| 5 to 17 Years | 0 (0.0%) | 0 (0.0%) |
| 18 to 34 Years | 0 (0.0%) | 0 (0.0%) |
| 35 to 64 Years | 4 (3.0%) | 7 (4.3%) |
| 65 to 74 Years | 3 (17.6%) | 0 (0.0%) |
| 75 Years and over | 0 (0.0%) | 4 (12.5%) |
Disability Class: Vision Difficulty

| Age Bracket | Male | Female |
| Under 5 Years | 0 (0.0%) | 0 (0.0%) |
| 5 to 17 Years | 0 (0.0%) | 0 (0.0%) |
| 18 to 34 Years | 0 (0.0%) | 0 (0.0%) |
| 35 to 64 Years | 7 (5.2%) | 0 (0.0%) |
| 65 to 74 Years | 0 (0.0%) | 2 (3.9%) |
| 75 Years and over | 0 (0.0%) | 0 (0.0%) |
Disability Class: Cognitive Difficulty
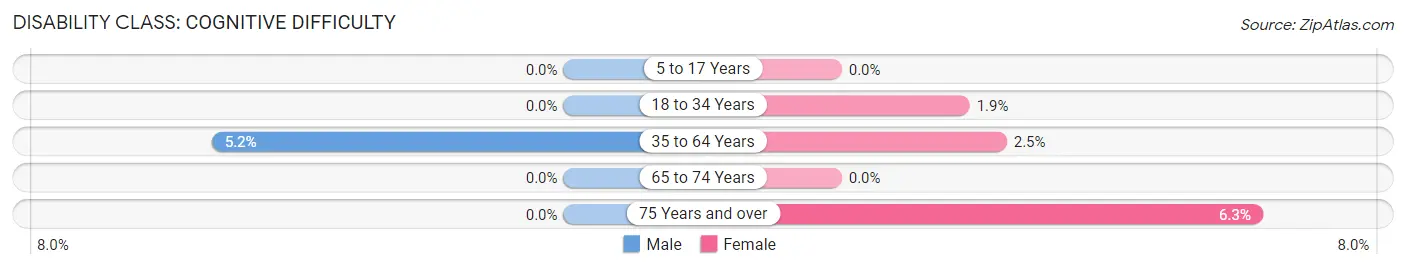
| Age Bracket | Male | Female |
| 5 to 17 Years | 0 (0.0%) | 0 (0.0%) |
| 18 to 34 Years | 0 (0.0%) | 2 (1.9%) |
| 35 to 64 Years | 7 (5.2%) | 4 (2.5%) |
| 65 to 74 Years | 0 (0.0%) | 0 (0.0%) |
| 75 Years and over | 0 (0.0%) | 2 (6.2%) |
Disability Class: Ambulatory Difficulty
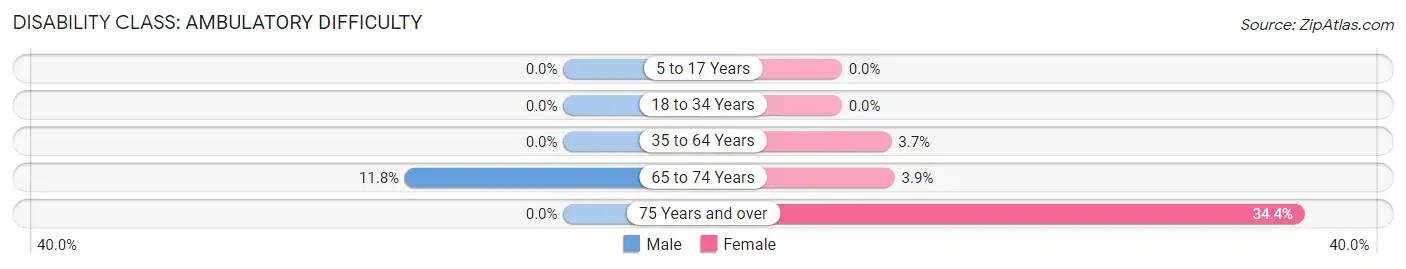
| Age Bracket | Male | Female |
| 5 to 17 Years | 0 (0.0%) | 0 (0.0%) |
| 18 to 34 Years | 0 (0.0%) | 0 (0.0%) |
| 35 to 64 Years | 0 (0.0%) | 6 (3.7%) |
| 65 to 74 Years | 2 (11.8%) | 2 (3.9%) |
| 75 Years and over | 0 (0.0%) | 11 (34.4%) |
Disability Class: Self-Care Difficulty
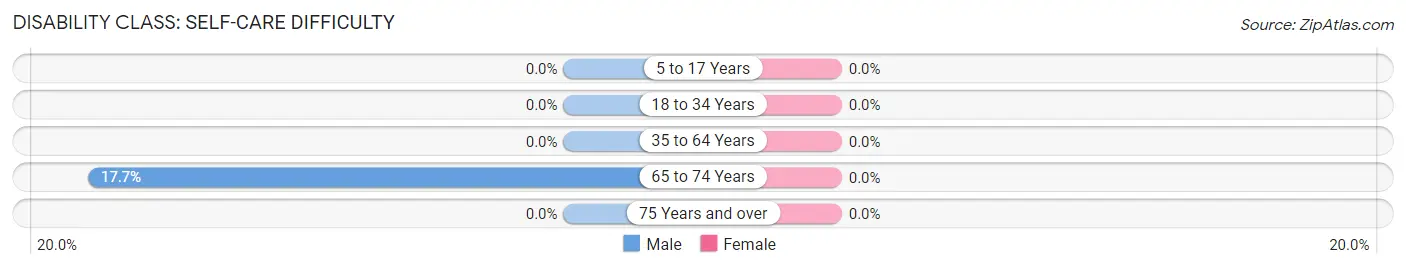
| Age Bracket | Male | Female |
| 5 to 17 Years | 0 (0.0%) | 0 (0.0%) |
| 18 to 34 Years | 0 (0.0%) | 0 (0.0%) |
| 35 to 64 Years | 0 (0.0%) | 0 (0.0%) |
| 65 to 74 Years | 3 (17.6%) | 0 (0.0%) |
| 75 Years and over | 0 (0.0%) | 0 (0.0%) |
Technology Access in Pennsbury Village borough
Computing Device Access in Pennsbury Village borough
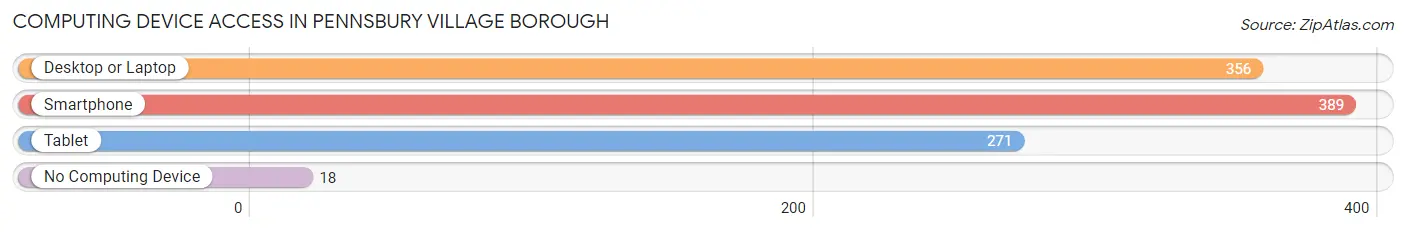
| Device Type | # Households | % Households |
| Desktop or Laptop | 356 | 77.6% |
| Smartphone | 389 | 84.8% |
| Tablet | 271 | 59.0% |
| No Computing Device | 18 | 3.9% |
| Total | 459 | 100.0% |
Internet Access in Pennsbury Village borough
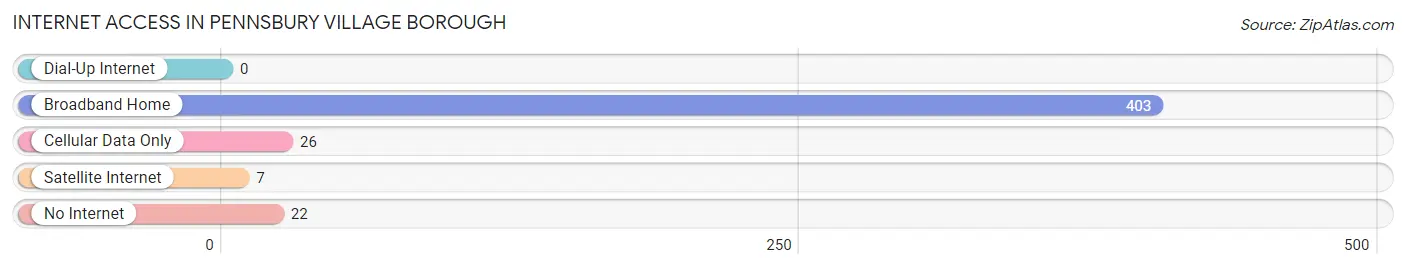
| Internet Type | # Households | % Households |
| Dial-Up Internet | 0 | 0.0% |
| Broadband Home | 403 | 87.8% |
| Cellular Data Only | 26 | 5.7% |
| Satellite Internet | 7 | 1.5% |
| No Internet | 22 | 4.8% |
| Total | 459 | 100.0% |
Pennsbury Village borough Summary
Pennsbury Village Borough is a small borough located in Bucks County, Pennsylvania. It is situated in the southeastern corner of the county, just north of Philadelphia. The borough is bordered by the Delaware River to the east, the Neshaminy Creek to the south, and the Pennsbury Township to the west and north. The population of Pennsbury Village Borough was 2,845 at the 2010 census.
History
The area that is now Pennsbury Village Borough was originally inhabited by the Lenape Native Americans. The first European settlers arrived in the area in the late 17th century. The area was part of the Pennsbury Township until 1876, when it was incorporated as a borough. The borough was named after William Penn, the founder of Pennsylvania.
The borough was a rural farming community until the 1950s, when it began to experience rapid growth due to its proximity to Philadelphia. The population of the borough increased from 1,000 in 1950 to 2,845 in 2010.
Geography
Pennsbury Village Borough is located at 40°10'25"N 75°7'45"W (40.173611, -75.129028). It has a total area of 0.9 square miles, all of which is land. The borough is located in the southeastern corner of Bucks County, just north of Philadelphia. It is bordered by the Delaware River to the east, the Neshaminy Creek to the south, and the Pennsbury Township to the west and north.
The borough is located in the humid subtropical climate zone (Köppen climate classification Cfa). The average temperature in the borough is 52.3°F, with an average high of 68.2°F and an average low of 36.4°F. The average annual precipitation is 43.3 inches.
Economy
The economy of Pennsbury Village Borough is largely based on retail and services. The borough is home to several small businesses, including restaurants, shops, and professional services. The borough also has a few industrial businesses, including a printing company and a metal fabrication shop.
The median household income in the borough was $50,945 in 2017, and the median home value was $232,400. The unemployment rate in the borough was 4.2% in 2017.
Demographics
As of the 2010 census, there were 2,845 people, 1,093 households, and 790 families living in the borough. The population density was 3,093.3 people per square mile. The racial makeup of the borough was 94.2% White, 2.2% African American, 0.3% Native American, 1.2% Asian, 0.7% from other races, and 1.5% from two or more races. Hispanic or Latino of any race were 2.7% of the population.
There were 1,093 households, out of which 33.2% had children under the age of 18 living with them, 54.2% were married couples living together, 11.2% had a female householder with no husband present, and 30.2% were non-families. 24.7% of all households were made up of individuals, and 10.2% had someone living alone who was 65 years of age or older. The average household size was 2.62 and the average family size was 3.14.
The median age in the borough was 41.2 years. 24.2% of residents were under the age of 18; 6.7% were between the ages of 18 and 24; 24.7% were from 25 to 44; 28.7% were from 45 to 64; and 15.7% were 65 years of age or older. The gender makeup of the borough was 48.2% male and 51.8% female.
The median income for a household in the borough was $50,945, and the median income for a family was $62,917. Males had a median income of $45,000 versus $35,000 for females. The per capita income for the borough was $25,945. About 4.2% of families and 5.7% of the population were below the poverty line, including 6.3% of those under age 18 and 5.2% of those age 65 or over.
Common Questions
What is the Total Population of Pennsbury Village borough?
Total Population of Pennsbury Village borough is 633.
What is the Total Male Population of Pennsbury Village borough?
Total Male Population of Pennsbury Village borough is 271.
What is the Total Female Population of Pennsbury Village borough?
Total Female Population of Pennsbury Village borough is 362.
What is the Ratio of Males per 100 Females in Pennsbury Village borough?
There are 74.86 Males per 100 Females in Pennsbury Village borough.
What is the Ratio of Females per 100 Males in Pennsbury Village borough?
There are 133.58 Females per 100 Males in Pennsbury Village borough.
What is the Median Population Age in Pennsbury Village borough?
Median Population Age in Pennsbury Village borough is 40.7 Years.
What is the Average Family Size in Pennsbury Village borough
Average Family Size in Pennsbury Village borough is 2.3 People.
What is the Average Household Size in Pennsbury Village borough
Average Household Size in Pennsbury Village borough is 1.4 People.
What is Per Capita Income in Pennsbury Village borough?
Per Capita income in Pennsbury Village borough is $64,484.
What is the Median Family Income in Pennsbury Village borough?
Median Family Income in Pennsbury Village borough is $109,500.
What is the Median Household income in Pennsbury Village borough?
Median Household Income in Pennsbury Village borough is $70,179.
What is Income or Wage Gap in Pennsbury Village borough?
Income or Wage Gap in Pennsbury Village borough is 4.4%.
Women in Pennsbury Village borough earn 95.6 cents for every dollar earned by a man.
What is Inequality or Gini Index in Pennsbury Village borough?
Inequality or Gini Index in Pennsbury Village borough is 0.40.
How Large is the Labor Force in Pennsbury Village borough?
There are 496 People in the Labor Forcein in Pennsbury Village borough.
What is the Percentage of People in the Labor Force in Pennsbury Village borough?
82.4% of People are in the Labor Force in Pennsbury Village borough.
What is the Unemployment Rate in Pennsbury Village borough?
Unemployment Rate in Pennsbury Village borough is 1.6%.