Penndel borough, PA
Penndel borough Overview
2,498
TOTAL POPULATION
1,258
MALE POPULATION
1,240
FEMALE POPULATION
101.45
MALES / 100 FEMALES
98.57
FEMALES / 100 MALES
31.6
MEDIAN AGE
2.9
AVG FAMILY SIZE
2.3
AVG HOUSEHOLD SIZE
$40,386
PER CAPITA INCOME
$109,214
AVG FAMILY INCOME
$77,708
AVG HOUSEHOLD INCOME
45.1%
WAGE / INCOME GAP [ % ]
54.9¢/ $1
WAGE / INCOME GAP [ $ ]
0.46
INEQUALITY / GINI INDEX
1,500
LABOR FORCE [ PEOPLE ]
69.2%
PERCENT IN LABOR FORCE
3.5%
UNEMPLOYMENT RATE
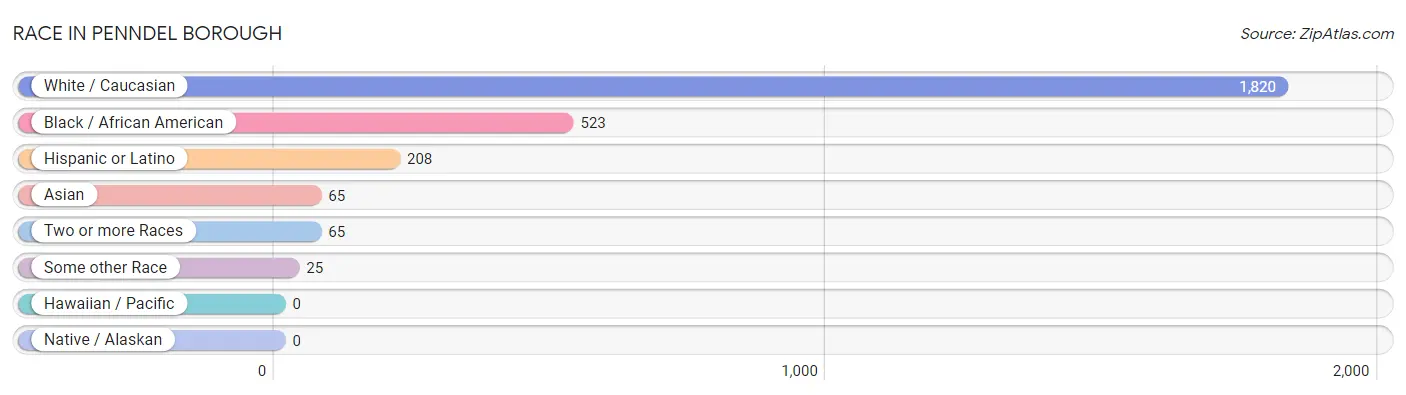
Race in Penndel borough
The most populous races in Penndel borough are White / Caucasian (1,820 | 72.9%), Black / African American (523 | 20.9%), and Hispanic or Latino (208 | 8.3%).
| Race | # Population | % Population |
| Asian | 65 | 2.6% |
| Black / African American | 523 | 20.9% |
| Hawaiian / Pacific | 0 | 0.0% |
| Hispanic or Latino | 208 | 8.3% |
| Native / Alaskan | 0 | 0.0% |
| White / Caucasian | 1,820 | 72.9% |
| Two or more Races | 65 | 2.6% |
| Some other Race | 25 | 1.0% |
| Total | 2,498 | 100.0% |
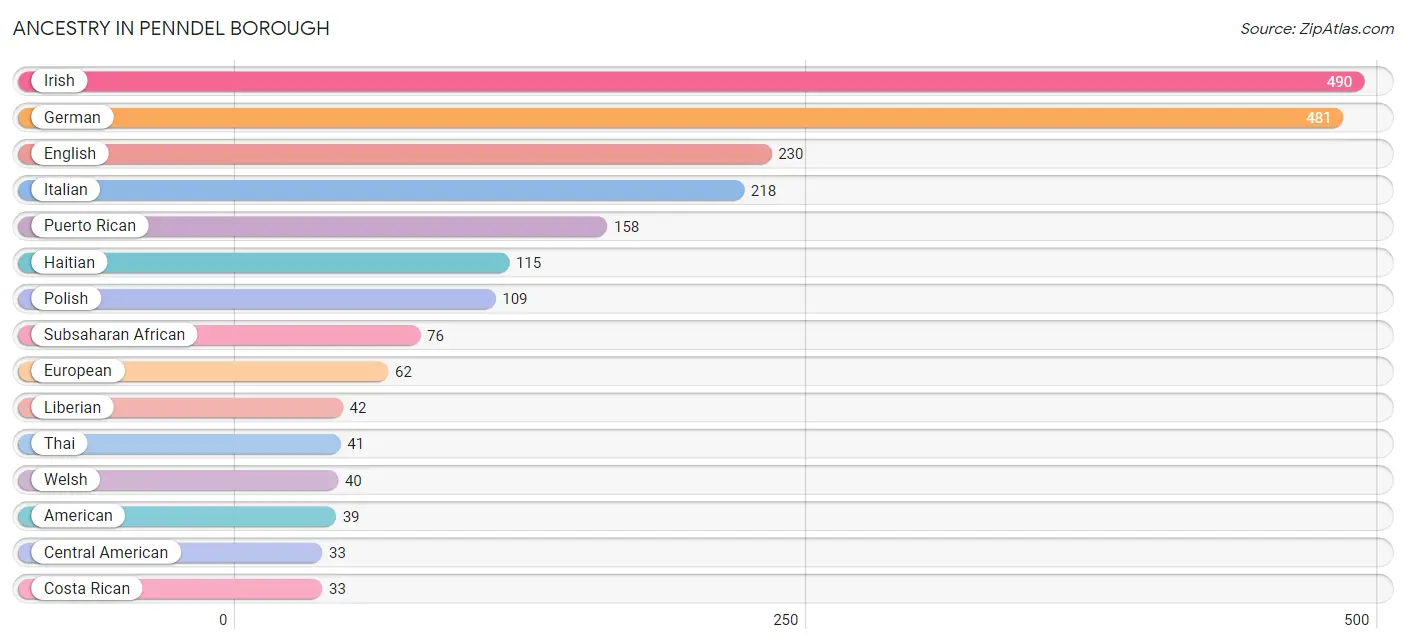
Ancestry in Penndel borough
The most populous ancestries reported in Penndel borough are Irish (490 | 19.6%), German (481 | 19.3%), English (230 | 9.2%), Italian (218 | 8.7%), and Puerto Rican (158 | 6.3%), together accounting for 63.2% of all Penndel borough residents.
| Ancestry | # Population | % Population |
| African | 23 | 0.9% |
| American | 39 | 1.6% |
| Austrian | 30 | 1.2% |
| Belizean | 8 | 0.3% |
| Bhutanese | 11 | 0.4% |
| Central American | 33 | 1.3% |
| Chippewa | 6 | 0.2% |
| Costa Rican | 33 | 1.3% |
| Cuban | 8 | 0.3% |
| Eastern European | 5 | 0.2% |
| English | 230 | 9.2% |
| European | 62 | 2.5% |
| French | 8 | 0.3% |
| French Canadian | 4 | 0.2% |
| German | 481 | 19.3% |
| Haitian | 115 | 4.6% |
| Indian (Asian) | 15 | 0.6% |
| Irish | 490 | 19.6% |
| Italian | 218 | 8.7% |
| Liberian | 42 | 1.7% |
| Lithuanian | 8 | 0.3% |
| Mexican | 4 | 0.2% |
| Nigerian | 11 | 0.4% |
| Pakistani | 4 | 0.2% |
| Pennsylvania German | 17 | 0.7% |
| Polish | 109 | 4.4% |
| Puerto Rican | 158 | 6.3% |
| Russian | 3 | 0.1% |
| Scotch-Irish | 20 | 0.8% |
| Scottish | 19 | 0.8% |
| Slovak | 20 | 0.8% |
| Sri Lankan | 10 | 0.4% |
| Subsaharan African | 76 | 3.0% |
| Swedish | 14 | 0.6% |
| Thai | 41 | 1.6% |
| Turkish | 6 | 0.2% |
| Ukrainian | 24 | 1.0% |
| Welsh | 40 | 1.6% | View All 38 Rows |
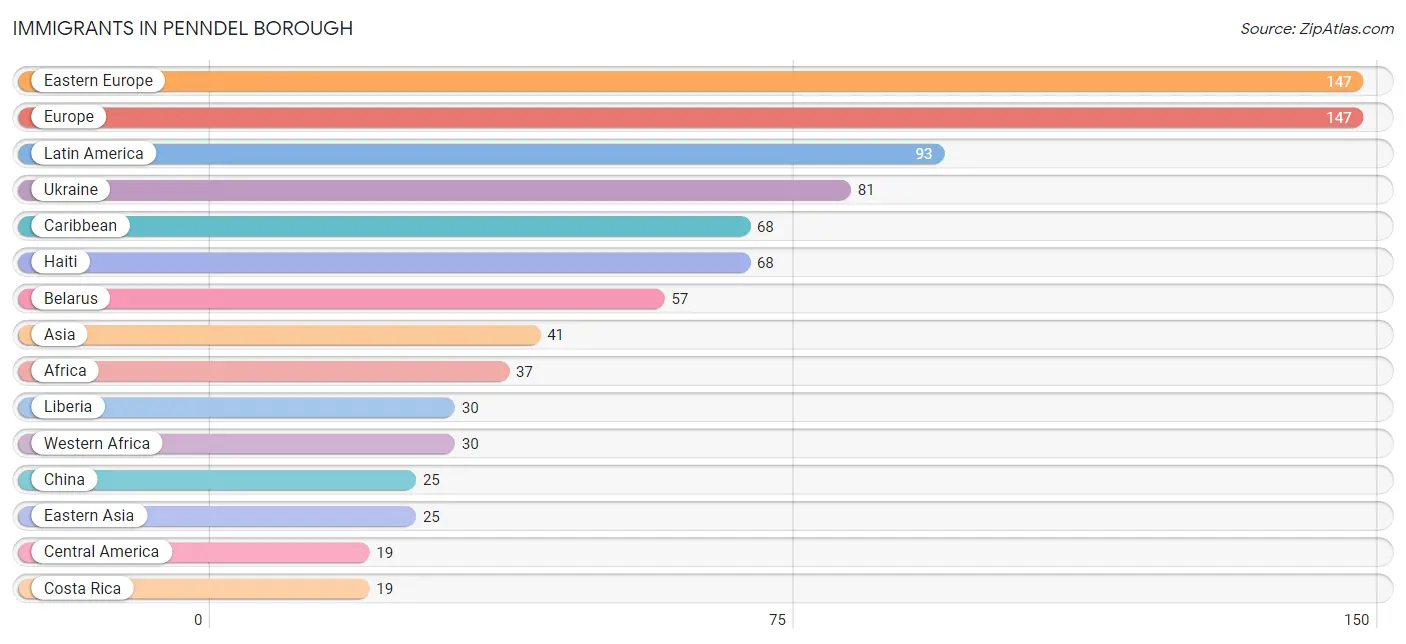
Immigrants in Penndel borough
The most numerous immigrant groups reported in Penndel borough came from Eastern Europe (147 | 5.9%), Europe (147 | 5.9%), Latin America (93 | 3.7%), Ukraine (81 | 3.2%), and Caribbean (68 | 2.7%), together accounting for 21.4% of all Penndel borough residents.
| Immigration Origin | # Population | % Population |
| Africa | 37 | 1.5% |
| Asia | 41 | 1.6% |
| Belarus | 57 | 2.3% |
| Caribbean | 68 | 2.7% |
| Central America | 19 | 0.8% |
| China | 25 | 1.0% |
| Costa Rica | 19 | 0.8% |
| Czechoslovakia | 9 | 0.4% |
| Eastern Asia | 25 | 1.0% |
| Eastern Europe | 147 | 5.9% |
| Europe | 147 | 5.9% |
| Fiji | 6 | 0.2% |
| Guyana | 6 | 0.2% |
| Haiti | 68 | 2.7% |
| India | 12 | 0.5% |
| Latin America | 93 | 3.7% |
| Liberia | 30 | 1.2% |
| Oceania | 6 | 0.2% |
| South America | 6 | 0.2% |
| South Central Asia | 12 | 0.5% |
| South Eastern Asia | 4 | 0.2% |
| Thailand | 4 | 0.2% |
| Ukraine | 81 | 3.2% |
| Western Africa | 30 | 1.2% | View All 24 Rows |
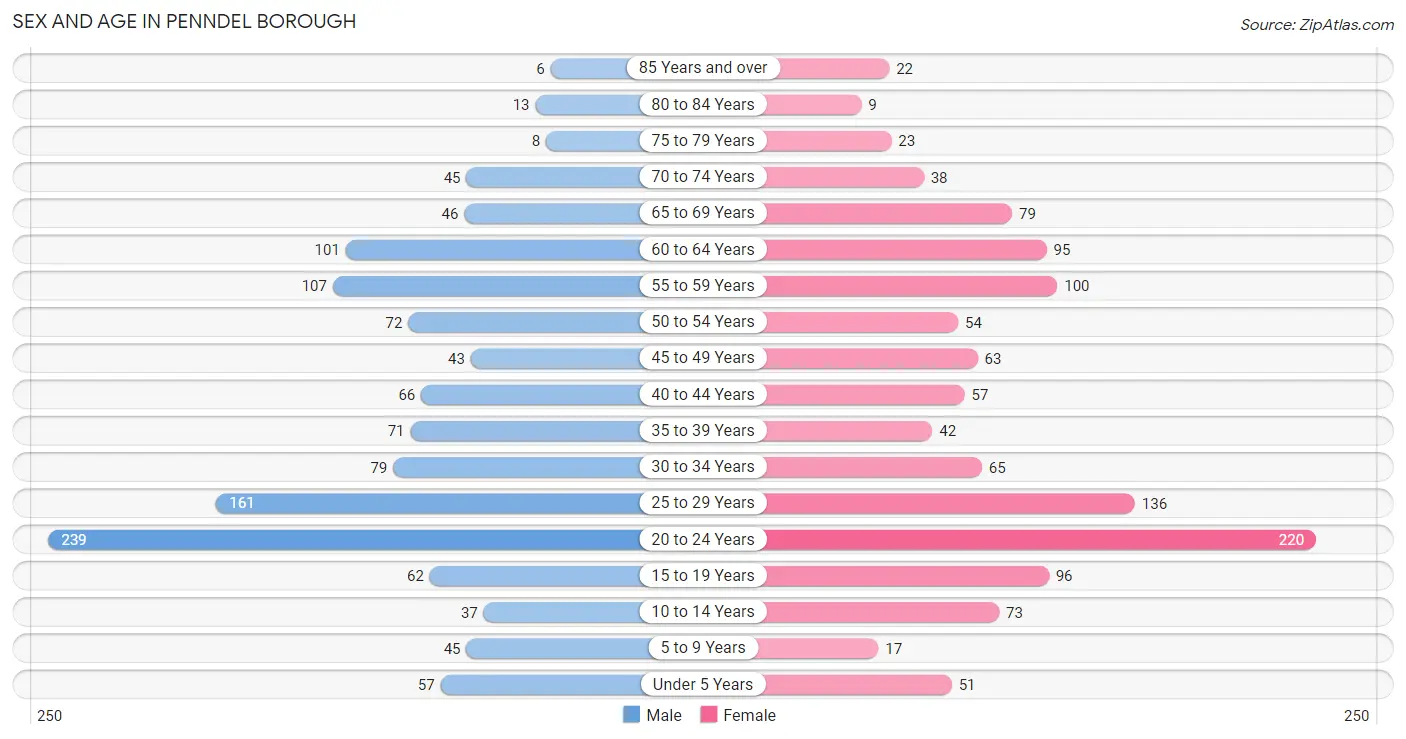
Sex and Age in Penndel borough
Sex and Age in Penndel borough
The most populous age groups in Penndel borough are 20 to 24 Years (239 | 19.0%) for men and 20 to 24 Years (220 | 17.7%) for women.
| Age Bracket | Male | Female |
| Under 5 Years | 57 (4.5%) | 51 (4.1%) |
| 5 to 9 Years | 45 (3.6%) | 17 (1.4%) |
| 10 to 14 Years | 37 (2.9%) | 73 (5.9%) |
| 15 to 19 Years | 62 (4.9%) | 96 (7.7%) |
| 20 to 24 Years | 239 (19.0%) | 220 (17.7%) |
| 25 to 29 Years | 161 (12.8%) | 136 (11.0%) |
| 30 to 34 Years | 79 (6.3%) | 65 (5.2%) |
| 35 to 39 Years | 71 (5.6%) | 42 (3.4%) |
| 40 to 44 Years | 66 (5.2%) | 57 (4.6%) |
| 45 to 49 Years | 43 (3.4%) | 63 (5.1%) |
| 50 to 54 Years | 72 (5.7%) | 54 (4.3%) |
| 55 to 59 Years | 107 (8.5%) | 100 (8.1%) |
| 60 to 64 Years | 101 (8.0%) | 95 (7.7%) |
| 65 to 69 Years | 46 (3.7%) | 79 (6.4%) |
| 70 to 74 Years | 45 (3.6%) | 38 (3.1%) |
| 75 to 79 Years | 8 (0.6%) | 23 (1.8%) |
| 80 to 84 Years | 13 (1.0%) | 9 (0.7%) |
| 85 Years and over | 6 (0.5%) | 22 (1.8%) |
| Total | 1,258 (100.0%) | 1,240 (100.0%) |
Families and Households in Penndel borough
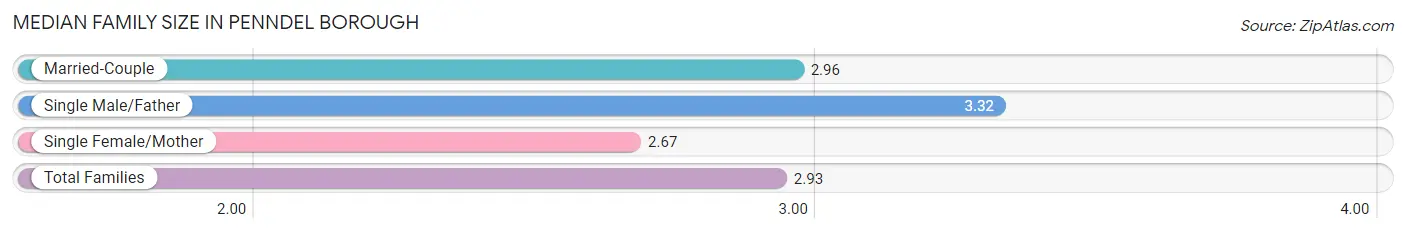
Median Family Size in Penndel borough
The median family size in Penndel borough is 2.93 persons per family, with single male/father families (78 | 13.5%) accounting for the largest median family size of 3.32 persons per family. On the other hand, single female/mother families (157 | 27.3%) represent the smallest median family size with 2.67 persons per family.
| Family Type | # Families | Family Size |
| Married-Couple | 341 (59.2%) | 2.96 |
| Single Male/Father | 78 (13.5%) | 3.32 |
| Single Female/Mother | 157 (27.3%) | 2.67 |
| Total Families | 576 (100.0%) | 2.93 |
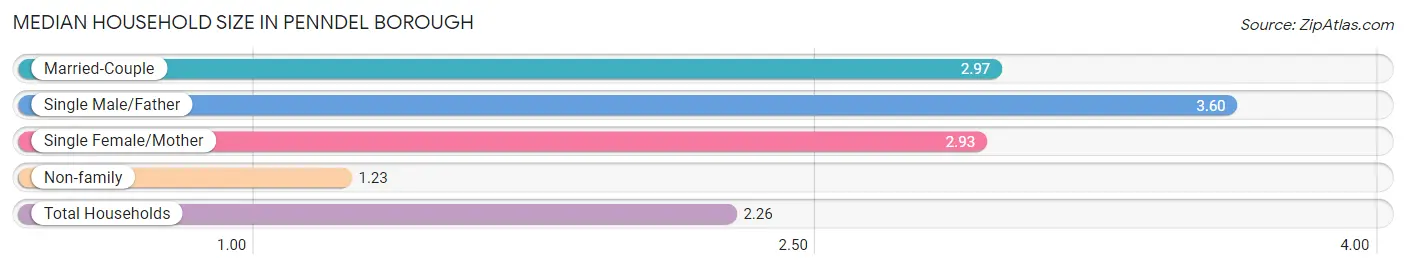
Median Household Size in Penndel borough
The median household size in Penndel borough is 2.26 persons per household, with single male/father households (78 | 7.7%) accounting for the largest median household size of 3.6 persons per household. non-family households (439 | 43.2%) represent the smallest median household size with 1.23 persons per household.
| Household Type | # Households | Household Size |
| Married-Couple | 341 (33.6%) | 2.97 |
| Single Male/Father | 78 (7.7%) | 3.60 |
| Single Female/Mother | 157 (15.5%) | 2.93 |
| Non-family | 439 (43.2%) | 1.23 |
| Total Households | 1,015 (100.0%) | 2.26 |
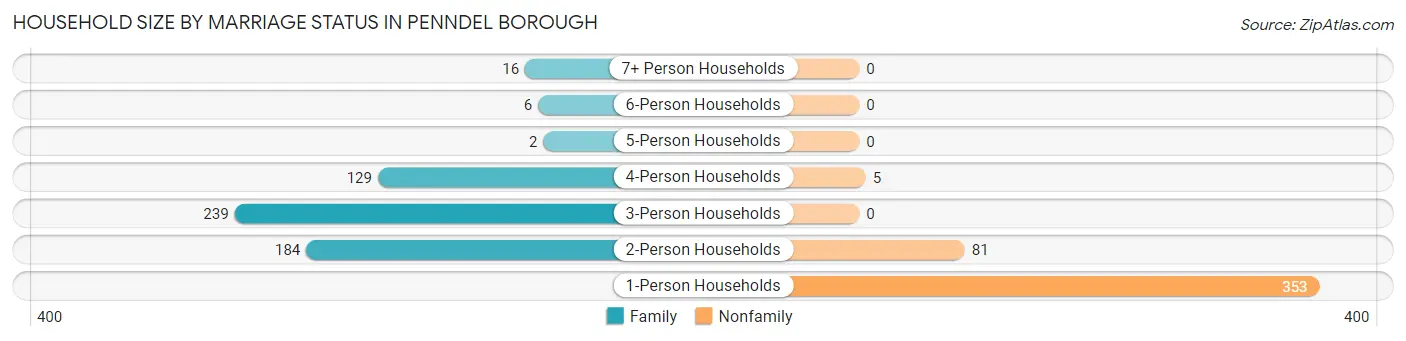
Household Size by Marriage Status in Penndel borough
Out of a total of 1,015 households in Penndel borough, 576 (56.8%) are family households, while 439 (43.2%) are nonfamily households. The most numerous type of family households are 3-person households, comprising 239, and the most common type of nonfamily households are 1-person households, comprising 353.
| Household Size | Family Households | Nonfamily Households |
| 1-Person Households | - | 353 (34.8%) |
| 2-Person Households | 184 (18.1%) | 81 (8.0%) |
| 3-Person Households | 239 (23.5%) | 0 (0.0%) |
| 4-Person Households | 129 (12.7%) | 5 (0.5%) |
| 5-Person Households | 2 (0.2%) | 0 (0.0%) |
| 6-Person Households | 6 (0.6%) | 0 (0.0%) |
| 7+ Person Households | 16 (1.6%) | 0 (0.0%) |
| Total | 576 (56.8%) | 439 (43.2%) |
Female Fertility in Penndel borough
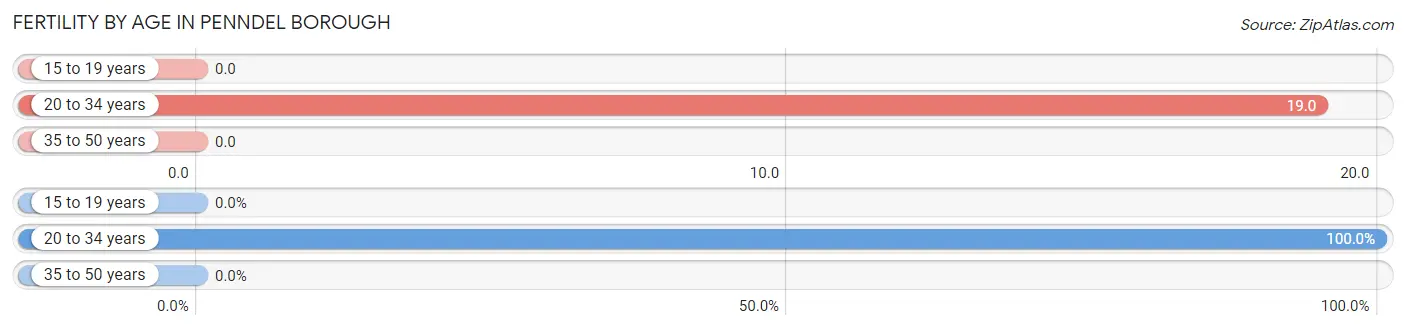
Fertility by Age in Penndel borough
Average fertility rate in Penndel borough is 11.0 births per 1,000 women. Women in the age bracket of 20 to 34 years have the highest fertility rate with 19.0 births per 1,000 women. Women in the age bracket of 20 to 34 years acount for 100.0% of all women with births.
| Age Bracket | Women with Births | Births / 1,000 Women |
| 15 to 19 years | 0 (0.0%) | 0.0 |
| 20 to 34 years | 8 (100.0%) | 19.0 |
| 35 to 50 years | 0 (0.0%) | 0.0 |
| Total | 8 (100.0%) | 11.0 |
Fertility by Age by Marriage Status in Penndel borough
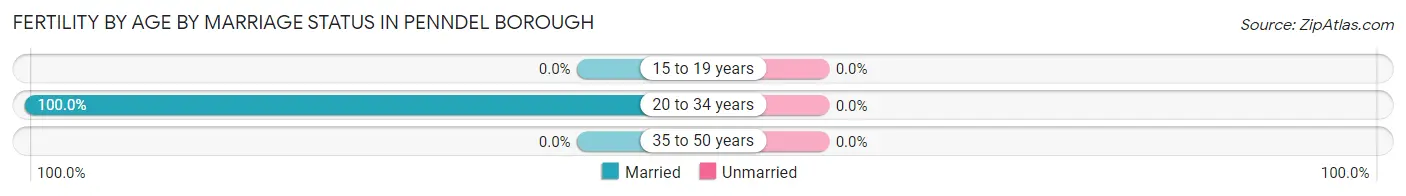
| Age Bracket | Married | Unmarried |
| 15 to 19 years | 0 (0.0%) | 0 (0.0%) |
| 20 to 34 years | 8 (100.0%) | 0 (0.0%) |
| 35 to 50 years | 0 (0.0%) | 0 (0.0%) |
| Total | 8 (100.0%) | 0 (0.0%) |
Fertility by Education in Penndel borough
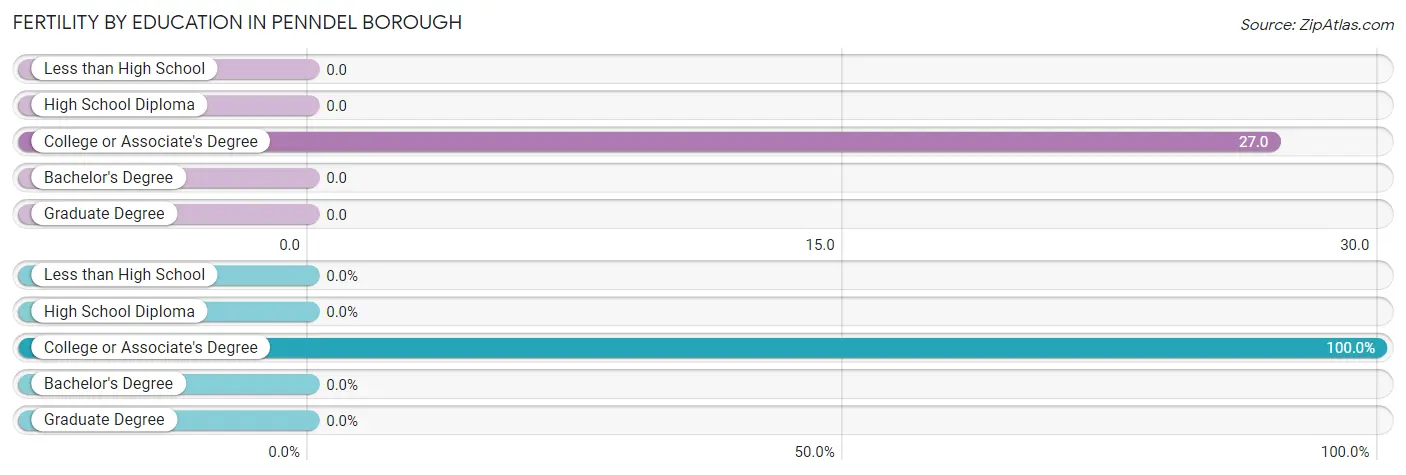
| Educational Attainment | Women with Births | Births / 1,000 Women |
| Less than High School | 0 (0.0%) | 0.0 |
| High School Diploma | 0 (0.0%) | 0.0 |
| College or Associate's Degree | 8 (100.0%) | 27.0 |
| Bachelor's Degree | 0 (0.0%) | 0.0 |
| Graduate Degree | 0 (0.0%) | 0.0 |
| Total | 8 (100.0%) | 11.0 |
Fertility by Education by Marriage Status in Penndel borough
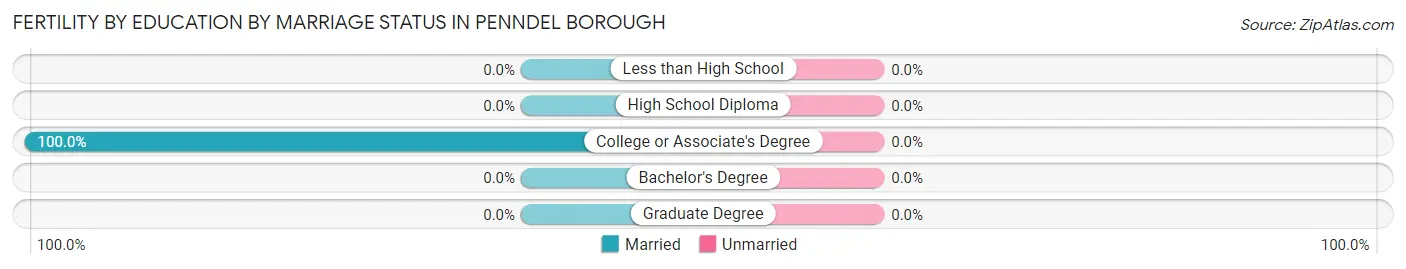
| Educational Attainment | Married | Unmarried |
| Less than High School | 0 (0.0%) | 0 (0.0%) |
| High School Diploma | 0 (0.0%) | 0 (0.0%) |
| College or Associate's Degree | 8 (100.0%) | 0 (0.0%) |
| Bachelor's Degree | 0 (0.0%) | 0 (0.0%) |
| Graduate Degree | 0 (0.0%) | 0 (0.0%) |
| Total | 8 (100.0%) | 0 (0.0%) |
Income in Penndel borough
Income Overview in Penndel borough
Per Capita Income in Penndel borough is $40,386, while median incomes of families and households are $109,214 and $77,708 respectively.
| Characteristic | Number | Measure |
| Per Capita Income | 2,498 | $40,386 |
| Median Family Income | 576 | $109,214 |
| Mean Family Income | 576 | $114,145 |
| Median Household Income | 1,015 | $77,708 |
| Mean Household Income | 1,015 | $96,981 |
| Income Deficit | 576 | $0 |
| Wage / Income Gap (%) | 2,498 | 45.09% |
| Wage / Income Gap ($) | 2,498 | 54.91¢ per $1 |
| Gini / Inequality Index | 2,498 | 0.46 |
Earnings by Sex in Penndel borough
Average Earnings in Penndel borough are $45,496, $59,063 for men and $32,434 for women, a difference of 45.1%.
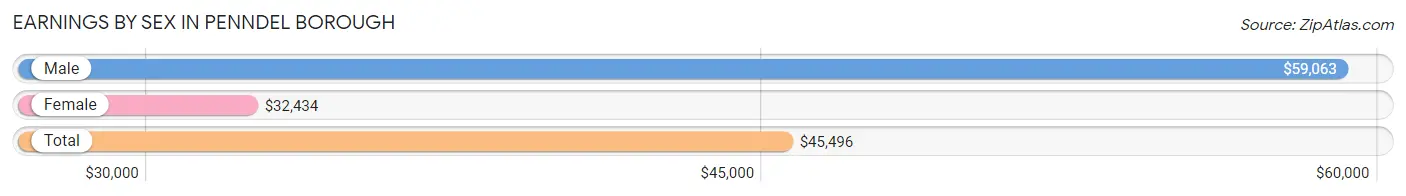
| Sex | Number | Average Earnings |
| Male | 826 (51.4%) | $59,063 |
| Female | 781 (48.6%) | $32,434 |
| Total | 1,607 (100.0%) | $45,496 |
Earnings by Sex by Income Bracket in Penndel borough
The most common earnings brackets in Penndel borough are $100,000+ for men (179 | 21.7%) and $55,000 to $64,999 for women (92 | 11.8%).
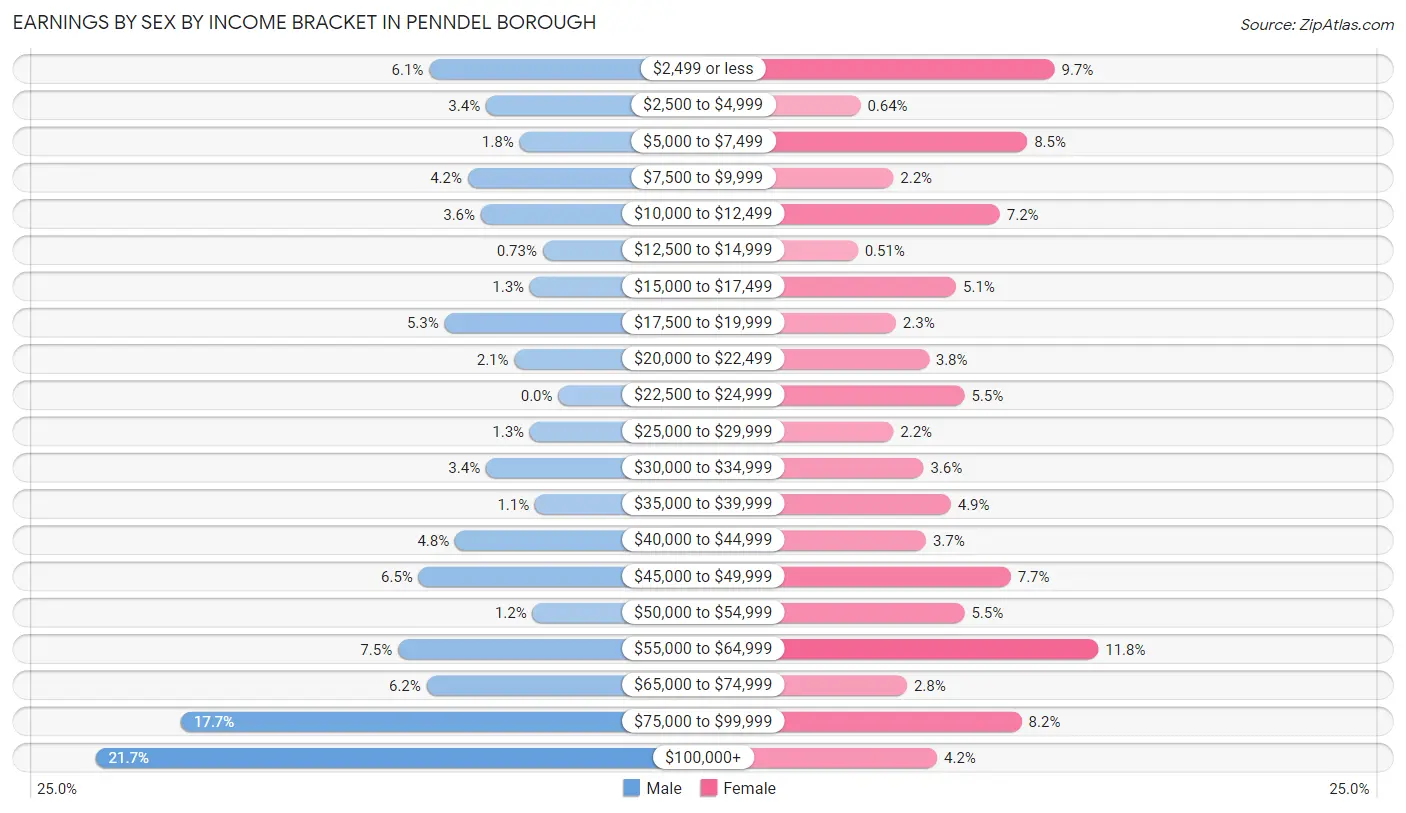
| Income | Male | Female |
| $2,499 or less | 50 (6.0%) | 76 (9.7%) |
| $2,500 to $4,999 | 28 (3.4%) | 5 (0.6%) |
| $5,000 to $7,499 | 15 (1.8%) | 66 (8.5%) |
| $7,500 to $9,999 | 35 (4.2%) | 17 (2.2%) |
| $10,000 to $12,499 | 30 (3.6%) | 56 (7.2%) |
| $12,500 to $14,999 | 6 (0.7%) | 4 (0.5%) |
| $15,000 to $17,499 | 11 (1.3%) | 40 (5.1%) |
| $17,500 to $19,999 | 44 (5.3%) | 18 (2.3%) |
| $20,000 to $22,499 | 17 (2.1%) | 30 (3.8%) |
| $22,500 to $24,999 | 0 (0.0%) | 43 (5.5%) |
| $25,000 to $29,999 | 11 (1.3%) | 17 (2.2%) |
| $30,000 to $34,999 | 28 (3.4%) | 28 (3.6%) |
| $35,000 to $39,999 | 9 (1.1%) | 38 (4.9%) |
| $40,000 to $44,999 | 40 (4.8%) | 29 (3.7%) |
| $45,000 to $49,999 | 54 (6.5%) | 60 (7.7%) |
| $50,000 to $54,999 | 10 (1.2%) | 43 (5.5%) |
| $55,000 to $64,999 | 62 (7.5%) | 92 (11.8%) |
| $65,000 to $74,999 | 51 (6.2%) | 22 (2.8%) |
| $75,000 to $99,999 | 146 (17.7%) | 64 (8.2%) |
| $100,000+ | 179 (21.7%) | 33 (4.2%) |
| Total | 826 (100.0%) | 781 (100.0%) |
Earnings by Sex by Educational Attainment in Penndel borough
Average earnings in Penndel borough are $71,806 for men and $48,444 for women, a difference of 32.5%. Men with an educational attainment of bachelor's degree enjoy the highest average annual earnings of $81,563, while those with high school diploma education earn the least with $68,889. Women with an educational attainment of graduate degree earn the most with the average annual earnings of $75,625, while those with high school diploma education have the smallest earnings of $29,375.
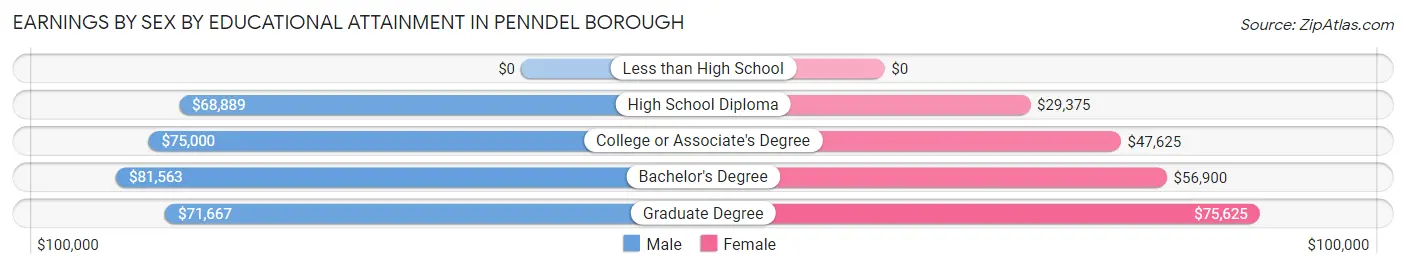
| Educational Attainment | Male Income | Female Income |
| Less than High School | - | - |
| High School Diploma | $68,889 | $29,375 |
| College or Associate's Degree | $75,000 | $47,625 |
| Bachelor's Degree | $81,563 | $56,900 |
| Graduate Degree | $71,667 | $75,625 |
| Total | $71,806 | $48,444 |
Family Income in Penndel borough
Family Income Brackets in Penndel borough
According to the Penndel borough family income data, there are 153 families falling into the $150,000 to $199,999 income range, which is the most common income bracket and makes up 26.6% of all families.
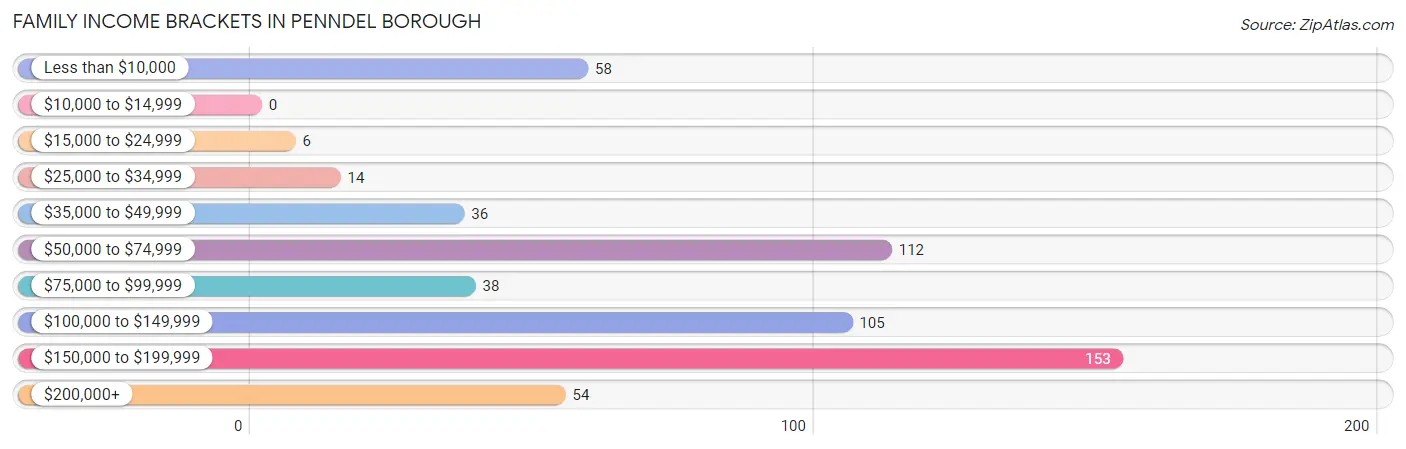
| Income Bracket | # Families | % Families |
| Less than $10,000 | 58 | 10.1% |
| $10,000 to $14,999 | 0 | 0.0% |
| $15,000 to $24,999 | 6 | 1.0% |
| $25,000 to $34,999 | 14 | 2.4% |
| $35,000 to $49,999 | 36 | 6.3% |
| $50,000 to $74,999 | 112 | 19.4% |
| $75,000 to $99,999 | 38 | 6.6% |
| $100,000 to $149,999 | 105 | 18.2% |
| $150,000 to $199,999 | 153 | 26.6% |
| $200,000+ | 54 | 9.4% |
Family Income by Famaliy Size in Penndel borough
3-person families (198 | 34.4%) account for the highest median family income in Penndel borough with $109,063 per family, while 2-person families (235 | 40.8%) have the highest median income of $48,594 per family member.
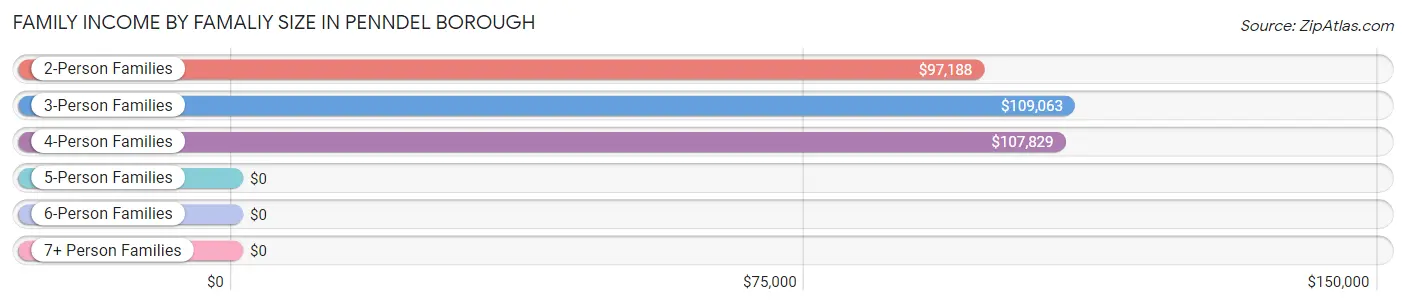
| Income Bracket | # Families | Median Income |
| 2-Person Families | 235 (40.8%) | $97,188 |
| 3-Person Families | 198 (34.4%) | $109,063 |
| 4-Person Families | 119 (20.7%) | $107,829 |
| 5-Person Families | 2 (0.4%) | $0 |
| 6-Person Families | 6 (1.0%) | $0 |
| 7+ Person Families | 16 (2.8%) | $0 |
| Total | 576 (100.0%) | $109,214 |
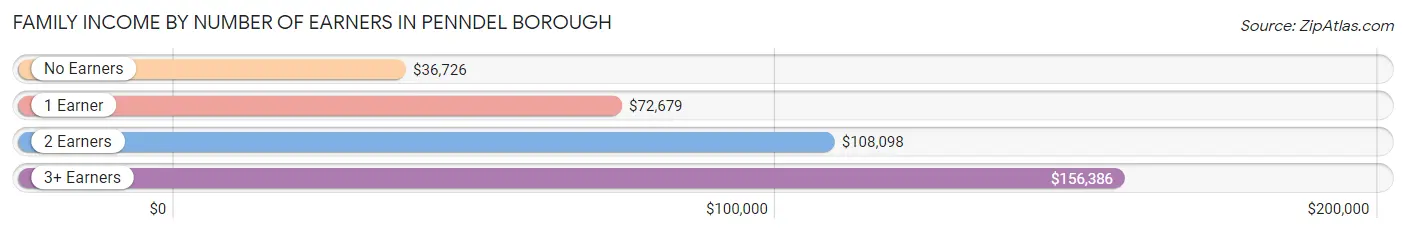
Family Income by Number of Earners in Penndel borough
The median family income in Penndel borough is $109,214, with families comprising 3+ earners (131) having the highest median family income of $156,386, while families with no earners (29) have the lowest median family income of $36,726, accounting for 22.7% and 5.0% of families, respectively.
| Number of Earners | # Families | Median Income |
| No Earners | 29 (5.0%) | $36,726 |
| 1 Earner | 219 (38.0%) | $72,679 |
| 2 Earners | 197 (34.2%) | $108,098 |
| 3+ Earners | 131 (22.7%) | $156,386 |
| Total | 576 (100.0%) | $109,214 |
Household Income in Penndel borough
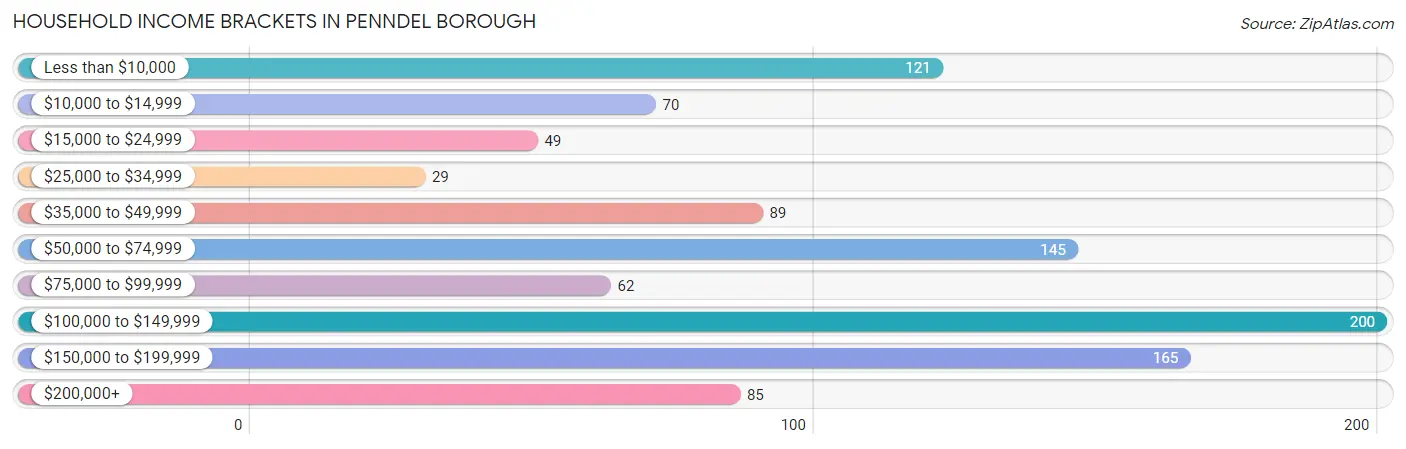
Household Income Brackets in Penndel borough
With 200 households falling in the category, the $100,000 to $149,999 income range is the most frequent in Penndel borough, accounting for 19.7% of all households. In contrast, only 29 households (2.9%) fall into the $25,000 to $34,999 income bracket, making it the least populous group.
| Income Bracket | # Households | % Households |
| Less than $10,000 | 121 | 11.9% |
| $10,000 to $14,999 | 70 | 6.9% |
| $15,000 to $24,999 | 49 | 4.8% |
| $25,000 to $34,999 | 29 | 2.9% |
| $35,000 to $49,999 | 89 | 8.8% |
| $50,000 to $74,999 | 145 | 14.3% |
| $75,000 to $99,999 | 62 | 6.1% |
| $100,000 to $149,999 | 200 | 19.7% |
| $150,000 to $199,999 | 165 | 16.3% |
| $200,000+ | 85 | 8.4% |
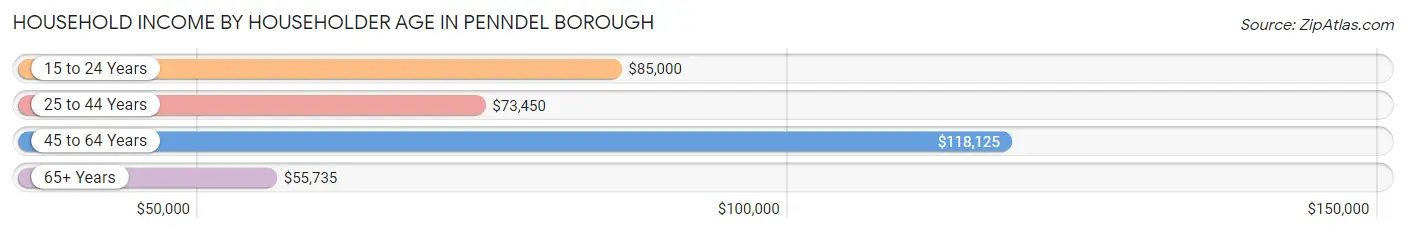
Household Income by Householder Age in Penndel borough
The median household income in Penndel borough is $77,708, with the highest median household income of $118,125 found in the 45 to 64 years age bracket for the primary householder. A total of 368 households (36.3%) fall into this category. Meanwhile, the 65+ years age bracket for the primary householder has the lowest median household income of $55,735, with 202 households (19.9%) in this group.
| Income Bracket | # Households | Median Income |
| 15 to 24 Years | 48 (4.7%) | $85,000 |
| 25 to 44 Years | 397 (39.1%) | $73,450 |
| 45 to 64 Years | 368 (36.3%) | $118,125 |
| 65+ Years | 202 (19.9%) | $55,735 |
| Total | 1,015 (100.0%) | $77,708 |
Poverty in Penndel borough
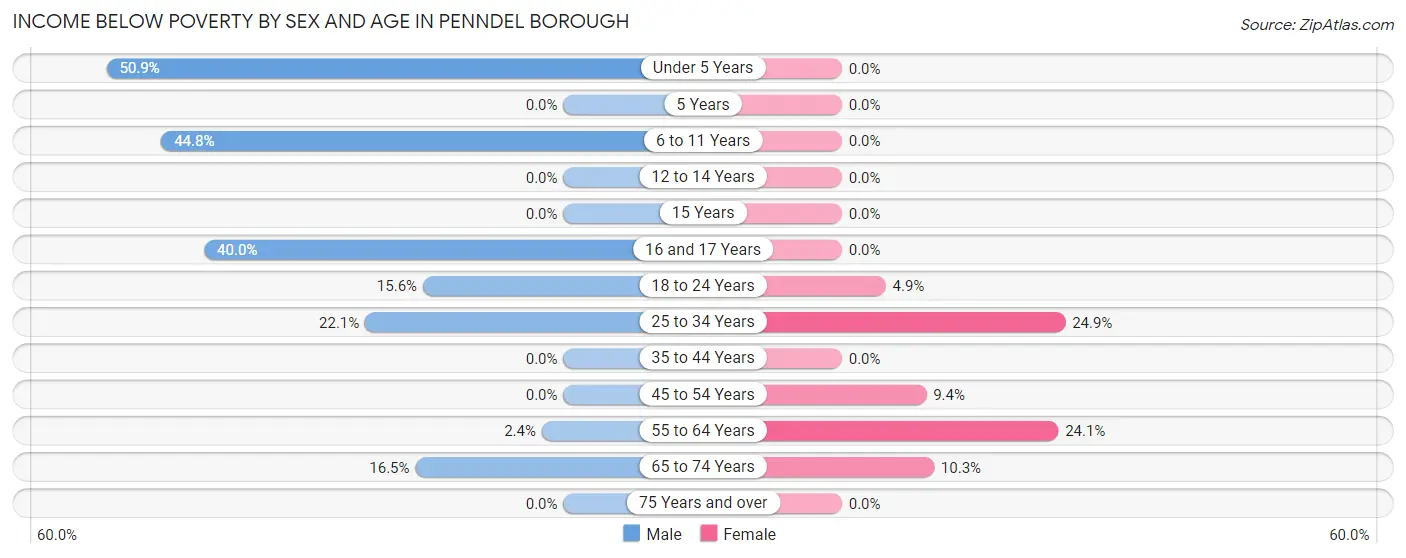
Income Below Poverty by Sex and Age in Penndel borough
With 14.2% poverty level for males and 11.2% for females among the residents of Penndel borough, under 5 year old males and 25 to 34 year old females are the most vulnerable to poverty, with 29 males (50.9%) and 50 females (24.9%) in their respective age groups living below the poverty level.
| Age Bracket | Male | Female |
| Under 5 Years | 29 (50.9%) | 0 (0.0%) |
| 5 Years | 0 (0.0%) | 0 (0.0%) |
| 6 to 11 Years | 30 (44.8%) | 0 (0.0%) |
| 12 to 14 Years | 0 (0.0%) | 0 (0.0%) |
| 15 Years | 0 (0.0%) | 0 (0.0%) |
| 16 and 17 Years | 4 (40.0%) | 0 (0.0%) |
| 18 to 24 Years | 28 (15.6%) | 8 (4.9%) |
| 25 to 34 Years | 53 (22.1%) | 50 (24.9%) |
| 35 to 44 Years | 0 (0.0%) | 0 (0.0%) |
| 45 to 54 Years | 0 (0.0%) | 11 (9.4%) |
| 55 to 64 Years | 5 (2.4%) | 47 (24.1%) |
| 65 to 74 Years | 15 (16.5%) | 12 (10.3%) |
| 75 Years and over | 0 (0.0%) | 0 (0.0%) |
| Total | 164 (14.2%) | 128 (11.2%) |
Income Above Poverty by Sex and Age in Penndel borough
According to the poverty statistics in Penndel borough, males aged 5 years and females aged under 5 years are the age groups that are most secure financially, with 100.0% of males and 100.0% of females in these age groups living above the poverty line.
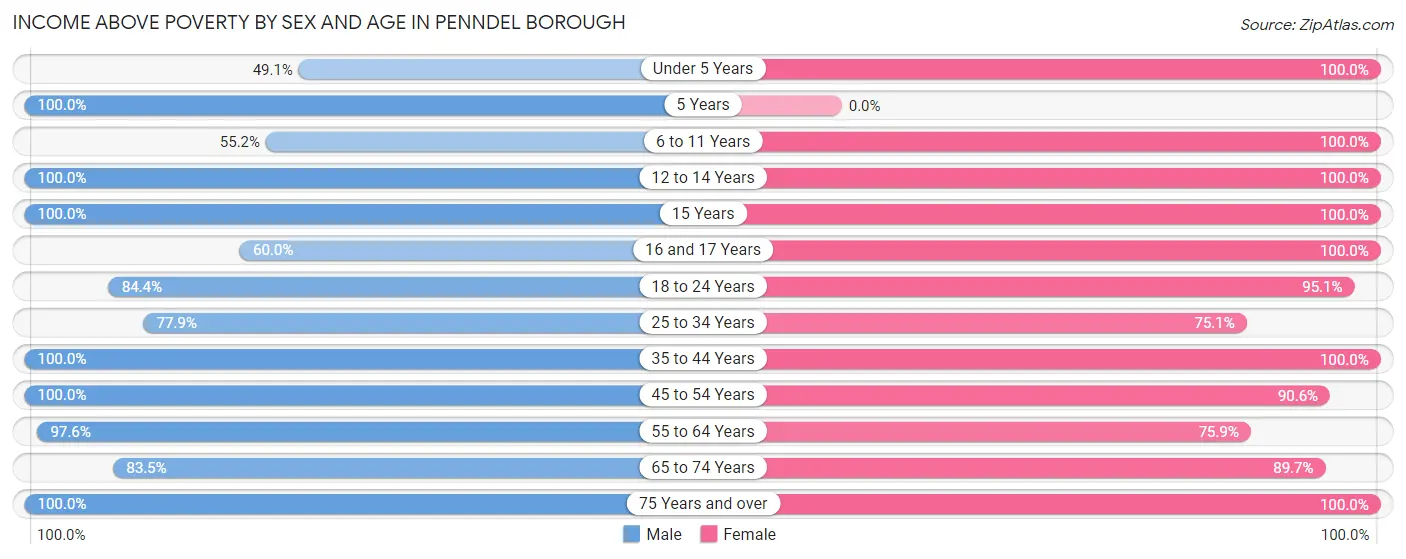
| Age Bracket | Male | Female |
| Under 5 Years | 28 (49.1%) | 51 (100.0%) |
| 5 Years | 5 (100.0%) | 0 (0.0%) |
| 6 to 11 Years | 37 (55.2%) | 41 (100.0%) |
| 12 to 14 Years | 10 (100.0%) | 49 (100.0%) |
| 15 Years | 8 (100.0%) | 43 (100.0%) |
| 16 and 17 Years | 6 (60.0%) | 10 (100.0%) |
| 18 to 24 Years | 151 (84.4%) | 156 (95.1%) |
| 25 to 34 Years | 187 (77.9%) | 151 (75.1%) |
| 35 to 44 Years | 137 (100.0%) | 99 (100.0%) |
| 45 to 54 Years | 115 (100.0%) | 106 (90.6%) |
| 55 to 64 Years | 203 (97.6%) | 148 (75.9%) |
| 65 to 74 Years | 76 (83.5%) | 105 (89.7%) |
| 75 Years and over | 27 (100.0%) | 54 (100.0%) |
| Total | 990 (85.8%) | 1,013 (88.8%) |
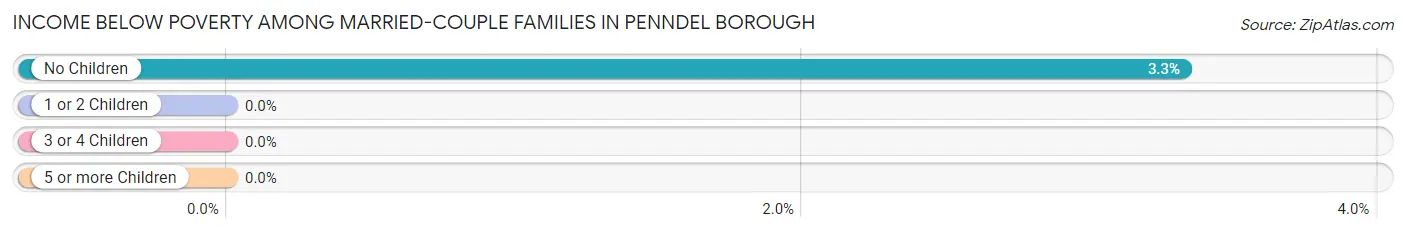
Income Below Poverty Among Married-Couple Families in Penndel borough
The poverty statistics for married-couple families in Penndel borough show that 2.4% or 8 of the total 341 families live below the poverty line. Families with no children have the highest poverty rate of 3.3%, comprising of 8 families. On the other hand, families with 1 or 2 children have the lowest poverty rate of 0.0%, which includes 0 families.
| Children | Above Poverty | Below Poverty |
| No Children | 233 (96.7%) | 8 (3.3%) |
| 1 or 2 Children | 94 (100.0%) | 0 (0.0%) |
| 3 or 4 Children | 6 (100.0%) | 0 (0.0%) |
| 5 or more Children | 0 (0.0%) | 0 (0.0%) |
| Total | 333 (97.7%) | 8 (2.4%) |
Income Below Poverty Among Single-Parent Households in Penndel borough
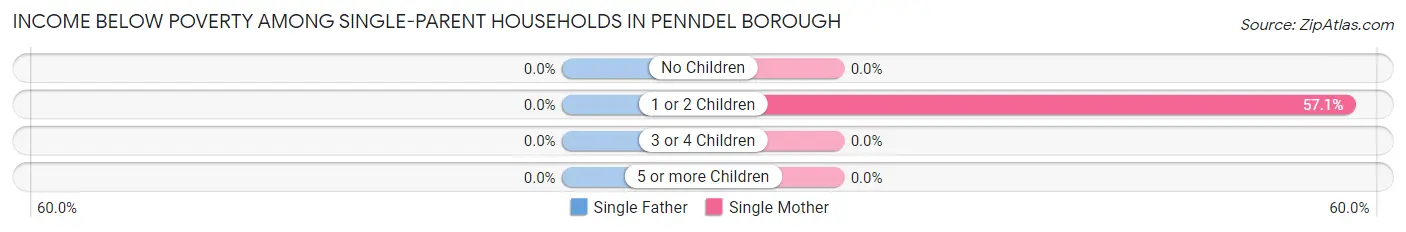
| Children | Single Father | Single Mother |
| No Children | 0 (0.0%) | 0 (0.0%) |
| 1 or 2 Children | 0 (0.0%) | 56 (57.1%) |
| 3 or 4 Children | 0 (0.0%) | 0 (0.0%) |
| 5 or more Children | 0 (0.0%) | 0 (0.0%) |
| Total | 0 (0.0%) | 56 (35.7%) |
Income Below Poverty Among Married-Couple vs Single-Parent Households in Penndel borough
The poverty data for Penndel borough shows that 8 of the married-couple family households (2.4%) and 56 of the single-parent households (23.8%) are living below the poverty level. Within the married-couple family households, those with no children have the highest poverty rate, with 8 households (3.3%) falling below the poverty line. Among the single-parent households, those with 1 or 2 children have the highest poverty rate, with 56 household (34.2%) living below poverty.
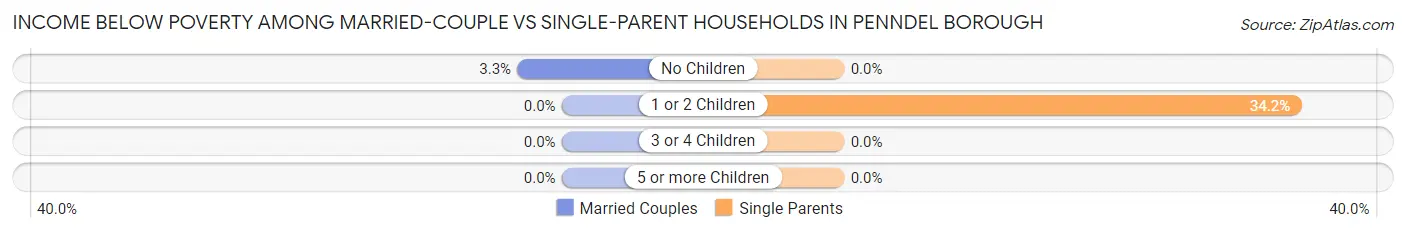
| Children | Married-Couple Families | Single-Parent Households |
| No Children | 8 (3.3%) | 0 (0.0%) |
| 1 or 2 Children | 0 (0.0%) | 56 (34.2%) |
| 3 or 4 Children | 0 (0.0%) | 0 (0.0%) |
| 5 or more Children | 0 (0.0%) | 0 (0.0%) |
| Total | 8 (2.4%) | 56 (23.8%) |
Employment Characteristics in Penndel borough
Employment by Class of Employer in Penndel borough
Among the 1,412 employed individuals in Penndel borough, private company employees (919 | 65.1%), not-for-profit organizations (143 | 10.1%), and local government employees (140 | 9.9%) make up the most common classes of employment.
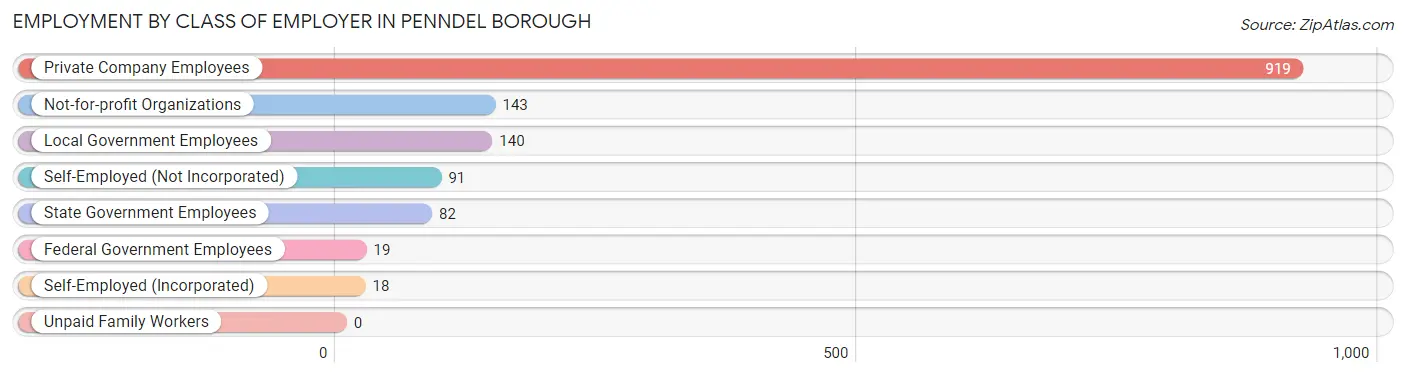
| Employer Class | # Employees | % Employees |
| Private Company Employees | 919 | 65.1% |
| Self-Employed (Incorporated) | 18 | 1.3% |
| Self-Employed (Not Incorporated) | 91 | 6.4% |
| Not-for-profit Organizations | 143 | 10.1% |
| Local Government Employees | 140 | 9.9% |
| State Government Employees | 82 | 5.8% |
| Federal Government Employees | 19 | 1.3% |
| Unpaid Family Workers | 0 | 0.0% |
| Total | 1,412 | 100.0% |
Employment Status by Age in Penndel borough
According to the labor force statistics for Penndel borough, out of the total population over 16 years of age (2,167), 69.2% or 1,500 individuals are in the labor force, with 3.5% or 53 of them unemployed. The age group with the highest labor force participation rate is 55 to 59 years, with 96.6% or 200 individuals in the labor force. Within the labor force, the 16 to 19 years age range has the highest percentage of unemployed individuals, with 71.0% or 22 of them being unemployed.
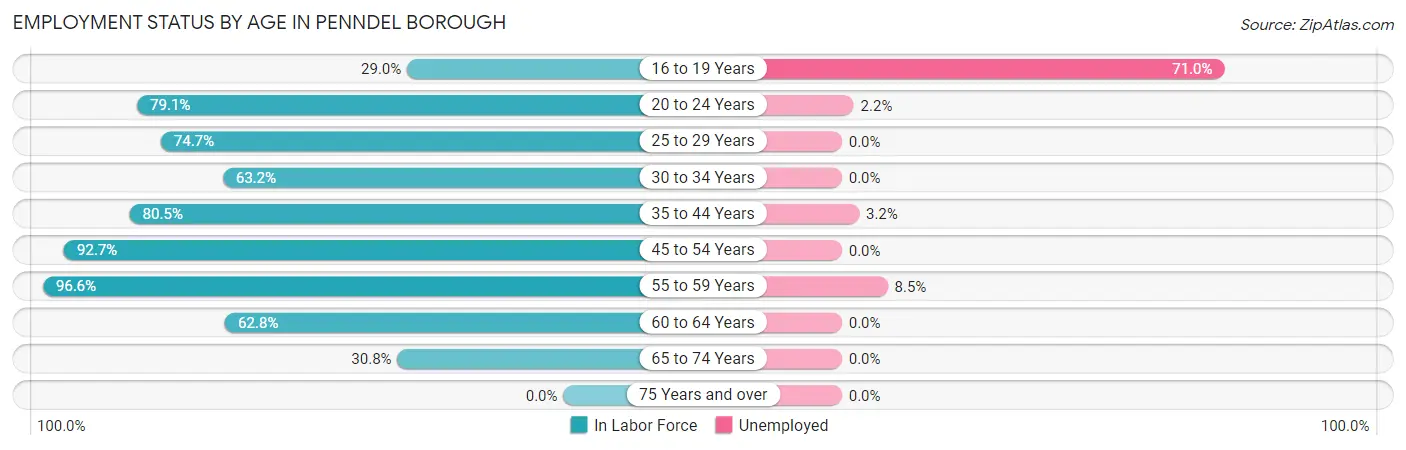
| Age Bracket | In Labor Force | Unemployed |
| 16 to 19 Years | 31 (29.0%) | 22 (71.0%) |
| 20 to 24 Years | 363 (79.1%) | 8 (2.2%) |
| 25 to 29 Years | 222 (74.7%) | 0 (0.0%) |
| 30 to 34 Years | 91 (63.2%) | 0 (0.0%) |
| 35 to 44 Years | 190 (80.5%) | 6 (3.2%) |
| 45 to 54 Years | 215 (92.7%) | 0 (0.0%) |
| 55 to 59 Years | 200 (96.6%) | 17 (8.5%) |
| 60 to 64 Years | 123 (62.8%) | 0 (0.0%) |
| 65 to 74 Years | 64 (30.8%) | 0 (0.0%) |
| 75 Years and over | 0 (0.0%) | 0 (0.0%) |
| Total | 1,500 (69.2%) | 52 (3.5%) |
Employment Status by Educational Attainment in Penndel borough
According to labor force statistics for Penndel borough, 79.3% of individuals (1,040) out of the total population between 25 and 64 years of age (1,312) are in the labor force, with 2.2% or 23 of them being unemployed. The group with the highest labor force participation rate are those with the educational attainment of bachelor's degree or higher, with 88.9% or 400 individuals in the labor force. Within the labor force, individuals with college / associate degree education have the highest percentage of unemployment, with 5.1% or 17 of them being unemployed.
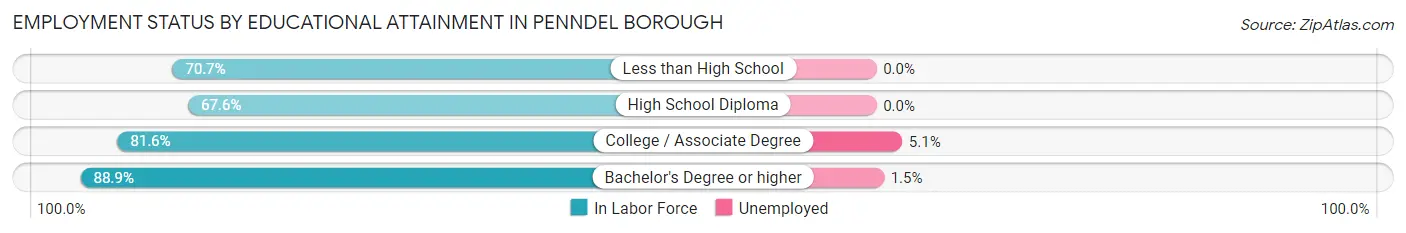
| Educational Attainment | In Labor Force | Unemployed |
| Less than High School | 29 (70.7%) | 0 (0.0%) |
| High School Diploma | 279 (67.6%) | 0 (0.0%) |
| College / Associate Degree | 333 (81.6%) | 21 (5.1%) |
| Bachelor's Degree or higher | 400 (88.9%) | 7 (1.5%) |
| Total | 1,040 (79.3%) | 29 (2.2%) |
Employment Occupations by Sex in Penndel borough
Management, Business, Science and Arts Occupations
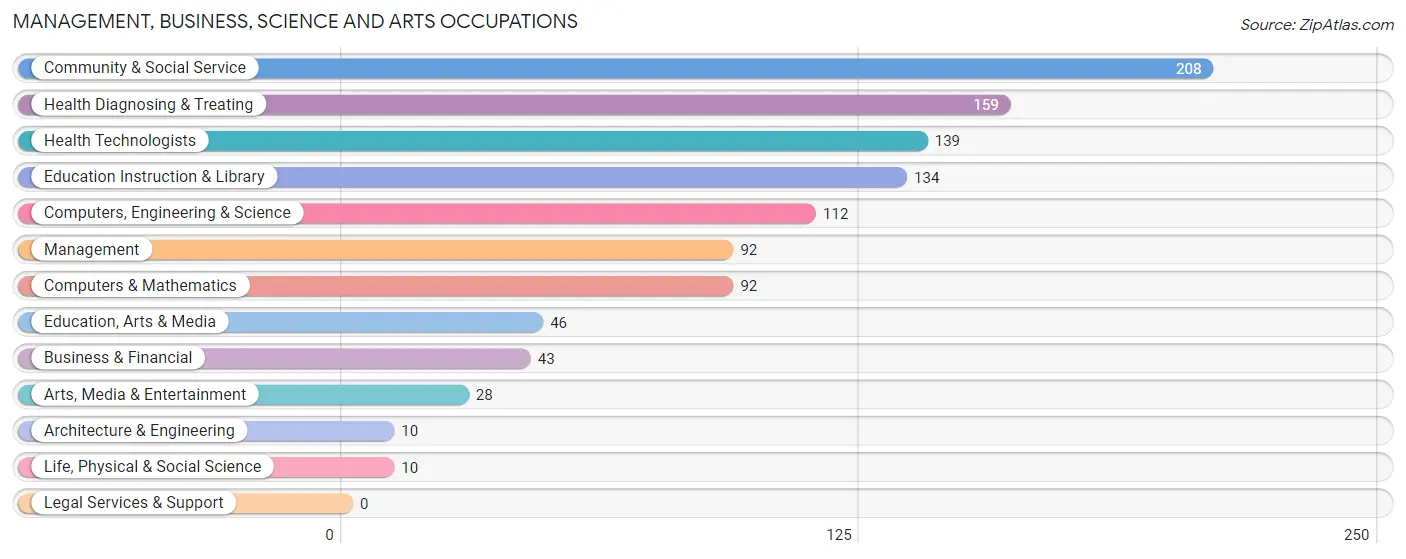
The most common Management, Business, Science and Arts occupations in Penndel borough are Community & Social Service (208 | 14.4%), Health Diagnosing & Treating (159 | 11.0%), Health Technologists (139 | 9.6%), Education Instruction & Library (134 | 9.3%), and Computers, Engineering & Science (112 | 7.7%).
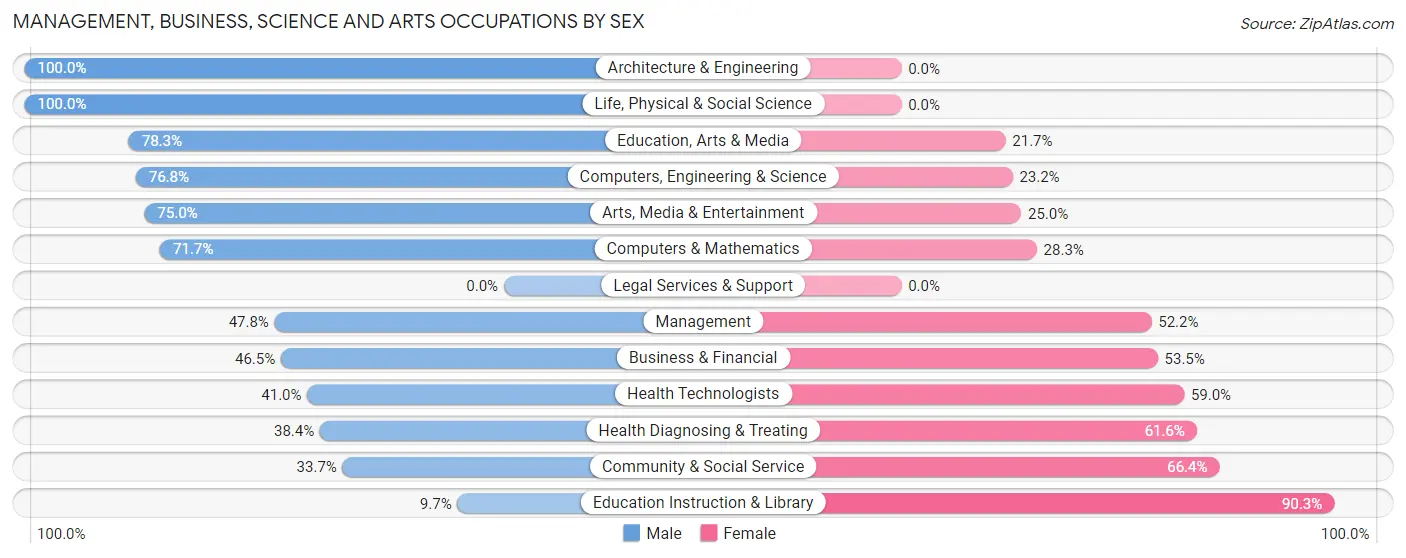
Management, Business, Science and Arts Occupations by Sex
Within the Management, Business, Science and Arts occupations in Penndel borough, the most male-oriented occupations are Architecture & Engineering (100.0%), Life, Physical & Social Science (100.0%), and Education, Arts & Media (78.3%), while the most female-oriented occupations are Education Instruction & Library (90.3%), Community & Social Service (66.3%), and Health Diagnosing & Treating (61.6%).
| Occupation | Male | Female |
| Management | 44 (47.8%) | 48 (52.2%) |
| Business & Financial | 20 (46.5%) | 23 (53.5%) |
| Computers, Engineering & Science | 86 (76.8%) | 26 (23.2%) |
| Computers & Mathematics | 66 (71.7%) | 26 (28.3%) |
| Architecture & Engineering | 10 (100.0%) | 0 (0.0%) |
| Life, Physical & Social Science | 10 (100.0%) | 0 (0.0%) |
| Community & Social Service | 70 (33.7%) | 138 (66.3%) |
| Education, Arts & Media | 36 (78.3%) | 10 (21.7%) |
| Legal Services & Support | 0 (0.0%) | 0 (0.0%) |
| Education Instruction & Library | 13 (9.7%) | 121 (90.3%) |
| Arts, Media & Entertainment | 21 (75.0%) | 7 (25.0%) |
| Health Diagnosing & Treating | 61 (38.4%) | 98 (61.6%) |
| Health Technologists | 57 (41.0%) | 82 (59.0%) |
| Total (Category) | 281 (45.8%) | 333 (54.2%) |
| Total (Overall) | 784 (54.2%) | 662 (45.8%) |
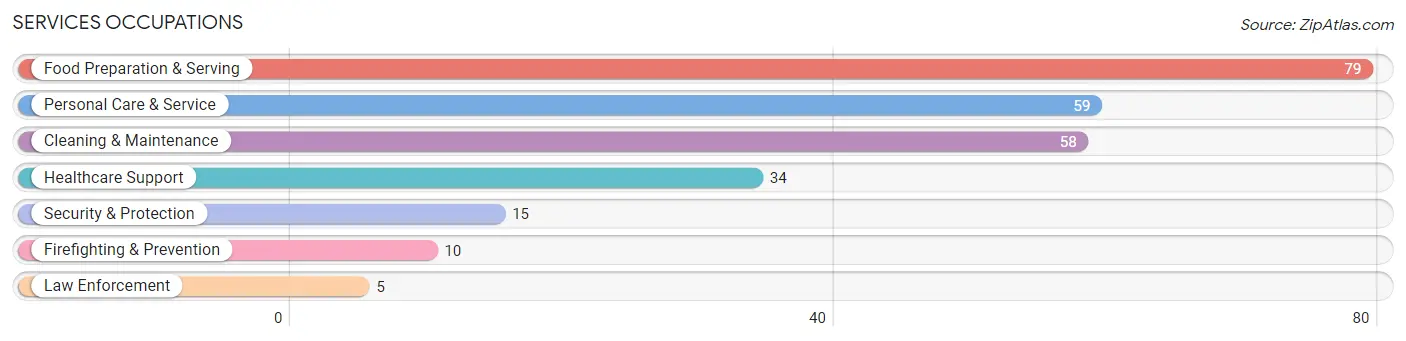
Services Occupations
The most common Services occupations in Penndel borough are Food Preparation & Serving (79 | 5.5%), Personal Care & Service (59 | 4.1%), Cleaning & Maintenance (58 | 4.0%), Healthcare Support (34 | 2.4%), and Security & Protection (15 | 1.0%).
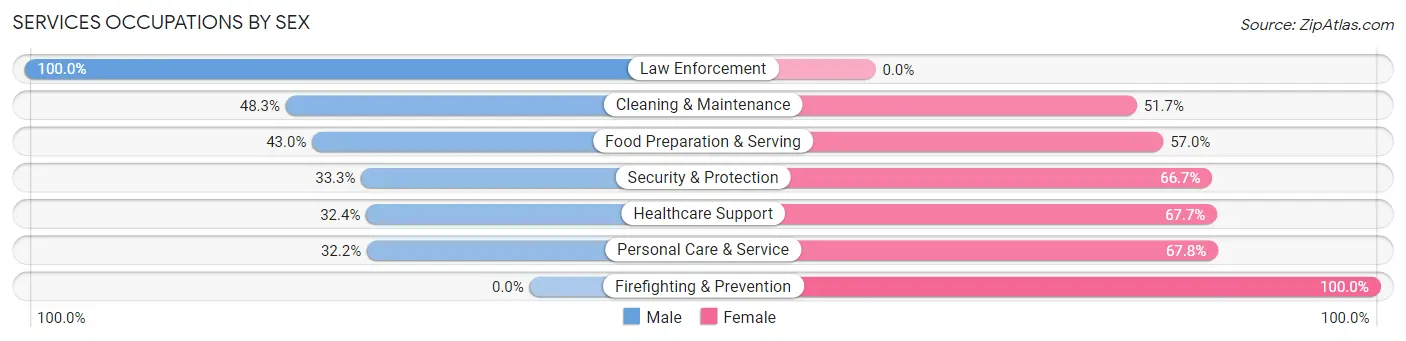
Services Occupations by Sex
Within the Services occupations in Penndel borough, the most male-oriented occupations are Law Enforcement (100.0%), Cleaning & Maintenance (48.3%), and Food Preparation & Serving (43.0%), while the most female-oriented occupations are Firefighting & Prevention (100.0%), Personal Care & Service (67.8%), and Healthcare Support (67.6%).
| Occupation | Male | Female |
| Healthcare Support | 11 (32.4%) | 23 (67.6%) |
| Security & Protection | 5 (33.3%) | 10 (66.7%) |
| Firefighting & Prevention | 0 (0.0%) | 10 (100.0%) |
| Law Enforcement | 5 (100.0%) | 0 (0.0%) |
| Food Preparation & Serving | 34 (43.0%) | 45 (57.0%) |
| Cleaning & Maintenance | 28 (48.3%) | 30 (51.7%) |
| Personal Care & Service | 19 (32.2%) | 40 (67.8%) |
| Total (Category) | 97 (39.6%) | 148 (60.4%) |
| Total (Overall) | 784 (54.2%) | 662 (45.8%) |
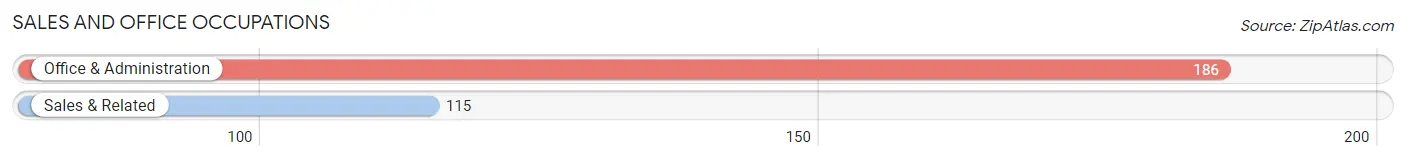
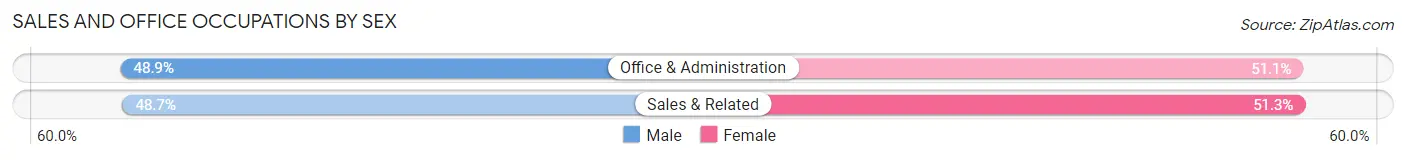
Sales and Office Occupations
The most common Sales and Office occupations in Penndel borough are Office & Administration (186 | 12.9%), and Sales & Related (115 | 8.0%).
Sales and Office Occupations by Sex
| Occupation | Male | Female |
| Sales & Related | 56 (48.7%) | 59 (51.3%) |
| Office & Administration | 91 (48.9%) | 95 (51.1%) |
| Total (Category) | 147 (48.8%) | 154 (51.2%) |
| Total (Overall) | 784 (54.2%) | 662 (45.8%) |
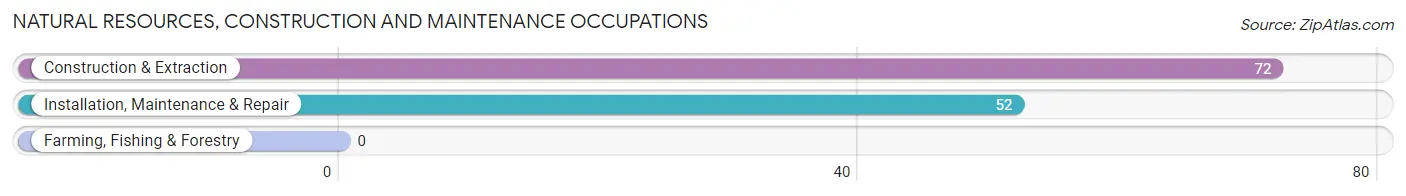
Natural Resources, Construction and Maintenance Occupations
The most common Natural Resources, Construction and Maintenance occupations in Penndel borough are Construction & Extraction (72 | 5.0%), and Installation, Maintenance & Repair (52 | 3.6%).
Natural Resources, Construction and Maintenance Occupations by Sex

| Occupation | Male | Female |
| Farming, Fishing & Forestry | 0 (0.0%) | 0 (0.0%) |
| Construction & Extraction | 72 (100.0%) | 0 (0.0%) |
| Installation, Maintenance & Repair | 52 (100.0%) | 0 (0.0%) |
| Total (Category) | 124 (100.0%) | 0 (0.0%) |
| Total (Overall) | 784 (54.2%) | 662 (45.8%) |
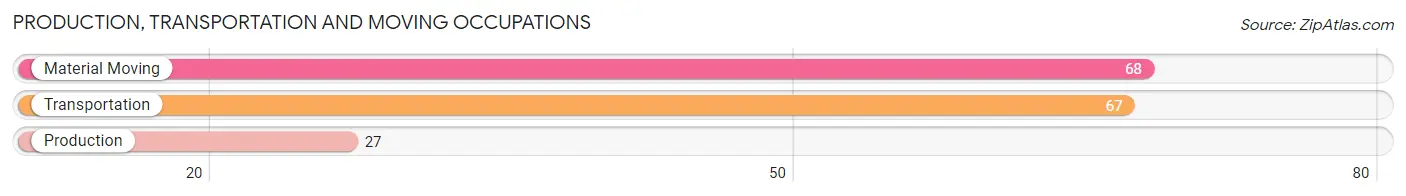
Production, Transportation and Moving Occupations
The most common Production, Transportation and Moving occupations in Penndel borough are Material Moving (68 | 4.7%), Transportation (67 | 4.6%), and Production (27 | 1.9%).
Production, Transportation and Moving Occupations by Sex
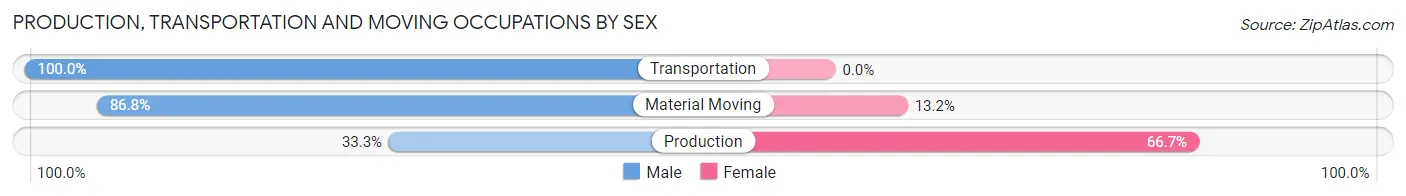
| Occupation | Male | Female |
| Production | 9 (33.3%) | 18 (66.7%) |
| Transportation | 67 (100.0%) | 0 (0.0%) |
| Material Moving | 59 (86.8%) | 9 (13.2%) |
| Total (Category) | 135 (83.3%) | 27 (16.7%) |
| Total (Overall) | 784 (54.2%) | 662 (45.8%) |
Employment Industries by Sex in Penndel borough
Employment Industries in Penndel borough
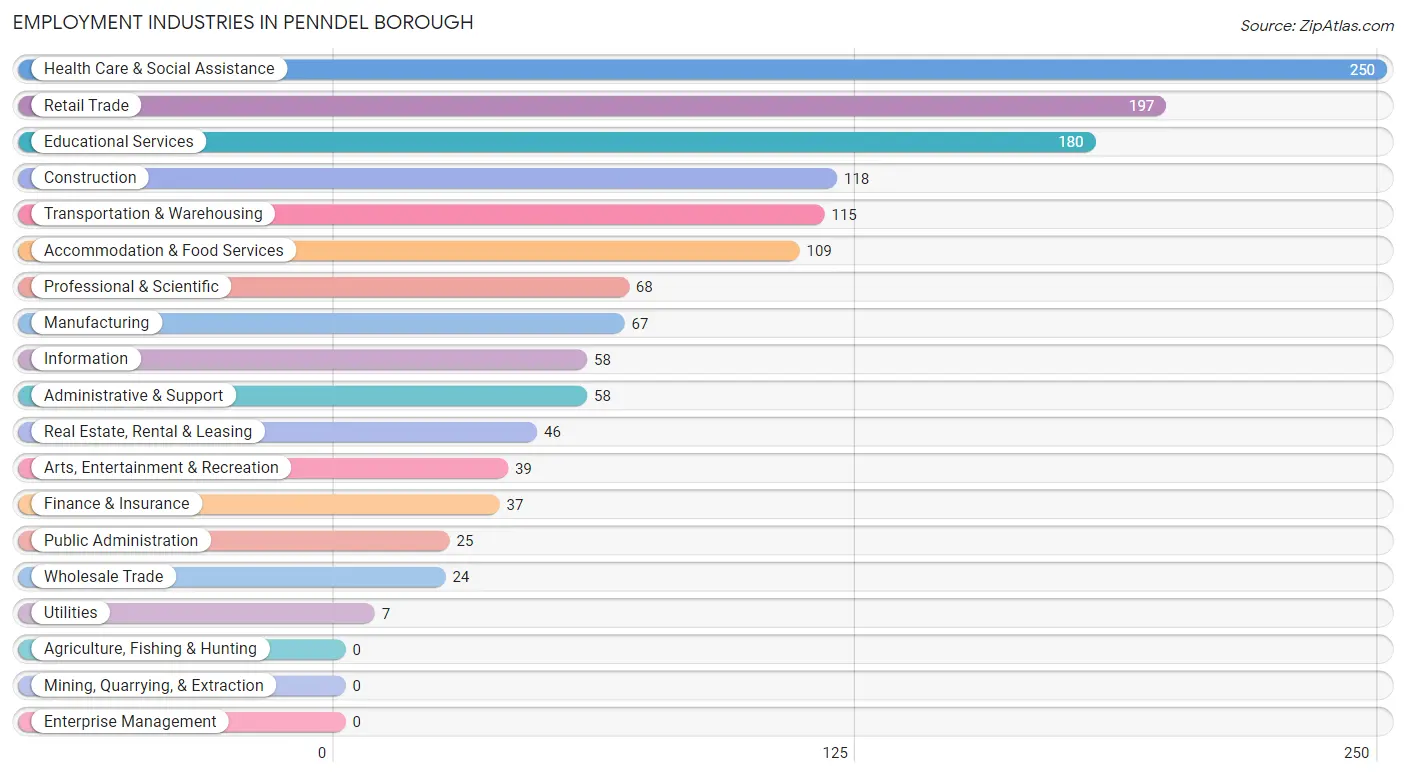
The major employment industries in Penndel borough include Health Care & Social Assistance (250 | 17.3%), Retail Trade (197 | 13.6%), Educational Services (180 | 12.4%), Construction (118 | 8.2%), and Transportation & Warehousing (115 | 8.0%).
Employment Industries by Sex in Penndel borough
The Penndel borough industries that see more men than women are Construction (100.0%), Public Administration (100.0%), and Transportation & Warehousing (98.3%), whereas the industries that tend to have a higher number of women are Information (100.0%), Arts, Entertainment & Recreation (84.6%), and Educational Services (71.1%).
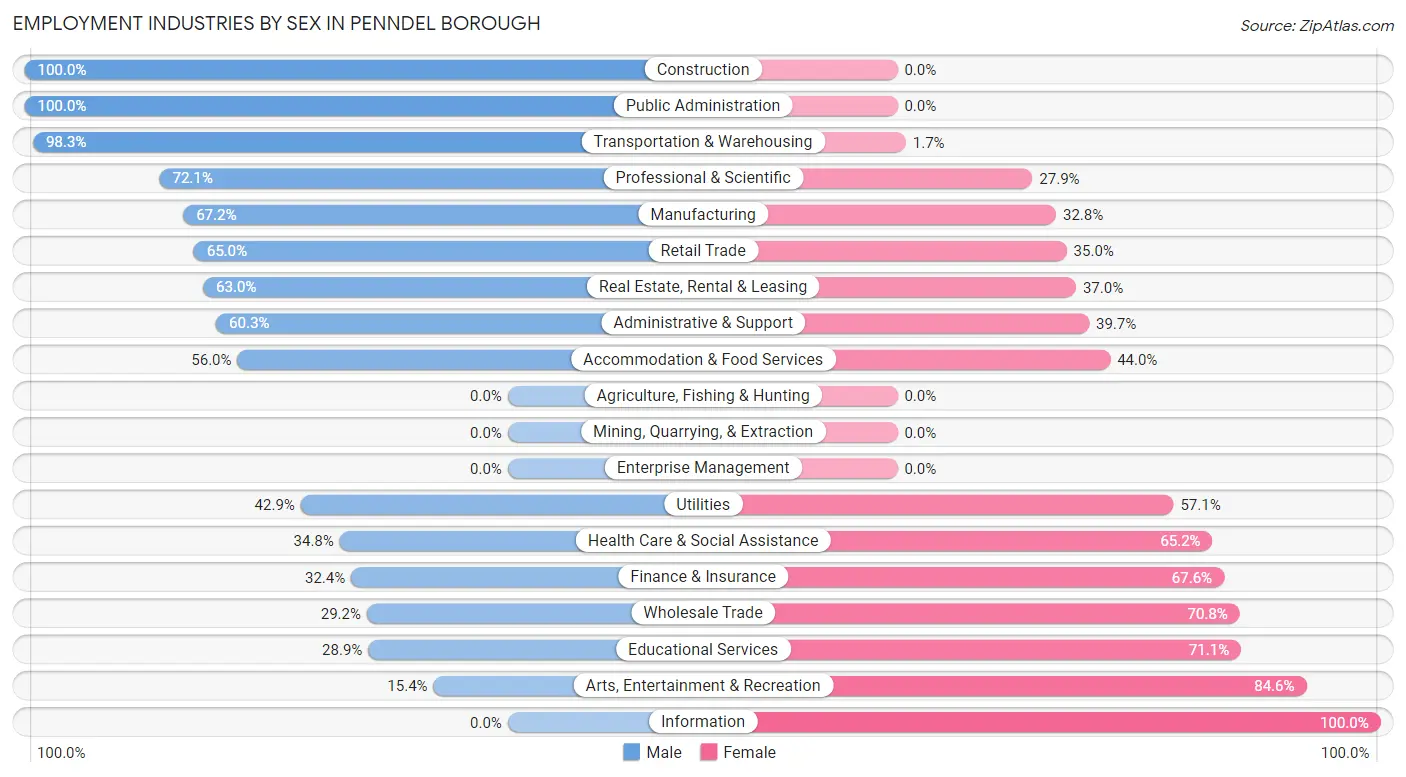
| Industry | Male | Female |
| Agriculture, Fishing & Hunting | 0 (0.0%) | 0 (0.0%) |
| Mining, Quarrying, & Extraction | 0 (0.0%) | 0 (0.0%) |
| Construction | 118 (100.0%) | 0 (0.0%) |
| Manufacturing | 45 (67.2%) | 22 (32.8%) |
| Wholesale Trade | 7 (29.2%) | 17 (70.8%) |
| Retail Trade | 128 (65.0%) | 69 (35.0%) |
| Transportation & Warehousing | 113 (98.3%) | 2 (1.7%) |
| Utilities | 3 (42.9%) | 4 (57.1%) |
| Information | 0 (0.0%) | 58 (100.0%) |
| Finance & Insurance | 12 (32.4%) | 25 (67.6%) |
| Real Estate, Rental & Leasing | 29 (63.0%) | 17 (37.0%) |
| Professional & Scientific | 49 (72.1%) | 19 (27.9%) |
| Enterprise Management | 0 (0.0%) | 0 (0.0%) |
| Administrative & Support | 35 (60.3%) | 23 (39.7%) |
| Educational Services | 52 (28.9%) | 128 (71.1%) |
| Health Care & Social Assistance | 87 (34.8%) | 163 (65.2%) |
| Arts, Entertainment & Recreation | 6 (15.4%) | 33 (84.6%) |
| Accommodation & Food Services | 61 (56.0%) | 48 (44.0%) |
| Public Administration | 25 (100.0%) | 0 (0.0%) |
| Total | 784 (54.2%) | 662 (45.8%) |
Education in Penndel borough
School Enrollment in Penndel borough
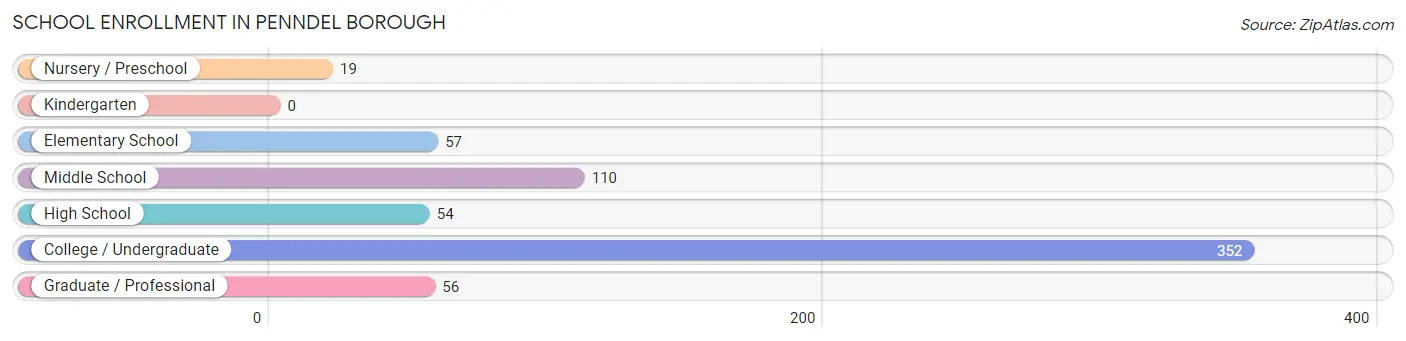
The most common levels of schooling among the 648 students in Penndel borough are college / undergraduate (352 | 54.3%), middle school (110 | 17.0%), and elementary school (57 | 8.8%).
| School Level | # Students | % Students |
| Nursery / Preschool | 19 | 2.9% |
| Kindergarten | 0 | 0.0% |
| Elementary School | 57 | 8.8% |
| Middle School | 110 | 17.0% |
| High School | 54 | 8.3% |
| College / Undergraduate | 352 | 54.3% |
| Graduate / Professional | 56 | 8.6% |
| Total | 648 | 100.0% |
School Enrollment by Age by Funding Source in Penndel borough
Out of a total of 648 students who are enrolled in schools in Penndel borough, 390 (60.2%) attend a private institution, while the remaining 258 (39.8%) are enrolled in public schools. The age group of 20 to 24 year olds has the highest likelihood of being enrolled in private schools, with 181 (85.4% in the age bracket) enrolled. Conversely, the age group of 15 to 17 year olds has the lowest likelihood of being enrolled in a private school, with 51 (100.0% in the age bracket) attending a public institution.
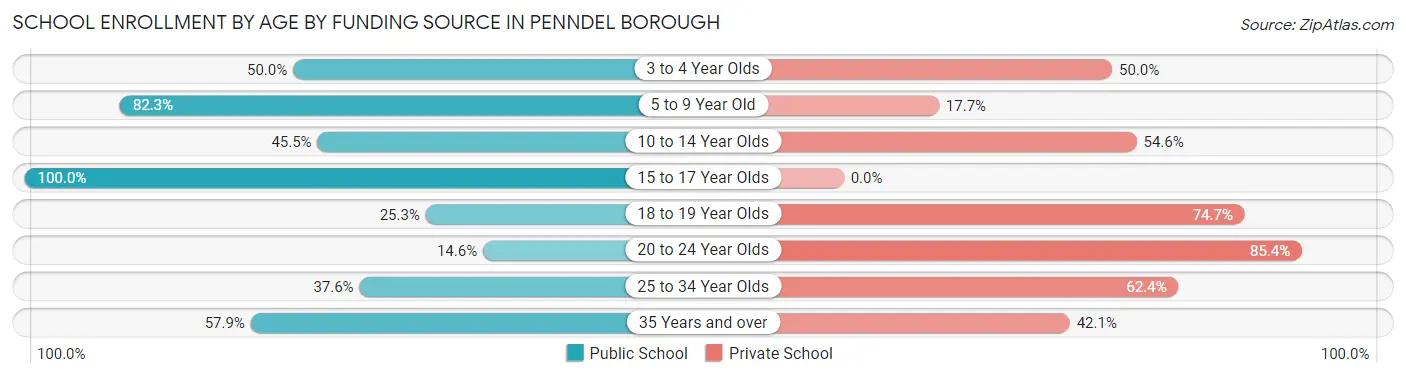
| Age Bracket | Public School | Private School |
| 3 to 4 Year Olds | 7 (50.0%) | 7 (50.0%) |
| 5 to 9 Year Old | 51 (82.3%) | 11 (17.7%) |
| 10 to 14 Year Olds | 50 (45.5%) | 60 (54.5%) |
| 15 to 17 Year Olds | 51 (100.0%) | 0 (0.0%) |
| 18 to 19 Year Olds | 22 (25.3%) | 65 (74.7%) |
| 20 to 24 Year Olds | 31 (14.6%) | 181 (85.4%) |
| 25 to 34 Year Olds | 35 (37.6%) | 58 (62.4%) |
| 35 Years and over | 11 (57.9%) | 8 (42.1%) |
| Total | 258 (39.8%) | 390 (60.2%) |
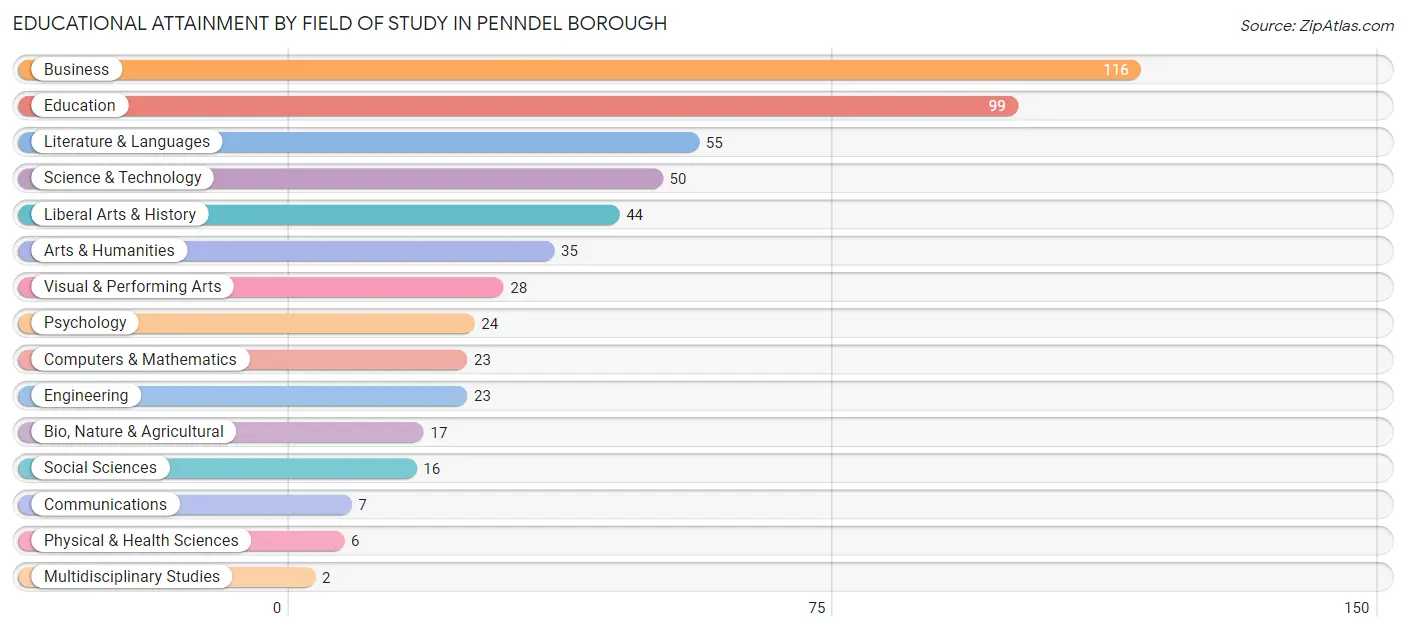
Educational Attainment by Field of Study in Penndel borough
Business (116 | 21.3%), education (99 | 18.2%), literature & languages (55 | 10.1%), science & technology (50 | 9.2%), and liberal arts & history (44 | 8.1%) are the most common fields of study among 545 individuals in Penndel borough who have obtained a bachelor's degree or higher.
| Field of Study | # Graduates | % Graduates |
| Computers & Mathematics | 23 | 4.2% |
| Bio, Nature & Agricultural | 17 | 3.1% |
| Physical & Health Sciences | 6 | 1.1% |
| Psychology | 24 | 4.4% |
| Social Sciences | 16 | 2.9% |
| Engineering | 23 | 4.2% |
| Multidisciplinary Studies | 2 | 0.4% |
| Science & Technology | 50 | 9.2% |
| Business | 116 | 21.3% |
| Education | 99 | 18.2% |
| Literature & Languages | 55 | 10.1% |
| Liberal Arts & History | 44 | 8.1% |
| Visual & Performing Arts | 28 | 5.1% |
| Communications | 7 | 1.3% |
| Arts & Humanities | 35 | 6.4% |
| Total | 545 | 100.0% |
Transportation & Commute in Penndel borough
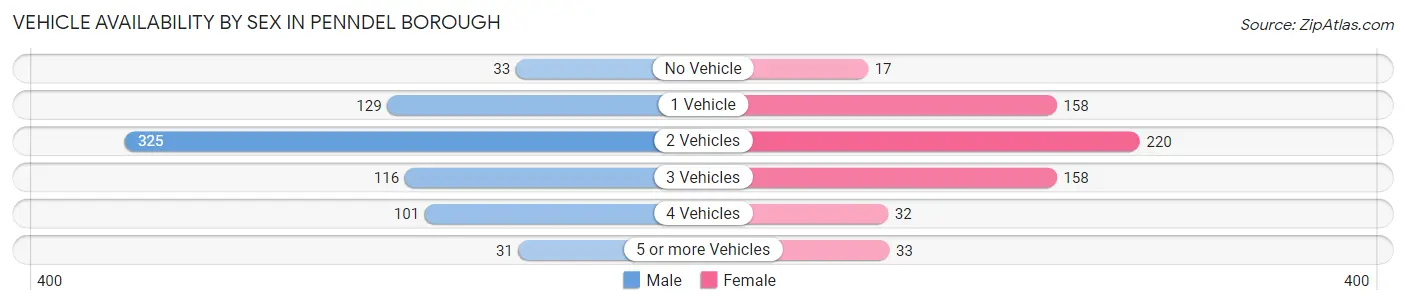
Vehicle Availability by Sex in Penndel borough
The most prevalent vehicle ownership categories in Penndel borough are males with 2 vehicles (325, accounting for 44.2%) and females with 2 vehicles (220, making up 52.6%).
| Vehicles Available | Male | Female |
| No Vehicle | 33 (4.5%) | 17 (2.8%) |
| 1 Vehicle | 129 (17.5%) | 158 (25.6%) |
| 2 Vehicles | 325 (44.2%) | 220 (35.6%) |
| 3 Vehicles | 116 (15.8%) | 158 (25.6%) |
| 4 Vehicles | 101 (13.7%) | 32 (5.2%) |
| 5 or more Vehicles | 31 (4.2%) | 33 (5.3%) |
| Total | 735 (100.0%) | 618 (100.0%) |
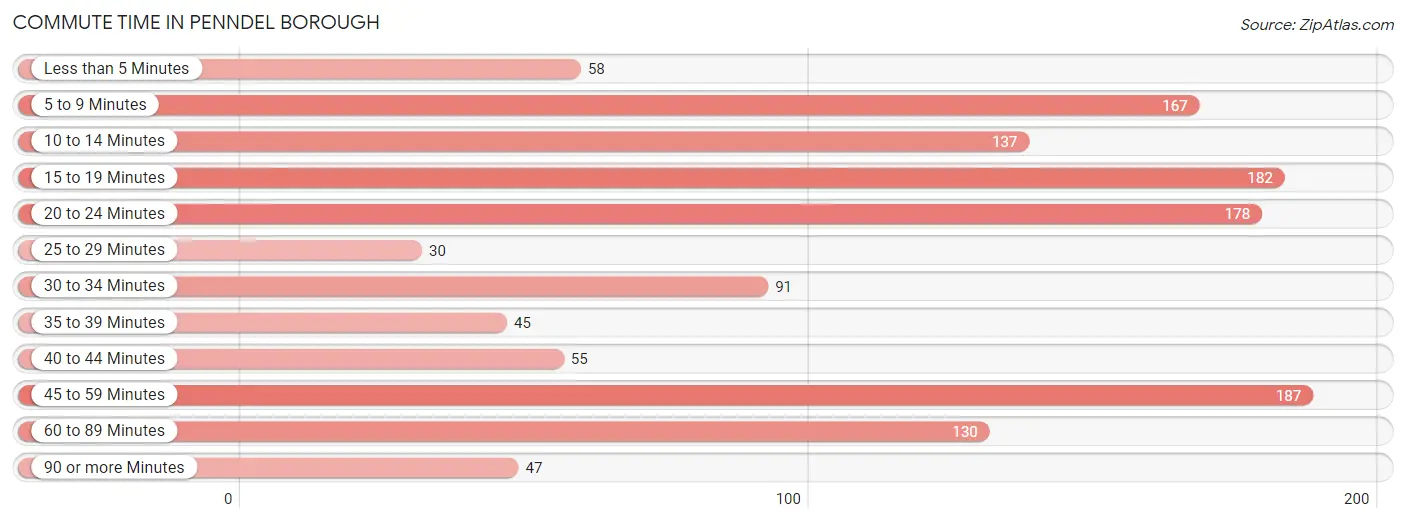
Commute Time in Penndel borough
The most frequently occuring commute durations in Penndel borough are 45 to 59 minutes (187 commuters, 14.3%), 15 to 19 minutes (182 commuters, 13.9%), and 20 to 24 minutes (178 commuters, 13.6%).
| Commute Time | # Commuters | % Commuters |
| Less than 5 Minutes | 58 | 4.4% |
| 5 to 9 Minutes | 167 | 12.8% |
| 10 to 14 Minutes | 137 | 10.5% |
| 15 to 19 Minutes | 182 | 13.9% |
| 20 to 24 Minutes | 178 | 13.6% |
| 25 to 29 Minutes | 30 | 2.3% |
| 30 to 34 Minutes | 91 | 7.0% |
| 35 to 39 Minutes | 45 | 3.4% |
| 40 to 44 Minutes | 55 | 4.2% |
| 45 to 59 Minutes | 187 | 14.3% |
| 60 to 89 Minutes | 130 | 10.0% |
| 90 or more Minutes | 47 | 3.6% |
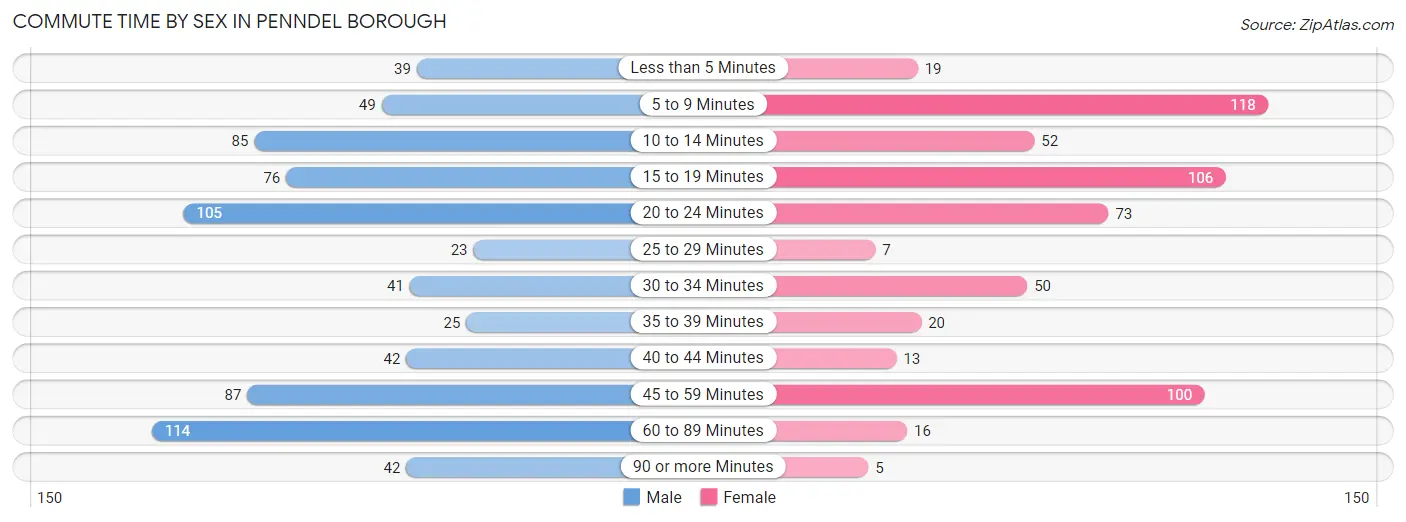
Commute Time by Sex in Penndel borough
The most common commute times in Penndel borough are 60 to 89 minutes (114 commuters, 15.7%) for males and 5 to 9 minutes (118 commuters, 20.4%) for females.
| Commute Time | Male | Female |
| Less than 5 Minutes | 39 (5.4%) | 19 (3.3%) |
| 5 to 9 Minutes | 49 (6.7%) | 118 (20.4%) |
| 10 to 14 Minutes | 85 (11.7%) | 52 (9.0%) |
| 15 to 19 Minutes | 76 (10.4%) | 106 (18.3%) |
| 20 to 24 Minutes | 105 (14.4%) | 73 (12.6%) |
| 25 to 29 Minutes | 23 (3.2%) | 7 (1.2%) |
| 30 to 34 Minutes | 41 (5.6%) | 50 (8.6%) |
| 35 to 39 Minutes | 25 (3.4%) | 20 (3.5%) |
| 40 to 44 Minutes | 42 (5.8%) | 13 (2.2%) |
| 45 to 59 Minutes | 87 (11.9%) | 100 (17.3%) |
| 60 to 89 Minutes | 114 (15.7%) | 16 (2.8%) |
| 90 or more Minutes | 42 (5.8%) | 5 (0.9%) |
Time of Departure to Work by Sex in Penndel borough
The most frequent times of departure to work in Penndel borough are 7:00 AM to 7:29 AM (142, 19.5%) for males and 6:00 AM to 6:29 AM (111, 19.2%) for females.
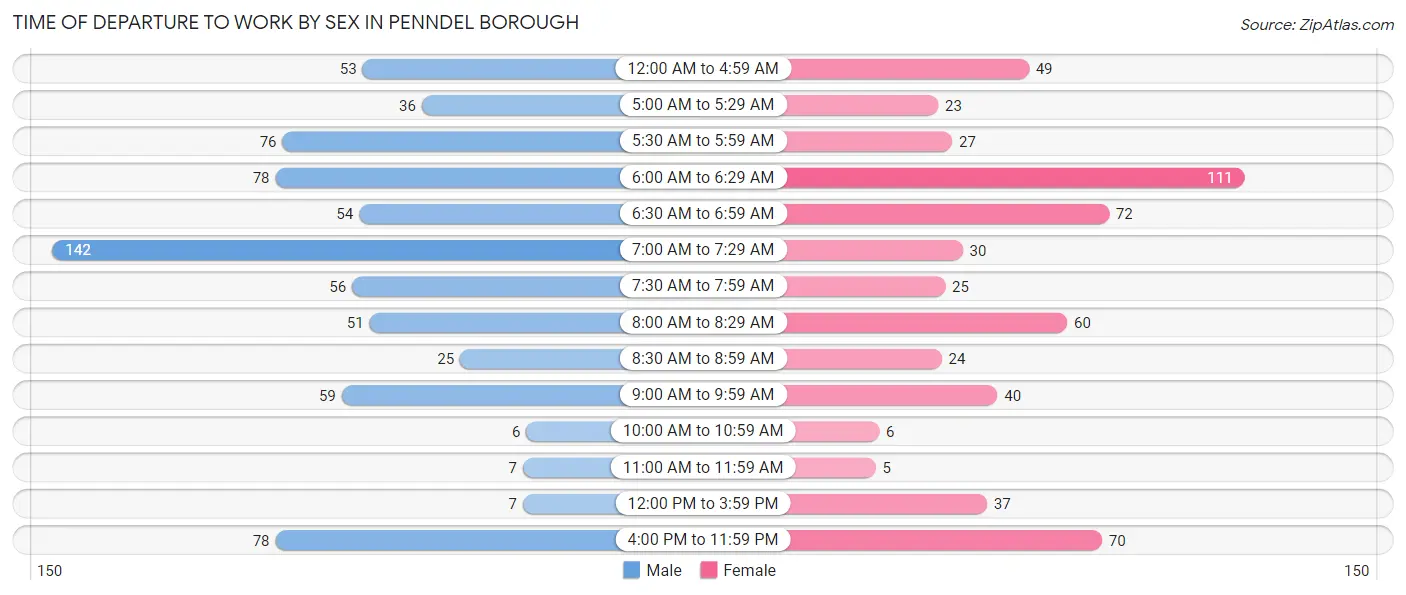
| Time of Departure | Male | Female |
| 12:00 AM to 4:59 AM | 53 (7.3%) | 49 (8.5%) |
| 5:00 AM to 5:29 AM | 36 (5.0%) | 23 (4.0%) |
| 5:30 AM to 5:59 AM | 76 (10.4%) | 27 (4.7%) |
| 6:00 AM to 6:29 AM | 78 (10.7%) | 111 (19.2%) |
| 6:30 AM to 6:59 AM | 54 (7.4%) | 72 (12.4%) |
| 7:00 AM to 7:29 AM | 142 (19.5%) | 30 (5.2%) |
| 7:30 AM to 7:59 AM | 56 (7.7%) | 25 (4.3%) |
| 8:00 AM to 8:29 AM | 51 (7.0%) | 60 (10.4%) |
| 8:30 AM to 8:59 AM | 25 (3.4%) | 24 (4.2%) |
| 9:00 AM to 9:59 AM | 59 (8.1%) | 40 (6.9%) |
| 10:00 AM to 10:59 AM | 6 (0.8%) | 6 (1.0%) |
| 11:00 AM to 11:59 AM | 7 (1.0%) | 5 (0.9%) |
| 12:00 PM to 3:59 PM | 7 (1.0%) | 37 (6.4%) |
| 4:00 PM to 11:59 PM | 78 (10.7%) | 70 (12.1%) |
| Total | 728 (100.0%) | 579 (100.0%) |
Housing Occupancy in Penndel borough
Occupancy by Ownership in Penndel borough
Of the total 1,015 dwellings in Penndel borough, owner-occupied units account for 449 (44.2%), while renter-occupied units make up 566 (55.8%).
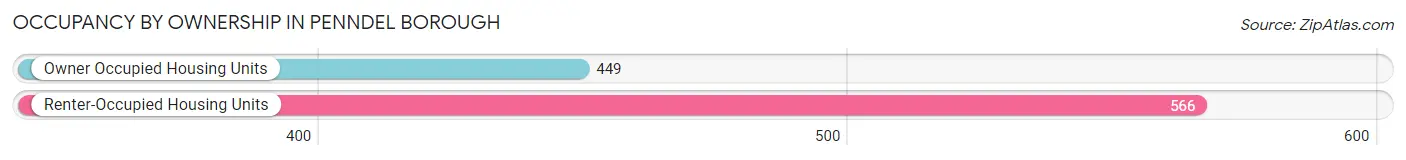
| Occupancy | # Housing Units | % Housing Units |
| Owner Occupied Housing Units | 449 | 44.2% |
| Renter-Occupied Housing Units | 566 | 55.8% |
| Total Occupied Housing Units | 1,015 | 100.0% |
Occupancy by Household Size in Penndel borough
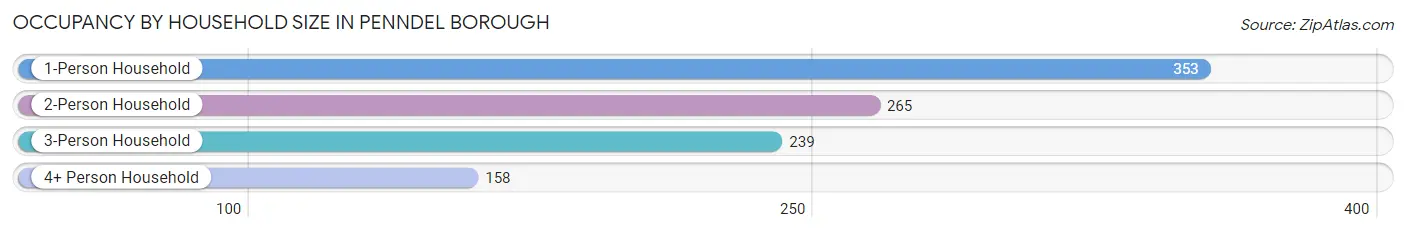
| Household Size | # Housing Units | % Housing Units |
| 1-Person Household | 353 | 34.8% |
| 2-Person Household | 265 | 26.1% |
| 3-Person Household | 239 | 23.5% |
| 4+ Person Household | 158 | 15.6% |
| Total Housing Units | 1,015 | 100.0% |
Occupancy by Ownership by Household Size in Penndel borough
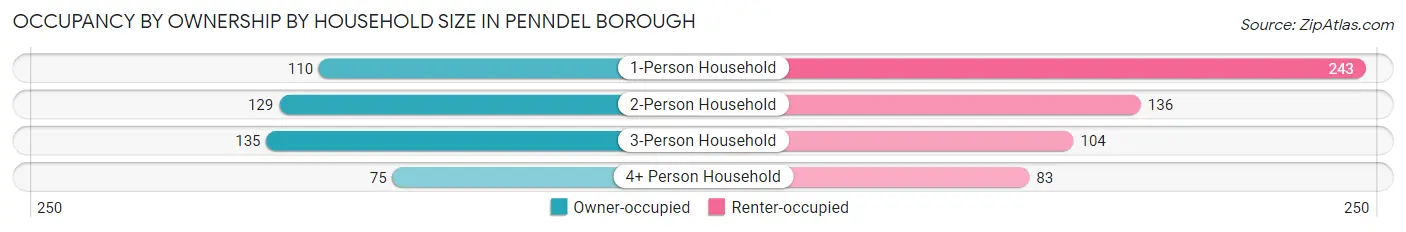
| Household Size | Owner-occupied | Renter-occupied |
| 1-Person Household | 110 (31.2%) | 243 (68.8%) |
| 2-Person Household | 129 (48.7%) | 136 (51.3%) |
| 3-Person Household | 135 (56.5%) | 104 (43.5%) |
| 4+ Person Household | 75 (47.5%) | 83 (52.5%) |
| Total Housing Units | 449 (44.2%) | 566 (55.8%) |
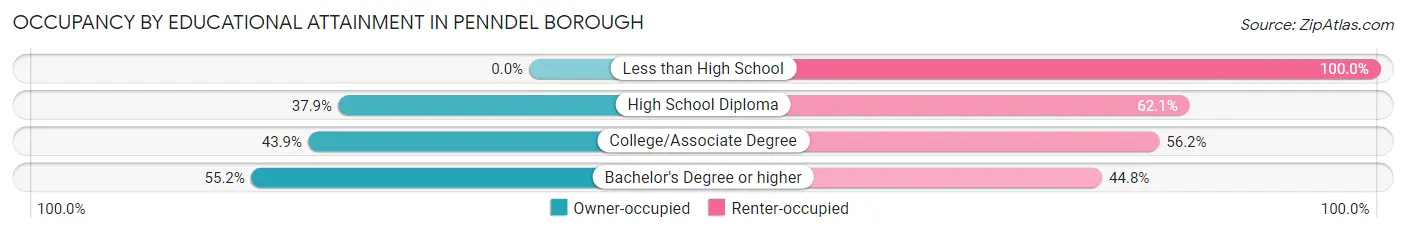
Occupancy by Educational Attainment in Penndel borough
| Household Size | Owner-occupied | Renter-occupied |
| Less than High School | 0 (0.0%) | 47 (100.0%) |
| High School Diploma | 108 (37.9%) | 177 (62.1%) |
| College/Associate Degree | 139 (43.9%) | 178 (56.1%) |
| Bachelor's Degree or higher | 202 (55.2%) | 164 (44.8%) |
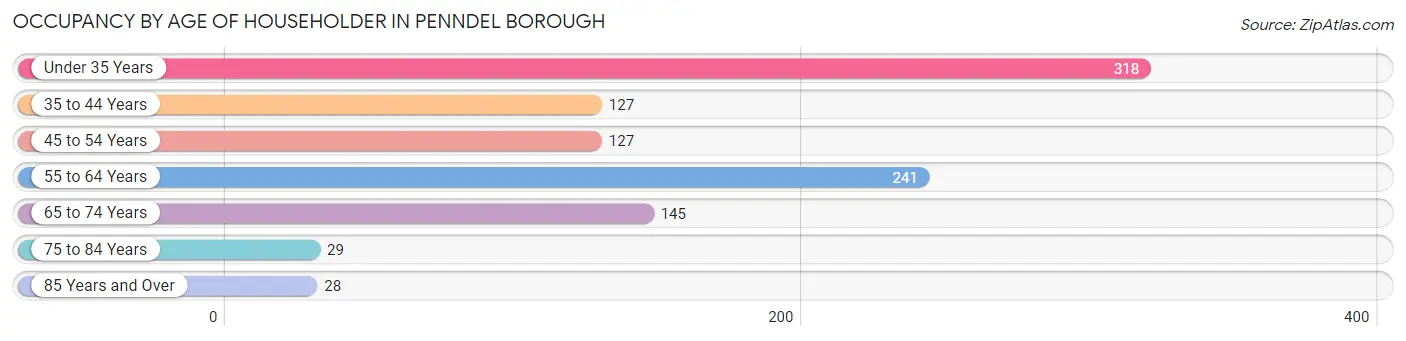
Occupancy by Age of Householder in Penndel borough
| Age Bracket | # Households | % Households |
| Under 35 Years | 318 | 31.3% |
| 35 to 44 Years | 127 | 12.5% |
| 45 to 54 Years | 127 | 12.5% |
| 55 to 64 Years | 241 | 23.7% |
| 65 to 74 Years | 145 | 14.3% |
| 75 to 84 Years | 29 | 2.9% |
| 85 Years and Over | 28 | 2.8% |
| Total | 1,015 | 100.0% |
Housing Finances in Penndel borough
Median Income by Occupancy in Penndel borough
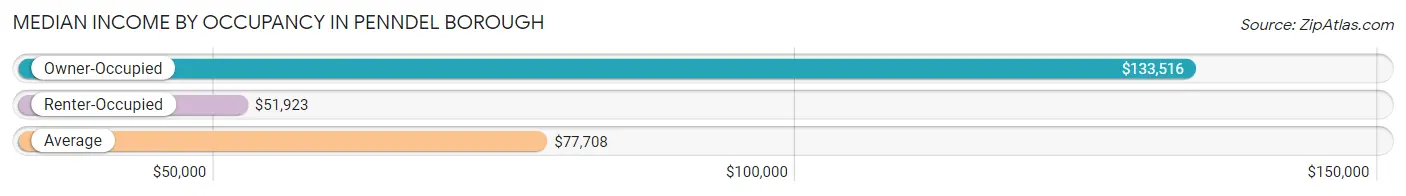
| Occupancy Type | # Households | Median Income |
| Owner-Occupied | 449 (44.2%) | $133,516 |
| Renter-Occupied | 566 (55.8%) | $51,923 |
| Average | 1,015 (100.0%) | $77,708 |
Occupancy by Householder Income Bracket in Penndel borough
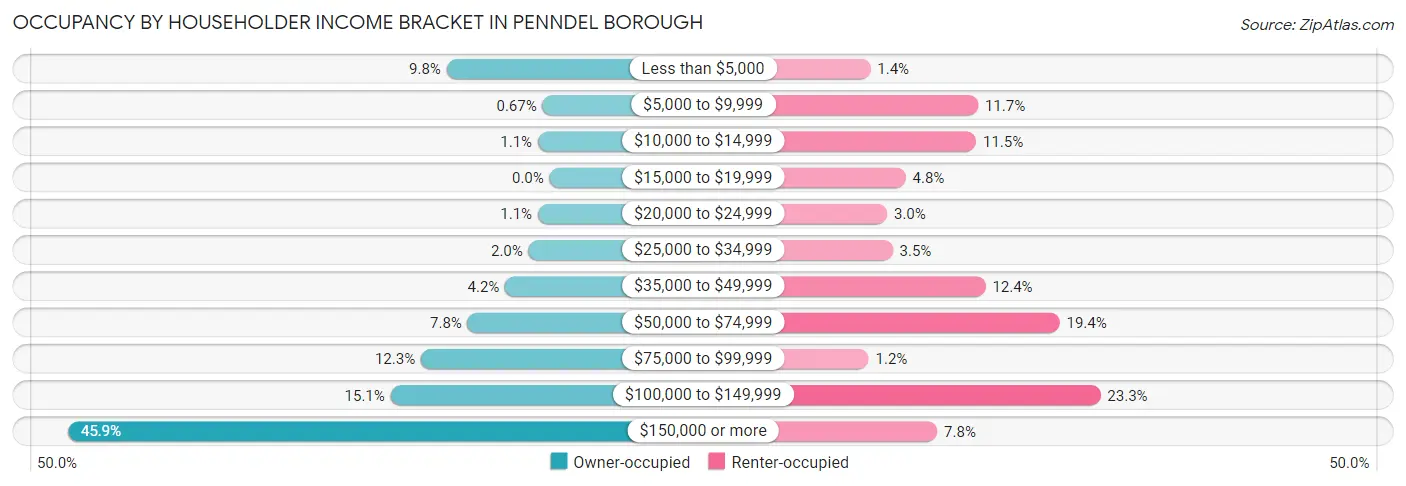
| Income Bracket | Owner-occupied | Renter-occupied |
| Less than $5,000 | 44 (9.8%) | 8 (1.4%) |
| $5,000 to $9,999 | 3 (0.7%) | 66 (11.7%) |
| $10,000 to $14,999 | 5 (1.1%) | 65 (11.5%) |
| $15,000 to $19,999 | 0 (0.0%) | 27 (4.8%) |
| $20,000 to $24,999 | 5 (1.1%) | 17 (3.0%) |
| $25,000 to $34,999 | 9 (2.0%) | 20 (3.5%) |
| $35,000 to $49,999 | 19 (4.2%) | 70 (12.4%) |
| $50,000 to $74,999 | 35 (7.8%) | 110 (19.4%) |
| $75,000 to $99,999 | 55 (12.2%) | 7 (1.2%) |
| $100,000 to $149,999 | 68 (15.1%) | 132 (23.3%) |
| $150,000 or more | 206 (45.9%) | 44 (7.8%) |
| Total | 449 (100.0%) | 566 (100.0%) |
Monthly Housing Cost Tiers in Penndel borough
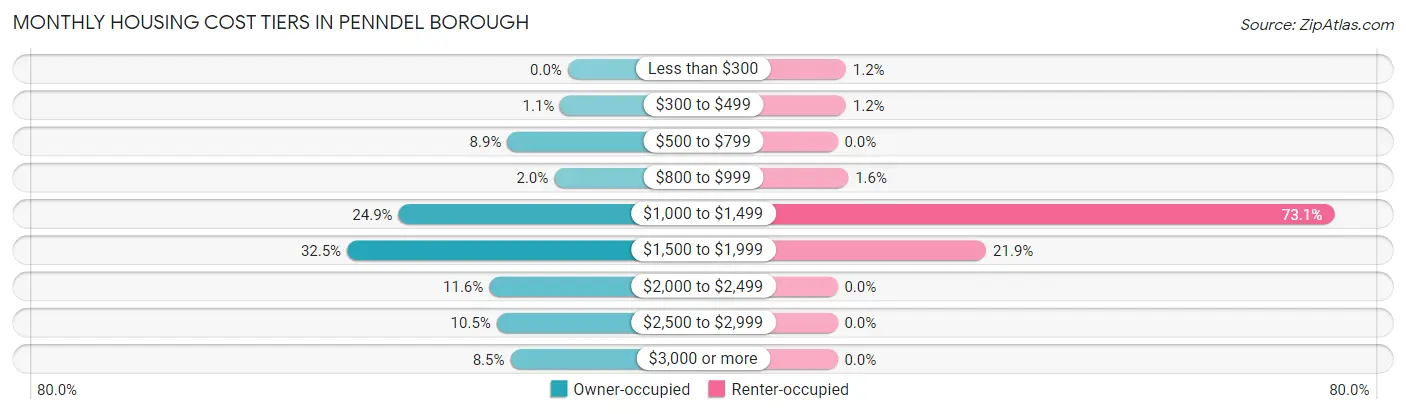
| Monthly Cost | Owner-occupied | Renter-occupied |
| Less than $300 | 0 (0.0%) | 7 (1.2%) |
| $300 to $499 | 5 (1.1%) | 7 (1.2%) |
| $500 to $799 | 40 (8.9%) | 0 (0.0%) |
| $800 to $999 | 9 (2.0%) | 9 (1.6%) |
| $1,000 to $1,499 | 112 (24.9%) | 414 (73.1%) |
| $1,500 to $1,999 | 146 (32.5%) | 124 (21.9%) |
| $2,000 to $2,499 | 52 (11.6%) | 0 (0.0%) |
| $2,500 to $2,999 | 47 (10.5%) | 0 (0.0%) |
| $3,000 or more | 38 (8.5%) | 0 (0.0%) |
| Total | 449 (100.0%) | 566 (100.0%) |
Physical Housing Characteristics in Penndel borough
Housing Structures in Penndel borough
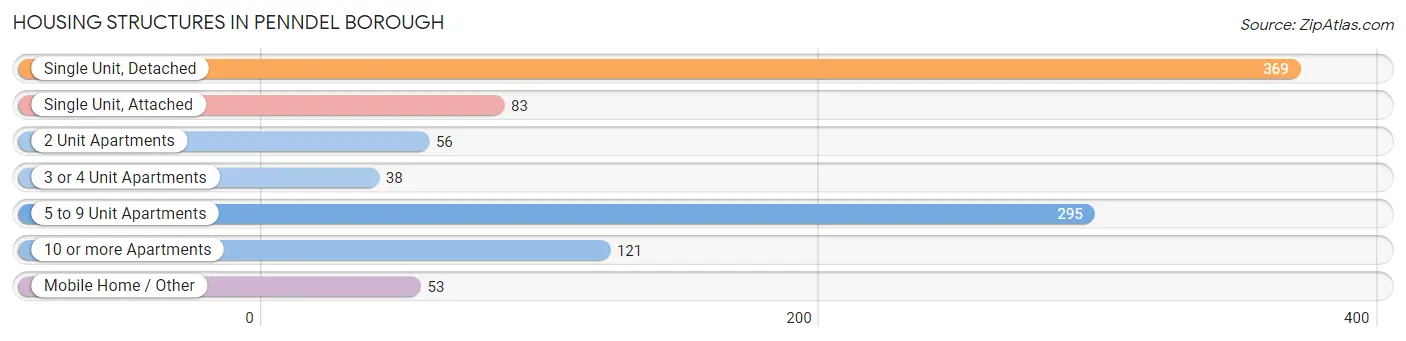
| Structure Type | # Housing Units | % Housing Units |
| Single Unit, Detached | 369 | 36.3% |
| Single Unit, Attached | 83 | 8.2% |
| 2 Unit Apartments | 56 | 5.5% |
| 3 or 4 Unit Apartments | 38 | 3.7% |
| 5 to 9 Unit Apartments | 295 | 29.1% |
| 10 or more Apartments | 121 | 11.9% |
| Mobile Home / Other | 53 | 5.2% |
| Total | 1,015 | 100.0% |
Housing Structures by Occupancy in Penndel borough
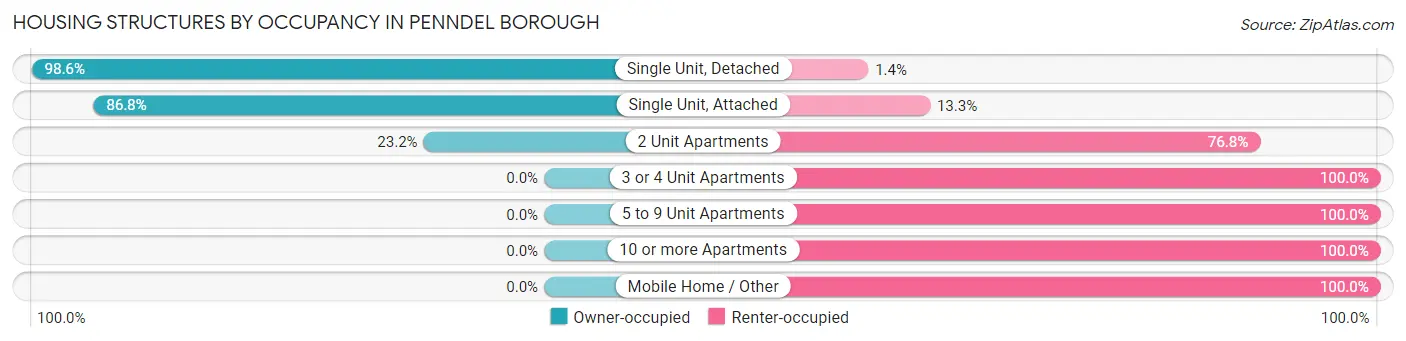
| Structure Type | Owner-occupied | Renter-occupied |
| Single Unit, Detached | 364 (98.6%) | 5 (1.4%) |
| Single Unit, Attached | 72 (86.8%) | 11 (13.3%) |
| 2 Unit Apartments | 13 (23.2%) | 43 (76.8%) |
| 3 or 4 Unit Apartments | 0 (0.0%) | 38 (100.0%) |
| 5 to 9 Unit Apartments | 0 (0.0%) | 295 (100.0%) |
| 10 or more Apartments | 0 (0.0%) | 121 (100.0%) |
| Mobile Home / Other | 0 (0.0%) | 53 (100.0%) |
| Total | 449 (44.2%) | 566 (55.8%) |
Housing Structures by Number of Rooms in Penndel borough
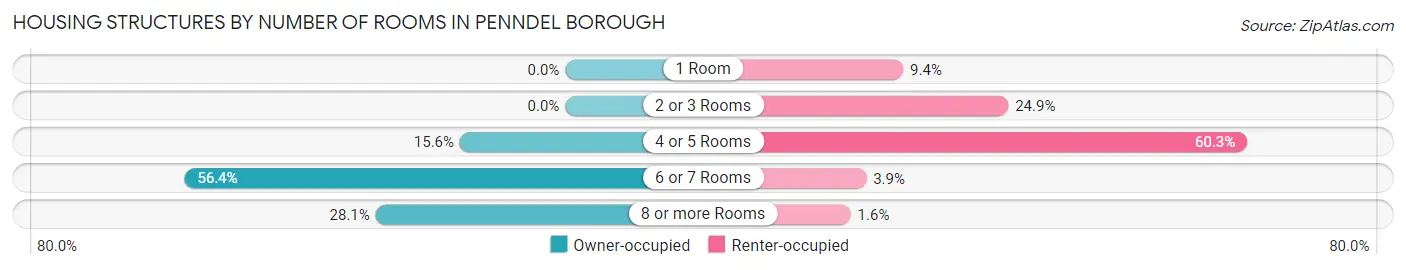
| Number of Rooms | Owner-occupied | Renter-occupied |
| 1 Room | 0 (0.0%) | 53 (9.4%) |
| 2 or 3 Rooms | 0 (0.0%) | 141 (24.9%) |
| 4 or 5 Rooms | 70 (15.6%) | 341 (60.3%) |
| 6 or 7 Rooms | 253 (56.4%) | 22 (3.9%) |
| 8 or more Rooms | 126 (28.1%) | 9 (1.6%) |
| Total | 449 (100.0%) | 566 (100.0%) |
Housing Structure by Heating Type in Penndel borough
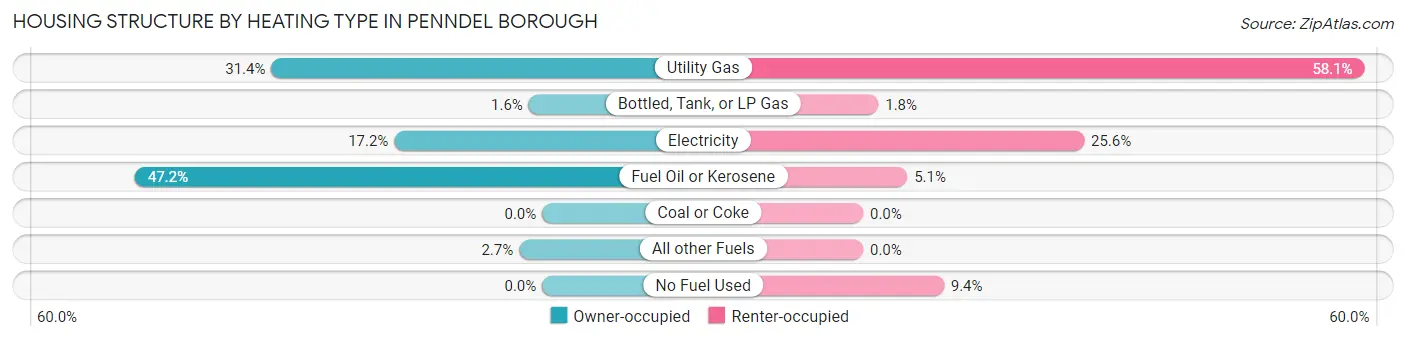
| Heating Type | Owner-occupied | Renter-occupied |
| Utility Gas | 141 (31.4%) | 329 (58.1%) |
| Bottled, Tank, or LP Gas | 7 (1.6%) | 10 (1.8%) |
| Electricity | 77 (17.2%) | 145 (25.6%) |
| Fuel Oil or Kerosene | 212 (47.2%) | 29 (5.1%) |
| Coal or Coke | 0 (0.0%) | 0 (0.0%) |
| All other Fuels | 12 (2.7%) | 0 (0.0%) |
| No Fuel Used | 0 (0.0%) | 53 (9.4%) |
| Total | 449 (100.0%) | 566 (100.0%) |
Household Vehicle Usage in Penndel borough
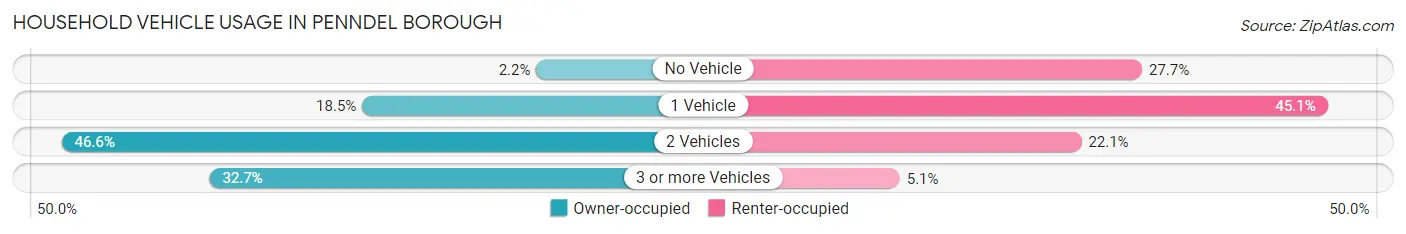
| Vehicles per Household | Owner-occupied | Renter-occupied |
| No Vehicle | 10 (2.2%) | 157 (27.7%) |
| 1 Vehicle | 83 (18.5%) | 255 (45.1%) |
| 2 Vehicles | 209 (46.6%) | 125 (22.1%) |
| 3 or more Vehicles | 147 (32.7%) | 29 (5.1%) |
| Total | 449 (100.0%) | 566 (100.0%) |
Real Estate & Mortgages in Penndel borough
Real Estate and Mortgage Overview in Penndel borough
| Characteristic | Without Mortgage | With Mortgage |
| Housing Units | 84 | 365 |
| Median Property Value | $293,800 | $314,600 |
| Median Household Income | $108,750 | $173 |
| Monthly Housing Costs | $850 | $38 |
| Real Estate Taxes | $5,324 | $0 |
Property Value by Mortgage Status in Penndel borough
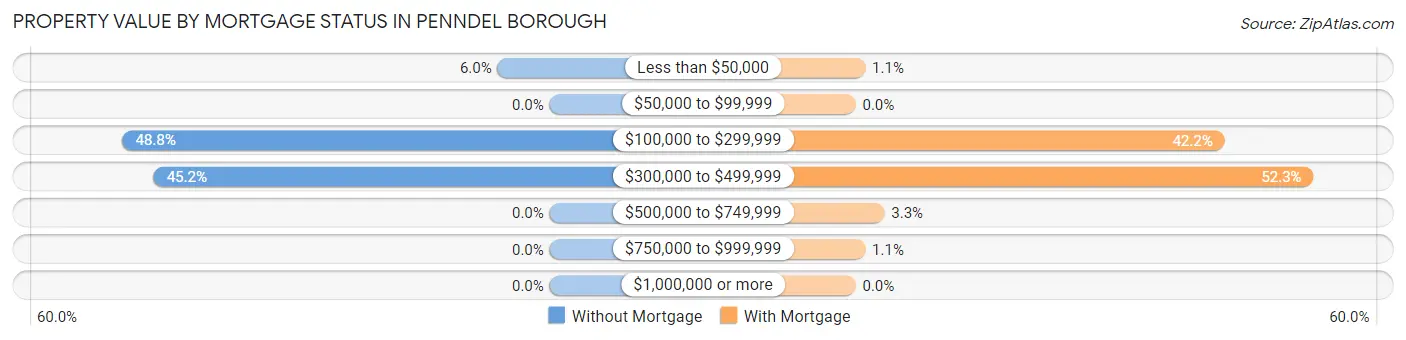
| Property Value | Without Mortgage | With Mortgage |
| Less than $50,000 | 5 (5.9%) | 4 (1.1%) |
| $50,000 to $99,999 | 0 (0.0%) | 0 (0.0%) |
| $100,000 to $299,999 | 41 (48.8%) | 154 (42.2%) |
| $300,000 to $499,999 | 38 (45.2%) | 191 (52.3%) |
| $500,000 to $749,999 | 0 (0.0%) | 12 (3.3%) |
| $750,000 to $999,999 | 0 (0.0%) | 4 (1.1%) |
| $1,000,000 or more | 0 (0.0%) | 0 (0.0%) |
| Total | 84 (100.0%) | 365 (100.0%) |
Household Income by Mortgage Status in Penndel borough
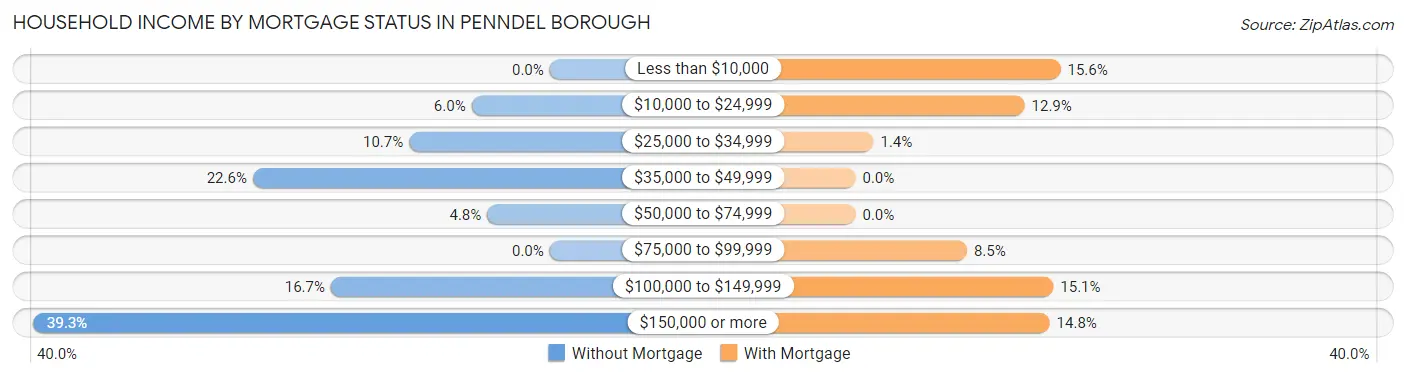
| Household Income | Without Mortgage | With Mortgage |
| Less than $10,000 | 0 (0.0%) | 57 (15.6%) |
| $10,000 to $24,999 | 5 (5.9%) | 47 (12.9%) |
| $25,000 to $34,999 | 9 (10.7%) | 5 (1.4%) |
| $35,000 to $49,999 | 19 (22.6%) | 0 (0.0%) |
| $50,000 to $74,999 | 4 (4.8%) | 0 (0.0%) |
| $75,000 to $99,999 | 0 (0.0%) | 31 (8.5%) |
| $100,000 to $149,999 | 14 (16.7%) | 55 (15.1%) |
| $150,000 or more | 33 (39.3%) | 54 (14.8%) |
| Total | 84 (100.0%) | 365 (100.0%) |
Property Value to Household Income Ratio in Penndel borough
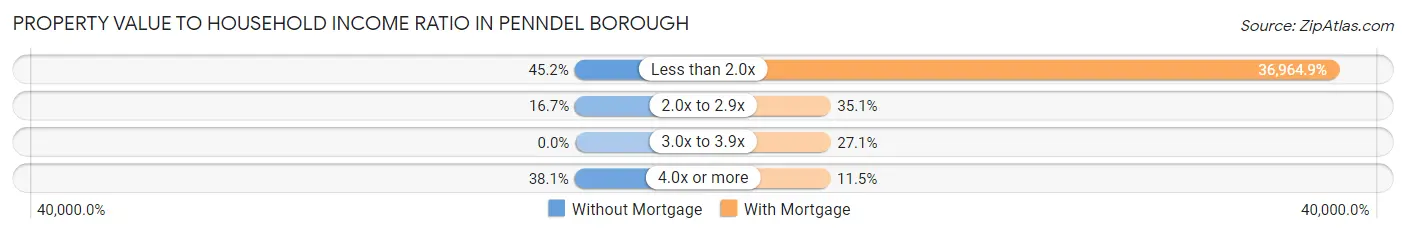
| Value-to-Income Ratio | Without Mortgage | With Mortgage |
| Less than 2.0x | 38 (45.2%) | 134,922 (36,964.9%) |
| 2.0x to 2.9x | 14 (16.7%) | 128 (35.1%) |
| 3.0x to 3.9x | 0 (0.0%) | 99 (27.1%) |
| 4.0x or more | 32 (38.1%) | 42 (11.5%) |
| Total | 84 (100.0%) | 365 (100.0%) |
Real Estate Taxes by Mortgage Status in Penndel borough
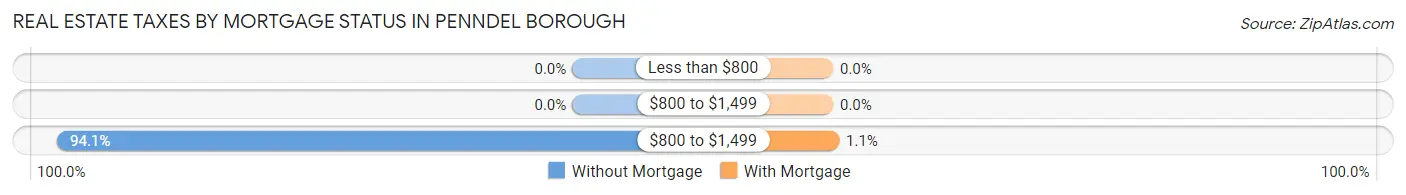
| Property Taxes | Without Mortgage | With Mortgage |
| Less than $800 | 0 (0.0%) | 0 (0.0%) |
| $800 to $1,499 | 0 (0.0%) | 0 (0.0%) |
| $800 to $1,499 | 79 (94.1%) | 4 (1.1%) |
| Total | 84 (100.0%) | 365 (100.0%) |
Health & Disability in Penndel borough
Health Insurance Coverage by Age in Penndel borough
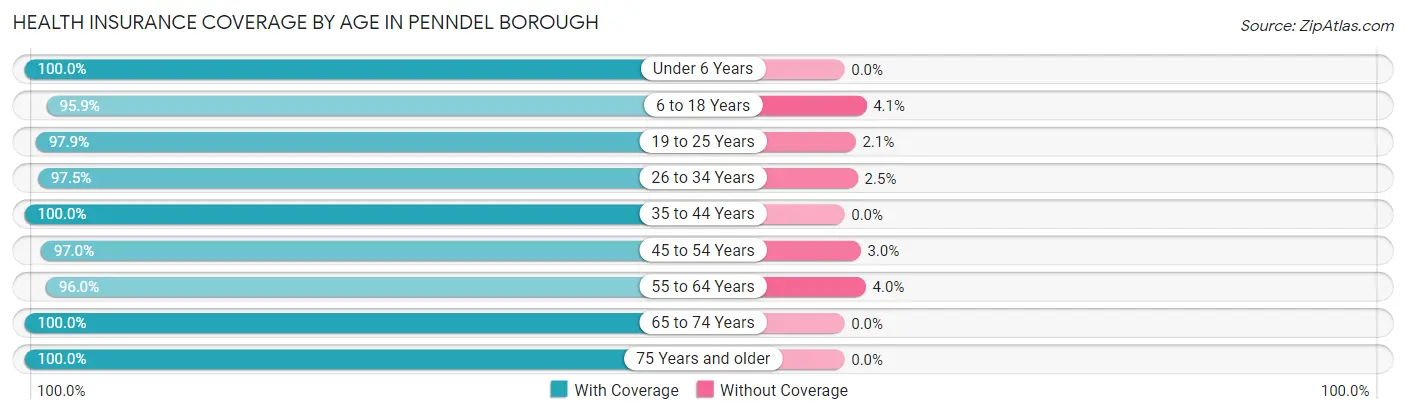
| Age Bracket | With Coverage | Without Coverage |
| Under 6 Years | 113 (100.0%) | 0 (0.0%) |
| 6 to 18 Years | 282 (95.9%) | 12 (4.1%) |
| 19 to 25 Years | 518 (97.9%) | 11 (2.1%) |
| 26 to 34 Years | 392 (97.5%) | 10 (2.5%) |
| 35 to 44 Years | 236 (100.0%) | 0 (0.0%) |
| 45 to 54 Years | 225 (97.0%) | 7 (3.0%) |
| 55 to 64 Years | 387 (96.0%) | 16 (4.0%) |
| 65 to 74 Years | 208 (100.0%) | 0 (0.0%) |
| 75 Years and older | 81 (100.0%) | 0 (0.0%) |
| Total | 2,442 (97.8%) | 56 (2.2%) |
Health Insurance Coverage by Citizenship Status in Penndel borough
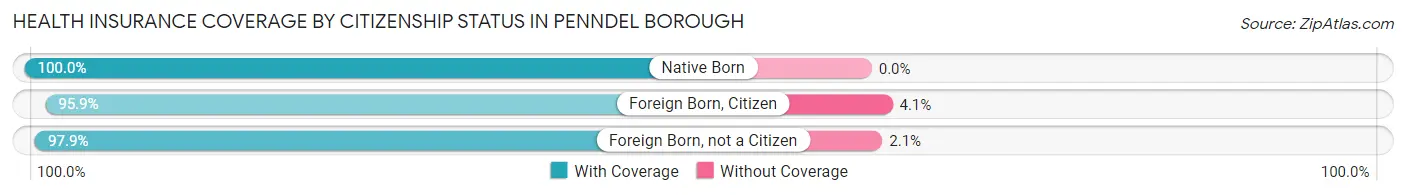
| Citizenship Status | With Coverage | Without Coverage |
| Native Born | 113 (100.0%) | 0 (0.0%) |
| Foreign Born, Citizen | 282 (95.9%) | 12 (4.1%) |
| Foreign Born, not a Citizen | 518 (97.9%) | 11 (2.1%) |
Health Insurance Coverage by Household Income in Penndel borough
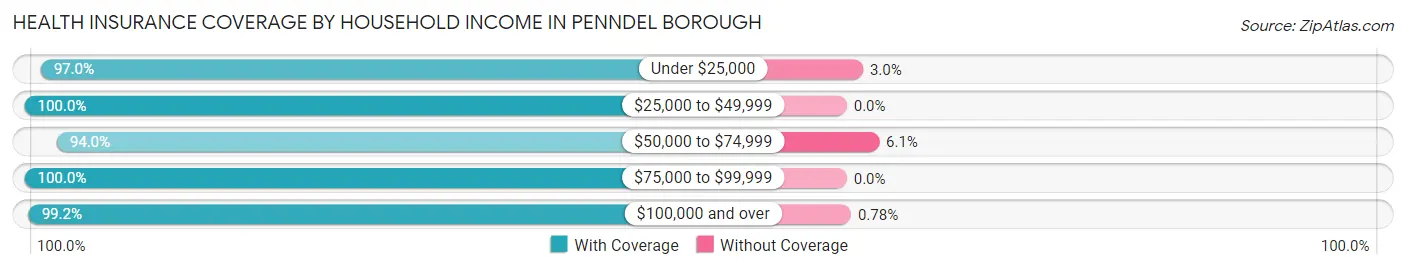
| Household Income | With Coverage | Without Coverage |
| Under $25,000 | 320 (97.0%) | 10 (3.0%) |
| $25,000 to $49,999 | 163 (100.0%) | 0 (0.0%) |
| $50,000 to $74,999 | 373 (94.0%) | 24 (6.0%) |
| $75,000 to $99,999 | 125 (100.0%) | 0 (0.0%) |
| $100,000 and over | 1,270 (99.2%) | 10 (0.8%) |
Public vs Private Health Insurance Coverage by Age in Penndel borough
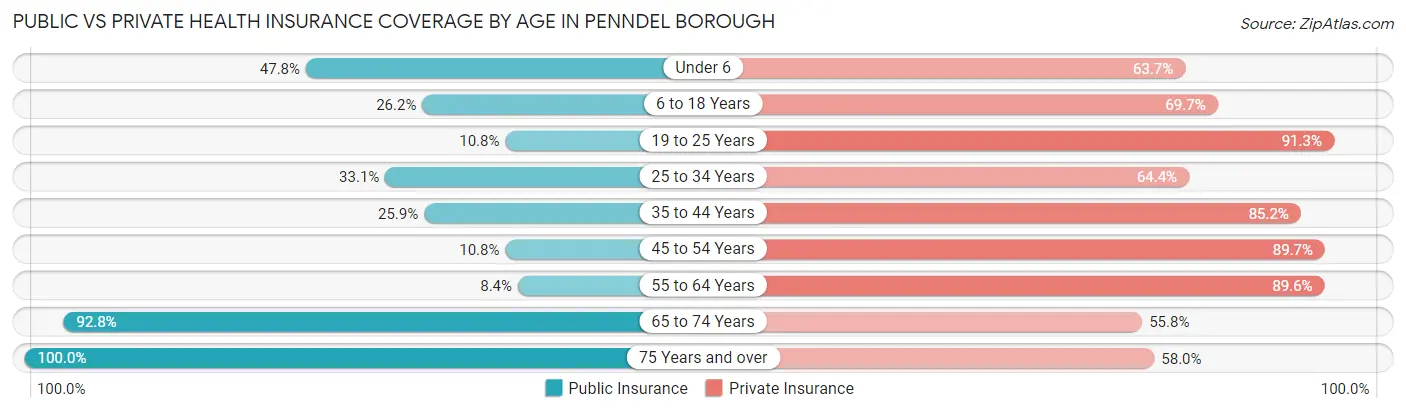
| Age Bracket | Public Insurance | Private Insurance |
| Under 6 | 54 (47.8%) | 72 (63.7%) |
| 6 to 18 Years | 77 (26.2%) | 205 (69.7%) |
| 19 to 25 Years | 57 (10.8%) | 483 (91.3%) |
| 25 to 34 Years | 133 (33.1%) | 259 (64.4%) |
| 35 to 44 Years | 61 (25.9%) | 201 (85.2%) |
| 45 to 54 Years | 25 (10.8%) | 208 (89.7%) |
| 55 to 64 Years | 34 (8.4%) | 361 (89.6%) |
| 65 to 74 Years | 193 (92.8%) | 116 (55.8%) |
| 75 Years and over | 81 (100.0%) | 47 (58.0%) |
| Total | 715 (28.6%) | 1,952 (78.1%) |
Disability Status by Sex by Age in Penndel borough
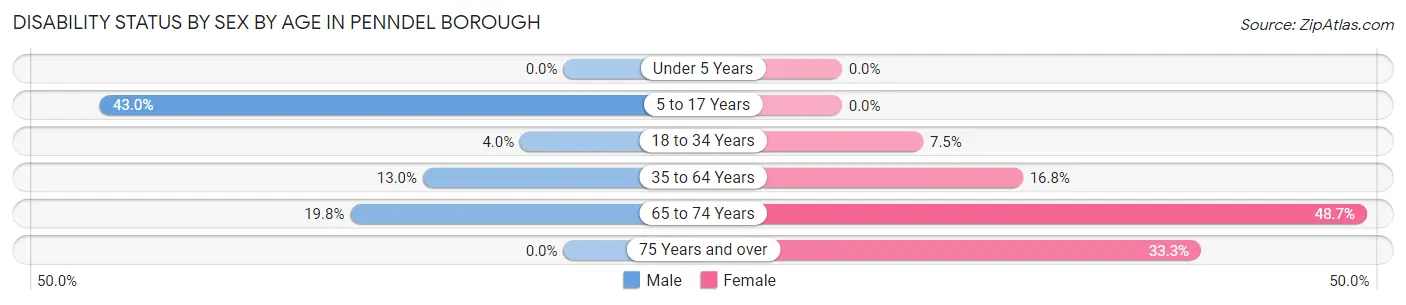
| Age Bracket | Male | Female |
| Under 5 Years | 0 (0.0%) | 0 (0.0%) |
| 5 to 17 Years | 43 (43.0%) | 0 (0.0%) |
| 18 to 34 Years | 21 (4.0%) | 35 (7.5%) |
| 35 to 64 Years | 60 (13.0%) | 69 (16.8%) |
| 65 to 74 Years | 18 (19.8%) | 57 (48.7%) |
| 75 Years and over | 0 (0.0%) | 18 (33.3%) |
Disability Class by Sex by Age in Penndel borough
Disability Class: Hearing Difficulty
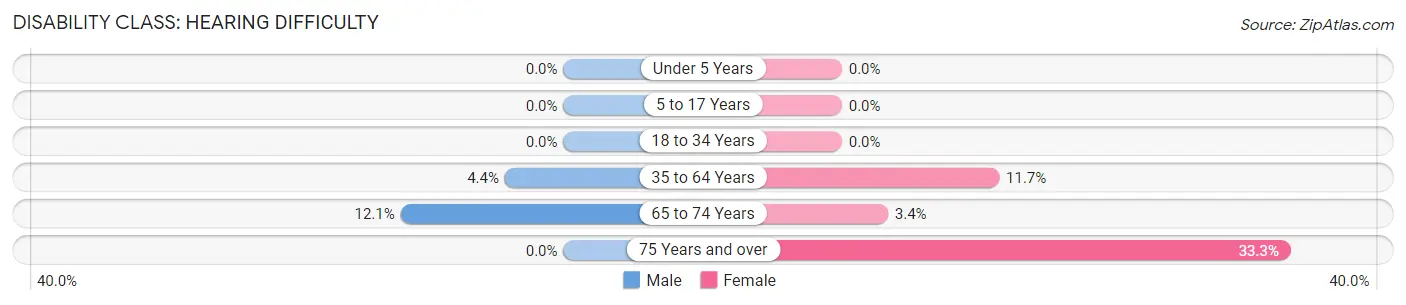
| Age Bracket | Male | Female |
| Under 5 Years | 0 (0.0%) | 0 (0.0%) |
| 5 to 17 Years | 0 (0.0%) | 0 (0.0%) |
| 18 to 34 Years | 0 (0.0%) | 0 (0.0%) |
| 35 to 64 Years | 20 (4.3%) | 48 (11.7%) |
| 65 to 74 Years | 11 (12.1%) | 4 (3.4%) |
| 75 Years and over | 0 (0.0%) | 18 (33.3%) |
Disability Class: Vision Difficulty
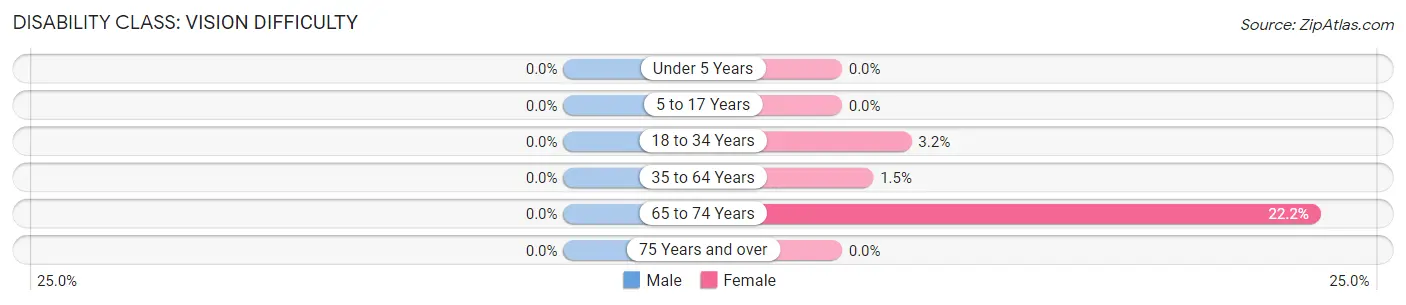
| Age Bracket | Male | Female |
| Under 5 Years | 0 (0.0%) | 0 (0.0%) |
| 5 to 17 Years | 0 (0.0%) | 0 (0.0%) |
| 18 to 34 Years | 0 (0.0%) | 15 (3.2%) |
| 35 to 64 Years | 0 (0.0%) | 6 (1.5%) |
| 65 to 74 Years | 0 (0.0%) | 26 (22.2%) |
| 75 Years and over | 0 (0.0%) | 0 (0.0%) |
Disability Class: Cognitive Difficulty
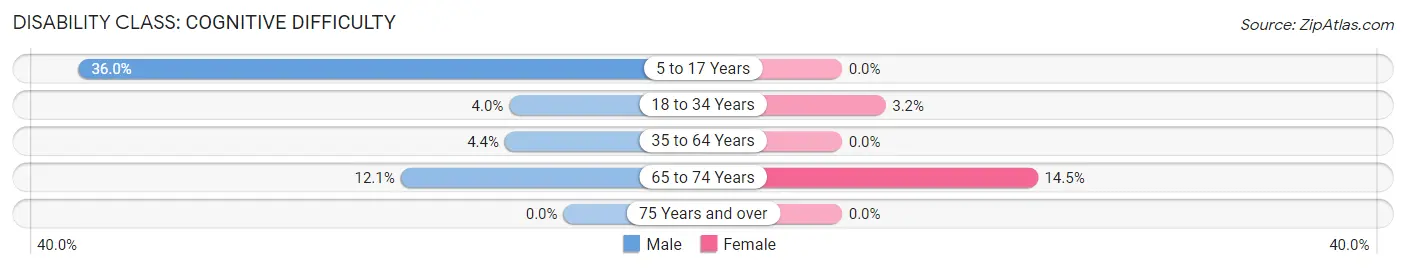
| Age Bracket | Male | Female |
| 5 to 17 Years | 36 (36.0%) | 0 (0.0%) |
| 18 to 34 Years | 21 (4.0%) | 15 (3.2%) |
| 35 to 64 Years | 20 (4.3%) | 0 (0.0%) |
| 65 to 74 Years | 11 (12.1%) | 17 (14.5%) |
| 75 Years and over | 0 (0.0%) | 0 (0.0%) |
Disability Class: Ambulatory Difficulty
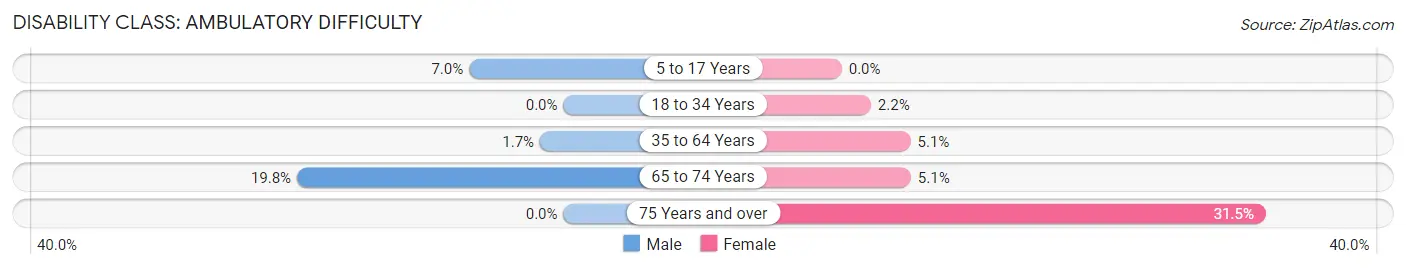
| Age Bracket | Male | Female |
| 5 to 17 Years | 7 (7.0%) | 0 (0.0%) |
| 18 to 34 Years | 0 (0.0%) | 10 (2.2%) |
| 35 to 64 Years | 8 (1.7%) | 21 (5.1%) |
| 65 to 74 Years | 18 (19.8%) | 6 (5.1%) |
| 75 Years and over | 0 (0.0%) | 17 (31.5%) |
Disability Class: Self-Care Difficulty
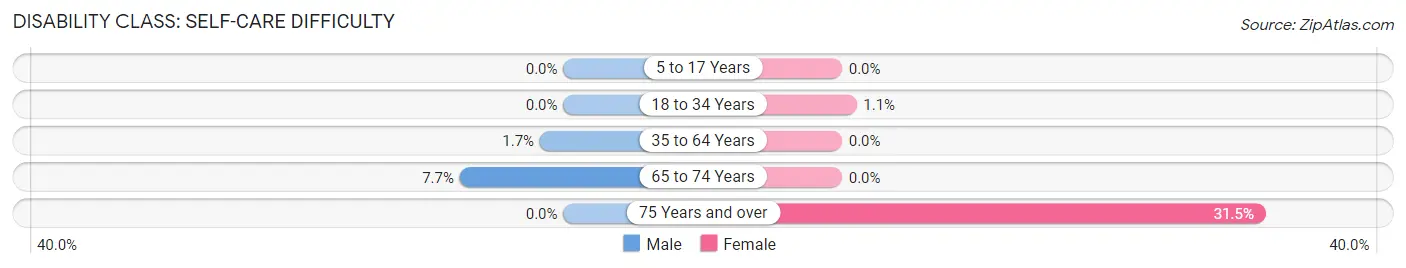
| Age Bracket | Male | Female |
| 5 to 17 Years | 0 (0.0%) | 0 (0.0%) |
| 18 to 34 Years | 0 (0.0%) | 5 (1.1%) |
| 35 to 64 Years | 8 (1.7%) | 0 (0.0%) |
| 65 to 74 Years | 7 (7.7%) | 0 (0.0%) |
| 75 Years and over | 0 (0.0%) | 17 (31.5%) |
Technology Access in Penndel borough
Computing Device Access in Penndel borough
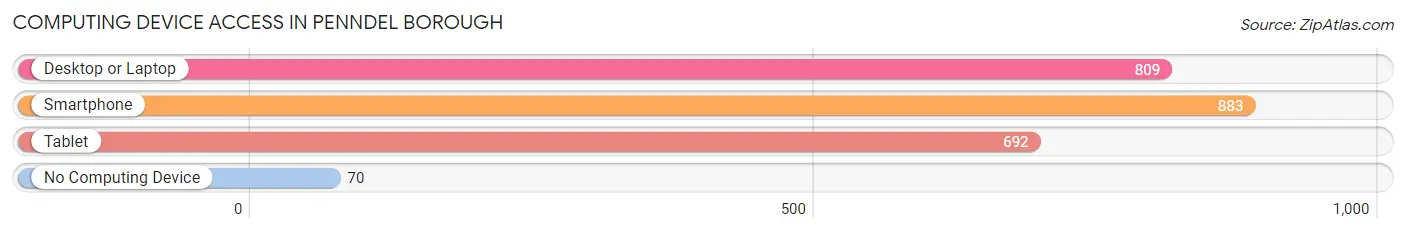
| Device Type | # Households | % Households |
| Desktop or Laptop | 809 | 79.7% |
| Smartphone | 883 | 87.0% |
| Tablet | 692 | 68.2% |
| No Computing Device | 70 | 6.9% |
| Total | 1,015 | 100.0% |
Internet Access in Penndel borough
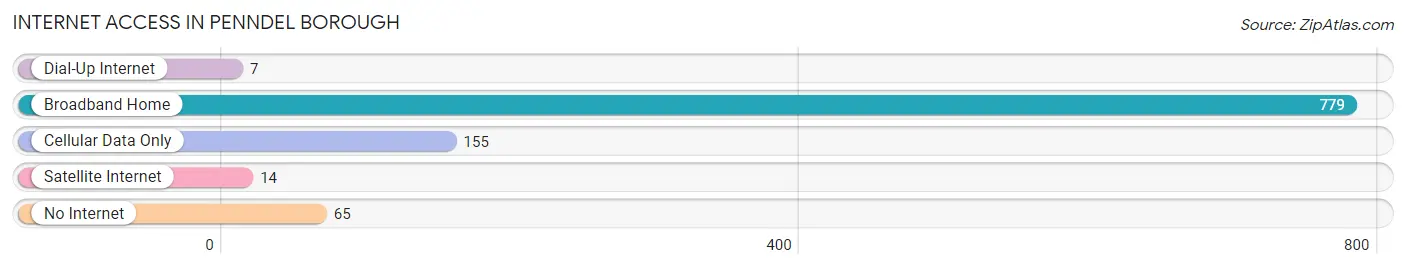
| Internet Type | # Households | % Households |
| Dial-Up Internet | 7 | 0.7% |
| Broadband Home | 779 | 76.7% |
| Cellular Data Only | 155 | 15.3% |
| Satellite Internet | 14 | 1.4% |
| No Internet | 65 | 6.4% |
| Total | 1,015 | 100.0% |
Penndel borough Summary
Pennel Borough is a small borough located in Bucks County, Pennsylvania. It is located just north of Philadelphia and is part of the Philadelphia metropolitan area. The borough has a population of approximately 4,000 people and covers an area of 1.2 square miles.
History
Pennel Borough was originally part of Middletown Township, which was established in 1692. The area was first settled in the early 1700s by Quakers from England. The area was known as “Pennel’s Corner” and was named after the Penn family, who owned a large tract of land in the area. In 1876, the area was incorporated as a borough and was named Pennel Borough.
Geography
Pennel Borough is located in Bucks County, Pennsylvania. It is located just north of Philadelphia and is part of the Philadelphia metropolitan area. The borough has a total area of 1.2 square miles, all of which is land. The borough is bordered by Middletown Township to the north, Bristol Township to the east, and Bensalem Township to the south and west.
Economy
The economy of Pennel Borough is largely based on small businesses and retail. The borough is home to several small businesses, including restaurants, shops, and professional services. The borough also has a few larger employers, such as the Pennel Borough School District and the Pennel Borough Police Department.
Demographics
As of the 2010 census, the population of Pennel Borough was 4,000. The racial makeup of the borough was 87.3% White, 8.2% African American, 0.7% Asian, 0.3% Native American, and 3.5% from other races. The median household income was $50,000 and the median family income was $60,000. The per capita income was $25,000.
Conclusion
Pennel Borough is a small borough located in Bucks County, Pennsylvania. It is located just north of Philadelphia and is part of the Philadelphia metropolitan area. The borough has a population of approximately 4,000 people and covers an area of 1.2 square miles. The economy of Pennel Borough is largely based on small businesses and retail. The racial makeup of the borough was 87.3% White, 8.2% African American, 0.7% Asian, 0.3% Native American, and 3.5% from other races. The median household income was $50,000 and the median family income was $60,000. The per capita income was $25,000. Pennel Borough is a small but vibrant community that offers its residents a variety of amenities and services.
Common Questions
What is the Total Population of Penndel borough?
Total Population of Penndel borough is 2,498.
What is the Total Male Population of Penndel borough?
Total Male Population of Penndel borough is 1,258.
What is the Total Female Population of Penndel borough?
Total Female Population of Penndel borough is 1,240.
What is the Ratio of Males per 100 Females in Penndel borough?
There are 101.45 Males per 100 Females in Penndel borough.
What is the Ratio of Females per 100 Males in Penndel borough?
There are 98.57 Females per 100 Males in Penndel borough.
What is the Median Population Age in Penndel borough?
Median Population Age in Penndel borough is 31.6 Years.
What is the Average Family Size in Penndel borough
Average Family Size in Penndel borough is 2.9 People.
What is the Average Household Size in Penndel borough
Average Household Size in Penndel borough is 2.3 People.
What is Per Capita Income in Penndel borough?
Per Capita income in Penndel borough is $40,386.
What is the Median Family Income in Penndel borough?
Median Family Income in Penndel borough is $109,214.
What is the Median Household income in Penndel borough?
Median Household Income in Penndel borough is $77,708.
What is Income or Wage Gap in Penndel borough?
Income or Wage Gap in Penndel borough is 45.1%.
Women in Penndel borough earn 54.9 cents for every dollar earned by a man.
What is Inequality or Gini Index in Penndel borough?
Inequality or Gini Index in Penndel borough is 0.46.
How Large is the Labor Force in Penndel borough?
There are 1,500 People in the Labor Forcein in Penndel borough.
What is the Percentage of People in the Labor Force in Penndel borough?
69.2% of People are in the Labor Force in Penndel borough.
What is the Unemployment Rate in Penndel borough?
Unemployment Rate in Penndel borough is 3.5%.