North Braddock borough, PA
North Braddock borough Overview
4,320
TOTAL POPULATION
1,883
MALE POPULATION
2,437
FEMALE POPULATION
77.27
MALES / 100 FEMALES
129.42
FEMALES / 100 MALES
43.8
MEDIAN AGE
3.0
AVG FAMILY SIZE
2.0
AVG HOUSEHOLD SIZE
$37,338
PER CAPITA INCOME
$47,088
AVG FAMILY INCOME
$39,885
AVG HOUSEHOLD INCOME
21.8%
WAGE / INCOME GAP [ % ]
78.2¢/ $1
WAGE / INCOME GAP [ $ ]
$8,302
FAMILY INCOME DEFICIT
0.62
INEQUALITY / GINI INDEX
2,435
LABOR FORCE [ PEOPLE ]
64.8%
PERCENT IN LABOR FORCE
16.3%
UNEMPLOYMENT RATE
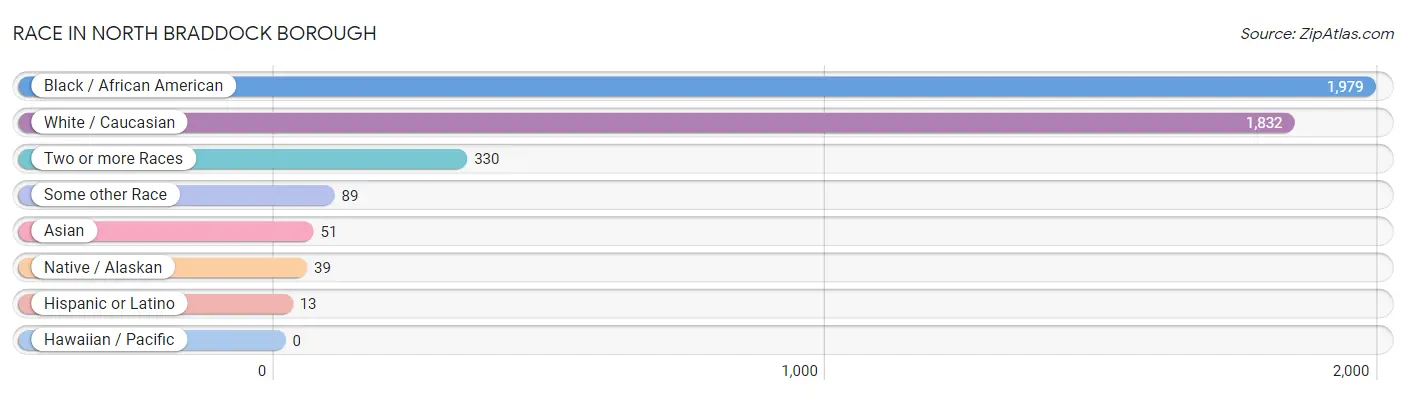
Race in North Braddock borough
The most populous races in North Braddock borough are Black / African American (1,979 | 45.8%), White / Caucasian (1,832 | 42.4%), and Two or more Races (330 | 7.6%).
| Race | # Population | % Population |
| Asian | 51 | 1.2% |
| Black / African American | 1,979 | 45.8% |
| Hawaiian / Pacific | 0 | 0.0% |
| Hispanic or Latino | 13 | 0.3% |
| Native / Alaskan | 39 | 0.9% |
| White / Caucasian | 1,832 | 42.4% |
| Two or more Races | 330 | 7.6% |
| Some other Race | 89 | 2.1% |
| Total | 4,320 | 100.0% |
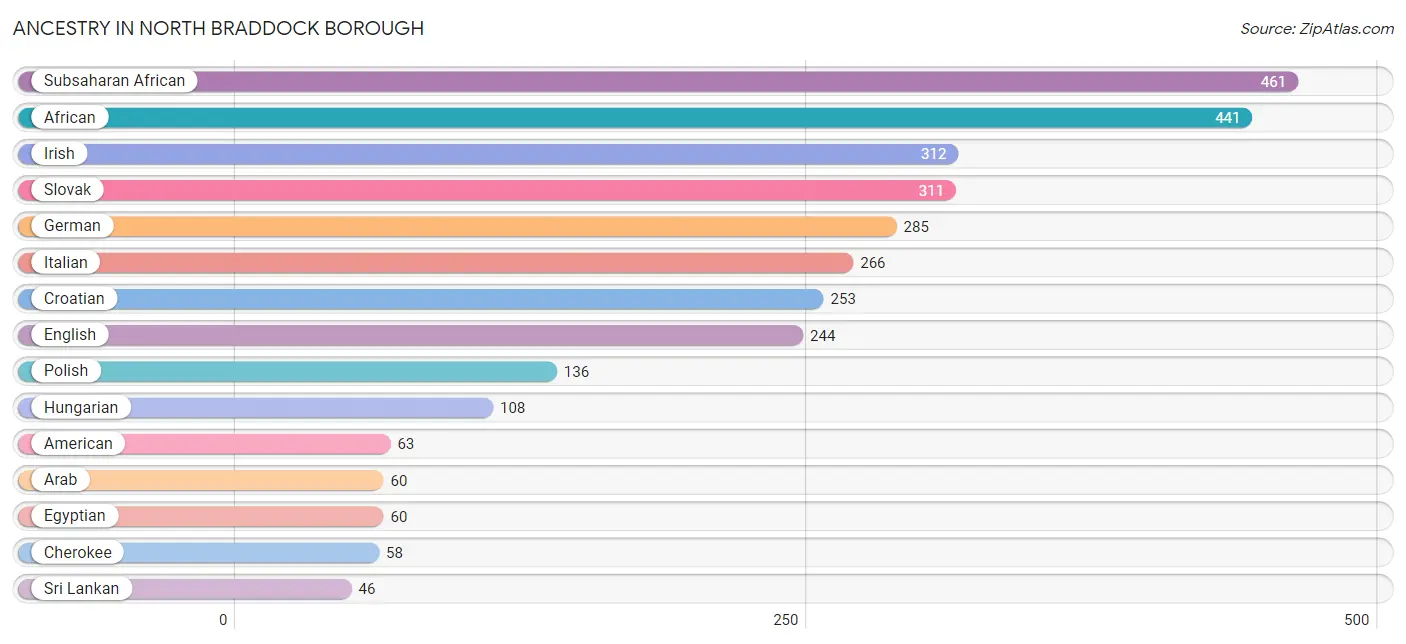
Ancestry in North Braddock borough
The most populous ancestries reported in North Braddock borough are Subsaharan African (461 | 10.7%), African (441 | 10.2%), Irish (312 | 7.2%), Slovak (311 | 7.2%), and German (285 | 6.6%), together accounting for 41.9% of all North Braddock borough residents.
| Ancestry | # Population | % Population |
| African | 441 | 10.2% |
| American | 63 | 1.5% |
| Arab | 60 | 1.4% |
| Armenian | 19 | 0.4% |
| Austrian | 14 | 0.3% |
| Belgian | 3 | 0.1% |
| Bhutanese | 3 | 0.1% |
| Cherokee | 58 | 1.3% |
| Croatian | 253 | 5.9% |
| Czech | 6 | 0.1% |
| Danish | 3 | 0.1% |
| Dutch | 9 | 0.2% |
| Egyptian | 60 | 1.4% |
| English | 244 | 5.7% |
| European | 28 | 0.6% |
| French | 22 | 0.5% |
| German | 285 | 6.6% |
| Greek | 5 | 0.1% |
| Hungarian | 108 | 2.5% |
| Indian (Asian) | 5 | 0.1% |
| Irish | 312 | 7.2% |
| Iroquois | 7 | 0.2% |
| Italian | 266 | 6.2% |
| Jamaican | 14 | 0.3% |
| Nigerian | 20 | 0.5% |
| Pennsylvania German | 6 | 0.1% |
| Polish | 136 | 3.2% |
| Russian | 37 | 0.9% |
| Scottish | 10 | 0.2% |
| Serbian | 10 | 0.2% |
| Slovak | 311 | 7.2% |
| Spaniard | 13 | 0.3% |
| Sri Lankan | 46 | 1.1% |
| Subsaharan African | 461 | 10.7% |
| Thai | 11 | 0.3% |
| Ukrainian | 24 | 0.6% | View All 36 Rows |
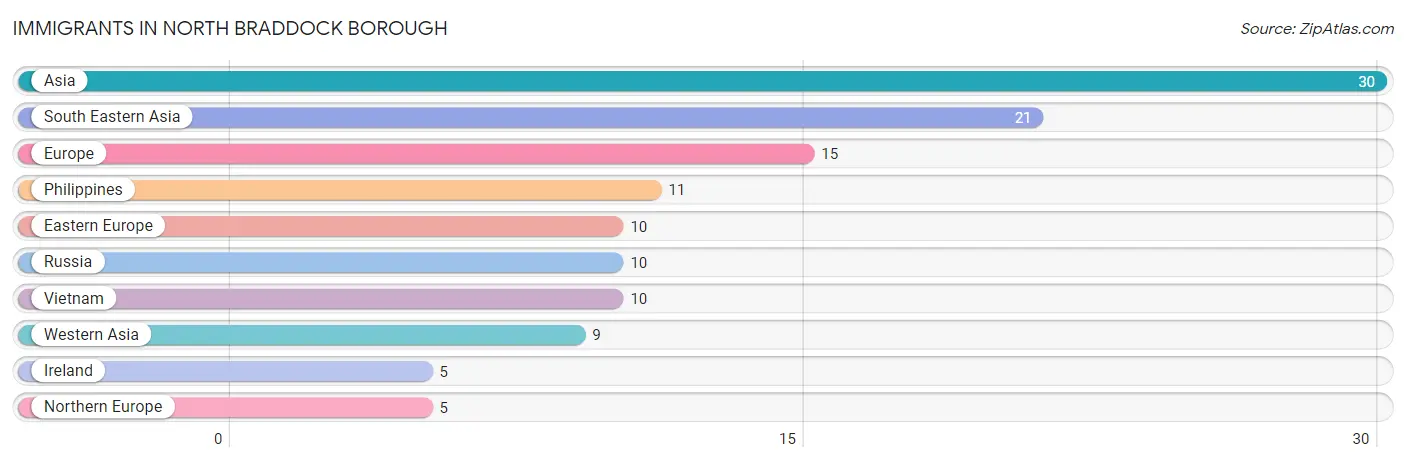
Immigrants in North Braddock borough
The most numerous immigrant groups reported in North Braddock borough came from Asia (30 | 0.7%), South Eastern Asia (21 | 0.5%), Europe (15 | 0.4%), Philippines (11 | 0.3%), and Eastern Europe (10 | 0.2%), together accounting for 2.0% of all North Braddock borough residents.
| Immigration Origin | # Population | % Population |
| Asia | 30 | 0.7% |
| Eastern Europe | 10 | 0.2% |
| Europe | 15 | 0.4% |
| Ireland | 5 | 0.1% |
| Northern Europe | 5 | 0.1% |
| Philippines | 11 | 0.3% |
| Russia | 10 | 0.2% |
| South Eastern Asia | 21 | 0.5% |
| Vietnam | 10 | 0.2% |
| Western Asia | 9 | 0.2% | View All 10 Rows |
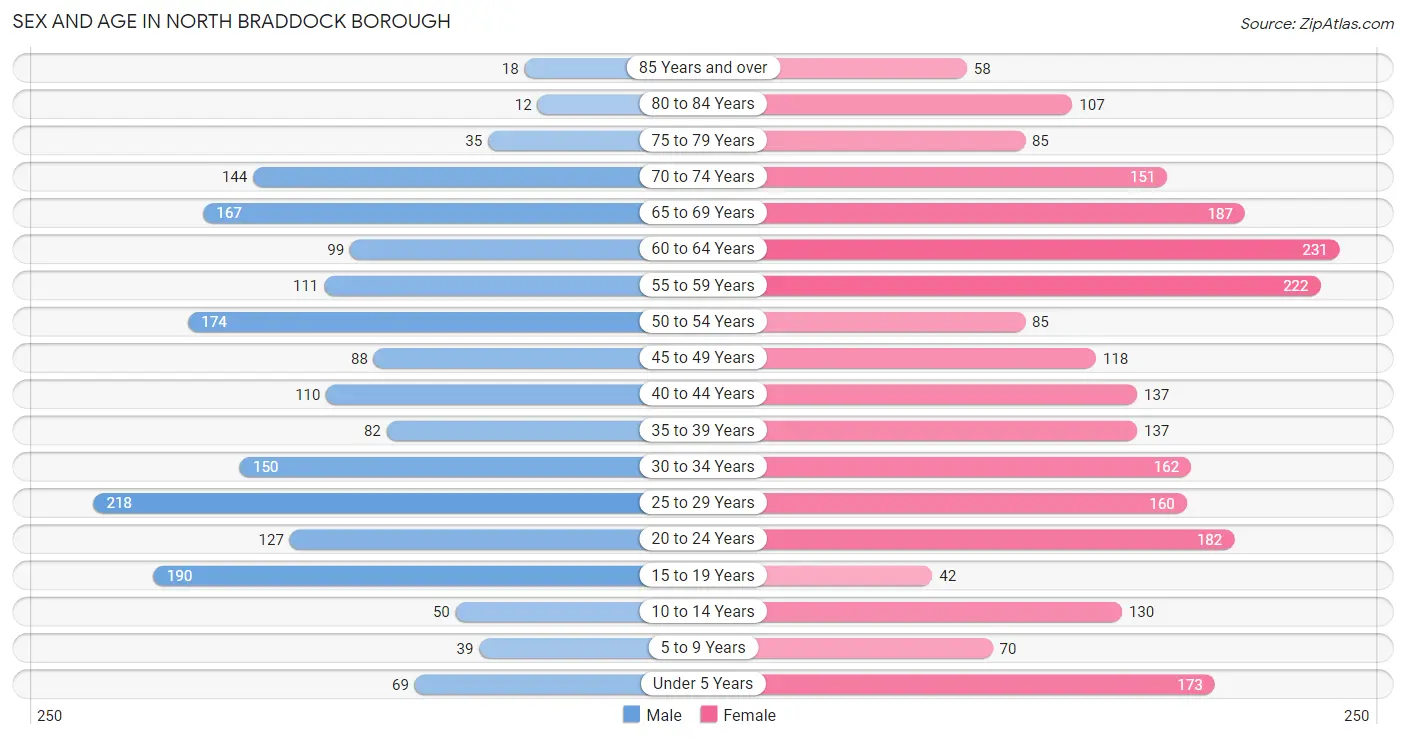
Sex and Age in North Braddock borough
Sex and Age in North Braddock borough
The most populous age groups in North Braddock borough are 25 to 29 Years (218 | 11.6%) for men and 60 to 64 Years (231 | 9.5%) for women.
| Age Bracket | Male | Female |
| Under 5 Years | 69 (3.7%) | 173 (7.1%) |
| 5 to 9 Years | 39 (2.1%) | 70 (2.9%) |
| 10 to 14 Years | 50 (2.7%) | 130 (5.3%) |
| 15 to 19 Years | 190 (10.1%) | 42 (1.7%) |
| 20 to 24 Years | 127 (6.7%) | 182 (7.5%) |
| 25 to 29 Years | 218 (11.6%) | 160 (6.6%) |
| 30 to 34 Years | 150 (8.0%) | 162 (6.7%) |
| 35 to 39 Years | 82 (4.3%) | 137 (5.6%) |
| 40 to 44 Years | 110 (5.8%) | 137 (5.6%) |
| 45 to 49 Years | 88 (4.7%) | 118 (4.8%) |
| 50 to 54 Years | 174 (9.2%) | 85 (3.5%) |
| 55 to 59 Years | 111 (5.9%) | 222 (9.1%) |
| 60 to 64 Years | 99 (5.3%) | 231 (9.5%) |
| 65 to 69 Years | 167 (8.9%) | 187 (7.7%) |
| 70 to 74 Years | 144 (7.6%) | 151 (6.2%) |
| 75 to 79 Years | 35 (1.9%) | 85 (3.5%) |
| 80 to 84 Years | 12 (0.6%) | 107 (4.4%) |
| 85 Years and over | 18 (1.0%) | 58 (2.4%) |
| Total | 1,883 (100.0%) | 2,437 (100.0%) |
Families and Households in North Braddock borough
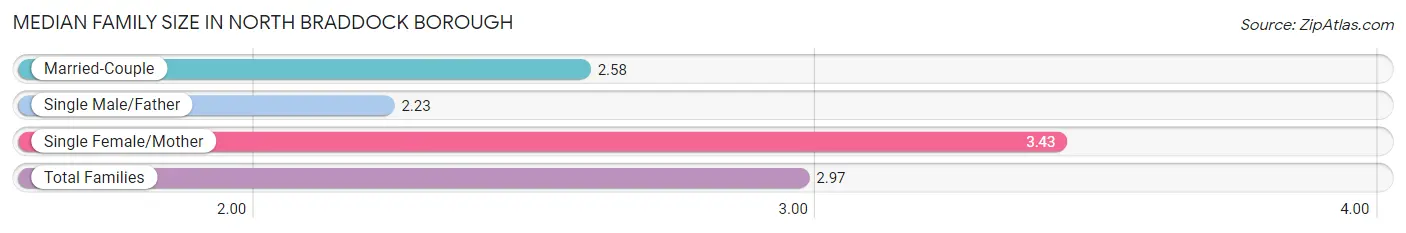
Median Family Size in North Braddock borough
The median family size in North Braddock borough is 2.97 persons per family, with single female/mother families (441 | 50.0%) accounting for the largest median family size of 3.43 persons per family. On the other hand, single male/father families (87 | 9.9%) represent the smallest median family size with 2.23 persons per family.
| Family Type | # Families | Family Size |
| Married-Couple | 354 (40.1%) | 2.58 |
| Single Male/Father | 87 (9.9%) | 2.23 |
| Single Female/Mother | 441 (50.0%) | 3.43 |
| Total Families | 882 (100.0%) | 2.97 |
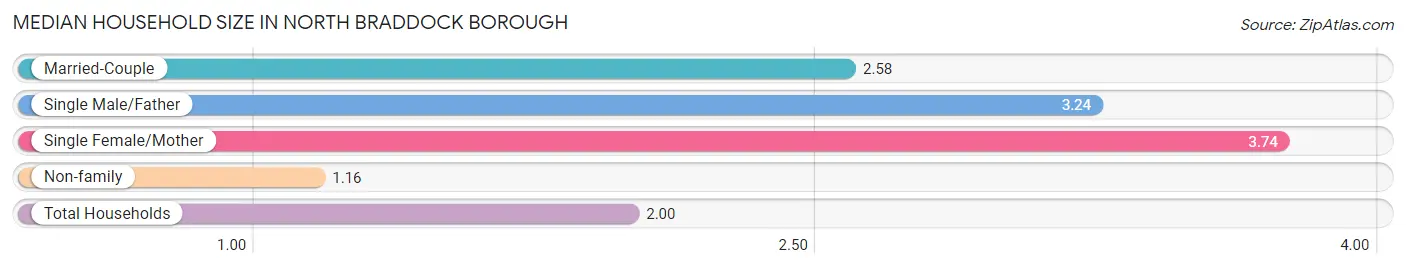
Median Household Size in North Braddock borough
The median household size in North Braddock borough is 2.00 persons per household, with single female/mother households (441 | 20.4%) accounting for the largest median household size of 3.74 persons per household. non-family households (1,276 | 59.1%) represent the smallest median household size with 1.16 persons per household.
| Household Type | # Households | Household Size |
| Married-Couple | 354 (16.4%) | 2.58 |
| Single Male/Father | 87 (4.0%) | 3.24 |
| Single Female/Mother | 441 (20.4%) | 3.74 |
| Non-family | 1,276 (59.1%) | 1.16 |
| Total Households | 2,158 (100.0%) | 2.00 |
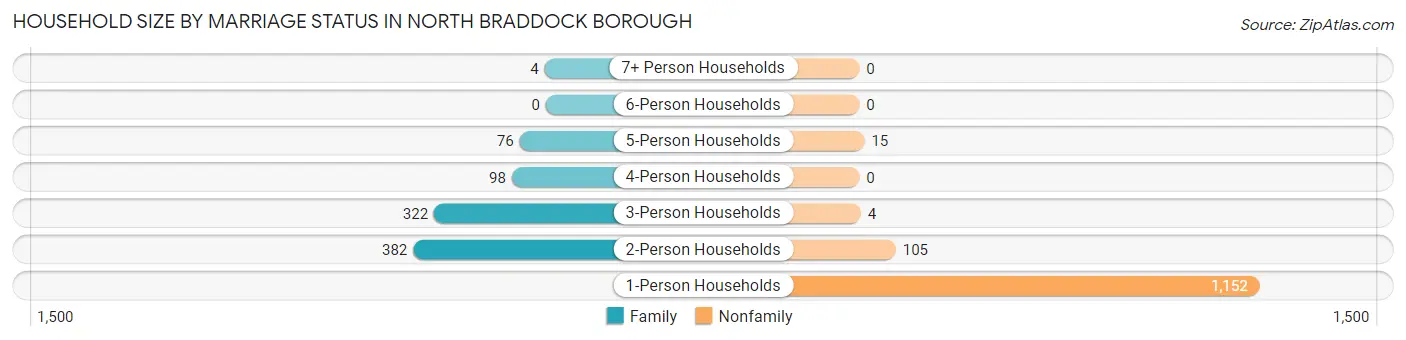
Household Size by Marriage Status in North Braddock borough
Out of a total of 2,158 households in North Braddock borough, 882 (40.9%) are family households, while 1,276 (59.1%) are nonfamily households. The most numerous type of family households are 2-person households, comprising 382, and the most common type of nonfamily households are 1-person households, comprising 1,152.
| Household Size | Family Households | Nonfamily Households |
| 1-Person Households | - | 1,152 (53.4%) |
| 2-Person Households | 382 (17.7%) | 105 (4.9%) |
| 3-Person Households | 322 (14.9%) | 4 (0.2%) |
| 4-Person Households | 98 (4.5%) | 0 (0.0%) |
| 5-Person Households | 76 (3.5%) | 15 (0.7%) |
| 6-Person Households | 0 (0.0%) | 0 (0.0%) |
| 7+ Person Households | 4 (0.2%) | 0 (0.0%) |
| Total | 882 (40.9%) | 1,276 (59.1%) |
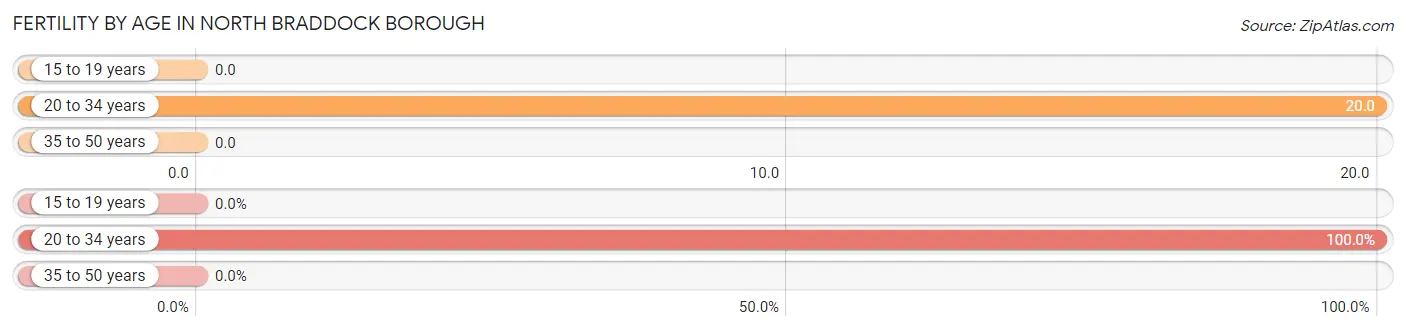
Female Fertility in North Braddock borough
Fertility by Age in North Braddock borough
Average fertility rate in North Braddock borough is 10.0 births per 1,000 women. Women in the age bracket of 20 to 34 years have the highest fertility rate with 20.0 births per 1,000 women. Women in the age bracket of 20 to 34 years acount for 100.0% of all women with births.
| Age Bracket | Women with Births | Births / 1,000 Women |
| 15 to 19 years | 0 (0.0%) | 0.0 |
| 20 to 34 years | 10 (100.0%) | 20.0 |
| 35 to 50 years | 0 (0.0%) | 0.0 |
| Total | 10 (100.0%) | 10.0 |
Fertility by Age by Marriage Status in North Braddock borough
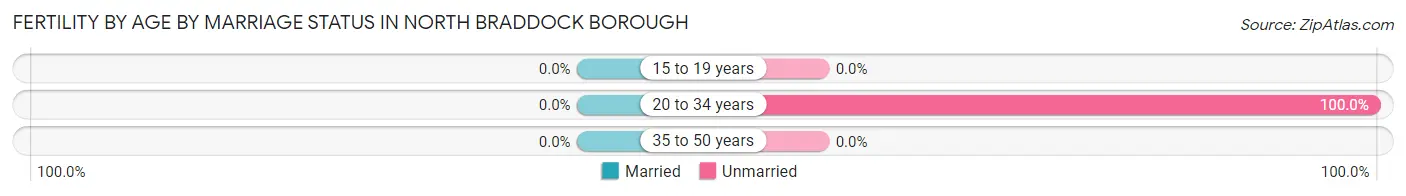
| Age Bracket | Married | Unmarried |
| 15 to 19 years | 0 (0.0%) | 0 (0.0%) |
| 20 to 34 years | 0 (0.0%) | 10 (100.0%) |
| 35 to 50 years | 0 (0.0%) | 0 (0.0%) |
| Total | 0 (0.0%) | 10 (100.0%) |
Fertility by Education in North Braddock borough
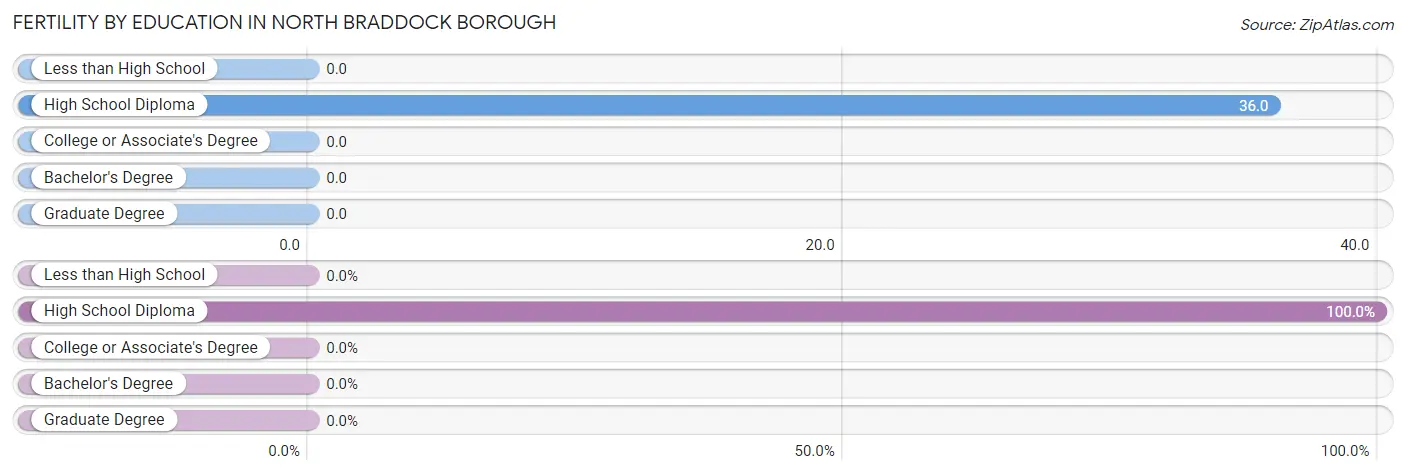
| Educational Attainment | Women with Births | Births / 1,000 Women |
| Less than High School | 0 (0.0%) | 0.0 |
| High School Diploma | 10 (100.0%) | 36.0 |
| College or Associate's Degree | 0 (0.0%) | 0.0 |
| Bachelor's Degree | 0 (0.0%) | 0.0 |
| Graduate Degree | 0 (0.0%) | 0.0 |
| Total | 10 (100.0%) | 10.0 |
Fertility by Education by Marriage Status in North Braddock borough
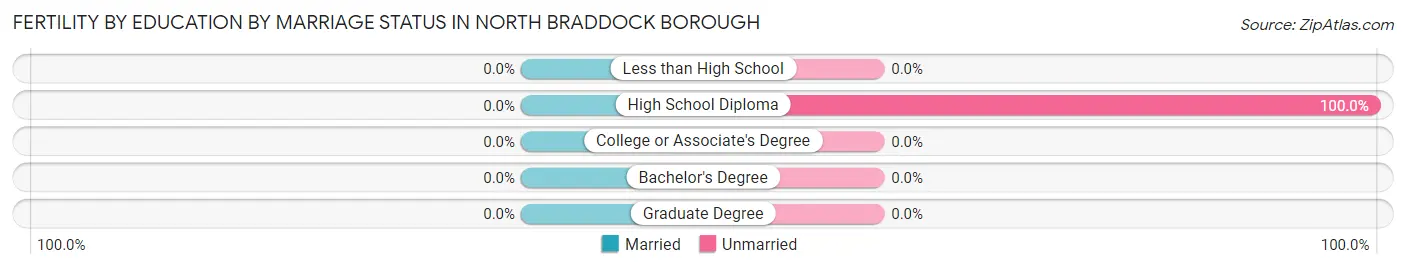
| Educational Attainment | Married | Unmarried |
| Less than High School | 0 (0.0%) | 0 (0.0%) |
| High School Diploma | 0 (0.0%) | 10 (100.0%) |
| College or Associate's Degree | 0 (0.0%) | 0 (0.0%) |
| Bachelor's Degree | 0 (0.0%) | 0 (0.0%) |
| Graduate Degree | 0 (0.0%) | 0 (0.0%) |
| Total | 0 (0.0%) | 10 (100.0%) |
Income in North Braddock borough
Income Overview in North Braddock borough
Per Capita Income in North Braddock borough is $37,338, while median incomes of families and households are $47,088 and $39,885 respectively.
| Characteristic | Number | Measure |
| Per Capita Income | 4,320 | $37,338 |
| Median Family Income | 882 | $47,088 |
| Mean Family Income | 882 | $111,321 |
| Median Household Income | 2,158 | $39,885 |
| Mean Household Income | 2,158 | $70,811 |
| Income Deficit | 882 | $8,302 |
| Wage / Income Gap (%) | 4,320 | 21.84% |
| Wage / Income Gap ($) | 4,320 | 78.16¢ per $1 |
| Gini / Inequality Index | 4,320 | 0.62 |
Earnings by Sex in North Braddock borough
Average Earnings in North Braddock borough are $31,903, $35,043 for men and $27,391 for women, a difference of 21.8%.
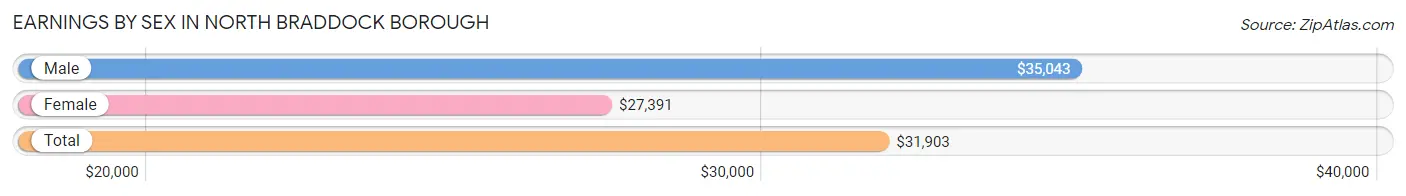
| Sex | Number | Average Earnings |
| Male | 1,134 (47.2%) | $35,043 |
| Female | 1,270 (52.8%) | $27,391 |
| Total | 2,404 (100.0%) | $31,903 |
Earnings by Sex by Income Bracket in North Braddock borough
The most common earnings brackets in North Braddock borough are $40,000 to $44,999 for men (153 | 13.5%) and $35,000 to $39,999 for women (150 | 11.8%).
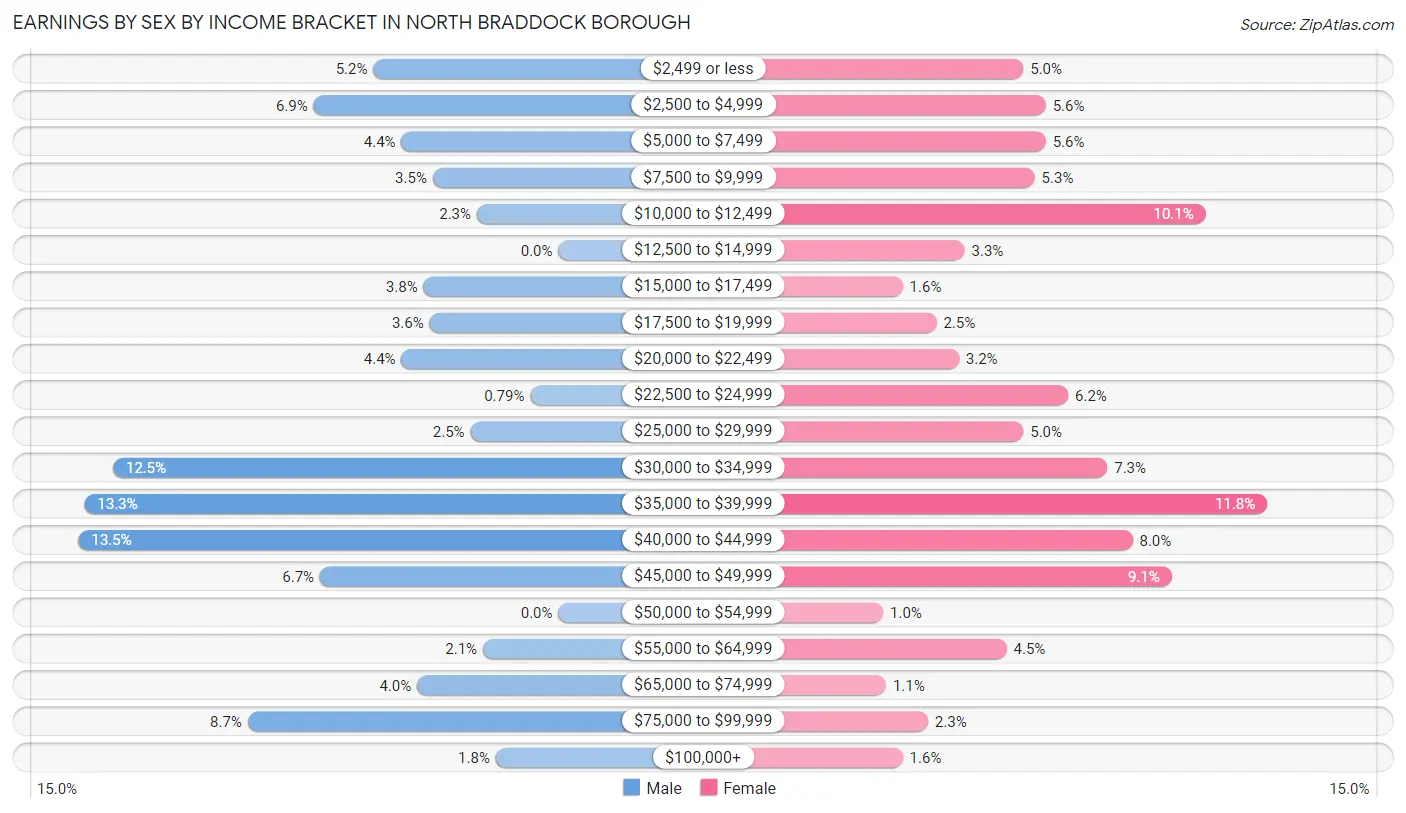
| Income | Male | Female |
| $2,499 or less | 59 (5.2%) | 63 (5.0%) |
| $2,500 to $4,999 | 78 (6.9%) | 71 (5.6%) |
| $5,000 to $7,499 | 50 (4.4%) | 71 (5.6%) |
| $7,500 to $9,999 | 40 (3.5%) | 67 (5.3%) |
| $10,000 to $12,499 | 26 (2.3%) | 128 (10.1%) |
| $12,500 to $14,999 | 0 (0.0%) | 42 (3.3%) |
| $15,000 to $17,499 | 43 (3.8%) | 20 (1.6%) |
| $17,500 to $19,999 | 41 (3.6%) | 32 (2.5%) |
| $20,000 to $22,499 | 50 (4.4%) | 40 (3.2%) |
| $22,500 to $24,999 | 9 (0.8%) | 79 (6.2%) |
| $25,000 to $29,999 | 28 (2.5%) | 63 (5.0%) |
| $30,000 to $34,999 | 142 (12.5%) | 93 (7.3%) |
| $35,000 to $39,999 | 151 (13.3%) | 150 (11.8%) |
| $40,000 to $44,999 | 153 (13.5%) | 102 (8.0%) |
| $45,000 to $49,999 | 76 (6.7%) | 116 (9.1%) |
| $50,000 to $54,999 | 0 (0.0%) | 13 (1.0%) |
| $55,000 to $64,999 | 24 (2.1%) | 57 (4.5%) |
| $65,000 to $74,999 | 45 (4.0%) | 14 (1.1%) |
| $75,000 to $99,999 | 99 (8.7%) | 29 (2.3%) |
| $100,000+ | 20 (1.8%) | 20 (1.6%) |
| Total | 1,134 (100.0%) | 1,270 (100.0%) |
Earnings by Sex by Educational Attainment in North Braddock borough
Average earnings in North Braddock borough are $38,266 for men and $31,523 for women, a difference of 17.6%. Men with an educational attainment of high school diploma enjoy the highest average annual earnings of $41,250, while those with graduate degree education earn the least with $4,328. Women with an educational attainment of graduate degree earn the most with the average annual earnings of $41,944, while those with less than high school education have the smallest earnings of $20,598.
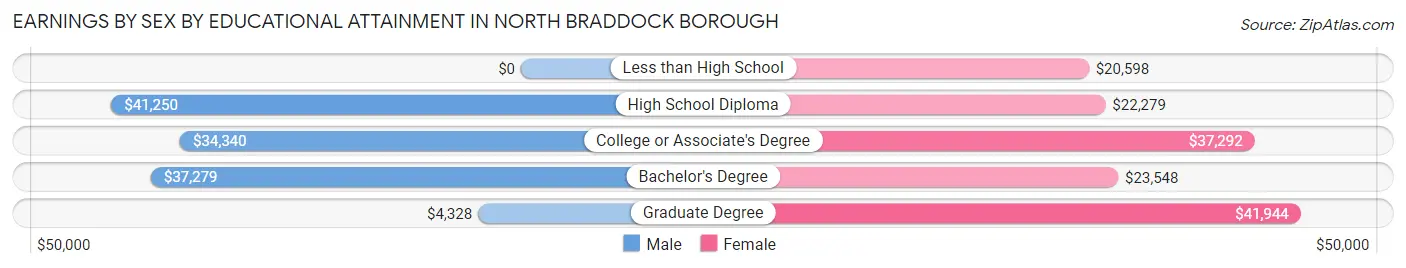
| Educational Attainment | Male Income | Female Income |
| Less than High School | - | - |
| High School Diploma | $41,250 | $22,279 |
| College or Associate's Degree | $34,340 | $37,292 |
| Bachelor's Degree | $37,279 | $23,548 |
| Graduate Degree | $4,328 | $41,944 |
| Total | $38,266 | $31,523 |
Family Income in North Braddock borough
Family Income Brackets in North Braddock borough
According to the North Braddock borough family income data, there are 200 families falling into the $35,000 to $49,999 income range, which is the most common income bracket and makes up 22.7% of all families. Conversely, the $150,000 to $199,999 income bracket is the least frequent group with only 13 families (1.5%) belonging to this category.
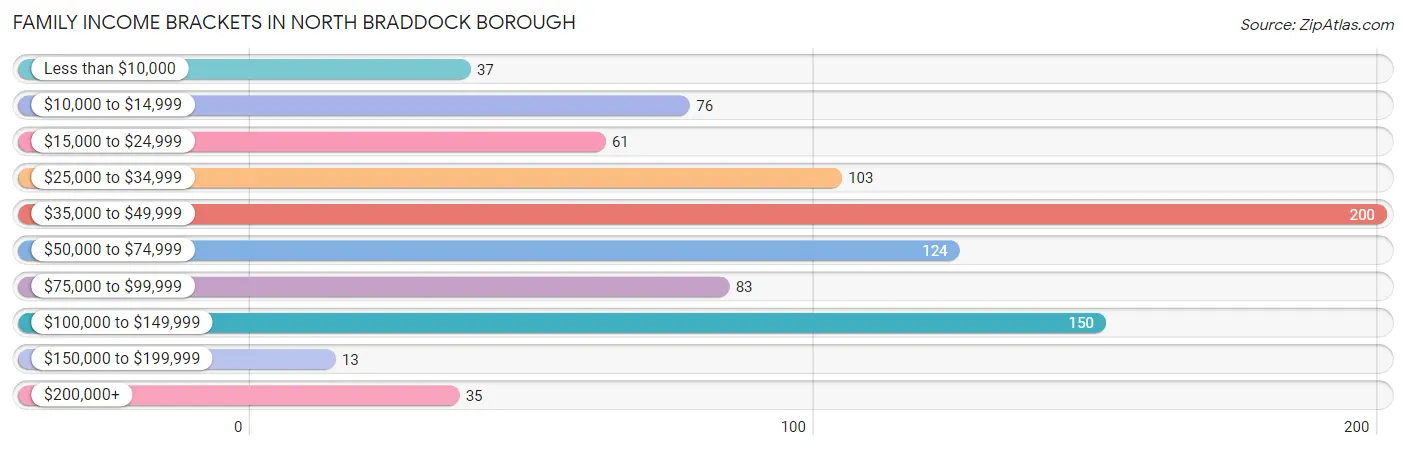
| Income Bracket | # Families | % Families |
| Less than $10,000 | 37 | 4.2% |
| $10,000 to $14,999 | 76 | 8.6% |
| $15,000 to $24,999 | 61 | 6.9% |
| $25,000 to $34,999 | 103 | 11.7% |
| $35,000 to $49,999 | 200 | 22.7% |
| $50,000 to $74,999 | 124 | 14.1% |
| $75,000 to $99,999 | 83 | 9.4% |
| $100,000 to $149,999 | 150 | 17.0% |
| $150,000 to $199,999 | 13 | 1.5% |
| $200,000+ | 35 | 4.0% |
Family Income by Famaliy Size in North Braddock borough
3-person families (235 | 26.6%) account for the highest median family income in North Braddock borough with $63,750 per family, while 2-person families (489 | 55.4%) have the highest median income of $22,741 per family member.
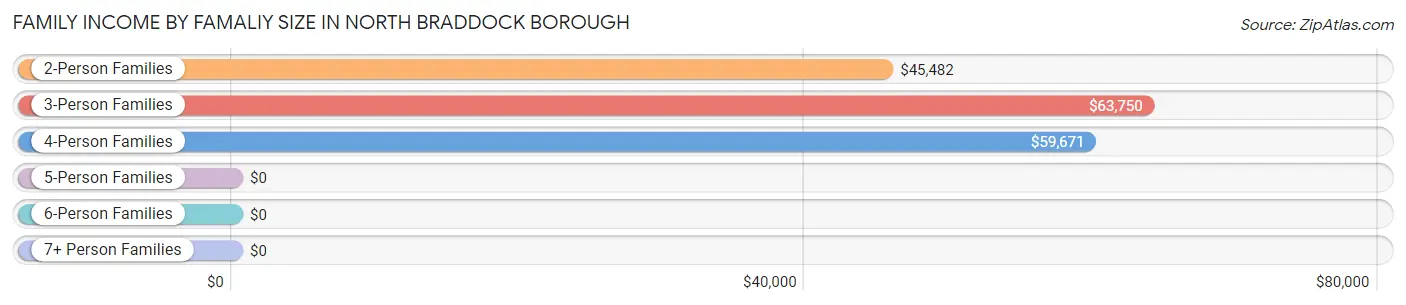
| Income Bracket | # Families | Median Income |
| 2-Person Families | 489 (55.4%) | $45,482 |
| 3-Person Families | 235 (26.6%) | $63,750 |
| 4-Person Families | 150 (17.0%) | $59,671 |
| 5-Person Families | 4 (0.4%) | $0 |
| 6-Person Families | 0 (0.0%) | $0 |
| 7+ Person Families | 4 (0.4%) | $0 |
| Total | 882 (100.0%) | $47,088 |
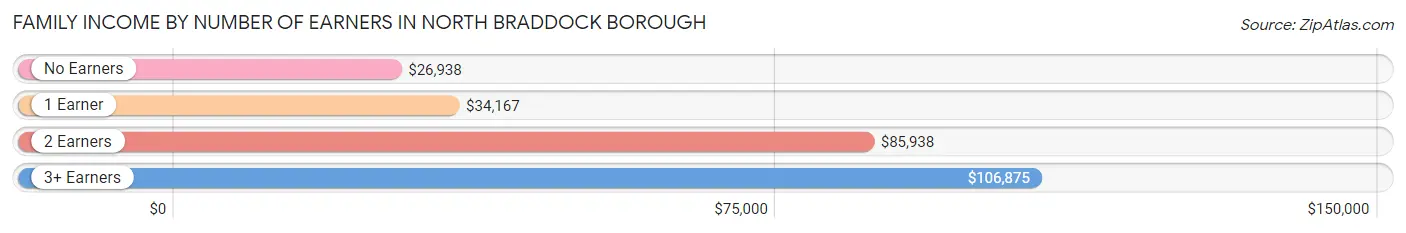
Family Income by Number of Earners in North Braddock borough
The median family income in North Braddock borough is $47,088, with families comprising 3+ earners (45) having the highest median family income of $106,875, while families with no earners (187) have the lowest median family income of $26,938, accounting for 5.1% and 21.2% of families, respectively.
| Number of Earners | # Families | Median Income |
| No Earners | 187 (21.2%) | $26,938 |
| 1 Earner | 308 (34.9%) | $34,167 |
| 2 Earners | 342 (38.8%) | $85,938 |
| 3+ Earners | 45 (5.1%) | $106,875 |
| Total | 882 (100.0%) | $47,088 |
Household Income in North Braddock borough
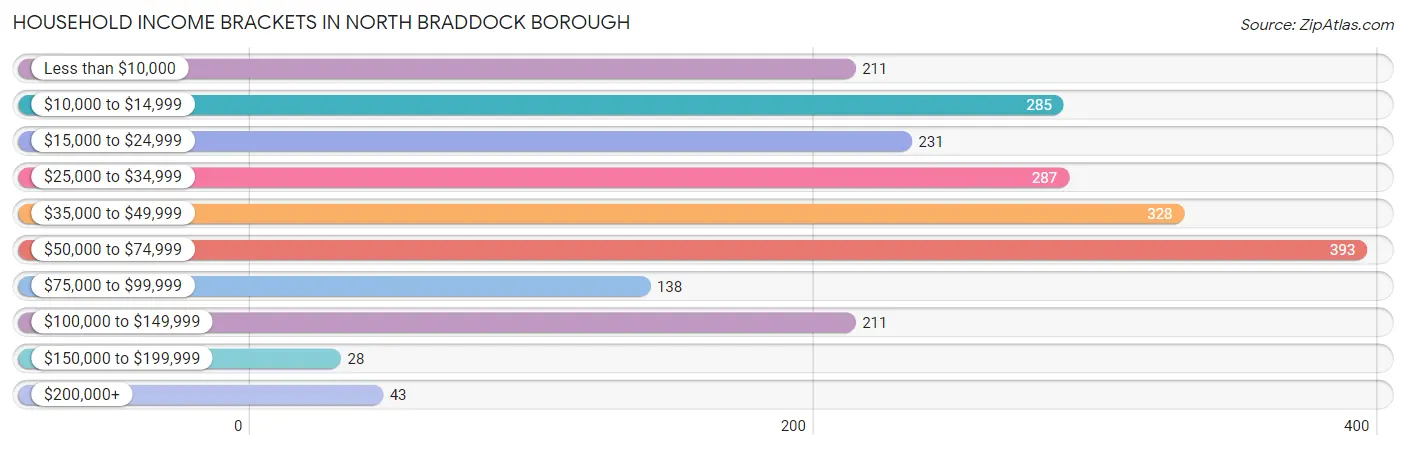
Household Income Brackets in North Braddock borough
With 393 households falling in the category, the $50,000 to $74,999 income range is the most frequent in North Braddock borough, accounting for 18.2% of all households. In contrast, only 28 households (1.3%) fall into the $150,000 to $199,999 income bracket, making it the least populous group.
| Income Bracket | # Households | % Households |
| Less than $10,000 | 211 | 9.8% |
| $10,000 to $14,999 | 285 | 13.2% |
| $15,000 to $24,999 | 231 | 10.7% |
| $25,000 to $34,999 | 287 | 13.3% |
| $35,000 to $49,999 | 328 | 15.2% |
| $50,000 to $74,999 | 393 | 18.2% |
| $75,000 to $99,999 | 138 | 6.4% |
| $100,000 to $149,999 | 211 | 9.8% |
| $150,000 to $199,999 | 28 | 1.3% |
| $200,000+ | 43 | 2.0% |
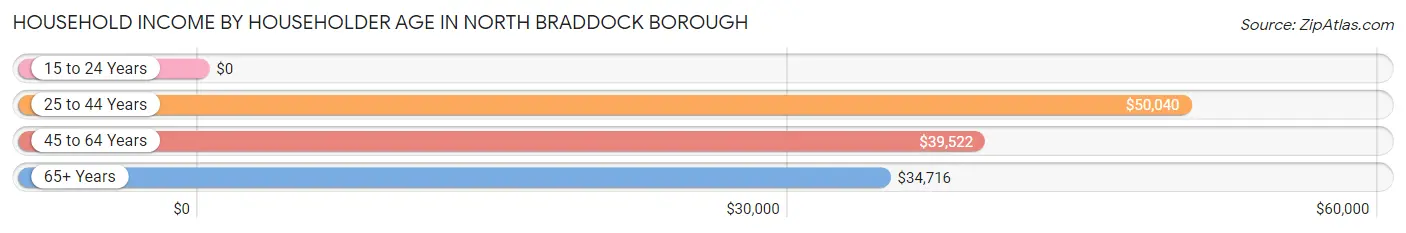
Household Income by Householder Age in North Braddock borough
The median household income in North Braddock borough is $39,885, with the highest median household income of $50,040 found in the 25 to 44 years age bracket for the primary householder. A total of 605 households (28.0%) fall into this category. Meanwhile, the 15 to 24 years age bracket for the primary householder has the lowest median household income of $0, with 53 households (2.5%) in this group.
| Income Bracket | # Households | Median Income |
| 15 to 24 Years | 53 (2.5%) | $0 |
| 25 to 44 Years | 605 (28.0%) | $50,040 |
| 45 to 64 Years | 829 (38.4%) | $39,522 |
| 65+ Years | 671 (31.1%) | $34,716 |
| Total | 2,158 (100.0%) | $39,885 |
Poverty in North Braddock borough
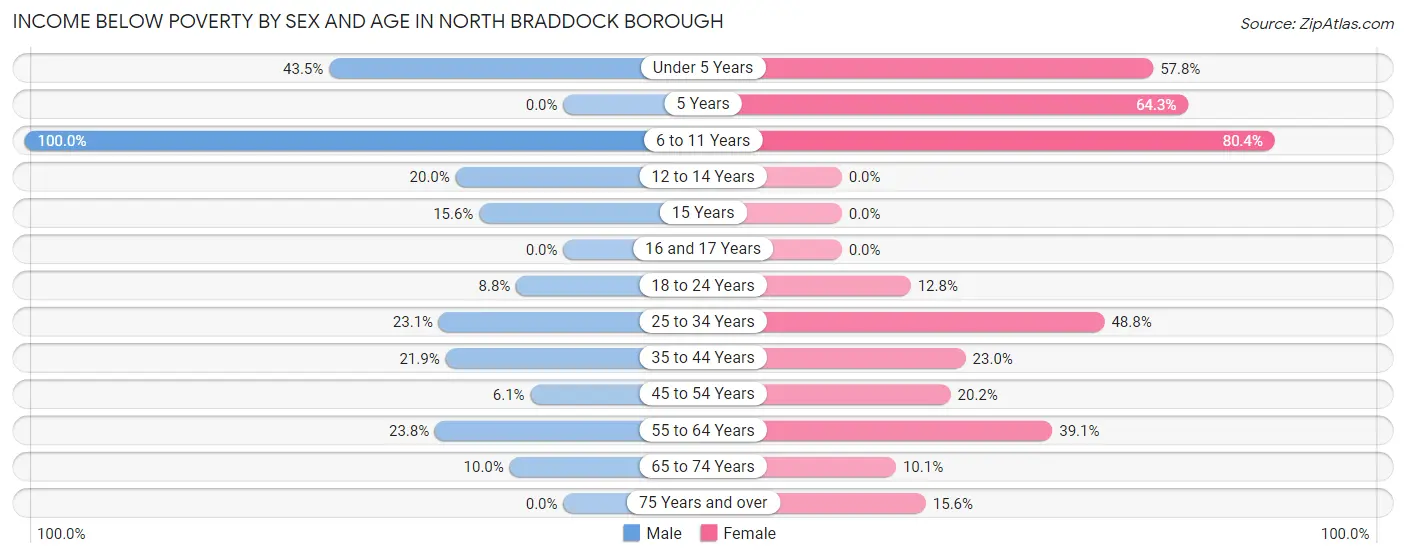
Income Below Poverty by Sex and Age in North Braddock borough
With 16.7% poverty level for males and 30.6% for females among the residents of North Braddock borough, 6 to 11 year old males and 6 to 11 year old females are the most vulnerable to poverty, with 28 males (100.0%) and 90 females (80.4%) in their respective age groups living below the poverty level.
| Age Bracket | Male | Female |
| Under 5 Years | 30 (43.5%) | 100 (57.8%) |
| 5 Years | 0 (0.0%) | 18 (64.3%) |
| 6 to 11 Years | 28 (100.0%) | 90 (80.4%) |
| 12 to 14 Years | 10 (20.0%) | 0 (0.0%) |
| 15 Years | 5 (15.6%) | 0 (0.0%) |
| 16 and 17 Years | 0 (0.0%) | 0 (0.0%) |
| 18 to 24 Years | 17 (8.8%) | 27 (12.8%) |
| 25 to 34 Years | 85 (23.1%) | 157 (48.8%) |
| 35 to 44 Years | 42 (21.9%) | 63 (23.0%) |
| 45 to 54 Years | 16 (6.1%) | 41 (20.2%) |
| 55 to 64 Years | 50 (23.8%) | 177 (39.1%) |
| 65 to 74 Years | 31 (10.0%) | 34 (10.1%) |
| 75 Years and over | 0 (0.0%) | 39 (15.6%) |
| Total | 314 (16.7%) | 746 (30.6%) |
Income Above Poverty by Sex and Age in North Braddock borough
According to the poverty statistics in North Braddock borough, males aged 5 years and females aged 12 to 14 years are the age groups that are most secure financially, with 100.0% of males and 100.0% of females in these age groups living above the poverty line.

| Age Bracket | Male | Female |
| Under 5 Years | 39 (56.5%) | 73 (42.2%) |
| 5 Years | 11 (100.0%) | 10 (35.7%) |
| 6 to 11 Years | 0 (0.0%) | 22 (19.6%) |
| 12 to 14 Years | 40 (80.0%) | 60 (100.0%) |
| 15 Years | 27 (84.4%) | 0 (0.0%) |
| 16 and 17 Years | 91 (100.0%) | 13 (100.0%) |
| 18 to 24 Years | 177 (91.2%) | 184 (87.2%) |
| 25 to 34 Years | 283 (76.9%) | 165 (51.2%) |
| 35 to 44 Years | 150 (78.1%) | 211 (77.0%) |
| 45 to 54 Years | 246 (93.9%) | 162 (79.8%) |
| 55 to 64 Years | 160 (76.2%) | 276 (60.9%) |
| 65 to 74 Years | 280 (90.0%) | 304 (89.9%) |
| 75 Years and over | 65 (100.0%) | 211 (84.4%) |
| Total | 1,569 (83.3%) | 1,691 (69.4%) |
Income Below Poverty Among Married-Couple Families in North Braddock borough
The poverty statistics for married-couple families in North Braddock borough show that 13.3% or 47 of the total 354 families live below the poverty line. Families with 5 or more children have the highest poverty rate of 100.0%, comprising of 4 families. On the other hand, families with 1 or 2 children have the lowest poverty rate of 0.0%, which includes 0 families.
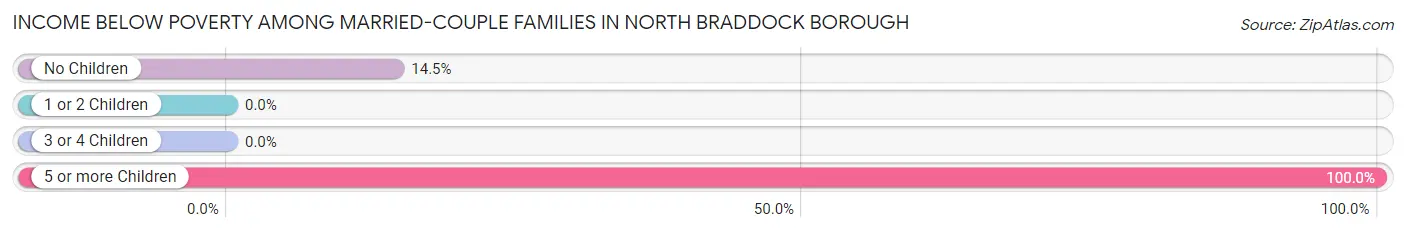
| Children | Above Poverty | Below Poverty |
| No Children | 254 (85.5%) | 43 (14.5%) |
| 1 or 2 Children | 53 (100.0%) | 0 (0.0%) |
| 3 or 4 Children | 0 (0.0%) | 0 (0.0%) |
| 5 or more Children | 0 (0.0%) | 4 (100.0%) |
| Total | 307 (86.7%) | 47 (13.3%) |
Income Below Poverty Among Single-Parent Households in North Braddock borough
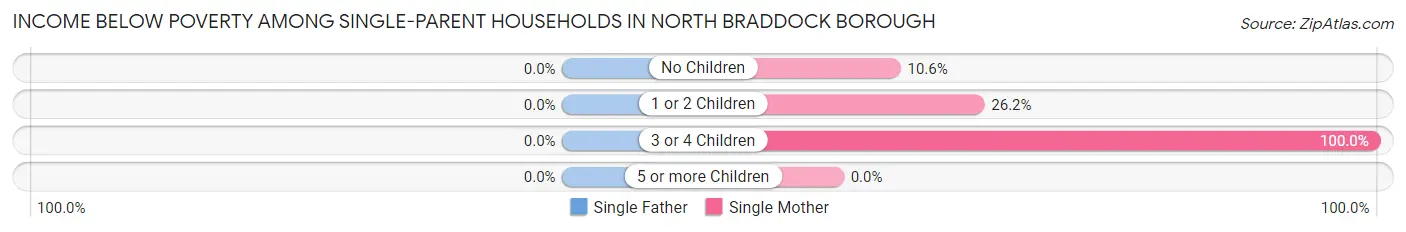
| Children | Single Father | Single Mother |
| No Children | 0 (0.0%) | 16 (10.6%) |
| 1 or 2 Children | 0 (0.0%) | 65 (26.2%) |
| 3 or 4 Children | 0 (0.0%) | 42 (100.0%) |
| 5 or more Children | 0 (0.0%) | 0 (0.0%) |
| Total | 0 (0.0%) | 123 (27.9%) |
Income Below Poverty Among Married-Couple vs Single-Parent Households in North Braddock borough
The poverty data for North Braddock borough shows that 47 of the married-couple family households (13.3%) and 123 of the single-parent households (23.3%) are living below the poverty level. Within the married-couple family households, those with 5 or more children have the highest poverty rate, with 4 households (100.0%) falling below the poverty line. Among the single-parent households, those with 3 or 4 children have the highest poverty rate, with 42 household (100.0%) living below poverty.
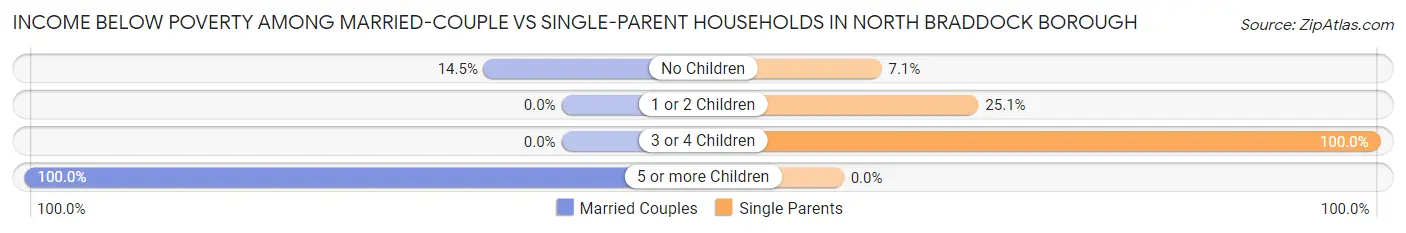
| Children | Married-Couple Families | Single-Parent Households |
| No Children | 43 (14.5%) | 16 (7.0%) |
| 1 or 2 Children | 0 (0.0%) | 65 (25.1%) |
| 3 or 4 Children | 0 (0.0%) | 42 (100.0%) |
| 5 or more Children | 4 (100.0%) | 0 (0.0%) |
| Total | 47 (13.3%) | 123 (23.3%) |
Employment Characteristics in North Braddock borough
Employment by Class of Employer in North Braddock borough
Among the 1,906 employed individuals in North Braddock borough, private company employees (1,090 | 57.2%), not-for-profit organizations (468 | 24.5%), and self-employed (not incorporated) (106 | 5.6%) make up the most common classes of employment.
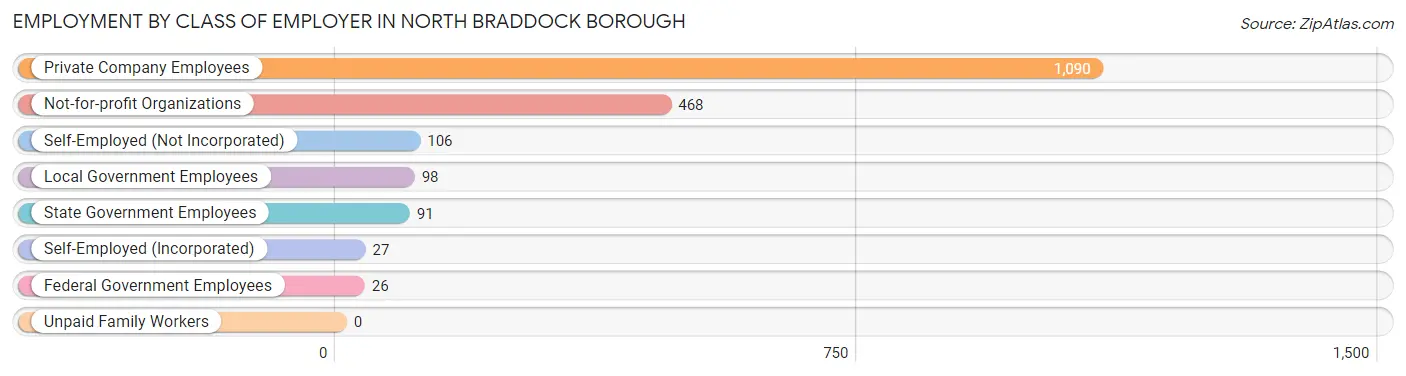
| Employer Class | # Employees | % Employees |
| Private Company Employees | 1,090 | 57.2% |
| Self-Employed (Incorporated) | 27 | 1.4% |
| Self-Employed (Not Incorporated) | 106 | 5.6% |
| Not-for-profit Organizations | 468 | 24.5% |
| Local Government Employees | 98 | 5.1% |
| State Government Employees | 91 | 4.8% |
| Federal Government Employees | 26 | 1.4% |
| Unpaid Family Workers | 0 | 0.0% |
| Total | 1,906 | 100.0% |
Employment Status by Age in North Braddock borough
According to the labor force statistics for North Braddock borough, out of the total population over 16 years of age (3,757), 64.8% or 2,435 individuals are in the labor force, with 16.3% or 397 of them unemployed. The age group with the highest labor force participation rate is 20 to 24 years, with 97.4% or 301 individuals in the labor force. Within the labor force, the 25 to 29 years age range has the highest percentage of unemployed individuals, with 46.9% or 172 of them being unemployed.
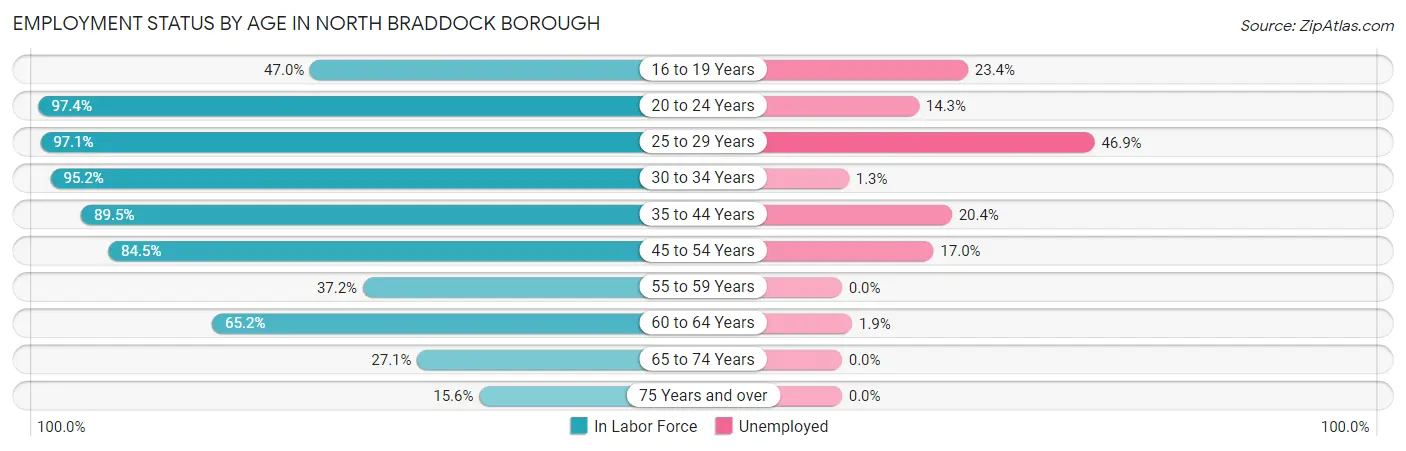
| Age Bracket | In Labor Force | Unemployed |
| 16 to 19 Years | 94 (47.0%) | 22 (23.4%) |
| 20 to 24 Years | 301 (97.4%) | 43 (14.3%) |
| 25 to 29 Years | 367 (97.1%) | 172 (46.9%) |
| 30 to 34 Years | 297 (95.2%) | 4 (1.3%) |
| 35 to 44 Years | 417 (89.5%) | 85 (20.4%) |
| 45 to 54 Years | 393 (84.5%) | 67 (17.0%) |
| 55 to 59 Years | 124 (37.2%) | 0 (0.0%) |
| 60 to 64 Years | 215 (65.2%) | 4 (1.9%) |
| 65 to 74 Years | 176 (27.1%) | 0 (0.0%) |
| 75 Years and over | 49 (15.6%) | 0 (0.0%) |
| Total | 2,435 (64.8%) | 397 (16.3%) |
Employment Status by Educational Attainment in North Braddock borough
According to labor force statistics for North Braddock borough, 79.4% of individuals (1,813) out of the total population between 25 and 64 years of age (2,284) are in the labor force, with 18.3% or 332 of them being unemployed. The group with the highest labor force participation rate are those with the educational attainment of college / associate degree, with 82.5% or 694 individuals in the labor force. Within the labor force, individuals with less than high school education have the highest percentage of unemployment, with 41.4% or 29 of them being unemployed.
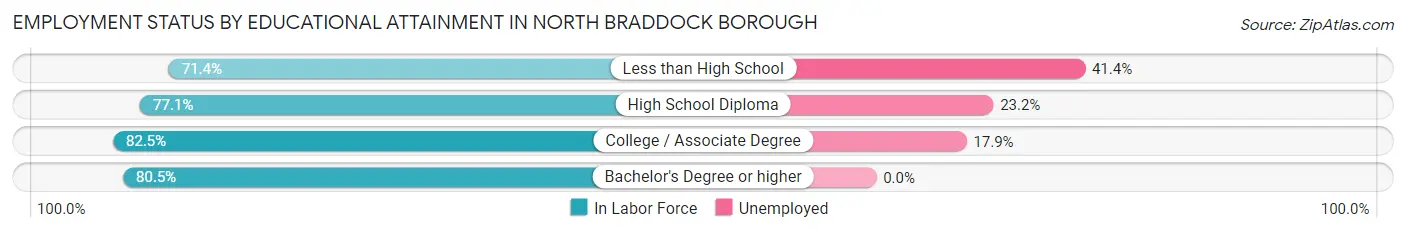
| Educational Attainment | In Labor Force | Unemployed |
| Less than High School | 70 (71.4%) | 41 (41.4%) |
| High School Diploma | 772 (77.1%) | 232 (23.2%) |
| College / Associate Degree | 694 (82.5%) | 151 (17.9%) |
| Bachelor's Degree or higher | 277 (80.5%) | 0 (0.0%) |
| Total | 1,813 (79.4%) | 418 (18.3%) |
Employment Occupations by Sex in North Braddock borough
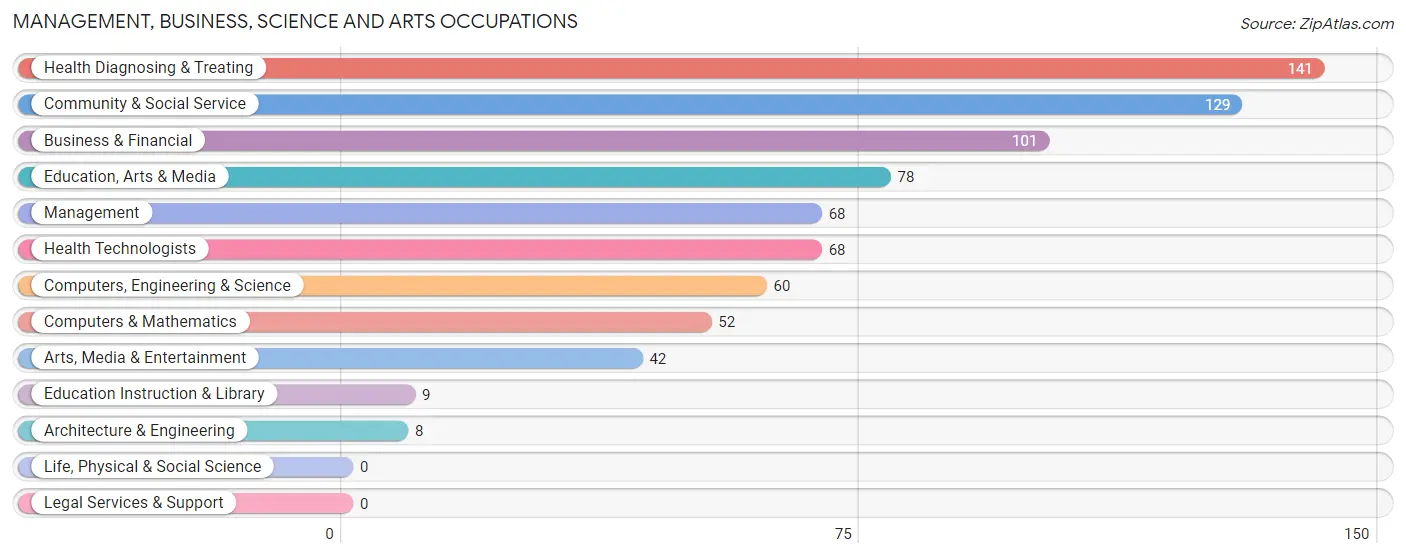
Management, Business, Science and Arts Occupations
The most common Management, Business, Science and Arts occupations in North Braddock borough are Health Diagnosing & Treating (141 | 6.9%), Community & Social Service (129 | 6.3%), Business & Financial (101 | 5.0%), Education, Arts & Media (78 | 3.8%), and Management (68 | 3.3%).
Management, Business, Science and Arts Occupations by Sex
Within the Management, Business, Science and Arts occupations in North Braddock borough, the most male-oriented occupations are Architecture & Engineering (100.0%), Education, Arts & Media (48.7%), and Management (44.1%), while the most female-oriented occupations are Computers & Mathematics (100.0%), Education Instruction & Library (100.0%), and Health Technologists (100.0%).
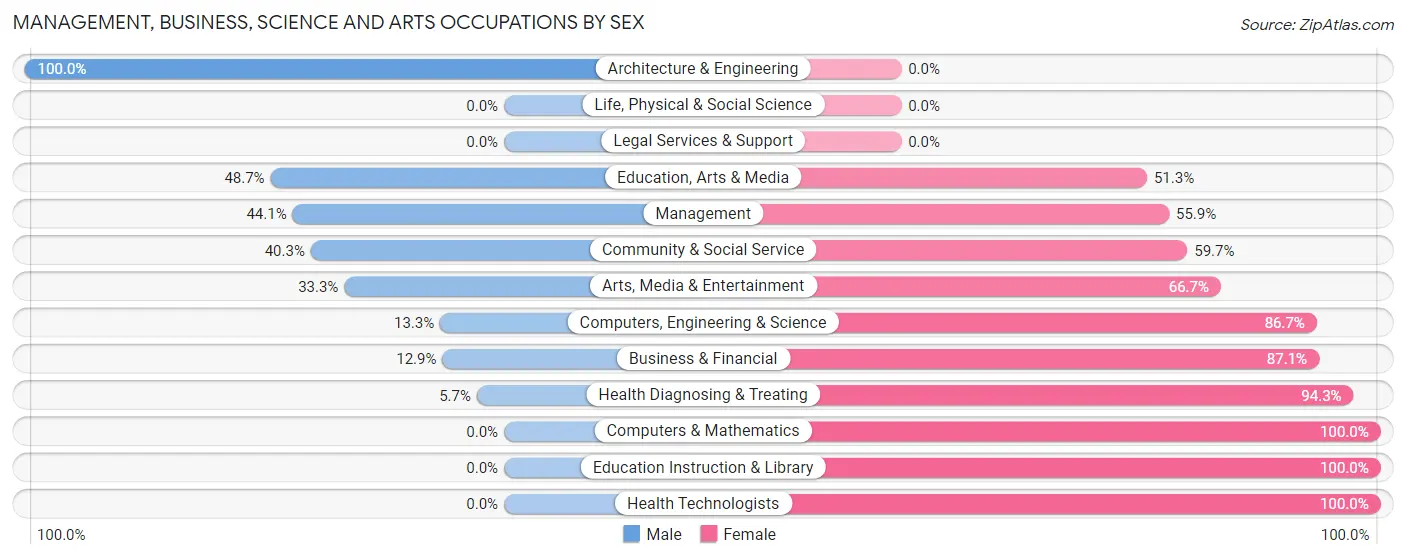
| Occupation | Male | Female |
| Management | 30 (44.1%) | 38 (55.9%) |
| Business & Financial | 13 (12.9%) | 88 (87.1%) |
| Computers, Engineering & Science | 8 (13.3%) | 52 (86.7%) |
| Computers & Mathematics | 0 (0.0%) | 52 (100.0%) |
| Architecture & Engineering | 8 (100.0%) | 0 (0.0%) |
| Life, Physical & Social Science | 0 (0.0%) | 0 (0.0%) |
| Community & Social Service | 52 (40.3%) | 77 (59.7%) |
| Education, Arts & Media | 38 (48.7%) | 40 (51.3%) |
| Legal Services & Support | 0 (0.0%) | 0 (0.0%) |
| Education Instruction & Library | 0 (0.0%) | 9 (100.0%) |
| Arts, Media & Entertainment | 14 (33.3%) | 28 (66.7%) |
| Health Diagnosing & Treating | 8 (5.7%) | 133 (94.3%) |
| Health Technologists | 0 (0.0%) | 68 (100.0%) |
| Total (Category) | 111 (22.2%) | 388 (77.8%) |
| Total (Overall) | 853 (41.9%) | 1,183 (58.1%) |
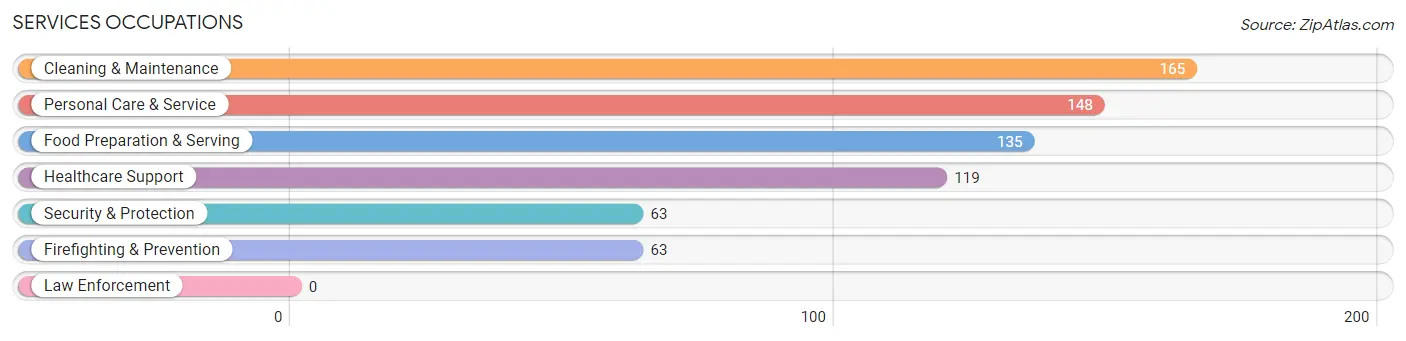
Services Occupations
The most common Services occupations in North Braddock borough are Cleaning & Maintenance (165 | 8.1%), Personal Care & Service (148 | 7.3%), Food Preparation & Serving (135 | 6.6%), Healthcare Support (119 | 5.8%), and Security & Protection (63 | 3.1%).
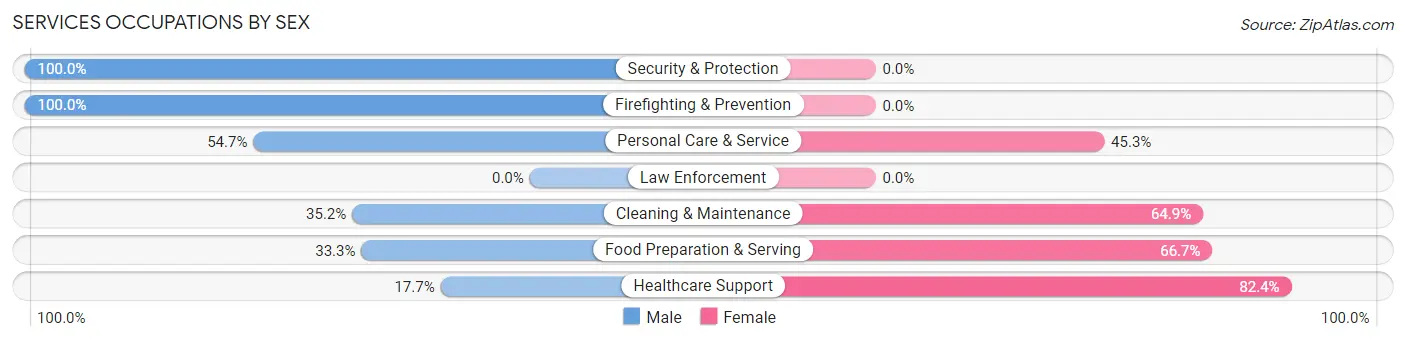
Services Occupations by Sex
Within the Services occupations in North Braddock borough, the most male-oriented occupations are Security & Protection (100.0%), Firefighting & Prevention (100.0%), and Personal Care & Service (54.7%), while the most female-oriented occupations are Healthcare Support (82.4%), Food Preparation & Serving (66.7%), and Cleaning & Maintenance (64.8%).
| Occupation | Male | Female |
| Healthcare Support | 21 (17.6%) | 98 (82.4%) |
| Security & Protection | 63 (100.0%) | 0 (0.0%) |
| Firefighting & Prevention | 63 (100.0%) | 0 (0.0%) |
| Law Enforcement | 0 (0.0%) | 0 (0.0%) |
| Food Preparation & Serving | 45 (33.3%) | 90 (66.7%) |
| Cleaning & Maintenance | 58 (35.1%) | 107 (64.8%) |
| Personal Care & Service | 81 (54.7%) | 67 (45.3%) |
| Total (Category) | 268 (42.5%) | 362 (57.5%) |
| Total (Overall) | 853 (41.9%) | 1,183 (58.1%) |
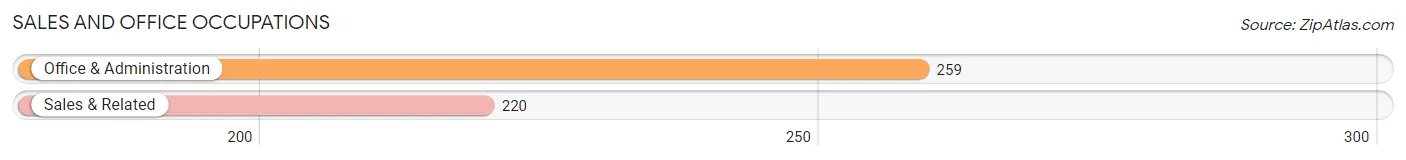
Sales and Office Occupations
The most common Sales and Office occupations in North Braddock borough are Office & Administration (259 | 12.7%), and Sales & Related (220 | 10.8%).
Sales and Office Occupations by Sex
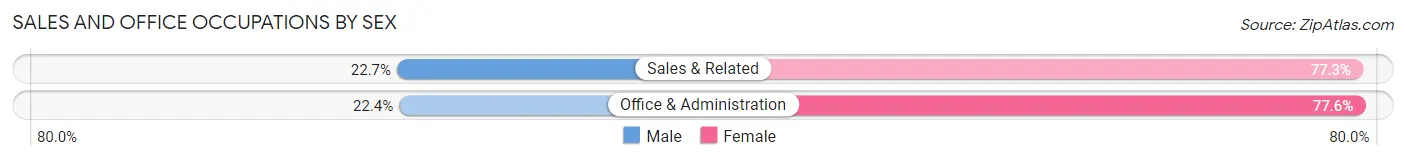
| Occupation | Male | Female |
| Sales & Related | 50 (22.7%) | 170 (77.3%) |
| Office & Administration | 58 (22.4%) | 201 (77.6%) |
| Total (Category) | 108 (22.6%) | 371 (77.4%) |
| Total (Overall) | 853 (41.9%) | 1,183 (58.1%) |
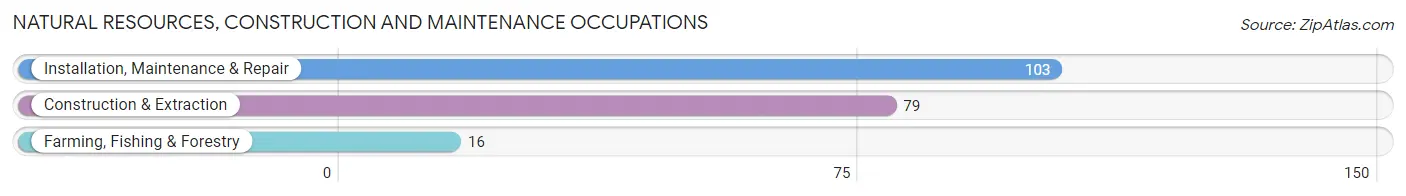
Natural Resources, Construction and Maintenance Occupations
The most common Natural Resources, Construction and Maintenance occupations in North Braddock borough are Installation, Maintenance & Repair (103 | 5.1%), Construction & Extraction (79 | 3.9%), and Farming, Fishing & Forestry (16 | 0.8%).
Natural Resources, Construction and Maintenance Occupations by Sex
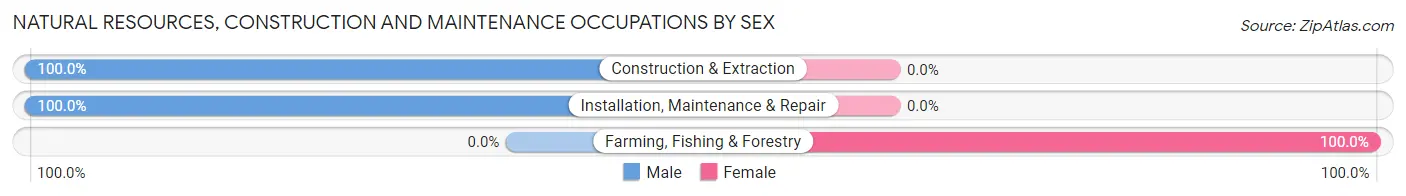
| Occupation | Male | Female |
| Farming, Fishing & Forestry | 0 (0.0%) | 16 (100.0%) |
| Construction & Extraction | 79 (100.0%) | 0 (0.0%) |
| Installation, Maintenance & Repair | 103 (100.0%) | 0 (0.0%) |
| Total (Category) | 182 (91.9%) | 16 (8.1%) |
| Total (Overall) | 853 (41.9%) | 1,183 (58.1%) |
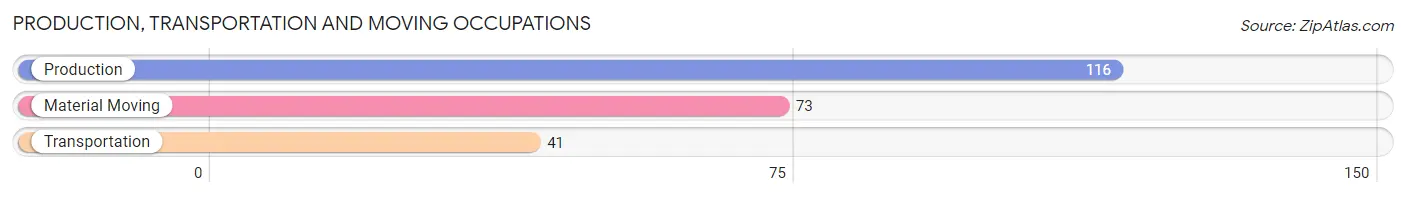
Production, Transportation and Moving Occupations
The most common Production, Transportation and Moving occupations in North Braddock borough are Production (116 | 5.7%), Material Moving (73 | 3.6%), and Transportation (41 | 2.0%).
Production, Transportation and Moving Occupations by Sex
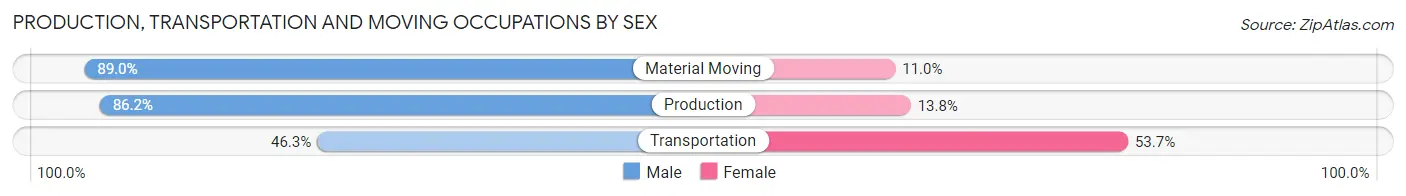
| Occupation | Male | Female |
| Production | 100 (86.2%) | 16 (13.8%) |
| Transportation | 19 (46.3%) | 22 (53.7%) |
| Material Moving | 65 (89.0%) | 8 (11.0%) |
| Total (Category) | 184 (80.0%) | 46 (20.0%) |
| Total (Overall) | 853 (41.9%) | 1,183 (58.1%) |
Employment Industries by Sex in North Braddock borough
Employment Industries in North Braddock borough
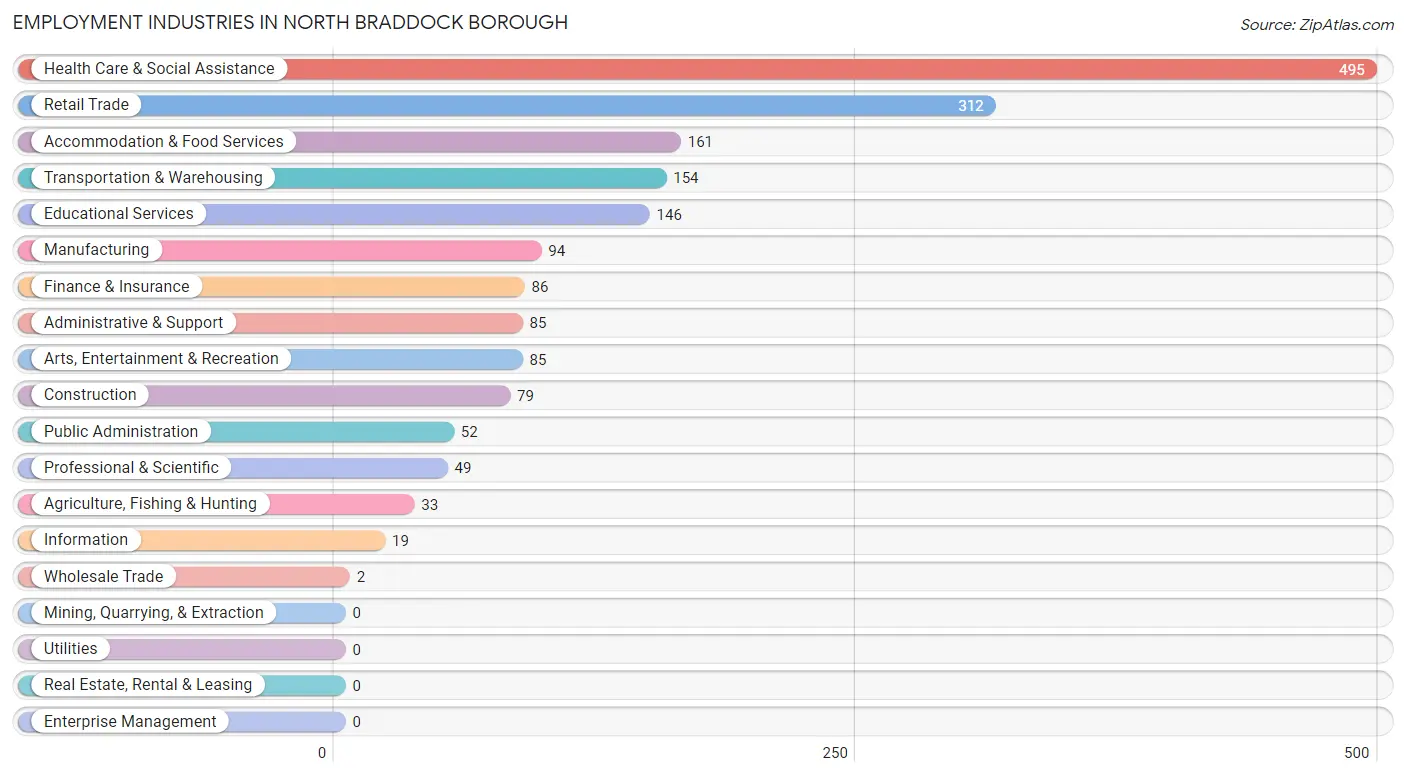
The major employment industries in North Braddock borough include Health Care & Social Assistance (495 | 24.3%), Retail Trade (312 | 15.3%), Accommodation & Food Services (161 | 7.9%), Transportation & Warehousing (154 | 7.6%), and Educational Services (146 | 7.2%).
Employment Industries by Sex in North Braddock borough
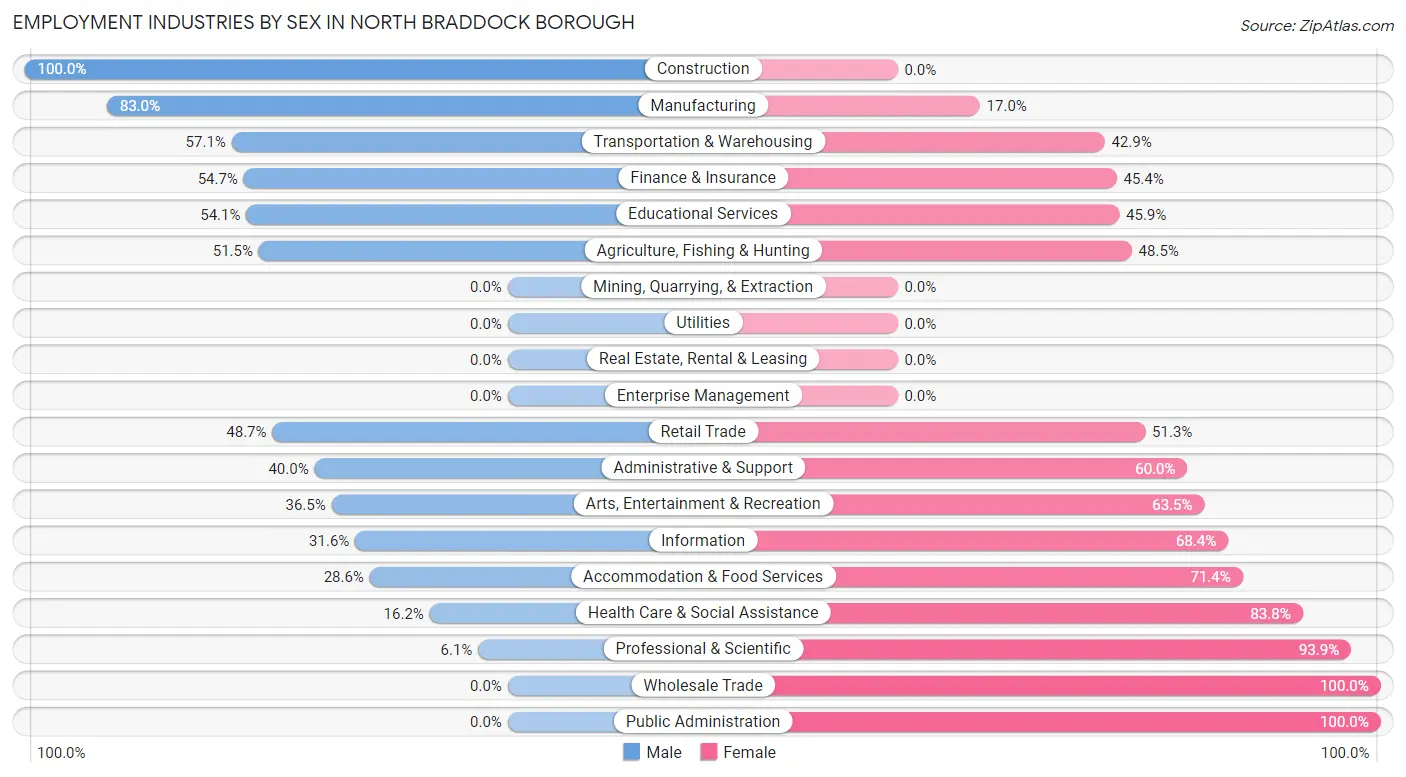
The North Braddock borough industries that see more men than women are Construction (100.0%), Manufacturing (83.0%), and Transportation & Warehousing (57.1%), whereas the industries that tend to have a higher number of women are Wholesale Trade (100.0%), Public Administration (100.0%), and Professional & Scientific (93.9%).
| Industry | Male | Female |
| Agriculture, Fishing & Hunting | 17 (51.5%) | 16 (48.5%) |
| Mining, Quarrying, & Extraction | 0 (0.0%) | 0 (0.0%) |
| Construction | 79 (100.0%) | 0 (0.0%) |
| Manufacturing | 78 (83.0%) | 16 (17.0%) |
| Wholesale Trade | 0 (0.0%) | 2 (100.0%) |
| Retail Trade | 152 (48.7%) | 160 (51.3%) |
| Transportation & Warehousing | 88 (57.1%) | 66 (42.9%) |
| Utilities | 0 (0.0%) | 0 (0.0%) |
| Information | 6 (31.6%) | 13 (68.4%) |
| Finance & Insurance | 47 (54.6%) | 39 (45.4%) |
| Real Estate, Rental & Leasing | 0 (0.0%) | 0 (0.0%) |
| Professional & Scientific | 3 (6.1%) | 46 (93.9%) |
| Enterprise Management | 0 (0.0%) | 0 (0.0%) |
| Administrative & Support | 34 (40.0%) | 51 (60.0%) |
| Educational Services | 79 (54.1%) | 67 (45.9%) |
| Health Care & Social Assistance | 80 (16.2%) | 415 (83.8%) |
| Arts, Entertainment & Recreation | 31 (36.5%) | 54 (63.5%) |
| Accommodation & Food Services | 46 (28.6%) | 115 (71.4%) |
| Public Administration | 0 (0.0%) | 52 (100.0%) |
| Total | 853 (41.9%) | 1,183 (58.1%) |
Education in North Braddock borough
School Enrollment in North Braddock borough
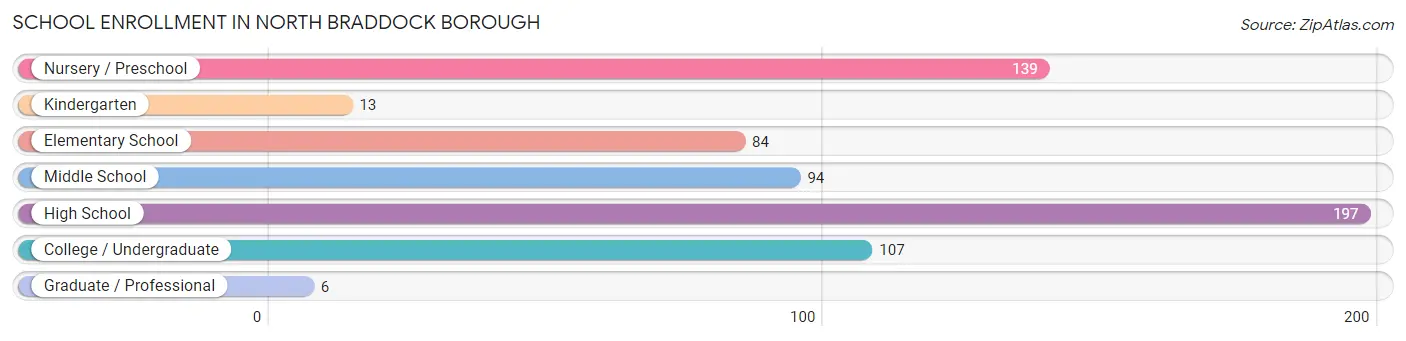
The most common levels of schooling among the 640 students in North Braddock borough are high school (197 | 30.8%), nursery / preschool (139 | 21.7%), and college / undergraduate (107 | 16.7%).
| School Level | # Students | % Students |
| Nursery / Preschool | 139 | 21.7% |
| Kindergarten | 13 | 2.0% |
| Elementary School | 84 | 13.1% |
| Middle School | 94 | 14.7% |
| High School | 197 | 30.8% |
| College / Undergraduate | 107 | 16.7% |
| Graduate / Professional | 6 | 0.9% |
| Total | 640 | 100.0% |
School Enrollment by Age by Funding Source in North Braddock borough
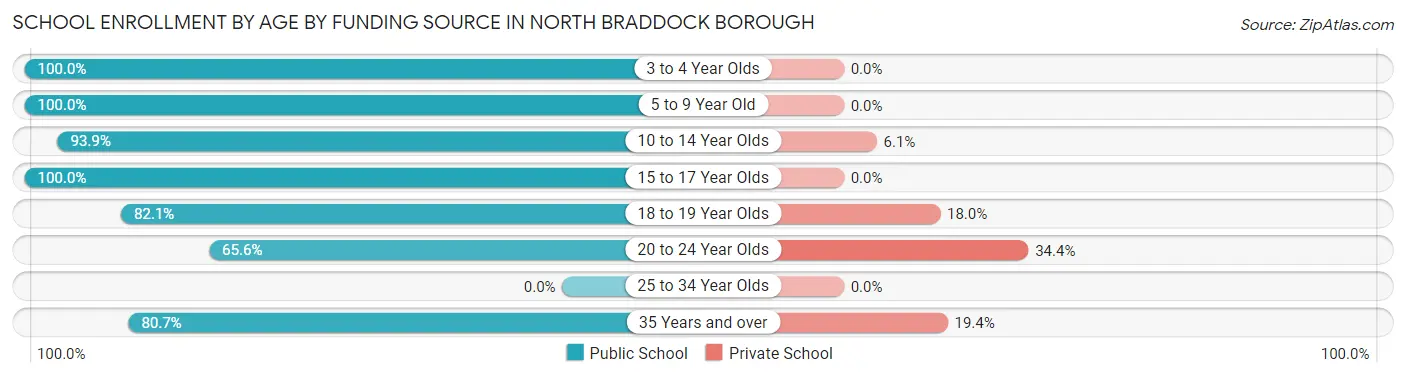
Out of a total of 640 students who are enrolled in schools in North Braddock borough, 45 (7.0%) attend a private institution, while the remaining 595 (93.0%) are enrolled in public schools. The age group of 20 to 24 year olds has the highest likelihood of being enrolled in private schools, with 22 (34.4% in the age bracket) enrolled. Conversely, the age group of 3 to 4 year olds has the lowest likelihood of being enrolled in a private school, with 103 (100.0% in the age bracket) attending a public institution.
| Age Bracket | Public School | Private School |
| 3 to 4 Year Olds | 103 (100.0%) | 0 (0.0%) |
| 5 to 9 Year Old | 109 (100.0%) | 0 (0.0%) |
| 10 to 14 Year Olds | 153 (93.9%) | 10 (6.1%) |
| 15 to 17 Year Olds | 131 (100.0%) | 0 (0.0%) |
| 18 to 19 Year Olds | 32 (82.1%) | 7 (17.9%) |
| 20 to 24 Year Olds | 42 (65.6%) | 22 (34.4%) |
| 25 to 34 Year Olds | 0 (0.0%) | 0 (0.0%) |
| 35 Years and over | 25 (80.6%) | 6 (19.4%) |
| Total | 595 (93.0%) | 45 (7.0%) |
Educational Attainment by Field of Study in North Braddock borough
Business (131 | 26.5%), science & technology (105 | 21.3%), arts & humanities (71 | 14.4%), education (53 | 10.7%), and liberal arts & history (40 | 8.1%) are the most common fields of study among 494 individuals in North Braddock borough who have obtained a bachelor's degree or higher.
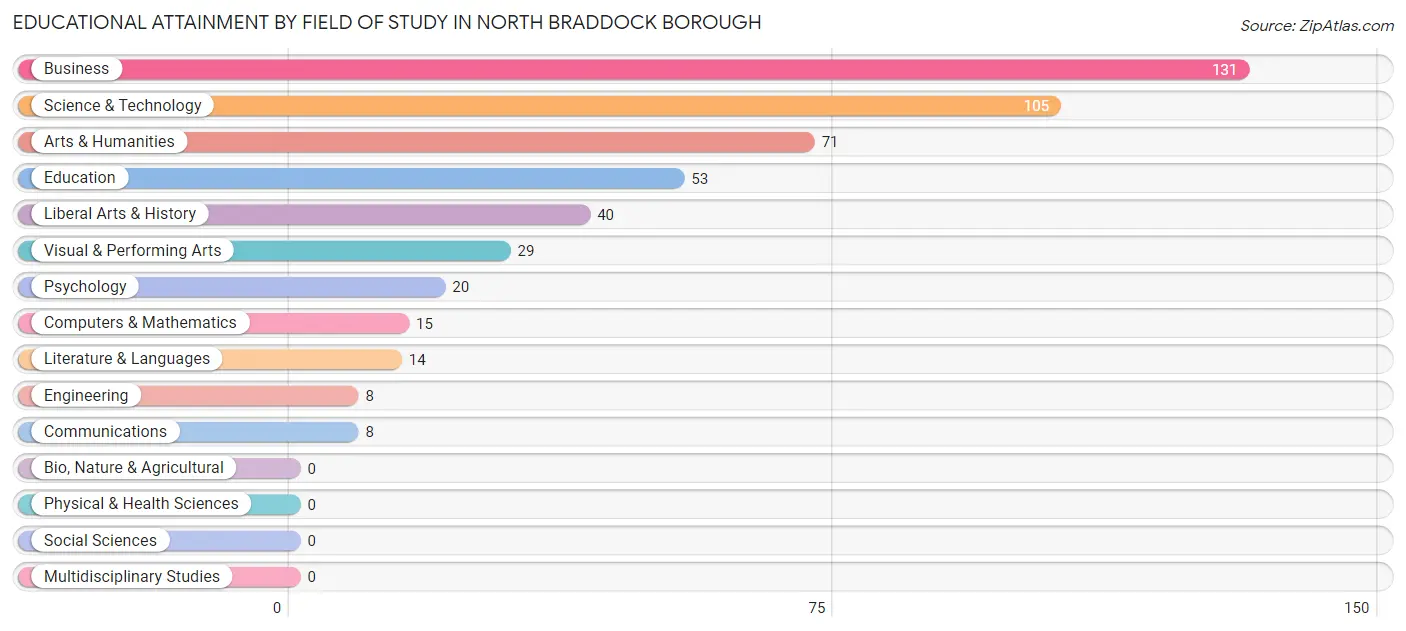
| Field of Study | # Graduates | % Graduates |
| Computers & Mathematics | 15 | 3.0% |
| Bio, Nature & Agricultural | 0 | 0.0% |
| Physical & Health Sciences | 0 | 0.0% |
| Psychology | 20 | 4.1% |
| Social Sciences | 0 | 0.0% |
| Engineering | 8 | 1.6% |
| Multidisciplinary Studies | 0 | 0.0% |
| Science & Technology | 105 | 21.3% |
| Business | 131 | 26.5% |
| Education | 53 | 10.7% |
| Literature & Languages | 14 | 2.8% |
| Liberal Arts & History | 40 | 8.1% |
| Visual & Performing Arts | 29 | 5.9% |
| Communications | 8 | 1.6% |
| Arts & Humanities | 71 | 14.4% |
| Total | 494 | 100.0% |
Transportation & Commute in North Braddock borough
Vehicle Availability by Sex in North Braddock borough
The most prevalent vehicle ownership categories in North Braddock borough are males with 1 vehicle (302, accounting for 40.4%) and females with 1 vehicle (548, making up 26.1%).
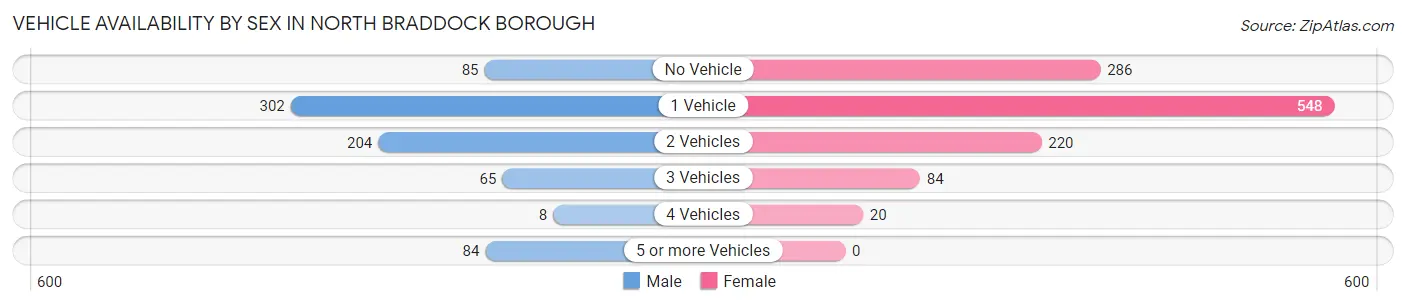
| Vehicles Available | Male | Female |
| No Vehicle | 85 (11.4%) | 286 (24.7%) |
| 1 Vehicle | 302 (40.4%) | 548 (47.3%) |
| 2 Vehicles | 204 (27.3%) | 220 (19.0%) |
| 3 Vehicles | 65 (8.7%) | 84 (7.2%) |
| 4 Vehicles | 8 (1.1%) | 20 (1.7%) |
| 5 or more Vehicles | 84 (11.2%) | 0 (0.0%) |
| Total | 748 (100.0%) | 1,158 (100.0%) |
Commute Time in North Braddock borough
The most frequently occuring commute durations in North Braddock borough are 30 to 34 minutes (345 commuters, 21.4%), 20 to 24 minutes (337 commuters, 20.9%), and 15 to 19 minutes (230 commuters, 14.3%).
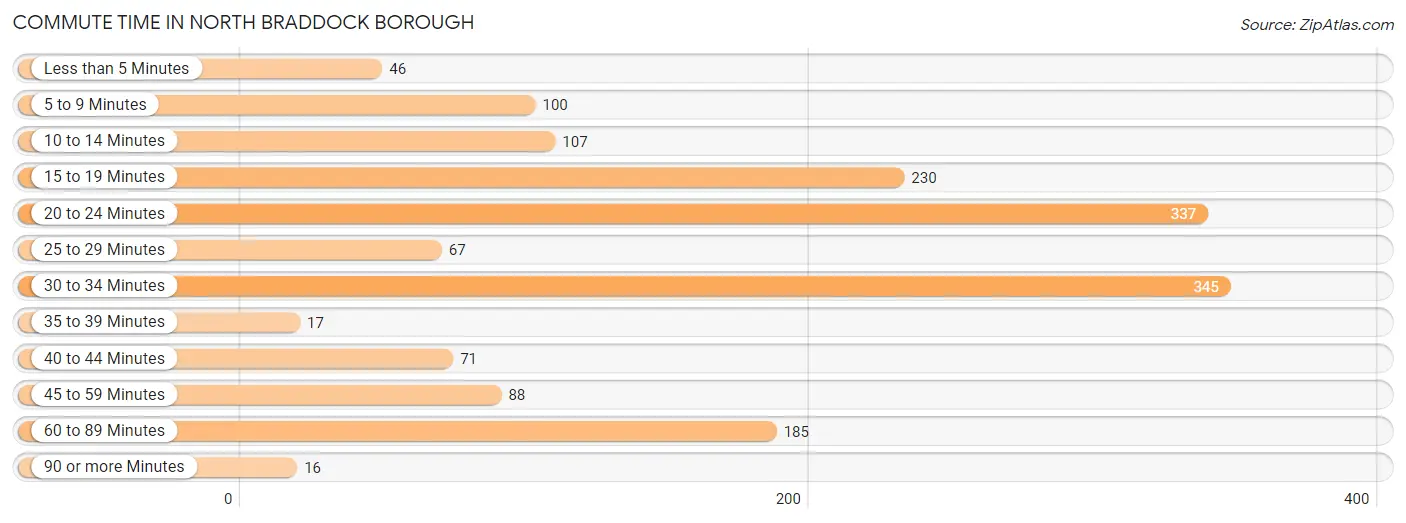
| Commute Time | # Commuters | % Commuters |
| Less than 5 Minutes | 46 | 2.9% |
| 5 to 9 Minutes | 100 | 6.2% |
| 10 to 14 Minutes | 107 | 6.7% |
| 15 to 19 Minutes | 230 | 14.3% |
| 20 to 24 Minutes | 337 | 20.9% |
| 25 to 29 Minutes | 67 | 4.2% |
| 30 to 34 Minutes | 345 | 21.4% |
| 35 to 39 Minutes | 17 | 1.1% |
| 40 to 44 Minutes | 71 | 4.4% |
| 45 to 59 Minutes | 88 | 5.5% |
| 60 to 89 Minutes | 185 | 11.5% |
| 90 or more Minutes | 16 | 1.0% |
Commute Time by Sex in North Braddock borough
The most common commute times in North Braddock borough are 20 to 24 minutes (189 commuters, 28.1%) for males and 30 to 34 minutes (194 commuters, 20.7%) for females.
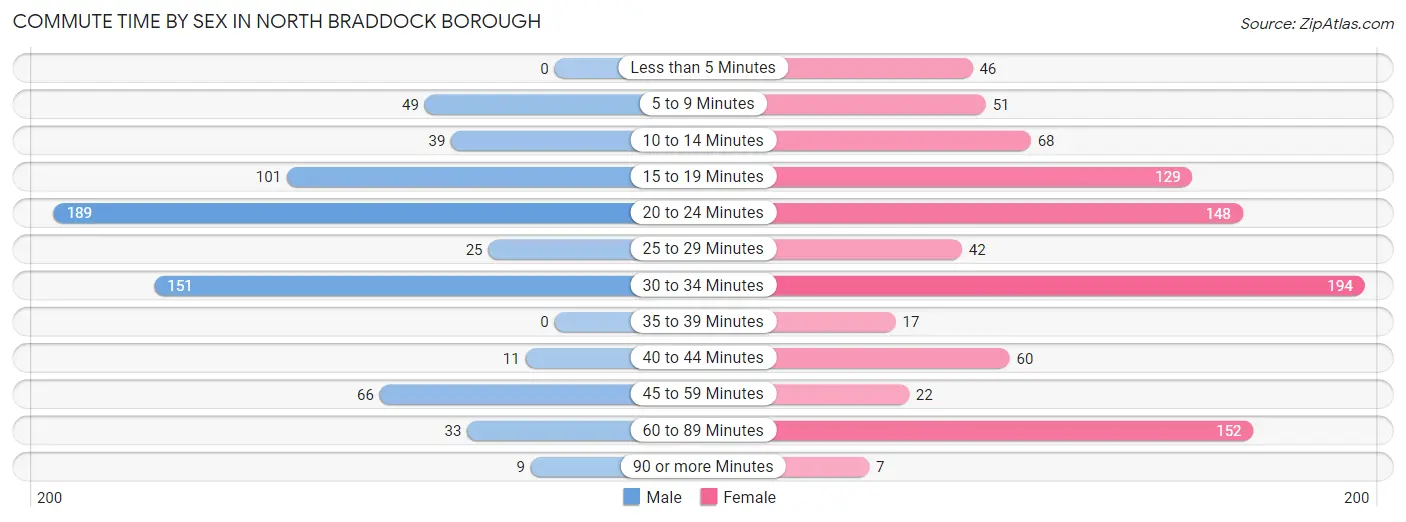
| Commute Time | Male | Female |
| Less than 5 Minutes | 0 (0.0%) | 46 (4.9%) |
| 5 to 9 Minutes | 49 (7.3%) | 51 (5.4%) |
| 10 to 14 Minutes | 39 (5.8%) | 68 (7.3%) |
| 15 to 19 Minutes | 101 (15.0%) | 129 (13.8%) |
| 20 to 24 Minutes | 189 (28.1%) | 148 (15.8%) |
| 25 to 29 Minutes | 25 (3.7%) | 42 (4.5%) |
| 30 to 34 Minutes | 151 (22.4%) | 194 (20.7%) |
| 35 to 39 Minutes | 0 (0.0%) | 17 (1.8%) |
| 40 to 44 Minutes | 11 (1.6%) | 60 (6.4%) |
| 45 to 59 Minutes | 66 (9.8%) | 22 (2.4%) |
| 60 to 89 Minutes | 33 (4.9%) | 152 (16.2%) |
| 90 or more Minutes | 9 (1.3%) | 7 (0.7%) |
Time of Departure to Work by Sex in North Braddock borough
The most frequent times of departure to work in North Braddock borough are 12:00 PM to 3:59 PM (140, 20.8%) for males and 7:30 AM to 7:59 AM (167, 17.8%) for females.
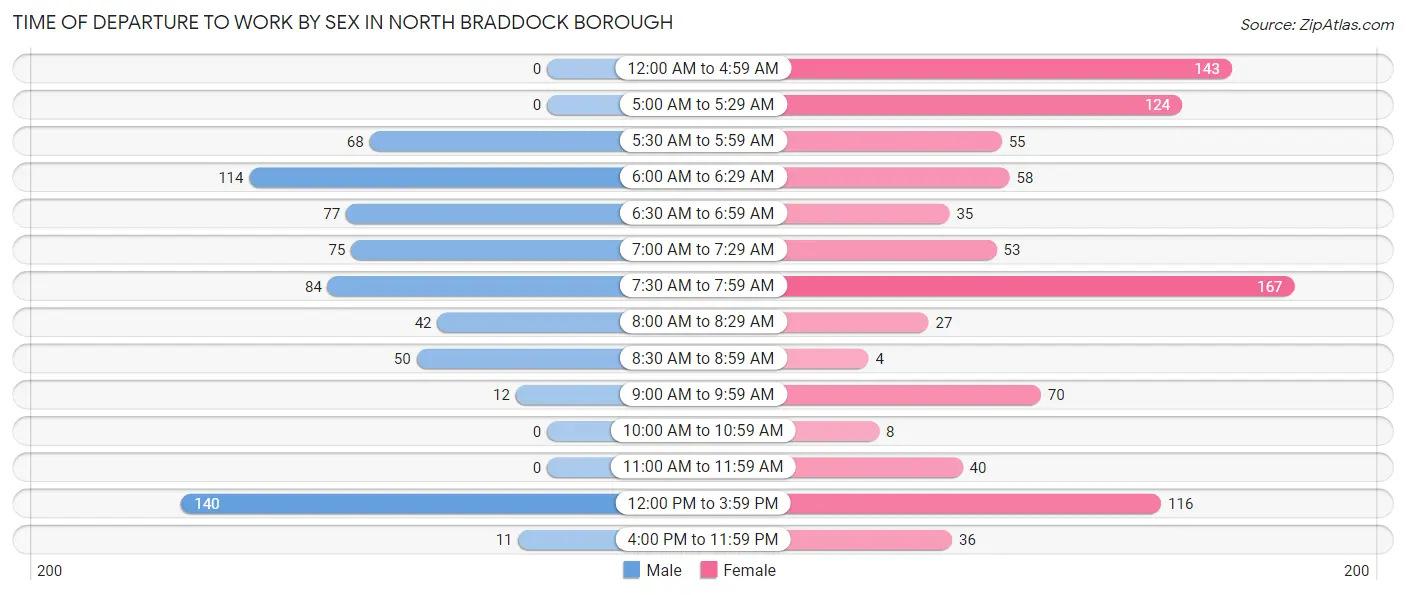
| Time of Departure | Male | Female |
| 12:00 AM to 4:59 AM | 0 (0.0%) | 143 (15.3%) |
| 5:00 AM to 5:29 AM | 0 (0.0%) | 124 (13.3%) |
| 5:30 AM to 5:59 AM | 68 (10.1%) | 55 (5.9%) |
| 6:00 AM to 6:29 AM | 114 (16.9%) | 58 (6.2%) |
| 6:30 AM to 6:59 AM | 77 (11.4%) | 35 (3.7%) |
| 7:00 AM to 7:29 AM | 75 (11.1%) | 53 (5.7%) |
| 7:30 AM to 7:59 AM | 84 (12.5%) | 167 (17.8%) |
| 8:00 AM to 8:29 AM | 42 (6.2%) | 27 (2.9%) |
| 8:30 AM to 8:59 AM | 50 (7.4%) | 4 (0.4%) |
| 9:00 AM to 9:59 AM | 12 (1.8%) | 70 (7.5%) |
| 10:00 AM to 10:59 AM | 0 (0.0%) | 8 (0.9%) |
| 11:00 AM to 11:59 AM | 0 (0.0%) | 40 (4.3%) |
| 12:00 PM to 3:59 PM | 140 (20.8%) | 116 (12.4%) |
| 4:00 PM to 11:59 PM | 11 (1.6%) | 36 (3.8%) |
| Total | 673 (100.0%) | 936 (100.0%) |
Housing Occupancy in North Braddock borough
Occupancy by Ownership in North Braddock borough
Of the total 2,158 dwellings in North Braddock borough, owner-occupied units account for 1,078 (49.9%), while renter-occupied units make up 1,080 (50.0%).
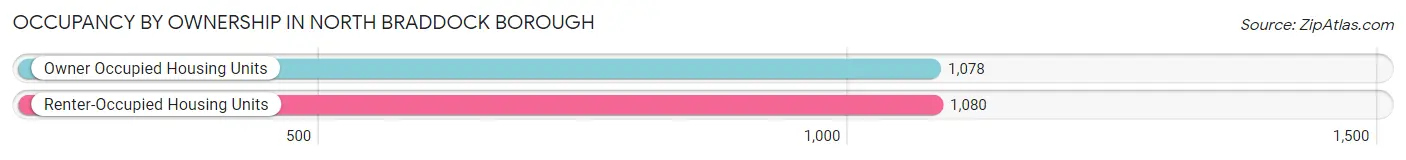
| Occupancy | # Housing Units | % Housing Units |
| Owner Occupied Housing Units | 1,078 | 49.9% |
| Renter-Occupied Housing Units | 1,080 | 50.0% |
| Total Occupied Housing Units | 2,158 | 100.0% |
Occupancy by Household Size in North Braddock borough
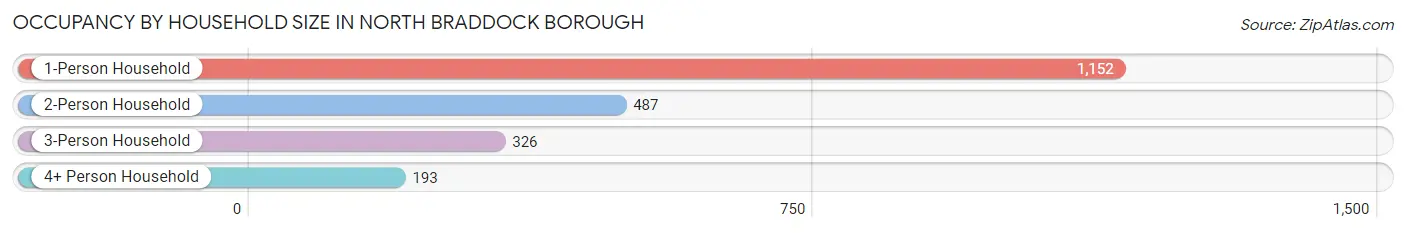
| Household Size | # Housing Units | % Housing Units |
| 1-Person Household | 1,152 | 53.4% |
| 2-Person Household | 487 | 22.6% |
| 3-Person Household | 326 | 15.1% |
| 4+ Person Household | 193 | 8.9% |
| Total Housing Units | 2,158 | 100.0% |
Occupancy by Ownership by Household Size in North Braddock borough
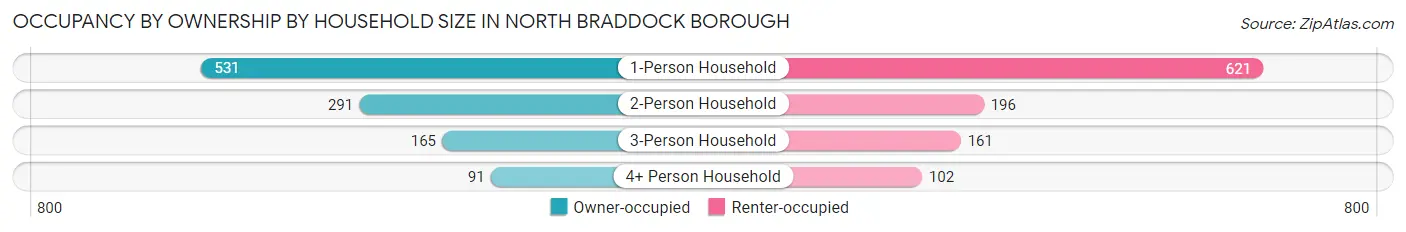
| Household Size | Owner-occupied | Renter-occupied |
| 1-Person Household | 531 (46.1%) | 621 (53.9%) |
| 2-Person Household | 291 (59.8%) | 196 (40.3%) |
| 3-Person Household | 165 (50.6%) | 161 (49.4%) |
| 4+ Person Household | 91 (47.1%) | 102 (52.8%) |
| Total Housing Units | 1,078 (49.9%) | 1,080 (50.0%) |
Occupancy by Educational Attainment in North Braddock borough
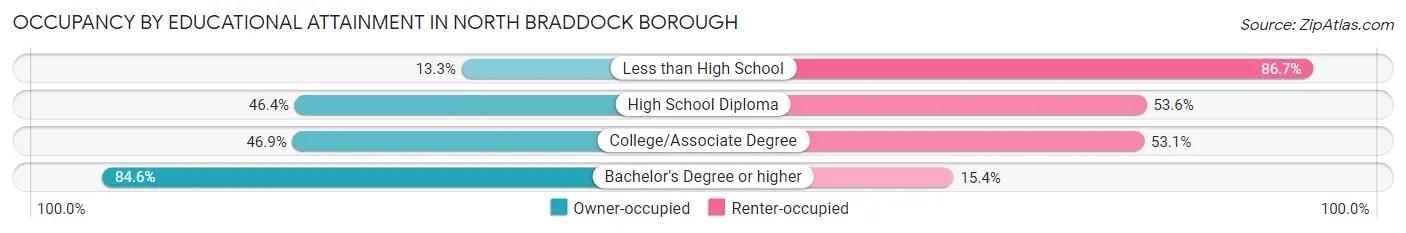
| Household Size | Owner-occupied | Renter-occupied |
| Less than High School | 18 (13.3%) | 117 (86.7%) |
| High School Diploma | 394 (46.4%) | 455 (53.6%) |
| College/Associate Degree | 407 (46.9%) | 461 (53.1%) |
| Bachelor's Degree or higher | 259 (84.6%) | 47 (15.4%) |
Occupancy by Age of Householder in North Braddock borough
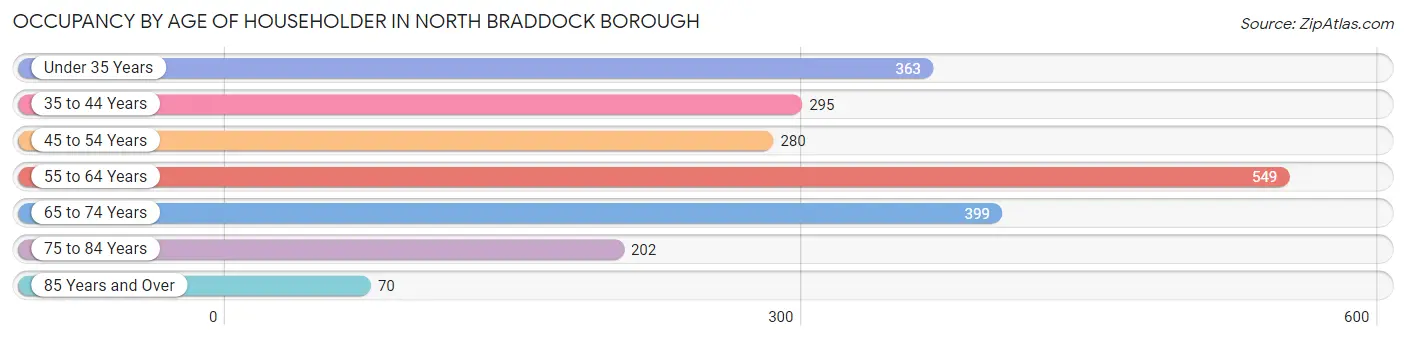
| Age Bracket | # Households | % Households |
| Under 35 Years | 363 | 16.8% |
| 35 to 44 Years | 295 | 13.7% |
| 45 to 54 Years | 280 | 13.0% |
| 55 to 64 Years | 549 | 25.4% |
| 65 to 74 Years | 399 | 18.5% |
| 75 to 84 Years | 202 | 9.4% |
| 85 Years and Over | 70 | 3.2% |
| Total | 2,158 | 100.0% |
Housing Finances in North Braddock borough
Median Income by Occupancy in North Braddock borough
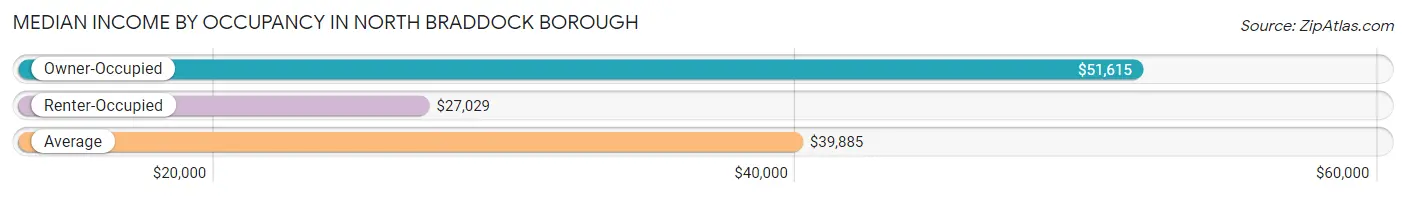
| Occupancy Type | # Households | Median Income |
| Owner-Occupied | 1,078 (49.9%) | $51,615 |
| Renter-Occupied | 1,080 (50.0%) | $27,029 |
| Average | 2,158 (100.0%) | $39,885 |
Occupancy by Householder Income Bracket in North Braddock borough
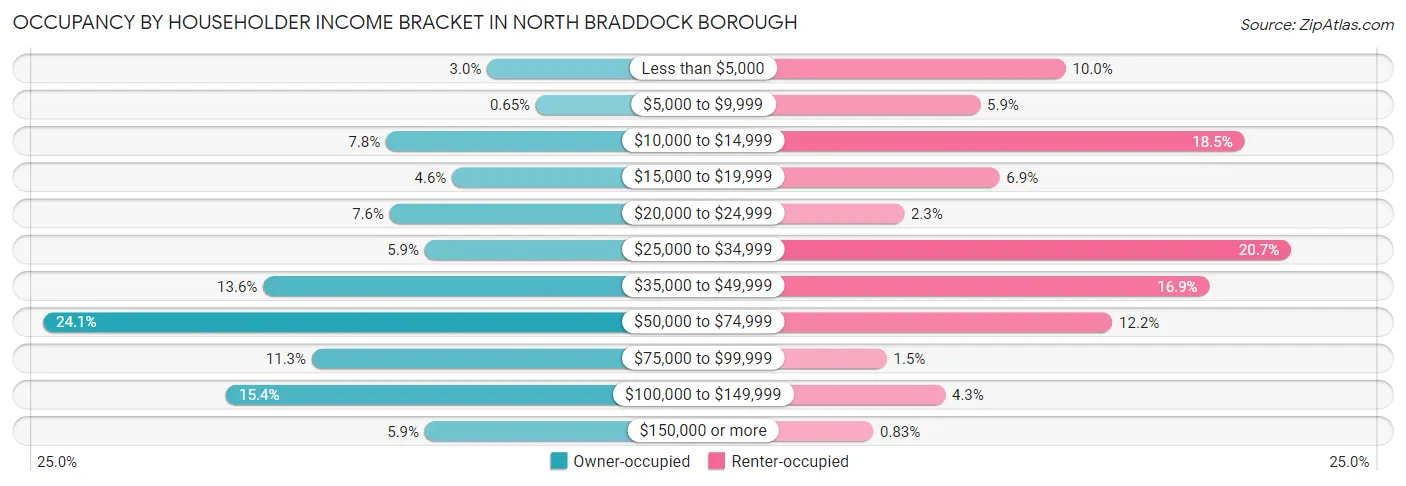
| Income Bracket | Owner-occupied | Renter-occupied |
| Less than $5,000 | 32 (3.0%) | 108 (10.0%) |
| $5,000 to $9,999 | 7 (0.6%) | 64 (5.9%) |
| $10,000 to $14,999 | 84 (7.8%) | 200 (18.5%) |
| $15,000 to $19,999 | 50 (4.6%) | 74 (6.9%) |
| $20,000 to $24,999 | 82 (7.6%) | 25 (2.3%) |
| $25,000 to $34,999 | 64 (5.9%) | 224 (20.7%) |
| $35,000 to $49,999 | 147 (13.6%) | 182 (16.9%) |
| $50,000 to $74,999 | 260 (24.1%) | 132 (12.2%) |
| $75,000 to $99,999 | 122 (11.3%) | 16 (1.5%) |
| $100,000 to $149,999 | 166 (15.4%) | 46 (4.3%) |
| $150,000 or more | 64 (5.9%) | 9 (0.8%) |
| Total | 1,078 (100.0%) | 1,080 (100.0%) |
Monthly Housing Cost Tiers in North Braddock borough
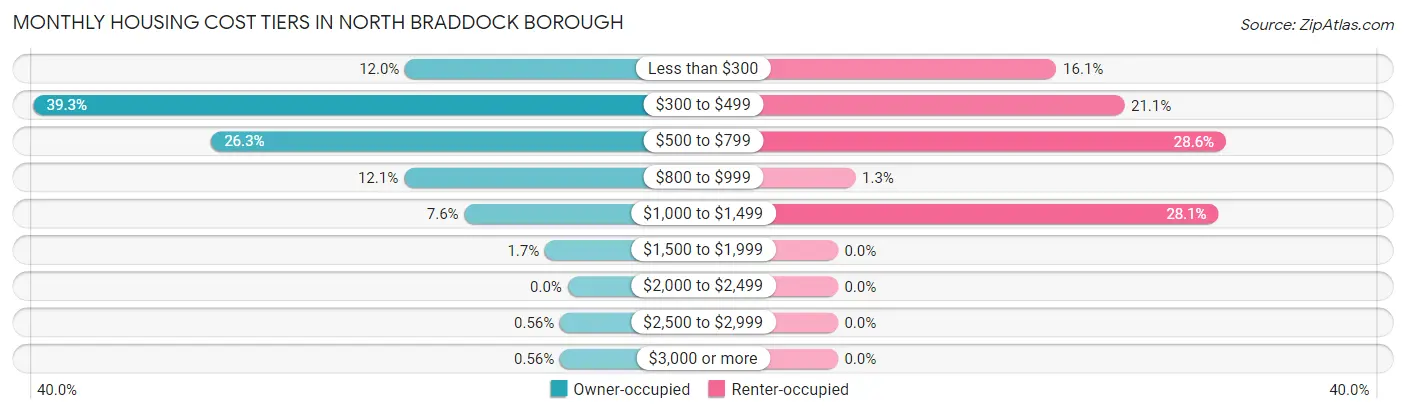
| Monthly Cost | Owner-occupied | Renter-occupied |
| Less than $300 | 129 (12.0%) | 174 (16.1%) |
| $300 to $499 | 424 (39.3%) | 228 (21.1%) |
| $500 to $799 | 283 (26.3%) | 309 (28.6%) |
| $800 to $999 | 130 (12.1%) | 14 (1.3%) |
| $1,000 to $1,499 | 82 (7.6%) | 303 (28.1%) |
| $1,500 to $1,999 | 18 (1.7%) | 0 (0.0%) |
| $2,000 to $2,499 | 0 (0.0%) | 0 (0.0%) |
| $2,500 to $2,999 | 6 (0.6%) | 0 (0.0%) |
| $3,000 or more | 6 (0.6%) | 0 (0.0%) |
| Total | 1,078 (100.0%) | 1,080 (100.0%) |
Physical Housing Characteristics in North Braddock borough
Housing Structures in North Braddock borough
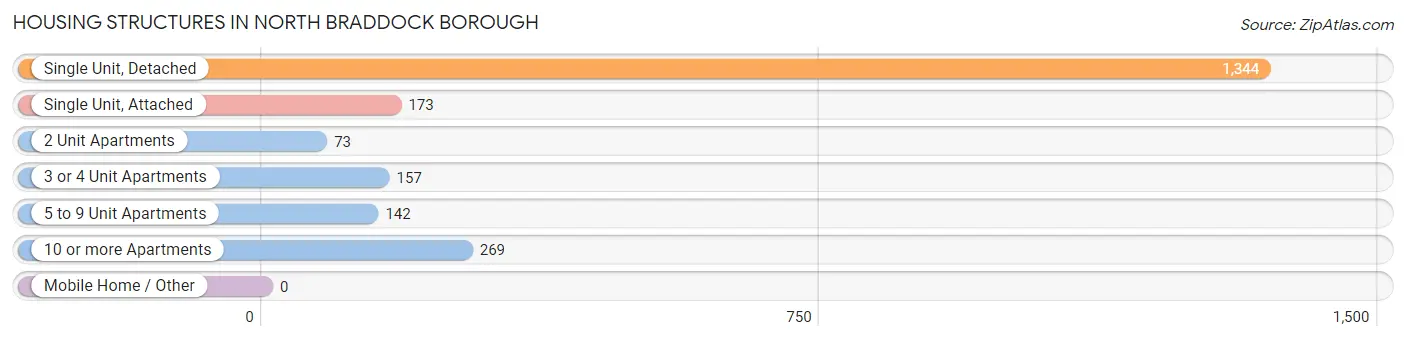
| Structure Type | # Housing Units | % Housing Units |
| Single Unit, Detached | 1,344 | 62.3% |
| Single Unit, Attached | 173 | 8.0% |
| 2 Unit Apartments | 73 | 3.4% |
| 3 or 4 Unit Apartments | 157 | 7.3% |
| 5 to 9 Unit Apartments | 142 | 6.6% |
| 10 or more Apartments | 269 | 12.5% |
| Mobile Home / Other | 0 | 0.0% |
| Total | 2,158 | 100.0% |
Housing Structures by Occupancy in North Braddock borough
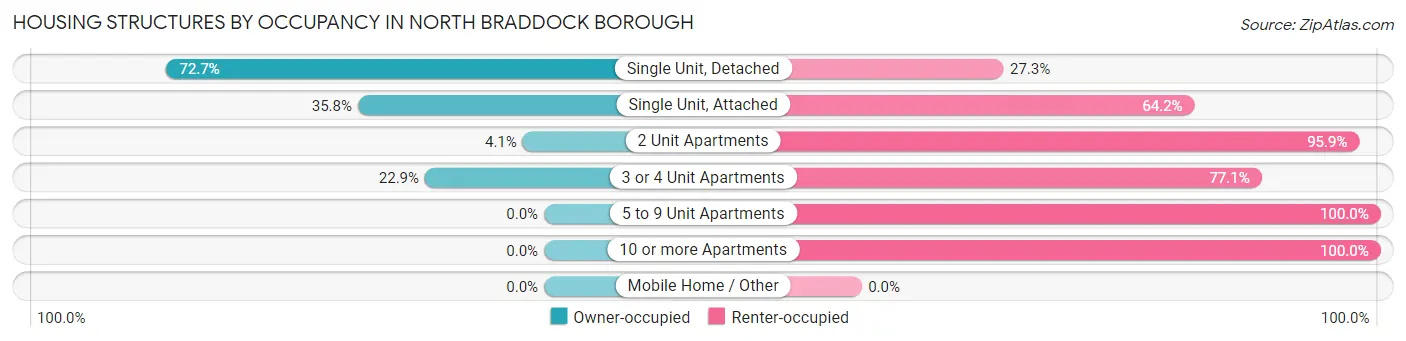
| Structure Type | Owner-occupied | Renter-occupied |
| Single Unit, Detached | 977 (72.7%) | 367 (27.3%) |
| Single Unit, Attached | 62 (35.8%) | 111 (64.2%) |
| 2 Unit Apartments | 3 (4.1%) | 70 (95.9%) |
| 3 or 4 Unit Apartments | 36 (22.9%) | 121 (77.1%) |
| 5 to 9 Unit Apartments | 0 (0.0%) | 142 (100.0%) |
| 10 or more Apartments | 0 (0.0%) | 269 (100.0%) |
| Mobile Home / Other | 0 (0.0%) | 0 (0.0%) |
| Total | 1,078 (49.9%) | 1,080 (50.0%) |
Housing Structures by Number of Rooms in North Braddock borough
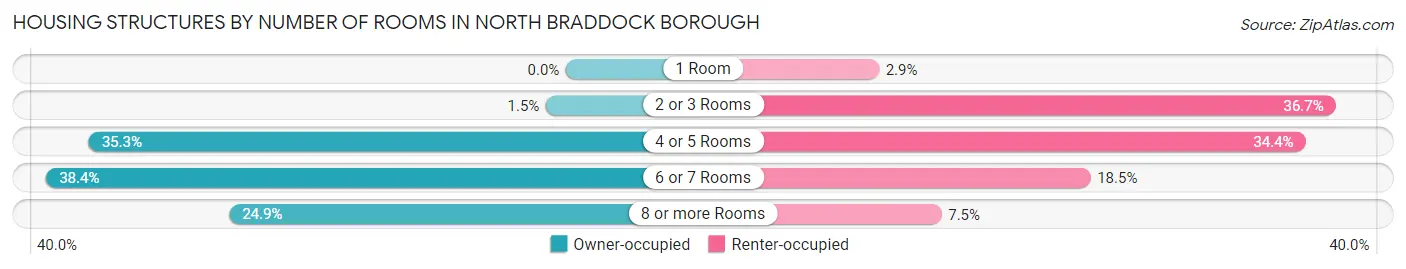
| Number of Rooms | Owner-occupied | Renter-occupied |
| 1 Room | 0 (0.0%) | 31 (2.9%) |
| 2 or 3 Rooms | 16 (1.5%) | 396 (36.7%) |
| 4 or 5 Rooms | 380 (35.2%) | 372 (34.4%) |
| 6 or 7 Rooms | 414 (38.4%) | 200 (18.5%) |
| 8 or more Rooms | 268 (24.9%) | 81 (7.5%) |
| Total | 1,078 (100.0%) | 1,080 (100.0%) |
Housing Structure by Heating Type in North Braddock borough
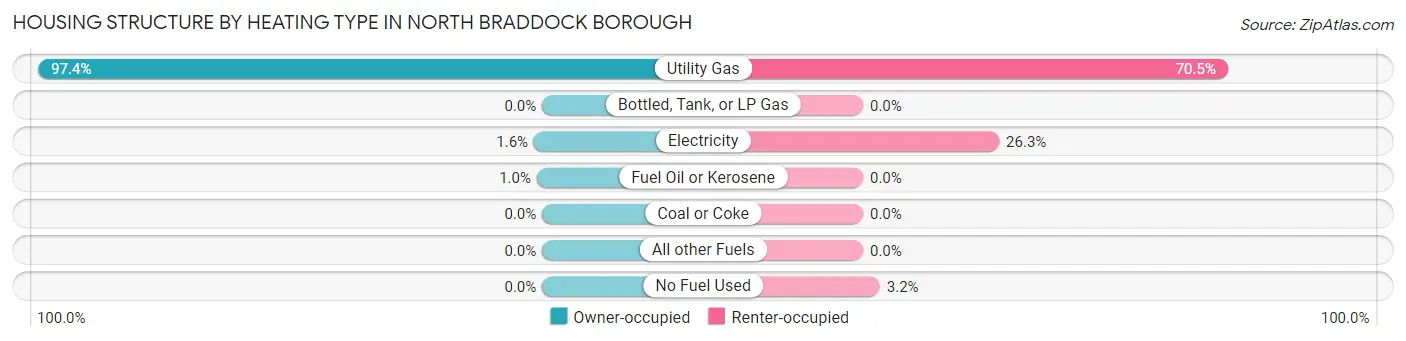
| Heating Type | Owner-occupied | Renter-occupied |
| Utility Gas | 1,050 (97.4%) | 761 (70.5%) |
| Bottled, Tank, or LP Gas | 0 (0.0%) | 0 (0.0%) |
| Electricity | 17 (1.6%) | 284 (26.3%) |
| Fuel Oil or Kerosene | 11 (1.0%) | 0 (0.0%) |
| Coal or Coke | 0 (0.0%) | 0 (0.0%) |
| All other Fuels | 0 (0.0%) | 0 (0.0%) |
| No Fuel Used | 0 (0.0%) | 35 (3.2%) |
| Total | 1,078 (100.0%) | 1,080 (100.0%) |
Household Vehicle Usage in North Braddock borough
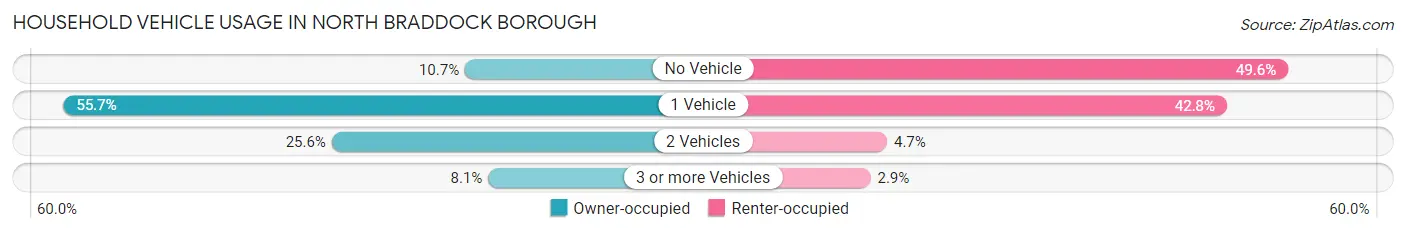
| Vehicles per Household | Owner-occupied | Renter-occupied |
| No Vehicle | 115 (10.7%) | 536 (49.6%) |
| 1 Vehicle | 600 (55.7%) | 462 (42.8%) |
| 2 Vehicles | 276 (25.6%) | 51 (4.7%) |
| 3 or more Vehicles | 87 (8.1%) | 31 (2.9%) |
| Total | 1,078 (100.0%) | 1,080 (100.0%) |
Real Estate & Mortgages in North Braddock borough
Real Estate and Mortgage Overview in North Braddock borough
| Characteristic | Without Mortgage | With Mortgage |
| Housing Units | 720 | 358 |
| Median Property Value | $50,400 | $62,500 |
| Median Household Income | $48,021 | $33 |
| Monthly Housing Costs | $421 | $0 |
| Real Estate Taxes | $859 | $11 |
Property Value by Mortgage Status in North Braddock borough
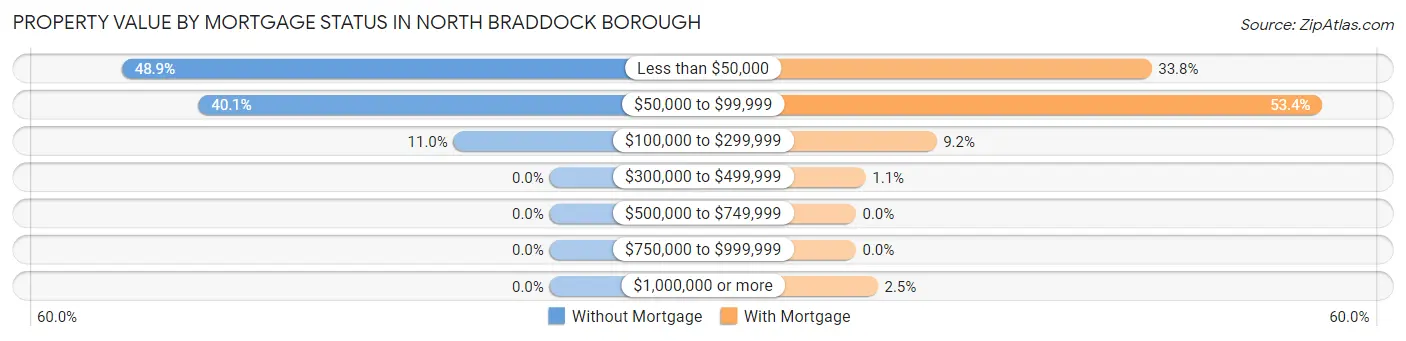
| Property Value | Without Mortgage | With Mortgage |
| Less than $50,000 | 352 (48.9%) | 121 (33.8%) |
| $50,000 to $99,999 | 289 (40.1%) | 191 (53.3%) |
| $100,000 to $299,999 | 79 (11.0%) | 33 (9.2%) |
| $300,000 to $499,999 | 0 (0.0%) | 4 (1.1%) |
| $500,000 to $749,999 | 0 (0.0%) | 0 (0.0%) |
| $750,000 to $999,999 | 0 (0.0%) | 0 (0.0%) |
| $1,000,000 or more | 0 (0.0%) | 9 (2.5%) |
| Total | 720 (100.0%) | 358 (100.0%) |
Household Income by Mortgage Status in North Braddock borough
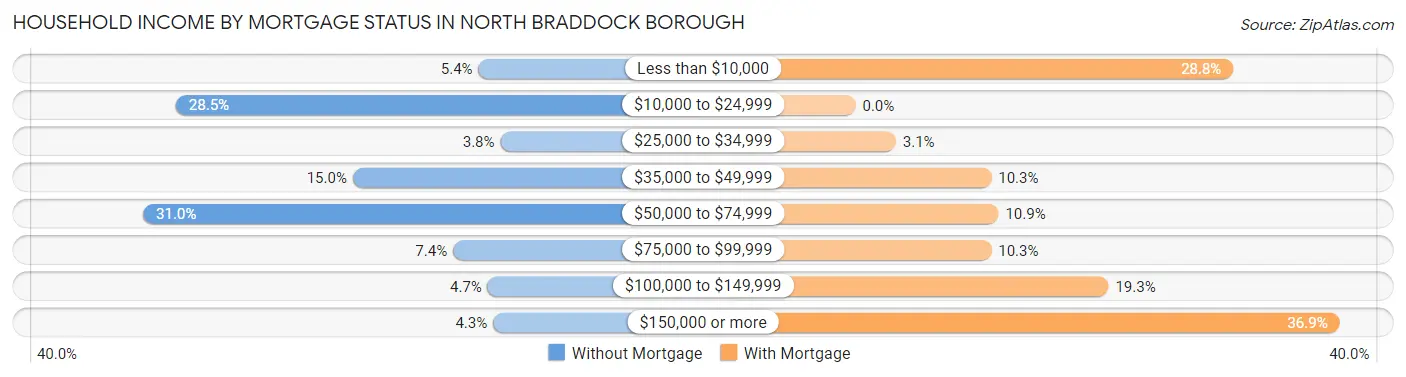
| Household Income | Without Mortgage | With Mortgage |
| Less than $10,000 | 39 (5.4%) | 103 (28.8%) |
| $10,000 to $24,999 | 205 (28.5%) | 0 (0.0%) |
| $25,000 to $34,999 | 27 (3.7%) | 11 (3.1%) |
| $35,000 to $49,999 | 108 (15.0%) | 37 (10.3%) |
| $50,000 to $74,999 | 223 (31.0%) | 39 (10.9%) |
| $75,000 to $99,999 | 53 (7.4%) | 37 (10.3%) |
| $100,000 to $149,999 | 34 (4.7%) | 69 (19.3%) |
| $150,000 or more | 31 (4.3%) | 132 (36.9%) |
| Total | 720 (100.0%) | 358 (100.0%) |
Property Value to Household Income Ratio in North Braddock borough
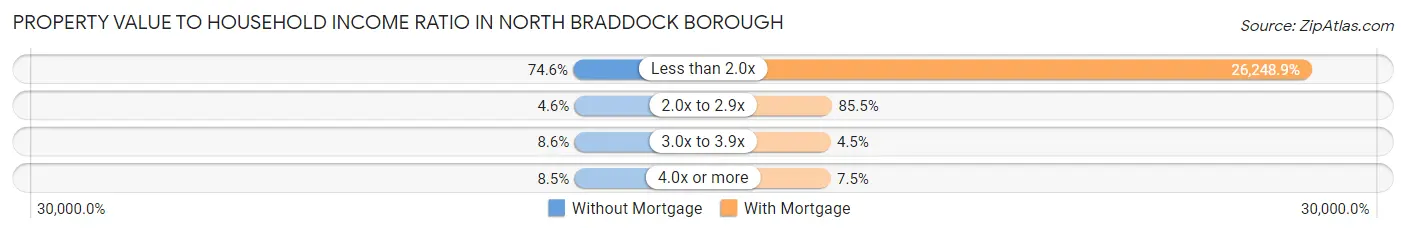
| Value-to-Income Ratio | Without Mortgage | With Mortgage |
| Less than 2.0x | 537 (74.6%) | 93,971 (26,248.9%) |
| 2.0x to 2.9x | 33 (4.6%) | 306 (85.5%) |
| 3.0x to 3.9x | 62 (8.6%) | 16 (4.5%) |
| 4.0x or more | 61 (8.5%) | 27 (7.5%) |
| Total | 720 (100.0%) | 358 (100.0%) |
Real Estate Taxes by Mortgage Status in North Braddock borough
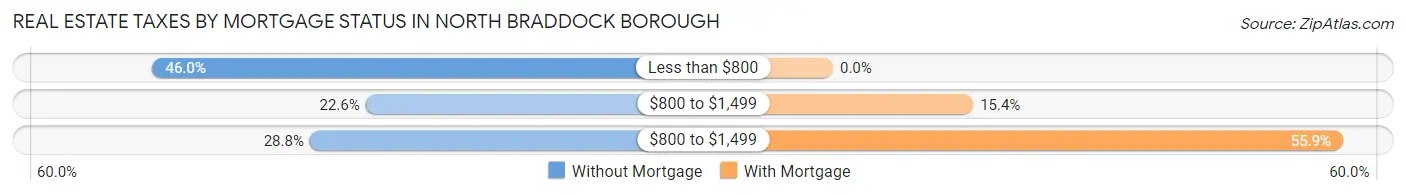
| Property Taxes | Without Mortgage | With Mortgage |
| Less than $800 | 331 (46.0%) | 0 (0.0%) |
| $800 to $1,499 | 163 (22.6%) | 55 (15.4%) |
| $800 to $1,499 | 207 (28.7%) | 200 (55.9%) |
| Total | 720 (100.0%) | 358 (100.0%) |
Health & Disability in North Braddock borough
Health Insurance Coverage by Age in North Braddock borough
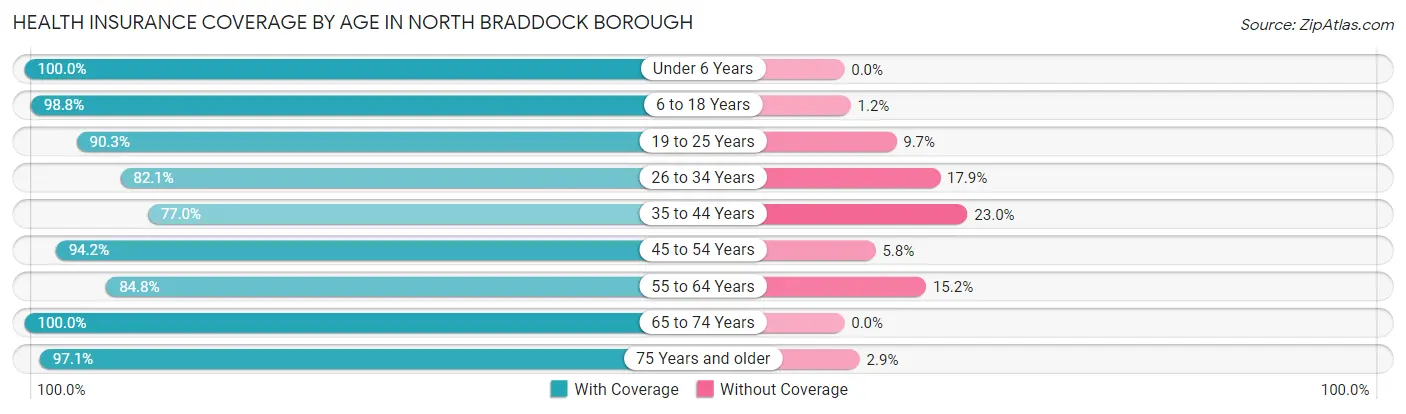
| Age Bracket | With Coverage | Without Coverage |
| Under 6 Years | 281 (100.0%) | 0 (0.0%) |
| 6 to 18 Years | 417 (98.8%) | 5 (1.2%) |
| 19 to 25 Years | 466 (90.3%) | 50 (9.7%) |
| 26 to 34 Years | 446 (82.1%) | 97 (17.9%) |
| 35 to 44 Years | 359 (77.0%) | 107 (23.0%) |
| 45 to 54 Years | 438 (94.2%) | 27 (5.8%) |
| 55 to 64 Years | 562 (84.8%) | 101 (15.2%) |
| 65 to 74 Years | 649 (100.0%) | 0 (0.0%) |
| 75 Years and older | 306 (97.1%) | 9 (2.9%) |
| Total | 3,924 (90.8%) | 396 (9.2%) |
Health Insurance Coverage by Citizenship Status in North Braddock borough
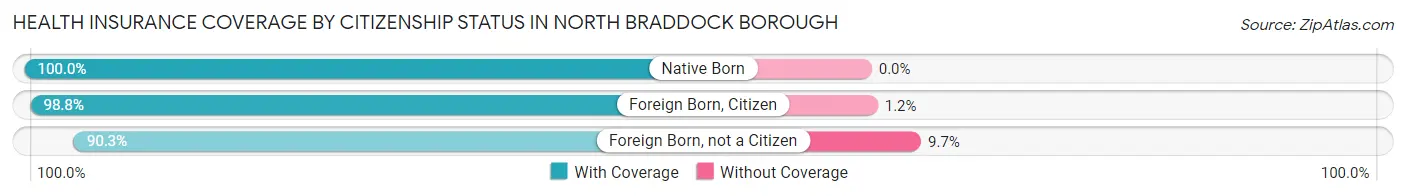
| Citizenship Status | With Coverage | Without Coverage |
| Native Born | 281 (100.0%) | 0 (0.0%) |
| Foreign Born, Citizen | 417 (98.8%) | 5 (1.2%) |
| Foreign Born, not a Citizen | 466 (90.3%) | 50 (9.7%) |
Health Insurance Coverage by Household Income in North Braddock borough
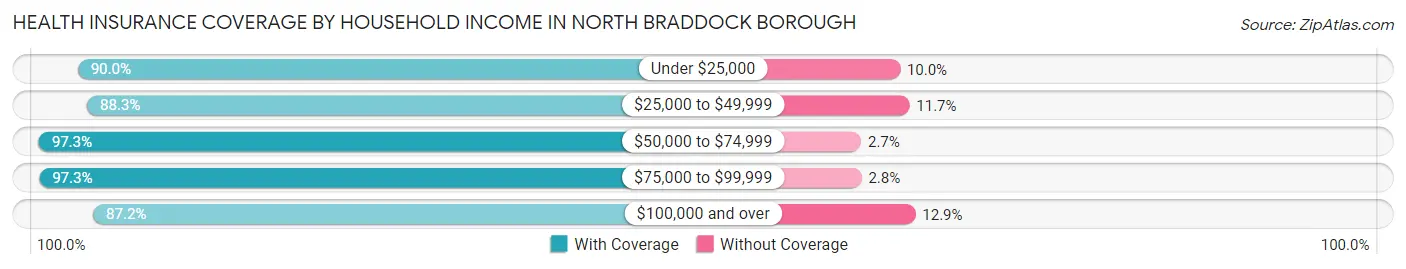
| Household Income | With Coverage | Without Coverage |
| Under $25,000 | 931 (90.0%) | 103 (10.0%) |
| $25,000 to $49,999 | 979 (88.3%) | 130 (11.7%) |
| $50,000 to $74,999 | 730 (97.3%) | 20 (2.7%) |
| $75,000 to $99,999 | 389 (97.3%) | 11 (2.8%) |
| $100,000 and over | 895 (87.2%) | 132 (12.9%) |
Public vs Private Health Insurance Coverage by Age in North Braddock borough
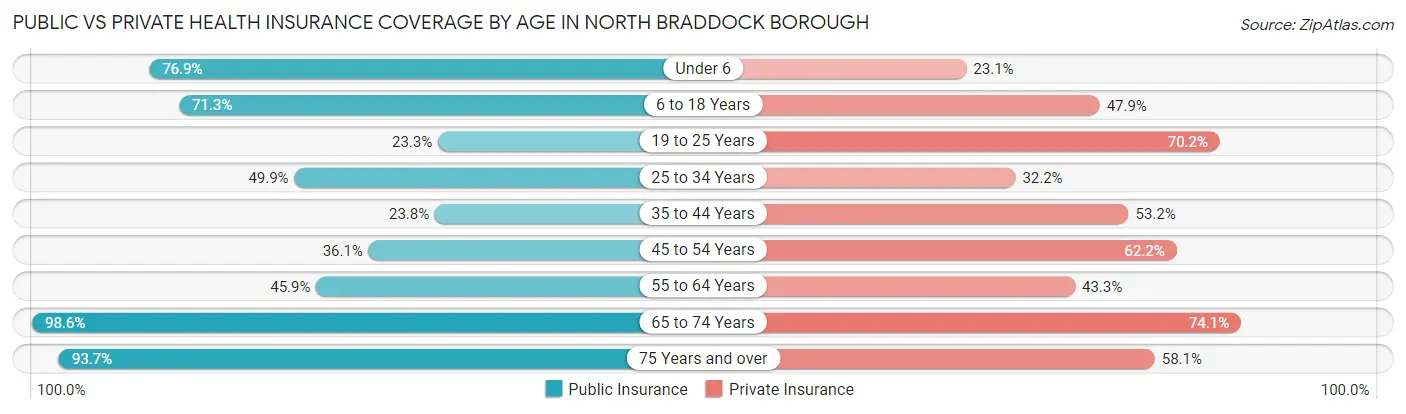
| Age Bracket | Public Insurance | Private Insurance |
| Under 6 | 216 (76.9%) | 65 (23.1%) |
| 6 to 18 Years | 301 (71.3%) | 202 (47.9%) |
| 19 to 25 Years | 120 (23.3%) | 362 (70.2%) |
| 25 to 34 Years | 271 (49.9%) | 175 (32.2%) |
| 35 to 44 Years | 111 (23.8%) | 248 (53.2%) |
| 45 to 54 Years | 168 (36.1%) | 289 (62.2%) |
| 55 to 64 Years | 304 (45.9%) | 287 (43.3%) |
| 65 to 74 Years | 640 (98.6%) | 481 (74.1%) |
| 75 Years and over | 295 (93.6%) | 183 (58.1%) |
| Total | 2,426 (56.2%) | 2,292 (53.1%) |
Disability Status by Sex by Age in North Braddock borough
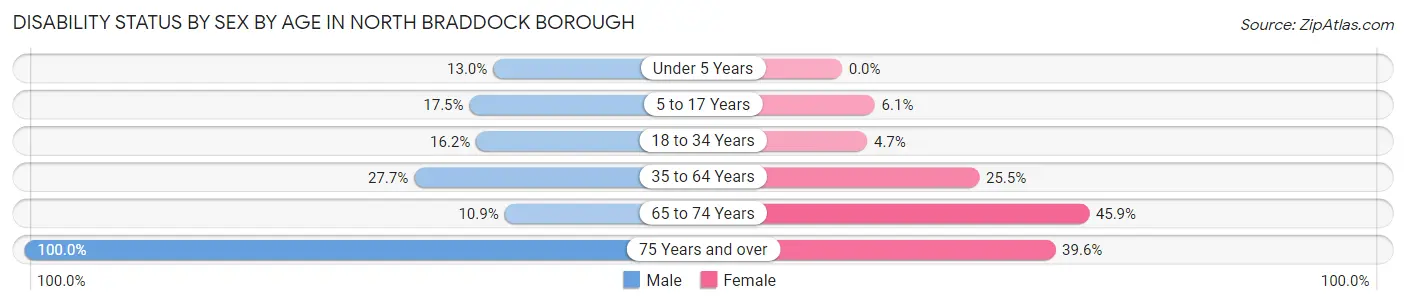
| Age Bracket | Male | Female |
| Under 5 Years | 9 (13.0%) | 0 (0.0%) |
| 5 to 17 Years | 37 (17.4%) | 13 (6.1%) |
| 18 to 34 Years | 91 (16.2%) | 25 (4.7%) |
| 35 to 64 Years | 184 (27.7%) | 237 (25.5%) |
| 65 to 74 Years | 34 (10.9%) | 155 (45.9%) |
| 75 Years and over | 65 (100.0%) | 99 (39.6%) |
Disability Class by Sex by Age in North Braddock borough
Disability Class: Hearing Difficulty
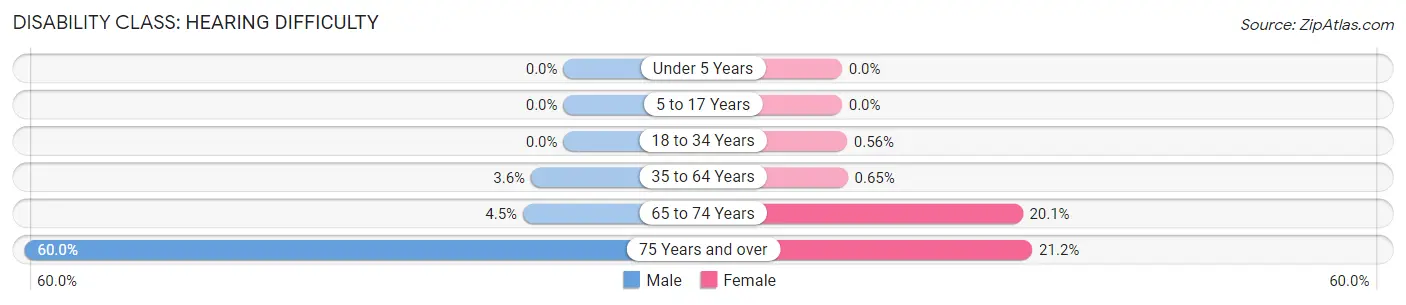
| Age Bracket | Male | Female |
| Under 5 Years | 0 (0.0%) | 0 (0.0%) |
| 5 to 17 Years | 0 (0.0%) | 0 (0.0%) |
| 18 to 34 Years | 0 (0.0%) | 3 (0.6%) |
| 35 to 64 Years | 24 (3.6%) | 6 (0.6%) |
| 65 to 74 Years | 14 (4.5%) | 68 (20.1%) |
| 75 Years and over | 39 (60.0%) | 53 (21.2%) |
Disability Class: Vision Difficulty
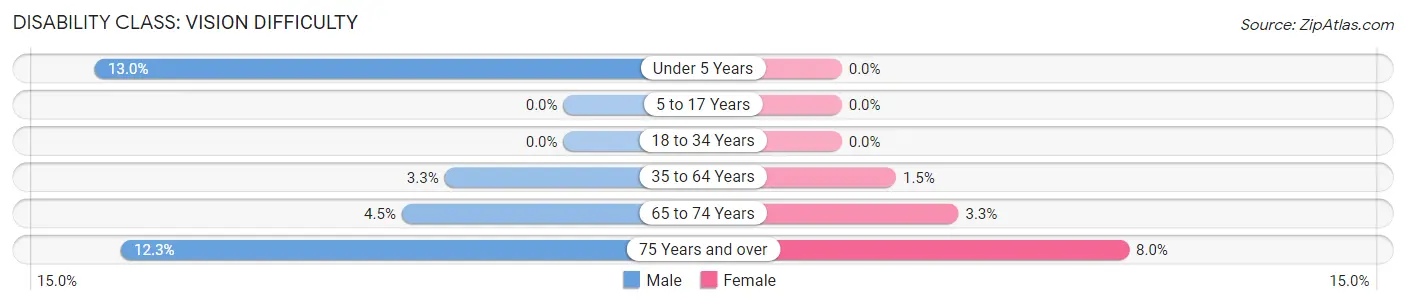
| Age Bracket | Male | Female |
| Under 5 Years | 9 (13.0%) | 0 (0.0%) |
| 5 to 17 Years | 0 (0.0%) | 0 (0.0%) |
| 18 to 34 Years | 0 (0.0%) | 0 (0.0%) |
| 35 to 64 Years | 22 (3.3%) | 14 (1.5%) |
| 65 to 74 Years | 14 (4.5%) | 11 (3.3%) |
| 75 Years and over | 8 (12.3%) | 20 (8.0%) |
Disability Class: Cognitive Difficulty
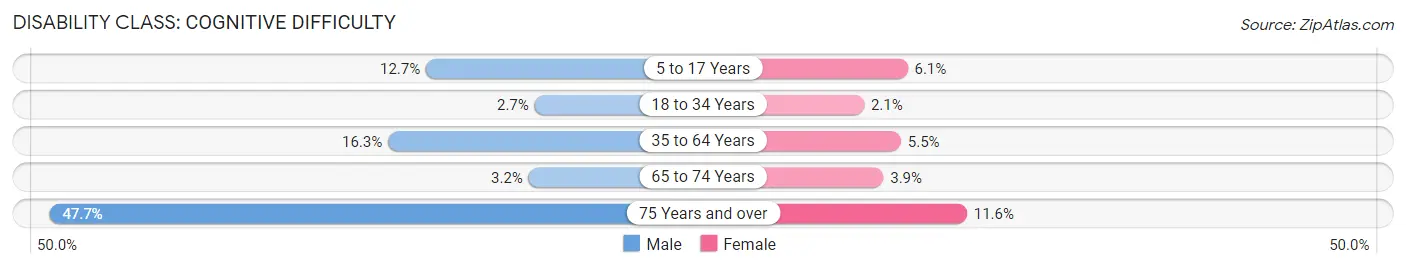
| Age Bracket | Male | Female |
| 5 to 17 Years | 27 (12.7%) | 13 (6.1%) |
| 18 to 34 Years | 15 (2.7%) | 11 (2.1%) |
| 35 to 64 Years | 108 (16.3%) | 51 (5.5%) |
| 65 to 74 Years | 10 (3.2%) | 13 (3.8%) |
| 75 Years and over | 31 (47.7%) | 29 (11.6%) |
Disability Class: Ambulatory Difficulty
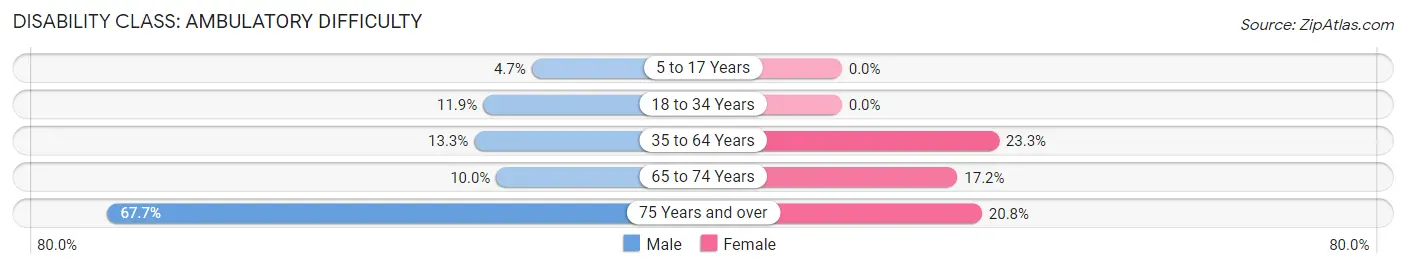
| Age Bracket | Male | Female |
| 5 to 17 Years | 10 (4.7%) | 0 (0.0%) |
| 18 to 34 Years | 67 (11.9%) | 0 (0.0%) |
| 35 to 64 Years | 88 (13.3%) | 217 (23.3%) |
| 65 to 74 Years | 31 (10.0%) | 58 (17.2%) |
| 75 Years and over | 44 (67.7%) | 52 (20.8%) |
Disability Class: Self-Care Difficulty
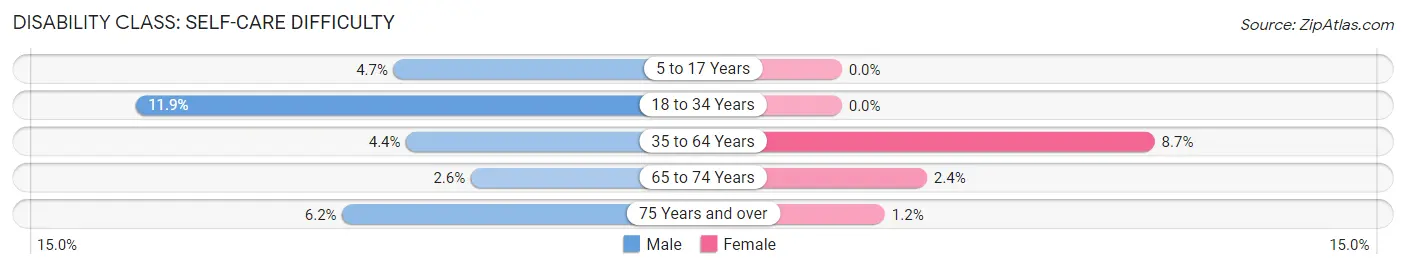
| Age Bracket | Male | Female |
| 5 to 17 Years | 10 (4.7%) | 0 (0.0%) |
| 18 to 34 Years | 67 (11.9%) | 0 (0.0%) |
| 35 to 64 Years | 29 (4.4%) | 81 (8.7%) |
| 65 to 74 Years | 8 (2.6%) | 8 (2.4%) |
| 75 Years and over | 4 (6.1%) | 3 (1.2%) |
Technology Access in North Braddock borough
Computing Device Access in North Braddock borough
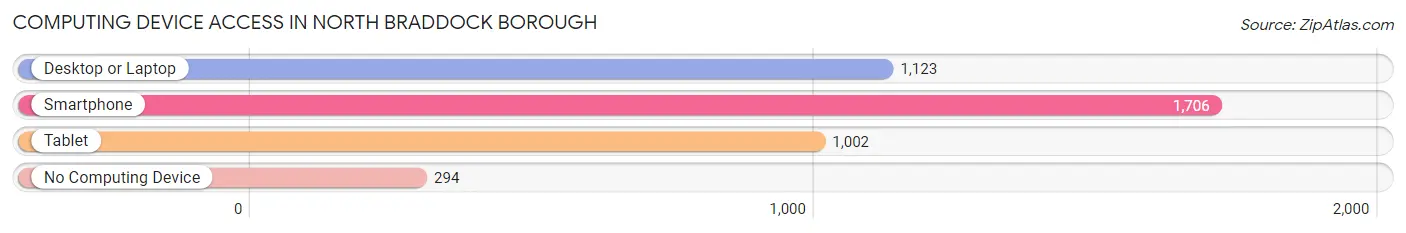
| Device Type | # Households | % Households |
| Desktop or Laptop | 1,123 | 52.0% |
| Smartphone | 1,706 | 79.0% |
| Tablet | 1,002 | 46.4% |
| No Computing Device | 294 | 13.6% |
| Total | 2,158 | 100.0% |
Internet Access in North Braddock borough
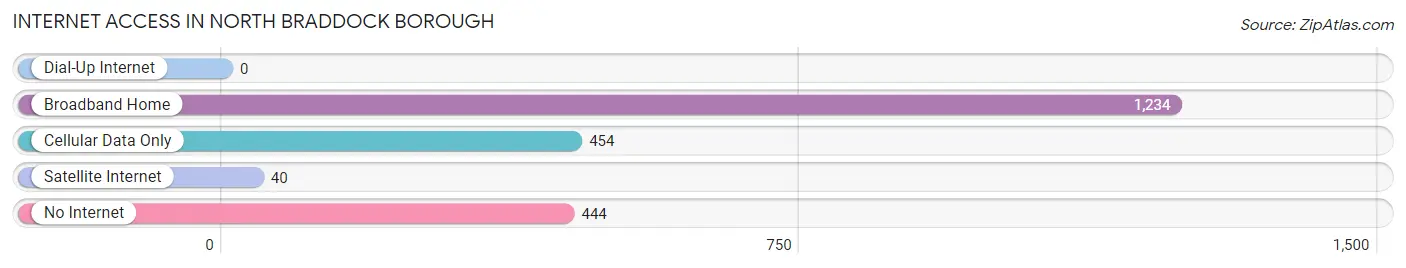
| Internet Type | # Households | % Households |
| Dial-Up Internet | 0 | 0.0% |
| Broadband Home | 1,234 | 57.2% |
| Cellular Data Only | 454 | 21.0% |
| Satellite Internet | 40 | 1.8% |
| No Internet | 444 | 20.6% |
| Total | 2,158 | 100.0% |
North Braddock borough Summary
North Braddock Borough is a small borough located in Allegheny County, Pennsylvania. It is situated just east of the city of Pittsburgh and is part of the Mon Valley. The borough has a population of approximately 3,000 people and covers an area of 1.2 square miles.
History
North Braddock was originally part of the larger Braddock Township, which was established in 1788. The area was first settled in the late 1700s by German and Scots-Irish immigrants. The first industry in the area was a grist mill, which was built in 1790. The area was known as "Braddock's Field" until 1845, when it was officially incorporated as the Borough of North Braddock.
The area was an important industrial center in the late 19th and early 20th centuries. The Edgar Thomson Steel Works, which was built in 1875, was the first steel mill in the United States and was located in North Braddock. The mill was the largest employer in the area and provided jobs for thousands of people. The mill was eventually closed in the 1980s, but the area still retains its industrial heritage.
Geography
North Braddock is located in the Monongahela Valley, which is part of the Allegheny Plateau. The borough is situated on the north bank of the Monongahela River and is bordered by the boroughs of Braddock, Rankin, and Swissvale. The borough is located approximately 10 miles east of downtown Pittsburgh.
The terrain of North Braddock is mostly flat, with some rolling hills in the northern part of the borough. The borough is located in a humid continental climate zone, with hot summers and cold winters. The average annual temperature is around 50 degrees Fahrenheit.
Economy
North Braddock's economy is largely based on manufacturing and services. The borough is home to several small businesses, including a number of auto repair shops, restaurants, and retail stores. The borough also has a number of industrial parks, which are home to a variety of manufacturing companies.
The borough is also home to the Edgar Thomson Steel Works, which is now owned by U.S. Steel. The mill is still in operation and provides jobs for hundreds of people in the area.
Demographics
As of the 2010 census, North Braddock had a population of 3,039 people. The racial makeup of the borough was 79.3% White, 15.2% African American, 0.3% Native American, 0.7% Asian, and 4.5% from other races. The median household income was $30,938, and the median family income was $37,917.
The borough is home to a large number of immigrants, with the largest groups being from Mexico, Poland, and the Dominican Republic. The borough also has a large number of people who are of Italian and Irish descent.
Conclusion
North Braddock is a small borough located in Allegheny County, Pennsylvania. It is situated just east of the city of Pittsburgh and is part of the Mon Valley. The borough has a population of approximately 3,000 people and covers an area of 1.2 square miles. The borough has a long history of industry and is home to the Edgar Thomson Steel Works, which is now owned by U.S. Steel. The borough's economy is largely based on manufacturing and services, and the median household income is $30,938. North Braddock is also home to a large number of immigrants, with the largest groups being from Mexico, Poland, and the Dominican Republic.
Common Questions
What is the Total Population of North Braddock borough?
Total Population of North Braddock borough is 4,320.
What is the Total Male Population of North Braddock borough?
Total Male Population of North Braddock borough is 1,883.
What is the Total Female Population of North Braddock borough?
Total Female Population of North Braddock borough is 2,437.
What is the Ratio of Males per 100 Females in North Braddock borough?
There are 77.27 Males per 100 Females in North Braddock borough.
What is the Ratio of Females per 100 Males in North Braddock borough?
There are 129.42 Females per 100 Males in North Braddock borough.
What is the Median Population Age in North Braddock borough?
Median Population Age in North Braddock borough is 43.8 Years.
What is the Average Family Size in North Braddock borough
Average Family Size in North Braddock borough is 3.0 People.
What is the Average Household Size in North Braddock borough
Average Household Size in North Braddock borough is 2.0 People.
What is Per Capita Income in North Braddock borough?
Per Capita income in North Braddock borough is $37,338.
What is the Median Family Income in North Braddock borough?
Median Family Income in North Braddock borough is $47,088.
What is the Median Household income in North Braddock borough?
Median Household Income in North Braddock borough is $39,885.
What is Income or Wage Gap in North Braddock borough?
Income or Wage Gap in North Braddock borough is 21.8%.
Women in North Braddock borough earn 78.2 cents for every dollar earned by a man.
What is Family Income Deficit in North Braddock borough?
Family Income Deficit in North Braddock borough is $8,302.
Families that are below poverty line in North Braddock borough earn $8,302 less on average than the poverty threshold level.
What is Inequality or Gini Index in North Braddock borough?
Inequality or Gini Index in North Braddock borough is 0.62.
How Large is the Labor Force in North Braddock borough?
There are 2,435 People in the Labor Forcein in North Braddock borough.
What is the Percentage of People in the Labor Force in North Braddock borough?
64.8% of People are in the Labor Force in North Braddock borough.
What is the Unemployment Rate in North Braddock borough?
Unemployment Rate in North Braddock borough is 16.3%.