New Holland borough, PA
New Holland borough Overview
5,734
TOTAL POPULATION
3,032
MALE POPULATION
2,702
FEMALE POPULATION
112.21
MALES / 100 FEMALES
89.12
FEMALES / 100 MALES
42.0
MEDIAN AGE
3.6
AVG FAMILY SIZE
2.7
AVG HOUSEHOLD SIZE
$33,137
PER CAPITA INCOME
$76,932
AVG FAMILY INCOME
$59,553
AVG HOUSEHOLD INCOME
53.7%
WAGE / INCOME GAP [ % ]
46.3¢/ $1
WAGE / INCOME GAP [ $ ]
0.47
INEQUALITY / GINI INDEX
2,907
LABOR FORCE [ PEOPLE ]
61.9%
PERCENT IN LABOR FORCE
2.6%
UNEMPLOYMENT RATE
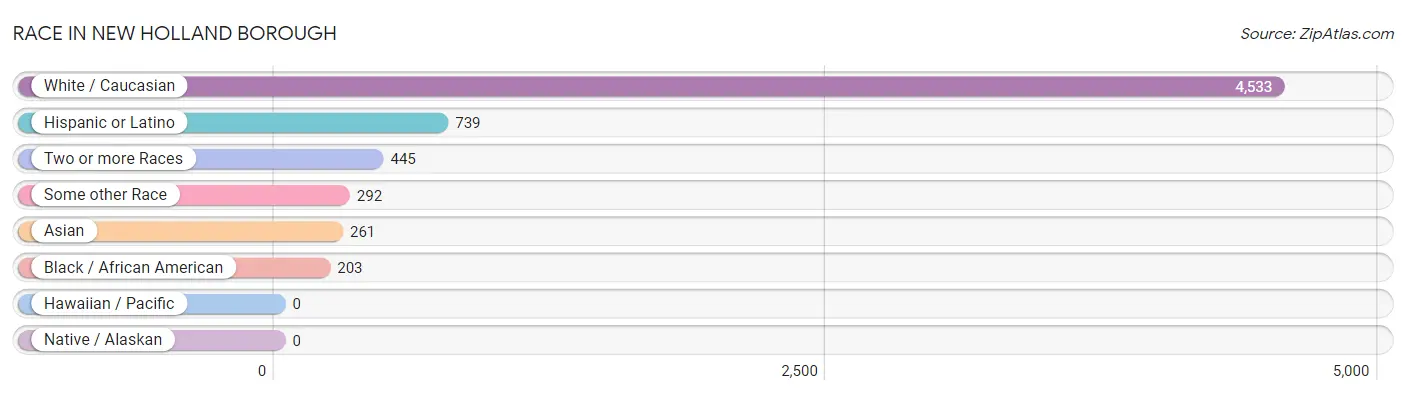
Race in New Holland borough
The most populous races in New Holland borough are White / Caucasian (4,533 | 79.0%), Hispanic or Latino (739 | 12.9%), and Two or more Races (445 | 7.8%).
| Race | # Population | % Population |
| Asian | 261 | 4.5% |
| Black / African American | 203 | 3.5% |
| Hawaiian / Pacific | 0 | 0.0% |
| Hispanic or Latino | 739 | 12.9% |
| Native / Alaskan | 0 | 0.0% |
| White / Caucasian | 4,533 | 79.0% |
| Two or more Races | 445 | 7.8% |
| Some other Race | 292 | 5.1% |
| Total | 5,734 | 100.0% |
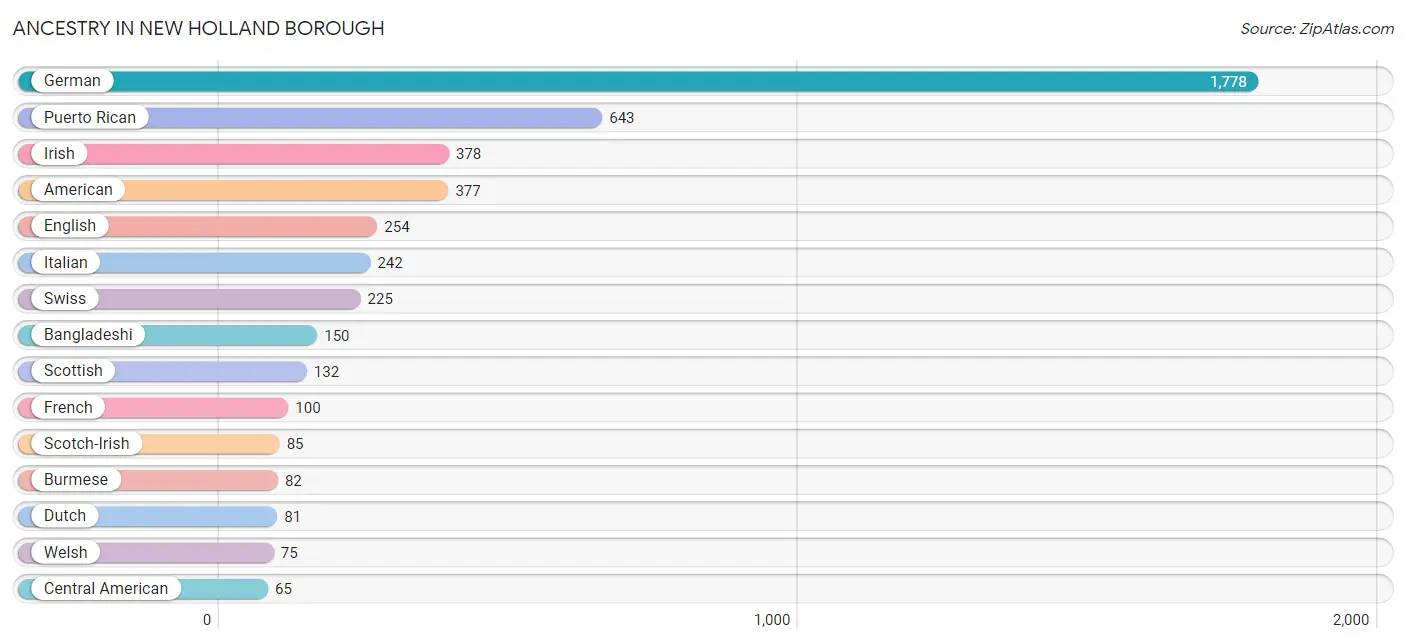
Ancestry in New Holland borough
The most populous ancestries reported in New Holland borough are German (1,778 | 31.0%), Puerto Rican (643 | 11.2%), Irish (378 | 6.6%), American (377 | 6.6%), and English (254 | 4.4%), together accounting for 59.8% of all New Holland borough residents.
| Ancestry | # Population | % Population |
| American | 377 | 6.6% |
| Austrian | 14 | 0.2% |
| Bangladeshi | 150 | 2.6% |
| Blackfeet | 26 | 0.4% |
| British | 18 | 0.3% |
| Burmese | 82 | 1.4% |
| Central American | 65 | 1.1% |
| Cherokee | 35 | 0.6% |
| Choctaw | 26 | 0.4% |
| Colombian | 18 | 0.3% |
| Czech | 18 | 0.3% |
| Dutch | 81 | 1.4% |
| English | 254 | 4.4% |
| French | 100 | 1.7% |
| German | 1,778 | 31.0% |
| Honduran | 46 | 0.8% |
| Hungarian | 10 | 0.2% |
| Irish | 378 | 6.6% |
| Italian | 242 | 4.2% |
| Mexican | 13 | 0.2% |
| Nicaraguan | 19 | 0.3% |
| Pennsylvania German | 45 | 0.8% |
| Polish | 60 | 1.1% |
| Portuguese | 64 | 1.1% |
| Puerto Rican | 643 | 11.2% |
| Scotch-Irish | 85 | 1.5% |
| Scottish | 132 | 2.3% |
| South American | 18 | 0.3% |
| Sri Lankan | 61 | 1.1% |
| Swedish | 24 | 0.4% |
| Swiss | 225 | 3.9% |
| Ukrainian | 25 | 0.4% |
| Welsh | 75 | 1.3% |
| Yugoslavian | 8 | 0.1% | View All 34 Rows |
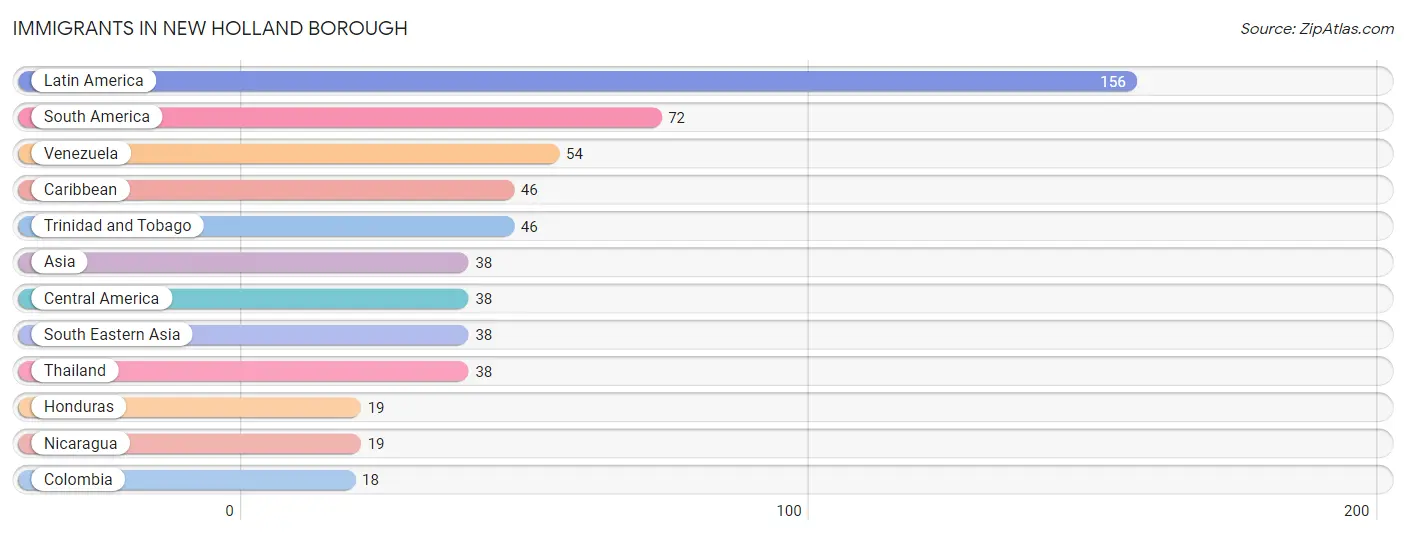
Immigrants in New Holland borough
The most numerous immigrant groups reported in New Holland borough came from Latin America (156 | 2.7%), South America (72 | 1.3%), Venezuela (54 | 0.9%), Caribbean (46 | 0.8%), and Trinidad and Tobago (46 | 0.8%), together accounting for 6.5% of all New Holland borough residents.
| Immigration Origin | # Population | % Population |
| Asia | 38 | 0.7% |
| Caribbean | 46 | 0.8% |
| Central America | 38 | 0.7% |
| Colombia | 18 | 0.3% |
| Honduras | 19 | 0.3% |
| Latin America | 156 | 2.7% |
| Nicaragua | 19 | 0.3% |
| South America | 72 | 1.3% |
| South Eastern Asia | 38 | 0.7% |
| Thailand | 38 | 0.7% |
| Trinidad and Tobago | 46 | 0.8% |
| Venezuela | 54 | 0.9% | View All 12 Rows |
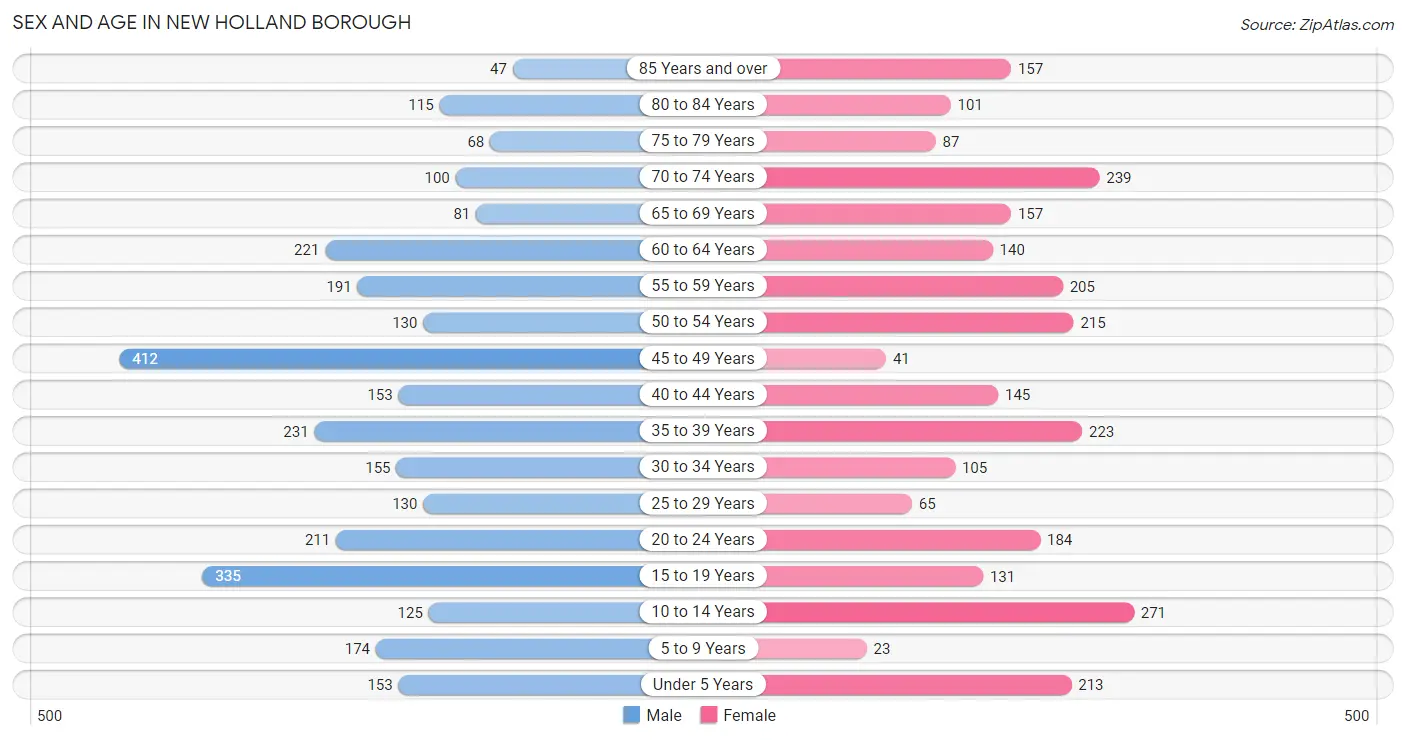
Sex and Age in New Holland borough
Sex and Age in New Holland borough
The most populous age groups in New Holland borough are 45 to 49 Years (412 | 13.6%) for men and 10 to 14 Years (271 | 10.0%) for women.
| Age Bracket | Male | Female |
| Under 5 Years | 153 (5.1%) | 213 (7.9%) |
| 5 to 9 Years | 174 (5.7%) | 23 (0.9%) |
| 10 to 14 Years | 125 (4.1%) | 271 (10.0%) |
| 15 to 19 Years | 335 (11.1%) | 131 (4.9%) |
| 20 to 24 Years | 211 (7.0%) | 184 (6.8%) |
| 25 to 29 Years | 130 (4.3%) | 65 (2.4%) |
| 30 to 34 Years | 155 (5.1%) | 105 (3.9%) |
| 35 to 39 Years | 231 (7.6%) | 223 (8.3%) |
| 40 to 44 Years | 153 (5.1%) | 145 (5.4%) |
| 45 to 49 Years | 412 (13.6%) | 41 (1.5%) |
| 50 to 54 Years | 130 (4.3%) | 215 (8.0%) |
| 55 to 59 Years | 191 (6.3%) | 205 (7.6%) |
| 60 to 64 Years | 221 (7.3%) | 140 (5.2%) |
| 65 to 69 Years | 81 (2.7%) | 157 (5.8%) |
| 70 to 74 Years | 100 (3.3%) | 239 (8.8%) |
| 75 to 79 Years | 68 (2.2%) | 87 (3.2%) |
| 80 to 84 Years | 115 (3.8%) | 101 (3.7%) |
| 85 Years and over | 47 (1.5%) | 157 (5.8%) |
| Total | 3,032 (100.0%) | 2,702 (100.0%) |
Families and Households in New Holland borough
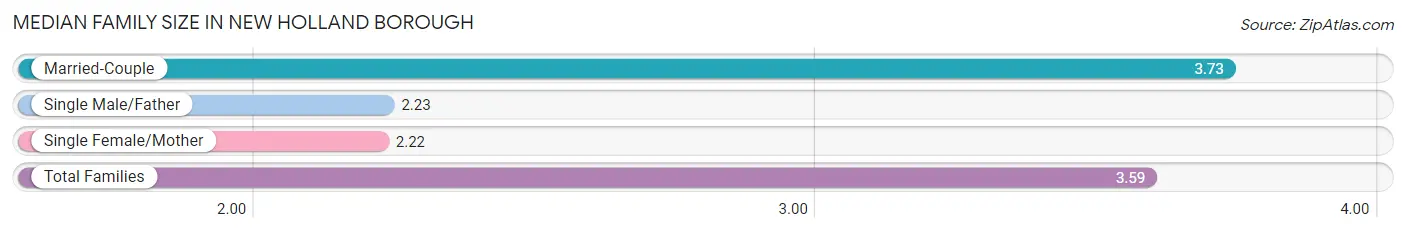
Median Family Size in New Holland borough
The median family size in New Holland borough is 3.59 persons per family, with married-couple families (1,164 | 90.8%) accounting for the largest median family size of 3.73 persons per family. On the other hand, single female/mother families (78 | 6.1%) represent the smallest median family size with 2.22 persons per family.
| Family Type | # Families | Family Size |
| Married-Couple | 1,164 (90.8%) | 3.73 |
| Single Male/Father | 40 (3.1%) | 2.23 |
| Single Female/Mother | 78 (6.1%) | 2.22 |
| Total Families | 1,282 (100.0%) | 3.59 |
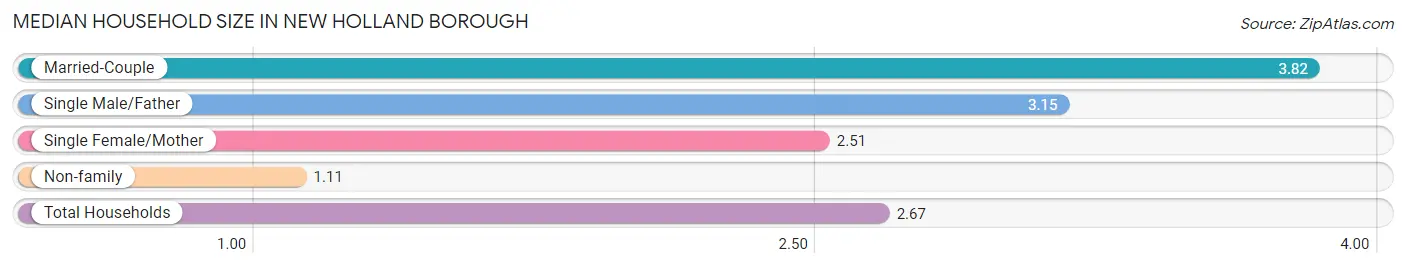
Median Household Size in New Holland borough
The median household size in New Holland borough is 2.67 persons per household, with married-couple households (1,164 | 54.2%) accounting for the largest median household size of 3.82 persons per household. non-family households (867 | 40.3%) represent the smallest median household size with 1.11 persons per household.
| Household Type | # Households | Household Size |
| Married-Couple | 1,164 (54.2%) | 3.82 |
| Single Male/Father | 40 (1.9%) | 3.15 |
| Single Female/Mother | 78 (3.6%) | 2.51 |
| Non-family | 867 (40.3%) | 1.11 |
| Total Households | 2,149 (100.0%) | 2.67 |
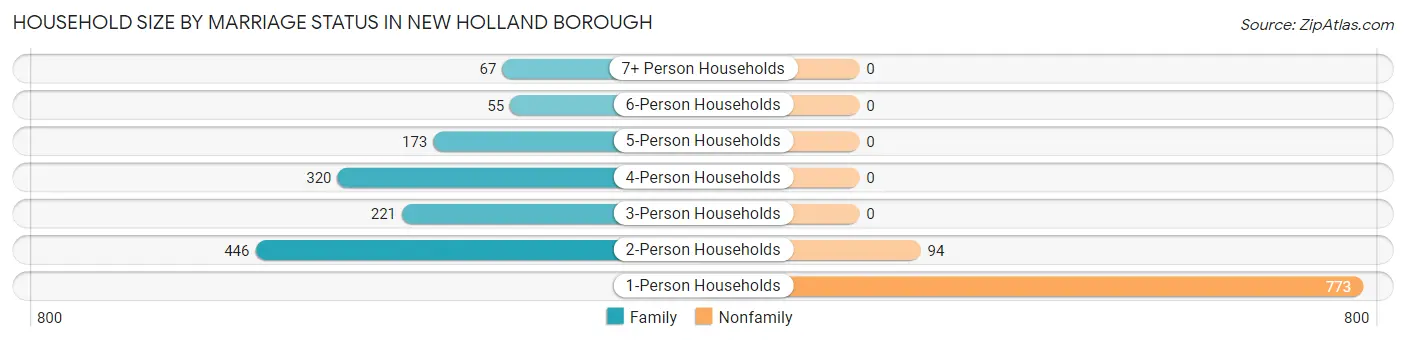
Household Size by Marriage Status in New Holland borough
Out of a total of 2,149 households in New Holland borough, 1,282 (59.7%) are family households, while 867 (40.3%) are nonfamily households. The most numerous type of family households are 2-person households, comprising 446, and the most common type of nonfamily households are 1-person households, comprising 773.
| Household Size | Family Households | Nonfamily Households |
| 1-Person Households | - | 773 (36.0%) |
| 2-Person Households | 446 (20.7%) | 94 (4.4%) |
| 3-Person Households | 221 (10.3%) | 0 (0.0%) |
| 4-Person Households | 320 (14.9%) | 0 (0.0%) |
| 5-Person Households | 173 (8.1%) | 0 (0.0%) |
| 6-Person Households | 55 (2.6%) | 0 (0.0%) |
| 7+ Person Households | 67 (3.1%) | 0 (0.0%) |
| Total | 1,282 (59.7%) | 867 (40.3%) |
Female Fertility in New Holland borough
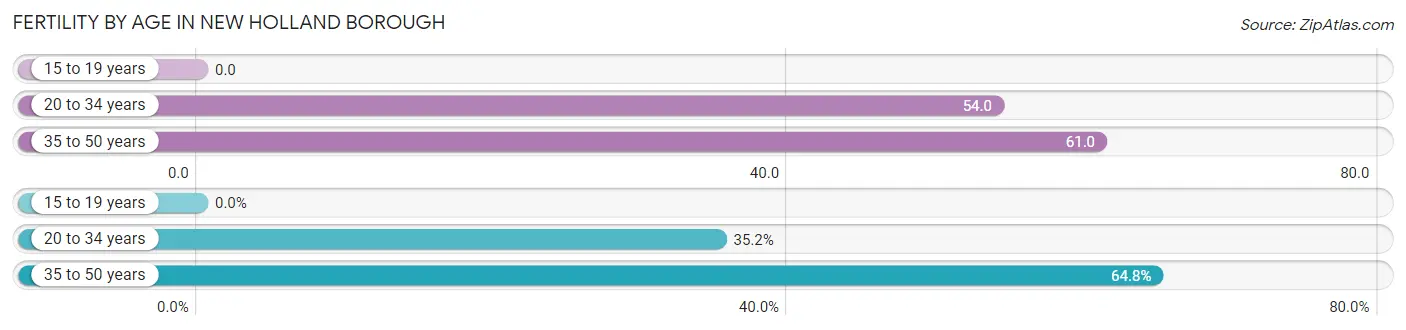
Fertility by Age in New Holland borough
Average fertility rate in New Holland borough is 51.0 births per 1,000 women. Women in the age bracket of 35 to 50 years have the highest fertility rate with 61.0 births per 1,000 women. Women in the age bracket of 35 to 50 years acount for 64.8% of all women with births.
| Age Bracket | Women with Births | Births / 1,000 Women |
| 15 to 19 years | 0 (0.0%) | 0.0 |
| 20 to 34 years | 19 (35.2%) | 54.0 |
| 35 to 50 years | 35 (64.8%) | 61.0 |
| Total | 54 (100.0%) | 51.0 |
Fertility by Age by Marriage Status in New Holland borough
61.1% of women with births (54) in New Holland borough are married. The highest percentage of unmarried women with births falls into 35 to 50 years age bracket with 60.0% of them unmarried at the time of birth, while the lowest percentage of unmarried women with births belong to 20 to 34 years age bracket with 0.0% of them unmarried.
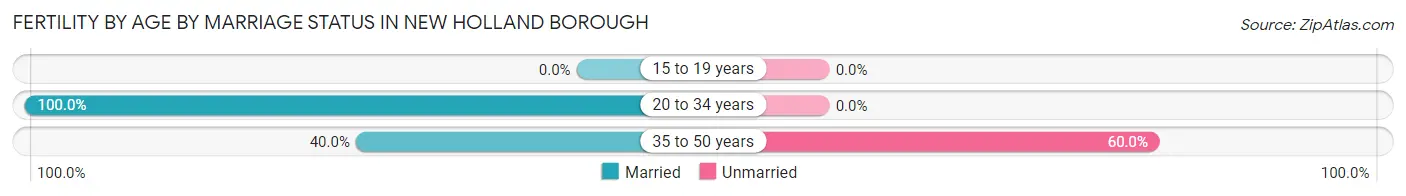
| Age Bracket | Married | Unmarried |
| 15 to 19 years | 0 (0.0%) | 0 (0.0%) |
| 20 to 34 years | 19 (100.0%) | 0 (0.0%) |
| 35 to 50 years | 14 (40.0%) | 21 (60.0%) |
| Total | 33 (61.1%) | 21 (38.9%) |
Fertility by Education in New Holland borough
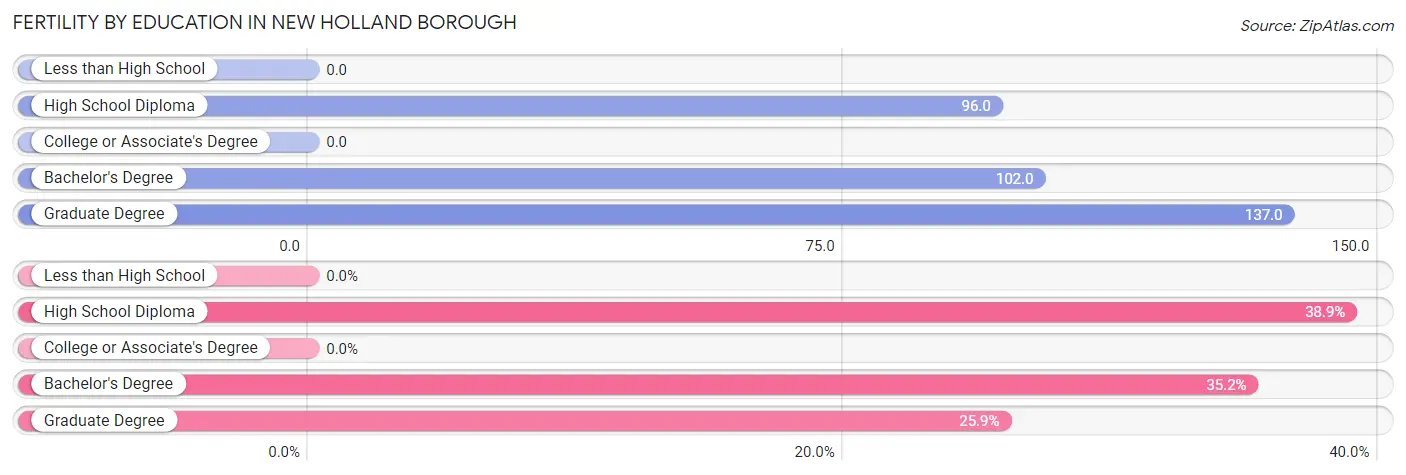
| Educational Attainment | Women with Births | Births / 1,000 Women |
| Less than High School | 0 (0.0%) | 0.0 |
| High School Diploma | 21 (38.9%) | 96.0 |
| College or Associate's Degree | 0 (0.0%) | 0.0 |
| Bachelor's Degree | 19 (35.2%) | 102.0 |
| Graduate Degree | 14 (25.9%) | 137.0 |
| Total | 54 (100.0%) | 51.0 |
Fertility by Education by Marriage Status in New Holland borough
38.9% of women with births in New Holland borough are unmarried. Women with the educational attainment of bachelor's degree are most likely to be married with 100.0% of them married at childbirth, while women with the educational attainment of high school diploma are least likely to be married with 100.0% of them unmarried at childbirth.
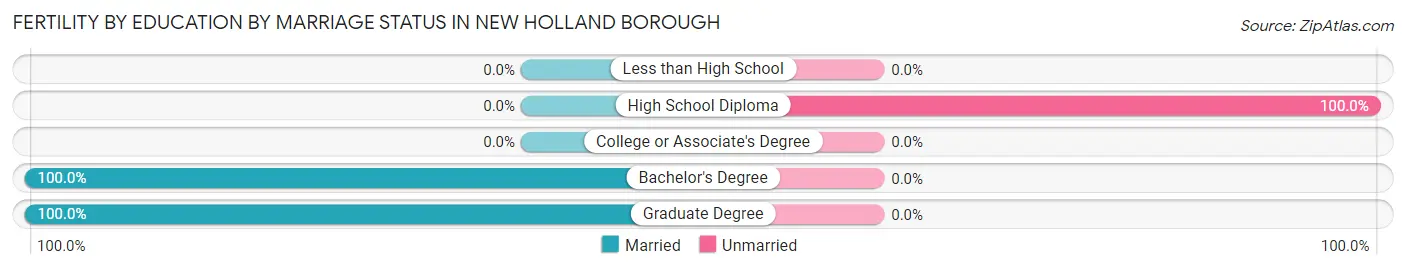
| Educational Attainment | Married | Unmarried |
| Less than High School | 0 (0.0%) | 0 (0.0%) |
| High School Diploma | 0 (0.0%) | 21 (100.0%) |
| College or Associate's Degree | 0 (0.0%) | 0 (0.0%) |
| Bachelor's Degree | 19 (100.0%) | 0 (0.0%) |
| Graduate Degree | 14 (100.0%) | 0 (0.0%) |
| Total | 33 (61.1%) | 21 (38.9%) |
Income in New Holland borough
Income Overview in New Holland borough
Per Capita Income in New Holland borough is $33,137, while median incomes of families and households are $76,932 and $59,553 respectively.
| Characteristic | Number | Measure |
| Per Capita Income | 5,734 | $33,137 |
| Median Family Income | 1,282 | $76,932 |
| Mean Family Income | 1,282 | $110,668 |
| Median Household Income | 2,149 | $59,553 |
| Mean Household Income | 2,149 | $85,442 |
| Income Deficit | 1,282 | $0 |
| Wage / Income Gap (%) | 5,734 | 53.74% |
| Wage / Income Gap ($) | 5,734 | 46.26¢ per $1 |
| Gini / Inequality Index | 5,734 | 0.47 |
Earnings by Sex in New Holland borough
Average Earnings in New Holland borough are $35,405, $44,381 for men and $20,530 for women, a difference of 53.7%.
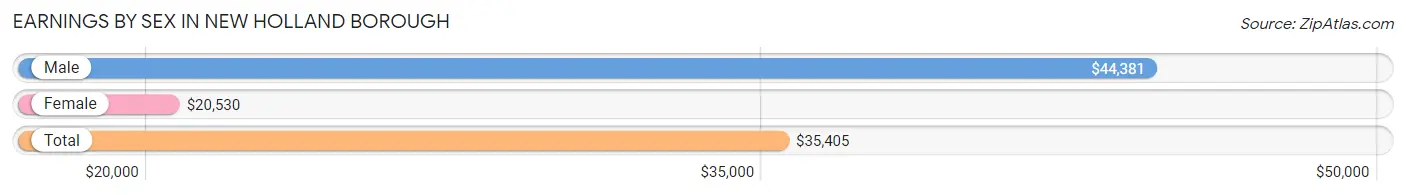
| Sex | Number | Average Earnings |
| Male | 1,874 (60.8%) | $44,381 |
| Female | 1,208 (39.2%) | $20,530 |
| Total | 3,082 (100.0%) | $35,405 |
Earnings by Sex by Income Bracket in New Holland borough
The most common earnings brackets in New Holland borough are $25,000 to $29,999 for men (306 | 16.3%) and $7,500 to $9,999 for women (158 | 13.1%).
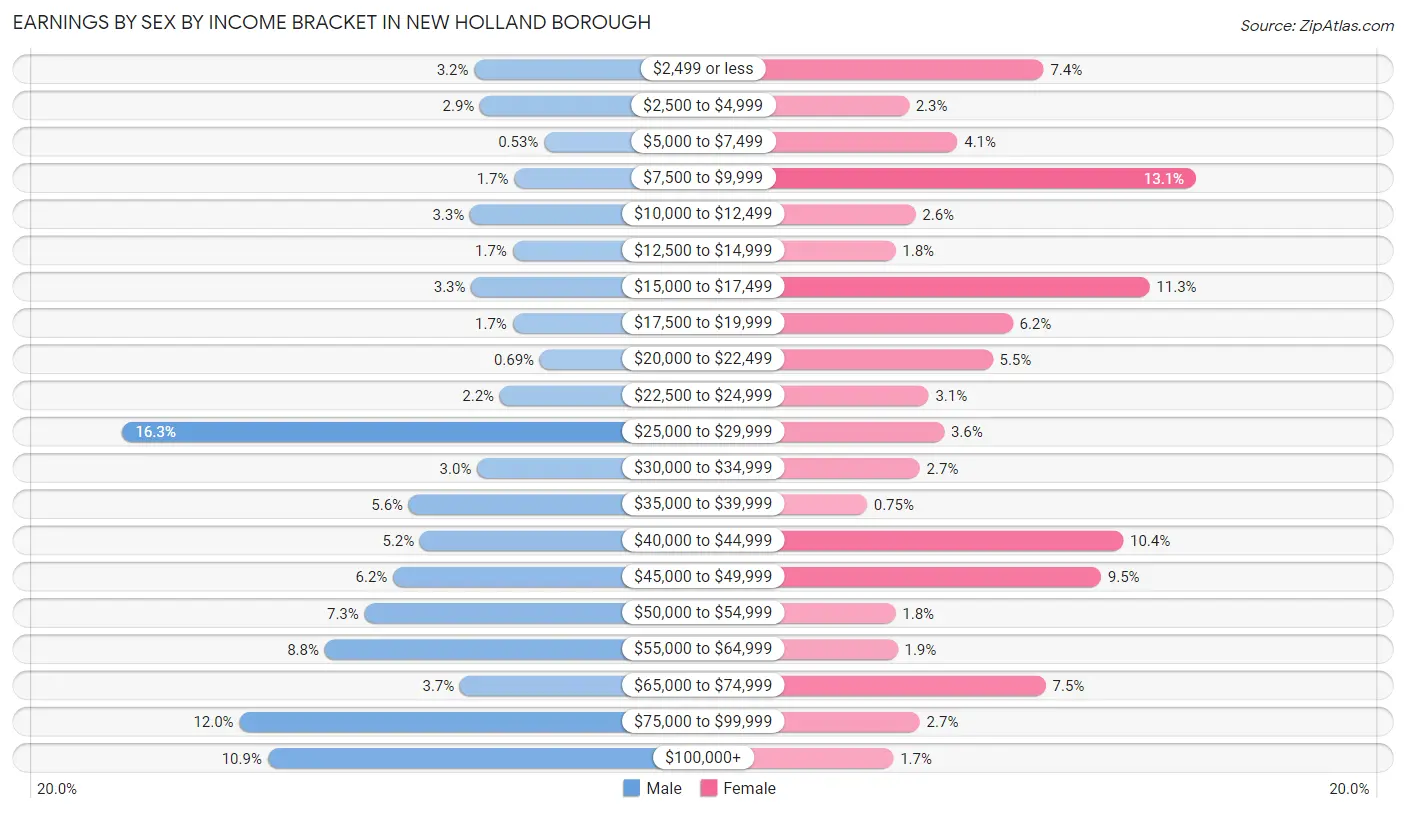
| Income | Male | Female |
| $2,499 or less | 59 (3.2%) | 89 (7.4%) |
| $2,500 to $4,999 | 55 (2.9%) | 28 (2.3%) |
| $5,000 to $7,499 | 10 (0.5%) | 50 (4.1%) |
| $7,500 to $9,999 | 31 (1.7%) | 158 (13.1%) |
| $10,000 to $12,499 | 62 (3.3%) | 31 (2.6%) |
| $12,500 to $14,999 | 32 (1.7%) | 22 (1.8%) |
| $15,000 to $17,499 | 61 (3.3%) | 137 (11.3%) |
| $17,500 to $19,999 | 32 (1.7%) | 75 (6.2%) |
| $20,000 to $22,499 | 13 (0.7%) | 66 (5.5%) |
| $22,500 to $24,999 | 41 (2.2%) | 37 (3.1%) |
| $25,000 to $29,999 | 306 (16.3%) | 44 (3.6%) |
| $30,000 to $34,999 | 57 (3.0%) | 33 (2.7%) |
| $35,000 to $39,999 | 105 (5.6%) | 9 (0.7%) |
| $40,000 to $44,999 | 97 (5.2%) | 125 (10.3%) |
| $45,000 to $49,999 | 116 (6.2%) | 115 (9.5%) |
| $50,000 to $54,999 | 136 (7.3%) | 22 (1.8%) |
| $55,000 to $64,999 | 164 (8.7%) | 23 (1.9%) |
| $65,000 to $74,999 | 69 (3.7%) | 90 (7.4%) |
| $75,000 to $99,999 | 224 (11.9%) | 33 (2.7%) |
| $100,000+ | 204 (10.9%) | 21 (1.7%) |
| Total | 1,874 (100.0%) | 1,208 (100.0%) |
Earnings by Sex by Educational Attainment in New Holland borough
Average earnings in New Holland borough are $47,029 for men and $23,986 for women, a difference of 49.0%. Men with an educational attainment of bachelor's degree enjoy the highest average annual earnings of $77,434, while those with high school diploma education earn the least with $44,807. Women with an educational attainment of graduate degree earn the most with the average annual earnings of $46,481, while those with less than high school education have the smallest earnings of $15,977.
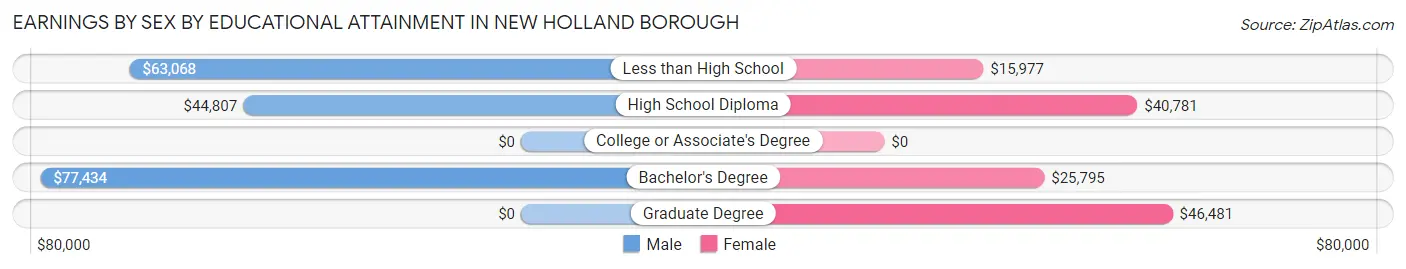
| Educational Attainment | Male Income | Female Income |
| Less than High School | $63,068 | $15,977 |
| High School Diploma | $44,807 | $40,781 |
| College or Associate's Degree | - | - |
| Bachelor's Degree | $77,434 | $25,795 |
| Graduate Degree | - | - |
| Total | $47,029 | $23,986 |
Family Income in New Holland borough
Family Income Brackets in New Holland borough
According to the New Holland borough family income data, there are 279 families falling into the $50,000 to $74,999 income range, which is the most common income bracket and makes up 21.8% of all families. Conversely, the $10,000 to $14,999 income bracket is the least frequent group with only 10 families (0.8%) belonging to this category.
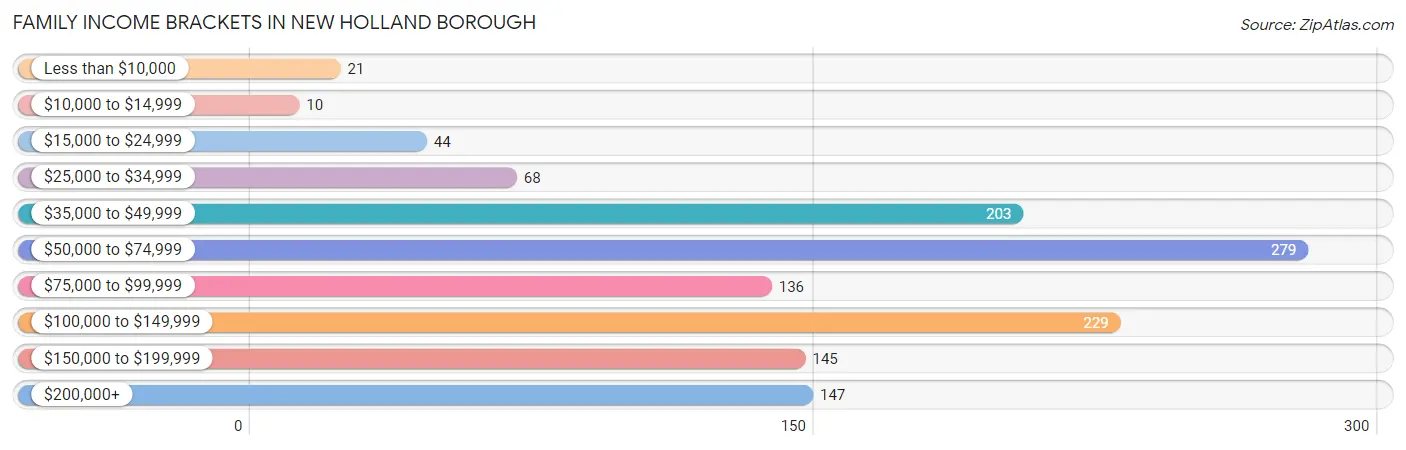
| Income Bracket | # Families | % Families |
| Less than $10,000 | 21 | 1.6% |
| $10,000 to $14,999 | 10 | 0.8% |
| $15,000 to $24,999 | 44 | 3.4% |
| $25,000 to $34,999 | 68 | 5.3% |
| $35,000 to $49,999 | 203 | 15.8% |
| $50,000 to $74,999 | 279 | 21.8% |
| $75,000 to $99,999 | 136 | 10.6% |
| $100,000 to $149,999 | 229 | 17.9% |
| $150,000 to $199,999 | 145 | 11.3% |
| $200,000+ | 147 | 11.5% |
Family Income by Famaliy Size in New Holland borough
5-person families (173 | 13.5%) account for the highest median family income in New Holland borough with $181,641 per family, while 5-person families (173 | 13.5%) have the highest median income of $36,328 per family member.
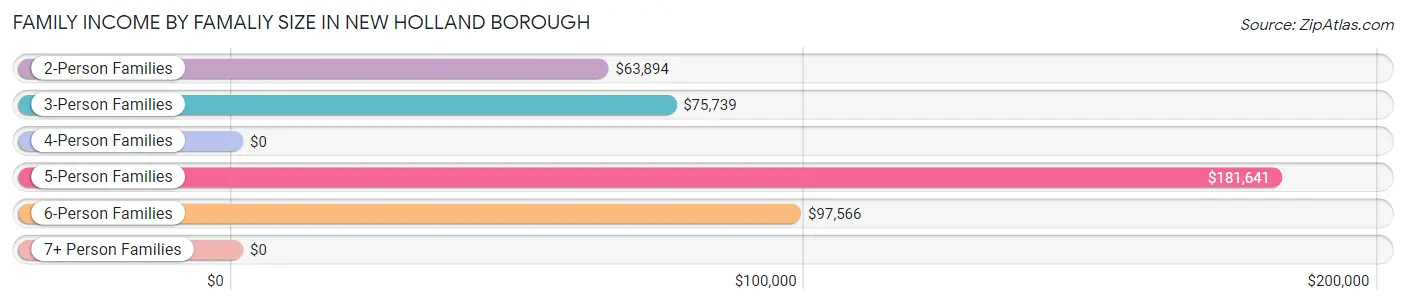
| Income Bracket | # Families | Median Income |
| 2-Person Families | 515 (40.2%) | $63,894 |
| 3-Person Families | 173 (13.5%) | $75,739 |
| 4-Person Families | 299 (23.3%) | $0 |
| 5-Person Families | 173 (13.5%) | $181,641 |
| 6-Person Families | 109 (8.5%) | $97,566 |
| 7+ Person Families | 13 (1.0%) | $0 |
| Total | 1,282 (100.0%) | $76,932 |
Family Income by Number of Earners in New Holland borough
The median family income in New Holland borough is $76,932, with families comprising 3+ earners (305) having the highest median family income of $180,859, while families with no earners (189) have the lowest median family income of $52,159, accounting for 23.8% and 14.7% of families, respectively.
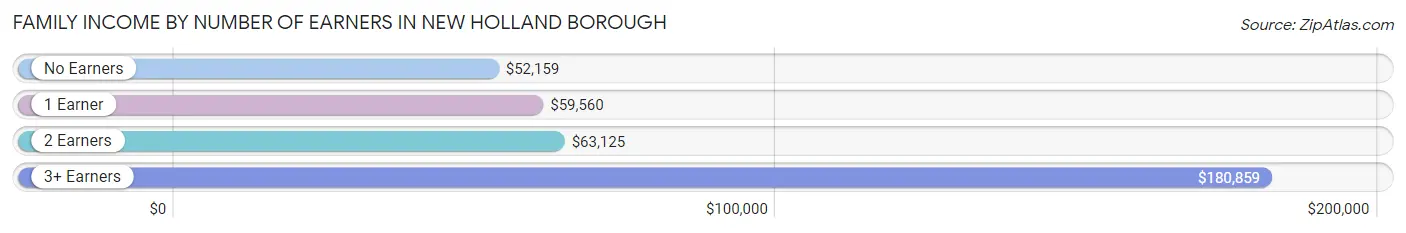
| Number of Earners | # Families | Median Income |
| No Earners | 189 (14.7%) | $52,159 |
| 1 Earner | 365 (28.5%) | $59,560 |
| 2 Earners | 423 (33.0%) | $63,125 |
| 3+ Earners | 305 (23.8%) | $180,859 |
| Total | 1,282 (100.0%) | $76,932 |
Household Income in New Holland borough
Household Income Brackets in New Holland borough
With 398 households falling in the category, the $50,000 to $74,999 income range is the most frequent in New Holland borough, accounting for 18.5% of all households. In contrast, only 26 households (1.2%) fall into the $10,000 to $14,999 income bracket, making it the least populous group.
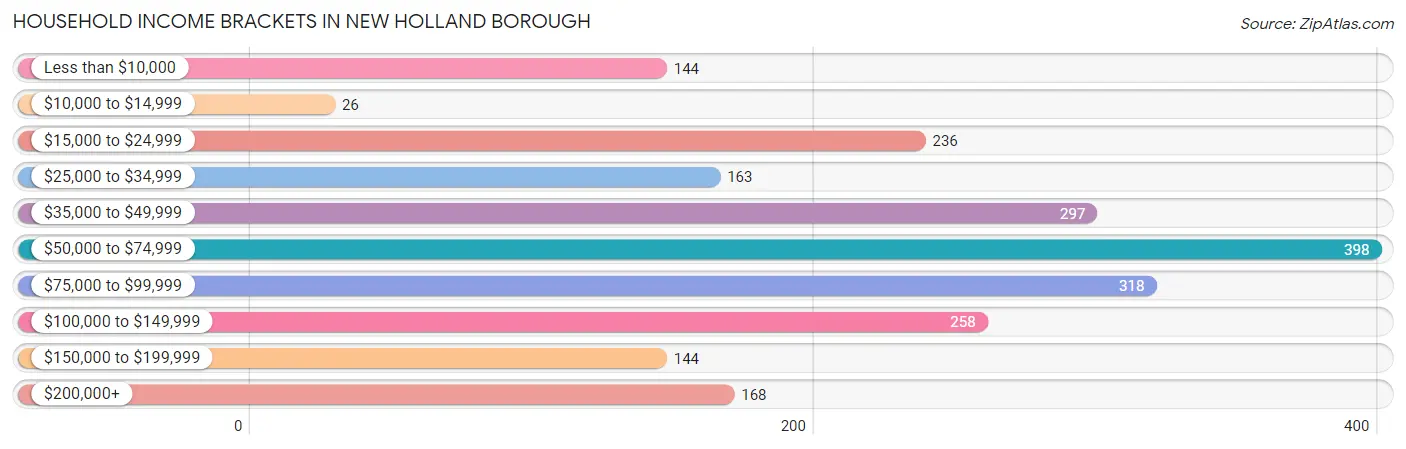
| Income Bracket | # Households | % Households |
| Less than $10,000 | 144 | 6.7% |
| $10,000 to $14,999 | 26 | 1.2% |
| $15,000 to $24,999 | 236 | 11.0% |
| $25,000 to $34,999 | 163 | 7.6% |
| $35,000 to $49,999 | 297 | 13.8% |
| $50,000 to $74,999 | 398 | 18.5% |
| $75,000 to $99,999 | 318 | 14.8% |
| $100,000 to $149,999 | 258 | 12.0% |
| $150,000 to $199,999 | 144 | 6.7% |
| $200,000+ | 168 | 7.8% |
Household Income by Householder Age in New Holland borough
The median household income in New Holland borough is $59,553, with the highest median household income of $85,417 found in the 25 to 44 years age bracket for the primary householder. A total of 551 households (25.6%) fall into this category. Meanwhile, the 15 to 24 years age bracket for the primary householder has the lowest median household income of $20,208, with 147 households (6.8%) in this group.
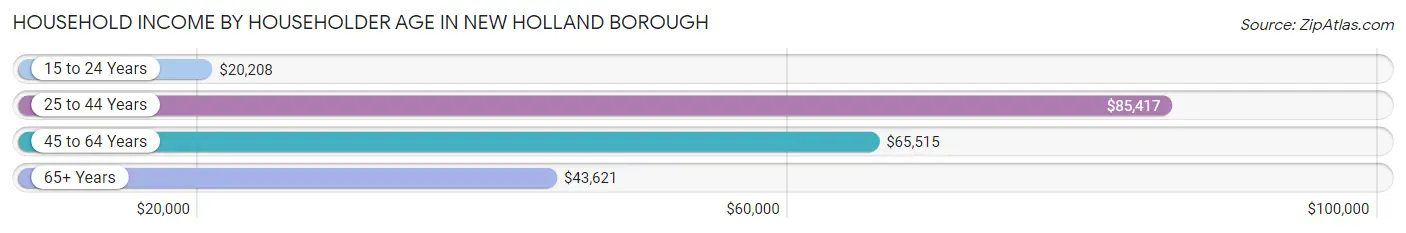
| Income Bracket | # Households | Median Income |
| 15 to 24 Years | 147 (6.8%) | $20,208 |
| 25 to 44 Years | 551 (25.6%) | $85,417 |
| 45 to 64 Years | 771 (35.9%) | $65,515 |
| 65+ Years | 680 (31.6%) | $43,621 |
| Total | 2,149 (100.0%) | $59,553 |
Poverty in New Holland borough
Income Below Poverty by Sex and Age in New Holland borough
With 6.1% poverty level for males and 5.3% for females among the residents of New Holland borough, under 5 year old males and 75 year old and over females are the most vulnerable to poverty, with 48 males (31.4%) and 60 females (17.4%) in their respective age groups living below the poverty level.
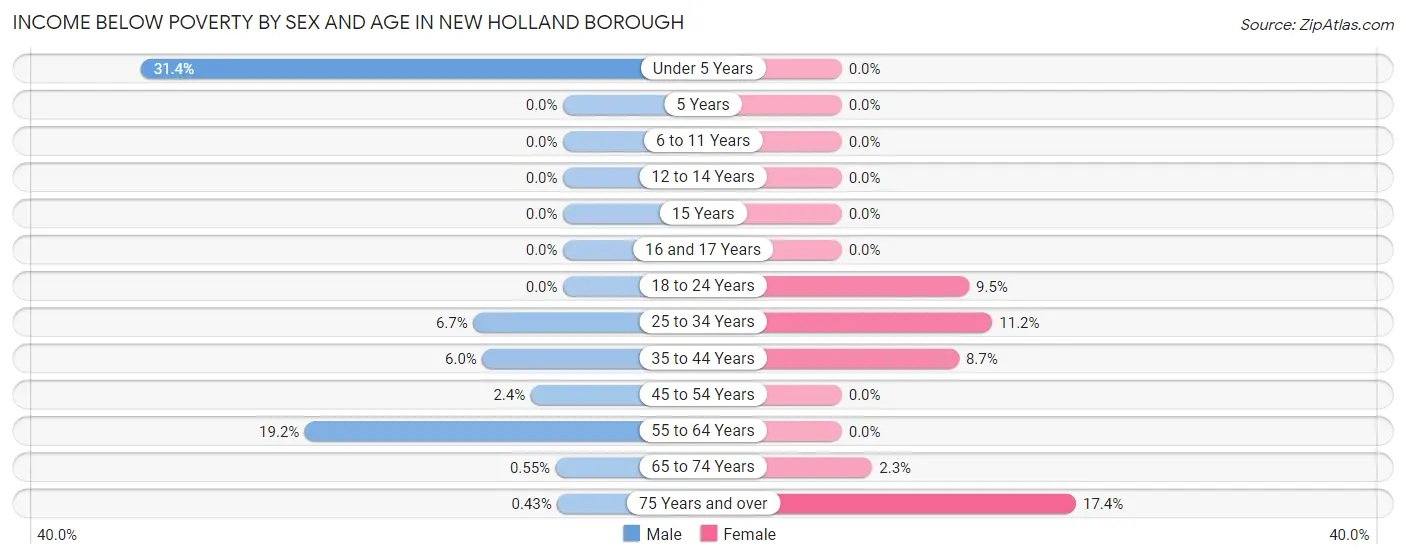
| Age Bracket | Male | Female |
| Under 5 Years | 48 (31.4%) | 0 (0.0%) |
| 5 Years | 0 (0.0%) | 0 (0.0%) |
| 6 to 11 Years | 0 (0.0%) | 0 (0.0%) |
| 12 to 14 Years | 0 (0.0%) | 0 (0.0%) |
| 15 Years | 0 (0.0%) | 0 (0.0%) |
| 16 and 17 Years | 0 (0.0%) | 0 (0.0%) |
| 18 to 24 Years | 0 (0.0%) | 19 (9.5%) |
| 25 to 34 Years | 19 (6.7%) | 19 (11.2%) |
| 35 to 44 Years | 23 (6.0%) | 32 (8.7%) |
| 45 to 54 Years | 13 (2.4%) | 0 (0.0%) |
| 55 to 64 Years | 79 (19.2%) | 0 (0.0%) |
| 65 to 74 Years | 1 (0.5%) | 9 (2.3%) |
| 75 Years and over | 1 (0.4%) | 60 (17.4%) |
| Total | 184 (6.1%) | 139 (5.3%) |
Income Above Poverty by Sex and Age in New Holland borough
According to the poverty statistics in New Holland borough, males aged 6 to 11 years and females aged under 5 years are the age groups that are most secure financially, with 100.0% of males and 100.0% of females in these age groups living above the poverty line.
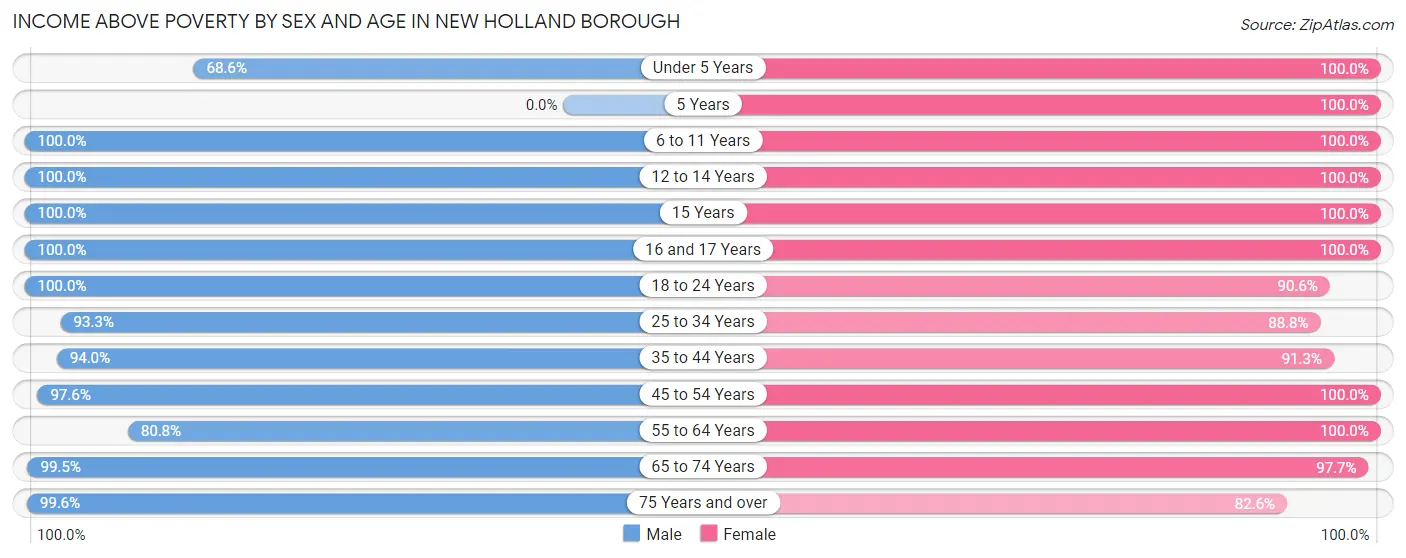
| Age Bracket | Male | Female |
| Under 5 Years | 105 (68.6%) | 136 (100.0%) |
| 5 Years | 0 (0.0%) | 17 (100.0%) |
| 6 to 11 Years | 272 (100.0%) | 152 (100.0%) |
| 12 to 14 Years | 27 (100.0%) | 125 (100.0%) |
| 15 Years | 25 (100.0%) | 53 (100.0%) |
| 16 and 17 Years | 228 (100.0%) | 61 (100.0%) |
| 18 to 24 Years | 293 (100.0%) | 182 (90.5%) |
| 25 to 34 Years | 266 (93.3%) | 151 (88.8%) |
| 35 to 44 Years | 361 (94.0%) | 336 (91.3%) |
| 45 to 54 Years | 529 (97.6%) | 256 (100.0%) |
| 55 to 64 Years | 333 (80.8%) | 345 (100.0%) |
| 65 to 74 Years | 180 (99.5%) | 387 (97.7%) |
| 75 Years and over | 229 (99.6%) | 285 (82.6%) |
| Total | 2,848 (93.9%) | 2,486 (94.7%) |
Income Below Poverty Among Married-Couple Families in New Holland borough
The poverty statistics for married-couple families in New Holland borough show that 2.5% or 29 of the total 1,164 families live below the poverty line. Families with 1 or 2 children have the highest poverty rate of 4.0%, comprising of 19 families. On the other hand, families with 3 or 4 children have the lowest poverty rate of 0.0%, which includes 0 families.
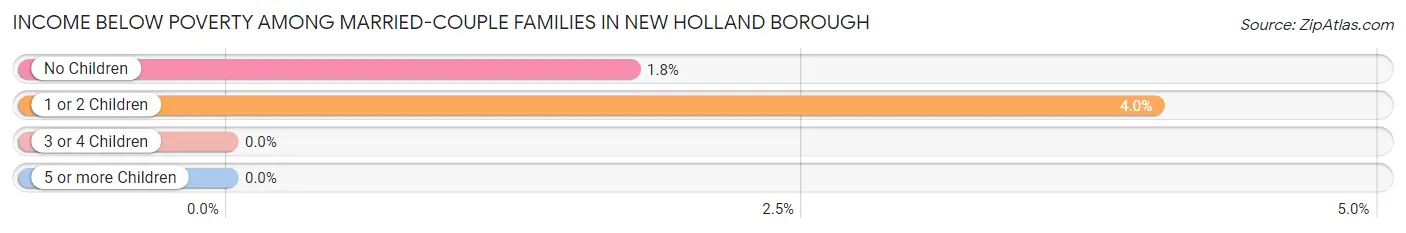
| Children | Above Poverty | Below Poverty |
| No Children | 560 (98.3%) | 10 (1.8%) |
| 1 or 2 Children | 453 (96.0%) | 19 (4.0%) |
| 3 or 4 Children | 122 (100.0%) | 0 (0.0%) |
| 5 or more Children | 0 (0.0%) | 0 (0.0%) |
| Total | 1,135 (97.5%) | 29 (2.5%) |
Income Below Poverty Among Single-Parent Households in New Holland borough
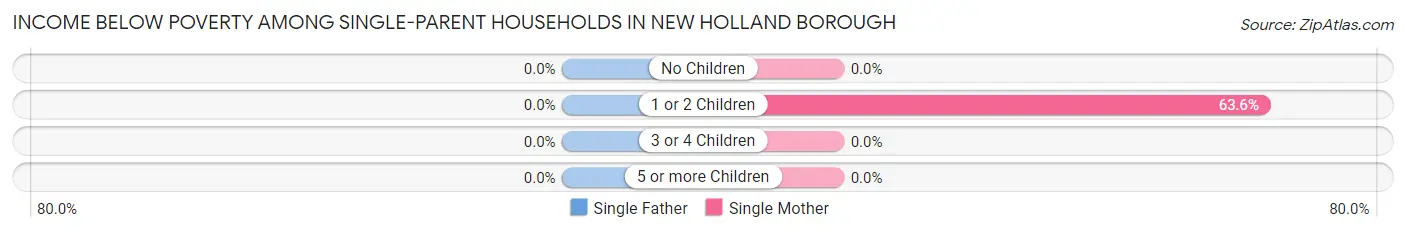
| Children | Single Father | Single Mother |
| No Children | 0 (0.0%) | 0 (0.0%) |
| 1 or 2 Children | 0 (0.0%) | 21 (63.6%) |
| 3 or 4 Children | 0 (0.0%) | 0 (0.0%) |
| 5 or more Children | 0 (0.0%) | 0 (0.0%) |
| Total | 0 (0.0%) | 21 (26.9%) |
Income Below Poverty Among Married-Couple vs Single-Parent Households in New Holland borough
The poverty data for New Holland borough shows that 29 of the married-couple family households (2.5%) and 21 of the single-parent households (17.8%) are living below the poverty level. Within the married-couple family households, those with 1 or 2 children have the highest poverty rate, with 19 households (4.0%) falling below the poverty line. Among the single-parent households, those with 1 or 2 children have the highest poverty rate, with 21 household (63.6%) living below poverty.
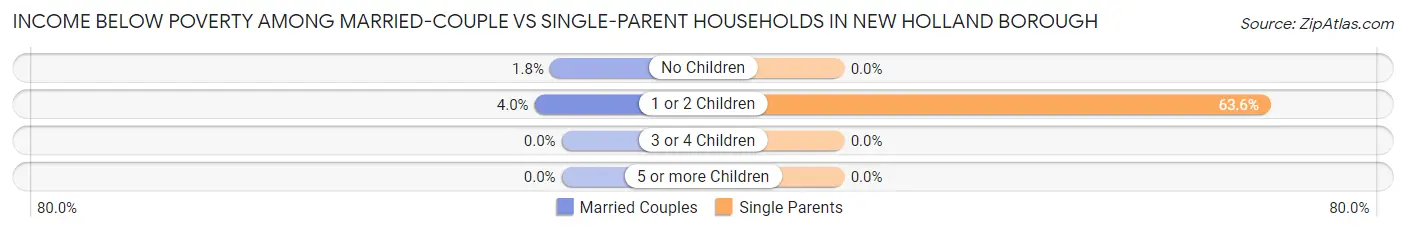
| Children | Married-Couple Families | Single-Parent Households |
| No Children | 10 (1.8%) | 0 (0.0%) |
| 1 or 2 Children | 19 (4.0%) | 21 (63.6%) |
| 3 or 4 Children | 0 (0.0%) | 0 (0.0%) |
| 5 or more Children | 0 (0.0%) | 0 (0.0%) |
| Total | 29 (2.5%) | 21 (17.8%) |
Employment Characteristics in New Holland borough
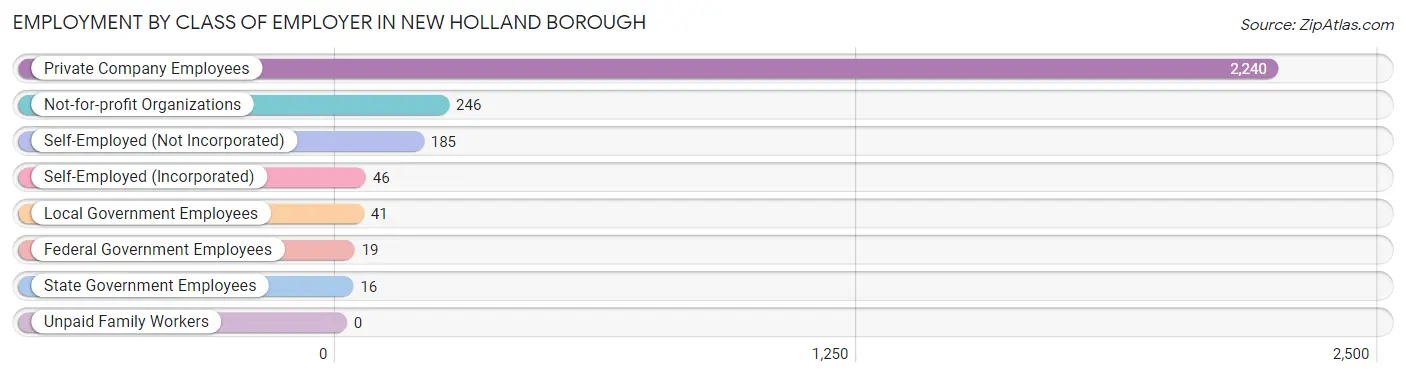
Employment by Class of Employer in New Holland borough
Among the 2,793 employed individuals in New Holland borough, private company employees (2,240 | 80.2%), not-for-profit organizations (246 | 8.8%), and self-employed (not incorporated) (185 | 6.6%) make up the most common classes of employment.
| Employer Class | # Employees | % Employees |
| Private Company Employees | 2,240 | 80.2% |
| Self-Employed (Incorporated) | 46 | 1.7% |
| Self-Employed (Not Incorporated) | 185 | 6.6% |
| Not-for-profit Organizations | 246 | 8.8% |
| Local Government Employees | 41 | 1.5% |
| State Government Employees | 16 | 0.6% |
| Federal Government Employees | 19 | 0.7% |
| Unpaid Family Workers | 0 | 0.0% |
| Total | 2,793 | 100.0% |
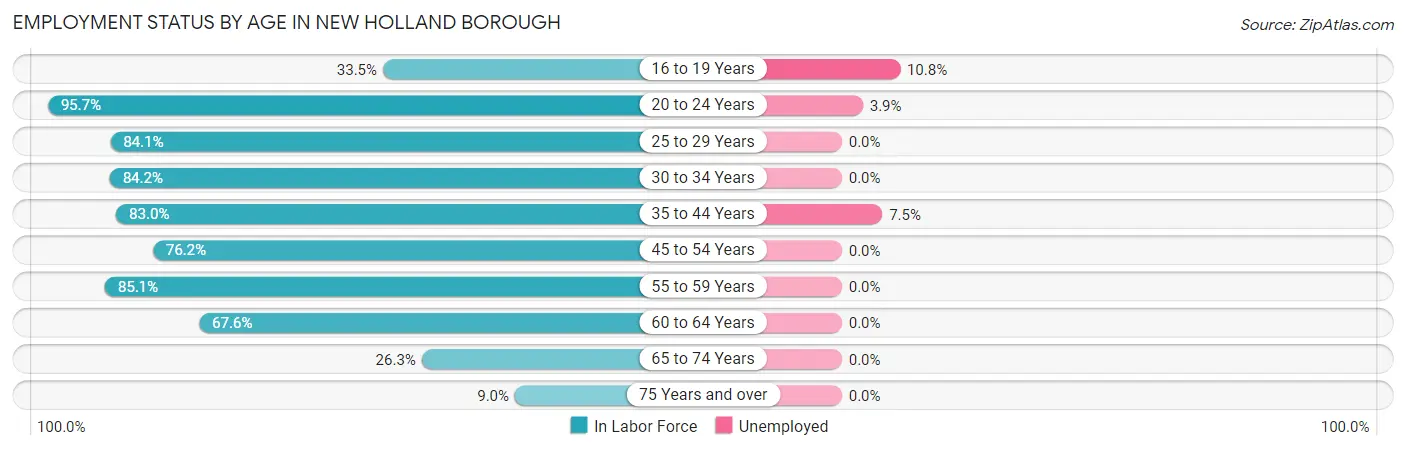
Employment Status by Age in New Holland borough
According to the labor force statistics for New Holland borough, out of the total population over 16 years of age (4,697), 61.9% or 2,907 individuals are in the labor force, with 2.6% or 76 of them unemployed. The age group with the highest labor force participation rate is 20 to 24 years, with 95.7% or 378 individuals in the labor force. Within the labor force, the 16 to 19 years age range has the highest percentage of unemployed individuals, with 10.8% or 14 of them being unemployed.
| Age Bracket | In Labor Force | Unemployed |
| 16 to 19 Years | 130 (33.5%) | 14 (10.8%) |
| 20 to 24 Years | 378 (95.7%) | 15 (3.9%) |
| 25 to 29 Years | 164 (84.1%) | 0 (0.0%) |
| 30 to 34 Years | 219 (84.2%) | 0 (0.0%) |
| 35 to 44 Years | 624 (83.0%) | 47 (7.5%) |
| 45 to 54 Years | 608 (76.2%) | 0 (0.0%) |
| 55 to 59 Years | 337 (85.1%) | 0 (0.0%) |
| 60 to 64 Years | 244 (67.6%) | 0 (0.0%) |
| 65 to 74 Years | 152 (26.3%) | 0 (0.0%) |
| 75 Years and over | 52 (9.0%) | 0 (0.0%) |
| Total | 2,907 (61.9%) | 76 (2.6%) |
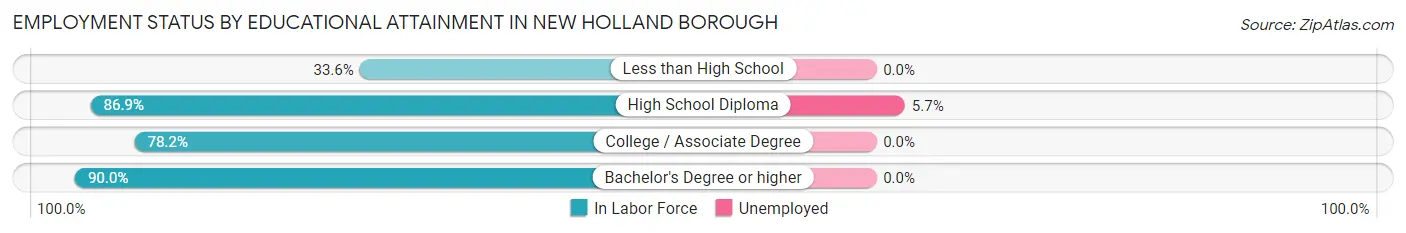
Employment Status by Educational Attainment in New Holland borough
According to labor force statistics for New Holland borough, 79.5% of individuals (2,196) out of the total population between 25 and 64 years of age (2,762) are in the labor force, with 2.1% or 46 of them being unemployed. The group with the highest labor force participation rate are those with the educational attainment of bachelor's degree or higher, with 90.0% or 564 individuals in the labor force. Within the labor force, individuals with high school diploma education have the highest percentage of unemployment, with 5.7% or 47 of them being unemployed.
| Educational Attainment | In Labor Force | Unemployed |
| Less than High School | 91 (33.6%) | 0 (0.0%) |
| High School Diploma | 831 (86.9%) | 54 (5.7%) |
| College / Associate Degree | 710 (78.2%) | 0 (0.0%) |
| Bachelor's Degree or higher | 564 (90.0%) | 0 (0.0%) |
| Total | 2,196 (79.5%) | 58 (2.1%) |
Employment Occupations by Sex in New Holland borough
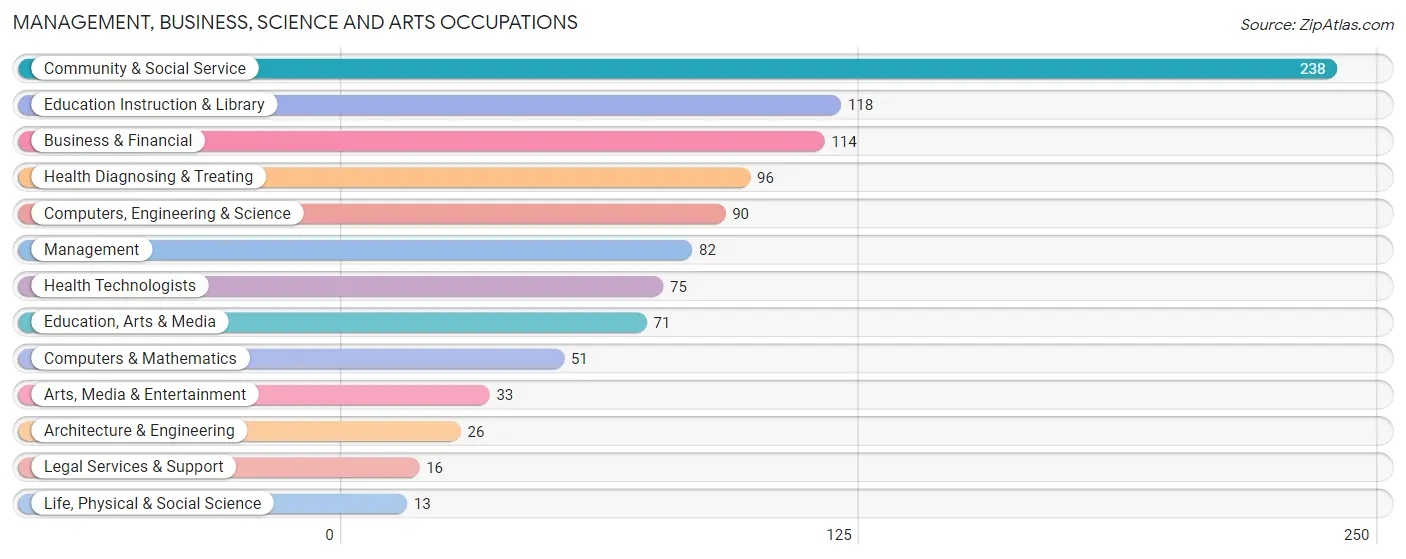
Management, Business, Science and Arts Occupations
The most common Management, Business, Science and Arts occupations in New Holland borough are Community & Social Service (238 | 8.5%), Education Instruction & Library (118 | 4.2%), Business & Financial (114 | 4.1%), Health Diagnosing & Treating (96 | 3.4%), and Computers, Engineering & Science (90 | 3.2%).
Management, Business, Science and Arts Occupations by Sex
Within the Management, Business, Science and Arts occupations in New Holland borough, the most male-oriented occupations are Computers, Engineering & Science (100.0%), Computers & Mathematics (100.0%), and Architecture & Engineering (100.0%), while the most female-oriented occupations are Legal Services & Support (100.0%), Health Diagnosing & Treating (100.0%), and Health Technologists (100.0%).
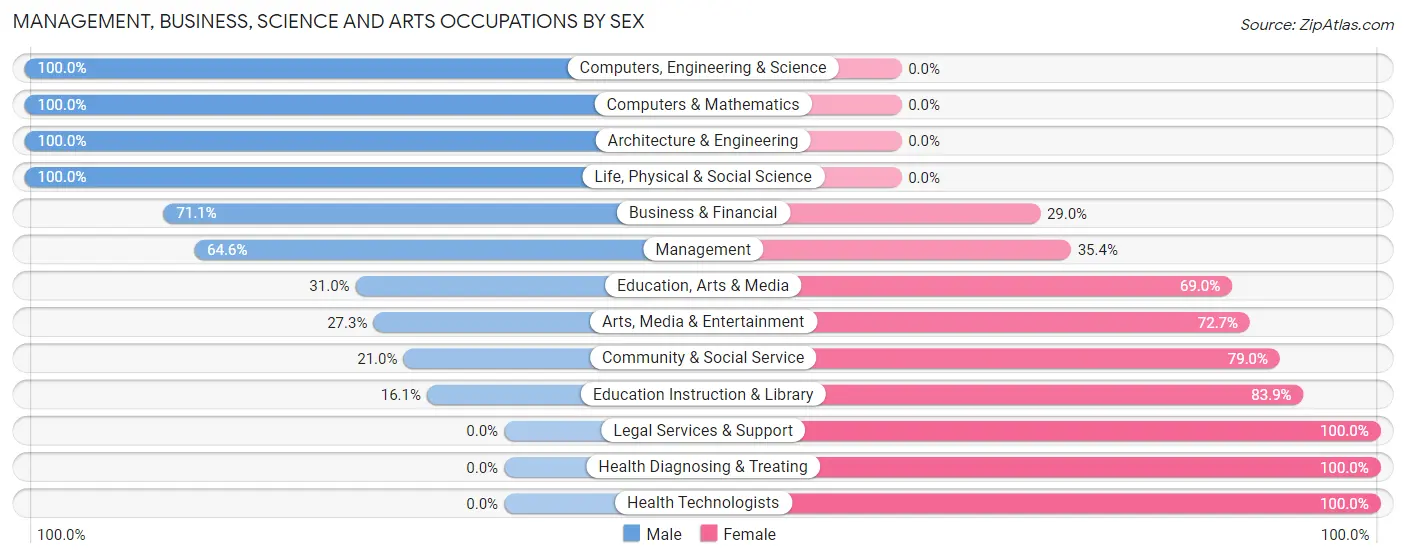
| Occupation | Male | Female |
| Management | 53 (64.6%) | 29 (35.4%) |
| Business & Financial | 81 (71.1%) | 33 (28.9%) |
| Computers, Engineering & Science | 90 (100.0%) | 0 (0.0%) |
| Computers & Mathematics | 51 (100.0%) | 0 (0.0%) |
| Architecture & Engineering | 26 (100.0%) | 0 (0.0%) |
| Life, Physical & Social Science | 13 (100.0%) | 0 (0.0%) |
| Community & Social Service | 50 (21.0%) | 188 (79.0%) |
| Education, Arts & Media | 22 (31.0%) | 49 (69.0%) |
| Legal Services & Support | 0 (0.0%) | 16 (100.0%) |
| Education Instruction & Library | 19 (16.1%) | 99 (83.9%) |
| Arts, Media & Entertainment | 9 (27.3%) | 24 (72.7%) |
| Health Diagnosing & Treating | 0 (0.0%) | 96 (100.0%) |
| Health Technologists | 0 (0.0%) | 75 (100.0%) |
| Total (Category) | 274 (44.2%) | 346 (55.8%) |
| Total (Overall) | 1,828 (65.0%) | 986 (35.0%) |
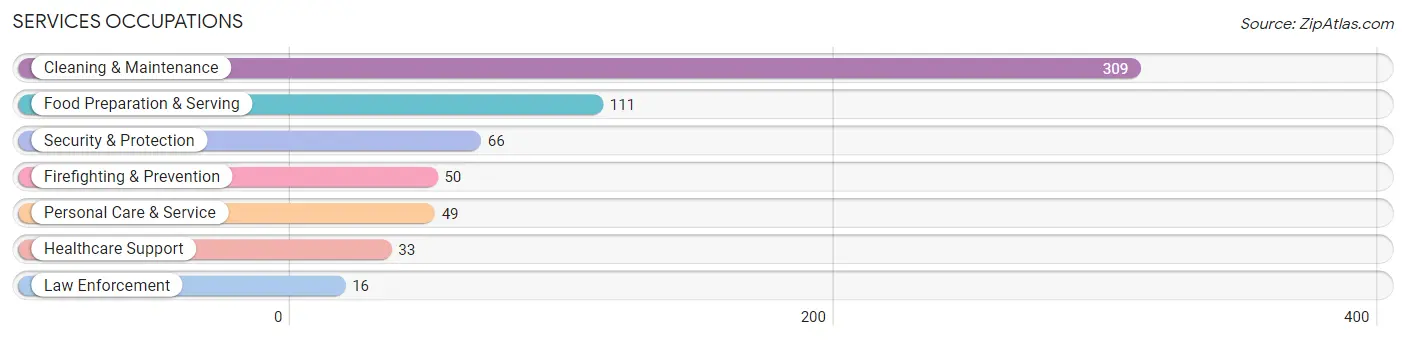
Services Occupations
The most common Services occupations in New Holland borough are Cleaning & Maintenance (309 | 11.0%), Food Preparation & Serving (111 | 3.9%), Security & Protection (66 | 2.4%), Firefighting & Prevention (50 | 1.8%), and Personal Care & Service (49 | 1.7%).
Services Occupations by Sex
Within the Services occupations in New Holland borough, the most male-oriented occupations are Cleaning & Maintenance (100.0%), Personal Care & Service (63.3%), and Food Preparation & Serving (53.1%), while the most female-oriented occupations are Healthcare Support (100.0%), Law Enforcement (100.0%), and Security & Protection (62.1%).
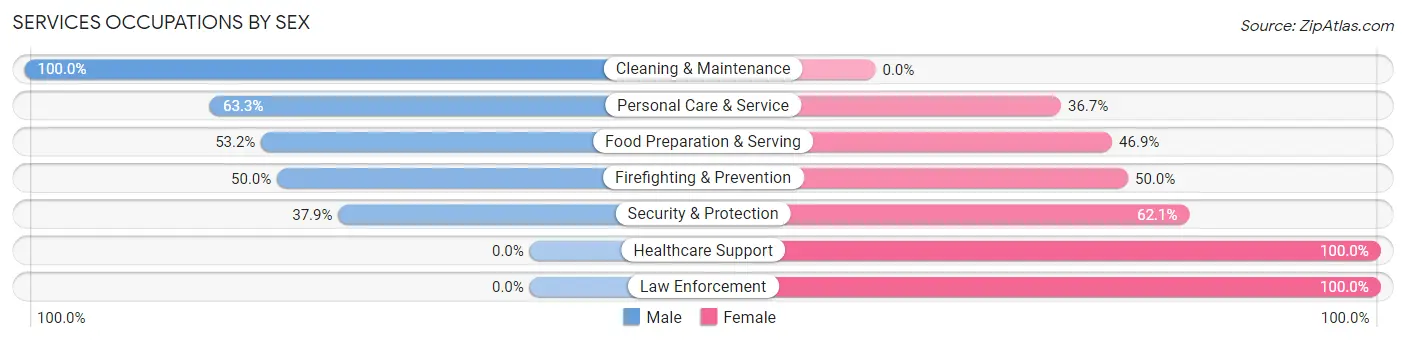
| Occupation | Male | Female |
| Healthcare Support | 0 (0.0%) | 33 (100.0%) |
| Security & Protection | 25 (37.9%) | 41 (62.1%) |
| Firefighting & Prevention | 25 (50.0%) | 25 (50.0%) |
| Law Enforcement | 0 (0.0%) | 16 (100.0%) |
| Food Preparation & Serving | 59 (53.1%) | 52 (46.9%) |
| Cleaning & Maintenance | 309 (100.0%) | 0 (0.0%) |
| Personal Care & Service | 31 (63.3%) | 18 (36.7%) |
| Total (Category) | 424 (74.7%) | 144 (25.4%) |
| Total (Overall) | 1,828 (65.0%) | 986 (35.0%) |
Sales and Office Occupations
The most common Sales and Office occupations in New Holland borough are Office & Administration (298 | 10.6%), and Sales & Related (244 | 8.7%).

Sales and Office Occupations by Sex
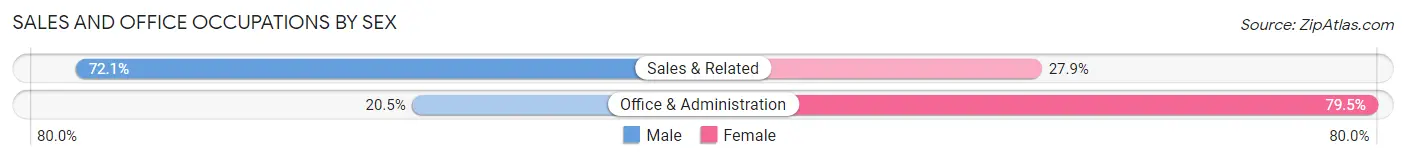
| Occupation | Male | Female |
| Sales & Related | 176 (72.1%) | 68 (27.9%) |
| Office & Administration | 61 (20.5%) | 237 (79.5%) |
| Total (Category) | 237 (43.7%) | 305 (56.3%) |
| Total (Overall) | 1,828 (65.0%) | 986 (35.0%) |
Natural Resources, Construction and Maintenance Occupations
The most common Natural Resources, Construction and Maintenance occupations in New Holland borough are Construction & Extraction (261 | 9.3%), Installation, Maintenance & Repair (107 | 3.8%), and Farming, Fishing & Forestry (29 | 1.0%).

Natural Resources, Construction and Maintenance Occupations by Sex

| Occupation | Male | Female |
| Farming, Fishing & Forestry | 16 (55.2%) | 13 (44.8%) |
| Construction & Extraction | 261 (100.0%) | 0 (0.0%) |
| Installation, Maintenance & Repair | 107 (100.0%) | 0 (0.0%) |
| Total (Category) | 384 (96.7%) | 13 (3.3%) |
| Total (Overall) | 1,828 (65.0%) | 986 (35.0%) |
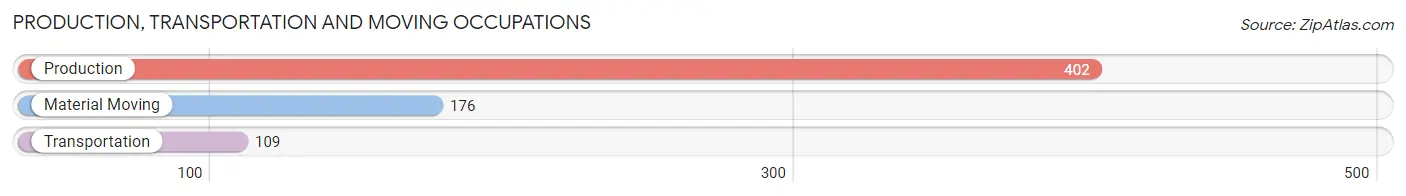
Production, Transportation and Moving Occupations
The most common Production, Transportation and Moving occupations in New Holland borough are Production (402 | 14.3%), Material Moving (176 | 6.2%), and Transportation (109 | 3.9%).
Production, Transportation and Moving Occupations by Sex
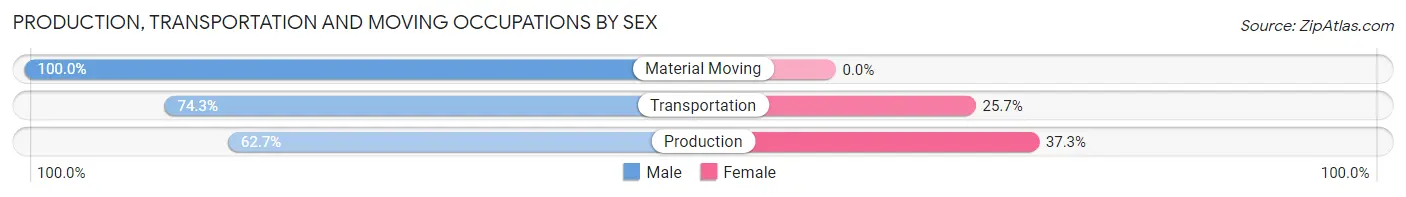
| Occupation | Male | Female |
| Production | 252 (62.7%) | 150 (37.3%) |
| Transportation | 81 (74.3%) | 28 (25.7%) |
| Material Moving | 176 (100.0%) | 0 (0.0%) |
| Total (Category) | 509 (74.1%) | 178 (25.9%) |
| Total (Overall) | 1,828 (65.0%) | 986 (35.0%) |
Employment Industries by Sex in New Holland borough
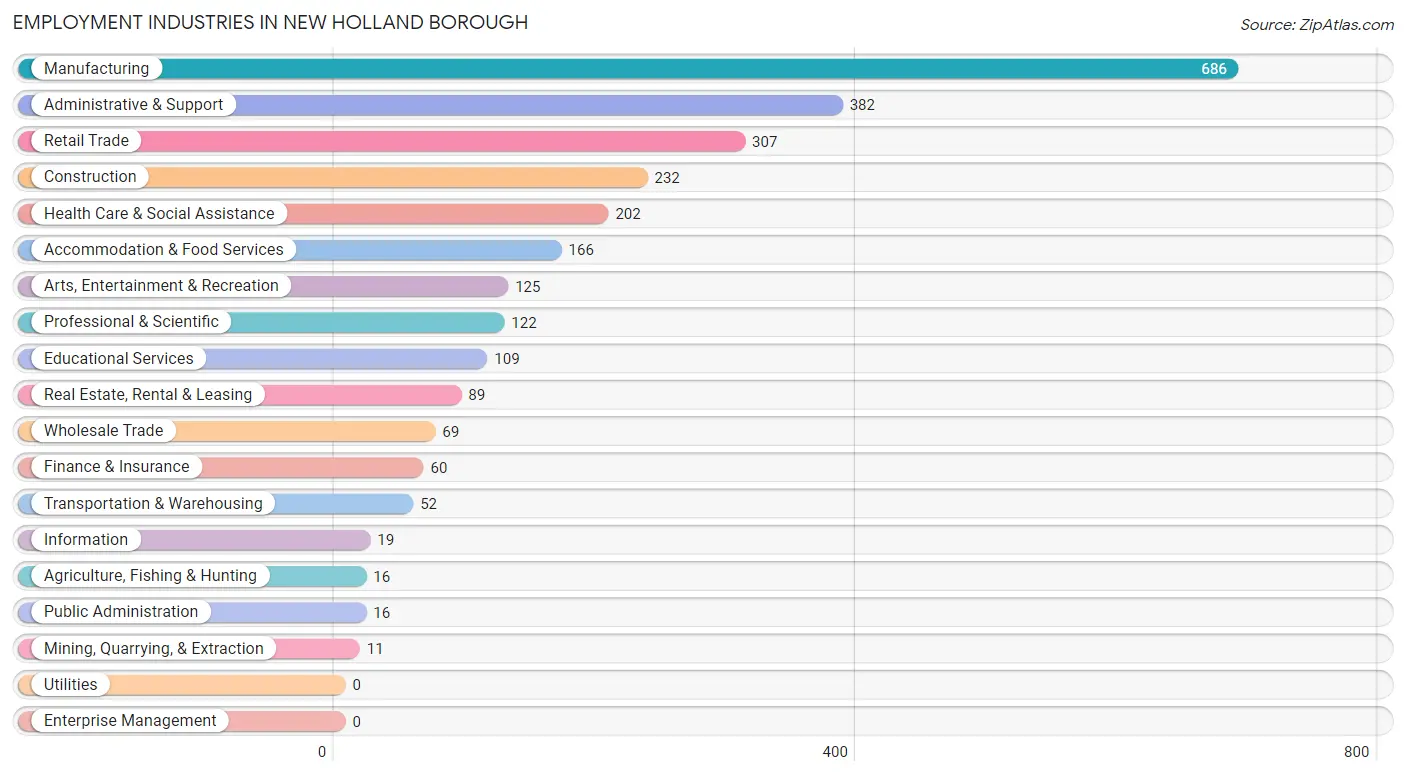
Employment Industries in New Holland borough
The major employment industries in New Holland borough include Manufacturing (686 | 24.4%), Administrative & Support (382 | 13.6%), Retail Trade (307 | 10.9%), Construction (232 | 8.2%), and Health Care & Social Assistance (202 | 7.2%).
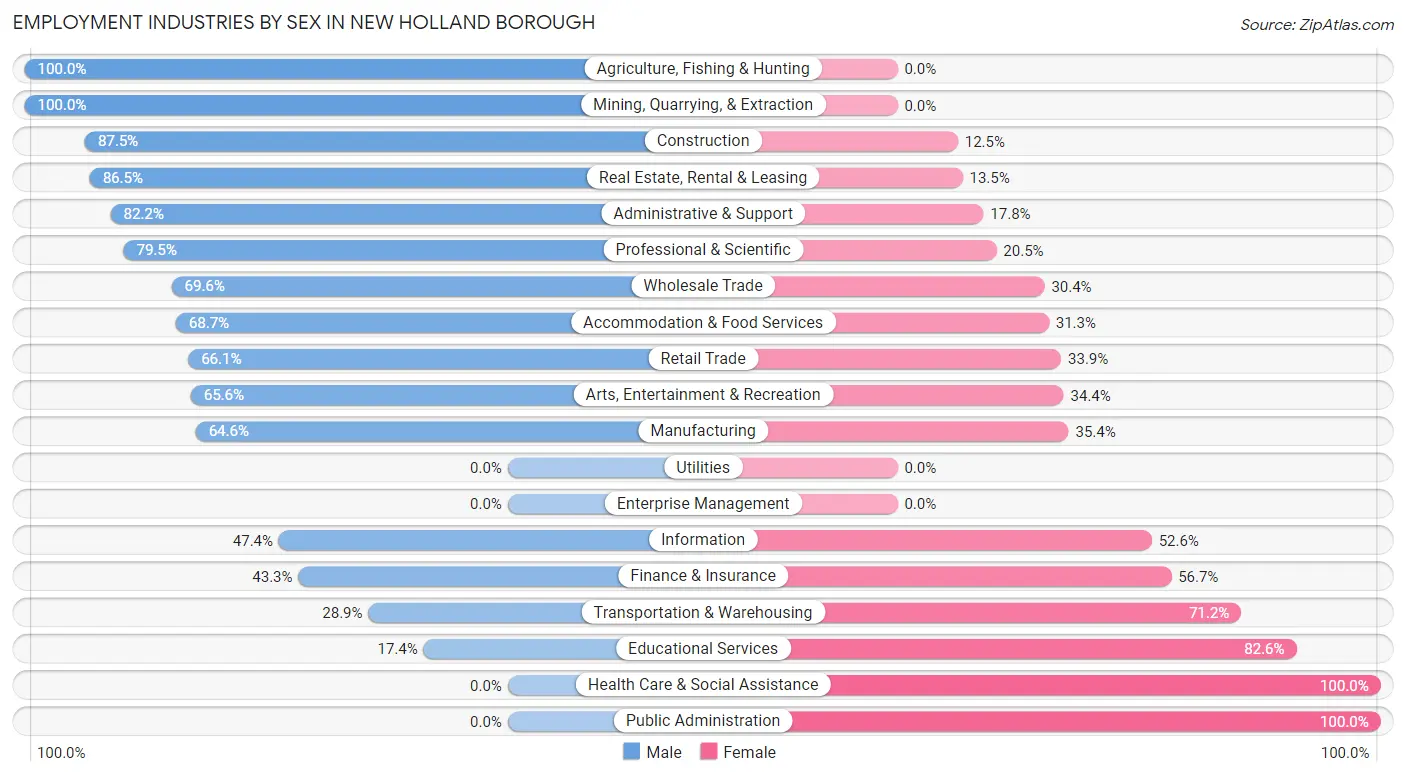
Employment Industries by Sex in New Holland borough
The New Holland borough industries that see more men than women are Agriculture, Fishing & Hunting (100.0%), Mining, Quarrying, & Extraction (100.0%), and Construction (87.5%), whereas the industries that tend to have a higher number of women are Health Care & Social Assistance (100.0%), Public Administration (100.0%), and Educational Services (82.6%).
| Industry | Male | Female |
| Agriculture, Fishing & Hunting | 16 (100.0%) | 0 (0.0%) |
| Mining, Quarrying, & Extraction | 11 (100.0%) | 0 (0.0%) |
| Construction | 203 (87.5%) | 29 (12.5%) |
| Manufacturing | 443 (64.6%) | 243 (35.4%) |
| Wholesale Trade | 48 (69.6%) | 21 (30.4%) |
| Retail Trade | 203 (66.1%) | 104 (33.9%) |
| Transportation & Warehousing | 15 (28.8%) | 37 (71.2%) |
| Utilities | 0 (0.0%) | 0 (0.0%) |
| Information | 9 (47.4%) | 10 (52.6%) |
| Finance & Insurance | 26 (43.3%) | 34 (56.7%) |
| Real Estate, Rental & Leasing | 77 (86.5%) | 12 (13.5%) |
| Professional & Scientific | 97 (79.5%) | 25 (20.5%) |
| Enterprise Management | 0 (0.0%) | 0 (0.0%) |
| Administrative & Support | 314 (82.2%) | 68 (17.8%) |
| Educational Services | 19 (17.4%) | 90 (82.6%) |
| Health Care & Social Assistance | 0 (0.0%) | 202 (100.0%) |
| Arts, Entertainment & Recreation | 82 (65.6%) | 43 (34.4%) |
| Accommodation & Food Services | 114 (68.7%) | 52 (31.3%) |
| Public Administration | 0 (0.0%) | 16 (100.0%) |
| Total | 1,828 (65.0%) | 986 (35.0%) |
Education in New Holland borough
School Enrollment in New Holland borough
The most common levels of schooling among the 1,195 students in New Holland borough are high school (467 | 39.1%), middle school (344 | 28.8%), and elementary school (206 | 17.2%).
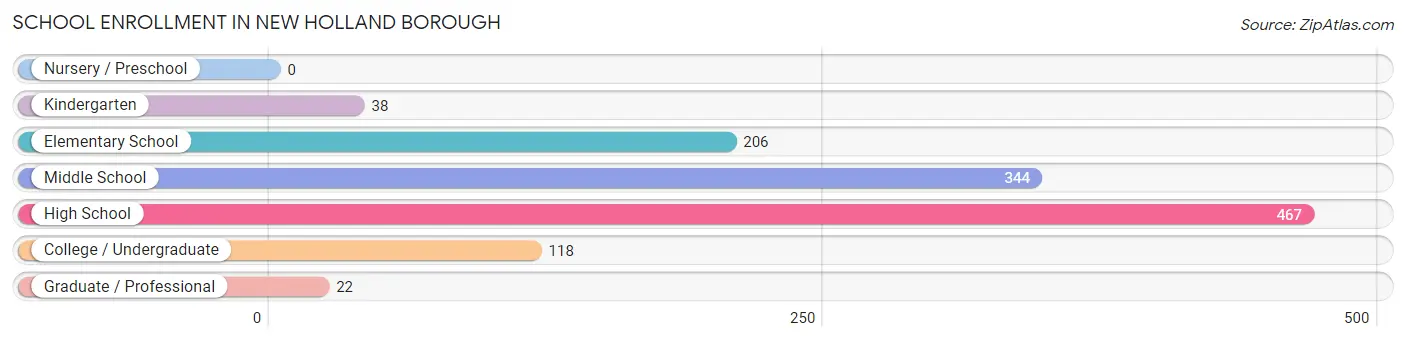
| School Level | # Students | % Students |
| Nursery / Preschool | 0 | 0.0% |
| Kindergarten | 38 | 3.2% |
| Elementary School | 206 | 17.2% |
| Middle School | 344 | 28.8% |
| High School | 467 | 39.1% |
| College / Undergraduate | 118 | 9.9% |
| Graduate / Professional | 22 | 1.8% |
| Total | 1,195 | 100.0% |
School Enrollment by Age by Funding Source in New Holland borough
Out of a total of 1,195 students who are enrolled in schools in New Holland borough, 295 (24.7%) attend a private institution, while the remaining 900 (75.3%) are enrolled in public schools. The age group of 35 years and over has the highest likelihood of being enrolled in private schools, with 22 (100.0% in the age bracket) enrolled. Conversely, the age group of 3 to 4 year olds has the lowest likelihood of being enrolled in a private school, with 21 (100.0% in the age bracket) attending a public institution.
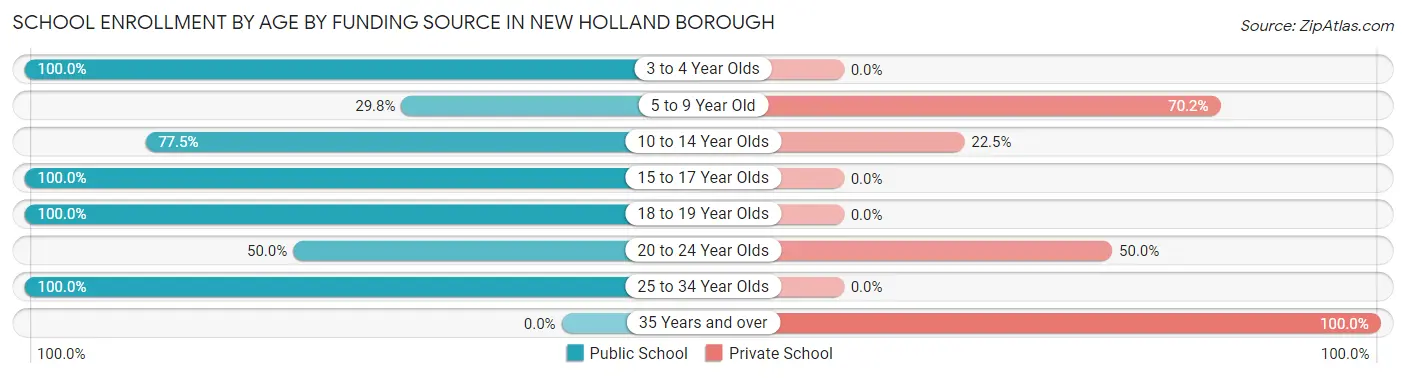
| Age Bracket | Public School | Private School |
| 3 to 4 Year Olds | 21 (100.0%) | 0 (0.0%) |
| 5 to 9 Year Old | 57 (29.8%) | 134 (70.2%) |
| 10 to 14 Year Olds | 307 (77.5%) | 89 (22.5%) |
| 15 to 17 Year Olds | 367 (100.0%) | 0 (0.0%) |
| 18 to 19 Year Olds | 17 (100.0%) | 0 (0.0%) |
| 20 to 24 Year Olds | 50 (50.0%) | 50 (50.0%) |
| 25 to 34 Year Olds | 81 (100.0%) | 0 (0.0%) |
| 35 Years and over | 0 (0.0%) | 22 (100.0%) |
| Total | 900 (75.3%) | 295 (24.7%) |
Educational Attainment by Field of Study in New Holland borough
Business (261 | 28.2%), education (179 | 19.3%), science & technology (88 | 9.5%), arts & humanities (86 | 9.3%), and engineering (71 | 7.7%) are the most common fields of study among 927 individuals in New Holland borough who have obtained a bachelor's degree or higher.
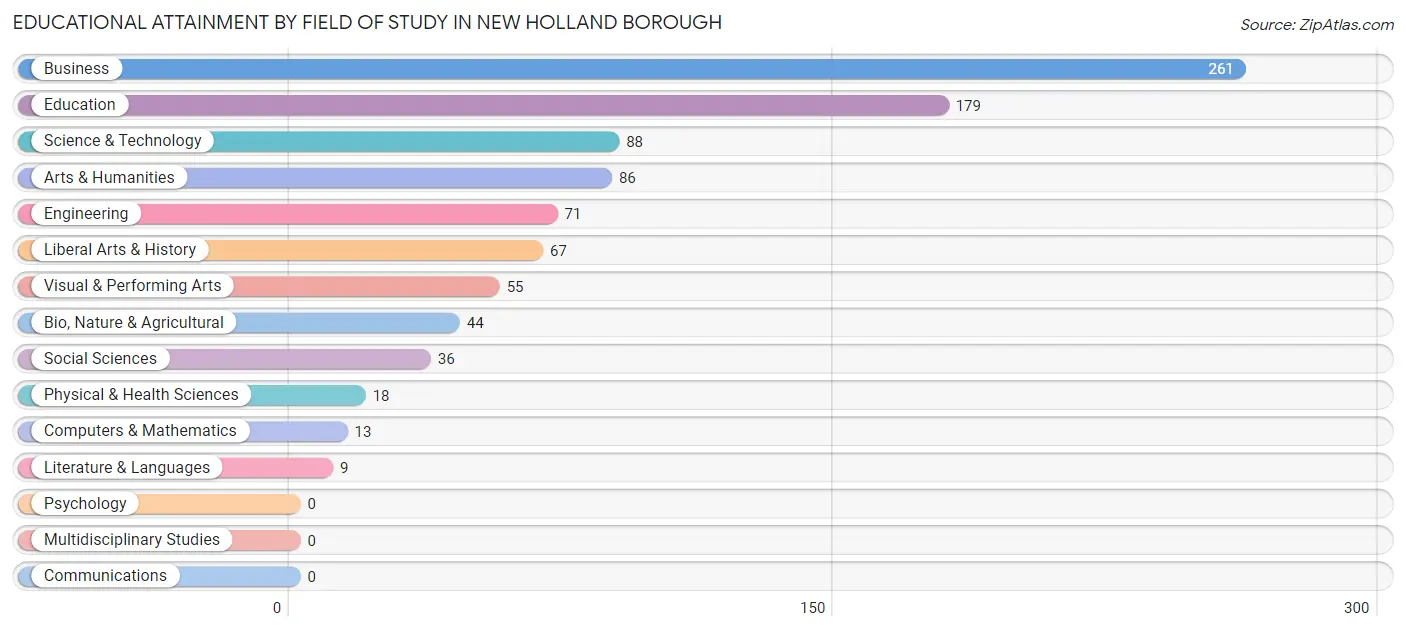
| Field of Study | # Graduates | % Graduates |
| Computers & Mathematics | 13 | 1.4% |
| Bio, Nature & Agricultural | 44 | 4.8% |
| Physical & Health Sciences | 18 | 1.9% |
| Psychology | 0 | 0.0% |
| Social Sciences | 36 | 3.9% |
| Engineering | 71 | 7.7% |
| Multidisciplinary Studies | 0 | 0.0% |
| Science & Technology | 88 | 9.5% |
| Business | 261 | 28.2% |
| Education | 179 | 19.3% |
| Literature & Languages | 9 | 1.0% |
| Liberal Arts & History | 67 | 7.2% |
| Visual & Performing Arts | 55 | 5.9% |
| Communications | 0 | 0.0% |
| Arts & Humanities | 86 | 9.3% |
| Total | 927 | 100.0% |
Transportation & Commute in New Holland borough
Vehicle Availability by Sex in New Holland borough
The most prevalent vehicle ownership categories in New Holland borough are males with 2 vehicles (704, accounting for 38.7%) and females with 2 vehicles (236, making up 72.3%).
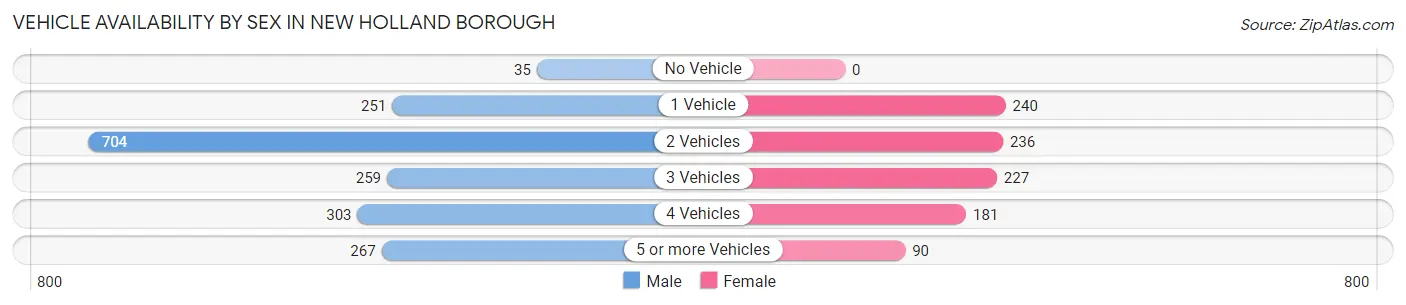
| Vehicles Available | Male | Female |
| No Vehicle | 35 (1.9%) | 0 (0.0%) |
| 1 Vehicle | 251 (13.8%) | 240 (24.6%) |
| 2 Vehicles | 704 (38.7%) | 236 (24.2%) |
| 3 Vehicles | 259 (14.2%) | 227 (23.3%) |
| 4 Vehicles | 303 (16.7%) | 181 (18.6%) |
| 5 or more Vehicles | 267 (14.7%) | 90 (9.2%) |
| Total | 1,819 (100.0%) | 974 (100.0%) |
Commute Time in New Holland borough
The most frequently occuring commute durations in New Holland borough are 10 to 14 minutes (582 commuters, 21.8%), 30 to 34 minutes (356 commuters, 13.4%), and 5 to 9 minutes (326 commuters, 12.2%).
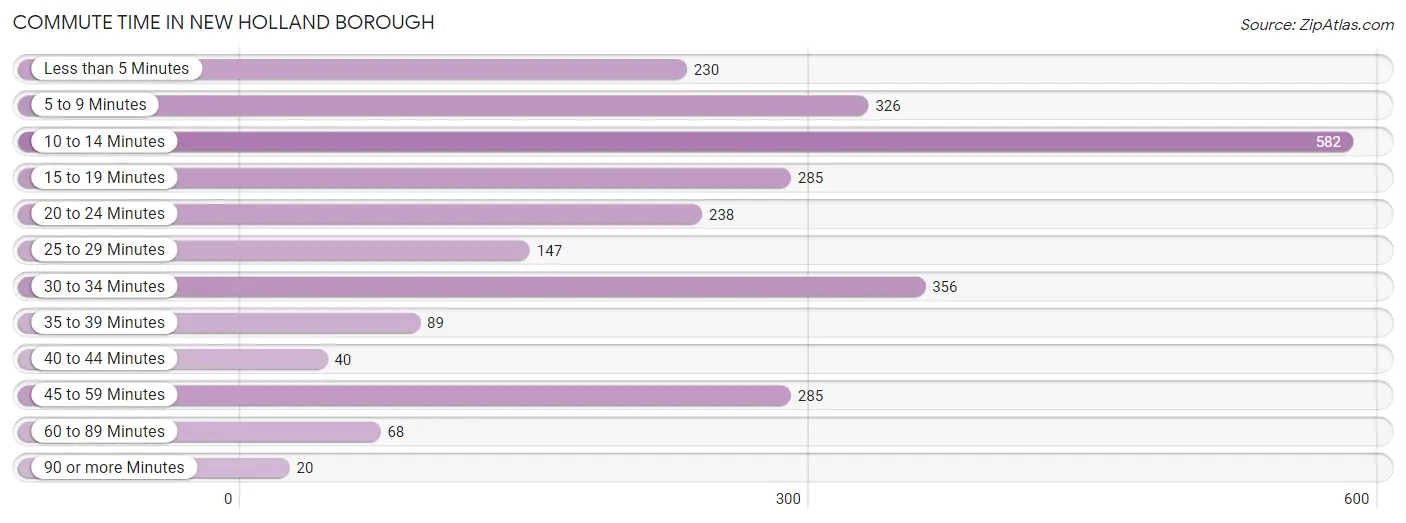
| Commute Time | # Commuters | % Commuters |
| Less than 5 Minutes | 230 | 8.6% |
| 5 to 9 Minutes | 326 | 12.2% |
| 10 to 14 Minutes | 582 | 21.8% |
| 15 to 19 Minutes | 285 | 10.7% |
| 20 to 24 Minutes | 238 | 8.9% |
| 25 to 29 Minutes | 147 | 5.5% |
| 30 to 34 Minutes | 356 | 13.4% |
| 35 to 39 Minutes | 89 | 3.3% |
| 40 to 44 Minutes | 40 | 1.5% |
| 45 to 59 Minutes | 285 | 10.7% |
| 60 to 89 Minutes | 68 | 2.5% |
| 90 or more Minutes | 20 | 0.7% |
Commute Time by Sex in New Holland borough
The most common commute times in New Holland borough are 10 to 14 minutes (402 commuters, 23.2%) for males and 10 to 14 minutes (180 commuters, 19.4%) for females.
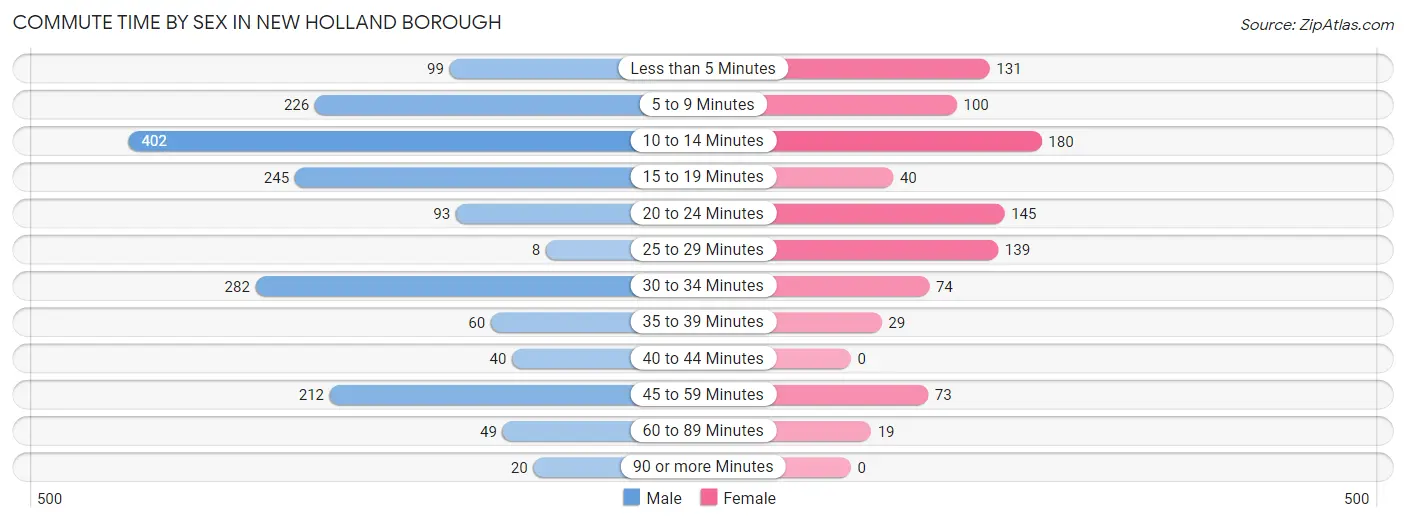
| Commute Time | Male | Female |
| Less than 5 Minutes | 99 (5.7%) | 131 (14.1%) |
| 5 to 9 Minutes | 226 (13.0%) | 100 (10.7%) |
| 10 to 14 Minutes | 402 (23.2%) | 180 (19.4%) |
| 15 to 19 Minutes | 245 (14.1%) | 40 (4.3%) |
| 20 to 24 Minutes | 93 (5.4%) | 145 (15.6%) |
| 25 to 29 Minutes | 8 (0.5%) | 139 (14.9%) |
| 30 to 34 Minutes | 282 (16.2%) | 74 (8.0%) |
| 35 to 39 Minutes | 60 (3.5%) | 29 (3.1%) |
| 40 to 44 Minutes | 40 (2.3%) | 0 (0.0%) |
| 45 to 59 Minutes | 212 (12.2%) | 73 (7.9%) |
| 60 to 89 Minutes | 49 (2.8%) | 19 (2.0%) |
| 90 or more Minutes | 20 (1.1%) | 0 (0.0%) |
Time of Departure to Work by Sex in New Holland borough
The most frequent times of departure to work in New Holland borough are 7:00 AM to 7:29 AM (437, 25.2%) for males and 7:00 AM to 7:29 AM (142, 15.3%) for females.
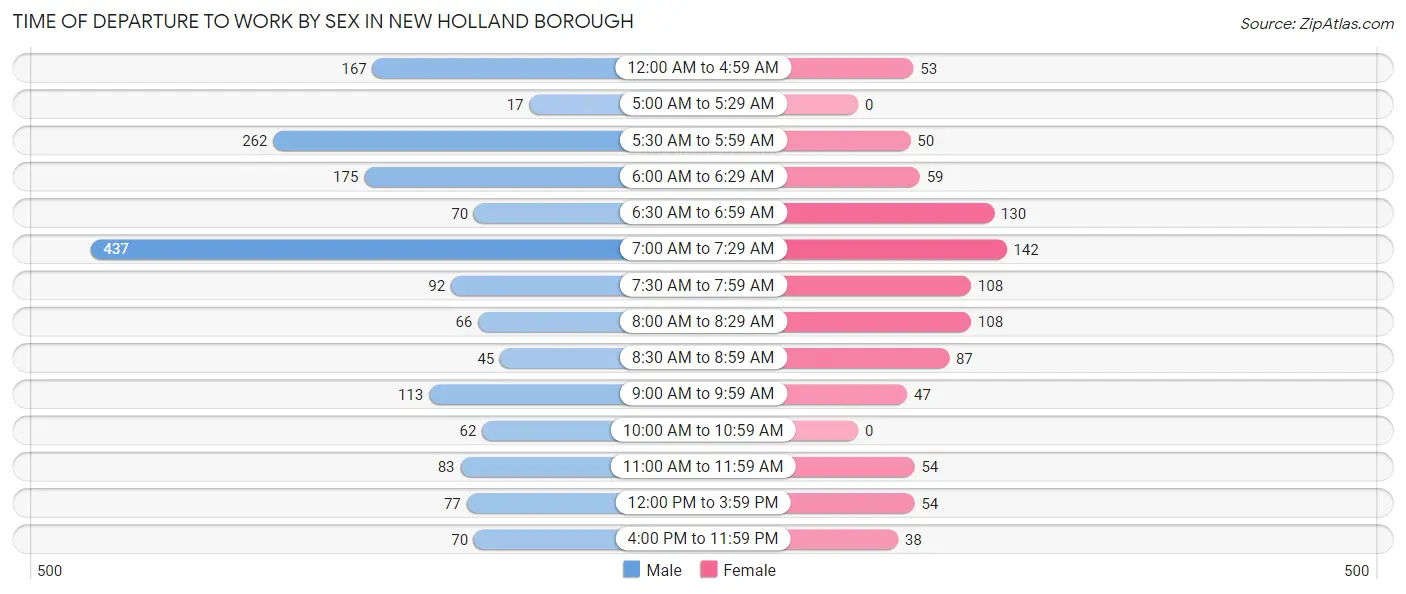
| Time of Departure | Male | Female |
| 12:00 AM to 4:59 AM | 167 (9.6%) | 53 (5.7%) |
| 5:00 AM to 5:29 AM | 17 (1.0%) | 0 (0.0%) |
| 5:30 AM to 5:59 AM | 262 (15.1%) | 50 (5.4%) |
| 6:00 AM to 6:29 AM | 175 (10.1%) | 59 (6.3%) |
| 6:30 AM to 6:59 AM | 70 (4.0%) | 130 (14.0%) |
| 7:00 AM to 7:29 AM | 437 (25.2%) | 142 (15.3%) |
| 7:30 AM to 7:59 AM | 92 (5.3%) | 108 (11.6%) |
| 8:00 AM to 8:29 AM | 66 (3.8%) | 108 (11.6%) |
| 8:30 AM to 8:59 AM | 45 (2.6%) | 87 (9.3%) |
| 9:00 AM to 9:59 AM | 113 (6.5%) | 47 (5.1%) |
| 10:00 AM to 10:59 AM | 62 (3.6%) | 0 (0.0%) |
| 11:00 AM to 11:59 AM | 83 (4.8%) | 54 (5.8%) |
| 12:00 PM to 3:59 PM | 77 (4.4%) | 54 (5.8%) |
| 4:00 PM to 11:59 PM | 70 (4.0%) | 38 (4.1%) |
| Total | 1,736 (100.0%) | 930 (100.0%) |
Housing Occupancy in New Holland borough
Occupancy by Ownership in New Holland borough
Of the total 2,149 dwellings in New Holland borough, owner-occupied units account for 1,520 (70.7%), while renter-occupied units make up 629 (29.3%).
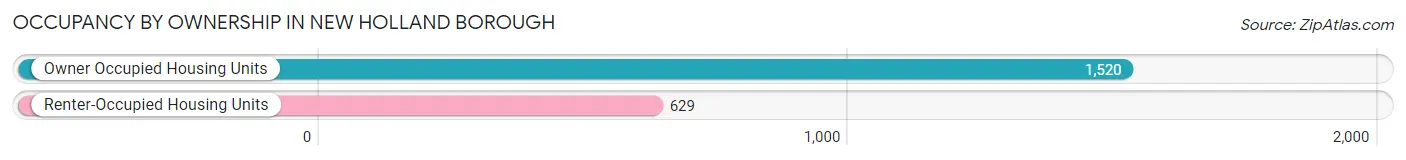
| Occupancy | # Housing Units | % Housing Units |
| Owner Occupied Housing Units | 1,520 | 70.7% |
| Renter-Occupied Housing Units | 629 | 29.3% |
| Total Occupied Housing Units | 2,149 | 100.0% |
Occupancy by Household Size in New Holland borough
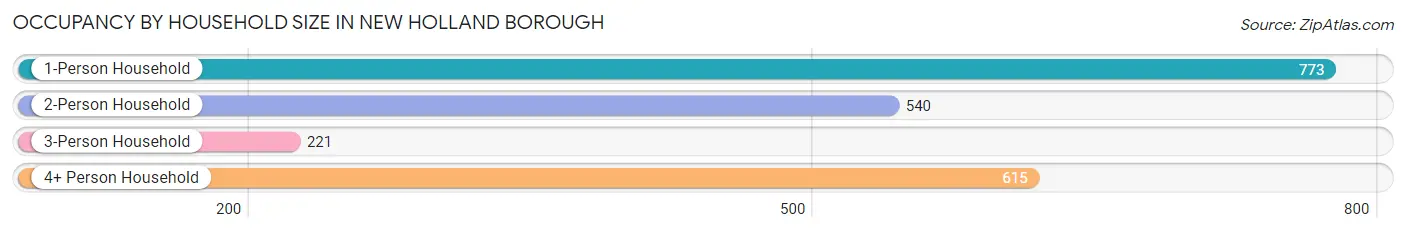
| Household Size | # Housing Units | % Housing Units |
| 1-Person Household | 773 | 36.0% |
| 2-Person Household | 540 | 25.1% |
| 3-Person Household | 221 | 10.3% |
| 4+ Person Household | 615 | 28.6% |
| Total Housing Units | 2,149 | 100.0% |
Occupancy by Ownership by Household Size in New Holland borough
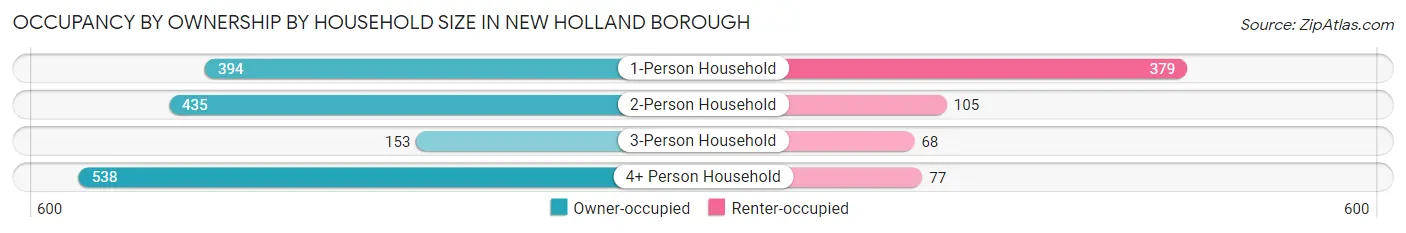
| Household Size | Owner-occupied | Renter-occupied |
| 1-Person Household | 394 (51.0%) | 379 (49.0%) |
| 2-Person Household | 435 (80.6%) | 105 (19.4%) |
| 3-Person Household | 153 (69.2%) | 68 (30.8%) |
| 4+ Person Household | 538 (87.5%) | 77 (12.5%) |
| Total Housing Units | 1,520 (70.7%) | 629 (29.3%) |
Occupancy by Educational Attainment in New Holland borough
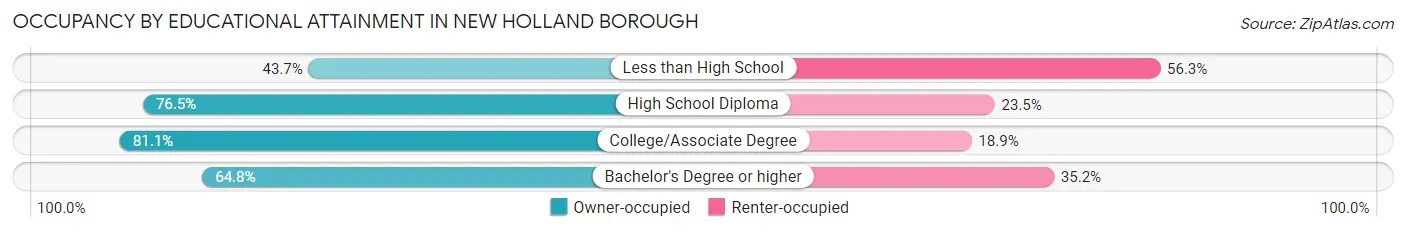
| Household Size | Owner-occupied | Renter-occupied |
| Less than High School | 111 (43.7%) | 143 (56.3%) |
| High School Diploma | 564 (76.5%) | 173 (23.5%) |
| College/Associate Degree | 472 (81.1%) | 110 (18.9%) |
| Bachelor's Degree or higher | 373 (64.8%) | 203 (35.2%) |
Occupancy by Age of Householder in New Holland borough
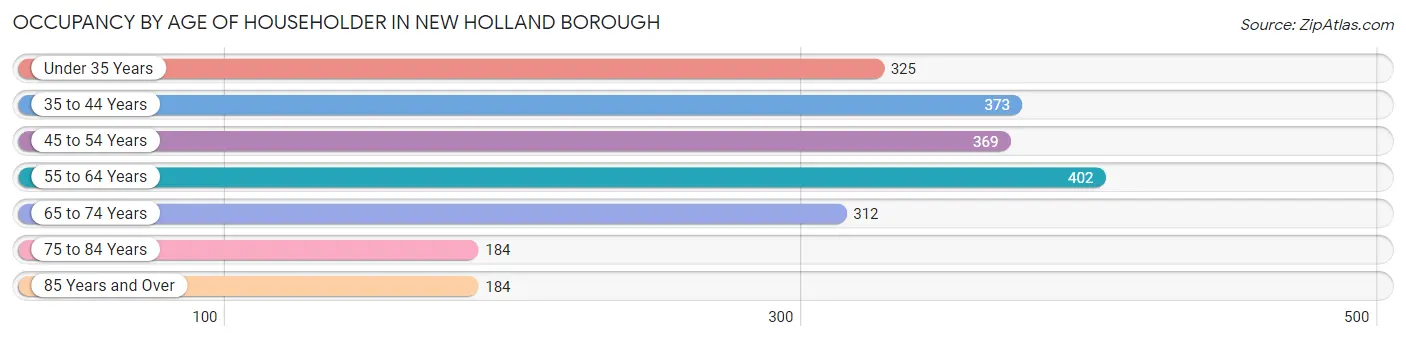
| Age Bracket | # Households | % Households |
| Under 35 Years | 325 | 15.1% |
| 35 to 44 Years | 373 | 17.4% |
| 45 to 54 Years | 369 | 17.2% |
| 55 to 64 Years | 402 | 18.7% |
| 65 to 74 Years | 312 | 14.5% |
| 75 to 84 Years | 184 | 8.6% |
| 85 Years and Over | 184 | 8.6% |
| Total | 2,149 | 100.0% |
Housing Finances in New Holland borough
Median Income by Occupancy in New Holland borough
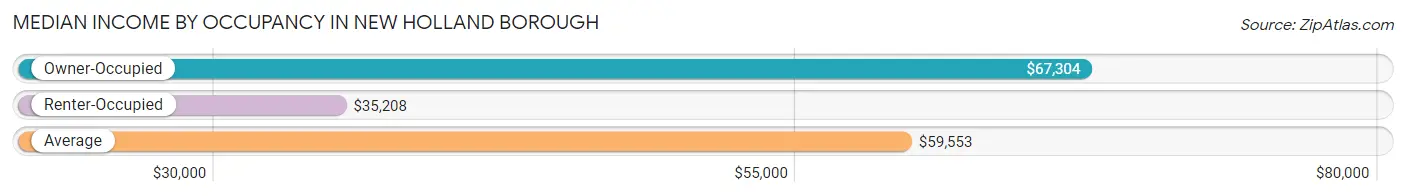
| Occupancy Type | # Households | Median Income |
| Owner-Occupied | 1,520 (70.7%) | $67,304 |
| Renter-Occupied | 629 (29.3%) | $35,208 |
| Average | 2,149 (100.0%) | $59,553 |
Occupancy by Householder Income Bracket in New Holland borough
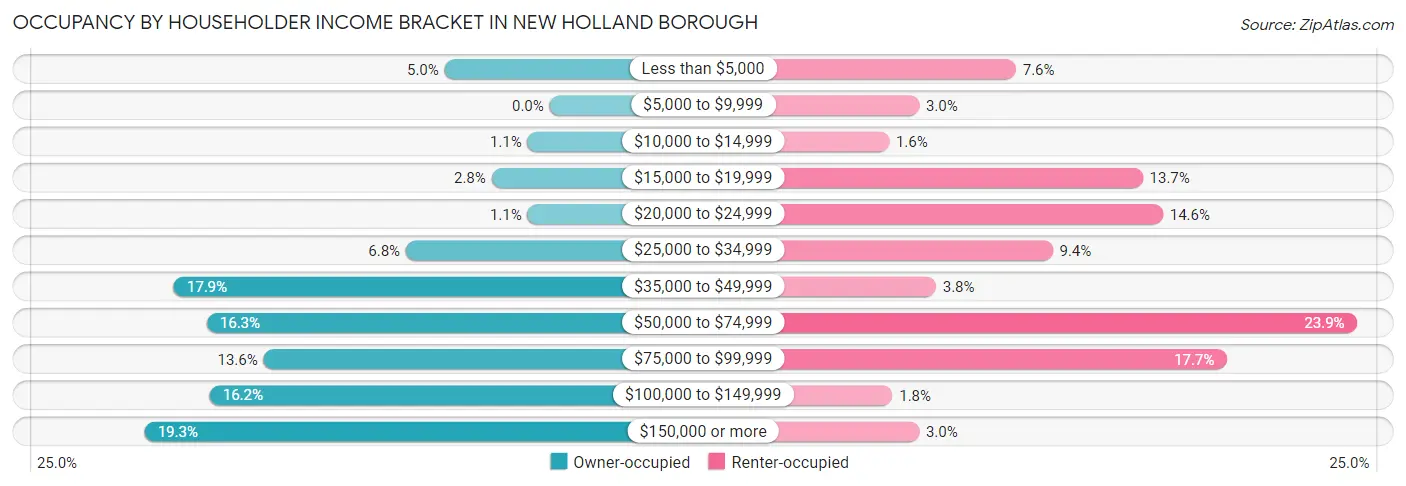
| Income Bracket | Owner-occupied | Renter-occupied |
| Less than $5,000 | 76 (5.0%) | 48 (7.6%) |
| $5,000 to $9,999 | 0 (0.0%) | 19 (3.0%) |
| $10,000 to $14,999 | 16 (1.1%) | 10 (1.6%) |
| $15,000 to $19,999 | 42 (2.8%) | 86 (13.7%) |
| $20,000 to $24,999 | 16 (1.1%) | 92 (14.6%) |
| $25,000 to $34,999 | 104 (6.8%) | 59 (9.4%) |
| $35,000 to $49,999 | 272 (17.9%) | 24 (3.8%) |
| $50,000 to $74,999 | 248 (16.3%) | 150 (23.8%) |
| $75,000 to $99,999 | 207 (13.6%) | 111 (17.6%) |
| $100,000 to $149,999 | 246 (16.2%) | 11 (1.8%) |
| $150,000 or more | 293 (19.3%) | 19 (3.0%) |
| Total | 1,520 (100.0%) | 629 (100.0%) |
Monthly Housing Cost Tiers in New Holland borough
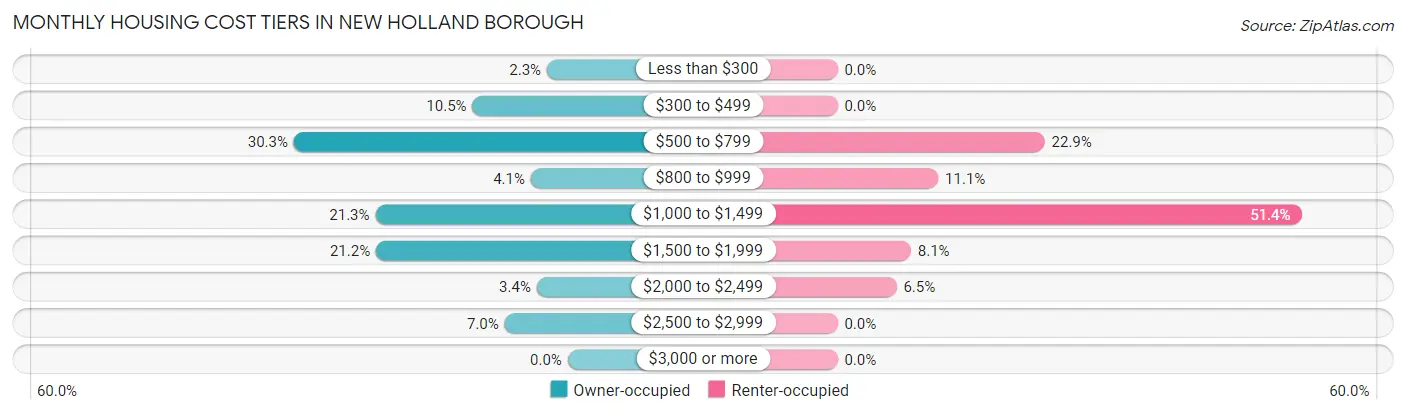
| Monthly Cost | Owner-occupied | Renter-occupied |
| Less than $300 | 35 (2.3%) | 0 (0.0%) |
| $300 to $499 | 160 (10.5%) | 0 (0.0%) |
| $500 to $799 | 460 (30.3%) | 144 (22.9%) |
| $800 to $999 | 62 (4.1%) | 70 (11.1%) |
| $1,000 to $1,499 | 323 (21.2%) | 323 (51.3%) |
| $1,500 to $1,999 | 322 (21.2%) | 51 (8.1%) |
| $2,000 to $2,499 | 52 (3.4%) | 41 (6.5%) |
| $2,500 to $2,999 | 106 (7.0%) | 0 (0.0%) |
| $3,000 or more | 0 (0.0%) | 0 (0.0%) |
| Total | 1,520 (100.0%) | 629 (100.0%) |
Physical Housing Characteristics in New Holland borough
Housing Structures in New Holland borough
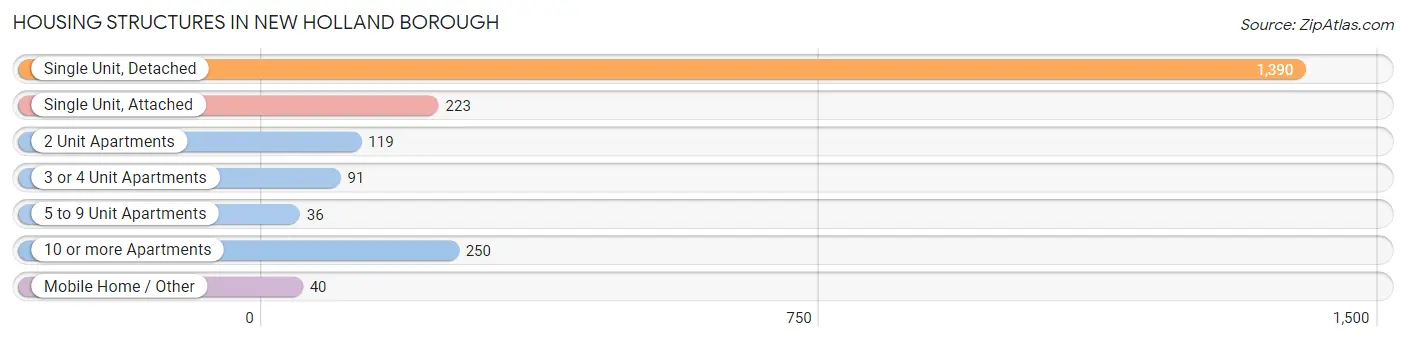
| Structure Type | # Housing Units | % Housing Units |
| Single Unit, Detached | 1,390 | 64.7% |
| Single Unit, Attached | 223 | 10.4% |
| 2 Unit Apartments | 119 | 5.5% |
| 3 or 4 Unit Apartments | 91 | 4.2% |
| 5 to 9 Unit Apartments | 36 | 1.7% |
| 10 or more Apartments | 250 | 11.6% |
| Mobile Home / Other | 40 | 1.9% |
| Total | 2,149 | 100.0% |
Housing Structures by Occupancy in New Holland borough
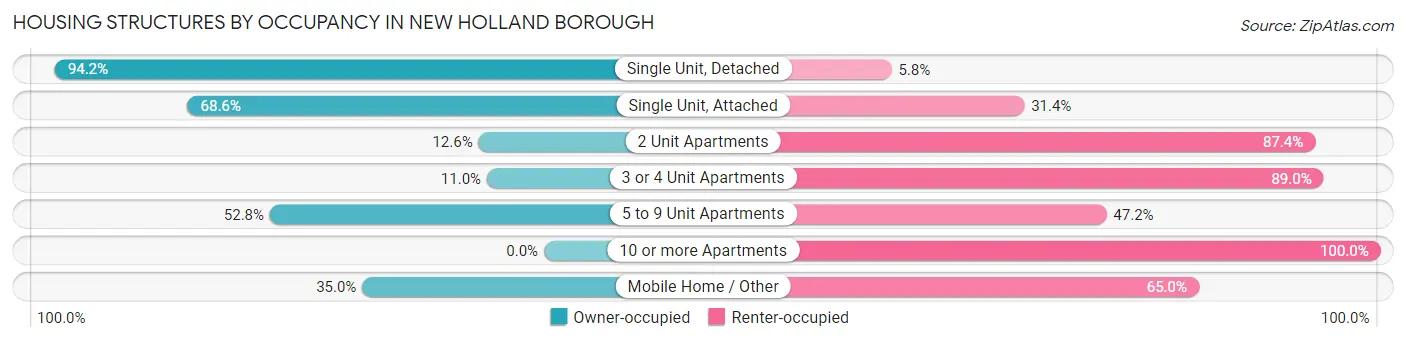
| Structure Type | Owner-occupied | Renter-occupied |
| Single Unit, Detached | 1,309 (94.2%) | 81 (5.8%) |
| Single Unit, Attached | 153 (68.6%) | 70 (31.4%) |
| 2 Unit Apartments | 15 (12.6%) | 104 (87.4%) |
| 3 or 4 Unit Apartments | 10 (11.0%) | 81 (89.0%) |
| 5 to 9 Unit Apartments | 19 (52.8%) | 17 (47.2%) |
| 10 or more Apartments | 0 (0.0%) | 250 (100.0%) |
| Mobile Home / Other | 14 (35.0%) | 26 (65.0%) |
| Total | 1,520 (70.7%) | 629 (29.3%) |
Housing Structures by Number of Rooms in New Holland borough
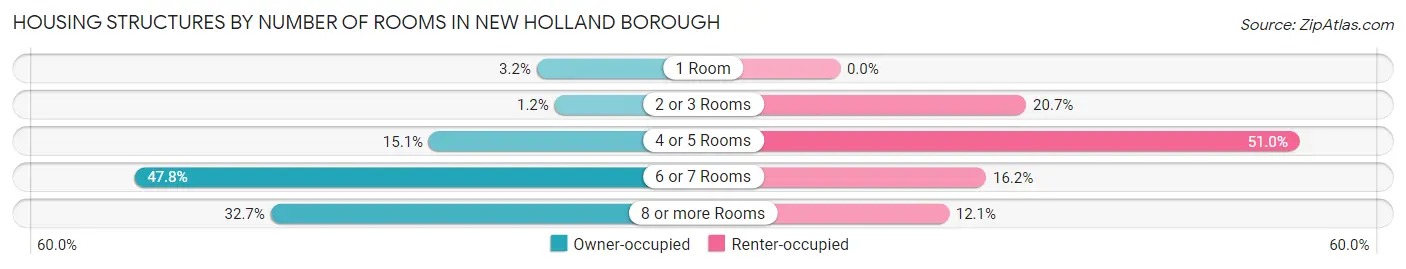
| Number of Rooms | Owner-occupied | Renter-occupied |
| 1 Room | 48 (3.2%) | 0 (0.0%) |
| 2 or 3 Rooms | 18 (1.2%) | 130 (20.7%) |
| 4 or 5 Rooms | 230 (15.1%) | 321 (51.0%) |
| 6 or 7 Rooms | 727 (47.8%) | 102 (16.2%) |
| 8 or more Rooms | 497 (32.7%) | 76 (12.1%) |
| Total | 1,520 (100.0%) | 629 (100.0%) |
Housing Structure by Heating Type in New Holland borough
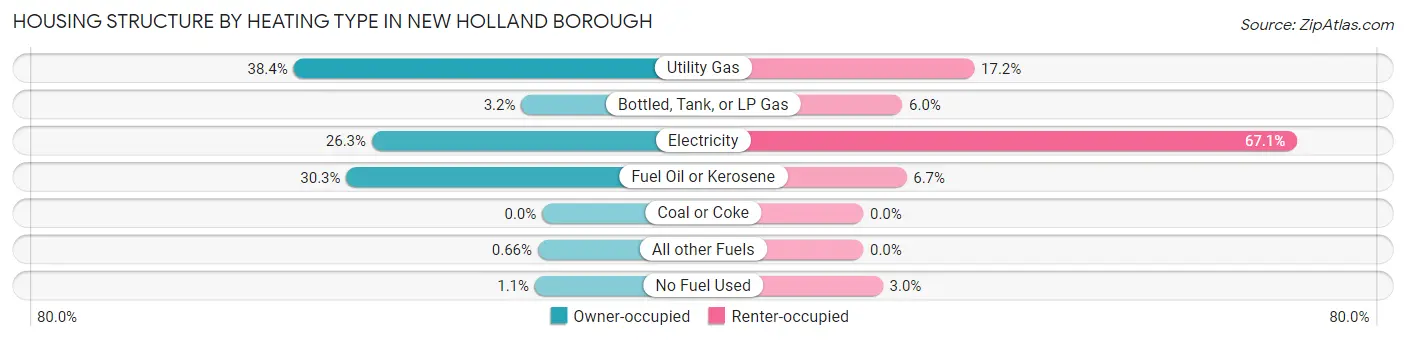
| Heating Type | Owner-occupied | Renter-occupied |
| Utility Gas | 584 (38.4%) | 108 (17.2%) |
| Bottled, Tank, or LP Gas | 49 (3.2%) | 38 (6.0%) |
| Electricity | 400 (26.3%) | 422 (67.1%) |
| Fuel Oil or Kerosene | 460 (30.3%) | 42 (6.7%) |
| Coal or Coke | 0 (0.0%) | 0 (0.0%) |
| All other Fuels | 10 (0.7%) | 0 (0.0%) |
| No Fuel Used | 17 (1.1%) | 19 (3.0%) |
| Total | 1,520 (100.0%) | 629 (100.0%) |
Household Vehicle Usage in New Holland borough
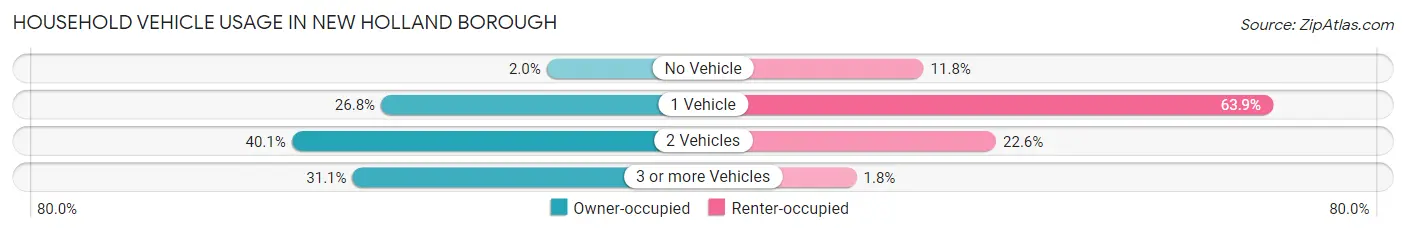
| Vehicles per Household | Owner-occupied | Renter-occupied |
| No Vehicle | 31 (2.0%) | 74 (11.8%) |
| 1 Vehicle | 407 (26.8%) | 402 (63.9%) |
| 2 Vehicles | 610 (40.1%) | 142 (22.6%) |
| 3 or more Vehicles | 472 (31.0%) | 11 (1.8%) |
| Total | 1,520 (100.0%) | 629 (100.0%) |
Real Estate & Mortgages in New Holland borough
Real Estate and Mortgage Overview in New Holland borough
| Characteristic | Without Mortgage | With Mortgage |
| Housing Units | 580 | 940 |
| Median Property Value | $224,100 | $220,400 |
| Median Household Income | $51,364 | $148 |
| Monthly Housing Costs | $561 | $0 |
| Real Estate Taxes | $2,943 | $63 |
Property Value by Mortgage Status in New Holland borough
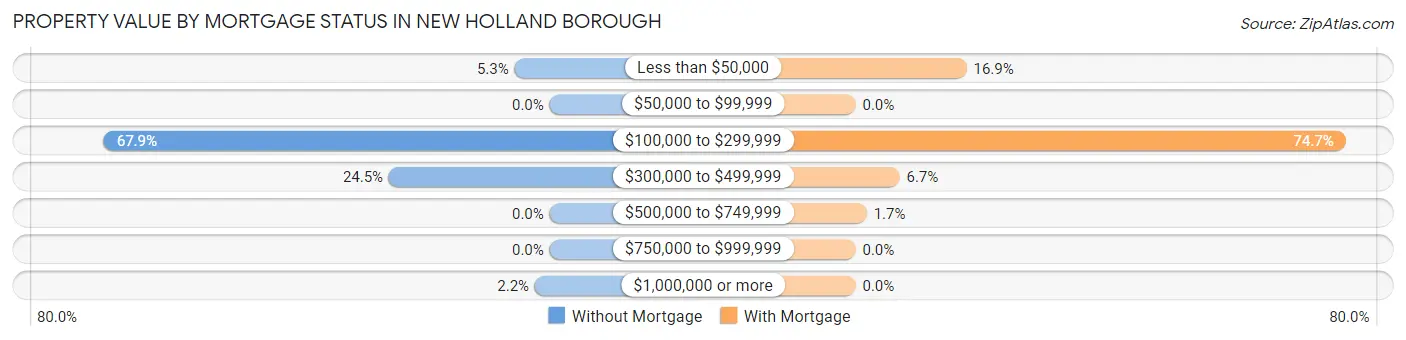
| Property Value | Without Mortgage | With Mortgage |
| Less than $50,000 | 31 (5.3%) | 159 (16.9%) |
| $50,000 to $99,999 | 0 (0.0%) | 0 (0.0%) |
| $100,000 to $299,999 | 394 (67.9%) | 702 (74.7%) |
| $300,000 to $499,999 | 142 (24.5%) | 63 (6.7%) |
| $500,000 to $749,999 | 0 (0.0%) | 16 (1.7%) |
| $750,000 to $999,999 | 0 (0.0%) | 0 (0.0%) |
| $1,000,000 or more | 13 (2.2%) | 0 (0.0%) |
| Total | 580 (100.0%) | 940 (100.0%) |
Household Income by Mortgage Status in New Holland borough
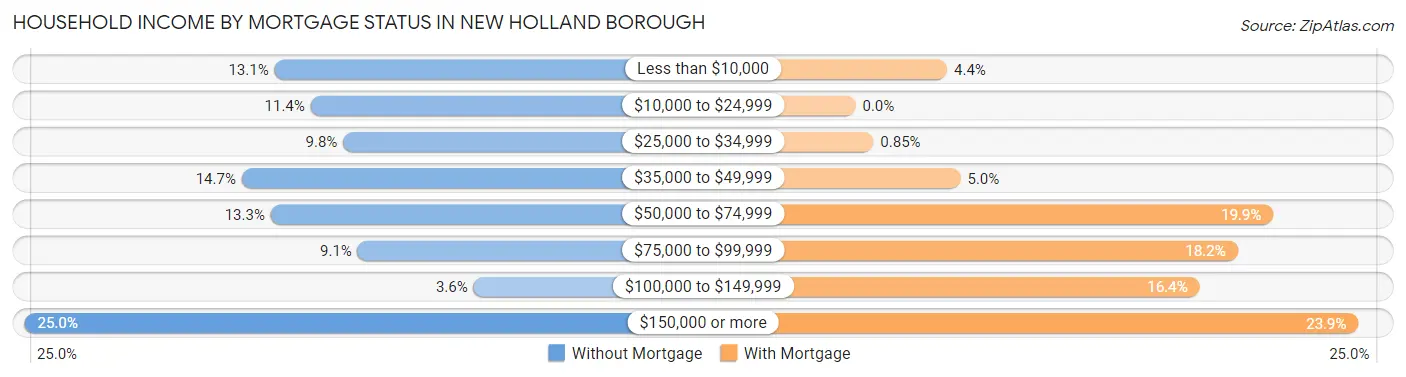
| Household Income | Without Mortgage | With Mortgage |
| Less than $10,000 | 76 (13.1%) | 41 (4.4%) |
| $10,000 to $24,999 | 66 (11.4%) | 0 (0.0%) |
| $25,000 to $34,999 | 57 (9.8%) | 8 (0.9%) |
| $35,000 to $49,999 | 85 (14.7%) | 47 (5.0%) |
| $50,000 to $74,999 | 77 (13.3%) | 187 (19.9%) |
| $75,000 to $99,999 | 53 (9.1%) | 171 (18.2%) |
| $100,000 to $149,999 | 21 (3.6%) | 154 (16.4%) |
| $150,000 or more | 145 (25.0%) | 225 (23.9%) |
| Total | 580 (100.0%) | 940 (100.0%) |
Property Value to Household Income Ratio in New Holland borough
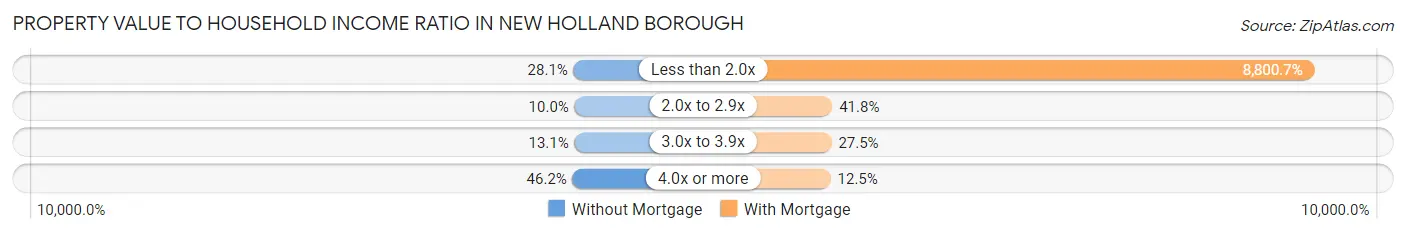
| Value-to-Income Ratio | Without Mortgage | With Mortgage |
| Less than 2.0x | 163 (28.1%) | 82,727 (8,800.7%) |
| 2.0x to 2.9x | 58 (10.0%) | 393 (41.8%) |
| 3.0x to 3.9x | 76 (13.1%) | 258 (27.5%) |
| 4.0x or more | 268 (46.2%) | 117 (12.4%) |
| Total | 580 (100.0%) | 940 (100.0%) |
Real Estate Taxes by Mortgage Status in New Holland borough
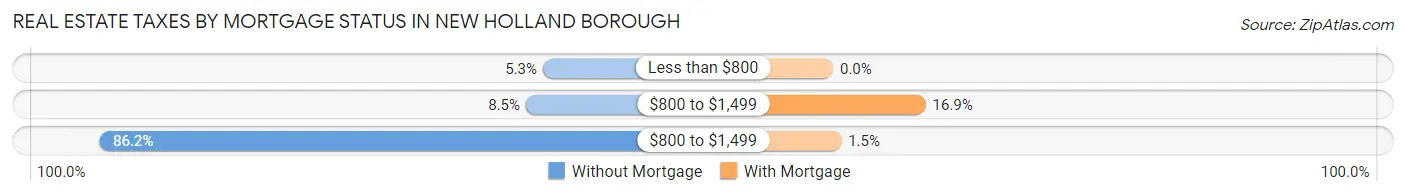
| Property Taxes | Without Mortgage | With Mortgage |
| Less than $800 | 31 (5.3%) | 0 (0.0%) |
| $800 to $1,499 | 49 (8.5%) | 159 (16.9%) |
| $800 to $1,499 | 500 (86.2%) | 14 (1.5%) |
| Total | 580 (100.0%) | 940 (100.0%) |
Health & Disability in New Holland borough
Health Insurance Coverage by Age in New Holland borough
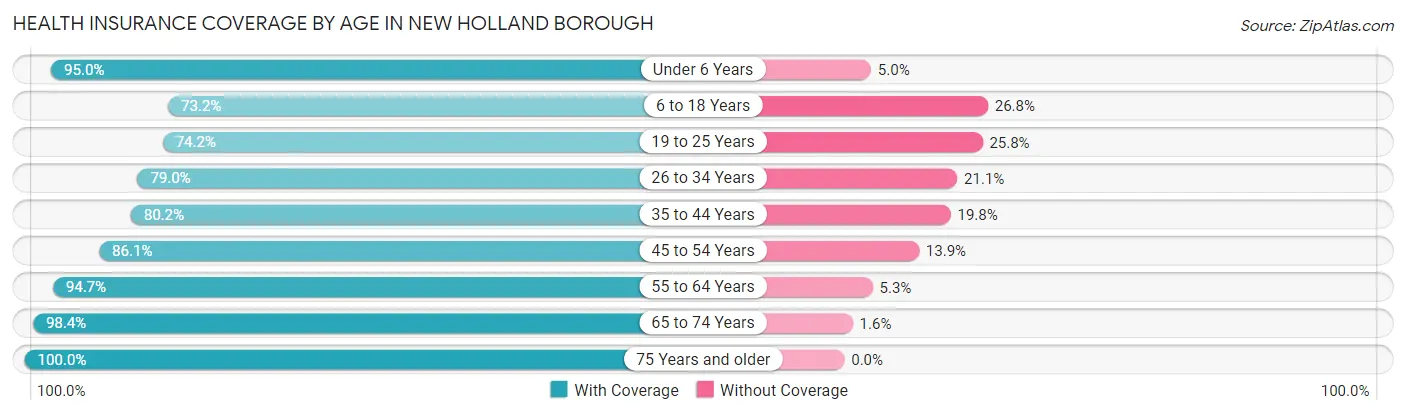
| Age Bracket | With Coverage | Without Coverage |
| Under 6 Years | 364 (95.0%) | 19 (5.0%) |
| 6 to 18 Years | 739 (73.2%) | 270 (26.8%) |
| 19 to 25 Years | 317 (74.2%) | 110 (25.8%) |
| 26 to 34 Years | 345 (78.9%) | 92 (21.0%) |
| 35 to 44 Years | 603 (80.2%) | 149 (19.8%) |
| 45 to 54 Years | 687 (86.1%) | 111 (13.9%) |
| 55 to 64 Years | 717 (94.7%) | 40 (5.3%) |
| 65 to 74 Years | 568 (98.4%) | 9 (1.6%) |
| 75 Years and older | 575 (100.0%) | 0 (0.0%) |
| Total | 4,915 (86.0%) | 800 (14.0%) |
Health Insurance Coverage by Citizenship Status in New Holland borough
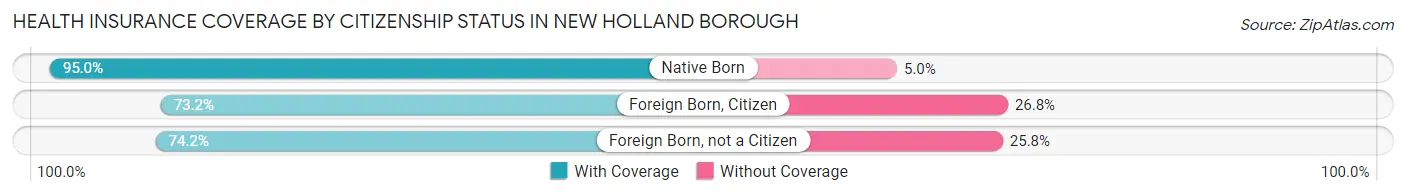
| Citizenship Status | With Coverage | Without Coverage |
| Native Born | 364 (95.0%) | 19 (5.0%) |
| Foreign Born, Citizen | 739 (73.2%) | 270 (26.8%) |
| Foreign Born, not a Citizen | 317 (74.2%) | 110 (25.8%) |
Health Insurance Coverage by Household Income in New Holland borough
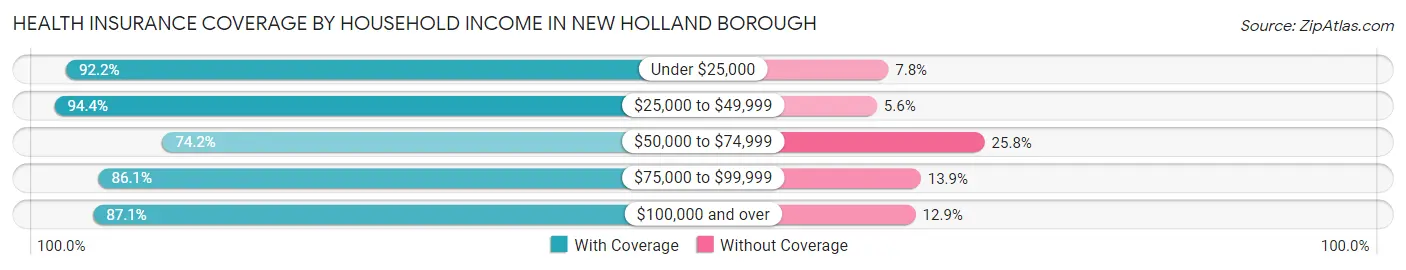
| Household Income | With Coverage | Without Coverage |
| Under $25,000 | 450 (92.2%) | 38 (7.8%) |
| $25,000 to $49,999 | 1,037 (94.4%) | 62 (5.6%) |
| $50,000 to $74,999 | 919 (74.2%) | 320 (25.8%) |
| $75,000 to $99,999 | 714 (86.1%) | 115 (13.9%) |
| $100,000 and over | 1,790 (87.1%) | 265 (12.9%) |
Public vs Private Health Insurance Coverage by Age in New Holland borough
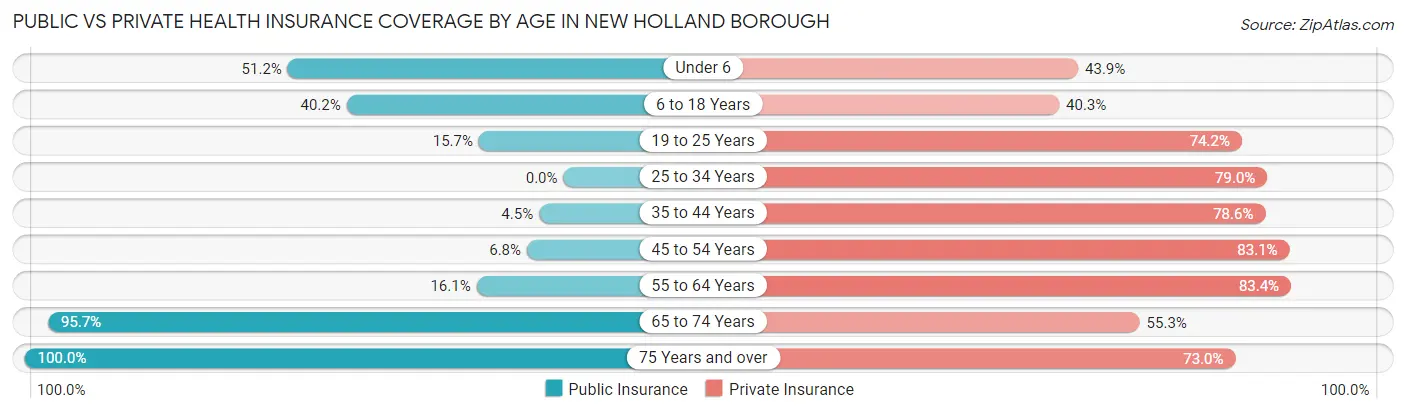
| Age Bracket | Public Insurance | Private Insurance |
| Under 6 | 196 (51.2%) | 168 (43.9%) |
| 6 to 18 Years | 406 (40.2%) | 407 (40.3%) |
| 19 to 25 Years | 67 (15.7%) | 317 (74.2%) |
| 25 to 34 Years | 0 (0.0%) | 345 (78.9%) |
| 35 to 44 Years | 34 (4.5%) | 591 (78.6%) |
| 45 to 54 Years | 54 (6.8%) | 663 (83.1%) |
| 55 to 64 Years | 122 (16.1%) | 631 (83.4%) |
| 65 to 74 Years | 552 (95.7%) | 319 (55.3%) |
| 75 Years and over | 575 (100.0%) | 420 (73.0%) |
| Total | 2,006 (35.1%) | 3,861 (67.6%) |
Disability Status by Sex by Age in New Holland borough
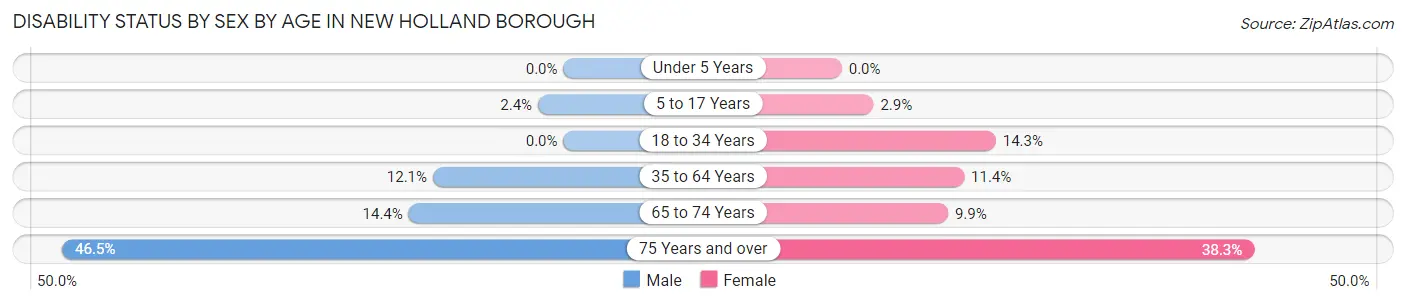
| Age Bracket | Male | Female |
| Under 5 Years | 0 (0.0%) | 0 (0.0%) |
| 5 to 17 Years | 13 (2.4%) | 12 (2.9%) |
| 18 to 34 Years | 0 (0.0%) | 53 (14.3%) |
| 35 to 64 Years | 162 (12.1%) | 110 (11.4%) |
| 65 to 74 Years | 26 (14.4%) | 39 (9.9%) |
| 75 Years and over | 107 (46.5%) | 132 (38.3%) |
Disability Class by Sex by Age in New Holland borough
Disability Class: Hearing Difficulty
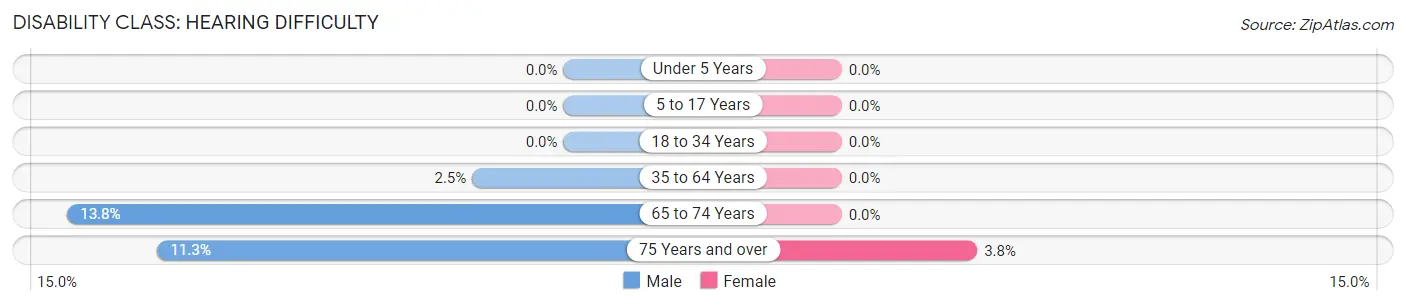
| Age Bracket | Male | Female |
| Under 5 Years | 0 (0.0%) | 0 (0.0%) |
| 5 to 17 Years | 0 (0.0%) | 0 (0.0%) |
| 18 to 34 Years | 0 (0.0%) | 0 (0.0%) |
| 35 to 64 Years | 34 (2.5%) | 0 (0.0%) |
| 65 to 74 Years | 25 (13.8%) | 0 (0.0%) |
| 75 Years and over | 26 (11.3%) | 13 (3.8%) |
Disability Class: Vision Difficulty
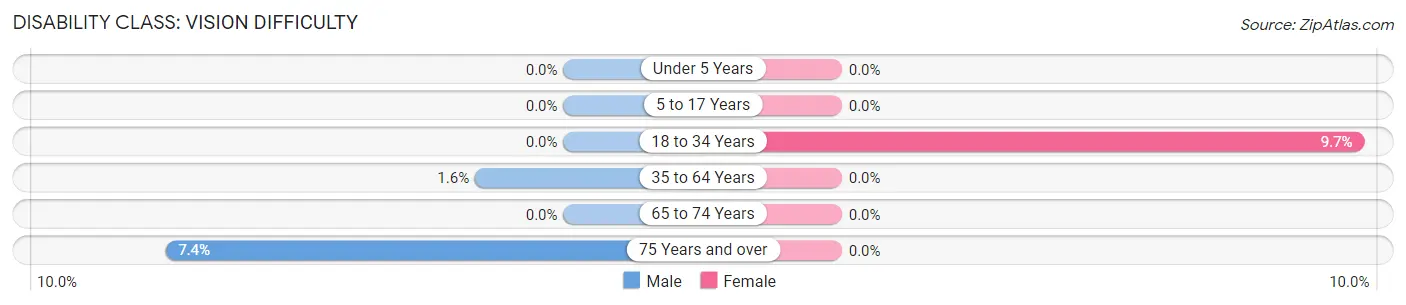
| Age Bracket | Male | Female |
| Under 5 Years | 0 (0.0%) | 0 (0.0%) |
| 5 to 17 Years | 0 (0.0%) | 0 (0.0%) |
| 18 to 34 Years | 0 (0.0%) | 36 (9.7%) |
| 35 to 64 Years | 22 (1.6%) | 0 (0.0%) |
| 65 to 74 Years | 0 (0.0%) | 0 (0.0%) |
| 75 Years and over | 17 (7.4%) | 0 (0.0%) |
Disability Class: Cognitive Difficulty
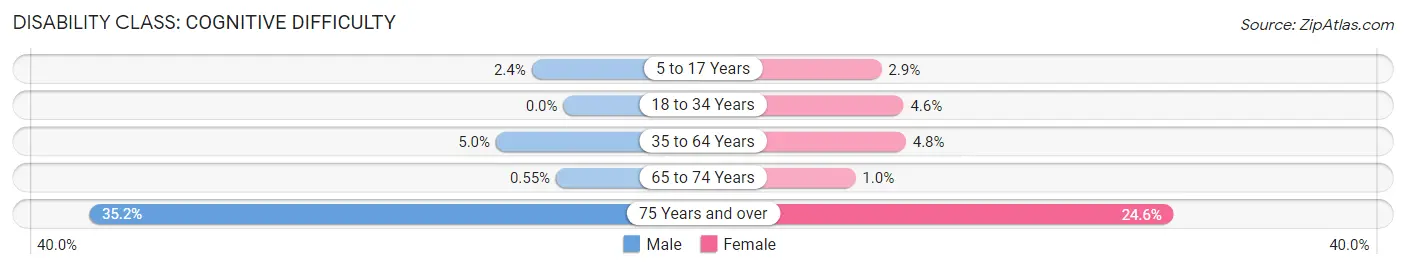
| Age Bracket | Male | Female |
| 5 to 17 Years | 13 (2.4%) | 12 (2.9%) |
| 18 to 34 Years | 0 (0.0%) | 17 (4.6%) |
| 35 to 64 Years | 67 (5.0%) | 46 (4.8%) |
| 65 to 74 Years | 1 (0.5%) | 4 (1.0%) |
| 75 Years and over | 81 (35.2%) | 85 (24.6%) |
Disability Class: Ambulatory Difficulty
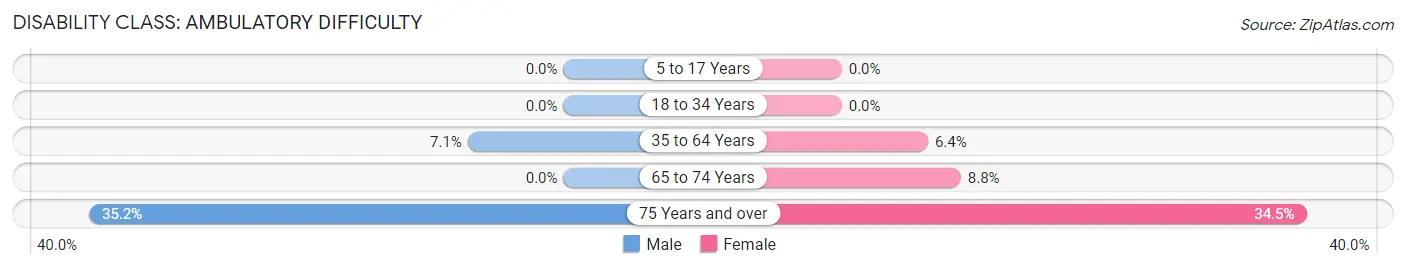
| Age Bracket | Male | Female |
| 5 to 17 Years | 0 (0.0%) | 0 (0.0%) |
| 18 to 34 Years | 0 (0.0%) | 0 (0.0%) |
| 35 to 64 Years | 95 (7.1%) | 62 (6.4%) |
| 65 to 74 Years | 0 (0.0%) | 35 (8.8%) |
| 75 Years and over | 81 (35.2%) | 119 (34.5%) |
Disability Class: Self-Care Difficulty
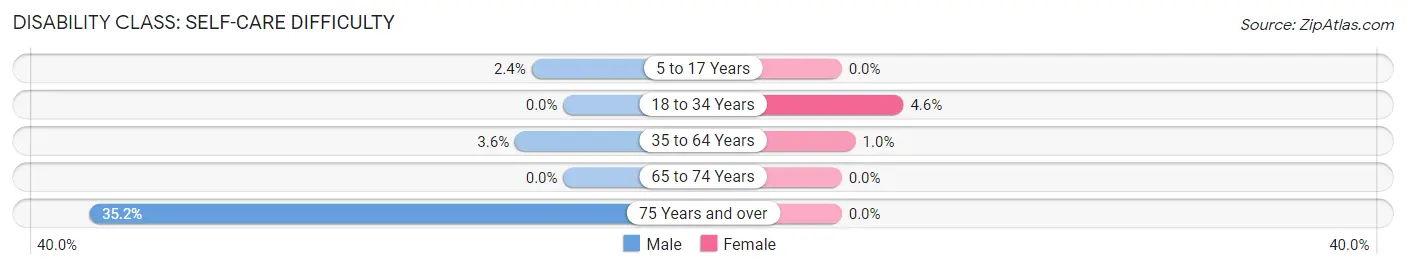
| Age Bracket | Male | Female |
| 5 to 17 Years | 13 (2.4%) | 0 (0.0%) |
| 18 to 34 Years | 0 (0.0%) | 17 (4.6%) |
| 35 to 64 Years | 48 (3.6%) | 10 (1.0%) |
| 65 to 74 Years | 0 (0.0%) | 0 (0.0%) |
| 75 Years and over | 81 (35.2%) | 0 (0.0%) |
Technology Access in New Holland borough
Computing Device Access in New Holland borough
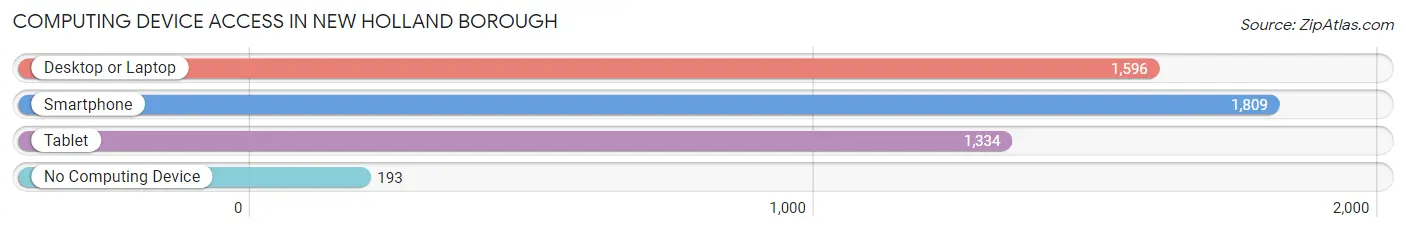
| Device Type | # Households | % Households |
| Desktop or Laptop | 1,596 | 74.3% |
| Smartphone | 1,809 | 84.2% |
| Tablet | 1,334 | 62.1% |
| No Computing Device | 193 | 9.0% |
| Total | 2,149 | 100.0% |
Internet Access in New Holland borough
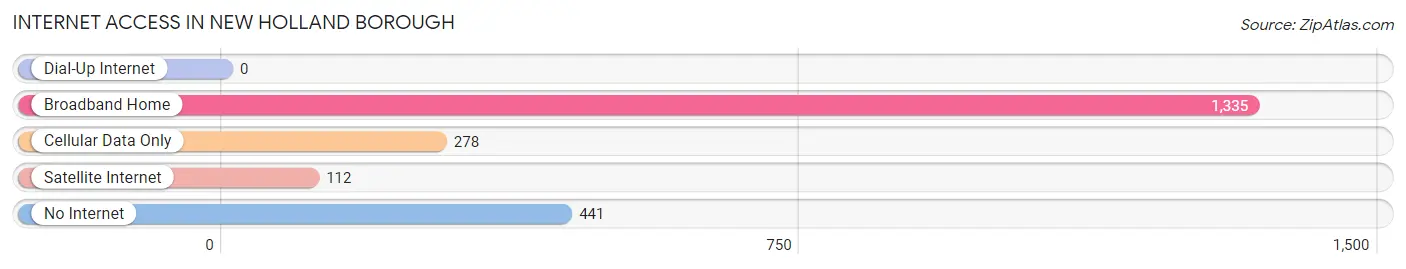
| Internet Type | # Households | % Households |
| Dial-Up Internet | 0 | 0.0% |
| Broadband Home | 1,335 | 62.1% |
| Cellular Data Only | 278 | 12.9% |
| Satellite Internet | 112 | 5.2% |
| No Internet | 441 | 20.5% |
| Total | 2,149 | 100.0% |
New Holland borough Summary
New Holland Borough is a small borough located in Lancaster County, Pennsylvania. It is situated in the southeastern part of the county, approximately 10 miles east of the city of Lancaster. The borough is bordered by Earl Township to the north, East Earl Township to the east, and West Earl Township to the south and west. As of the 2010 census, the population of New Holland Borough was 5,367.
History
New Holland Borough was founded in 1833 by a group of Mennonites from the Netherlands. The Mennonites had been living in the area since the late 17th century, and the borough was named after their homeland. The Mennonites were attracted to the area due to its fertile soil and abundant natural resources.
The borough was officially incorporated in 1845, and the first mayor was elected in 1846. The first post office was established in 1847, and the first school was built in 1848. The borough was home to several industries, including a flour mill, a sawmill, a tannery, and a brickyard.
Geography
New Holland Borough is located at 40°7'25"N 76°7'25"W (40.123611, -76.123611). It has a total area of 1.2 square miles, all of which is land. The borough is situated in the southeastern part of Lancaster County, approximately 10 miles east of the city of Lancaster. It is bordered by Earl Township to the north, East Earl Township to the east, and West Earl Township to the south and west.
The borough is located in the Piedmont region of Pennsylvania, and is characterized by rolling hills and valleys. The borough is drained by the Conestoga River, which flows through the center of the borough.
Economy
New Holland Borough is home to several small businesses, including a variety of retail stores, restaurants, and service providers. The borough is also home to several manufacturing companies, including New Holland Machine Company, which produces agricultural equipment, and New Holland Brewing Company, which produces craft beer.
The borough is also home to several farms, which produce a variety of crops, including corn, soybeans, wheat, and hay. The borough is also home to several dairy farms, which produce milk, cheese, and other dairy products.
Demographics
As of the 2010 census, the population of New Holland Borough was 5,367. The racial makeup of the borough was 95.3% White, 0.7% African American, 0.2% Native American, 0.7% Asian, 0.1% Pacific Islander, 1.2% from other races, and 1.9% from two or more races. Hispanic or Latino of any race were 3.2% of the population.
The median household income in the borough was $45,938, and the median family income was $54,938. The per capita income in the borough was $21,945. About 8.2% of families and 10.2% of the population were below the poverty line, including 14.2% of those under age 18 and 6.2% of those age 65 or over.
Common Questions
What is the Total Population of New Holland borough?
Total Population of New Holland borough is 5,734.
What is the Total Male Population of New Holland borough?
Total Male Population of New Holland borough is 3,032.
What is the Total Female Population of New Holland borough?
Total Female Population of New Holland borough is 2,702.
What is the Ratio of Males per 100 Females in New Holland borough?
There are 112.21 Males per 100 Females in New Holland borough.
What is the Ratio of Females per 100 Males in New Holland borough?
There are 89.12 Females per 100 Males in New Holland borough.
What is the Median Population Age in New Holland borough?
Median Population Age in New Holland borough is 42.0 Years.
What is the Average Family Size in New Holland borough
Average Family Size in New Holland borough is 3.6 People.
What is the Average Household Size in New Holland borough
Average Household Size in New Holland borough is 2.7 People.
What is Per Capita Income in New Holland borough?
Per Capita income in New Holland borough is $33,137.
What is the Median Family Income in New Holland borough?
Median Family Income in New Holland borough is $76,932.
What is the Median Household income in New Holland borough?
Median Household Income in New Holland borough is $59,553.
What is Income or Wage Gap in New Holland borough?
Income or Wage Gap in New Holland borough is 53.7%.
Women in New Holland borough earn 46.3 cents for every dollar earned by a man.
What is Inequality or Gini Index in New Holland borough?
Inequality or Gini Index in New Holland borough is 0.47.
How Large is the Labor Force in New Holland borough?
There are 2,907 People in the Labor Forcein in New Holland borough.
What is the Percentage of People in the Labor Force in New Holland borough?
61.9% of People are in the Labor Force in New Holland borough.
What is the Unemployment Rate in New Holland borough?
Unemployment Rate in New Holland borough is 2.6%.