Morton borough, PA
Morton borough Overview
2,759
TOTAL POPULATION
1,435
MALE POPULATION
1,324
FEMALE POPULATION
108.38
MALES / 100 FEMALES
92.26
FEMALES / 100 MALES
41.1
MEDIAN AGE
2.9
AVG FAMILY SIZE
2.2
AVG HOUSEHOLD SIZE
$42,555
PER CAPITA INCOME
$103,000
AVG FAMILY INCOME
$63,599
AVG HOUSEHOLD INCOME
4.1%
WAGE / INCOME GAP [ % ]
95.9¢/ $1
WAGE / INCOME GAP [ $ ]
0.43
INEQUALITY / GINI INDEX
1,592
LABOR FORCE [ PEOPLE ]
70.3%
PERCENT IN LABOR FORCE
5.2%
UNEMPLOYMENT RATE
Race in Morton borough
The most populous races in Morton borough are White / Caucasian (1,871 | 67.8%), Black / African American (639 | 23.2%), and Asian (177 | 6.4%).
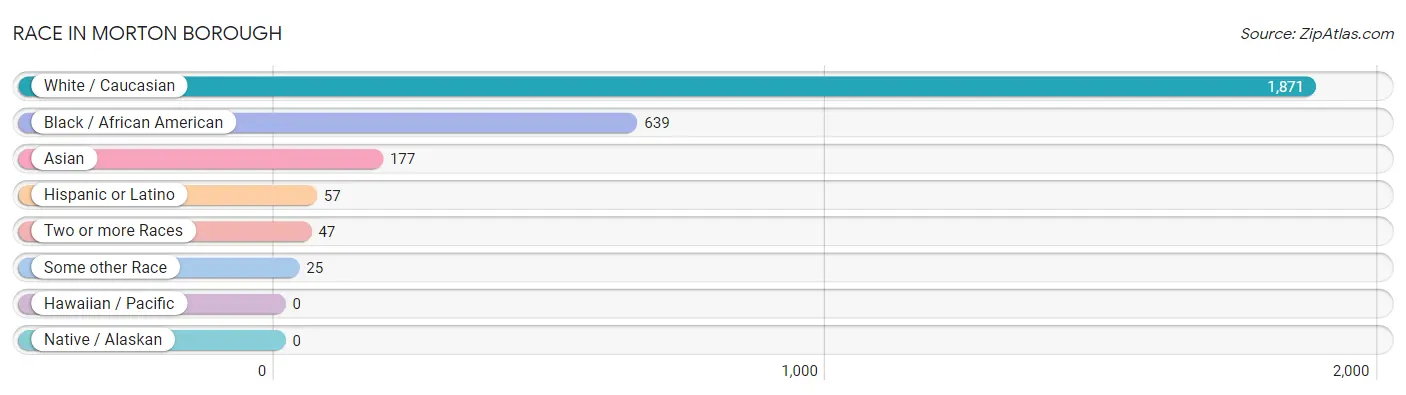
| Race | # Population | % Population |
| Asian | 177 | 6.4% |
| Black / African American | 639 | 23.2% |
| Hawaiian / Pacific | 0 | 0.0% |
| Hispanic or Latino | 57 | 2.1% |
| Native / Alaskan | 0 | 0.0% |
| White / Caucasian | 1,871 | 67.8% |
| Two or more Races | 47 | 1.7% |
| Some other Race | 25 | 0.9% |
| Total | 2,759 | 100.0% |
Ancestry in Morton borough
The most populous ancestries reported in Morton borough are Irish (787 | 28.5%), Italian (461 | 16.7%), German (312 | 11.3%), Indian (Asian) (146 | 5.3%), and American (143 | 5.2%), together accounting for 67.0% of all Morton borough residents.
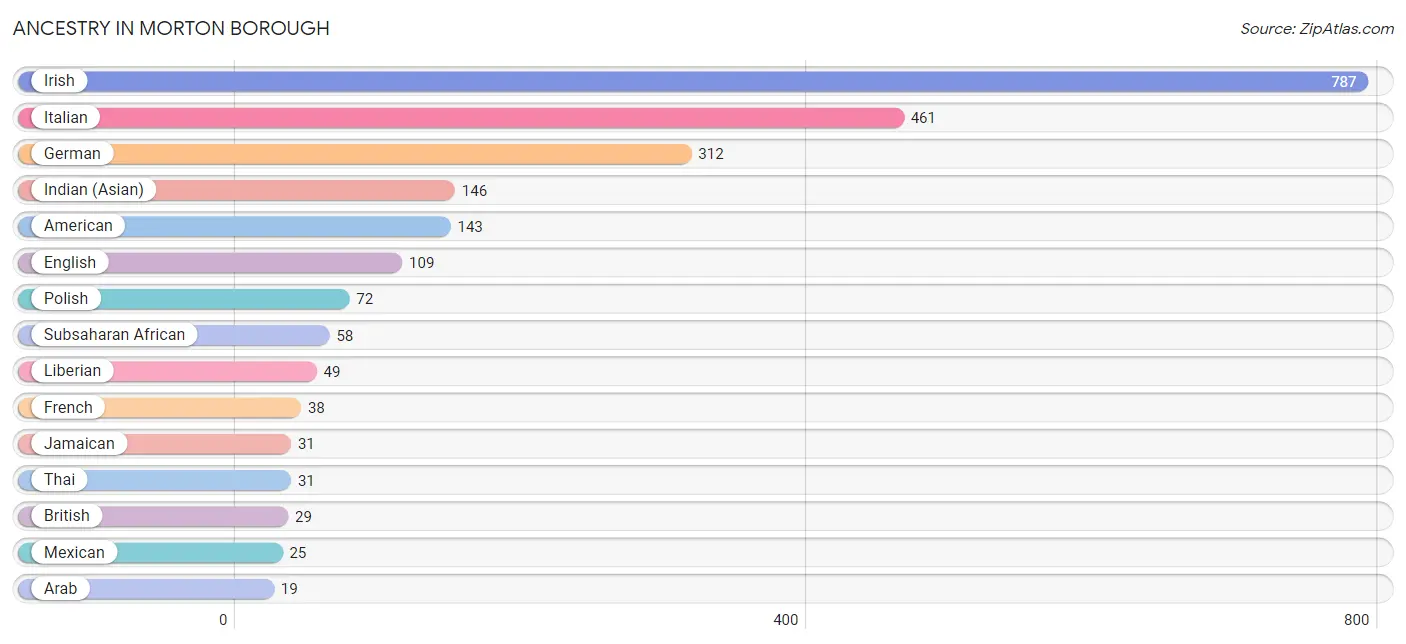
| Ancestry | # Population | % Population |
| African | 9 | 0.3% |
| American | 143 | 5.2% |
| Arab | 19 | 0.7% |
| Armenian | 4 | 0.1% |
| Austrian | 16 | 0.6% |
| Barbadian | 12 | 0.4% |
| British | 29 | 1.1% |
| Colombian | 12 | 0.4% |
| Cuban | 16 | 0.6% |
| English | 109 | 4.0% |
| European | 11 | 0.4% |
| French | 38 | 1.4% |
| German | 312 | 11.3% |
| Greek | 7 | 0.3% |
| Indian (Asian) | 146 | 5.3% |
| Irish | 787 | 28.5% |
| Italian | 461 | 16.7% |
| Jamaican | 31 | 1.1% |
| Lebanese | 19 | 0.7% |
| Liberian | 49 | 1.8% |
| Lithuanian | 4 | 0.1% |
| Mexican | 25 | 0.9% |
| Norwegian | 2 | 0.1% |
| Polish | 72 | 2.6% |
| Scotch-Irish | 8 | 0.3% |
| Scottish | 10 | 0.4% |
| South American | 12 | 0.4% |
| Spaniard | 4 | 0.1% |
| Subsaharan African | 58 | 2.1% |
| Swedish | 9 | 0.3% |
| Thai | 31 | 1.1% |
| Trinidadian and Tobagonian | 3 | 0.1% |
| Ukrainian | 7 | 0.3% |
| Welsh | 11 | 0.4% | View All 34 Rows |
Immigrants in Morton borough
The most numerous immigrant groups reported in Morton borough came from Asia (92 | 3.3%), China (70 | 2.5%), Eastern Asia (70 | 2.5%), Africa (66 | 2.4%), and Liberia (43 | 1.6%), together accounting for 12.4% of all Morton borough residents.
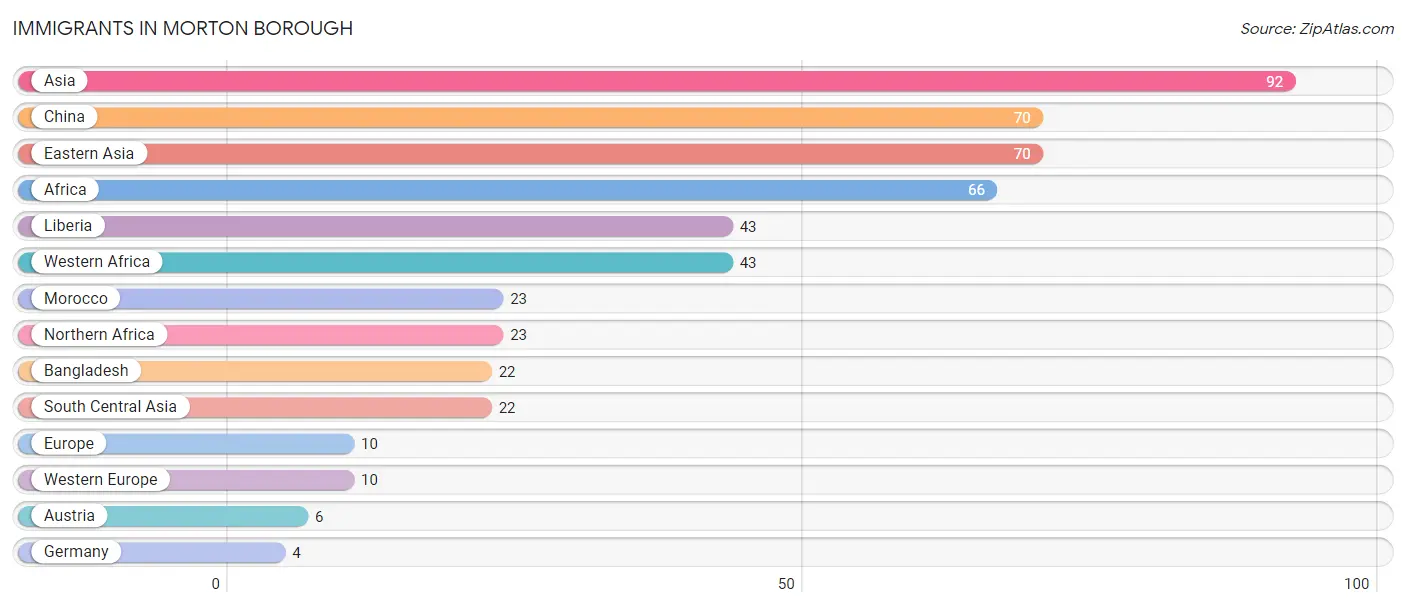
| Immigration Origin | # Population | % Population |
| Africa | 66 | 2.4% |
| Asia | 92 | 3.3% |
| Austria | 6 | 0.2% |
| Bangladesh | 22 | 0.8% |
| China | 70 | 2.5% |
| Eastern Asia | 70 | 2.5% |
| Europe | 10 | 0.4% |
| Germany | 4 | 0.1% |
| Liberia | 43 | 1.6% |
| Morocco | 23 | 0.8% |
| Northern Africa | 23 | 0.8% |
| South Central Asia | 22 | 0.8% |
| Western Africa | 43 | 1.6% |
| Western Europe | 10 | 0.4% | View All 14 Rows |
Sex and Age in Morton borough
Sex and Age in Morton borough
The most populous age groups in Morton borough are 65 to 69 Years (133 | 9.3%) for men and 35 to 39 Years (135 | 10.2%) for women.
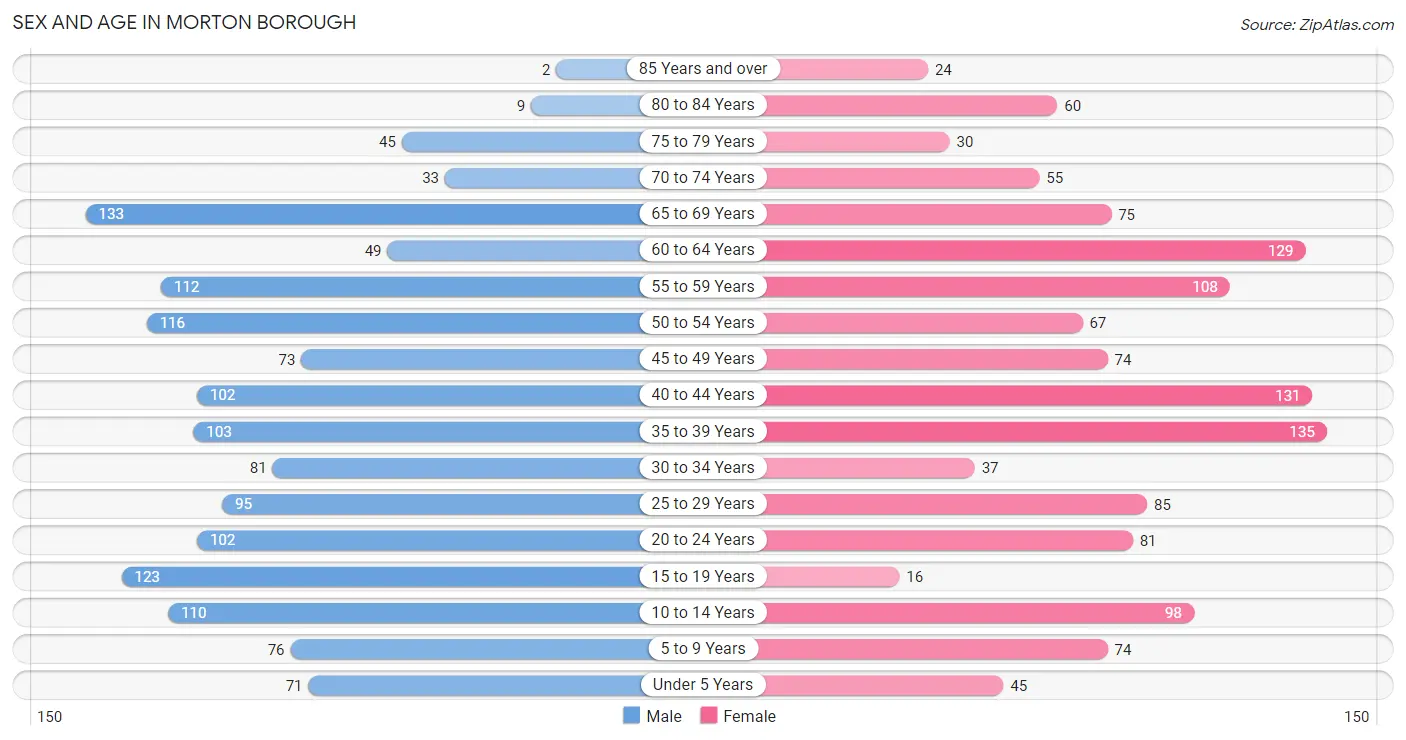
| Age Bracket | Male | Female |
| Under 5 Years | 71 (5.0%) | 45 (3.4%) |
| 5 to 9 Years | 76 (5.3%) | 74 (5.6%) |
| 10 to 14 Years | 110 (7.7%) | 98 (7.4%) |
| 15 to 19 Years | 123 (8.6%) | 16 (1.2%) |
| 20 to 24 Years | 102 (7.1%) | 81 (6.1%) |
| 25 to 29 Years | 95 (6.6%) | 85 (6.4%) |
| 30 to 34 Years | 81 (5.6%) | 37 (2.8%) |
| 35 to 39 Years | 103 (7.2%) | 135 (10.2%) |
| 40 to 44 Years | 102 (7.1%) | 131 (9.9%) |
| 45 to 49 Years | 73 (5.1%) | 74 (5.6%) |
| 50 to 54 Years | 116 (8.1%) | 67 (5.1%) |
| 55 to 59 Years | 112 (7.8%) | 108 (8.2%) |
| 60 to 64 Years | 49 (3.4%) | 129 (9.7%) |
| 65 to 69 Years | 133 (9.3%) | 75 (5.7%) |
| 70 to 74 Years | 33 (2.3%) | 55 (4.2%) |
| 75 to 79 Years | 45 (3.1%) | 30 (2.3%) |
| 80 to 84 Years | 9 (0.6%) | 60 (4.5%) |
| 85 Years and over | 2 (0.1%) | 24 (1.8%) |
| Total | 1,435 (100.0%) | 1,324 (100.0%) |
Families and Households in Morton borough
Median Family Size in Morton borough
The median family size in Morton borough is 2.89 persons per family, with married-couple families (428 | 63.9%) accounting for the largest median family size of 3 persons per family. On the other hand, single female/mother families (200 | 29.8%) represent the smallest median family size with 2.65 persons per family.
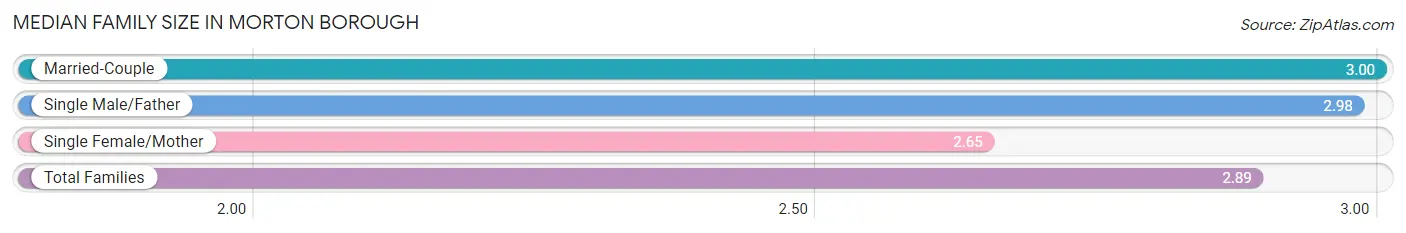
| Family Type | # Families | Family Size |
| Married-Couple | 428 (63.9%) | 3.00 |
| Single Male/Father | 42 (6.3%) | 2.98 |
| Single Female/Mother | 200 (29.8%) | 2.65 |
| Total Families | 670 (100.0%) | 2.89 |
Median Household Size in Morton borough
The median household size in Morton borough is 2.16 persons per household, with single female/mother households (200 | 15.7%) accounting for the largest median household size of 3.24 persons per household. non-family households (601 | 47.3%) represent the smallest median household size with 1.14 persons per household.
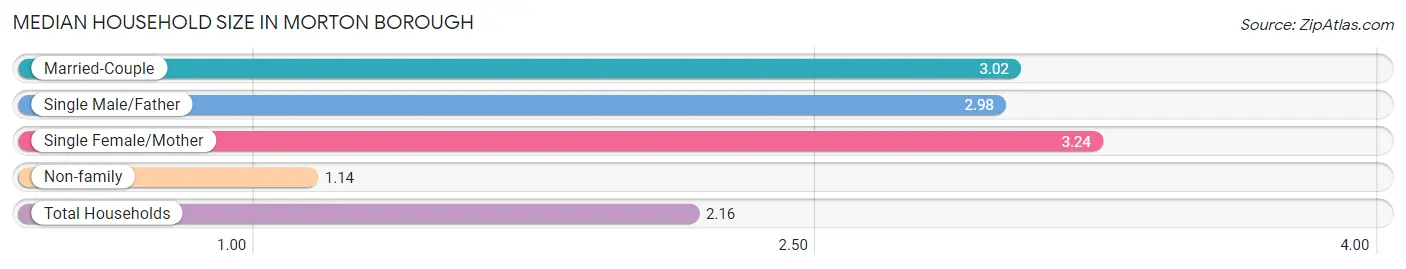
| Household Type | # Households | Household Size |
| Married-Couple | 428 (33.7%) | 3.02 |
| Single Male/Father | 42 (3.3%) | 2.98 |
| Single Female/Mother | 200 (15.7%) | 3.24 |
| Non-family | 601 (47.3%) | 1.14 |
| Total Households | 1,271 (100.0%) | 2.16 |
Household Size by Marriage Status in Morton borough
Out of a total of 1,271 households in Morton borough, 670 (52.7%) are family households, while 601 (47.3%) are nonfamily households. The most numerous type of family households are 3-person households, comprising 235, and the most common type of nonfamily households are 1-person households, comprising 533.
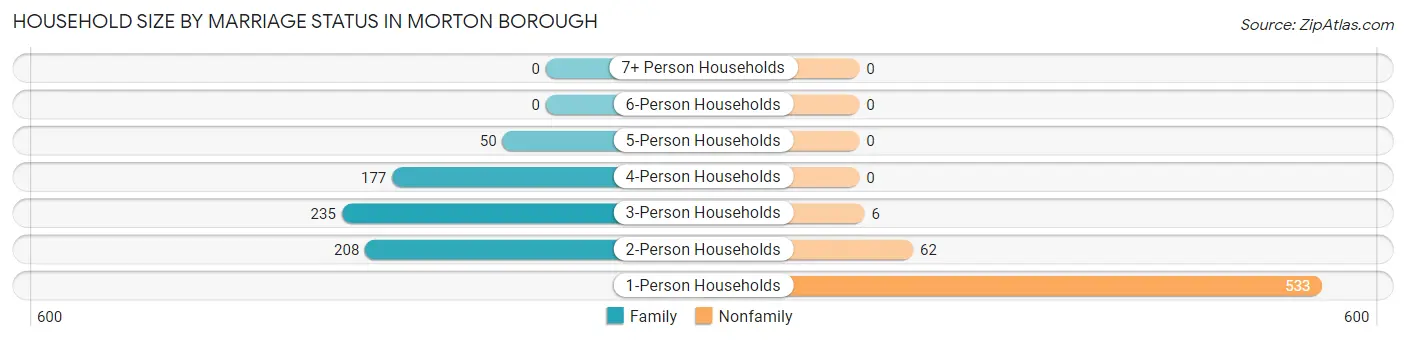
| Household Size | Family Households | Nonfamily Households |
| 1-Person Households | - | 533 (41.9%) |
| 2-Person Households | 208 (16.4%) | 62 (4.9%) |
| 3-Person Households | 235 (18.5%) | 6 (0.5%) |
| 4-Person Households | 177 (13.9%) | 0 (0.0%) |
| 5-Person Households | 50 (3.9%) | 0 (0.0%) |
| 6-Person Households | 0 (0.0%) | 0 (0.0%) |
| 7+ Person Households | 0 (0.0%) | 0 (0.0%) |
| Total | 670 (52.7%) | 601 (47.3%) |
Female Fertility in Morton borough
Fertility by Age in Morton borough
Average fertility rate in Morton borough is 33.0 births per 1,000 women. Women in the age bracket of 35 to 50 years have the highest fertility rate with 37.0 births per 1,000 women. Women in the age bracket of 35 to 50 years acount for 68.4% of all women with births.
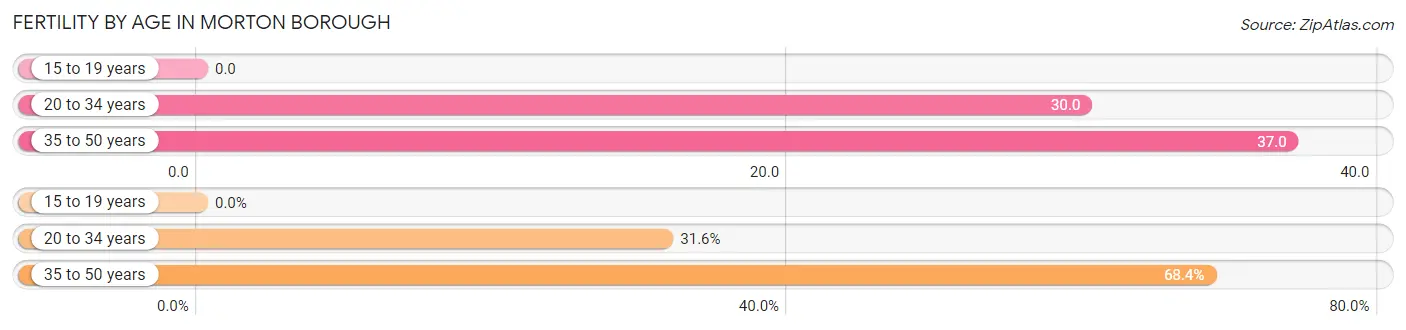
| Age Bracket | Women with Births | Births / 1,000 Women |
| 15 to 19 years | 0 (0.0%) | 0.0 |
| 20 to 34 years | 6 (31.6%) | 30.0 |
| 35 to 50 years | 13 (68.4%) | 37.0 |
| Total | 19 (100.0%) | 33.0 |
Fertility by Age by Marriage Status in Morton borough
68.4% of women with births (19) in Morton borough are married. The highest percentage of unmarried women with births falls into 20 to 34 years age bracket with 100.0% of them unmarried at the time of birth, while the lowest percentage of unmarried women with births belong to 35 to 50 years age bracket with 0.0% of them unmarried.
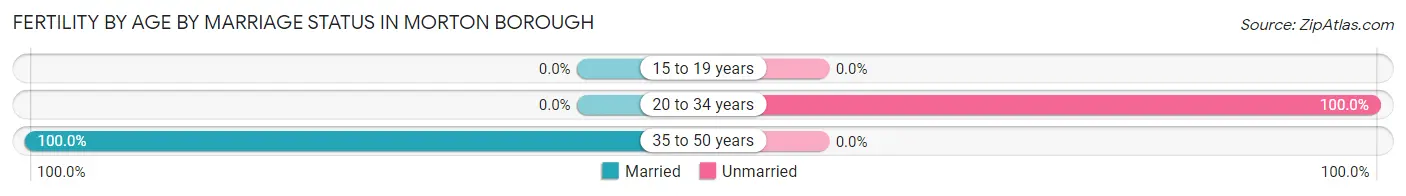
| Age Bracket | Married | Unmarried |
| 15 to 19 years | 0 (0.0%) | 0 (0.0%) |
| 20 to 34 years | 0 (0.0%) | 6 (100.0%) |
| 35 to 50 years | 13 (100.0%) | 0 (0.0%) |
| Total | 13 (68.4%) | 6 (31.6%) |
Fertility by Education in Morton borough
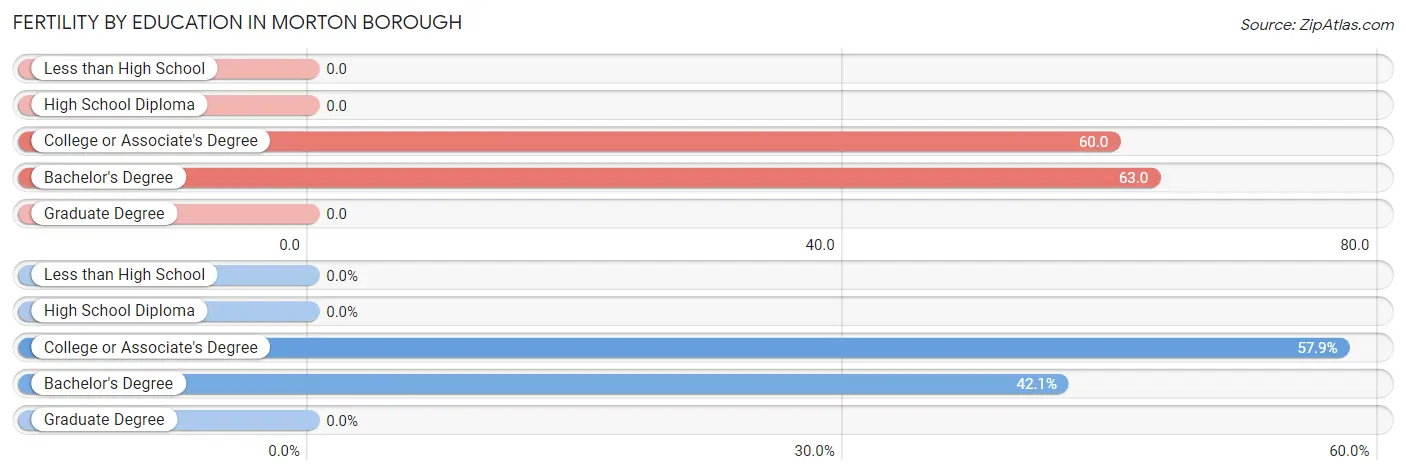
| Educational Attainment | Women with Births | Births / 1,000 Women |
| Less than High School | 0 (0.0%) | 0.0 |
| High School Diploma | 0 (0.0%) | 0.0 |
| College or Associate's Degree | 11 (57.9%) | 60.0 |
| Bachelor's Degree | 8 (42.1%) | 63.0 |
| Graduate Degree | 0 (0.0%) | 0.0 |
| Total | 19 (100.0%) | 33.0 |
Fertility by Education by Marriage Status in Morton borough
31.6% of women with births in Morton borough are unmarried. Women with the educational attainment of bachelor's degree are most likely to be married with 100.0% of them married at childbirth, while women with the educational attainment of college or associate's degree are least likely to be married with 54.5% of them unmarried at childbirth.
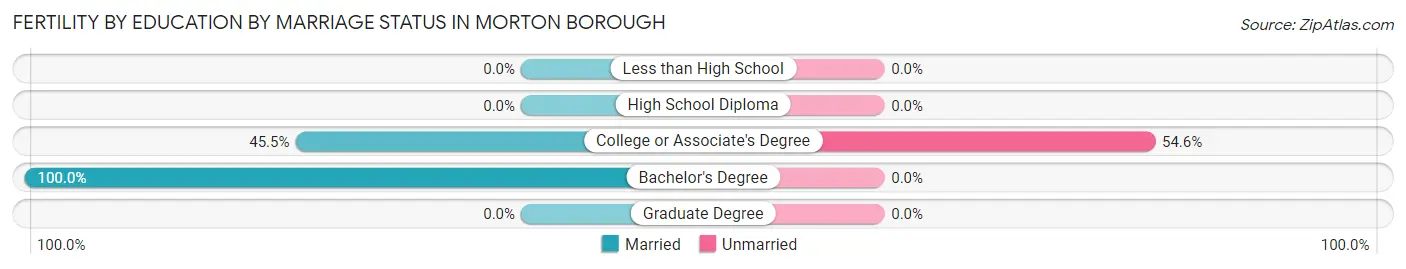
| Educational Attainment | Married | Unmarried |
| Less than High School | 0 (0.0%) | 0 (0.0%) |
| High School Diploma | 0 (0.0%) | 0 (0.0%) |
| College or Associate's Degree | 5 (45.5%) | 6 (54.5%) |
| Bachelor's Degree | 8 (100.0%) | 0 (0.0%) |
| Graduate Degree | 0 (0.0%) | 0 (0.0%) |
| Total | 13 (68.4%) | 6 (31.6%) |
Income in Morton borough
Income Overview in Morton borough
Per Capita Income in Morton borough is $42,555, while median incomes of families and households are $103,000 and $63,599 respectively.
| Characteristic | Number | Measure |
| Per Capita Income | 2,759 | $42,555 |
| Median Family Income | 670 | $103,000 |
| Mean Family Income | 670 | $109,080 |
| Median Household Income | 1,271 | $63,599 |
| Mean Household Income | 1,271 | $92,355 |
| Income Deficit | 670 | $0 |
| Wage / Income Gap (%) | 2,759 | 4.12% |
| Wage / Income Gap ($) | 2,759 | 95.88¢ per $1 |
| Gini / Inequality Index | 2,759 | 0.43 |
Earnings by Sex in Morton borough
Average Earnings in Morton borough are $43,917, $43,281 for men and $45,139 for women, a difference of 4.1%.
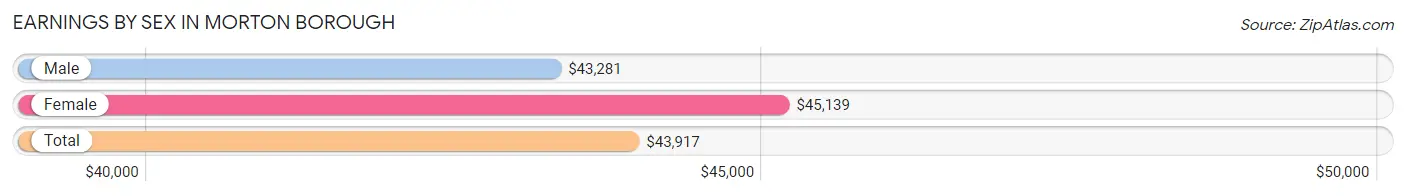
| Sex | Number | Average Earnings |
| Male | 834 (51.6%) | $43,281 |
| Female | 783 (48.4%) | $45,139 |
| Total | 1,617 (100.0%) | $43,917 |
Earnings by Sex by Income Bracket in Morton borough
The most common earnings brackets in Morton borough are $100,000+ for men (185 | 22.2%) and $100,000+ for women (147 | 18.8%).
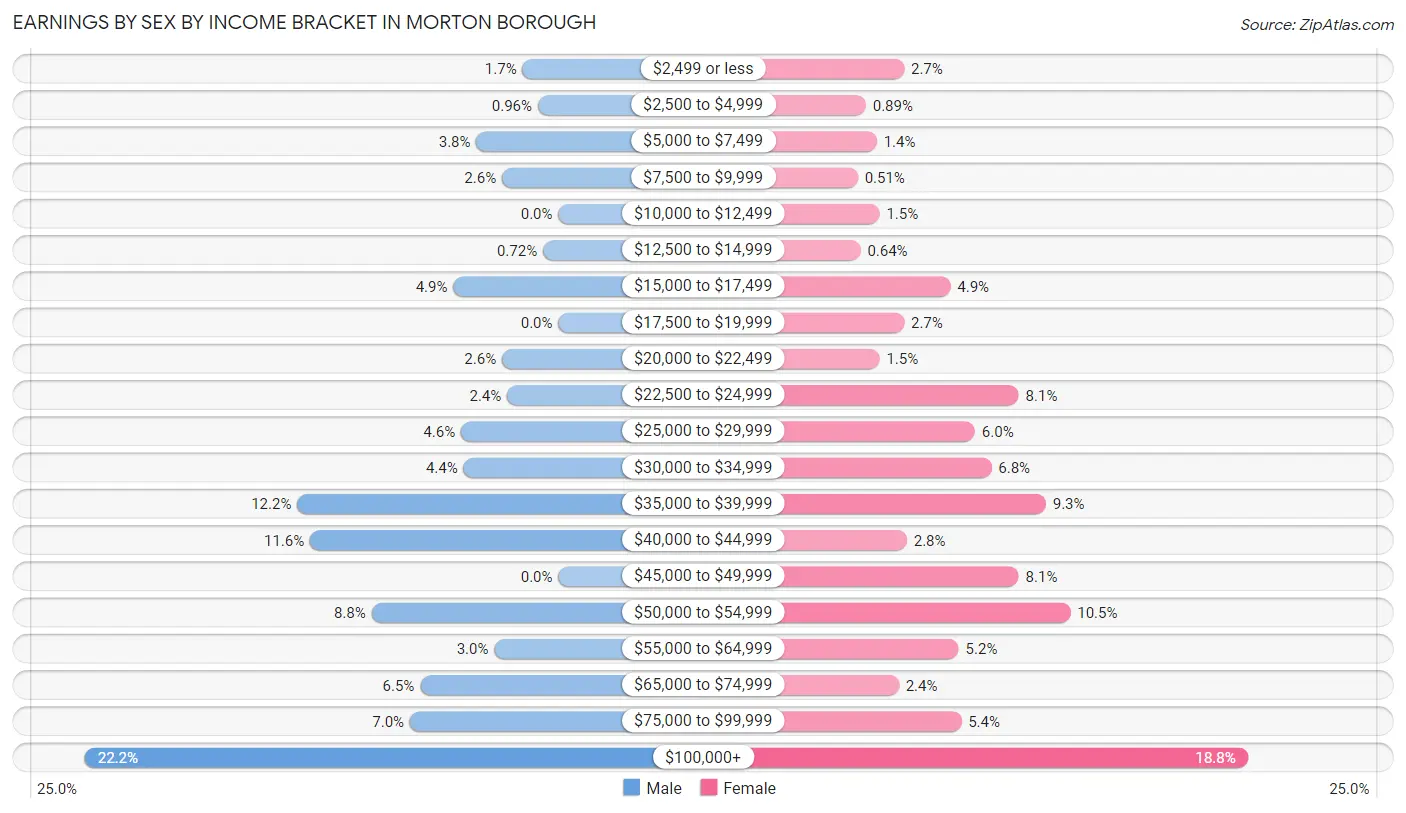
| Income | Male | Female |
| $2,499 or less | 14 (1.7%) | 21 (2.7%) |
| $2,500 to $4,999 | 8 (1.0%) | 7 (0.9%) |
| $5,000 to $7,499 | 32 (3.8%) | 11 (1.4%) |
| $7,500 to $9,999 | 22 (2.6%) | 4 (0.5%) |
| $10,000 to $12,499 | 0 (0.0%) | 12 (1.5%) |
| $12,500 to $14,999 | 6 (0.7%) | 5 (0.6%) |
| $15,000 to $17,499 | 41 (4.9%) | 38 (4.9%) |
| $17,500 to $19,999 | 0 (0.0%) | 21 (2.7%) |
| $20,000 to $22,499 | 22 (2.6%) | 12 (1.5%) |
| $22,500 to $24,999 | 20 (2.4%) | 63 (8.1%) |
| $25,000 to $29,999 | 38 (4.6%) | 47 (6.0%) |
| $30,000 to $34,999 | 37 (4.4%) | 53 (6.8%) |
| $35,000 to $39,999 | 102 (12.2%) | 73 (9.3%) |
| $40,000 to $44,999 | 97 (11.6%) | 22 (2.8%) |
| $45,000 to $49,999 | 0 (0.0%) | 63 (8.1%) |
| $50,000 to $54,999 | 73 (8.7%) | 82 (10.5%) |
| $55,000 to $64,999 | 25 (3.0%) | 41 (5.2%) |
| $65,000 to $74,999 | 54 (6.5%) | 19 (2.4%) |
| $75,000 to $99,999 | 58 (7.0%) | 42 (5.4%) |
| $100,000+ | 185 (22.2%) | 147 (18.8%) |
| Total | 834 (100.0%) | 783 (100.0%) |
Earnings by Sex by Educational Attainment in Morton borough
Average earnings in Morton borough are $50,938 for men and $47,028 for women, a difference of 7.7%. Men with an educational attainment of graduate degree enjoy the highest average annual earnings of $133,594, while those with less than high school education earn the least with $37,727. Women with an educational attainment of graduate degree earn the most with the average annual earnings of $125,265, while those with less than high school education have the smallest earnings of $23,605.
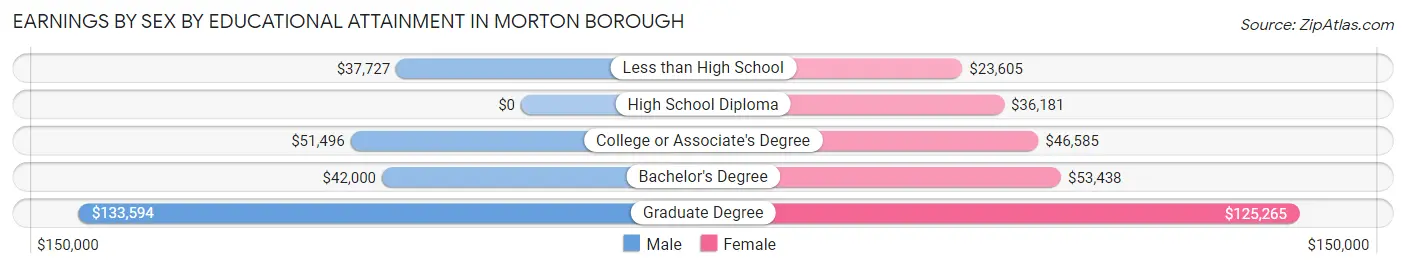
| Educational Attainment | Male Income | Female Income |
| Less than High School | $37,727 | $23,605 |
| High School Diploma | - | - |
| College or Associate's Degree | $51,496 | $46,585 |
| Bachelor's Degree | $42,000 | $53,438 |
| Graduate Degree | $133,594 | $125,265 |
| Total | $50,938 | $47,028 |
Family Income in Morton borough
Family Income Brackets in Morton borough
According to the Morton borough family income data, there are 179 families falling into the $100,000 to $149,999 income range, which is the most common income bracket and makes up 26.7% of all families.
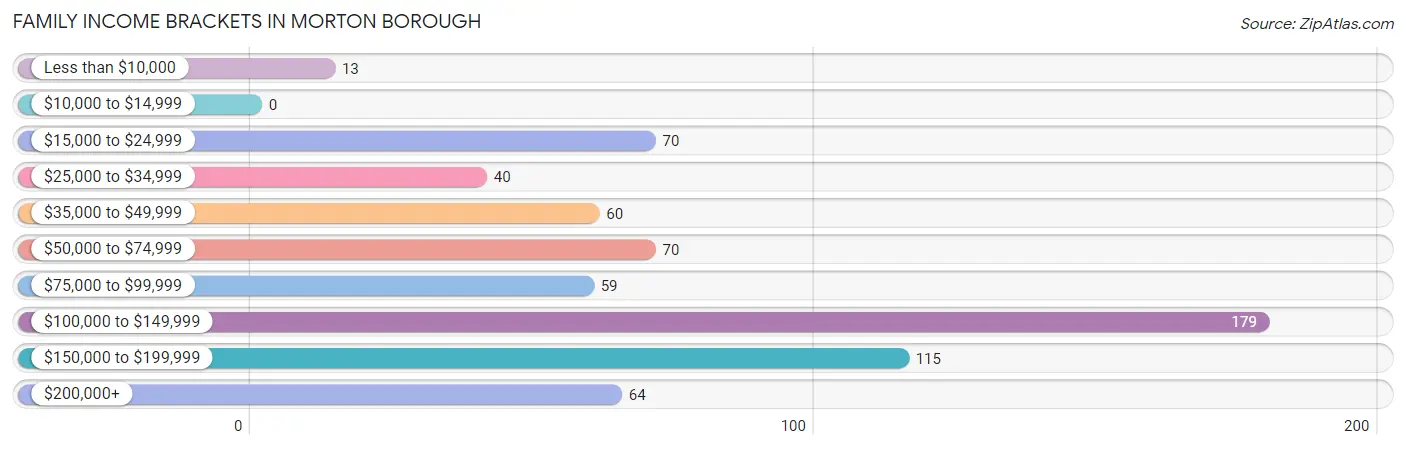
| Income Bracket | # Families | % Families |
| Less than $10,000 | 13 | 1.9% |
| $10,000 to $14,999 | 0 | 0.0% |
| $15,000 to $24,999 | 70 | 10.4% |
| $25,000 to $34,999 | 40 | 6.0% |
| $35,000 to $49,999 | 60 | 9.0% |
| $50,000 to $74,999 | 70 | 10.4% |
| $75,000 to $99,999 | 59 | 8.8% |
| $100,000 to $149,999 | 179 | 26.7% |
| $150,000 to $199,999 | 115 | 17.2% |
| $200,000+ | 64 | 9.6% |
Family Income by Famaliy Size in Morton borough
3-person families (269 | 40.2%) account for the highest median family income in Morton borough with $128,194 per family, while 2-person families (246 | 36.7%) have the highest median income of $44,125 per family member.
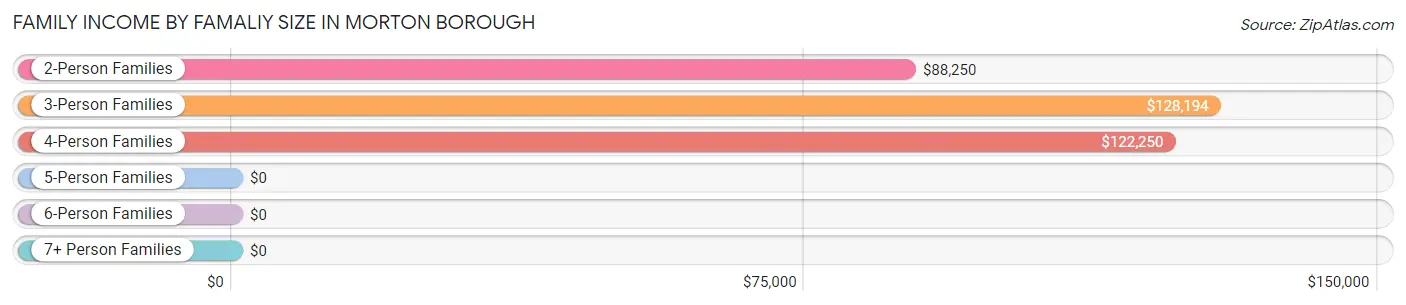
| Income Bracket | # Families | Median Income |
| 2-Person Families | 246 (36.7%) | $88,250 |
| 3-Person Families | 269 (40.2%) | $128,194 |
| 4-Person Families | 121 (18.1%) | $122,250 |
| 5-Person Families | 34 (5.1%) | $0 |
| 6-Person Families | 0 (0.0%) | $0 |
| 7+ Person Families | 0 (0.0%) | $0 |
| Total | 670 (100.0%) | $103,000 |
Family Income by Number of Earners in Morton borough
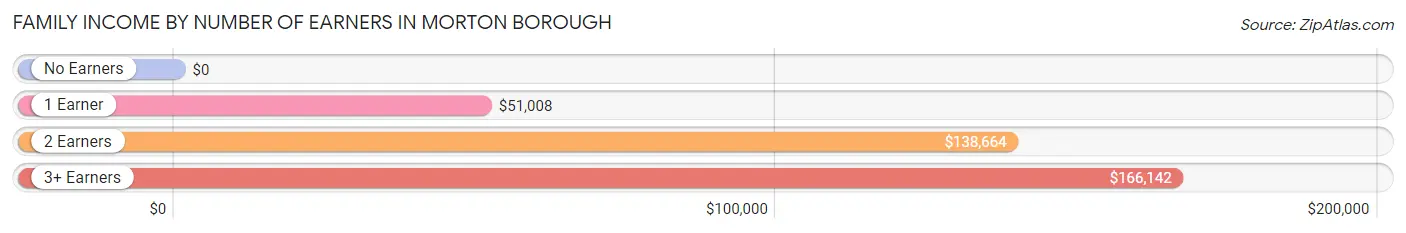
| Number of Earners | # Families | Median Income |
| No Earners | 51 (7.6%) | $0 |
| 1 Earner | 283 (42.2%) | $51,008 |
| 2 Earners | 261 (39.0%) | $138,664 |
| 3+ Earners | 75 (11.2%) | $166,142 |
| Total | 670 (100.0%) | $103,000 |
Household Income in Morton borough
Household Income Brackets in Morton borough
With 230 households falling in the category, the $50,000 to $74,999 income range is the most frequent in Morton borough, accounting for 18.1% of all households. In contrast, only 6 households (0.5%) fall into the $10,000 to $14,999 income bracket, making it the least populous group.
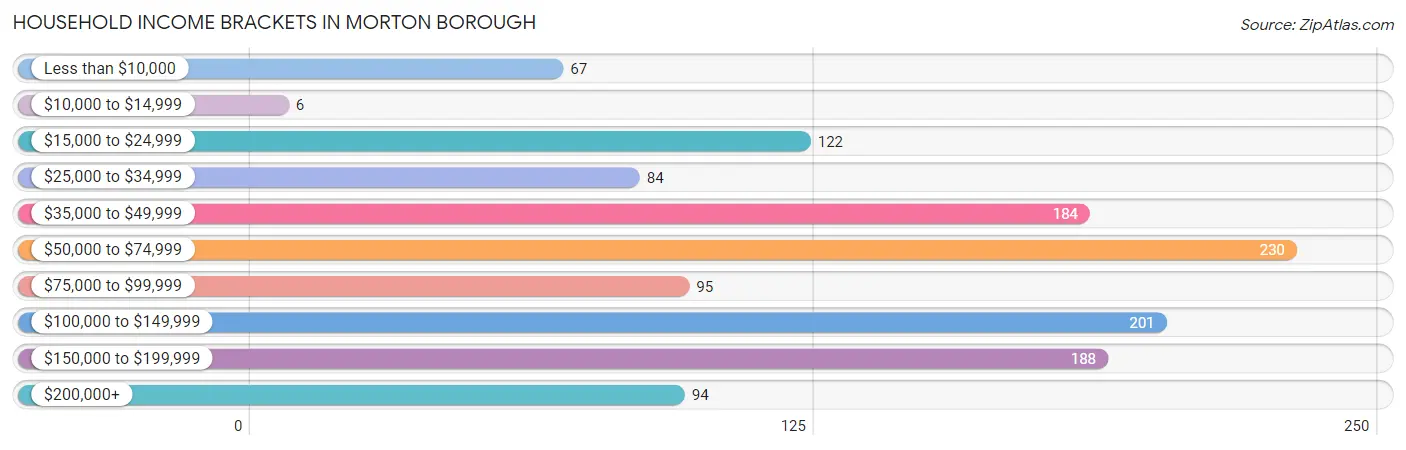
| Income Bracket | # Households | % Households |
| Less than $10,000 | 67 | 5.3% |
| $10,000 to $14,999 | 6 | 0.5% |
| $15,000 to $24,999 | 122 | 9.6% |
| $25,000 to $34,999 | 84 | 6.6% |
| $35,000 to $49,999 | 184 | 14.5% |
| $50,000 to $74,999 | 230 | 18.1% |
| $75,000 to $99,999 | 95 | 7.5% |
| $100,000 to $149,999 | 201 | 15.8% |
| $150,000 to $199,999 | 188 | 14.8% |
| $200,000+ | 94 | 7.4% |
Household Income by Householder Age in Morton borough
The median household income in Morton borough is $63,599, with the highest median household income of $92,500 found in the 45 to 64 years age bracket for the primary householder. A total of 404 households (31.8%) fall into this category. Meanwhile, the 15 to 24 years age bracket for the primary householder has the lowest median household income of $36,483, with 51 households (4.0%) in this group.

| Income Bracket | # Households | Median Income |
| 15 to 24 Years | 51 (4.0%) | $36,483 |
| 25 to 44 Years | 454 (35.7%) | $84,405 |
| 45 to 64 Years | 404 (31.8%) | $92,500 |
| 65+ Years | 362 (28.5%) | $49,688 |
| Total | 1,271 (100.0%) | $63,599 |
Poverty in Morton borough
Income Below Poverty by Sex and Age in Morton borough
With 6.5% poverty level for males and 7.7% for females among the residents of Morton borough, 5 year old males and 16 and 17 year old females are the most vulnerable to poverty, with 6 males (50.0%) and 7 females (100.0%) in their respective age groups living below the poverty level.
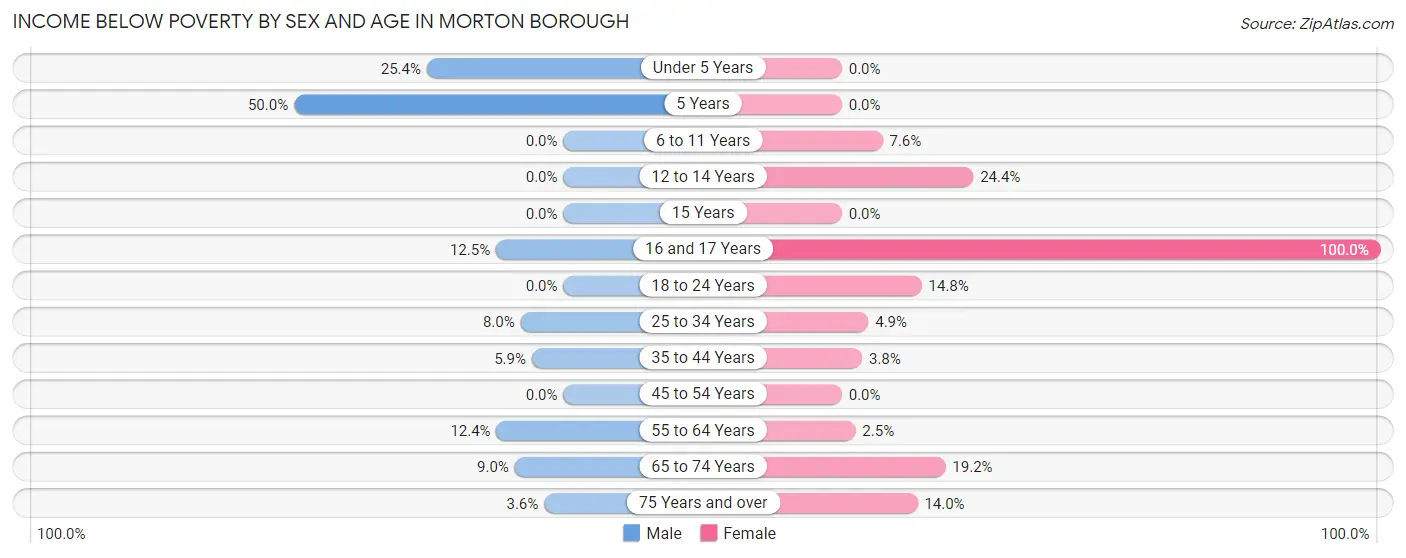
| Age Bracket | Male | Female |
| Under 5 Years | 18 (25.4%) | 0 (0.0%) |
| 5 Years | 6 (50.0%) | 0 (0.0%) |
| 6 to 11 Years | 0 (0.0%) | 9 (7.6%) |
| 12 to 14 Years | 0 (0.0%) | 10 (24.4%) |
| 15 Years | 0 (0.0%) | 0 (0.0%) |
| 16 and 17 Years | 6 (12.5%) | 7 (100.0%) |
| 18 to 24 Years | 0 (0.0%) | 12 (14.8%) |
| 25 to 34 Years | 14 (8.0%) | 6 (4.9%) |
| 35 to 44 Years | 12 (5.9%) | 10 (3.8%) |
| 45 to 54 Years | 0 (0.0%) | 0 (0.0%) |
| 55 to 64 Years | 20 (12.4%) | 6 (2.5%) |
| 65 to 74 Years | 15 (9.0%) | 25 (19.2%) |
| 75 Years and over | 2 (3.6%) | 16 (14.0%) |
| Total | 93 (6.5%) | 101 (7.7%) |
Income Above Poverty by Sex and Age in Morton borough
According to the poverty statistics in Morton borough, males aged 6 to 11 years and females aged under 5 years are the age groups that are most secure financially, with 100.0% of males and 100.0% of females in these age groups living above the poverty line.
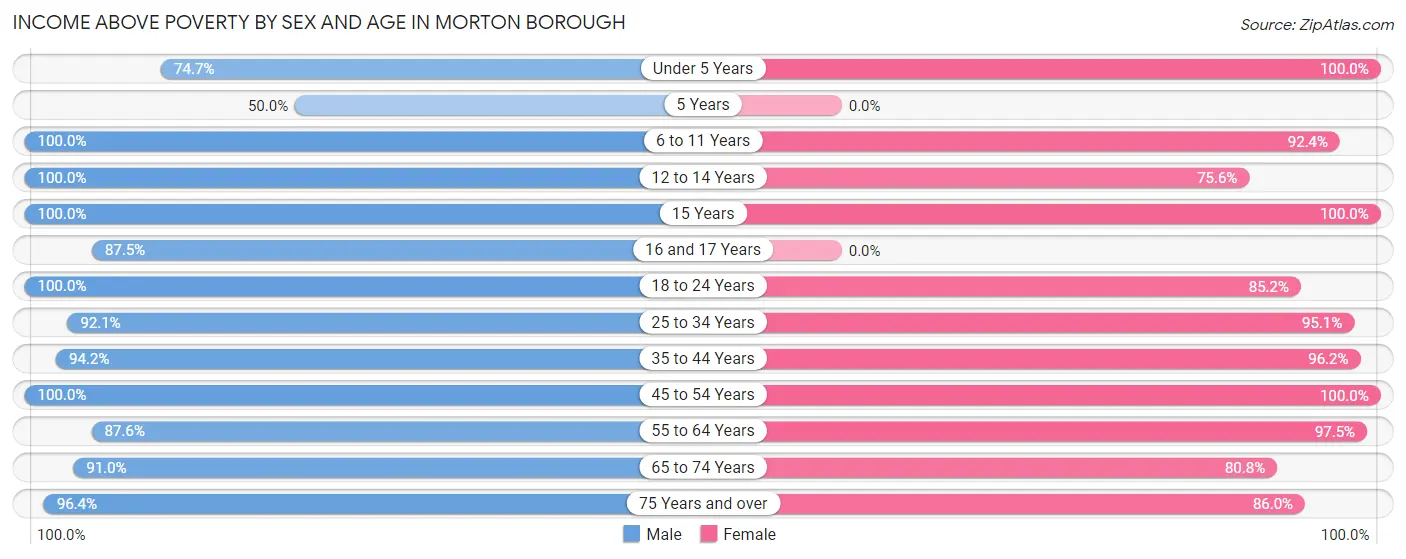
| Age Bracket | Male | Female |
| Under 5 Years | 53 (74.7%) | 45 (100.0%) |
| 5 Years | 6 (50.0%) | 0 (0.0%) |
| 6 to 11 Years | 124 (100.0%) | 110 (92.4%) |
| 12 to 14 Years | 50 (100.0%) | 31 (75.6%) |
| 15 Years | 11 (100.0%) | 9 (100.0%) |
| 16 and 17 Years | 42 (87.5%) | 0 (0.0%) |
| 18 to 24 Years | 166 (100.0%) | 69 (85.2%) |
| 25 to 34 Years | 162 (92.0%) | 116 (95.1%) |
| 35 to 44 Years | 193 (94.2%) | 256 (96.2%) |
| 45 to 54 Years | 189 (100.0%) | 141 (100.0%) |
| 55 to 64 Years | 141 (87.6%) | 231 (97.5%) |
| 65 to 74 Years | 151 (91.0%) | 105 (80.8%) |
| 75 Years and over | 54 (96.4%) | 98 (86.0%) |
| Total | 1,342 (93.5%) | 1,211 (92.3%) |
Income Below Poverty Among Married-Couple Families in Morton borough
The poverty statistics for married-couple families in Morton borough show that 7.5% or 32 of the total 428 families live below the poverty line. Families with 3 or 4 children have the highest poverty rate of 48.3%, comprising of 14 families. On the other hand, families with no children have the lowest poverty rate of 4.4%, which includes 13 families.
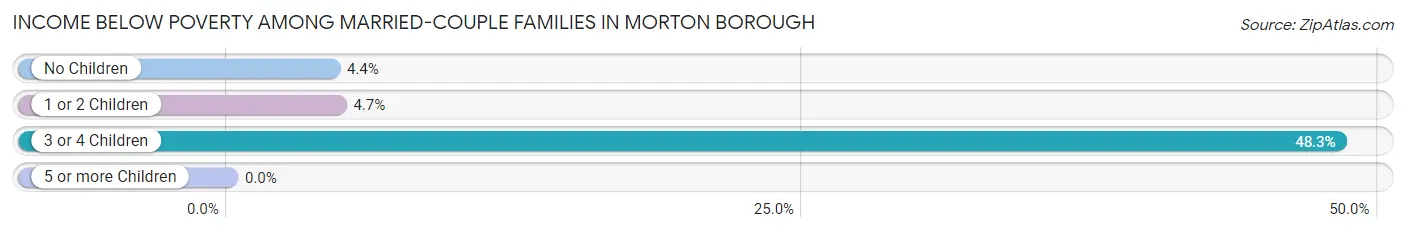
| Children | Above Poverty | Below Poverty |
| No Children | 280 (95.6%) | 13 (4.4%) |
| 1 or 2 Children | 101 (95.3%) | 5 (4.7%) |
| 3 or 4 Children | 15 (51.7%) | 14 (48.3%) |
| 5 or more Children | 0 (0.0%) | 0 (0.0%) |
| Total | 396 (92.5%) | 32 (7.5%) |
Income Below Poverty Among Single-Parent Households in Morton borough
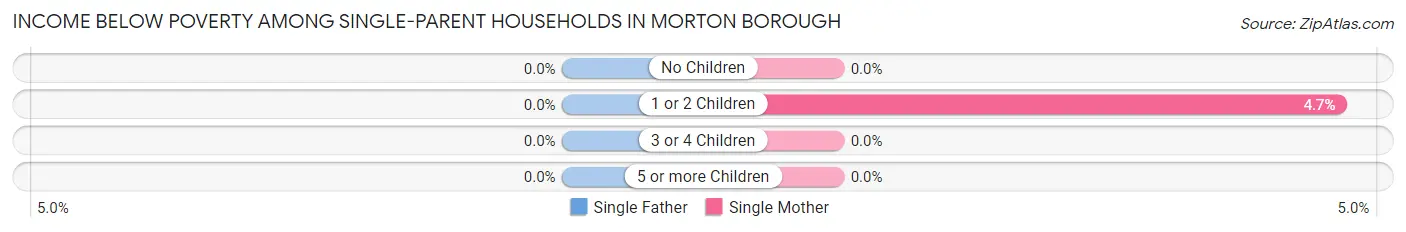
| Children | Single Father | Single Mother |
| No Children | 0 (0.0%) | 0 (0.0%) |
| 1 or 2 Children | 0 (0.0%) | 6 (4.7%) |
| 3 or 4 Children | 0 (0.0%) | 0 (0.0%) |
| 5 or more Children | 0 (0.0%) | 0 (0.0%) |
| Total | 0 (0.0%) | 6 (3.0%) |
Income Below Poverty Among Married-Couple vs Single-Parent Households in Morton borough
The poverty data for Morton borough shows that 32 of the married-couple family households (7.5%) and 6 of the single-parent households (2.5%) are living below the poverty level. Within the married-couple family households, those with 3 or 4 children have the highest poverty rate, with 14 households (48.3%) falling below the poverty line. Among the single-parent households, those with 1 or 2 children have the highest poverty rate, with 6 household (3.8%) living below poverty.
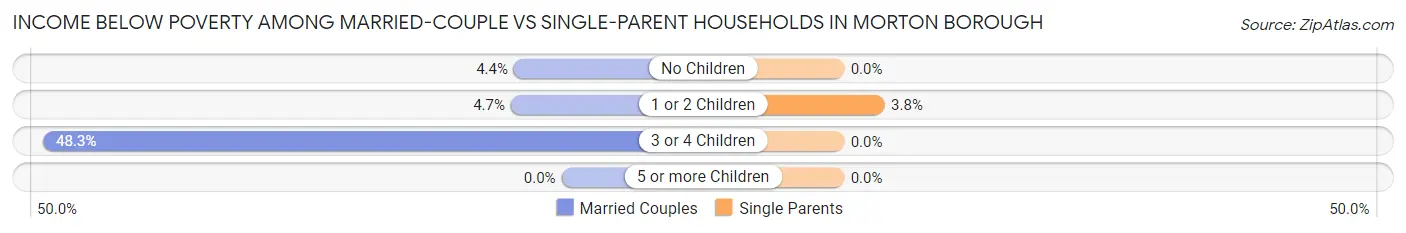
| Children | Married-Couple Families | Single-Parent Households |
| No Children | 13 (4.4%) | 0 (0.0%) |
| 1 or 2 Children | 5 (4.7%) | 6 (3.8%) |
| 3 or 4 Children | 14 (48.3%) | 0 (0.0%) |
| 5 or more Children | 0 (0.0%) | 0 (0.0%) |
| Total | 32 (7.5%) | 6 (2.5%) |
Employment Characteristics in Morton borough
Employment by Class of Employer in Morton borough
Among the 1,481 employed individuals in Morton borough, private company employees (964 | 65.1%), not-for-profit organizations (285 | 19.2%), and local government employees (129 | 8.7%) make up the most common classes of employment.
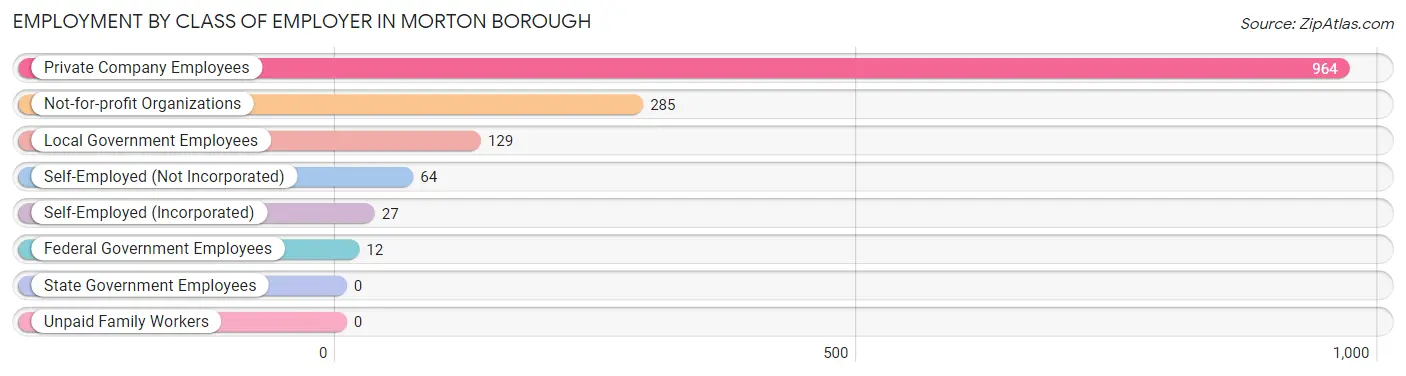
| Employer Class | # Employees | % Employees |
| Private Company Employees | 964 | 65.1% |
| Self-Employed (Incorporated) | 27 | 1.8% |
| Self-Employed (Not Incorporated) | 64 | 4.3% |
| Not-for-profit Organizations | 285 | 19.2% |
| Local Government Employees | 129 | 8.7% |
| State Government Employees | 0 | 0.0% |
| Federal Government Employees | 12 | 0.8% |
| Unpaid Family Workers | 0 | 0.0% |
| Total | 1,481 | 100.0% |
Employment Status by Age in Morton borough
According to the labor force statistics for Morton borough, out of the total population over 16 years of age (2,265), 70.3% or 1,592 individuals are in the labor force, with 5.2% or 83 of them unemployed. The age group with the highest labor force participation rate is 25 to 29 years, with 100.0% or 180 individuals in the labor force. Within the labor force, the 65 to 74 years age range has the highest percentage of unemployed individuals, with 12.3% or 15 of them being unemployed.
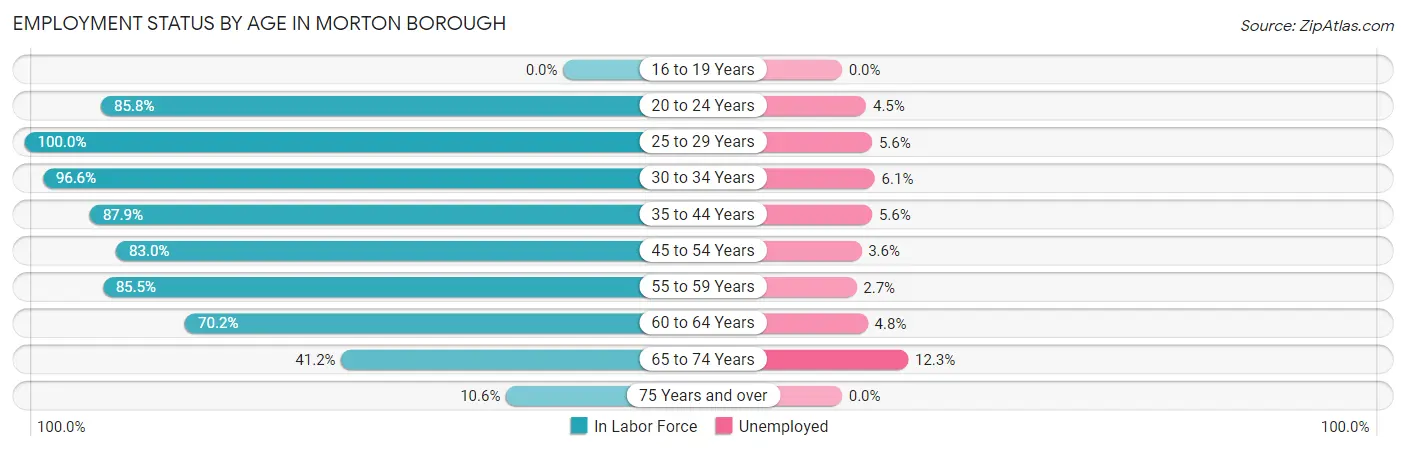
| Age Bracket | In Labor Force | Unemployed |
| 16 to 19 Years | 0 (0.0%) | 0 (0.0%) |
| 20 to 24 Years | 157 (85.8%) | 7 (4.5%) |
| 25 to 29 Years | 180 (100.0%) | 10 (5.6%) |
| 30 to 34 Years | 114 (96.6%) | 7 (6.1%) |
| 35 to 44 Years | 414 (87.9%) | 23 (5.6%) |
| 45 to 54 Years | 274 (83.0%) | 10 (3.6%) |
| 55 to 59 Years | 188 (85.5%) | 5 (2.7%) |
| 60 to 64 Years | 125 (70.2%) | 6 (4.8%) |
| 65 to 74 Years | 122 (41.2%) | 15 (12.3%) |
| 75 Years and over | 18 (10.6%) | 0 (0.0%) |
| Total | 1,592 (70.3%) | 83 (5.2%) |
Employment Status by Educational Attainment in Morton borough
According to labor force statistics for Morton borough, 86.5% of individuals (1,295) out of the total population between 25 and 64 years of age (1,497) are in the labor force, with 4.7% or 61 of them being unemployed. The group with the highest labor force participation rate are those with the educational attainment of high school diploma, with 89.2% or 282 individuals in the labor force. Within the labor force, individuals with high school diploma education have the highest percentage of unemployment, with 19.9% or 56 of them being unemployed.
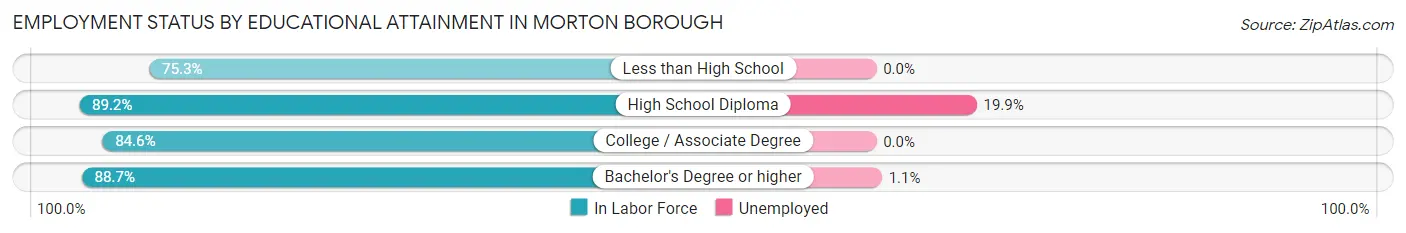
| Educational Attainment | In Labor Force | Unemployed |
| Less than High School | 64 (75.3%) | 0 (0.0%) |
| High School Diploma | 282 (89.2%) | 63 (19.9%) |
| College / Associate Degree | 477 (84.6%) | 0 (0.0%) |
| Bachelor's Degree or higher | 472 (88.7%) | 6 (1.1%) |
| Total | 1,295 (86.5%) | 70 (4.7%) |
Employment Occupations by Sex in Morton borough
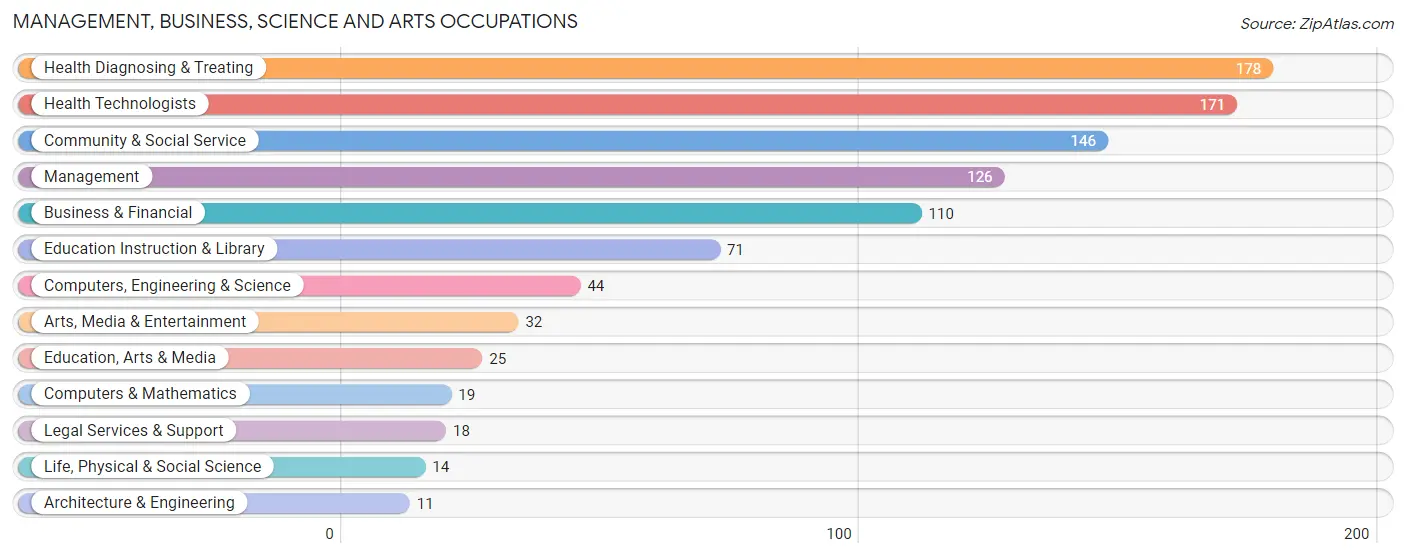
Management, Business, Science and Arts Occupations
The most common Management, Business, Science and Arts occupations in Morton borough are Health Diagnosing & Treating (178 | 11.8%), Health Technologists (171 | 11.3%), Community & Social Service (146 | 9.7%), Management (126 | 8.4%), and Business & Financial (110 | 7.3%).
Management, Business, Science and Arts Occupations by Sex
Within the Management, Business, Science and Arts occupations in Morton borough, the most male-oriented occupations are Architecture & Engineering (100.0%), Life, Physical & Social Science (57.1%), and Computers, Engineering & Science (56.8%), while the most female-oriented occupations are Education, Arts & Media (100.0%), Legal Services & Support (100.0%), and Community & Social Service (80.8%).
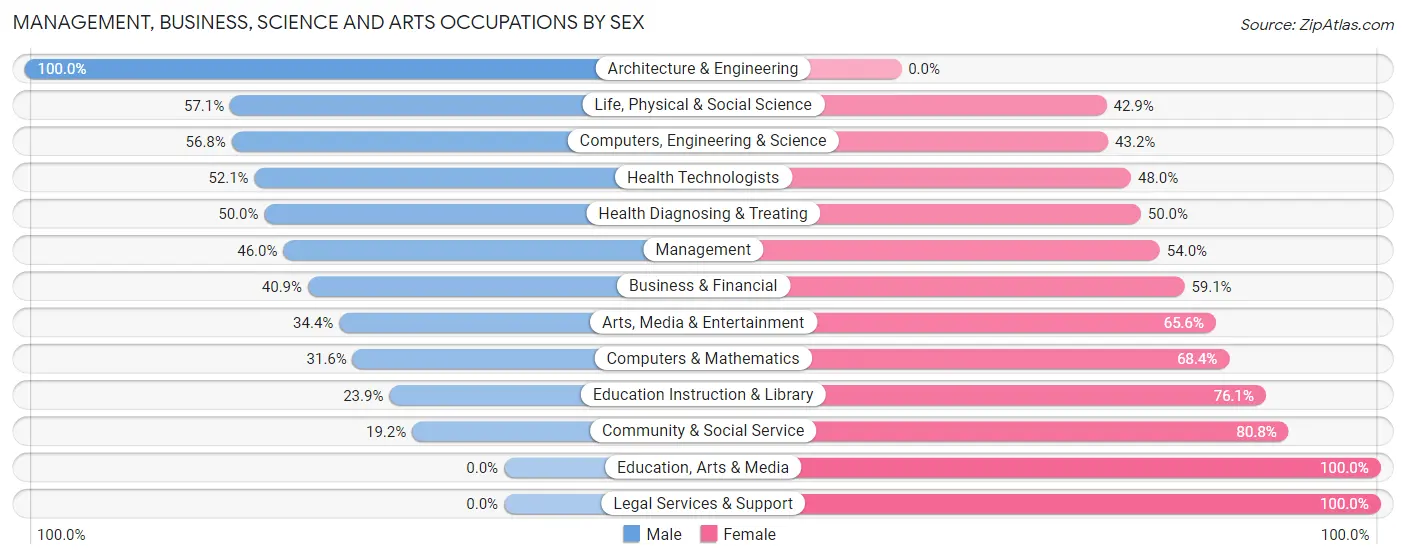
| Occupation | Male | Female |
| Management | 58 (46.0%) | 68 (54.0%) |
| Business & Financial | 45 (40.9%) | 65 (59.1%) |
| Computers, Engineering & Science | 25 (56.8%) | 19 (43.2%) |
| Computers & Mathematics | 6 (31.6%) | 13 (68.4%) |
| Architecture & Engineering | 11 (100.0%) | 0 (0.0%) |
| Life, Physical & Social Science | 8 (57.1%) | 6 (42.9%) |
| Community & Social Service | 28 (19.2%) | 118 (80.8%) |
| Education, Arts & Media | 0 (0.0%) | 25 (100.0%) |
| Legal Services & Support | 0 (0.0%) | 18 (100.0%) |
| Education Instruction & Library | 17 (23.9%) | 54 (76.1%) |
| Arts, Media & Entertainment | 11 (34.4%) | 21 (65.6%) |
| Health Diagnosing & Treating | 89 (50.0%) | 89 (50.0%) |
| Health Technologists | 89 (52.0%) | 82 (47.9%) |
| Total (Category) | 245 (40.6%) | 359 (59.4%) |
| Total (Overall) | 743 (49.2%) | 766 (50.8%) |
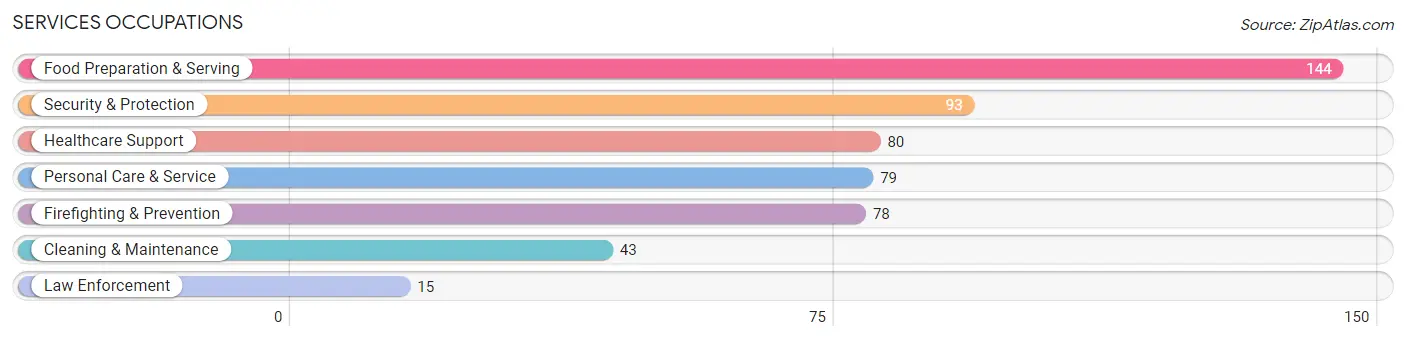
Services Occupations
The most common Services occupations in Morton borough are Food Preparation & Serving (144 | 9.5%), Security & Protection (93 | 6.2%), Healthcare Support (80 | 5.3%), Personal Care & Service (79 | 5.2%), and Firefighting & Prevention (78 | 5.2%).
Services Occupations by Sex
Within the Services occupations in Morton borough, the most male-oriented occupations are Law Enforcement (100.0%), Food Preparation & Serving (64.6%), and Healthcare Support (43.8%), while the most female-oriented occupations are Cleaning & Maintenance (100.0%), Firefighting & Prevention (69.2%), and Security & Protection (58.1%).
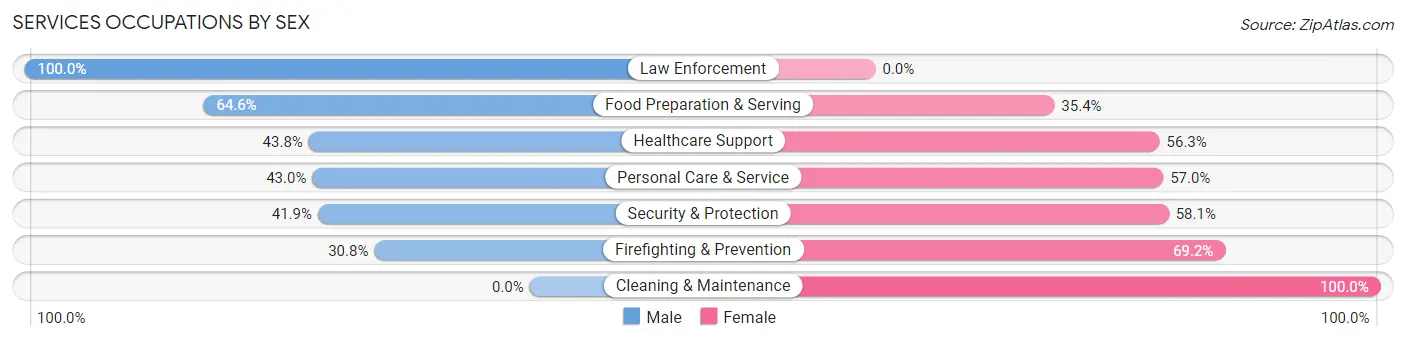
| Occupation | Male | Female |
| Healthcare Support | 35 (43.8%) | 45 (56.2%) |
| Security & Protection | 39 (41.9%) | 54 (58.1%) |
| Firefighting & Prevention | 24 (30.8%) | 54 (69.2%) |
| Law Enforcement | 15 (100.0%) | 0 (0.0%) |
| Food Preparation & Serving | 93 (64.6%) | 51 (35.4%) |
| Cleaning & Maintenance | 0 (0.0%) | 43 (100.0%) |
| Personal Care & Service | 34 (43.0%) | 45 (57.0%) |
| Total (Category) | 201 (45.8%) | 238 (54.2%) |
| Total (Overall) | 743 (49.2%) | 766 (50.8%) |
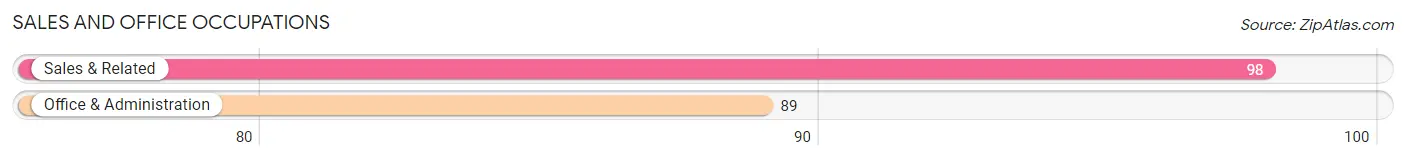
Sales and Office Occupations
The most common Sales and Office occupations in Morton borough are Sales & Related (98 | 6.5%), and Office & Administration (89 | 5.9%).
Sales and Office Occupations by Sex
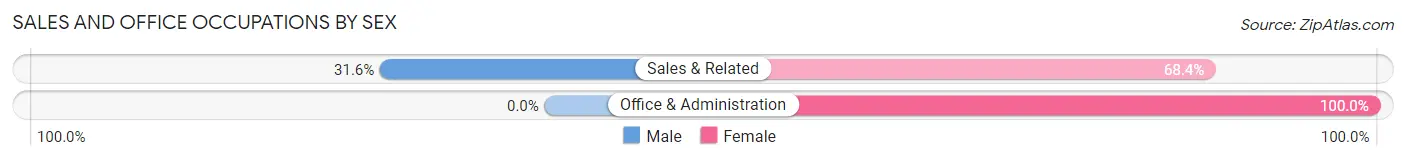
| Occupation | Male | Female |
| Sales & Related | 31 (31.6%) | 67 (68.4%) |
| Office & Administration | 0 (0.0%) | 89 (100.0%) |
| Total (Category) | 31 (16.6%) | 156 (83.4%) |
| Total (Overall) | 743 (49.2%) | 766 (50.8%) |
Natural Resources, Construction and Maintenance Occupations
The most common Natural Resources, Construction and Maintenance occupations in Morton borough are Construction & Extraction (98 | 6.5%), and Installation, Maintenance & Repair (23 | 1.5%).
Natural Resources, Construction and Maintenance Occupations by Sex
| Occupation | Male | Female |
| Farming, Fishing & Forestry | 0 (0.0%) | 0 (0.0%) |
| Construction & Extraction | 98 (100.0%) | 0 (0.0%) |
| Installation, Maintenance & Repair | 23 (100.0%) | 0 (0.0%) |
| Total (Category) | 121 (100.0%) | 0 (0.0%) |
| Total (Overall) | 743 (49.2%) | 766 (50.8%) |
Production, Transportation and Moving Occupations
The most common Production, Transportation and Moving occupations in Morton borough are Material Moving (62 | 4.1%), Production (50 | 3.3%), and Transportation (46 | 3.0%).
Production, Transportation and Moving Occupations by Sex
| Occupation | Male | Female |
| Production | 50 (100.0%) | 0 (0.0%) |
| Transportation | 33 (71.7%) | 13 (28.3%) |
| Material Moving | 62 (100.0%) | 0 (0.0%) |
| Total (Category) | 145 (91.8%) | 13 (8.2%) |
| Total (Overall) | 743 (49.2%) | 766 (50.8%) |
Employment Industries by Sex in Morton borough
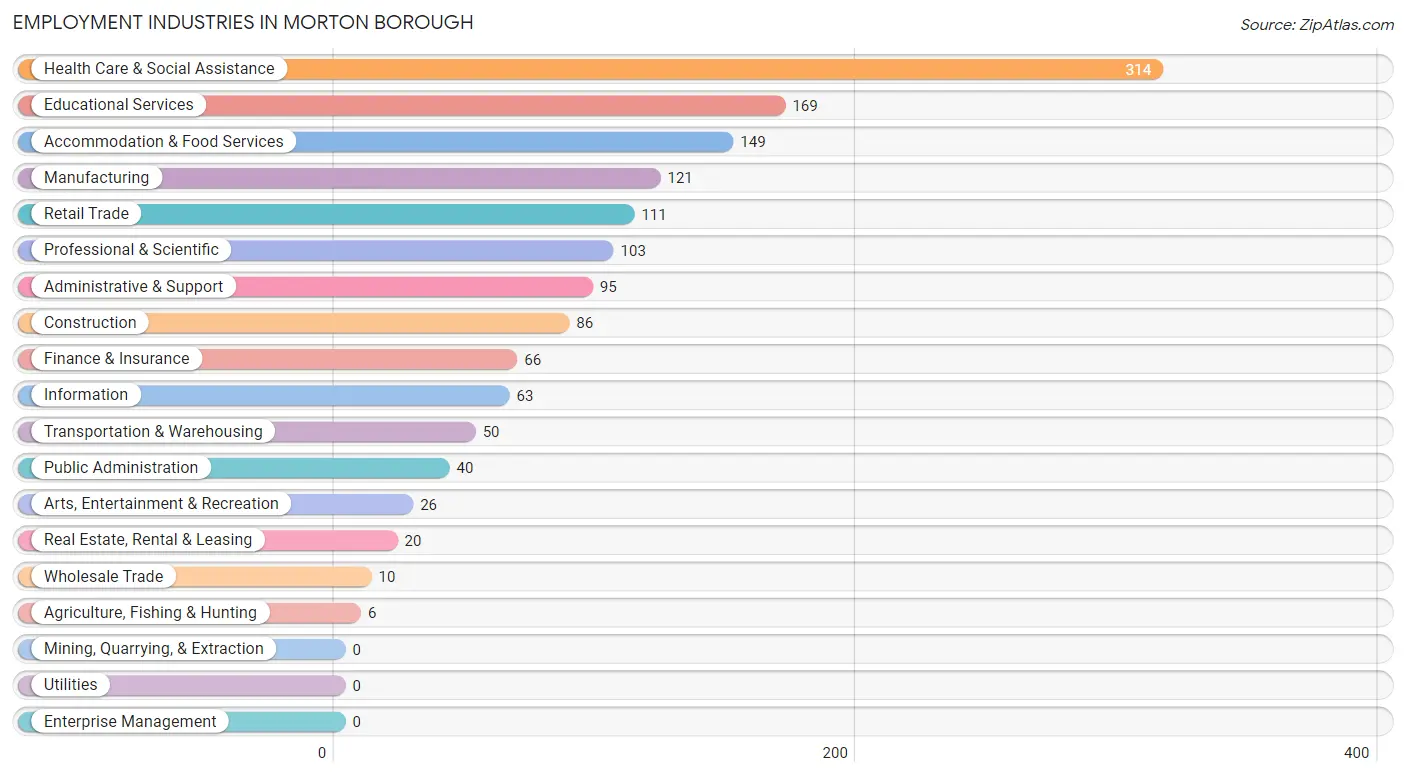
Employment Industries in Morton borough
The major employment industries in Morton borough include Health Care & Social Assistance (314 | 20.8%), Educational Services (169 | 11.2%), Accommodation & Food Services (149 | 9.9%), Manufacturing (121 | 8.0%), and Retail Trade (111 | 7.4%).
Employment Industries by Sex in Morton borough
The Morton borough industries that see more men than women are Agriculture, Fishing & Hunting (100.0%), Arts, Entertainment & Recreation (100.0%), and Manufacturing (88.4%), whereas the industries that tend to have a higher number of women are Wholesale Trade (100.0%), Educational Services (78.7%), and Professional & Scientific (72.8%).
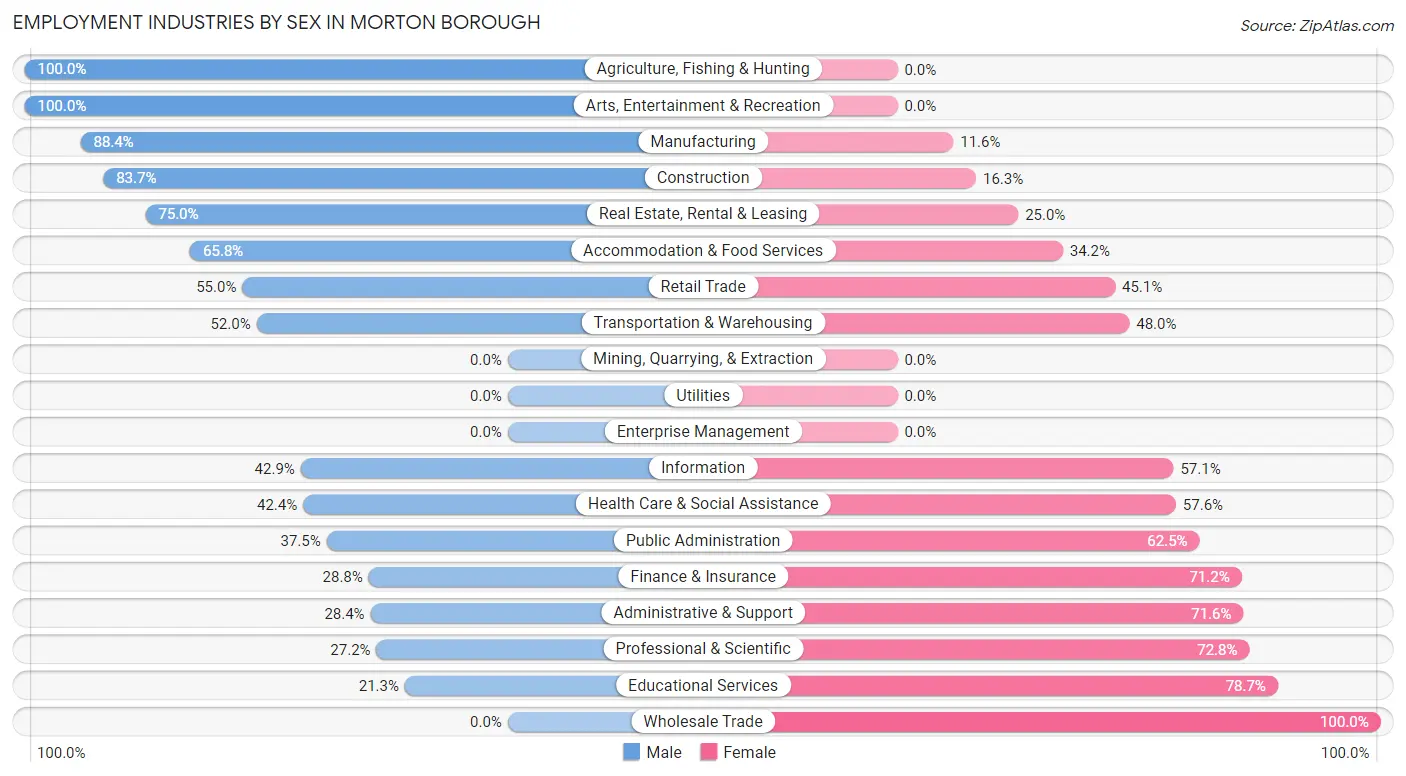
| Industry | Male | Female |
| Agriculture, Fishing & Hunting | 6 (100.0%) | 0 (0.0%) |
| Mining, Quarrying, & Extraction | 0 (0.0%) | 0 (0.0%) |
| Construction | 72 (83.7%) | 14 (16.3%) |
| Manufacturing | 107 (88.4%) | 14 (11.6%) |
| Wholesale Trade | 0 (0.0%) | 10 (100.0%) |
| Retail Trade | 61 (54.9%) | 50 (45.1%) |
| Transportation & Warehousing | 26 (52.0%) | 24 (48.0%) |
| Utilities | 0 (0.0%) | 0 (0.0%) |
| Information | 27 (42.9%) | 36 (57.1%) |
| Finance & Insurance | 19 (28.8%) | 47 (71.2%) |
| Real Estate, Rental & Leasing | 15 (75.0%) | 5 (25.0%) |
| Professional & Scientific | 28 (27.2%) | 75 (72.8%) |
| Enterprise Management | 0 (0.0%) | 0 (0.0%) |
| Administrative & Support | 27 (28.4%) | 68 (71.6%) |
| Educational Services | 36 (21.3%) | 133 (78.7%) |
| Health Care & Social Assistance | 133 (42.4%) | 181 (57.6%) |
| Arts, Entertainment & Recreation | 26 (100.0%) | 0 (0.0%) |
| Accommodation & Food Services | 98 (65.8%) | 51 (34.2%) |
| Public Administration | 15 (37.5%) | 25 (62.5%) |
| Total | 743 (49.2%) | 766 (50.8%) |
Education in Morton borough
School Enrollment in Morton borough
The most common levels of schooling among the 612 students in Morton borough are high school (176 | 28.8%), elementary school (168 | 27.5%), and middle school (135 | 22.1%).
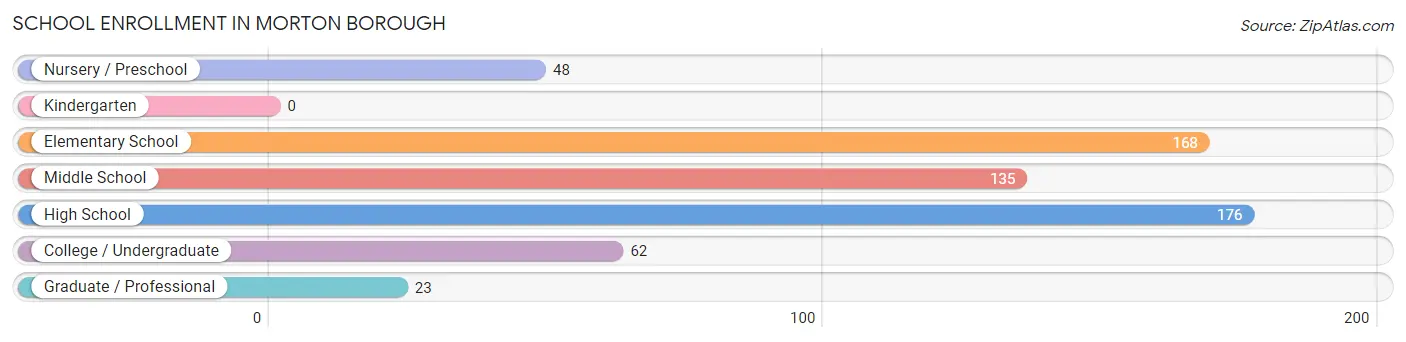
| School Level | # Students | % Students |
| Nursery / Preschool | 48 | 7.8% |
| Kindergarten | 0 | 0.0% |
| Elementary School | 168 | 27.5% |
| Middle School | 135 | 22.1% |
| High School | 176 | 28.8% |
| College / Undergraduate | 62 | 10.1% |
| Graduate / Professional | 23 | 3.8% |
| Total | 612 | 100.0% |
School Enrollment by Age by Funding Source in Morton borough
Out of a total of 612 students who are enrolled in schools in Morton borough, 132 (21.6%) attend a private institution, while the remaining 480 (78.4%) are enrolled in public schools. The age group of 20 to 24 year olds has the highest likelihood of being enrolled in private schools, with 13 (72.2% in the age bracket) enrolled. Conversely, the age group of 15 to 17 year olds has the lowest likelihood of being enrolled in a private school, with 75 (100.0% in the age bracket) attending a public institution.
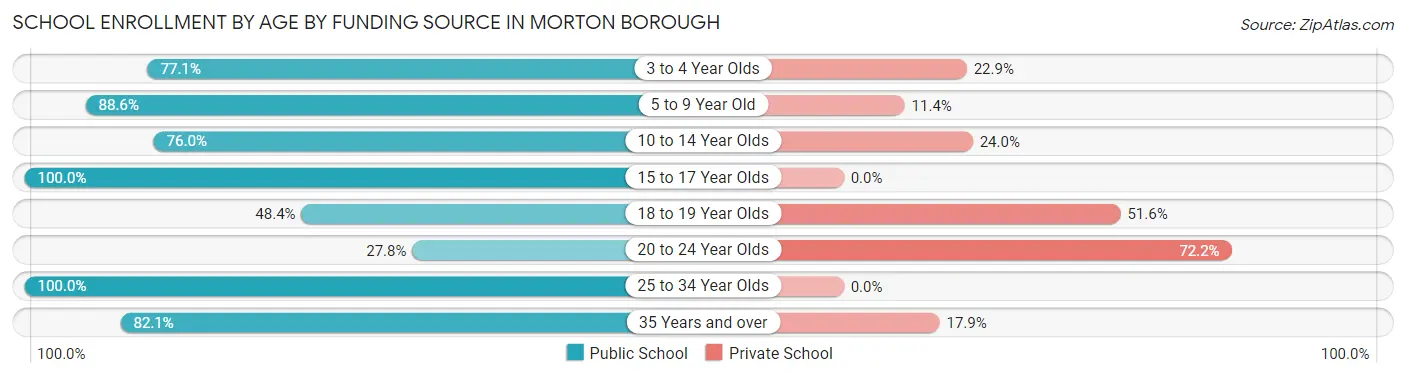
| Age Bracket | Public School | Private School |
| 3 to 4 Year Olds | 37 (77.1%) | 11 (22.9%) |
| 5 to 9 Year Old | 117 (88.6%) | 15 (11.4%) |
| 10 to 14 Year Olds | 158 (76.0%) | 50 (24.0%) |
| 15 to 17 Year Olds | 75 (100.0%) | 0 (0.0%) |
| 18 to 19 Year Olds | 31 (48.4%) | 33 (51.6%) |
| 20 to 24 Year Olds | 5 (27.8%) | 13 (72.2%) |
| 25 to 34 Year Olds | 11 (100.0%) | 0 (0.0%) |
| 35 Years and over | 46 (82.1%) | 10 (17.9%) |
| Total | 480 (78.4%) | 132 (21.6%) |
Educational Attainment by Field of Study in Morton borough
Science & technology (137 | 21.4%), business (88 | 13.8%), social sciences (82 | 12.8%), education (70 | 10.9%), and visual & performing arts (68 | 10.6%) are the most common fields of study among 640 individuals in Morton borough who have obtained a bachelor's degree or higher.
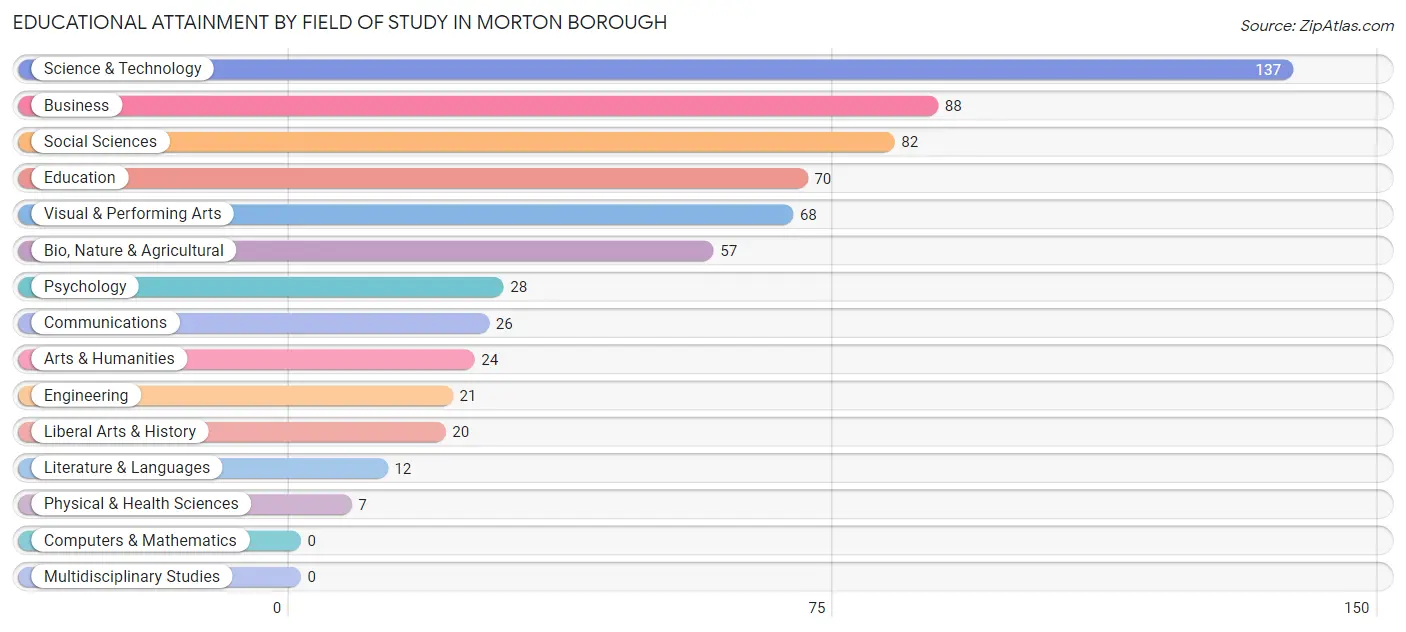
| Field of Study | # Graduates | % Graduates |
| Computers & Mathematics | 0 | 0.0% |
| Bio, Nature & Agricultural | 57 | 8.9% |
| Physical & Health Sciences | 7 | 1.1% |
| Psychology | 28 | 4.4% |
| Social Sciences | 82 | 12.8% |
| Engineering | 21 | 3.3% |
| Multidisciplinary Studies | 0 | 0.0% |
| Science & Technology | 137 | 21.4% |
| Business | 88 | 13.8% |
| Education | 70 | 10.9% |
| Literature & Languages | 12 | 1.9% |
| Liberal Arts & History | 20 | 3.1% |
| Visual & Performing Arts | 68 | 10.6% |
| Communications | 26 | 4.1% |
| Arts & Humanities | 24 | 3.7% |
| Total | 640 | 100.0% |
Transportation & Commute in Morton borough
Vehicle Availability by Sex in Morton borough
The most prevalent vehicle ownership categories in Morton borough are males with 2 vehicles (390, accounting for 54.1%) and females with 2 vehicles (272, making up 51.8%).
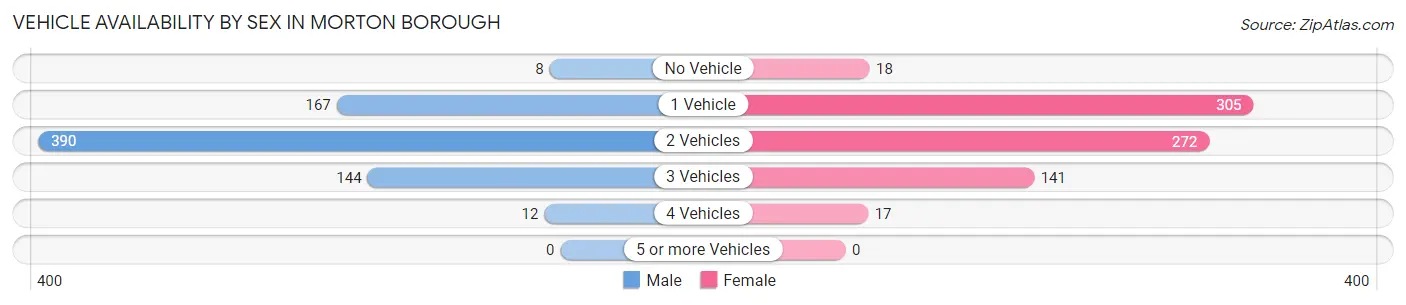
| Vehicles Available | Male | Female |
| No Vehicle | 8 (1.1%) | 18 (2.4%) |
| 1 Vehicle | 167 (23.2%) | 305 (40.5%) |
| 2 Vehicles | 390 (54.1%) | 272 (36.1%) |
| 3 Vehicles | 144 (20.0%) | 141 (18.7%) |
| 4 Vehicles | 12 (1.7%) | 17 (2.3%) |
| 5 or more Vehicles | 0 (0.0%) | 0 (0.0%) |
| Total | 721 (100.0%) | 753 (100.0%) |
Commute Time in Morton borough
The most frequently occuring commute durations in Morton borough are 45 to 59 minutes (289 commuters, 22.3%), 30 to 34 minutes (210 commuters, 16.2%), and 15 to 19 minutes (178 commuters, 13.7%).
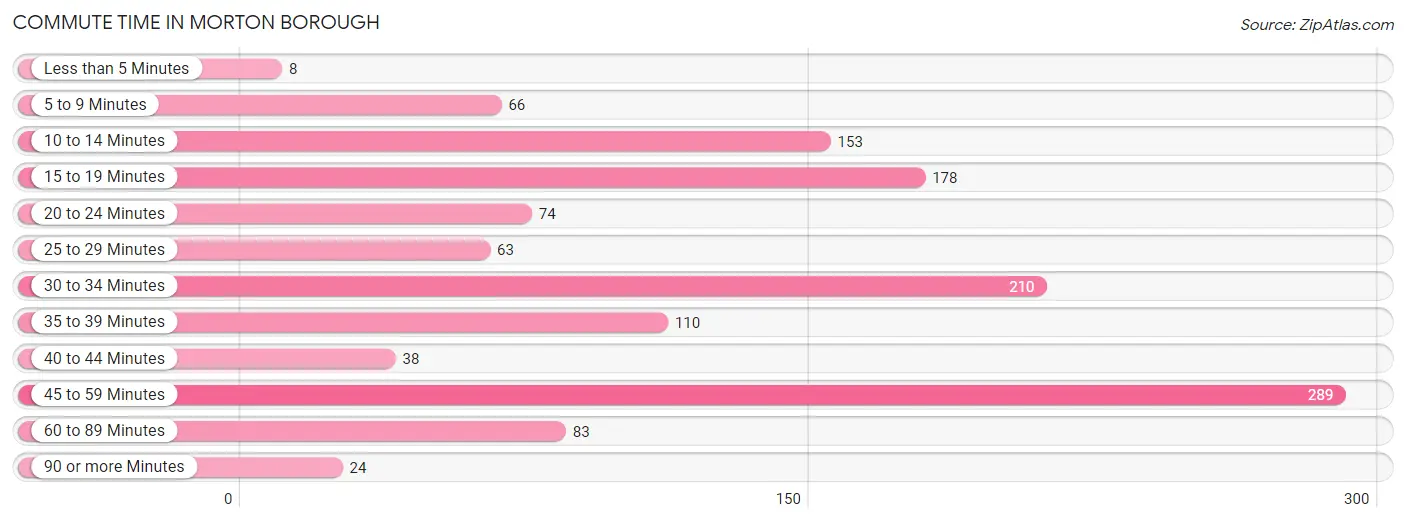
| Commute Time | # Commuters | % Commuters |
| Less than 5 Minutes | 8 | 0.6% |
| 5 to 9 Minutes | 66 | 5.1% |
| 10 to 14 Minutes | 153 | 11.8% |
| 15 to 19 Minutes | 178 | 13.7% |
| 20 to 24 Minutes | 74 | 5.7% |
| 25 to 29 Minutes | 63 | 4.9% |
| 30 to 34 Minutes | 210 | 16.2% |
| 35 to 39 Minutes | 110 | 8.5% |
| 40 to 44 Minutes | 38 | 2.9% |
| 45 to 59 Minutes | 289 | 22.3% |
| 60 to 89 Minutes | 83 | 6.4% |
| 90 or more Minutes | 24 | 1.8% |
Commute Time by Sex in Morton borough
The most common commute times in Morton borough are 45 to 59 minutes (175 commuters, 25.6%) for males and 10 to 14 minutes (135 commuters, 22.1%) for females.
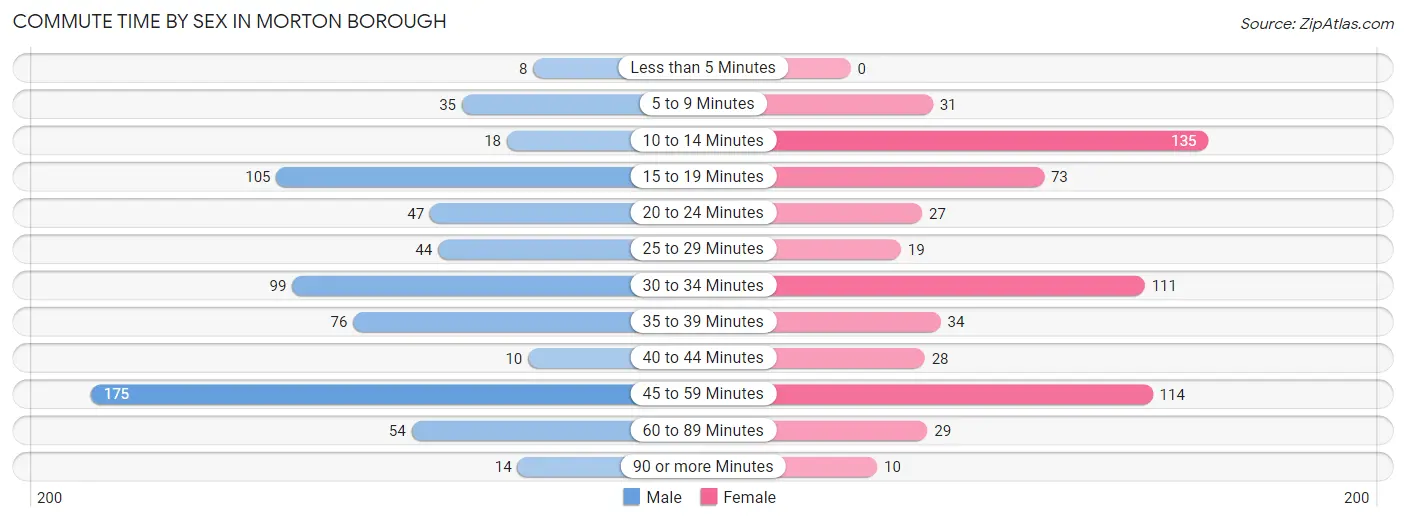
| Commute Time | Male | Female |
| Less than 5 Minutes | 8 (1.2%) | 0 (0.0%) |
| 5 to 9 Minutes | 35 (5.1%) | 31 (5.1%) |
| 10 to 14 Minutes | 18 (2.6%) | 135 (22.1%) |
| 15 to 19 Minutes | 105 (15.3%) | 73 (11.9%) |
| 20 to 24 Minutes | 47 (6.9%) | 27 (4.4%) |
| 25 to 29 Minutes | 44 (6.4%) | 19 (3.1%) |
| 30 to 34 Minutes | 99 (14.4%) | 111 (18.2%) |
| 35 to 39 Minutes | 76 (11.1%) | 34 (5.6%) |
| 40 to 44 Minutes | 10 (1.5%) | 28 (4.6%) |
| 45 to 59 Minutes | 175 (25.6%) | 114 (18.7%) |
| 60 to 89 Minutes | 54 (7.9%) | 29 (4.8%) |
| 90 or more Minutes | 14 (2.0%) | 10 (1.6%) |
Time of Departure to Work by Sex in Morton borough
The most frequent times of departure to work in Morton borough are 6:00 AM to 6:29 AM (162, 23.6%) for males and 8:00 AM to 8:29 AM (111, 18.2%) for females.
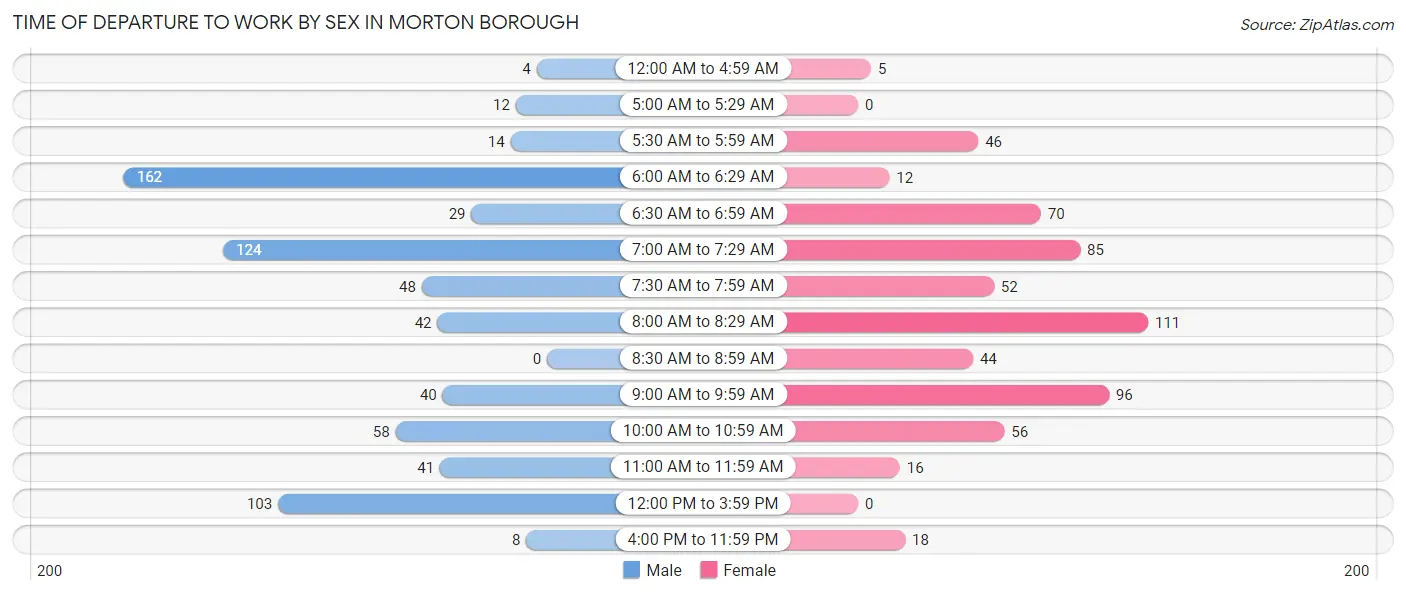
| Time of Departure | Male | Female |
| 12:00 AM to 4:59 AM | 4 (0.6%) | 5 (0.8%) |
| 5:00 AM to 5:29 AM | 12 (1.8%) | 0 (0.0%) |
| 5:30 AM to 5:59 AM | 14 (2.0%) | 46 (7.5%) |
| 6:00 AM to 6:29 AM | 162 (23.6%) | 12 (2.0%) |
| 6:30 AM to 6:59 AM | 29 (4.2%) | 70 (11.5%) |
| 7:00 AM to 7:29 AM | 124 (18.1%) | 85 (13.9%) |
| 7:30 AM to 7:59 AM | 48 (7.0%) | 52 (8.5%) |
| 8:00 AM to 8:29 AM | 42 (6.1%) | 111 (18.2%) |
| 8:30 AM to 8:59 AM | 0 (0.0%) | 44 (7.2%) |
| 9:00 AM to 9:59 AM | 40 (5.8%) | 96 (15.7%) |
| 10:00 AM to 10:59 AM | 58 (8.5%) | 56 (9.2%) |
| 11:00 AM to 11:59 AM | 41 (6.0%) | 16 (2.6%) |
| 12:00 PM to 3:59 PM | 103 (15.0%) | 0 (0.0%) |
| 4:00 PM to 11:59 PM | 8 (1.2%) | 18 (2.9%) |
| Total | 685 (100.0%) | 611 (100.0%) |
Housing Occupancy in Morton borough
Occupancy by Ownership in Morton borough
Of the total 1,271 dwellings in Morton borough, owner-occupied units account for 725 (57.0%), while renter-occupied units make up 546 (43.0%).
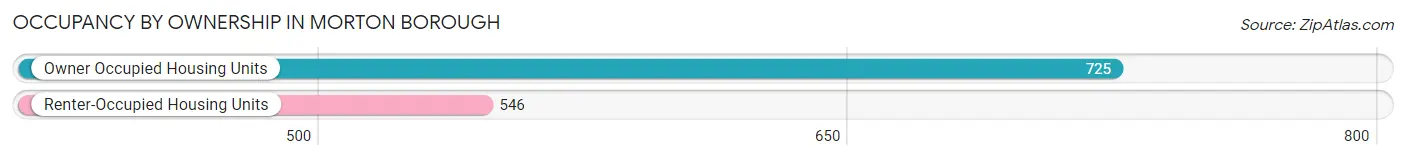
| Occupancy | # Housing Units | % Housing Units |
| Owner Occupied Housing Units | 725 | 57.0% |
| Renter-Occupied Housing Units | 546 | 43.0% |
| Total Occupied Housing Units | 1,271 | 100.0% |
Occupancy by Household Size in Morton borough
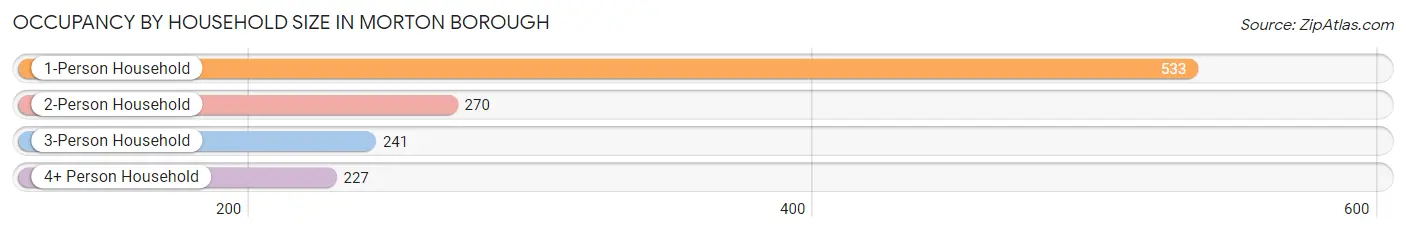
| Household Size | # Housing Units | % Housing Units |
| 1-Person Household | 533 | 41.9% |
| 2-Person Household | 270 | 21.2% |
| 3-Person Household | 241 | 19.0% |
| 4+ Person Household | 227 | 17.9% |
| Total Housing Units | 1,271 | 100.0% |
Occupancy by Ownership by Household Size in Morton borough
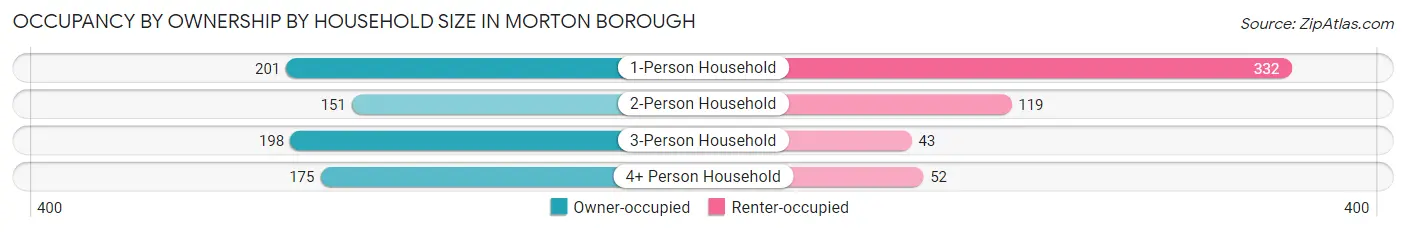
| Household Size | Owner-occupied | Renter-occupied |
| 1-Person Household | 201 (37.7%) | 332 (62.3%) |
| 2-Person Household | 151 (55.9%) | 119 (44.1%) |
| 3-Person Household | 198 (82.2%) | 43 (17.8%) |
| 4+ Person Household | 175 (77.1%) | 52 (22.9%) |
| Total Housing Units | 725 (57.0%) | 546 (43.0%) |
Occupancy by Educational Attainment in Morton borough
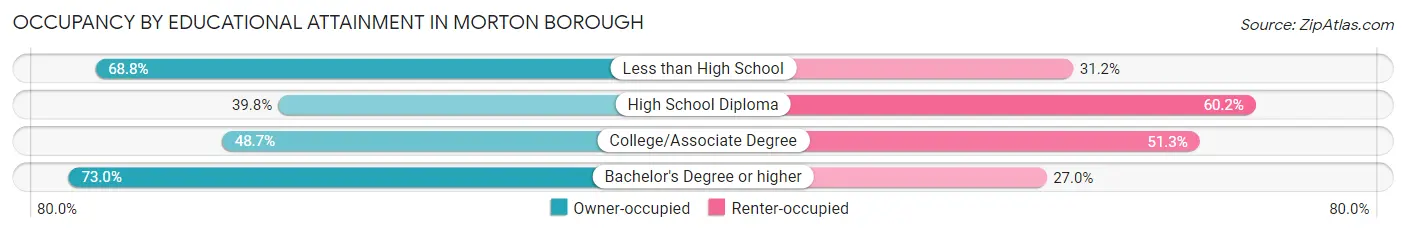
| Household Size | Owner-occupied | Renter-occupied |
| Less than High School | 86 (68.8%) | 39 (31.2%) |
| High School Diploma | 123 (39.8%) | 186 (60.2%) |
| College/Associate Degree | 191 (48.7%) | 201 (51.3%) |
| Bachelor's Degree or higher | 325 (73.0%) | 120 (27.0%) |
Occupancy by Age of Householder in Morton borough
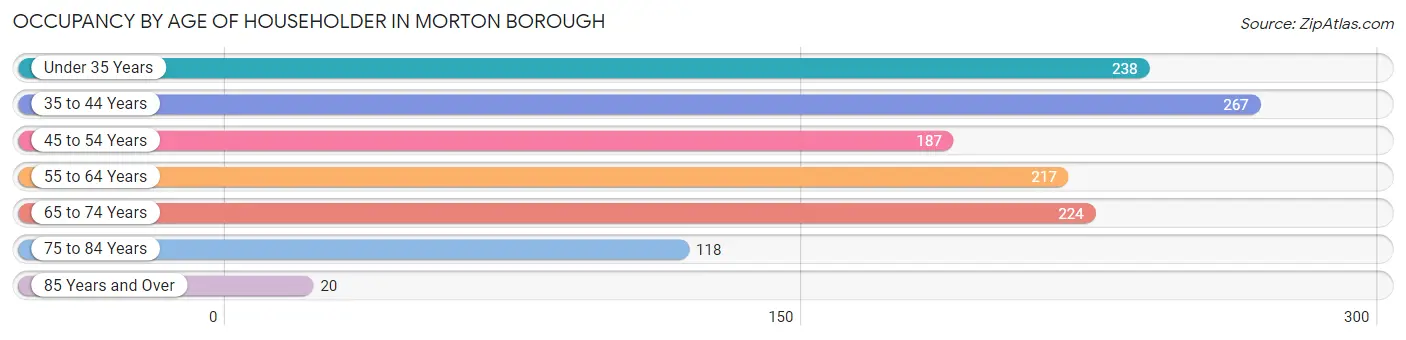
| Age Bracket | # Households | % Households |
| Under 35 Years | 238 | 18.7% |
| 35 to 44 Years | 267 | 21.0% |
| 45 to 54 Years | 187 | 14.7% |
| 55 to 64 Years | 217 | 17.1% |
| 65 to 74 Years | 224 | 17.6% |
| 75 to 84 Years | 118 | 9.3% |
| 85 Years and Over | 20 | 1.6% |
| Total | 1,271 | 100.0% |
Housing Finances in Morton borough
Median Income by Occupancy in Morton borough
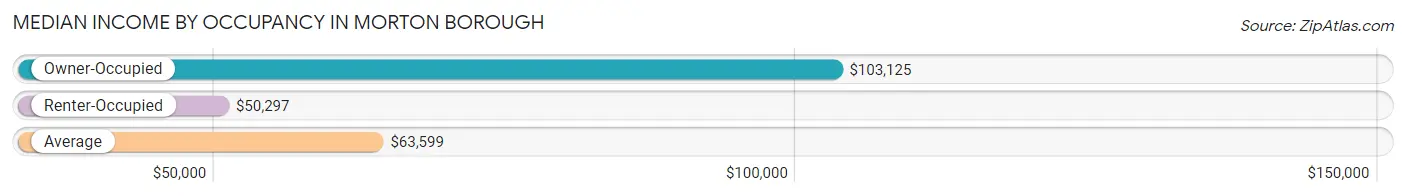
| Occupancy Type | # Households | Median Income |
| Owner-Occupied | 725 (57.0%) | $103,125 |
| Renter-Occupied | 546 (43.0%) | $50,297 |
| Average | 1,271 (100.0%) | $63,599 |
Occupancy by Householder Income Bracket in Morton borough
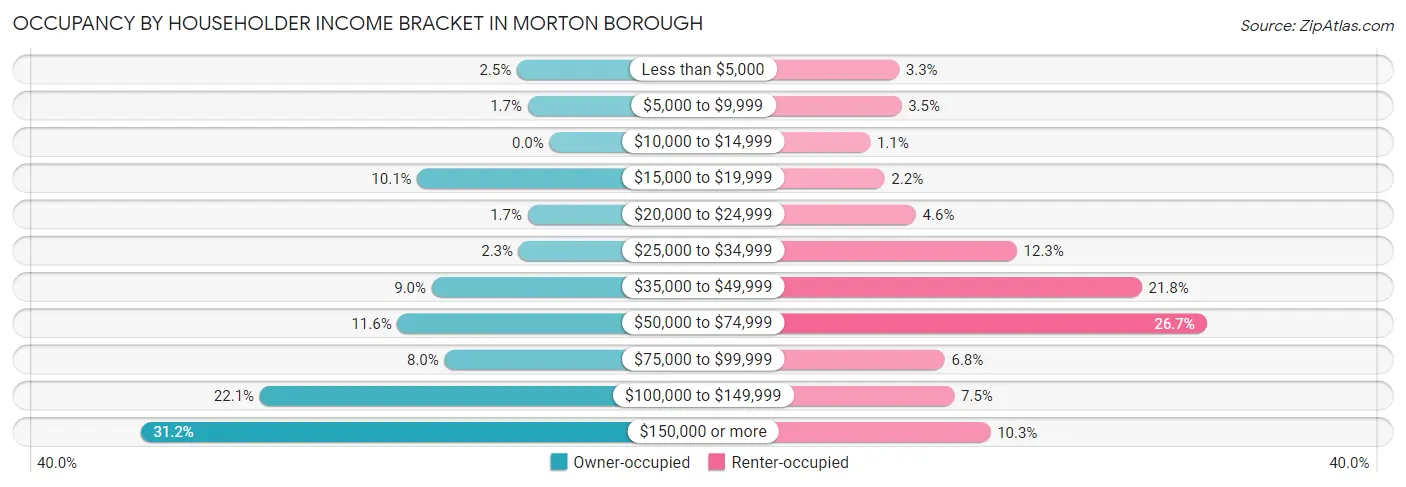
| Income Bracket | Owner-occupied | Renter-occupied |
| Less than $5,000 | 18 (2.5%) | 18 (3.3%) |
| $5,000 to $9,999 | 12 (1.7%) | 19 (3.5%) |
| $10,000 to $14,999 | 0 (0.0%) | 6 (1.1%) |
| $15,000 to $19,999 | 73 (10.1%) | 12 (2.2%) |
| $20,000 to $24,999 | 12 (1.7%) | 25 (4.6%) |
| $25,000 to $34,999 | 17 (2.3%) | 67 (12.3%) |
| $35,000 to $49,999 | 65 (9.0%) | 119 (21.8%) |
| $50,000 to $74,999 | 84 (11.6%) | 146 (26.7%) |
| $75,000 to $99,999 | 58 (8.0%) | 37 (6.8%) |
| $100,000 to $149,999 | 160 (22.1%) | 41 (7.5%) |
| $150,000 or more | 226 (31.2%) | 56 (10.3%) |
| Total | 725 (100.0%) | 546 (100.0%) |
Monthly Housing Cost Tiers in Morton borough
| Monthly Cost | Owner-occupied | Renter-occupied |
| Less than $300 | 10 (1.4%) | 0 (0.0%) |
| $300 to $499 | 44 (6.1%) | 0 (0.0%) |
| $500 to $799 | 77 (10.6%) | 8 (1.5%) |
| $800 to $999 | 80 (11.0%) | 69 (12.6%) |
| $1,000 to $1,499 | 72 (9.9%) | 310 (56.8%) |
| $1,500 to $1,999 | 176 (24.3%) | 134 (24.5%) |
| $2,000 to $2,499 | 143 (19.7%) | 0 (0.0%) |
| $2,500 to $2,999 | 98 (13.5%) | 10 (1.8%) |
| $3,000 or more | 25 (3.5%) | 0 (0.0%) |
| Total | 725 (100.0%) | 546 (100.0%) |
Physical Housing Characteristics in Morton borough
Housing Structures in Morton borough
| Structure Type | # Housing Units | % Housing Units |
| Single Unit, Detached | 404 | 31.8% |
| Single Unit, Attached | 332 | 26.1% |
| 2 Unit Apartments | 220 | 17.3% |
| 3 or 4 Unit Apartments | 74 | 5.8% |
| 5 to 9 Unit Apartments | 16 | 1.3% |
| 10 or more Apartments | 215 | 16.9% |
| Mobile Home / Other | 10 | 0.8% |
| Total | 1,271 | 100.0% |
Housing Structures by Occupancy in Morton borough
| Structure Type | Owner-occupied | Renter-occupied |
| Single Unit, Detached | 394 (97.5%) | 10 (2.5%) |
| Single Unit, Attached | 279 (84.0%) | 53 (16.0%) |
| 2 Unit Apartments | 42 (19.1%) | 178 (80.9%) |
| 3 or 4 Unit Apartments | 0 (0.0%) | 74 (100.0%) |
| 5 to 9 Unit Apartments | 0 (0.0%) | 16 (100.0%) |
| 10 or more Apartments | 0 (0.0%) | 215 (100.0%) |
| Mobile Home / Other | 10 (100.0%) | 0 (0.0%) |
| Total | 725 (57.0%) | 546 (43.0%) |
Housing Structures by Number of Rooms in Morton borough
| Number of Rooms | Owner-occupied | Renter-occupied |
| 1 Room | 0 (0.0%) | 24 (4.4%) |
| 2 or 3 Rooms | 4 (0.5%) | 162 (29.7%) |
| 4 or 5 Rooms | 120 (16.6%) | 346 (63.4%) |
| 6 or 7 Rooms | 421 (58.1%) | 14 (2.6%) |
| 8 or more Rooms | 180 (24.8%) | 0 (0.0%) |
| Total | 725 (100.0%) | 546 (100.0%) |
Housing Structure by Heating Type in Morton borough
| Heating Type | Owner-occupied | Renter-occupied |
| Utility Gas | 505 (69.7%) | 195 (35.7%) |
| Bottled, Tank, or LP Gas | 12 (1.7%) | 0 (0.0%) |
| Electricity | 173 (23.9%) | 342 (62.6%) |
| Fuel Oil or Kerosene | 35 (4.8%) | 9 (1.7%) |
| Coal or Coke | 0 (0.0%) | 0 (0.0%) |
| All other Fuels | 0 (0.0%) | 0 (0.0%) |
| No Fuel Used | 0 (0.0%) | 0 (0.0%) |
| Total | 725 (100.0%) | 546 (100.0%) |
Household Vehicle Usage in Morton borough
| Vehicles per Household | Owner-occupied | Renter-occupied |
| No Vehicle | 13 (1.8%) | 36 (6.6%) |
| 1 Vehicle | 296 (40.8%) | 361 (66.1%) |
| 2 Vehicles | 282 (38.9%) | 141 (25.8%) |
| 3 or more Vehicles | 134 (18.5%) | 8 (1.5%) |
| Total | 725 (100.0%) | 546 (100.0%) |
Real Estate & Mortgages in Morton borough
Real Estate and Mortgage Overview in Morton borough
| Characteristic | Without Mortgage | With Mortgage |
| Housing Units | 239 | 486 |
| Median Property Value | $214,100 | $279,600 |
| Median Household Income | $67,813 | $213 |
| Monthly Housing Costs | $695 | $25 |
| Real Estate Taxes | $4,225 | $0 |
Property Value by Mortgage Status in Morton borough
| Property Value | Without Mortgage | With Mortgage |
| Less than $50,000 | 0 (0.0%) | 0 (0.0%) |
| $50,000 to $99,999 | 0 (0.0%) | 0 (0.0%) |
| $100,000 to $299,999 | 193 (80.7%) | 283 (58.2%) |
| $300,000 to $499,999 | 36 (15.1%) | 187 (38.5%) |
| $500,000 to $749,999 | 0 (0.0%) | 0 (0.0%) |
| $750,000 to $999,999 | 4 (1.7%) | 16 (3.3%) |
| $1,000,000 or more | 6 (2.5%) | 0 (0.0%) |
| Total | 239 (100.0%) | 486 (100.0%) |
Household Income by Mortgage Status in Morton borough
| Household Income | Without Mortgage | With Mortgage |
| Less than $10,000 | 8 (3.4%) | 0 (0.0%) |
| $10,000 to $24,999 | 61 (25.5%) | 22 (4.5%) |
| $25,000 to $34,999 | 0 (0.0%) | 24 (4.9%) |
| $35,000 to $49,999 | 26 (10.9%) | 17 (3.5%) |
| $50,000 to $74,999 | 40 (16.7%) | 39 (8.0%) |
| $75,000 to $99,999 | 27 (11.3%) | 44 (9.0%) |
| $100,000 to $149,999 | 64 (26.8%) | 31 (6.4%) |
| $150,000 or more | 13 (5.4%) | 96 (19.8%) |
| Total | 239 (100.0%) | 486 (100.0%) |
Property Value to Household Income Ratio in Morton borough
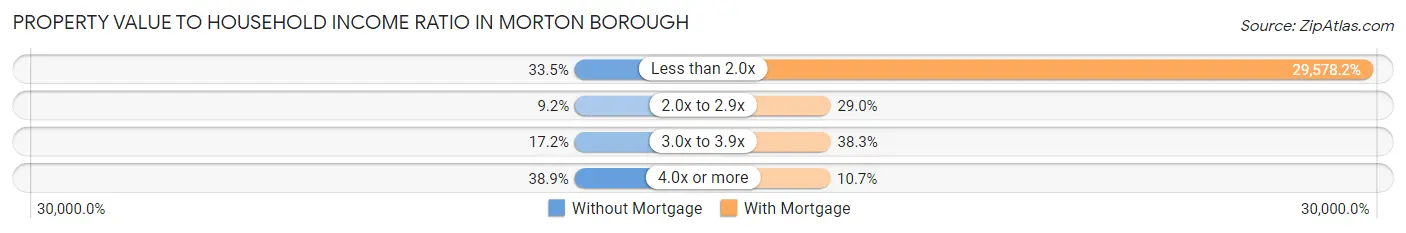
| Value-to-Income Ratio | Without Mortgage | With Mortgage |
| Less than 2.0x | 80 (33.5%) | 143,750 (29,578.2%) |
| 2.0x to 2.9x | 22 (9.2%) | 141 (29.0%) |
| 3.0x to 3.9x | 41 (17.2%) | 186 (38.3%) |
| 4.0x or more | 93 (38.9%) | 52 (10.7%) |
| Total | 239 (100.0%) | 486 (100.0%) |
Real Estate Taxes by Mortgage Status in Morton borough
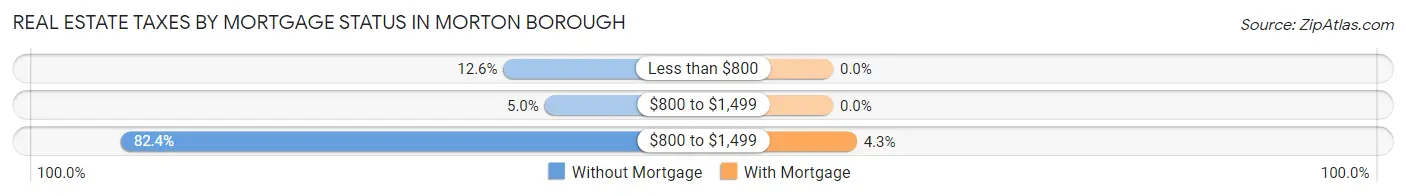
| Property Taxes | Without Mortgage | With Mortgage |
| Less than $800 | 30 (12.6%) | 0 (0.0%) |
| $800 to $1,499 | 12 (5.0%) | 0 (0.0%) |
| $800 to $1,499 | 197 (82.4%) | 21 (4.3%) |
| Total | 239 (100.0%) | 486 (100.0%) |
Health & Disability in Morton borough
Health Insurance Coverage by Age in Morton borough
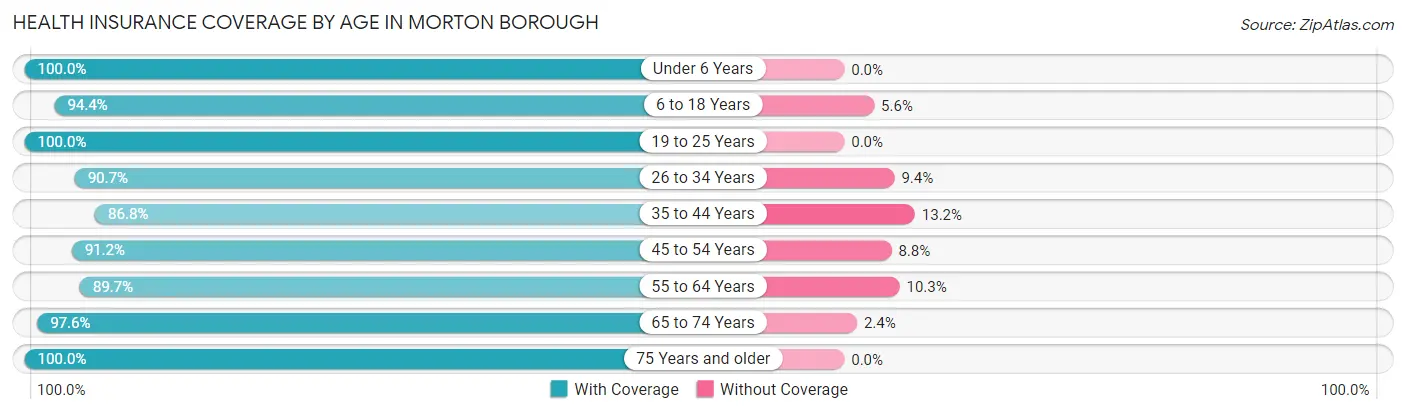
| Age Bracket | With Coverage | Without Coverage |
| Under 6 Years | 128 (100.0%) | 0 (0.0%) |
| 6 to 18 Years | 458 (94.4%) | 27 (5.6%) |
| 19 to 25 Years | 203 (100.0%) | 0 (0.0%) |
| 26 to 34 Years | 252 (90.6%) | 26 (9.3%) |
| 35 to 44 Years | 409 (86.8%) | 62 (13.2%) |
| 45 to 54 Years | 301 (91.2%) | 29 (8.8%) |
| 55 to 64 Years | 357 (89.7%) | 41 (10.3%) |
| 65 to 74 Years | 289 (97.6%) | 7 (2.4%) |
| 75 Years and older | 170 (100.0%) | 0 (0.0%) |
| Total | 2,567 (93.0%) | 192 (7.0%) |
Health Insurance Coverage by Citizenship Status in Morton borough
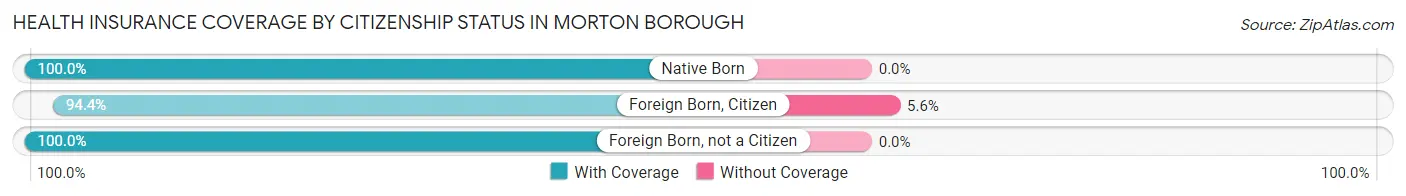
| Citizenship Status | With Coverage | Without Coverage |
| Native Born | 128 (100.0%) | 0 (0.0%) |
| Foreign Born, Citizen | 458 (94.4%) | 27 (5.6%) |
| Foreign Born, not a Citizen | 203 (100.0%) | 0 (0.0%) |
Health Insurance Coverage by Household Income in Morton borough
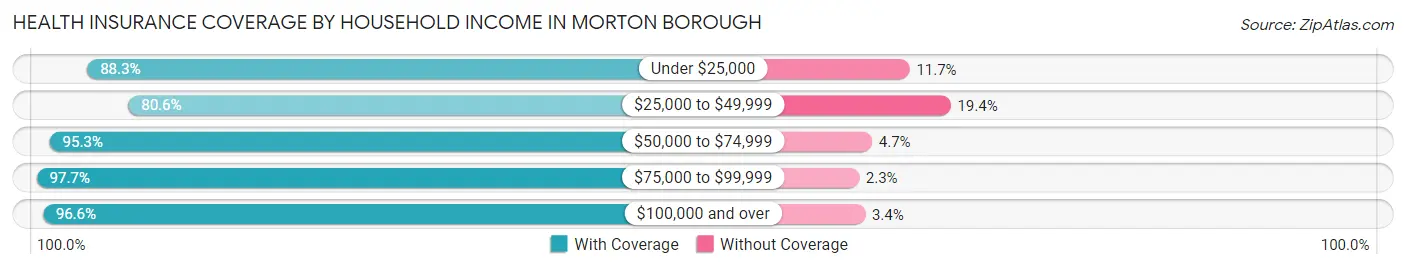
| Household Income | With Coverage | Without Coverage |
| Under $25,000 | 233 (88.3%) | 31 (11.7%) |
| $25,000 to $49,999 | 369 (80.6%) | 89 (19.4%) |
| $50,000 to $74,999 | 447 (95.3%) | 22 (4.7%) |
| $75,000 to $99,999 | 260 (97.7%) | 6 (2.3%) |
| $100,000 and over | 1,247 (96.6%) | 44 (3.4%) |
Public vs Private Health Insurance Coverage by Age in Morton borough
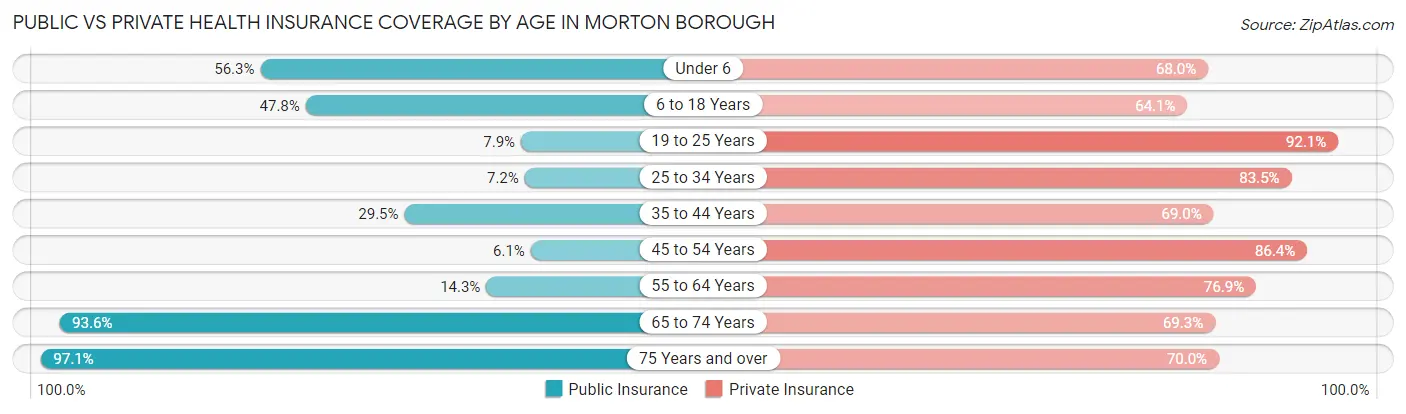
| Age Bracket | Public Insurance | Private Insurance |
| Under 6 | 72 (56.2%) | 87 (68.0%) |
| 6 to 18 Years | 232 (47.8%) | 311 (64.1%) |
| 19 to 25 Years | 16 (7.9%) | 187 (92.1%) |
| 25 to 34 Years | 20 (7.2%) | 232 (83.5%) |
| 35 to 44 Years | 139 (29.5%) | 325 (69.0%) |
| 45 to 54 Years | 20 (6.1%) | 285 (86.4%) |
| 55 to 64 Years | 57 (14.3%) | 306 (76.9%) |
| 65 to 74 Years | 277 (93.6%) | 205 (69.3%) |
| 75 Years and over | 165 (97.1%) | 119 (70.0%) |
| Total | 998 (36.2%) | 2,057 (74.6%) |
Disability Status by Sex by Age in Morton borough
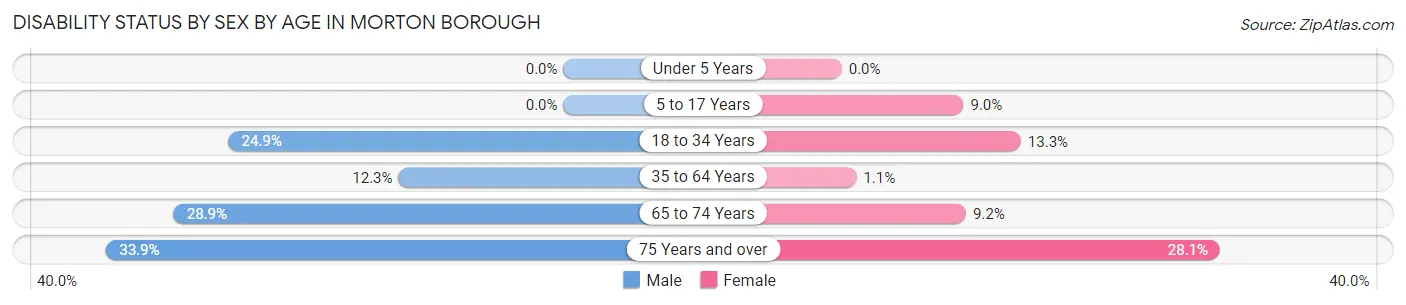
| Age Bracket | Male | Female |
| Under 5 Years | 0 (0.0%) | 0 (0.0%) |
| 5 to 17 Years | 0 (0.0%) | 17 (9.0%) |
| 18 to 34 Years | 85 (24.8%) | 27 (13.3%) |
| 35 to 64 Years | 68 (12.2%) | 7 (1.1%) |
| 65 to 74 Years | 48 (28.9%) | 12 (9.2%) |
| 75 Years and over | 19 (33.9%) | 32 (28.1%) |
Disability Class by Sex by Age in Morton borough
Disability Class: Hearing Difficulty
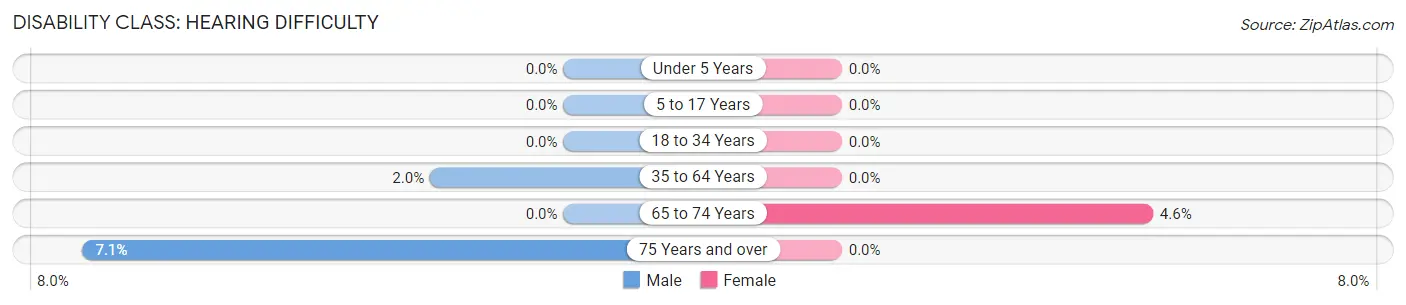
| Age Bracket | Male | Female |
| Under 5 Years | 0 (0.0%) | 0 (0.0%) |
| 5 to 17 Years | 0 (0.0%) | 0 (0.0%) |
| 18 to 34 Years | 0 (0.0%) | 0 (0.0%) |
| 35 to 64 Years | 11 (2.0%) | 0 (0.0%) |
| 65 to 74 Years | 0 (0.0%) | 6 (4.6%) |
| 75 Years and over | 4 (7.1%) | 0 (0.0%) |
Disability Class: Vision Difficulty
| Age Bracket | Male | Female |
| Under 5 Years | 0 (0.0%) | 0 (0.0%) |
| 5 to 17 Years | 0 (0.0%) | 0 (0.0%) |
| 18 to 34 Years | 2 (0.6%) | 7 (3.5%) |
| 35 to 64 Years | 32 (5.8%) | 0 (0.0%) |
| 65 to 74 Years | 5 (3.0%) | 0 (0.0%) |
| 75 Years and over | 4 (7.1%) | 0 (0.0%) |
Disability Class: Cognitive Difficulty
| Age Bracket | Male | Female |
| 5 to 17 Years | 0 (0.0%) | 17 (9.0%) |
| 18 to 34 Years | 61 (17.8%) | 27 (13.3%) |
| 35 to 64 Years | 62 (11.2%) | 1 (0.2%) |
| 65 to 74 Years | 39 (23.5%) | 0 (0.0%) |
| 75 Years and over | 2 (3.6%) | 0 (0.0%) |
Disability Class: Ambulatory Difficulty
| Age Bracket | Male | Female |
| 5 to 17 Years | 0 (0.0%) | 0 (0.0%) |
| 18 to 34 Years | 22 (6.4%) | 11 (5.4%) |
| 35 to 64 Years | 18 (3.2%) | 7 (1.1%) |
| 65 to 74 Years | 43 (25.9%) | 6 (4.6%) |
| 75 Years and over | 17 (30.4%) | 28 (24.6%) |
Disability Class: Self-Care Difficulty
| Age Bracket | Male | Female |
| 5 to 17 Years | 0 (0.0%) | 0 (0.0%) |
| 18 to 34 Years | 33 (9.7%) | 8 (3.9%) |
| 35 to 64 Years | 35 (6.3%) | 1 (0.2%) |
| 65 to 74 Years | 39 (23.5%) | 0 (0.0%) |
| 75 Years and over | 2 (3.6%) | 17 (14.9%) |
Technology Access in Morton borough
Computing Device Access in Morton borough
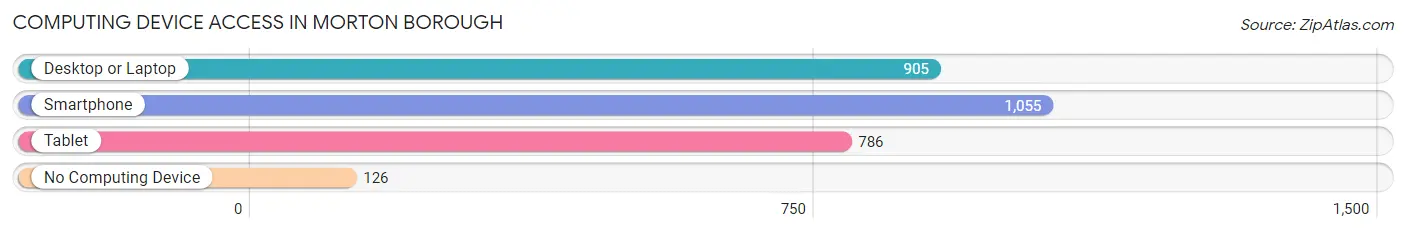
| Device Type | # Households | % Households |
| Desktop or Laptop | 905 | 71.2% |
| Smartphone | 1,055 | 83.0% |
| Tablet | 786 | 61.8% |
| No Computing Device | 126 | 9.9% |
| Total | 1,271 | 100.0% |
Internet Access in Morton borough
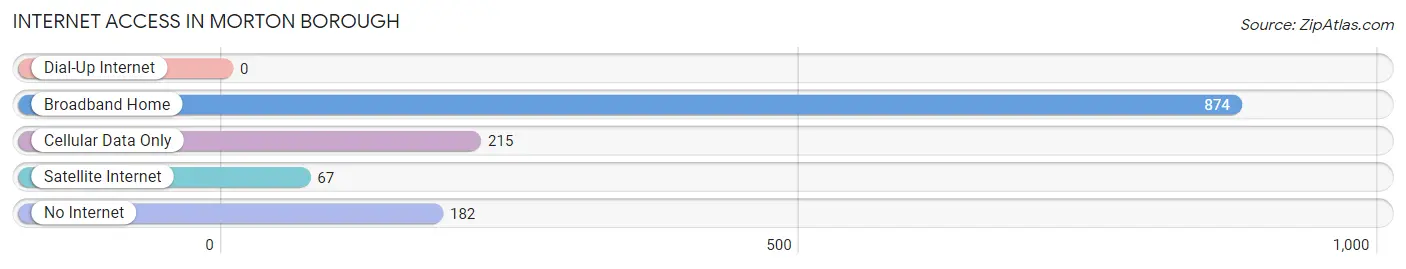
| Internet Type | # Households | % Households |
| Dial-Up Internet | 0 | 0.0% |
| Broadband Home | 874 | 68.8% |
| Cellular Data Only | 215 | 16.9% |
| Satellite Internet | 67 | 5.3% |
| No Internet | 182 | 14.3% |
| Total | 1,271 | 100.0% |
Morton borough Summary
Morton Borough is a small borough located in Delaware County, Pennsylvania. It is situated in the southeastern corner of the county, just north of the city of Philadelphia. The borough is bordered by the townships of Nether Providence, Ridley, and Upper Providence. The population of Morton Borough was 4,845 at the 2010 census.
History
Morton Borough was originally part of the larger Nether Providence Township, which was established in 1687. The area was first settled in the late 1600s by English and Welsh Quakers. The town was named after Thomas Morton, who was a prominent Quaker leader in the area. In 1876, the area was incorporated as a borough.
Geography
Morton Borough is located at 39°54'45"N 75°20'45"W (39.912500, -75.345833). It has a total area of 0.9 square miles, all of which is land. The borough is located in the southeastern corner of Delaware County, just north of the city of Philadelphia. It is bordered by the townships of Nether Providence, Ridley, and Upper Providence.
Economy
Morton Borough has a diverse economy. The borough is home to a variety of businesses, including retail stores, restaurants, and professional services. The borough also has a number of industrial and manufacturing businesses. The largest employer in the borough is the Morton Borough School District, which employs over 500 people.
Demographics
As of the 2010 census, the population of Morton Borough was 4,845. The racial makeup of the borough was 87.3% White, 8.2% African American, 0.7% Asian, 0.3% Native American, and 3.5% from other races. The median household income was $50,945, and the median family income was $62,917. The per capita income was $25,945.
Conclusion
Morton Borough is a small borough located in Delaware County, Pennsylvania. It has a rich history, and a diverse economy. The population of the borough is 4,845, and the median household income is $50,945. The borough is home to a variety of businesses, and the largest employer is the Morton Borough School District.
Common Questions
What is the Total Population of Morton borough?
Total Population of Morton borough is 2,759.
What is the Total Male Population of Morton borough?
Total Male Population of Morton borough is 1,435.
What is the Total Female Population of Morton borough?
Total Female Population of Morton borough is 1,324.
What is the Ratio of Males per 100 Females in Morton borough?
There are 108.38 Males per 100 Females in Morton borough.
What is the Ratio of Females per 100 Males in Morton borough?
There are 92.26 Females per 100 Males in Morton borough.
What is the Median Population Age in Morton borough?
Median Population Age in Morton borough is 41.1 Years.
What is the Average Family Size in Morton borough
Average Family Size in Morton borough is 2.9 People.
What is the Average Household Size in Morton borough
Average Household Size in Morton borough is 2.2 People.
What is Per Capita Income in Morton borough?
Per Capita income in Morton borough is $42,555.
What is the Median Family Income in Morton borough?
Median Family Income in Morton borough is $103,000.
What is the Median Household income in Morton borough?
Median Household Income in Morton borough is $63,599.
What is Income or Wage Gap in Morton borough?
Income or Wage Gap in Morton borough is 4.1%.
Women in Morton borough earn 95.9 cents for every dollar earned by a man.
What is Inequality or Gini Index in Morton borough?
Inequality or Gini Index in Morton borough is 0.43.
How Large is the Labor Force in Morton borough?
There are 1,592 People in the Labor Forcein in Morton borough.
What is the Percentage of People in the Labor Force in Morton borough?
70.3% of People are in the Labor Force in Morton borough.
What is the Unemployment Rate in Morton borough?
Unemployment Rate in Morton borough is 5.2%.