Mercersburg borough, PA
Mercersburg borough Overview
2,083
TOTAL POPULATION
1,026
MALE POPULATION
1,057
FEMALE POPULATION
97.07
MALES / 100 FEMALES
103.02
FEMALES / 100 MALES
43.8
MEDIAN AGE
3.1
AVG FAMILY SIZE
2.4
AVG HOUSEHOLD SIZE
$37,153
PER CAPITA INCOME
$81,731
AVG FAMILY INCOME
$71,905
AVG HOUSEHOLD INCOME
20.4%
WAGE / INCOME GAP [ % ]
79.6¢/ $1
WAGE / INCOME GAP [ $ ]
0.46
INEQUALITY / GINI INDEX
1,201
LABOR FORCE [ PEOPLE ]
70.4%
PERCENT IN LABOR FORCE
2.7%
UNEMPLOYMENT RATE
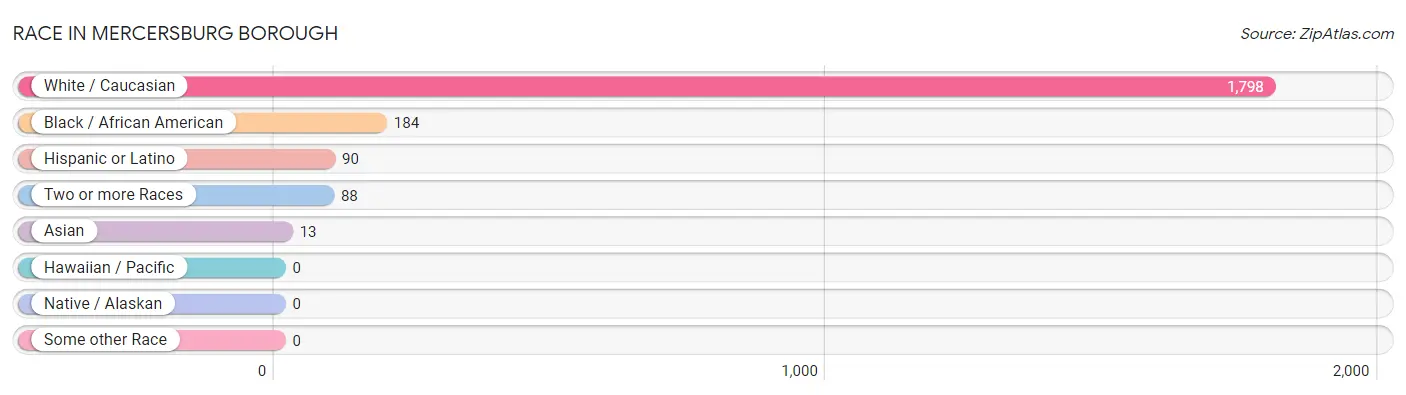
Race in Mercersburg borough
The most populous races in Mercersburg borough are White / Caucasian (1,798 | 86.3%), Black / African American (184 | 8.8%), and Hispanic or Latino (90 | 4.3%).
| Race | # Population | % Population |
| Asian | 13 | 0.6% |
| Black / African American | 184 | 8.8% |
| Hawaiian / Pacific | 0 | 0.0% |
| Hispanic or Latino | 90 | 4.3% |
| Native / Alaskan | 0 | 0.0% |
| White / Caucasian | 1,798 | 86.3% |
| Two or more Races | 88 | 4.2% |
| Some other Race | 0 | 0.0% |
| Total | 2,083 | 100.0% |
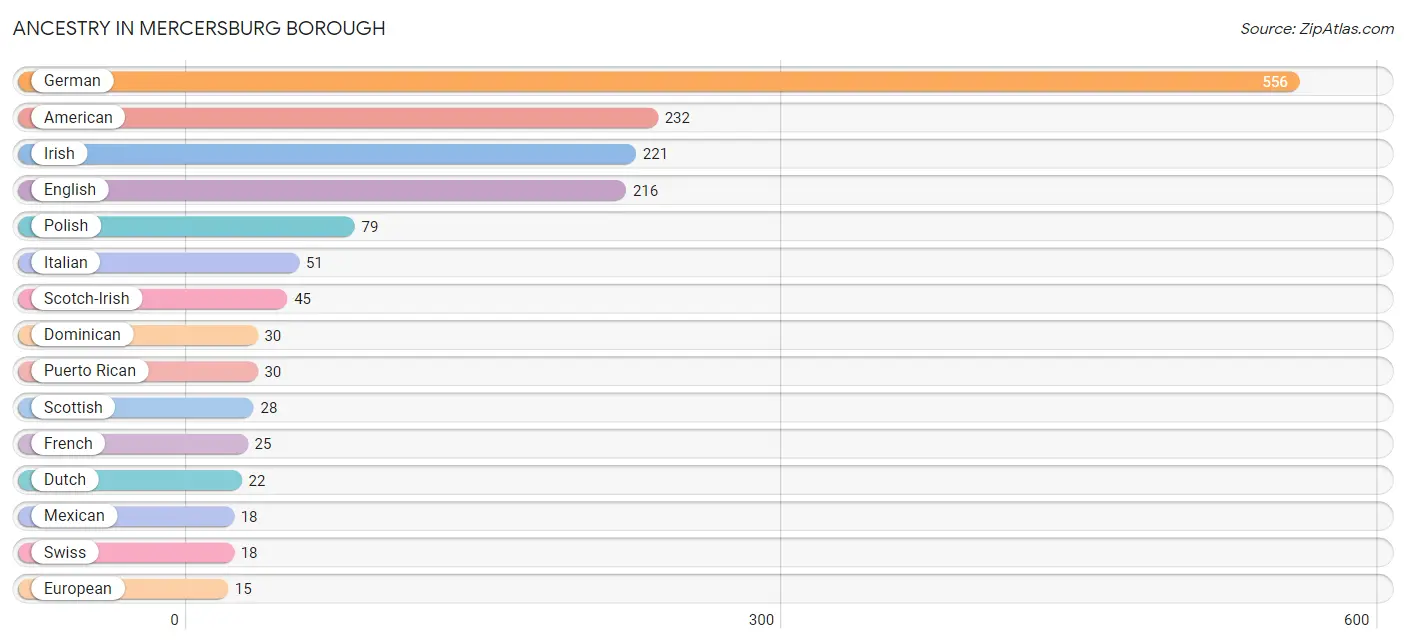
Ancestry in Mercersburg borough
The most populous ancestries reported in Mercersburg borough are German (556 | 26.7%), American (232 | 11.1%), Irish (221 | 10.6%), English (216 | 10.4%), and Polish (79 | 3.8%), together accounting for 62.6% of all Mercersburg borough residents.
| Ancestry | # Population | % Population |
| American | 232 | 11.1% |
| Arab | 3 | 0.1% |
| Armenian | 3 | 0.1% |
| Bhutanese | 7 | 0.3% |
| British | 13 | 0.6% |
| Cherokee | 2 | 0.1% |
| Cuban | 10 | 0.5% |
| Czech | 6 | 0.3% |
| Dominican | 30 | 1.4% |
| Dutch | 22 | 1.1% |
| Eastern European | 3 | 0.1% |
| English | 216 | 10.4% |
| European | 15 | 0.7% |
| French | 25 | 1.2% |
| German | 556 | 26.7% |
| Icelander | 5 | 0.2% |
| Indian (Asian) | 13 | 0.6% |
| Iranian | 4 | 0.2% |
| Irish | 221 | 10.6% |
| Italian | 51 | 2.5% |
| Korean | 4 | 0.2% |
| Lithuanian | 7 | 0.3% |
| Mexican | 18 | 0.9% |
| Polish | 79 | 3.8% |
| Puerto Rican | 30 | 1.4% |
| Russian | 7 | 0.3% |
| Scandinavian | 4 | 0.2% |
| Scotch-Irish | 45 | 2.2% |
| Scottish | 28 | 1.3% |
| Slovak | 5 | 0.2% |
| Swedish | 6 | 0.3% |
| Swiss | 18 | 0.9% |
| Syrian | 3 | 0.1% |
| Welsh | 7 | 0.3% | View All 34 Rows |
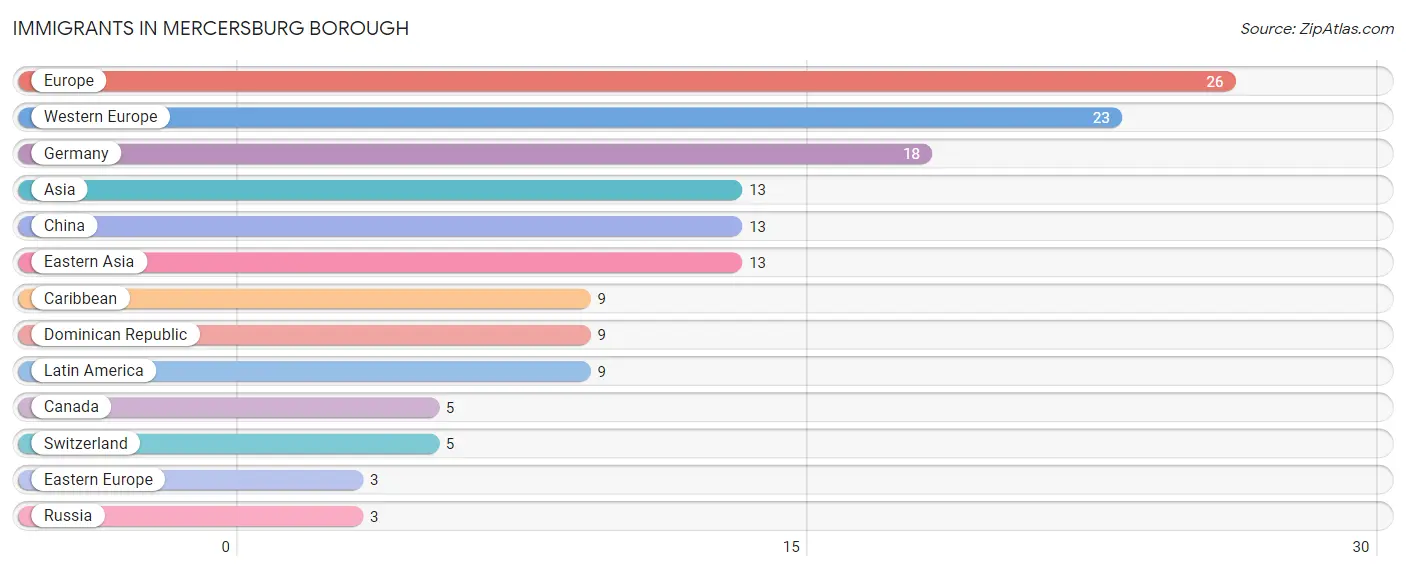
Immigrants in Mercersburg borough
The most numerous immigrant groups reported in Mercersburg borough came from Europe (26 | 1.3%), Western Europe (23 | 1.1%), Germany (18 | 0.9%), Asia (13 | 0.6%), and China (13 | 0.6%), together accounting for 4.4% of all Mercersburg borough residents.
| Immigration Origin | # Population | % Population |
| Asia | 13 | 0.6% |
| Canada | 5 | 0.2% |
| Caribbean | 9 | 0.4% |
| China | 13 | 0.6% |
| Dominican Republic | 9 | 0.4% |
| Eastern Asia | 13 | 0.6% |
| Eastern Europe | 3 | 0.1% |
| Europe | 26 | 1.3% |
| Germany | 18 | 0.9% |
| Latin America | 9 | 0.4% |
| Russia | 3 | 0.1% |
| Switzerland | 5 | 0.2% |
| Western Europe | 23 | 1.1% | View All 13 Rows |
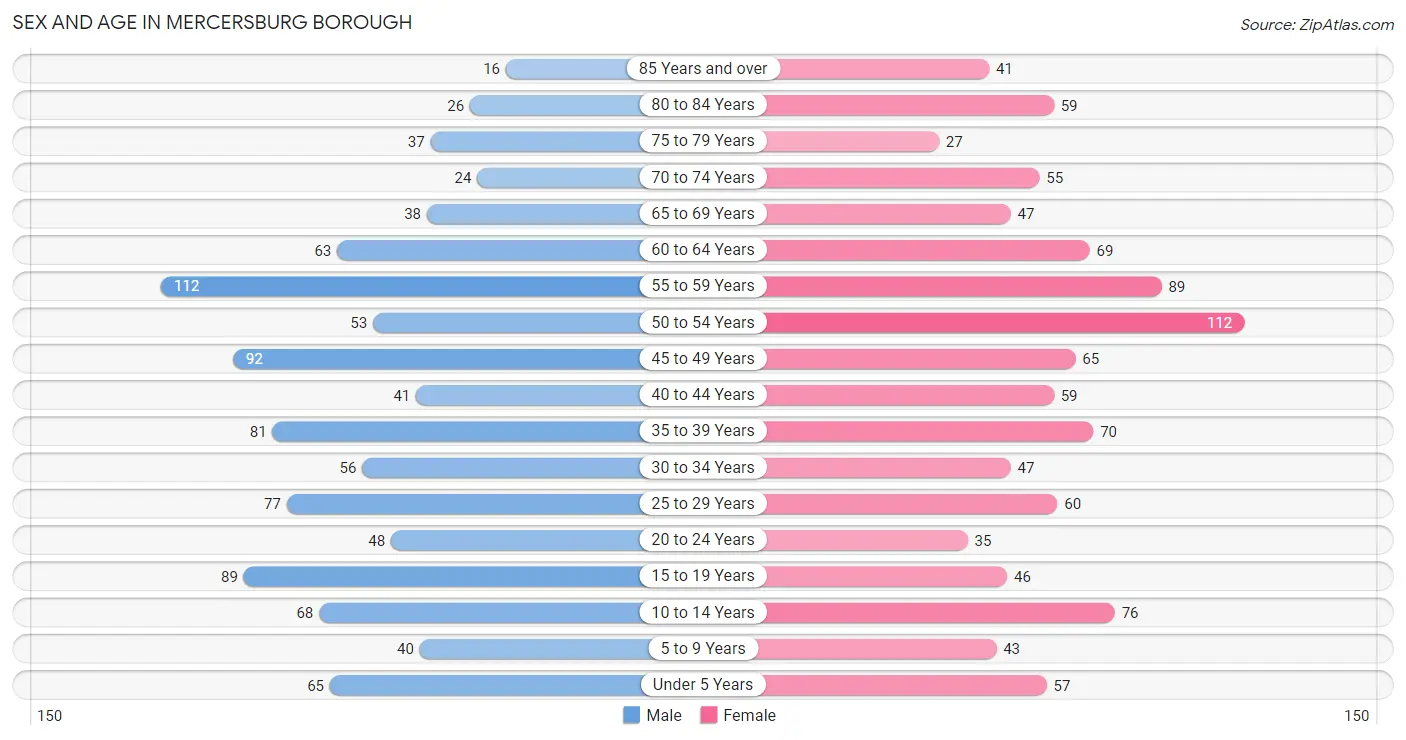
Sex and Age in Mercersburg borough
Sex and Age in Mercersburg borough
The most populous age groups in Mercersburg borough are 55 to 59 Years (112 | 10.9%) for men and 50 to 54 Years (112 | 10.6%) for women.
| Age Bracket | Male | Female |
| Under 5 Years | 65 (6.3%) | 57 (5.4%) |
| 5 to 9 Years | 40 (3.9%) | 43 (4.1%) |
| 10 to 14 Years | 68 (6.6%) | 76 (7.2%) |
| 15 to 19 Years | 89 (8.7%) | 46 (4.3%) |
| 20 to 24 Years | 48 (4.7%) | 35 (3.3%) |
| 25 to 29 Years | 77 (7.5%) | 60 (5.7%) |
| 30 to 34 Years | 56 (5.5%) | 47 (4.4%) |
| 35 to 39 Years | 81 (7.9%) | 70 (6.6%) |
| 40 to 44 Years | 41 (4.0%) | 59 (5.6%) |
| 45 to 49 Years | 92 (9.0%) | 65 (6.1%) |
| 50 to 54 Years | 53 (5.2%) | 112 (10.6%) |
| 55 to 59 Years | 112 (10.9%) | 89 (8.4%) |
| 60 to 64 Years | 63 (6.1%) | 69 (6.5%) |
| 65 to 69 Years | 38 (3.7%) | 47 (4.4%) |
| 70 to 74 Years | 24 (2.3%) | 55 (5.2%) |
| 75 to 79 Years | 37 (3.6%) | 27 (2.5%) |
| 80 to 84 Years | 26 (2.5%) | 59 (5.6%) |
| 85 Years and over | 16 (1.6%) | 41 (3.9%) |
| Total | 1,026 (100.0%) | 1,057 (100.0%) |
Families and Households in Mercersburg borough
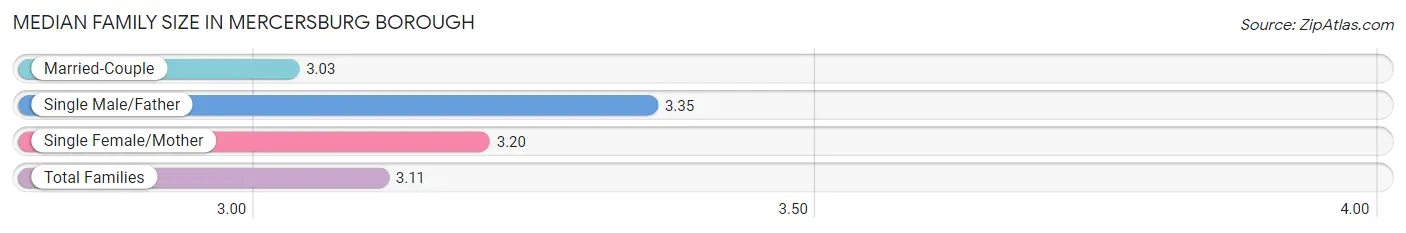
Median Family Size in Mercersburg borough
The median family size in Mercersburg borough is 3.11 persons per family, with single male/father families (37 | 7.4%) accounting for the largest median family size of 3.35 persons per family. On the other hand, married-couple families (306 | 61.5%) represent the smallest median family size with 3.03 persons per family.
| Family Type | # Families | Family Size |
| Married-Couple | 306 (61.5%) | 3.03 |
| Single Male/Father | 37 (7.4%) | 3.35 |
| Single Female/Mother | 155 (31.1%) | 3.20 |
| Total Families | 498 (100.0%) | 3.11 |
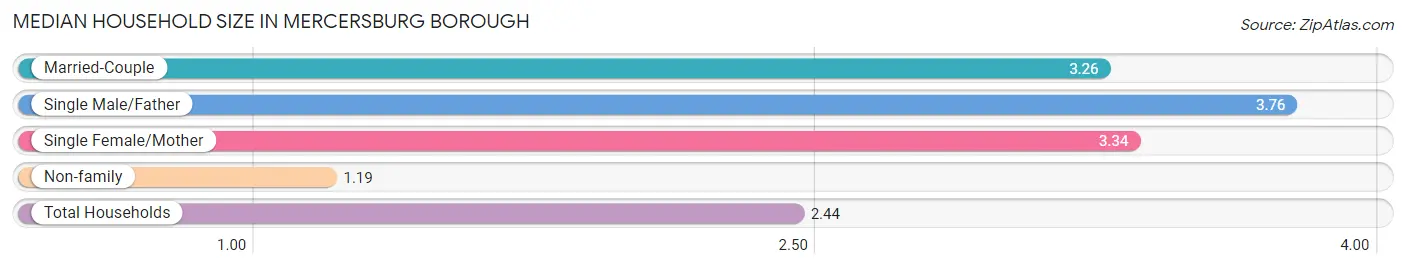
Median Household Size in Mercersburg borough
The median household size in Mercersburg borough is 2.44 persons per household, with single male/father households (37 | 4.4%) accounting for the largest median household size of 3.76 persons per household. non-family households (348 | 41.1%) represent the smallest median household size with 1.19 persons per household.
| Household Type | # Households | Household Size |
| Married-Couple | 306 (36.2%) | 3.26 |
| Single Male/Father | 37 (4.4%) | 3.76 |
| Single Female/Mother | 155 (18.3%) | 3.34 |
| Non-family | 348 (41.1%) | 1.19 |
| Total Households | 846 (100.0%) | 2.44 |
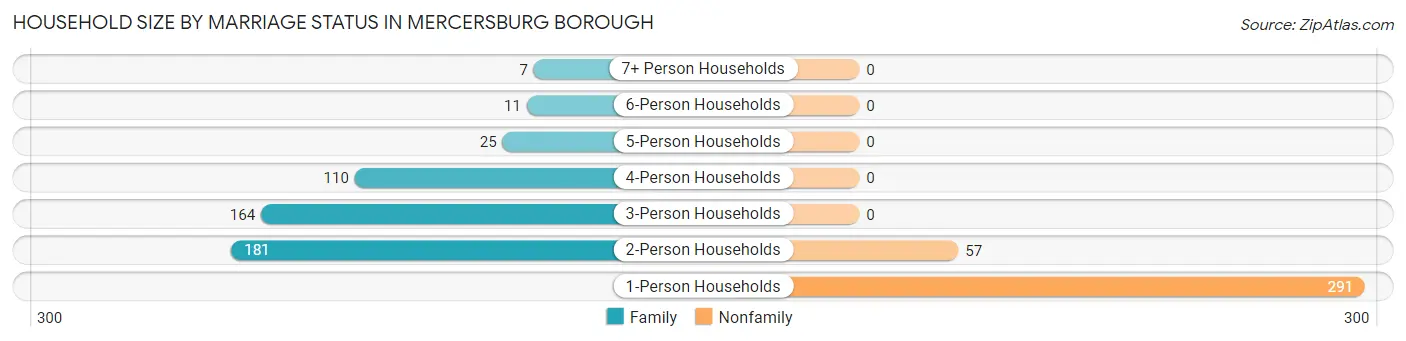
Household Size by Marriage Status in Mercersburg borough
Out of a total of 846 households in Mercersburg borough, 498 (58.9%) are family households, while 348 (41.1%) are nonfamily households. The most numerous type of family households are 2-person households, comprising 181, and the most common type of nonfamily households are 1-person households, comprising 291.
| Household Size | Family Households | Nonfamily Households |
| 1-Person Households | - | 291 (34.4%) |
| 2-Person Households | 181 (21.4%) | 57 (6.7%) |
| 3-Person Households | 164 (19.4%) | 0 (0.0%) |
| 4-Person Households | 110 (13.0%) | 0 (0.0%) |
| 5-Person Households | 25 (3.0%) | 0 (0.0%) |
| 6-Person Households | 11 (1.3%) | 0 (0.0%) |
| 7+ Person Households | 7 (0.8%) | 0 (0.0%) |
| Total | 498 (58.9%) | 348 (41.1%) |
Female Fertility in Mercersburg borough
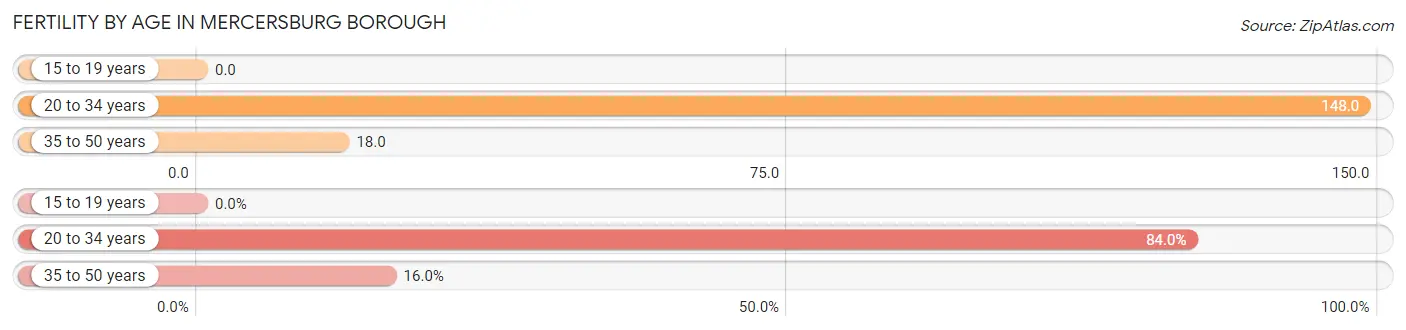
Fertility by Age in Mercersburg borough
Average fertility rate in Mercersburg borough is 61.0 births per 1,000 women. Women in the age bracket of 20 to 34 years have the highest fertility rate with 148.0 births per 1,000 women. Women in the age bracket of 20 to 34 years acount for 84.0% of all women with births.
| Age Bracket | Women with Births | Births / 1,000 Women |
| 15 to 19 years | 0 (0.0%) | 0.0 |
| 20 to 34 years | 21 (84.0%) | 148.0 |
| 35 to 50 years | 4 (16.0%) | 18.0 |
| Total | 25 (100.0%) | 61.0 |
Fertility by Age by Marriage Status in Mercersburg borough
60.0% of women with births (25) in Mercersburg borough are married. The highest percentage of unmarried women with births falls into 35 to 50 years age bracket with 100.0% of them unmarried at the time of birth, while the lowest percentage of unmarried women with births belong to 20 to 34 years age bracket with 28.6% of them unmarried.
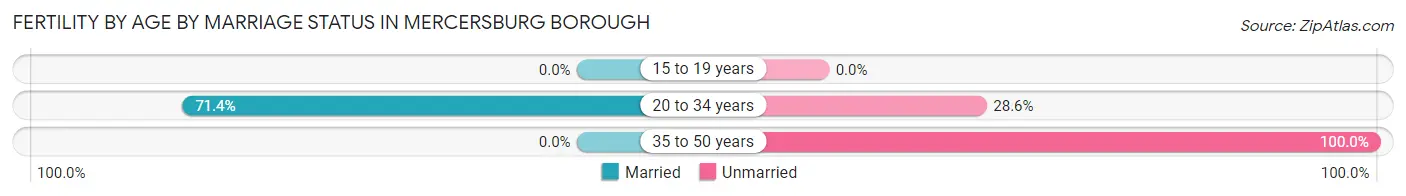
| Age Bracket | Married | Unmarried |
| 15 to 19 years | 0 (0.0%) | 0 (0.0%) |
| 20 to 34 years | 15 (71.4%) | 6 (28.6%) |
| 35 to 50 years | 0 (0.0%) | 4 (100.0%) |
| Total | 15 (60.0%) | 10 (40.0%) |
Fertility by Education in Mercersburg borough
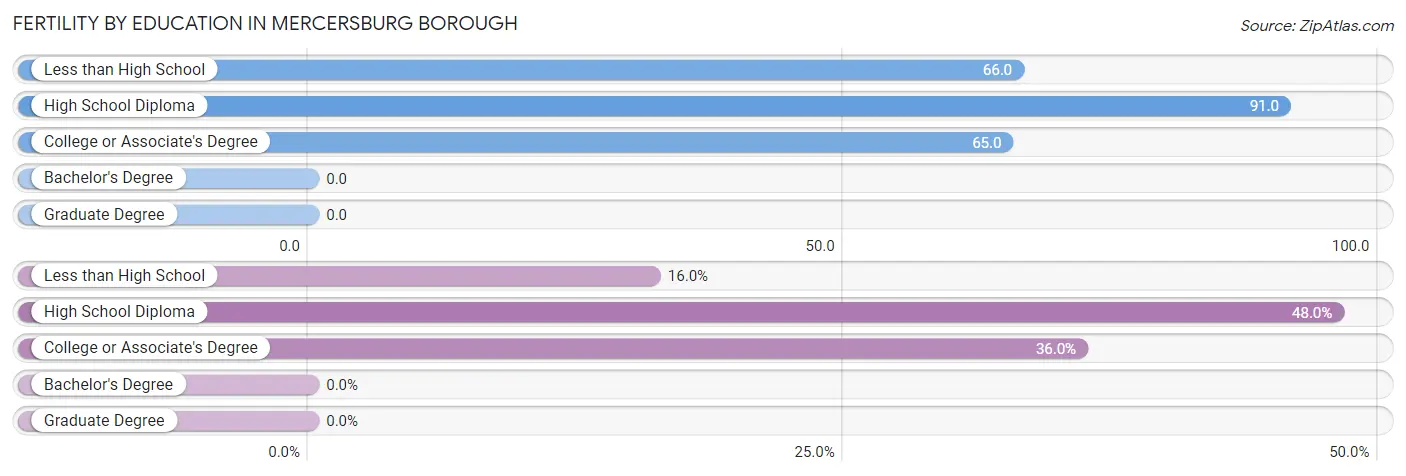
| Educational Attainment | Women with Births | Births / 1,000 Women |
| Less than High School | 4 (16.0%) | 66.0 |
| High School Diploma | 12 (48.0%) | 91.0 |
| College or Associate's Degree | 9 (36.0%) | 65.0 |
| Bachelor's Degree | 0 (0.0%) | 0.0 |
| Graduate Degree | 0 (0.0%) | 0.0 |
| Total | 25 (100.0%) | 61.0 |
Fertility by Education by Marriage Status in Mercersburg borough
40.0% of women with births in Mercersburg borough are unmarried. Women with the educational attainment of college or associate's degree are most likely to be married with 100.0% of them married at childbirth, while women with the educational attainment of less than high school are least likely to be married with 100.0% of them unmarried at childbirth.
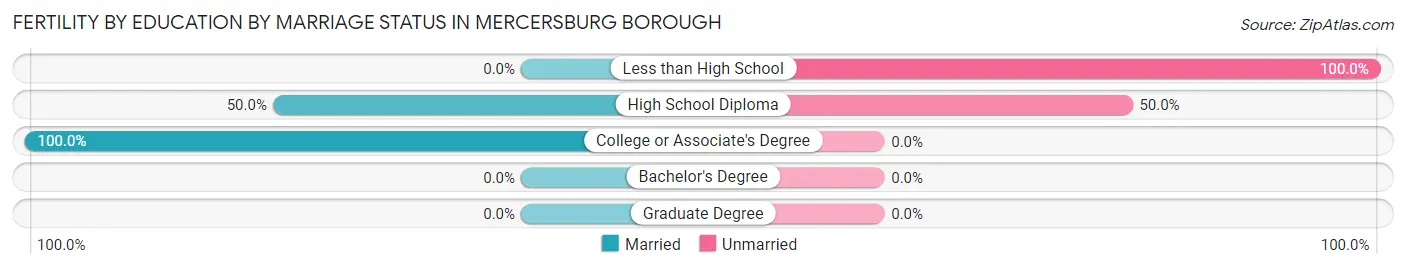
| Educational Attainment | Married | Unmarried |
| Less than High School | 0 (0.0%) | 4 (100.0%) |
| High School Diploma | 6 (50.0%) | 6 (50.0%) |
| College or Associate's Degree | 9 (100.0%) | 0 (0.0%) |
| Bachelor's Degree | 0 (0.0%) | 0 (0.0%) |
| Graduate Degree | 0 (0.0%) | 0 (0.0%) |
| Total | 15 (60.0%) | 10 (40.0%) |
Income in Mercersburg borough
Income Overview in Mercersburg borough
Per Capita Income in Mercersburg borough is $37,153, while median incomes of families and households are $81,731 and $71,905 respectively.
| Characteristic | Number | Measure |
| Per Capita Income | 2,083 | $37,153 |
| Median Family Income | 498 | $81,731 |
| Mean Family Income | 498 | $93,313 |
| Median Household Income | 846 | $71,905 |
| Mean Household Income | 846 | $86,418 |
| Income Deficit | 498 | $0 |
| Wage / Income Gap (%) | 2,083 | 20.41% |
| Wage / Income Gap ($) | 2,083 | 79.59¢ per $1 |
| Gini / Inequality Index | 2,083 | 0.46 |
Earnings by Sex in Mercersburg borough
Average Earnings in Mercersburg borough are $37,902, $41,544 for men and $33,065 for women, a difference of 20.4%.
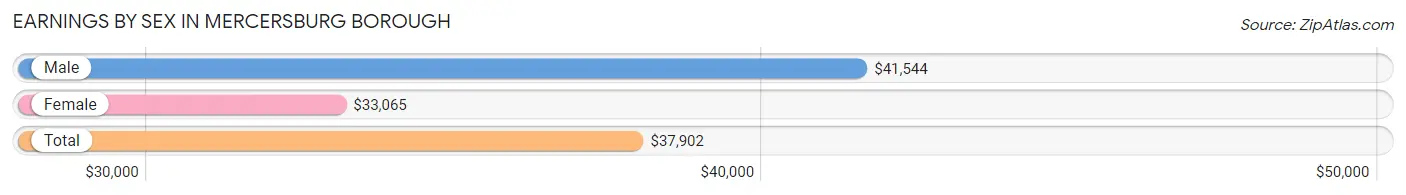
| Sex | Number | Average Earnings |
| Male | 669 (53.0%) | $41,544 |
| Female | 594 (47.0%) | $33,065 |
| Total | 1,263 (100.0%) | $37,902 |
Earnings by Sex by Income Bracket in Mercersburg borough
The most common earnings brackets in Mercersburg borough are $55,000 to $64,999 for men (121 | 18.1%) and $75,000 to $99,999 for women (65 | 10.9%).
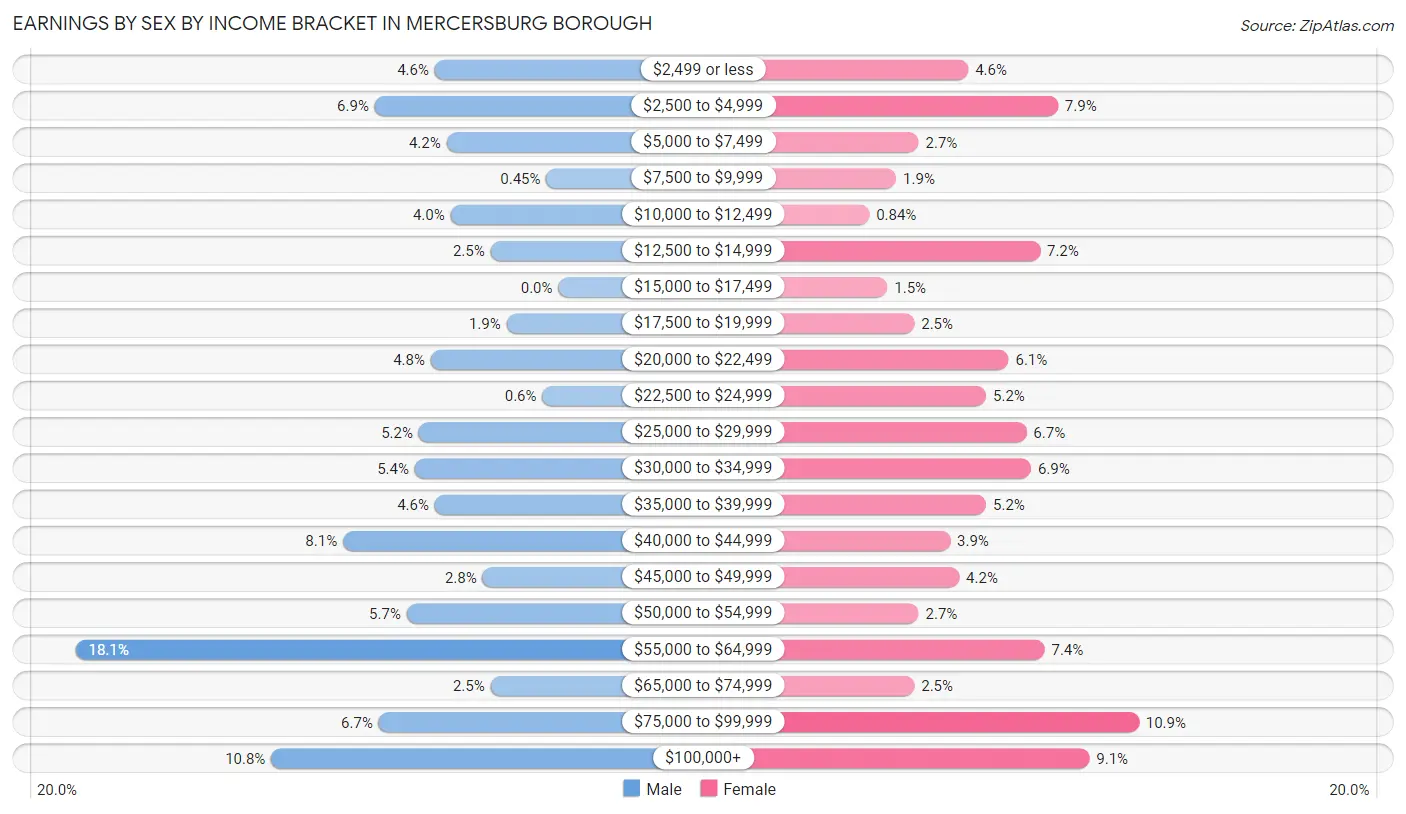
| Income | Male | Female |
| $2,499 or less | 31 (4.6%) | 27 (4.5%) |
| $2,500 to $4,999 | 46 (6.9%) | 47 (7.9%) |
| $5,000 to $7,499 | 28 (4.2%) | 16 (2.7%) |
| $7,500 to $9,999 | 3 (0.4%) | 11 (1.8%) |
| $10,000 to $12,499 | 27 (4.0%) | 5 (0.8%) |
| $12,500 to $14,999 | 17 (2.5%) | 43 (7.2%) |
| $15,000 to $17,499 | 0 (0.0%) | 9 (1.5%) |
| $17,500 to $19,999 | 13 (1.9%) | 15 (2.5%) |
| $20,000 to $22,499 | 32 (4.8%) | 36 (6.1%) |
| $22,500 to $24,999 | 4 (0.6%) | 31 (5.2%) |
| $25,000 to $29,999 | 35 (5.2%) | 40 (6.7%) |
| $30,000 to $34,999 | 36 (5.4%) | 41 (6.9%) |
| $35,000 to $39,999 | 31 (4.6%) | 31 (5.2%) |
| $40,000 to $44,999 | 54 (8.1%) | 23 (3.9%) |
| $45,000 to $49,999 | 19 (2.8%) | 25 (4.2%) |
| $50,000 to $54,999 | 38 (5.7%) | 16 (2.7%) |
| $55,000 to $64,999 | 121 (18.1%) | 44 (7.4%) |
| $65,000 to $74,999 | 17 (2.5%) | 15 (2.5%) |
| $75,000 to $99,999 | 45 (6.7%) | 65 (10.9%) |
| $100,000+ | 72 (10.8%) | 54 (9.1%) |
| Total | 669 (100.0%) | 594 (100.0%) |
Earnings by Sex by Educational Attainment in Mercersburg borough
Average earnings in Mercersburg borough are $49,583 for men and $34,375 for women, a difference of 30.7%. Men with an educational attainment of bachelor's degree enjoy the highest average annual earnings of $116,667, while those with high school diploma education earn the least with $40,789. Women with an educational attainment of graduate degree earn the most with the average annual earnings of $82,875, while those with bachelor's degree education have the smallest earnings of $28,036.
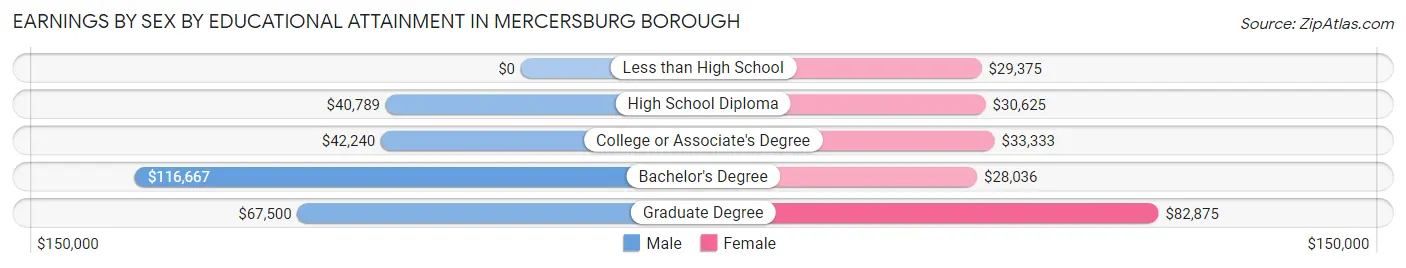
| Educational Attainment | Male Income | Female Income |
| Less than High School | - | - |
| High School Diploma | $40,789 | $30,625 |
| College or Associate's Degree | $42,240 | $33,333 |
| Bachelor's Degree | $116,667 | $28,036 |
| Graduate Degree | $67,500 | $82,875 |
| Total | $49,583 | $34,375 |
Family Income in Mercersburg borough
Family Income Brackets in Mercersburg borough
According to the Mercersburg borough family income data, there are 123 families falling into the $100,000 to $149,999 income range, which is the most common income bracket and makes up 24.7% of all families. Conversely, the $10,000 to $14,999 income bracket is the least frequent group with only 4 families (0.8%) belonging to this category.
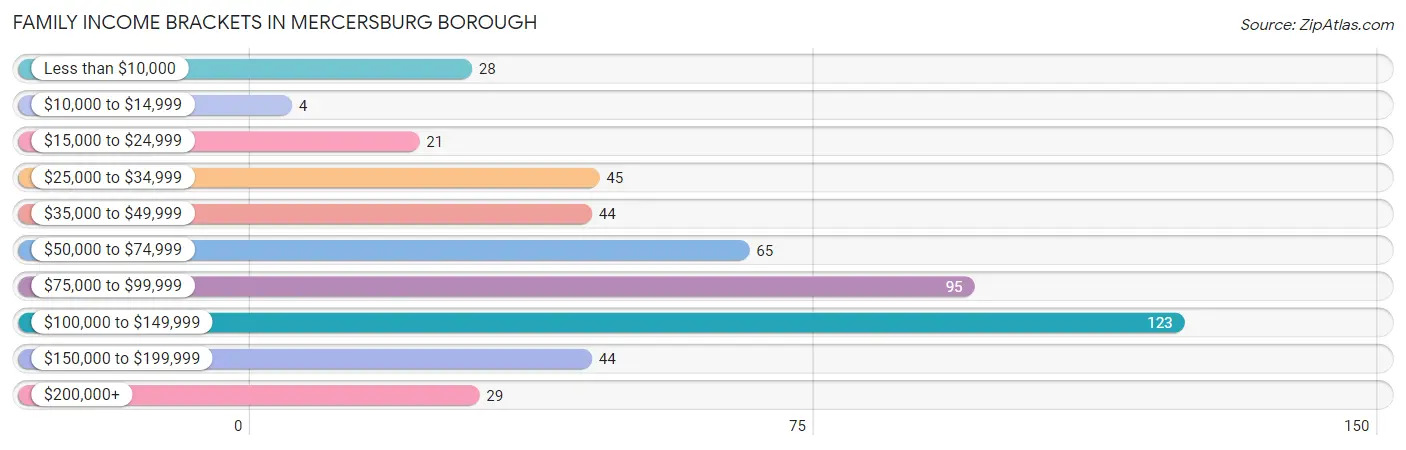
| Income Bracket | # Families | % Families |
| Less than $10,000 | 28 | 5.6% |
| $10,000 to $14,999 | 4 | 0.8% |
| $15,000 to $24,999 | 21 | 4.2% |
| $25,000 to $34,999 | 45 | 9.0% |
| $35,000 to $49,999 | 44 | 8.8% |
| $50,000 to $74,999 | 65 | 13.1% |
| $75,000 to $99,999 | 95 | 19.1% |
| $100,000 to $149,999 | 123 | 24.7% |
| $150,000 to $199,999 | 44 | 8.8% |
| $200,000+ | 29 | 5.8% |
Family Income by Famaliy Size in Mercersburg borough
5-person families (22 | 4.4%) account for the highest median family income in Mercersburg borough with $128,333 per family, while 2-person families (194 | 39.0%) have the highest median income of $31,875 per family member.
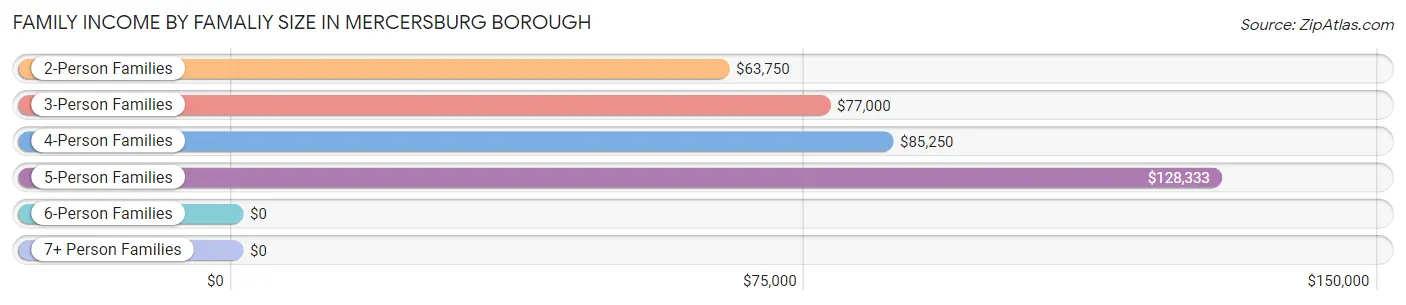
| Income Bracket | # Families | Median Income |
| 2-Person Families | 194 (39.0%) | $63,750 |
| 3-Person Families | 174 (34.9%) | $77,000 |
| 4-Person Families | 92 (18.5%) | $85,250 |
| 5-Person Families | 22 (4.4%) | $128,333 |
| 6-Person Families | 11 (2.2%) | $0 |
| 7+ Person Families | 5 (1.0%) | $0 |
| Total | 498 (100.0%) | $81,731 |
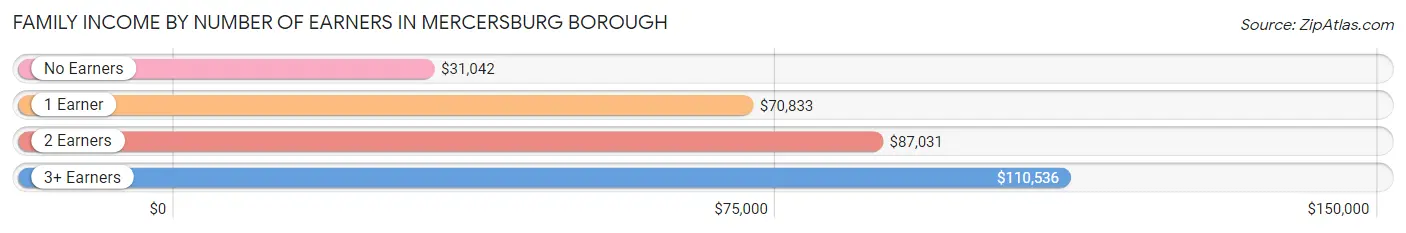
Family Income by Number of Earners in Mercersburg borough
The median family income in Mercersburg borough is $81,731, with families comprising 3+ earners (61) having the highest median family income of $110,536, while families with no earners (55) have the lowest median family income of $31,042, accounting for 12.2% and 11.0% of families, respectively.
| Number of Earners | # Families | Median Income |
| No Earners | 55 (11.0%) | $31,042 |
| 1 Earner | 166 (33.3%) | $70,833 |
| 2 Earners | 216 (43.4%) | $87,031 |
| 3+ Earners | 61 (12.2%) | $110,536 |
| Total | 498 (100.0%) | $81,731 |
Household Income in Mercersburg borough
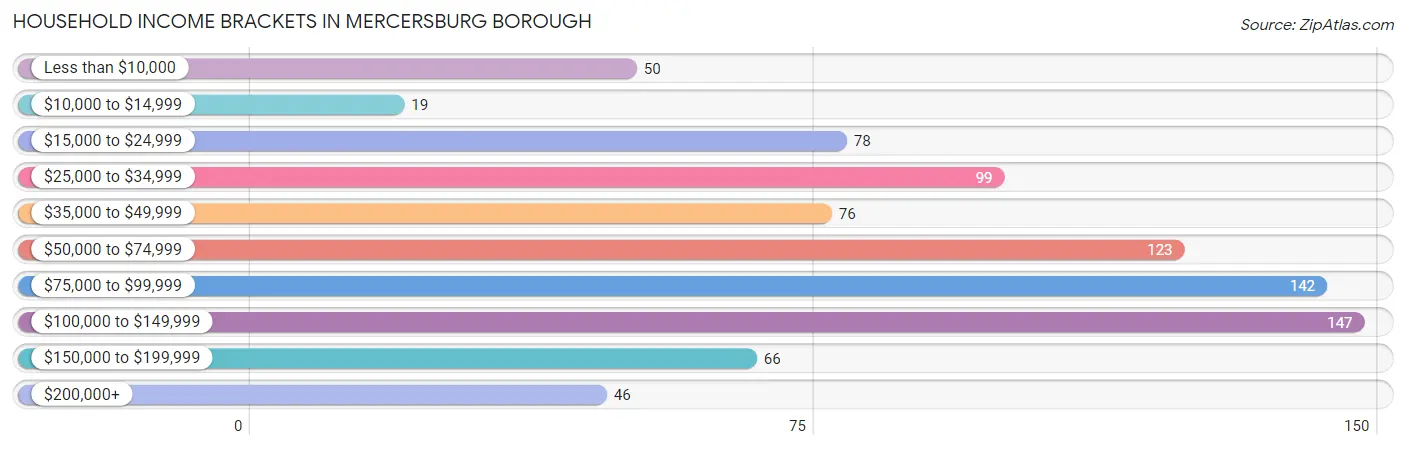
Household Income Brackets in Mercersburg borough
With 147 households falling in the category, the $100,000 to $149,999 income range is the most frequent in Mercersburg borough, accounting for 17.4% of all households. In contrast, only 19 households (2.2%) fall into the $10,000 to $14,999 income bracket, making it the least populous group.
| Income Bracket | # Households | % Households |
| Less than $10,000 | 50 | 5.9% |
| $10,000 to $14,999 | 19 | 2.2% |
| $15,000 to $24,999 | 78 | 9.2% |
| $25,000 to $34,999 | 99 | 11.7% |
| $35,000 to $49,999 | 76 | 9.0% |
| $50,000 to $74,999 | 123 | 14.5% |
| $75,000 to $99,999 | 142 | 16.8% |
| $100,000 to $149,999 | 147 | 17.4% |
| $150,000 to $199,999 | 66 | 7.8% |
| $200,000+ | 46 | 5.4% |
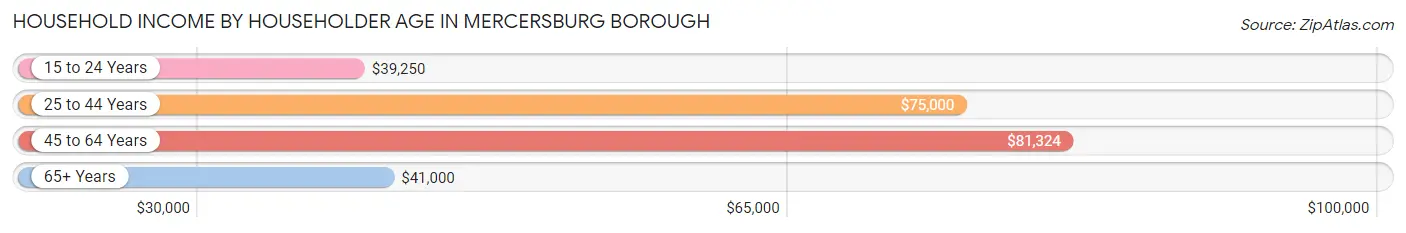
Household Income by Householder Age in Mercersburg borough
The median household income in Mercersburg borough is $71,905, with the highest median household income of $81,324 found in the 45 to 64 years age bracket for the primary householder. A total of 342 households (40.4%) fall into this category. Meanwhile, the 15 to 24 years age bracket for the primary householder has the lowest median household income of $39,250, with 24 households (2.8%) in this group.
| Income Bracket | # Households | Median Income |
| 15 to 24 Years | 24 (2.8%) | $39,250 |
| 25 to 44 Years | 220 (26.0%) | $75,000 |
| 45 to 64 Years | 342 (40.4%) | $81,324 |
| 65+ Years | 260 (30.7%) | $41,000 |
| Total | 846 (100.0%) | $71,905 |
Poverty in Mercersburg borough
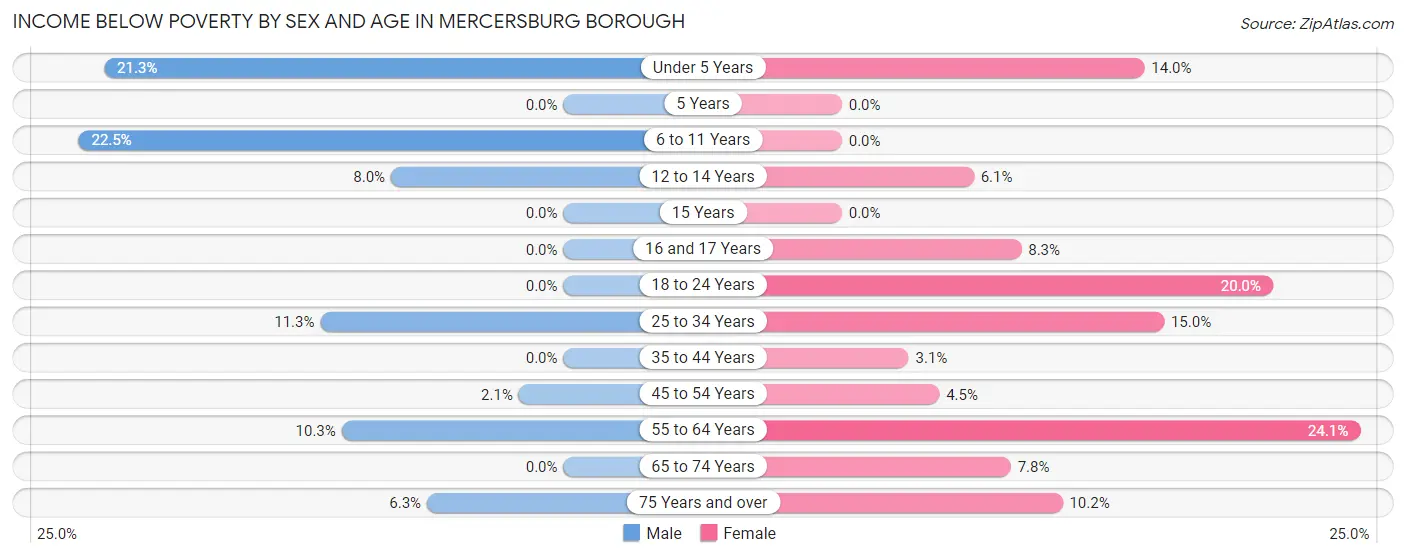
Income Below Poverty by Sex and Age in Mercersburg borough
With 7.2% poverty level for males and 10.4% for females among the residents of Mercersburg borough, 6 to 11 year old males and 55 to 64 year old females are the most vulnerable to poverty, with 18 males (22.5%) and 38 females (24.0%) in their respective age groups living below the poverty level.
| Age Bracket | Male | Female |
| Under 5 Years | 13 (21.3%) | 8 (14.0%) |
| 5 Years | 0 (0.0%) | 0 (0.0%) |
| 6 to 11 Years | 18 (22.5%) | 0 (0.0%) |
| 12 to 14 Years | 2 (8.0%) | 3 (6.1%) |
| 15 Years | 0 (0.0%) | 0 (0.0%) |
| 16 and 17 Years | 0 (0.0%) | 1 (8.3%) |
| 18 to 24 Years | 0 (0.0%) | 10 (20.0%) |
| 25 to 34 Years | 15 (11.3%) | 16 (14.9%) |
| 35 to 44 Years | 0 (0.0%) | 4 (3.1%) |
| 45 to 54 Years | 3 (2.1%) | 8 (4.5%) |
| 55 to 64 Years | 18 (10.3%) | 38 (24.0%) |
| 65 to 74 Years | 0 (0.0%) | 8 (7.8%) |
| 75 Years and over | 5 (6.3%) | 13 (10.2%) |
| Total | 74 (7.2%) | 109 (10.4%) |
Income Above Poverty by Sex and Age in Mercersburg borough
According to the poverty statistics in Mercersburg borough, males aged 5 years and females aged 5 years are the age groups that are most secure financially, with 100.0% of males and 100.0% of females in these age groups living above the poverty line.
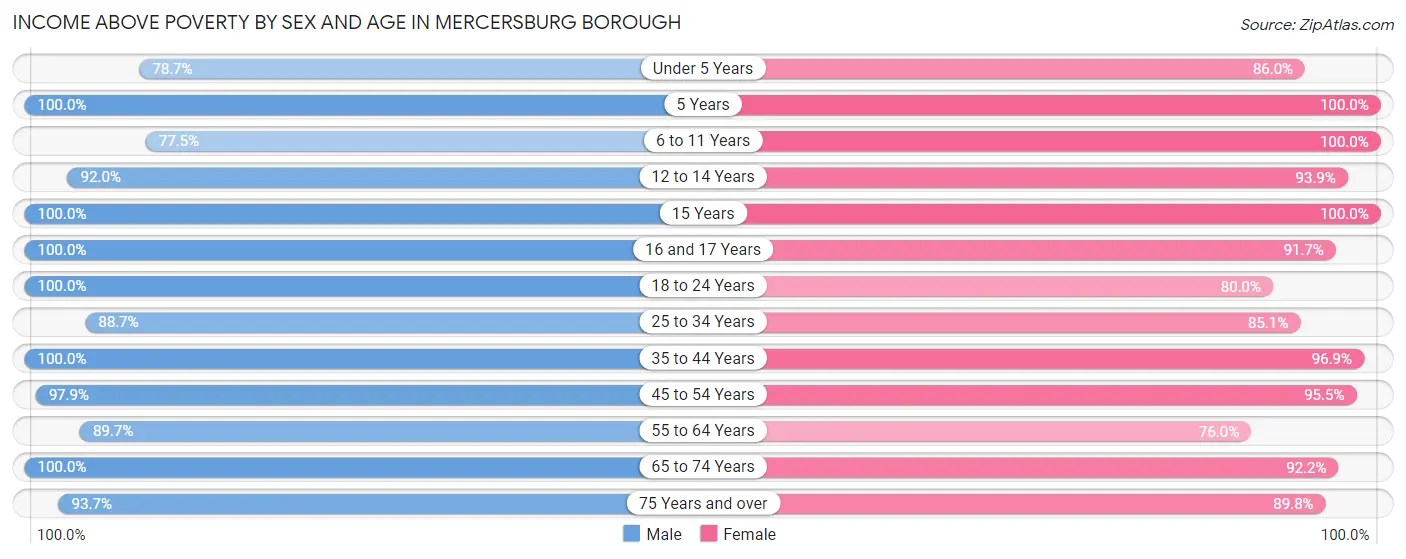
| Age Bracket | Male | Female |
| Under 5 Years | 48 (78.7%) | 49 (86.0%) |
| 5 Years | 3 (100.0%) | 6 (100.0%) |
| 6 to 11 Years | 62 (77.5%) | 59 (100.0%) |
| 12 to 14 Years | 23 (92.0%) | 46 (93.9%) |
| 15 Years | 15 (100.0%) | 13 (100.0%) |
| 16 and 17 Years | 21 (100.0%) | 11 (91.7%) |
| 18 to 24 Years | 101 (100.0%) | 40 (80.0%) |
| 25 to 34 Years | 118 (88.7%) | 91 (85.1%) |
| 35 to 44 Years | 122 (100.0%) | 125 (96.9%) |
| 45 to 54 Years | 142 (97.9%) | 169 (95.5%) |
| 55 to 64 Years | 157 (89.7%) | 120 (75.9%) |
| 65 to 74 Years | 62 (100.0%) | 94 (92.2%) |
| 75 Years and over | 74 (93.7%) | 114 (89.8%) |
| Total | 948 (92.8%) | 937 (89.6%) |
Income Below Poverty Among Married-Couple Families in Mercersburg borough
The poverty statistics for married-couple families in Mercersburg borough show that 5.2% or 16 of the total 306 families live below the poverty line. Families with no children have the highest poverty rate of 8.4%, comprising of 16 families. On the other hand, families with 1 or 2 children have the lowest poverty rate of 0.0%, which includes 0 families.
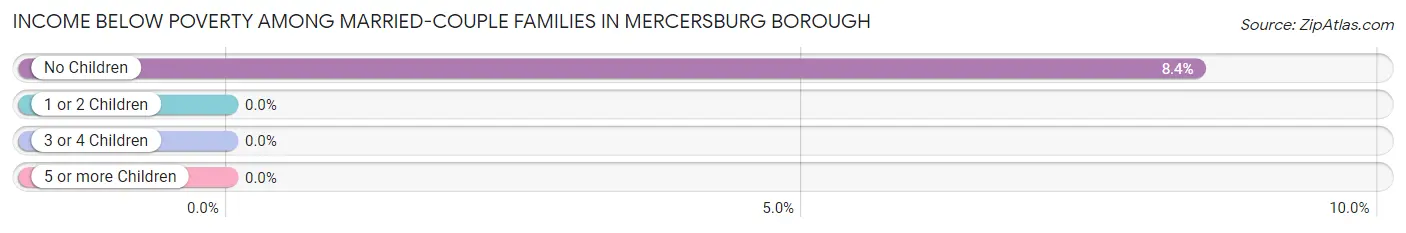
| Children | Above Poverty | Below Poverty |
| No Children | 174 (91.6%) | 16 (8.4%) |
| 1 or 2 Children | 109 (100.0%) | 0 (0.0%) |
| 3 or 4 Children | 7 (100.0%) | 0 (0.0%) |
| 5 or more Children | 0 (0.0%) | 0 (0.0%) |
| Total | 290 (94.8%) | 16 (5.2%) |
Income Below Poverty Among Single-Parent Households in Mercersburg borough
According to the poverty data in Mercersburg borough, 35.1% or 13 single-father households and 6.5% or 10 single-mother households are living below the poverty line. Among single-father households, those with 1 or 2 children have the highest poverty rate, with 9 households (90.0%) experiencing poverty. Likewise, among single-mother households, those with 3 or 4 children have the highest poverty rate, with 2 households (22.2%) falling below the poverty line.
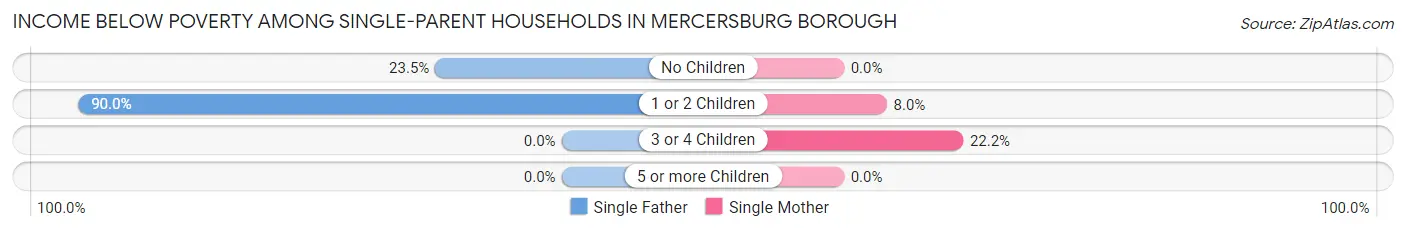
| Children | Single Father | Single Mother |
| No Children | 4 (23.5%) | 0 (0.0%) |
| 1 or 2 Children | 9 (90.0%) | 8 (8.0%) |
| 3 or 4 Children | 0 (0.0%) | 2 (22.2%) |
| 5 or more Children | 0 (0.0%) | 0 (0.0%) |
| Total | 13 (35.1%) | 10 (6.5%) |
Income Below Poverty Among Married-Couple vs Single-Parent Households in Mercersburg borough
The poverty data for Mercersburg borough shows that 16 of the married-couple family households (5.2%) and 23 of the single-parent households (12.0%) are living below the poverty level. Within the married-couple family households, those with no children have the highest poverty rate, with 16 households (8.4%) falling below the poverty line. Among the single-parent households, those with 1 or 2 children have the highest poverty rate, with 17 household (15.4%) living below poverty.
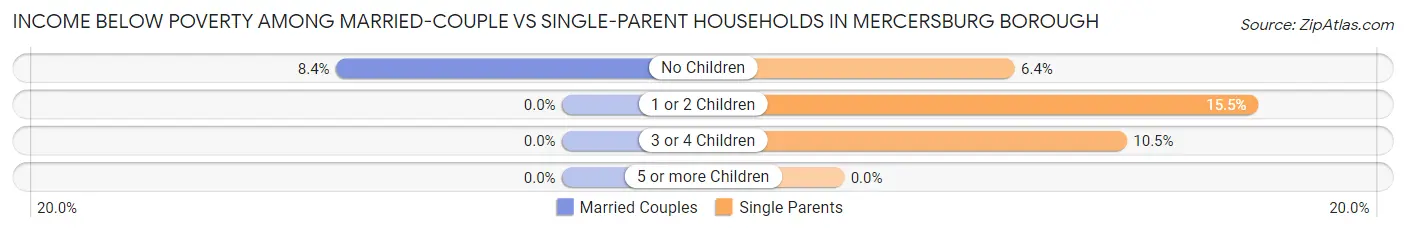
| Children | Married-Couple Families | Single-Parent Households |
| No Children | 16 (8.4%) | 4 (6.4%) |
| 1 or 2 Children | 0 (0.0%) | 17 (15.4%) |
| 3 or 4 Children | 0 (0.0%) | 2 (10.5%) |
| 5 or more Children | 0 (0.0%) | 0 (0.0%) |
| Total | 16 (5.2%) | 23 (12.0%) |
Employment Characteristics in Mercersburg borough
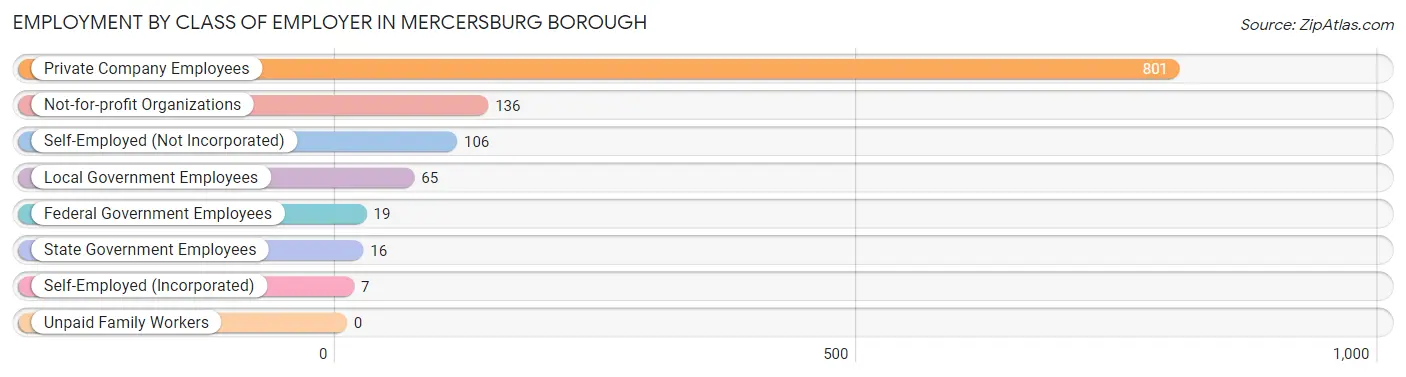
Employment by Class of Employer in Mercersburg borough
Among the 1,150 employed individuals in Mercersburg borough, private company employees (801 | 69.7%), not-for-profit organizations (136 | 11.8%), and self-employed (not incorporated) (106 | 9.2%) make up the most common classes of employment.
| Employer Class | # Employees | % Employees |
| Private Company Employees | 801 | 69.7% |
| Self-Employed (Incorporated) | 7 | 0.6% |
| Self-Employed (Not Incorporated) | 106 | 9.2% |
| Not-for-profit Organizations | 136 | 11.8% |
| Local Government Employees | 65 | 5.7% |
| State Government Employees | 16 | 1.4% |
| Federal Government Employees | 19 | 1.7% |
| Unpaid Family Workers | 0 | 0.0% |
| Total | 1,150 | 100.0% |
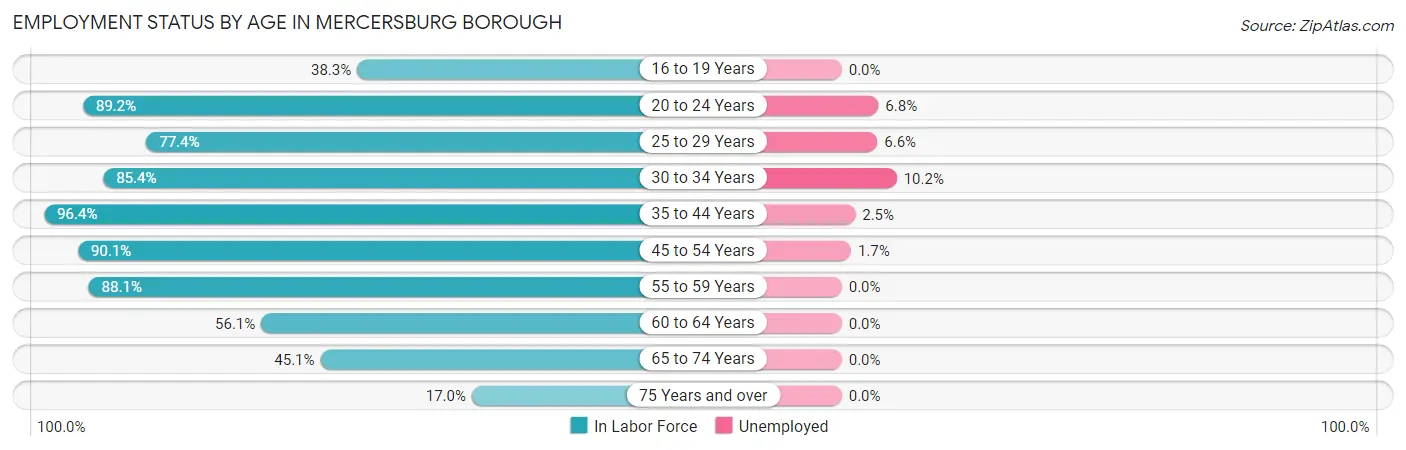
Employment Status by Age in Mercersburg borough
According to the labor force statistics for Mercersburg borough, out of the total population over 16 years of age (1,706), 70.4% or 1,201 individuals are in the labor force, with 2.7% or 32 of them unemployed. The age group with the highest labor force participation rate is 35 to 44 years, with 96.4% or 242 individuals in the labor force. Within the labor force, the 30 to 34 years age range has the highest percentage of unemployed individuals, with 10.2% or 9 of them being unemployed.
| Age Bracket | In Labor Force | Unemployed |
| 16 to 19 Years | 41 (38.3%) | 0 (0.0%) |
| 20 to 24 Years | 74 (89.2%) | 5 (6.8%) |
| 25 to 29 Years | 106 (77.4%) | 7 (6.6%) |
| 30 to 34 Years | 88 (85.4%) | 9 (10.2%) |
| 35 to 44 Years | 242 (96.4%) | 6 (2.5%) |
| 45 to 54 Years | 290 (90.1%) | 5 (1.7%) |
| 55 to 59 Years | 177 (88.1%) | 0 (0.0%) |
| 60 to 64 Years | 74 (56.1%) | 0 (0.0%) |
| 65 to 74 Years | 74 (45.1%) | 0 (0.0%) |
| 75 Years and over | 35 (17.0%) | 0 (0.0%) |
| Total | 1,201 (70.4%) | 32 (2.7%) |
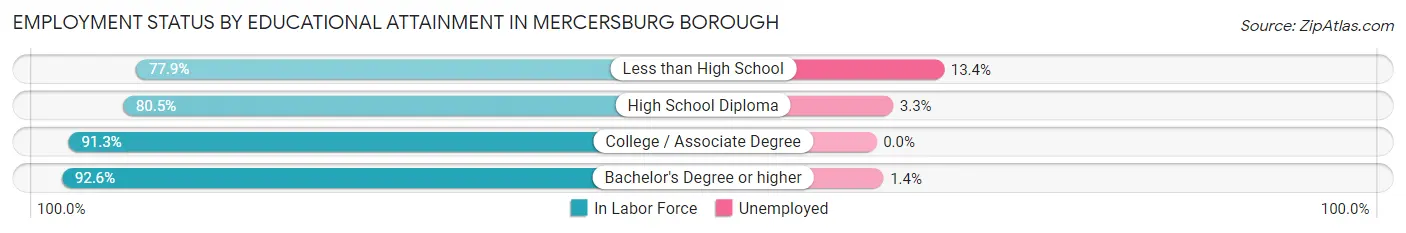
Employment Status by Educational Attainment in Mercersburg borough
According to labor force statistics for Mercersburg borough, 85.3% of individuals (978) out of the total population between 25 and 64 years of age (1,146) are in the labor force, with 2.8% or 27 of them being unemployed. The group with the highest labor force participation rate are those with the educational attainment of bachelor's degree or higher, with 92.6% or 214 individuals in the labor force. Within the labor force, individuals with less than high school education have the highest percentage of unemployment, with 13.4% or 9 of them being unemployed.
| Educational Attainment | In Labor Force | Unemployed |
| Less than High School | 67 (77.9%) | 12 (13.4%) |
| High School Diploma | 455 (80.5%) | 19 (3.3%) |
| College / Associate Degree | 241 (91.3%) | 0 (0.0%) |
| Bachelor's Degree or higher | 214 (92.6%) | 3 (1.4%) |
| Total | 978 (85.3%) | 32 (2.8%) |
Employment Occupations by Sex in Mercersburg borough
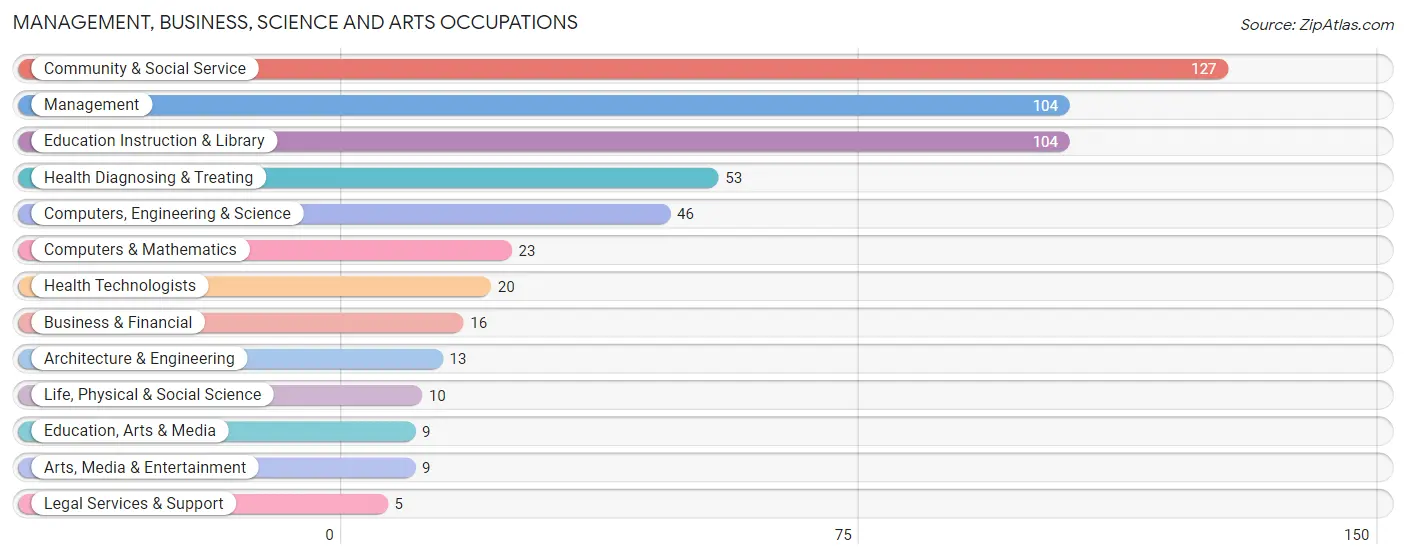
Management, Business, Science and Arts Occupations
The most common Management, Business, Science and Arts occupations in Mercersburg borough are Community & Social Service (127 | 10.9%), Management (104 | 8.9%), Education Instruction & Library (104 | 8.9%), Health Diagnosing & Treating (53 | 4.5%), and Computers, Engineering & Science (46 | 3.9%).
Management, Business, Science and Arts Occupations by Sex
Within the Management, Business, Science and Arts occupations in Mercersburg borough, the most male-oriented occupations are Legal Services & Support (100.0%), Life, Physical & Social Science (70.0%), and Computers, Engineering & Science (63.0%), while the most female-oriented occupations are Education, Arts & Media (100.0%), Arts, Media & Entertainment (100.0%), and Health Diagnosing & Treating (77.4%).
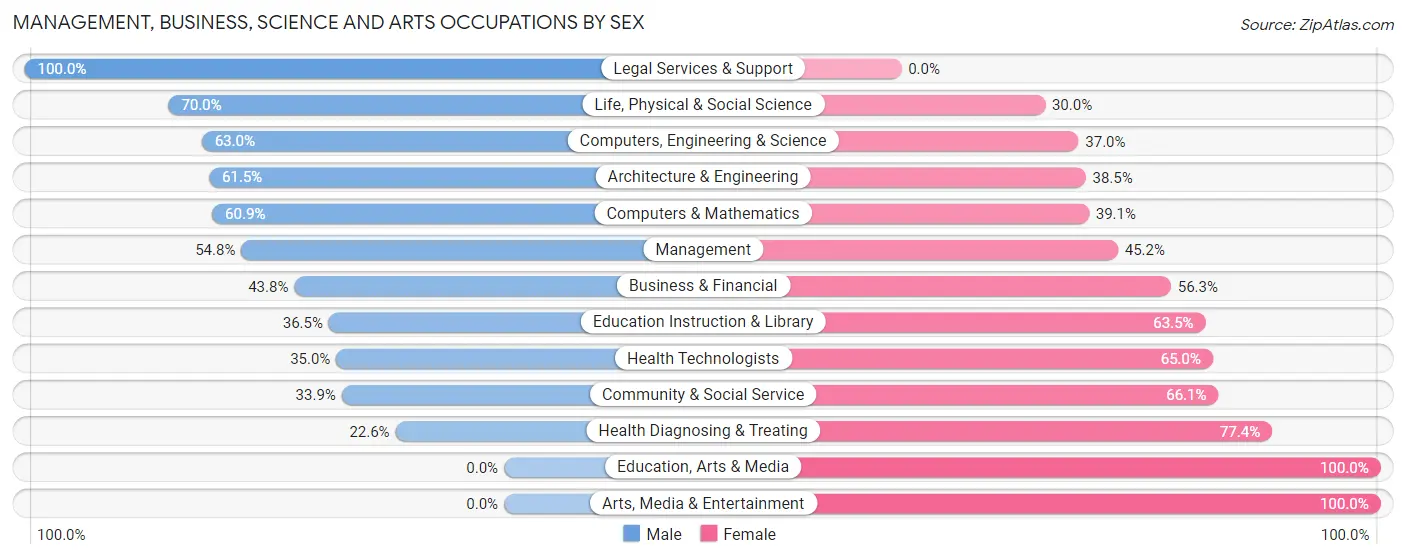
| Occupation | Male | Female |
| Management | 57 (54.8%) | 47 (45.2%) |
| Business & Financial | 7 (43.8%) | 9 (56.2%) |
| Computers, Engineering & Science | 29 (63.0%) | 17 (37.0%) |
| Computers & Mathematics | 14 (60.9%) | 9 (39.1%) |
| Architecture & Engineering | 8 (61.5%) | 5 (38.5%) |
| Life, Physical & Social Science | 7 (70.0%) | 3 (30.0%) |
| Community & Social Service | 43 (33.9%) | 84 (66.1%) |
| Education, Arts & Media | 0 (0.0%) | 9 (100.0%) |
| Legal Services & Support | 5 (100.0%) | 0 (0.0%) |
| Education Instruction & Library | 38 (36.5%) | 66 (63.5%) |
| Arts, Media & Entertainment | 0 (0.0%) | 9 (100.0%) |
| Health Diagnosing & Treating | 12 (22.6%) | 41 (77.4%) |
| Health Technologists | 7 (35.0%) | 13 (65.0%) |
| Total (Category) | 148 (42.8%) | 198 (57.2%) |
| Total (Overall) | 616 (52.7%) | 553 (47.3%) |
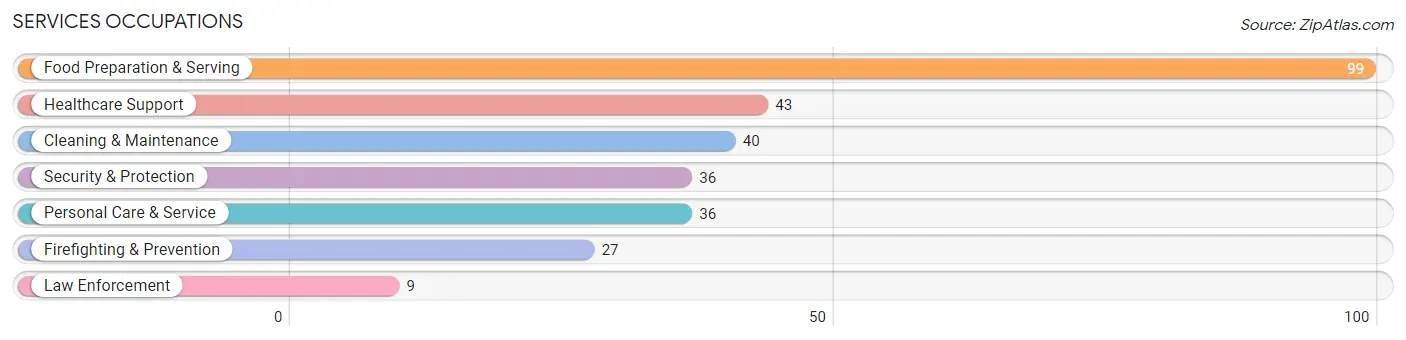
Services Occupations
The most common Services occupations in Mercersburg borough are Food Preparation & Serving (99 | 8.5%), Healthcare Support (43 | 3.7%), Cleaning & Maintenance (40 | 3.4%), Security & Protection (36 | 3.1%), and Personal Care & Service (36 | 3.1%).
Services Occupations by Sex
Within the Services occupations in Mercersburg borough, the most male-oriented occupations are Law Enforcement (100.0%), Cleaning & Maintenance (75.0%), and Food Preparation & Serving (59.6%), while the most female-oriented occupations are Healthcare Support (93.0%), Personal Care & Service (88.9%), and Firefighting & Prevention (66.7%).
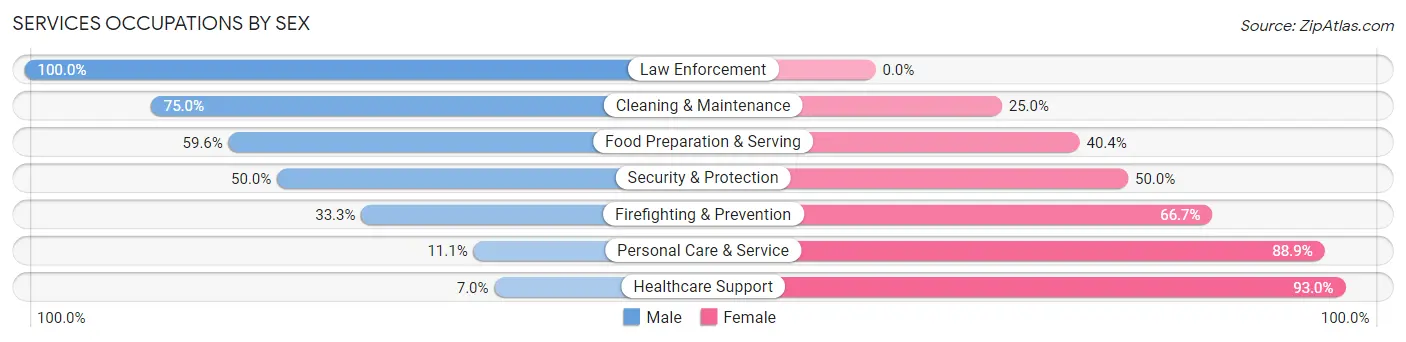
| Occupation | Male | Female |
| Healthcare Support | 3 (7.0%) | 40 (93.0%) |
| Security & Protection | 18 (50.0%) | 18 (50.0%) |
| Firefighting & Prevention | 9 (33.3%) | 18 (66.7%) |
| Law Enforcement | 9 (100.0%) | 0 (0.0%) |
| Food Preparation & Serving | 59 (59.6%) | 40 (40.4%) |
| Cleaning & Maintenance | 30 (75.0%) | 10 (25.0%) |
| Personal Care & Service | 4 (11.1%) | 32 (88.9%) |
| Total (Category) | 114 (44.9%) | 140 (55.1%) |
| Total (Overall) | 616 (52.7%) | 553 (47.3%) |
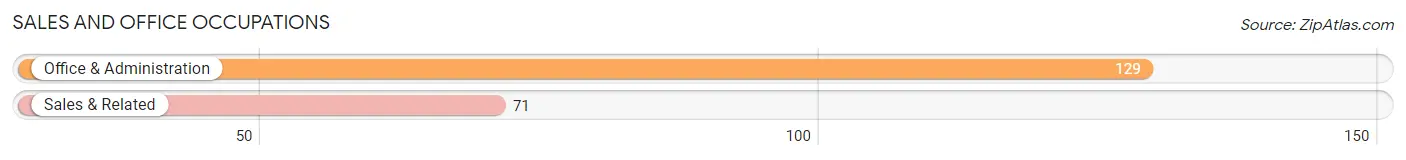
Sales and Office Occupations
The most common Sales and Office occupations in Mercersburg borough are Office & Administration (129 | 11.0%), and Sales & Related (71 | 6.1%).
Sales and Office Occupations by Sex
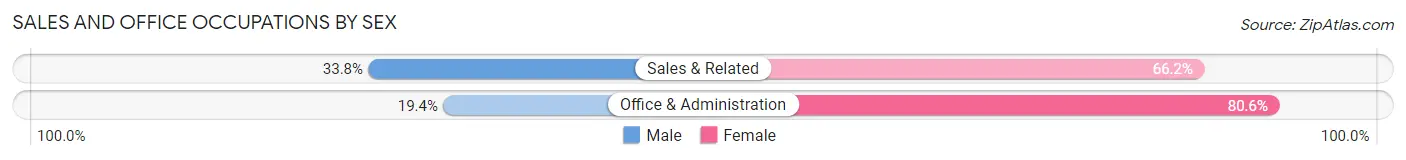
| Occupation | Male | Female |
| Sales & Related | 24 (33.8%) | 47 (66.2%) |
| Office & Administration | 25 (19.4%) | 104 (80.6%) |
| Total (Category) | 49 (24.5%) | 151 (75.5%) |
| Total (Overall) | 616 (52.7%) | 553 (47.3%) |
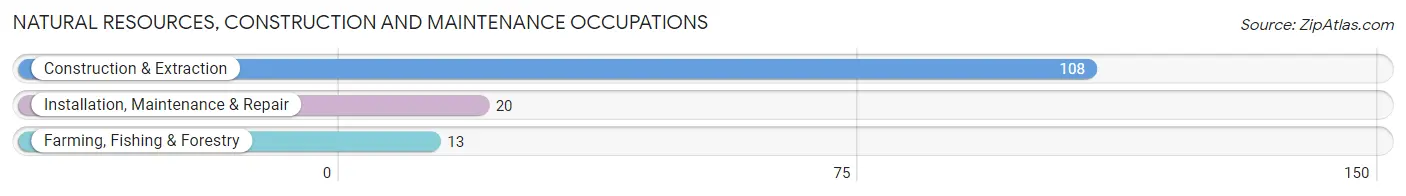
Natural Resources, Construction and Maintenance Occupations
The most common Natural Resources, Construction and Maintenance occupations in Mercersburg borough are Construction & Extraction (108 | 9.2%), Installation, Maintenance & Repair (20 | 1.7%), and Farming, Fishing & Forestry (13 | 1.1%).
Natural Resources, Construction and Maintenance Occupations by Sex
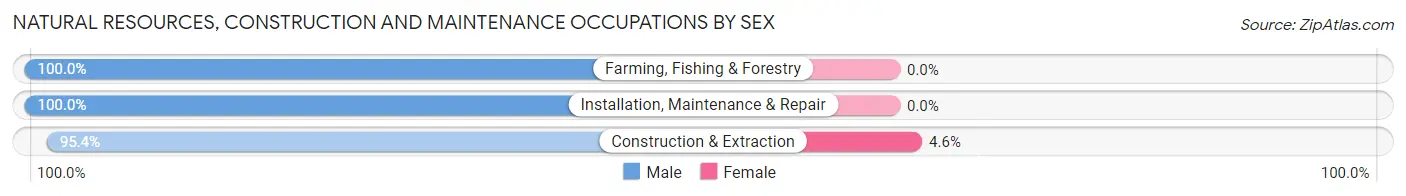
| Occupation | Male | Female |
| Farming, Fishing & Forestry | 13 (100.0%) | 0 (0.0%) |
| Construction & Extraction | 103 (95.4%) | 5 (4.6%) |
| Installation, Maintenance & Repair | 20 (100.0%) | 0 (0.0%) |
| Total (Category) | 136 (96.5%) | 5 (3.5%) |
| Total (Overall) | 616 (52.7%) | 553 (47.3%) |
Production, Transportation and Moving Occupations
The most common Production, Transportation and Moving occupations in Mercersburg borough are Production (120 | 10.3%), Material Moving (70 | 6.0%), and Transportation (38 | 3.3%).
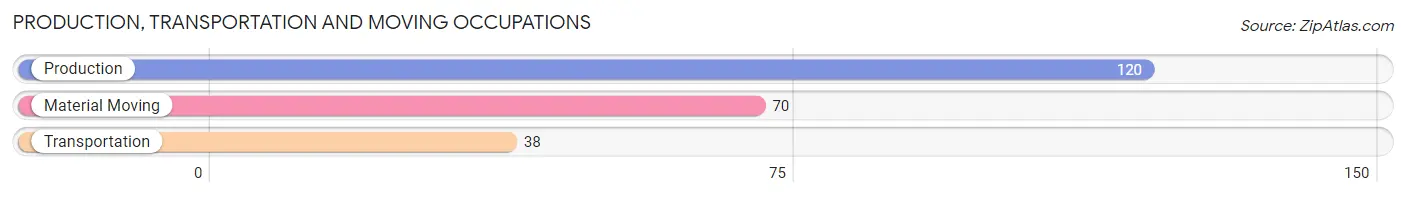
Production, Transportation and Moving Occupations by Sex
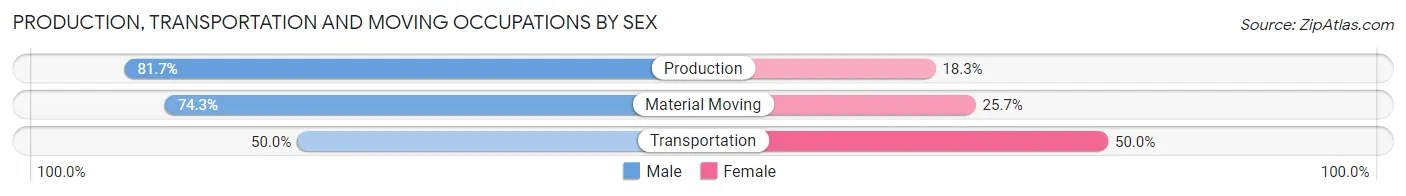
| Occupation | Male | Female |
| Production | 98 (81.7%) | 22 (18.3%) |
| Transportation | 19 (50.0%) | 19 (50.0%) |
| Material Moving | 52 (74.3%) | 18 (25.7%) |
| Total (Category) | 169 (74.1%) | 59 (25.9%) |
| Total (Overall) | 616 (52.7%) | 553 (47.3%) |
Employment Industries by Sex in Mercersburg borough
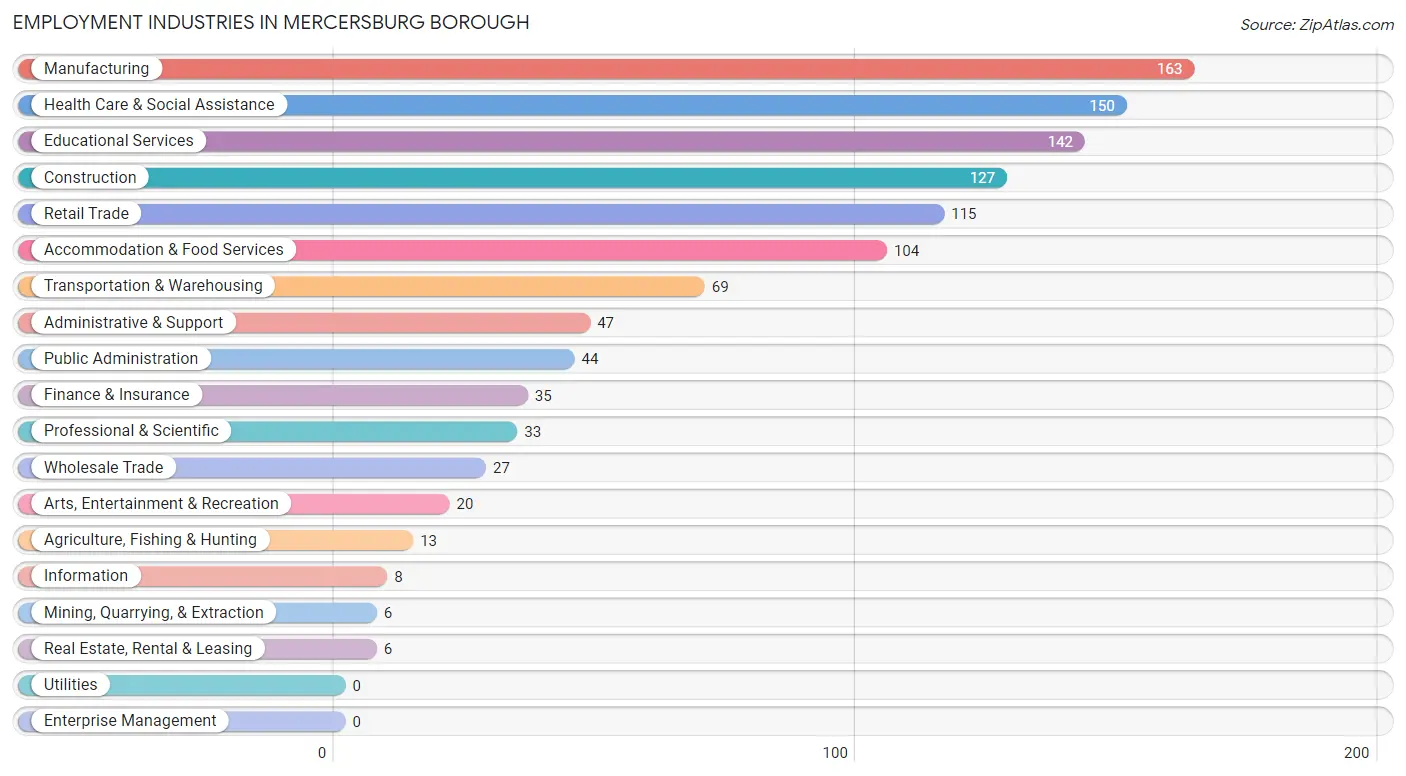
Employment Industries in Mercersburg borough
The major employment industries in Mercersburg borough include Manufacturing (163 | 13.9%), Health Care & Social Assistance (150 | 12.8%), Educational Services (142 | 12.1%), Construction (127 | 10.9%), and Retail Trade (115 | 9.8%).
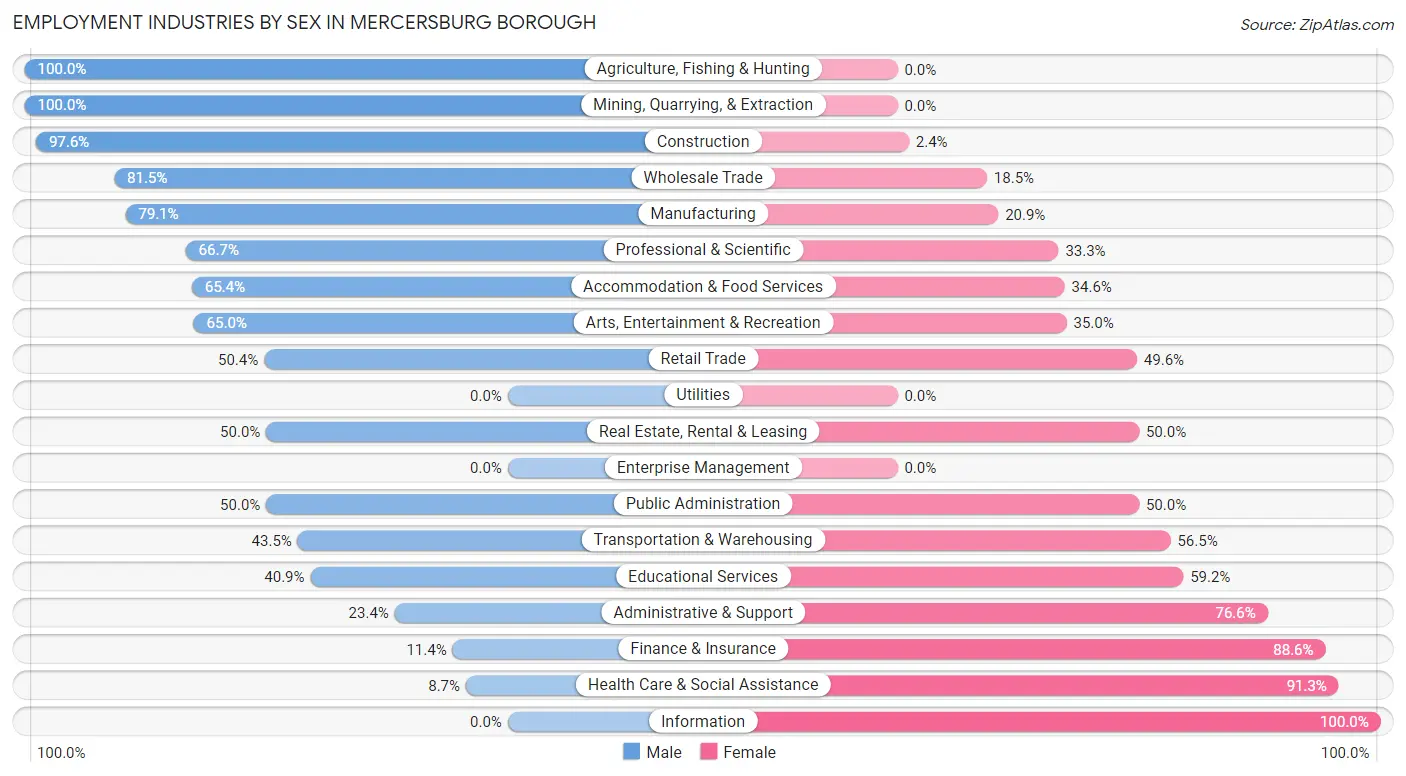
Employment Industries by Sex in Mercersburg borough
The Mercersburg borough industries that see more men than women are Agriculture, Fishing & Hunting (100.0%), Mining, Quarrying, & Extraction (100.0%), and Construction (97.6%), whereas the industries that tend to have a higher number of women are Information (100.0%), Health Care & Social Assistance (91.3%), and Finance & Insurance (88.6%).
| Industry | Male | Female |
| Agriculture, Fishing & Hunting | 13 (100.0%) | 0 (0.0%) |
| Mining, Quarrying, & Extraction | 6 (100.0%) | 0 (0.0%) |
| Construction | 124 (97.6%) | 3 (2.4%) |
| Manufacturing | 129 (79.1%) | 34 (20.9%) |
| Wholesale Trade | 22 (81.5%) | 5 (18.5%) |
| Retail Trade | 58 (50.4%) | 57 (49.6%) |
| Transportation & Warehousing | 30 (43.5%) | 39 (56.5%) |
| Utilities | 0 (0.0%) | 0 (0.0%) |
| Information | 0 (0.0%) | 8 (100.0%) |
| Finance & Insurance | 4 (11.4%) | 31 (88.6%) |
| Real Estate, Rental & Leasing | 3 (50.0%) | 3 (50.0%) |
| Professional & Scientific | 22 (66.7%) | 11 (33.3%) |
| Enterprise Management | 0 (0.0%) | 0 (0.0%) |
| Administrative & Support | 11 (23.4%) | 36 (76.6%) |
| Educational Services | 58 (40.8%) | 84 (59.2%) |
| Health Care & Social Assistance | 13 (8.7%) | 137 (91.3%) |
| Arts, Entertainment & Recreation | 13 (65.0%) | 7 (35.0%) |
| Accommodation & Food Services | 68 (65.4%) | 36 (34.6%) |
| Public Administration | 22 (50.0%) | 22 (50.0%) |
| Total | 616 (52.7%) | 553 (47.3%) |
Education in Mercersburg borough
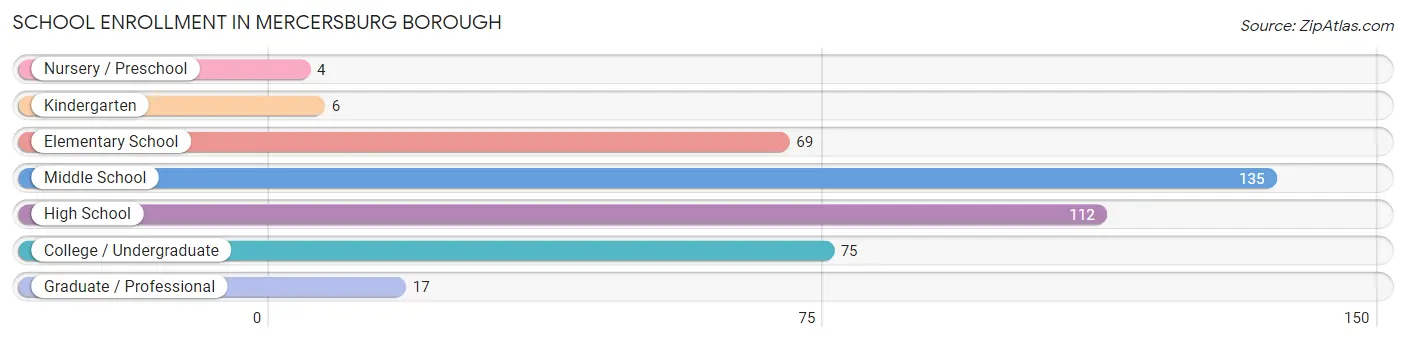
School Enrollment in Mercersburg borough
The most common levels of schooling among the 418 students in Mercersburg borough are middle school (135 | 32.3%), high school (112 | 26.8%), and college / undergraduate (75 | 17.9%).
| School Level | # Students | % Students |
| Nursery / Preschool | 4 | 1.0% |
| Kindergarten | 6 | 1.4% |
| Elementary School | 69 | 16.5% |
| Middle School | 135 | 32.3% |
| High School | 112 | 26.8% |
| College / Undergraduate | 75 | 17.9% |
| Graduate / Professional | 17 | 4.1% |
| Total | 418 | 100.0% |
School Enrollment by Age by Funding Source in Mercersburg borough
Out of a total of 418 students who are enrolled in schools in Mercersburg borough, 60 (14.4%) attend a private institution, while the remaining 358 (85.6%) are enrolled in public schools. The age group of 18 to 19 year olds has the highest likelihood of being enrolled in private schools, with 18 (34.0% in the age bracket) enrolled. Conversely, the age group of 3 to 4 year olds has the lowest likelihood of being enrolled in a private school, with 4 (100.0% in the age bracket) attending a public institution.
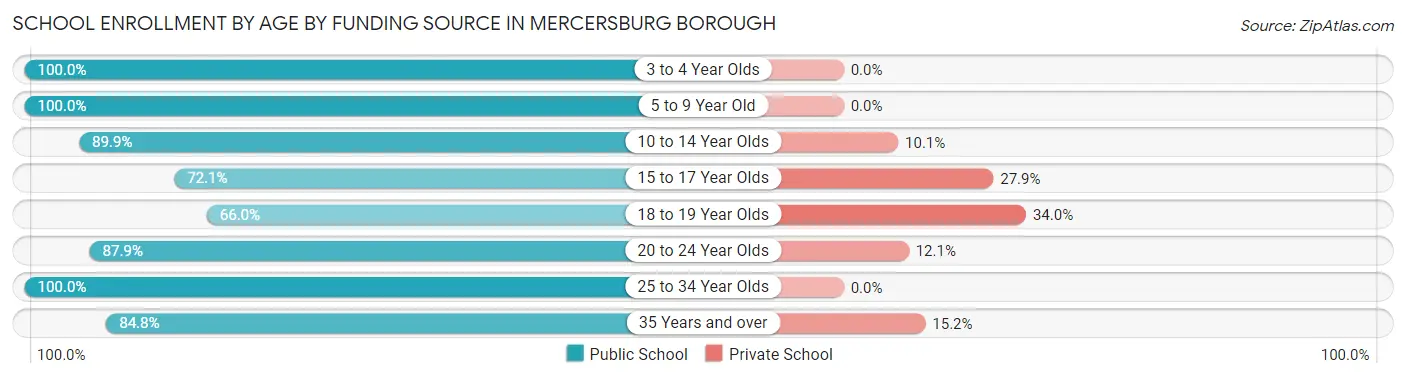
| Age Bracket | Public School | Private School |
| 3 to 4 Year Olds | 4 (100.0%) | 0 (0.0%) |
| 5 to 9 Year Old | 75 (100.0%) | 0 (0.0%) |
| 10 to 14 Year Olds | 124 (89.9%) | 14 (10.1%) |
| 15 to 17 Year Olds | 44 (72.1%) | 17 (27.9%) |
| 18 to 19 Year Olds | 35 (66.0%) | 18 (34.0%) |
| 20 to 24 Year Olds | 29 (87.9%) | 4 (12.1%) |
| 25 to 34 Year Olds | 8 (100.0%) | 0 (0.0%) |
| 35 Years and over | 39 (84.8%) | 7 (15.2%) |
| Total | 358 (85.6%) | 60 (14.4%) |
Educational Attainment by Field of Study in Mercersburg borough
Education (68 | 23.1%), business (38 | 12.9%), science & technology (25 | 8.5%), literature & languages (24 | 8.1%), and arts & humanities (20 | 6.8%) are the most common fields of study among 295 individuals in Mercersburg borough who have obtained a bachelor's degree or higher.
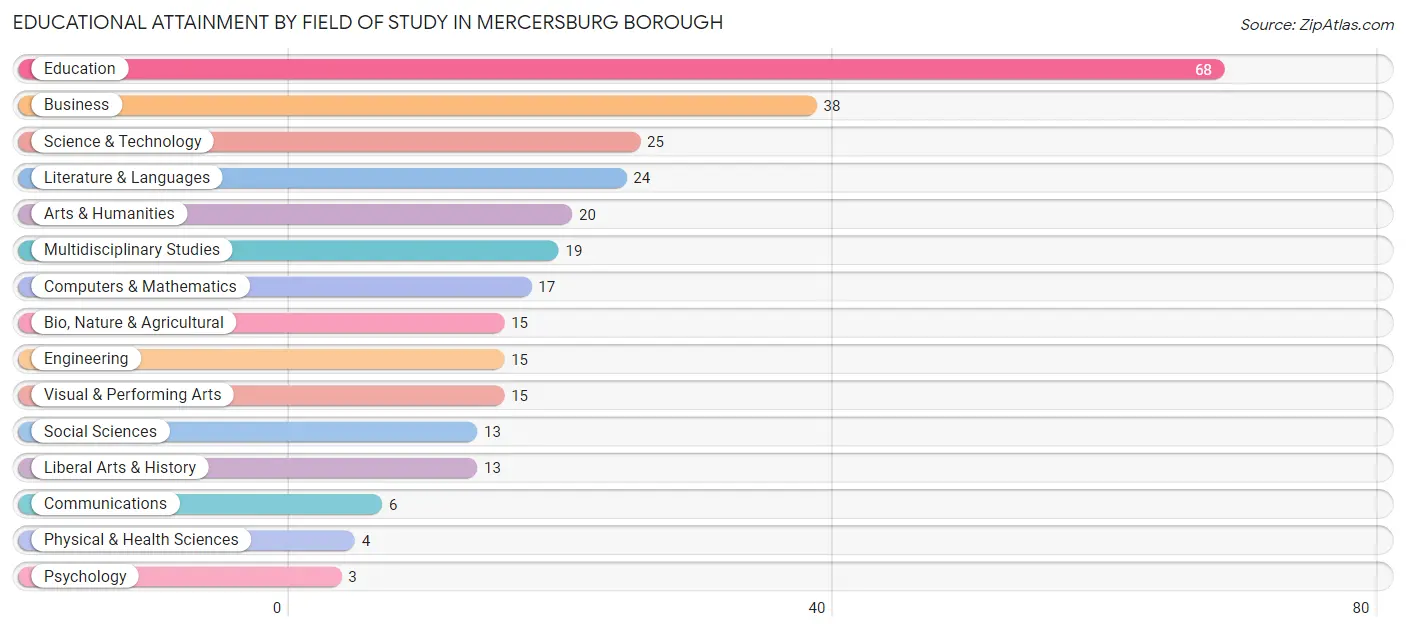
| Field of Study | # Graduates | % Graduates |
| Computers & Mathematics | 17 | 5.8% |
| Bio, Nature & Agricultural | 15 | 5.1% |
| Physical & Health Sciences | 4 | 1.4% |
| Psychology | 3 | 1.0% |
| Social Sciences | 13 | 4.4% |
| Engineering | 15 | 5.1% |
| Multidisciplinary Studies | 19 | 6.4% |
| Science & Technology | 25 | 8.5% |
| Business | 38 | 12.9% |
| Education | 68 | 23.1% |
| Literature & Languages | 24 | 8.1% |
| Liberal Arts & History | 13 | 4.4% |
| Visual & Performing Arts | 15 | 5.1% |
| Communications | 6 | 2.0% |
| Arts & Humanities | 20 | 6.8% |
| Total | 295 | 100.0% |
Transportation & Commute in Mercersburg borough
Vehicle Availability by Sex in Mercersburg borough
The most prevalent vehicle ownership categories in Mercersburg borough are males with 2 vehicles (276, accounting for 45.0%) and females with 2 vehicles (203, making up 51.4%).
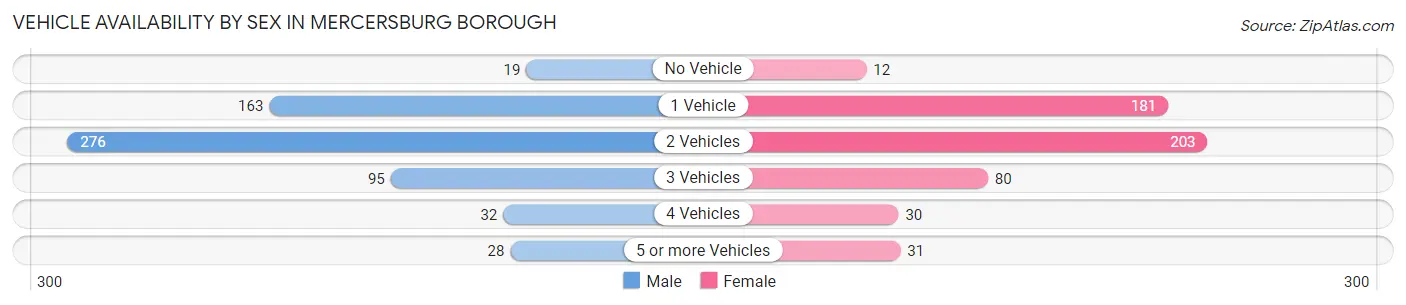
| Vehicles Available | Male | Female |
| No Vehicle | 19 (3.1%) | 12 (2.2%) |
| 1 Vehicle | 163 (26.6%) | 181 (33.7%) |
| 2 Vehicles | 276 (45.0%) | 203 (37.8%) |
| 3 Vehicles | 95 (15.5%) | 80 (14.9%) |
| 4 Vehicles | 32 (5.2%) | 30 (5.6%) |
| 5 or more Vehicles | 28 (4.6%) | 31 (5.8%) |
| Total | 613 (100.0%) | 537 (100.0%) |
Commute Time in Mercersburg borough
The most frequently occuring commute durations in Mercersburg borough are 30 to 34 minutes (233 commuters, 21.7%), 5 to 9 minutes (191 commuters, 17.8%), and less than 5 minutes (153 commuters, 14.3%).
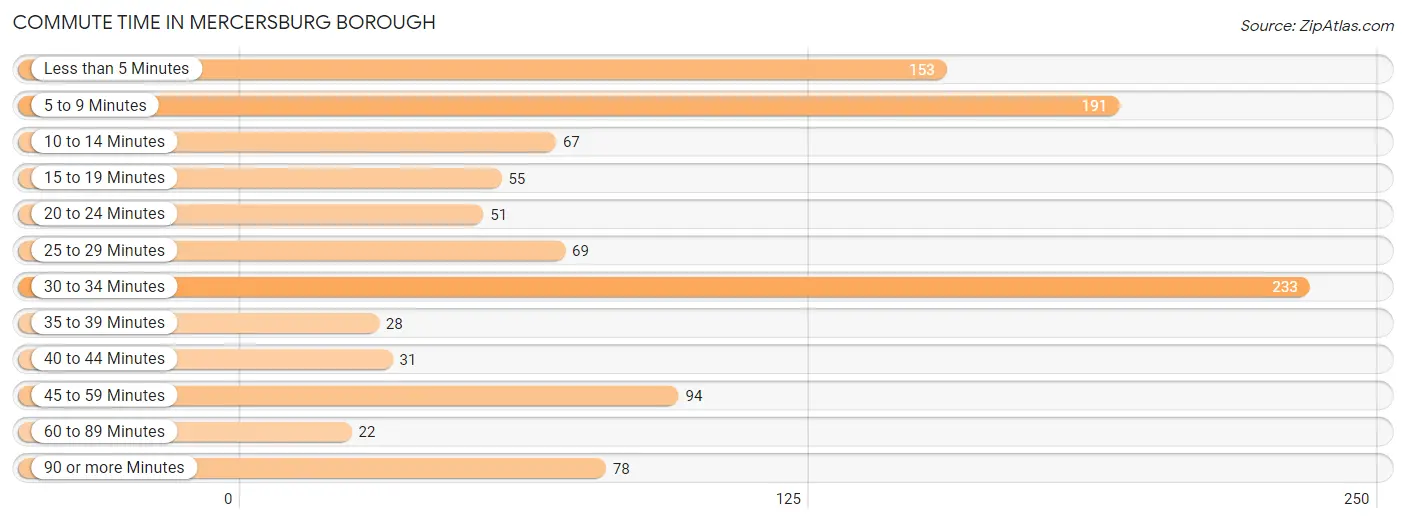
| Commute Time | # Commuters | % Commuters |
| Less than 5 Minutes | 153 | 14.3% |
| 5 to 9 Minutes | 191 | 17.8% |
| 10 to 14 Minutes | 67 | 6.2% |
| 15 to 19 Minutes | 55 | 5.1% |
| 20 to 24 Minutes | 51 | 4.8% |
| 25 to 29 Minutes | 69 | 6.4% |
| 30 to 34 Minutes | 233 | 21.7% |
| 35 to 39 Minutes | 28 | 2.6% |
| 40 to 44 Minutes | 31 | 2.9% |
| 45 to 59 Minutes | 94 | 8.8% |
| 60 to 89 Minutes | 22 | 2.1% |
| 90 or more Minutes | 78 | 7.3% |
Commute Time by Sex in Mercersburg borough
The most common commute times in Mercersburg borough are 30 to 34 minutes (175 commuters, 30.3%) for males and 5 to 9 minutes (110 commuters, 22.2%) for females.
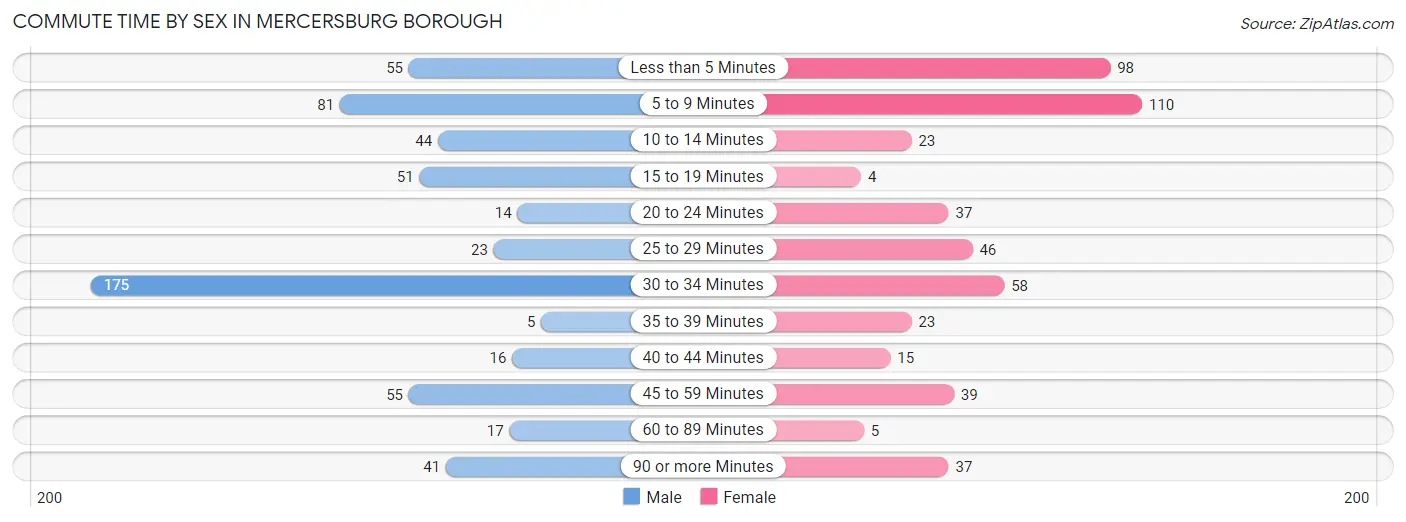
| Commute Time | Male | Female |
| Less than 5 Minutes | 55 (9.5%) | 98 (19.8%) |
| 5 to 9 Minutes | 81 (14.0%) | 110 (22.2%) |
| 10 to 14 Minutes | 44 (7.6%) | 23 (4.6%) |
| 15 to 19 Minutes | 51 (8.8%) | 4 (0.8%) |
| 20 to 24 Minutes | 14 (2.4%) | 37 (7.5%) |
| 25 to 29 Minutes | 23 (4.0%) | 46 (9.3%) |
| 30 to 34 Minutes | 175 (30.3%) | 58 (11.7%) |
| 35 to 39 Minutes | 5 (0.9%) | 23 (4.6%) |
| 40 to 44 Minutes | 16 (2.8%) | 15 (3.0%) |
| 45 to 59 Minutes | 55 (9.5%) | 39 (7.9%) |
| 60 to 89 Minutes | 17 (2.9%) | 5 (1.0%) |
| 90 or more Minutes | 41 (7.1%) | 37 (7.5%) |
Time of Departure to Work by Sex in Mercersburg borough
The most frequent times of departure to work in Mercersburg borough are 12:00 PM to 3:59 PM (131, 22.7%) for males and 7:30 AM to 7:59 AM (100, 20.2%) for females.
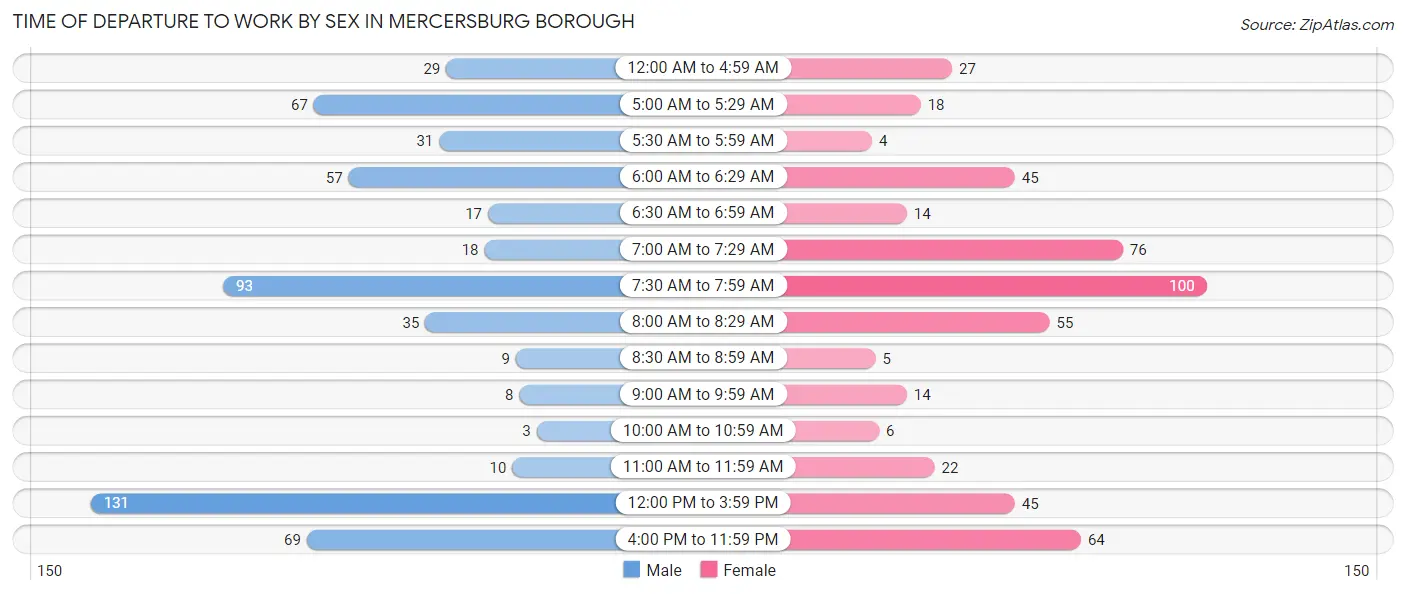
| Time of Departure | Male | Female |
| 12:00 AM to 4:59 AM | 29 (5.0%) | 27 (5.4%) |
| 5:00 AM to 5:29 AM | 67 (11.6%) | 18 (3.6%) |
| 5:30 AM to 5:59 AM | 31 (5.4%) | 4 (0.8%) |
| 6:00 AM to 6:29 AM | 57 (9.9%) | 45 (9.1%) |
| 6:30 AM to 6:59 AM | 17 (2.9%) | 14 (2.8%) |
| 7:00 AM to 7:29 AM | 18 (3.1%) | 76 (15.3%) |
| 7:30 AM to 7:59 AM | 93 (16.1%) | 100 (20.2%) |
| 8:00 AM to 8:29 AM | 35 (6.1%) | 55 (11.1%) |
| 8:30 AM to 8:59 AM | 9 (1.6%) | 5 (1.0%) |
| 9:00 AM to 9:59 AM | 8 (1.4%) | 14 (2.8%) |
| 10:00 AM to 10:59 AM | 3 (0.5%) | 6 (1.2%) |
| 11:00 AM to 11:59 AM | 10 (1.7%) | 22 (4.4%) |
| 12:00 PM to 3:59 PM | 131 (22.7%) | 45 (9.1%) |
| 4:00 PM to 11:59 PM | 69 (12.0%) | 64 (12.9%) |
| Total | 577 (100.0%) | 495 (100.0%) |
Housing Occupancy in Mercersburg borough
Occupancy by Ownership in Mercersburg borough
Of the total 846 dwellings in Mercersburg borough, owner-occupied units account for 480 (56.7%), while renter-occupied units make up 366 (43.3%).
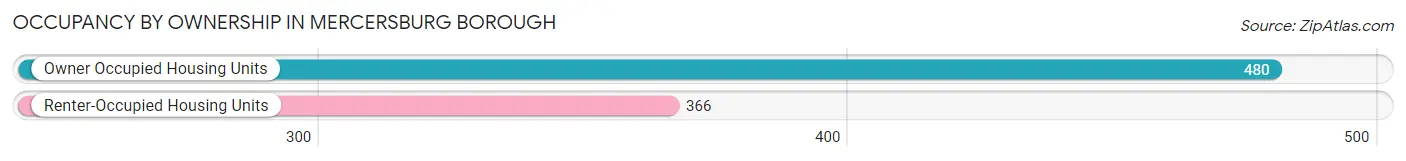
| Occupancy | # Housing Units | % Housing Units |
| Owner Occupied Housing Units | 480 | 56.7% |
| Renter-Occupied Housing Units | 366 | 43.3% |
| Total Occupied Housing Units | 846 | 100.0% |
Occupancy by Household Size in Mercersburg borough
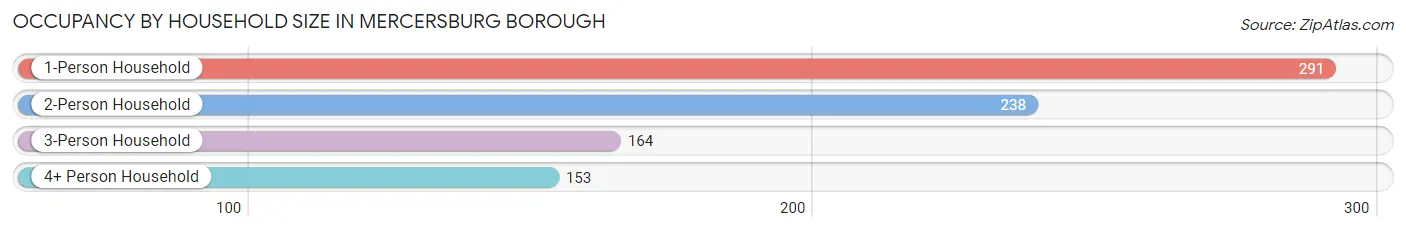
| Household Size | # Housing Units | % Housing Units |
| 1-Person Household | 291 | 34.4% |
| 2-Person Household | 238 | 28.1% |
| 3-Person Household | 164 | 19.4% |
| 4+ Person Household | 153 | 18.1% |
| Total Housing Units | 846 | 100.0% |
Occupancy by Ownership by Household Size in Mercersburg borough
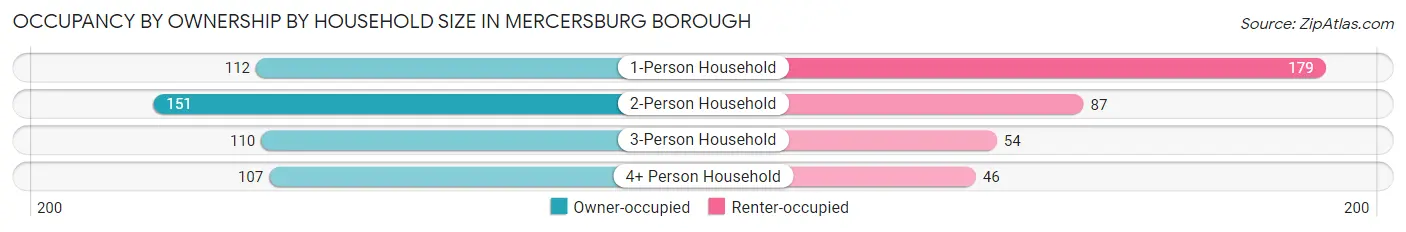
| Household Size | Owner-occupied | Renter-occupied |
| 1-Person Household | 112 (38.5%) | 179 (61.5%) |
| 2-Person Household | 151 (63.4%) | 87 (36.5%) |
| 3-Person Household | 110 (67.1%) | 54 (32.9%) |
| 4+ Person Household | 107 (69.9%) | 46 (30.1%) |
| Total Housing Units | 480 (56.7%) | 366 (43.3%) |
Occupancy by Educational Attainment in Mercersburg borough
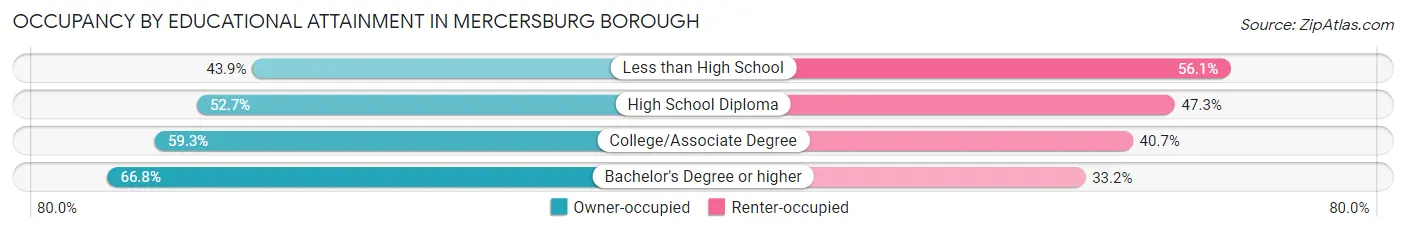
| Household Size | Owner-occupied | Renter-occupied |
| Less than High School | 43 (43.9%) | 55 (56.1%) |
| High School Diploma | 168 (52.7%) | 151 (47.3%) |
| College/Associate Degree | 140 (59.3%) | 96 (40.7%) |
| Bachelor's Degree or higher | 129 (66.8%) | 64 (33.2%) |
Occupancy by Age of Householder in Mercersburg borough
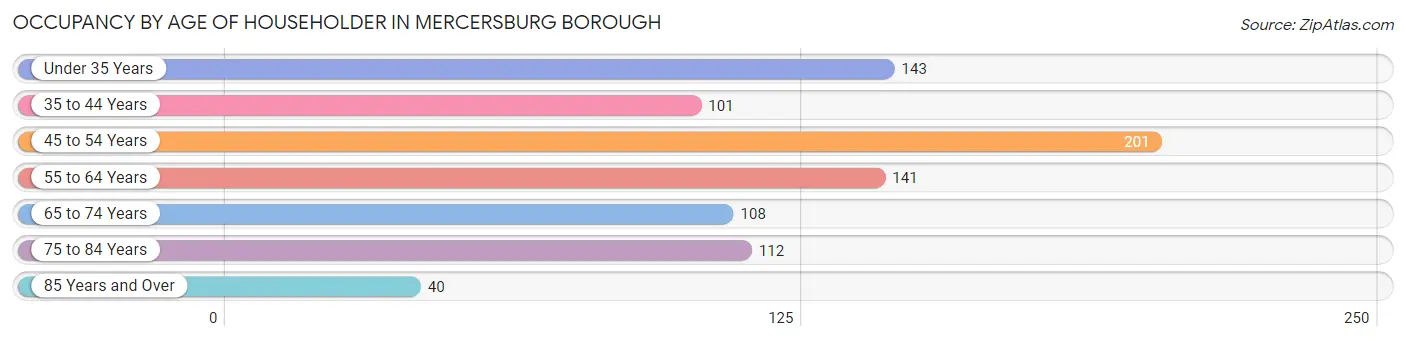
| Age Bracket | # Households | % Households |
| Under 35 Years | 143 | 16.9% |
| 35 to 44 Years | 101 | 11.9% |
| 45 to 54 Years | 201 | 23.8% |
| 55 to 64 Years | 141 | 16.7% |
| 65 to 74 Years | 108 | 12.8% |
| 75 to 84 Years | 112 | 13.2% |
| 85 Years and Over | 40 | 4.7% |
| Total | 846 | 100.0% |
Housing Finances in Mercersburg borough
Median Income by Occupancy in Mercersburg borough
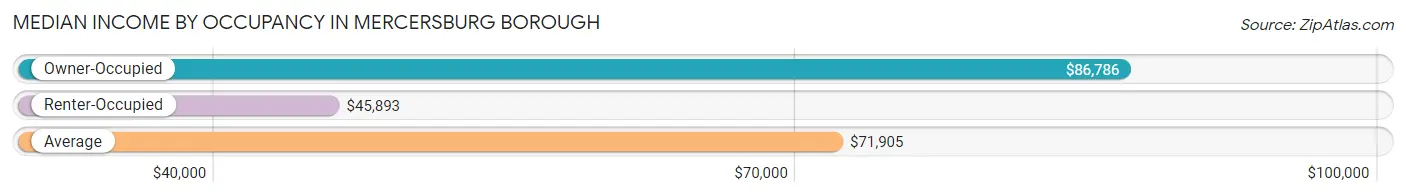
| Occupancy Type | # Households | Median Income |
| Owner-Occupied | 480 (56.7%) | $86,786 |
| Renter-Occupied | 366 (43.3%) | $45,893 |
| Average | 846 (100.0%) | $71,905 |
Occupancy by Householder Income Bracket in Mercersburg borough
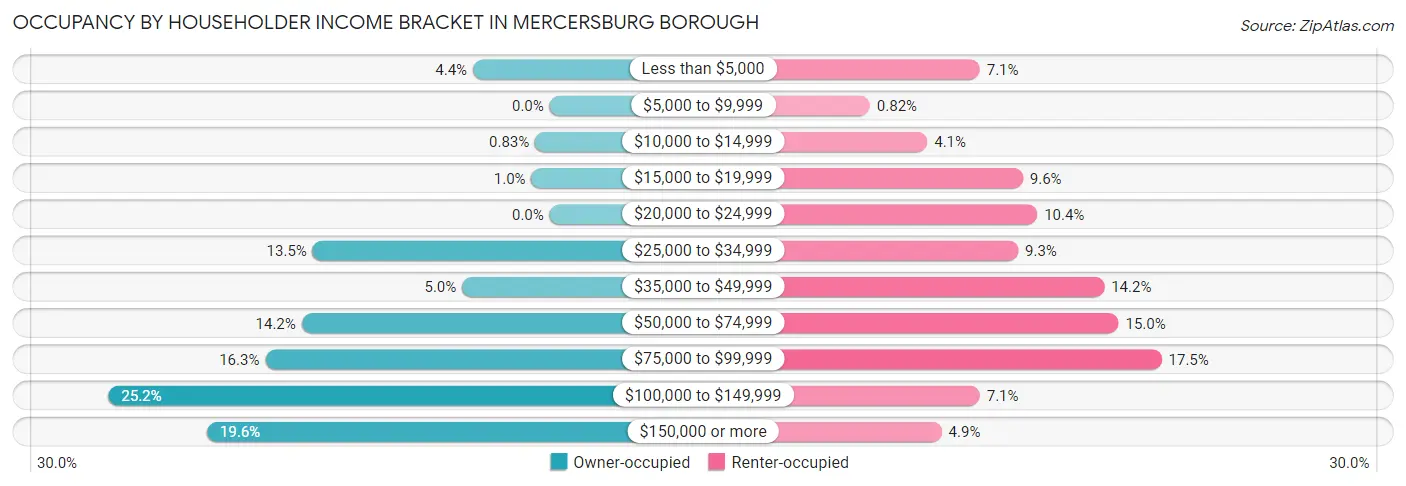
| Income Bracket | Owner-occupied | Renter-occupied |
| Less than $5,000 | 21 (4.4%) | 26 (7.1%) |
| $5,000 to $9,999 | 0 (0.0%) | 3 (0.8%) |
| $10,000 to $14,999 | 4 (0.8%) | 15 (4.1%) |
| $15,000 to $19,999 | 5 (1.0%) | 35 (9.6%) |
| $20,000 to $24,999 | 0 (0.0%) | 38 (10.4%) |
| $25,000 to $34,999 | 65 (13.5%) | 34 (9.3%) |
| $35,000 to $49,999 | 24 (5.0%) | 52 (14.2%) |
| $50,000 to $74,999 | 68 (14.2%) | 55 (15.0%) |
| $75,000 to $99,999 | 78 (16.3%) | 64 (17.5%) |
| $100,000 to $149,999 | 121 (25.2%) | 26 (7.1%) |
| $150,000 or more | 94 (19.6%) | 18 (4.9%) |
| Total | 480 (100.0%) | 366 (100.0%) |
Monthly Housing Cost Tiers in Mercersburg borough
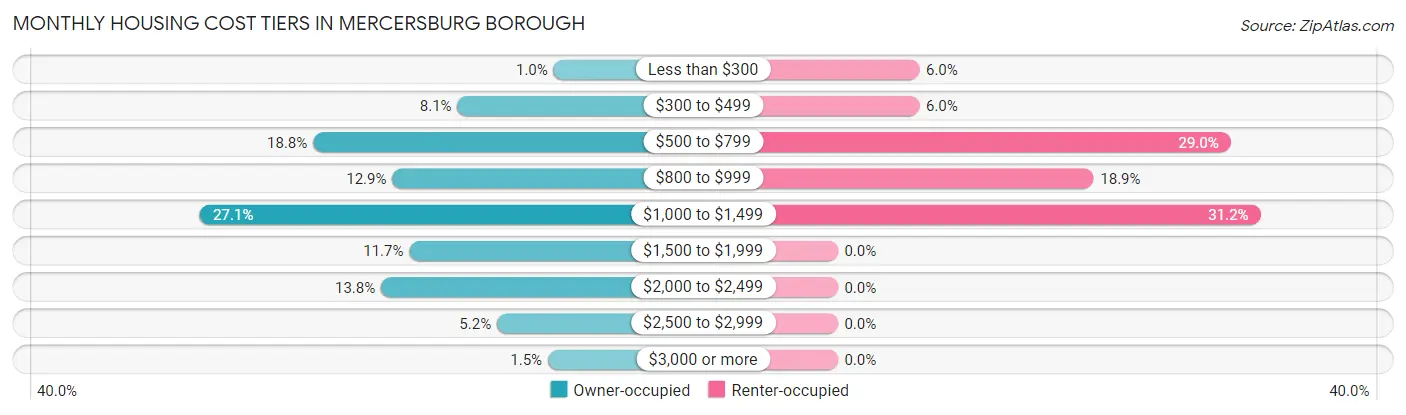
| Monthly Cost | Owner-occupied | Renter-occupied |
| Less than $300 | 5 (1.0%) | 22 (6.0%) |
| $300 to $499 | 39 (8.1%) | 22 (6.0%) |
| $500 to $799 | 90 (18.8%) | 106 (29.0%) |
| $800 to $999 | 62 (12.9%) | 69 (18.9%) |
| $1,000 to $1,499 | 130 (27.1%) | 114 (31.1%) |
| $1,500 to $1,999 | 56 (11.7%) | 0 (0.0%) |
| $2,000 to $2,499 | 66 (13.8%) | 0 (0.0%) |
| $2,500 to $2,999 | 25 (5.2%) | 0 (0.0%) |
| $3,000 or more | 7 (1.5%) | 0 (0.0%) |
| Total | 480 (100.0%) | 366 (100.0%) |
Physical Housing Characteristics in Mercersburg borough
Housing Structures in Mercersburg borough
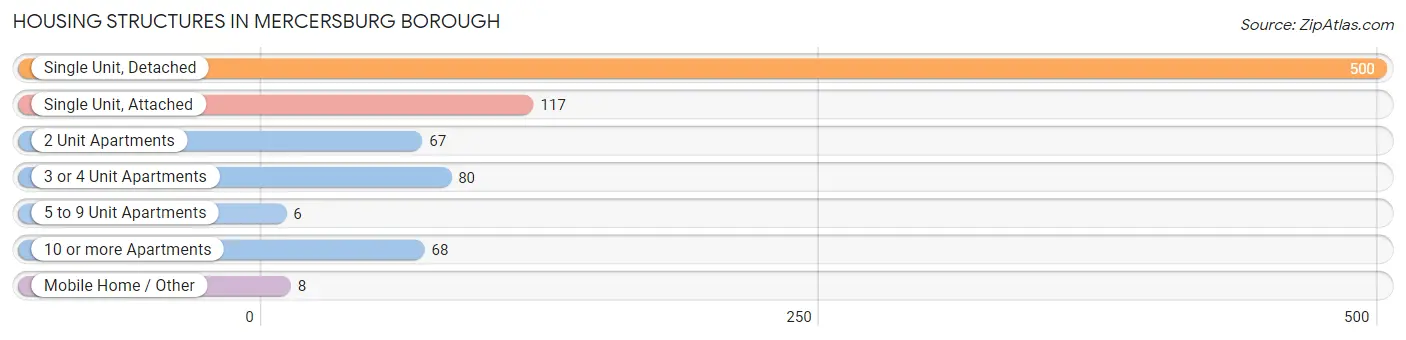
| Structure Type | # Housing Units | % Housing Units |
| Single Unit, Detached | 500 | 59.1% |
| Single Unit, Attached | 117 | 13.8% |
| 2 Unit Apartments | 67 | 7.9% |
| 3 or 4 Unit Apartments | 80 | 9.5% |
| 5 to 9 Unit Apartments | 6 | 0.7% |
| 10 or more Apartments | 68 | 8.0% |
| Mobile Home / Other | 8 | 0.9% |
| Total | 846 | 100.0% |
Housing Structures by Occupancy in Mercersburg borough
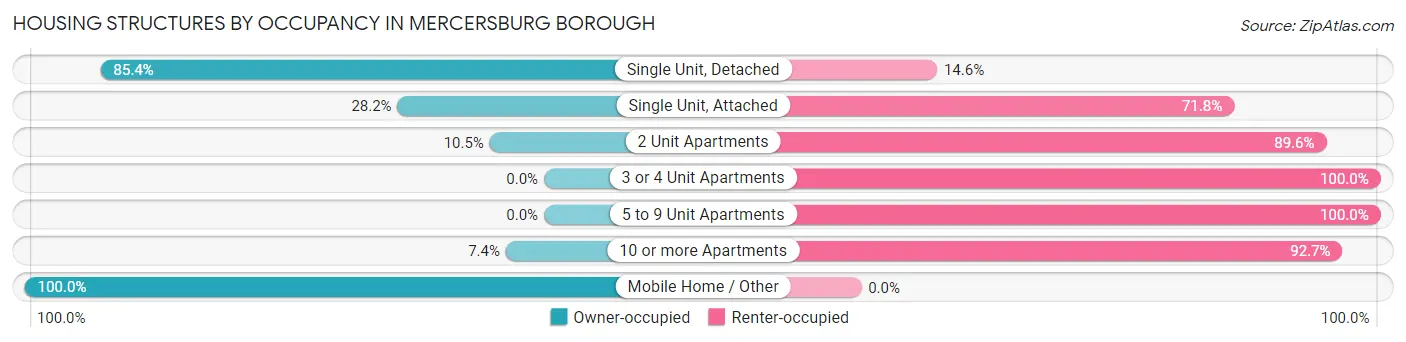
| Structure Type | Owner-occupied | Renter-occupied |
| Single Unit, Detached | 427 (85.4%) | 73 (14.6%) |
| Single Unit, Attached | 33 (28.2%) | 84 (71.8%) |
| 2 Unit Apartments | 7 (10.4%) | 60 (89.5%) |
| 3 or 4 Unit Apartments | 0 (0.0%) | 80 (100.0%) |
| 5 to 9 Unit Apartments | 0 (0.0%) | 6 (100.0%) |
| 10 or more Apartments | 5 (7.3%) | 63 (92.6%) |
| Mobile Home / Other | 8 (100.0%) | 0 (0.0%) |
| Total | 480 (56.7%) | 366 (43.3%) |
Housing Structures by Number of Rooms in Mercersburg borough
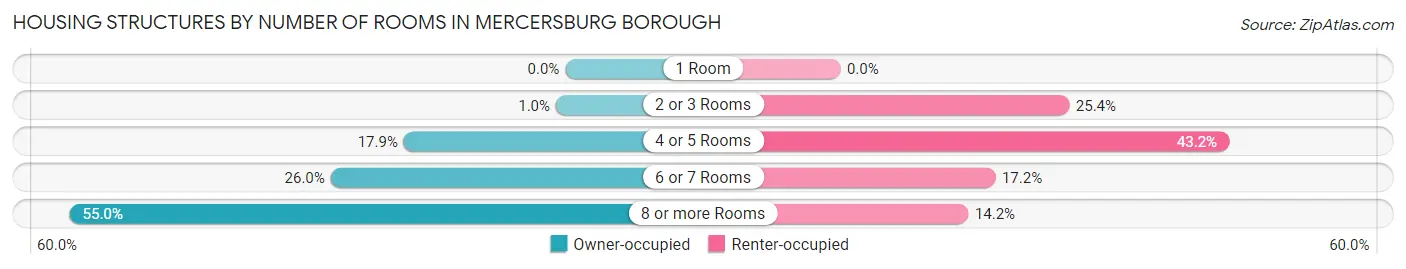
| Number of Rooms | Owner-occupied | Renter-occupied |
| 1 Room | 0 (0.0%) | 0 (0.0%) |
| 2 or 3 Rooms | 5 (1.0%) | 93 (25.4%) |
| 4 or 5 Rooms | 86 (17.9%) | 158 (43.2%) |
| 6 or 7 Rooms | 125 (26.0%) | 63 (17.2%) |
| 8 or more Rooms | 264 (55.0%) | 52 (14.2%) |
| Total | 480 (100.0%) | 366 (100.0%) |
Housing Structure by Heating Type in Mercersburg borough
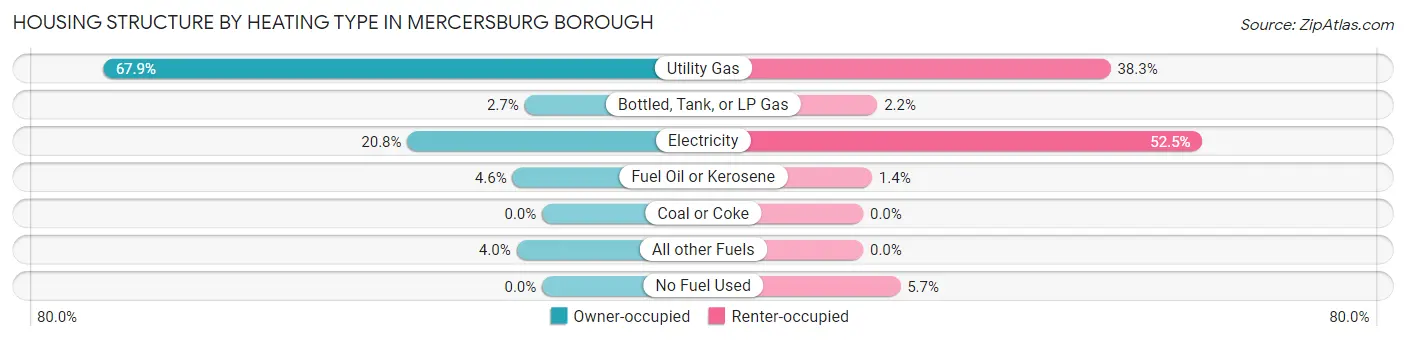
| Heating Type | Owner-occupied | Renter-occupied |
| Utility Gas | 326 (67.9%) | 140 (38.3%) |
| Bottled, Tank, or LP Gas | 13 (2.7%) | 8 (2.2%) |
| Electricity | 100 (20.8%) | 192 (52.5%) |
| Fuel Oil or Kerosene | 22 (4.6%) | 5 (1.4%) |
| Coal or Coke | 0 (0.0%) | 0 (0.0%) |
| All other Fuels | 19 (4.0%) | 0 (0.0%) |
| No Fuel Used | 0 (0.0%) | 21 (5.7%) |
| Total | 480 (100.0%) | 366 (100.0%) |
Household Vehicle Usage in Mercersburg borough
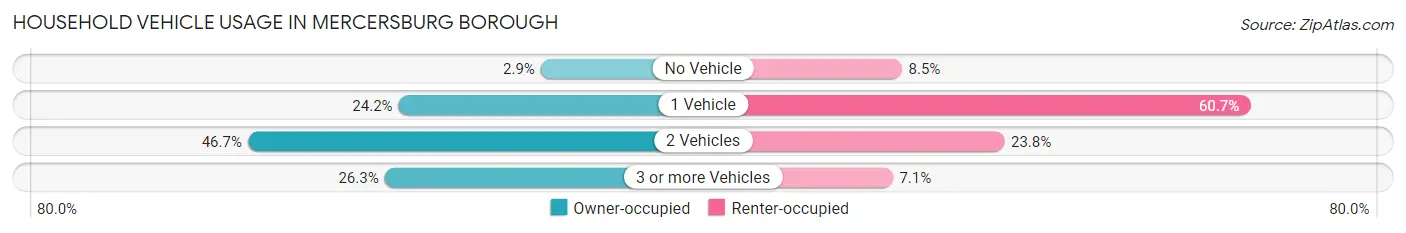
| Vehicles per Household | Owner-occupied | Renter-occupied |
| No Vehicle | 14 (2.9%) | 31 (8.5%) |
| 1 Vehicle | 116 (24.2%) | 222 (60.7%) |
| 2 Vehicles | 224 (46.7%) | 87 (23.8%) |
| 3 or more Vehicles | 126 (26.3%) | 26 (7.1%) |
| Total | 480 (100.0%) | 366 (100.0%) |
Real Estate & Mortgages in Mercersburg borough
Real Estate and Mortgage Overview in Mercersburg borough
| Characteristic | Without Mortgage | With Mortgage |
| Housing Units | 186 | 294 |
| Median Property Value | $216,700 | $188,600 |
| Median Household Income | $74,063 | $59 |
| Monthly Housing Costs | $663 | $7 |
| Real Estate Taxes | $3,170 | $11 |
Property Value by Mortgage Status in Mercersburg borough
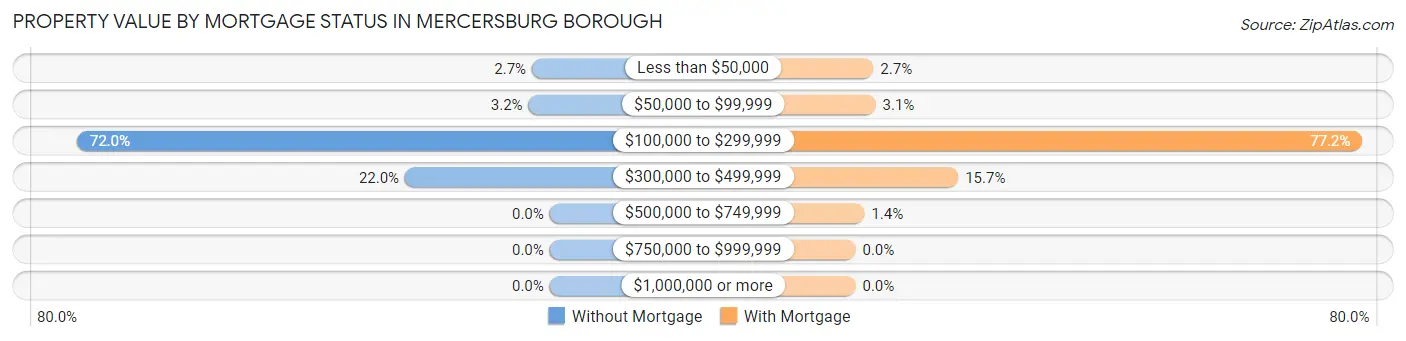
| Property Value | Without Mortgage | With Mortgage |
| Less than $50,000 | 5 (2.7%) | 8 (2.7%) |
| $50,000 to $99,999 | 6 (3.2%) | 9 (3.1%) |
| $100,000 to $299,999 | 134 (72.0%) | 227 (77.2%) |
| $300,000 to $499,999 | 41 (22.0%) | 46 (15.7%) |
| $500,000 to $749,999 | 0 (0.0%) | 4 (1.4%) |
| $750,000 to $999,999 | 0 (0.0%) | 0 (0.0%) |
| $1,000,000 or more | 0 (0.0%) | 0 (0.0%) |
| Total | 186 (100.0%) | 294 (100.0%) |
Household Income by Mortgage Status in Mercersburg borough
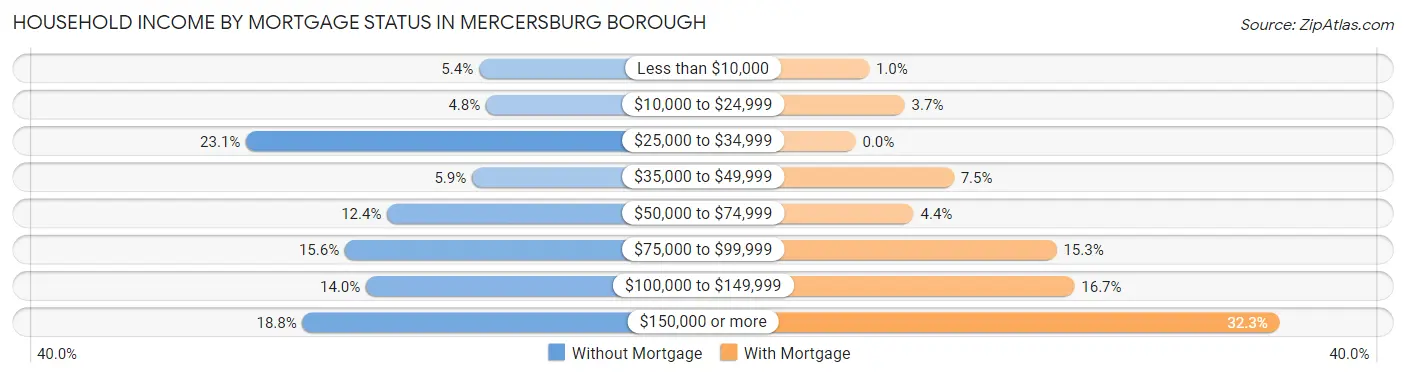
| Household Income | Without Mortgage | With Mortgage |
| Less than $10,000 | 10 (5.4%) | 3 (1.0%) |
| $10,000 to $24,999 | 9 (4.8%) | 11 (3.7%) |
| $25,000 to $34,999 | 43 (23.1%) | 0 (0.0%) |
| $35,000 to $49,999 | 11 (5.9%) | 22 (7.5%) |
| $50,000 to $74,999 | 23 (12.4%) | 13 (4.4%) |
| $75,000 to $99,999 | 29 (15.6%) | 45 (15.3%) |
| $100,000 to $149,999 | 26 (14.0%) | 49 (16.7%) |
| $150,000 or more | 35 (18.8%) | 95 (32.3%) |
| Total | 186 (100.0%) | 294 (100.0%) |
Property Value to Household Income Ratio in Mercersburg borough
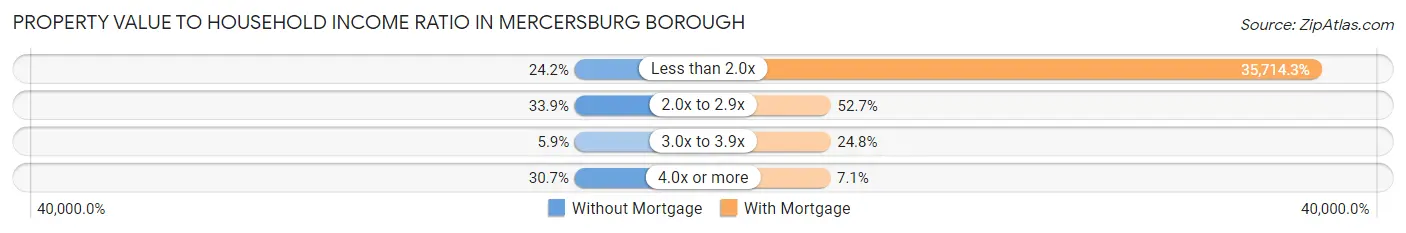
| Value-to-Income Ratio | Without Mortgage | With Mortgage |
| Less than 2.0x | 45 (24.2%) | 105,000 (35,714.3%) |
| 2.0x to 2.9x | 63 (33.9%) | 155 (52.7%) |
| 3.0x to 3.9x | 11 (5.9%) | 73 (24.8%) |
| 4.0x or more | 57 (30.6%) | 21 (7.1%) |
| Total | 186 (100.0%) | 294 (100.0%) |
Real Estate Taxes by Mortgage Status in Mercersburg borough
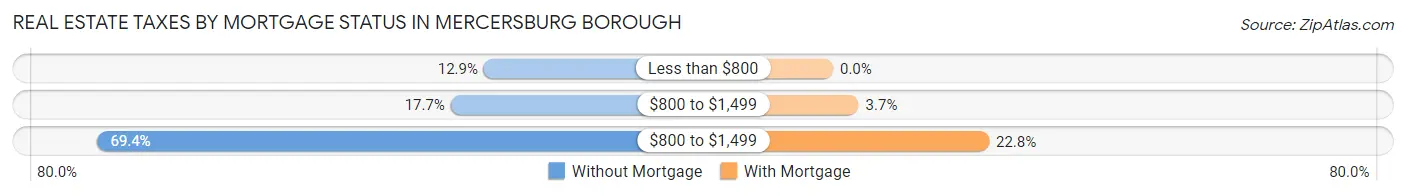
| Property Taxes | Without Mortgage | With Mortgage |
| Less than $800 | 24 (12.9%) | 0 (0.0%) |
| $800 to $1,499 | 33 (17.7%) | 11 (3.7%) |
| $800 to $1,499 | 129 (69.4%) | 67 (22.8%) |
| Total | 186 (100.0%) | 294 (100.0%) |
Health & Disability in Mercersburg borough
Health Insurance Coverage by Age in Mercersburg borough
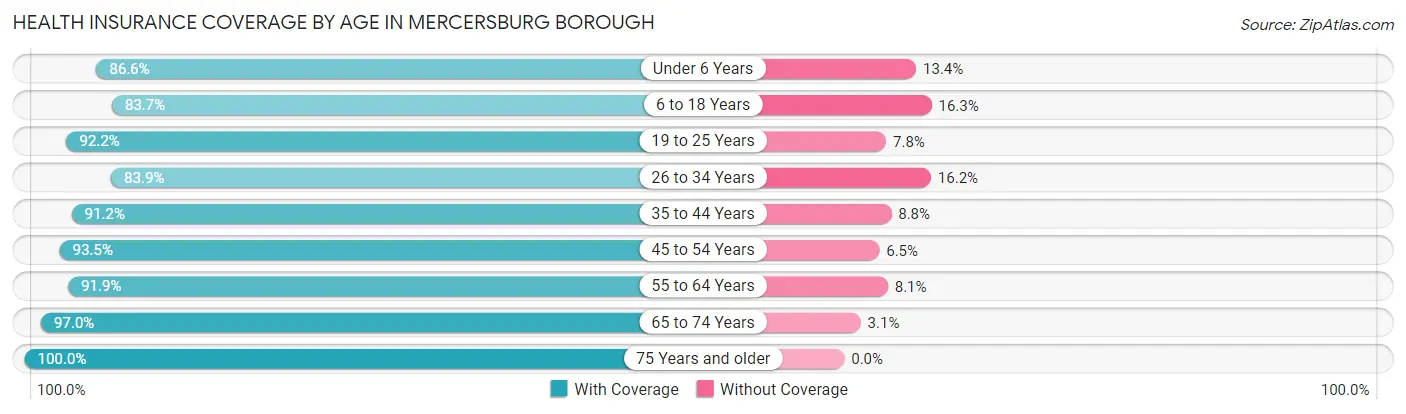
| Age Bracket | With Coverage | Without Coverage |
| Under 6 Years | 110 (86.6%) | 17 (13.4%) |
| 6 to 18 Years | 278 (83.7%) | 54 (16.3%) |
| 19 to 25 Years | 130 (92.2%) | 11 (7.8%) |
| 26 to 34 Years | 161 (83.9%) | 31 (16.2%) |
| 35 to 44 Years | 229 (91.2%) | 22 (8.8%) |
| 45 to 54 Years | 301 (93.5%) | 21 (6.5%) |
| 55 to 64 Years | 306 (91.9%) | 27 (8.1%) |
| 65 to 74 Years | 159 (97.0%) | 5 (3.0%) |
| 75 Years and older | 206 (100.0%) | 0 (0.0%) |
| Total | 1,880 (90.9%) | 188 (9.1%) |
Health Insurance Coverage by Citizenship Status in Mercersburg borough
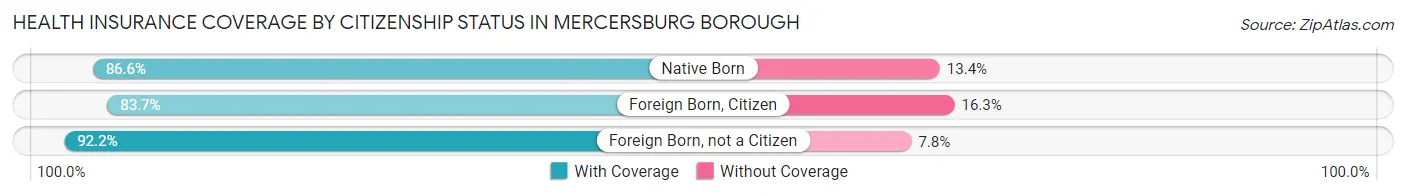
| Citizenship Status | With Coverage | Without Coverage |
| Native Born | 110 (86.6%) | 17 (13.4%) |
| Foreign Born, Citizen | 278 (83.7%) | 54 (16.3%) |
| Foreign Born, not a Citizen | 130 (92.2%) | 11 (7.8%) |
Health Insurance Coverage by Household Income in Mercersburg borough
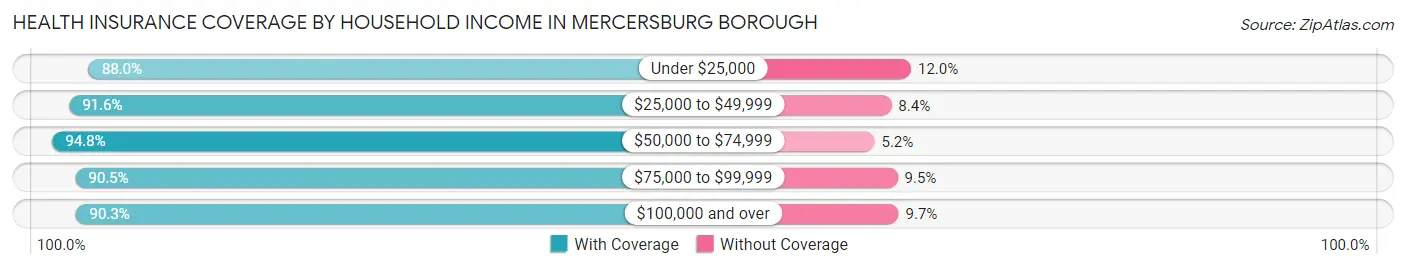
| Household Income | With Coverage | Without Coverage |
| Under $25,000 | 168 (88.0%) | 23 (12.0%) |
| $25,000 to $49,999 | 296 (91.6%) | 27 (8.4%) |
| $50,000 to $74,999 | 255 (94.8%) | 14 (5.2%) |
| $75,000 to $99,999 | 380 (90.5%) | 40 (9.5%) |
| $100,000 and over | 781 (90.3%) | 84 (9.7%) |
Public vs Private Health Insurance Coverage by Age in Mercersburg borough
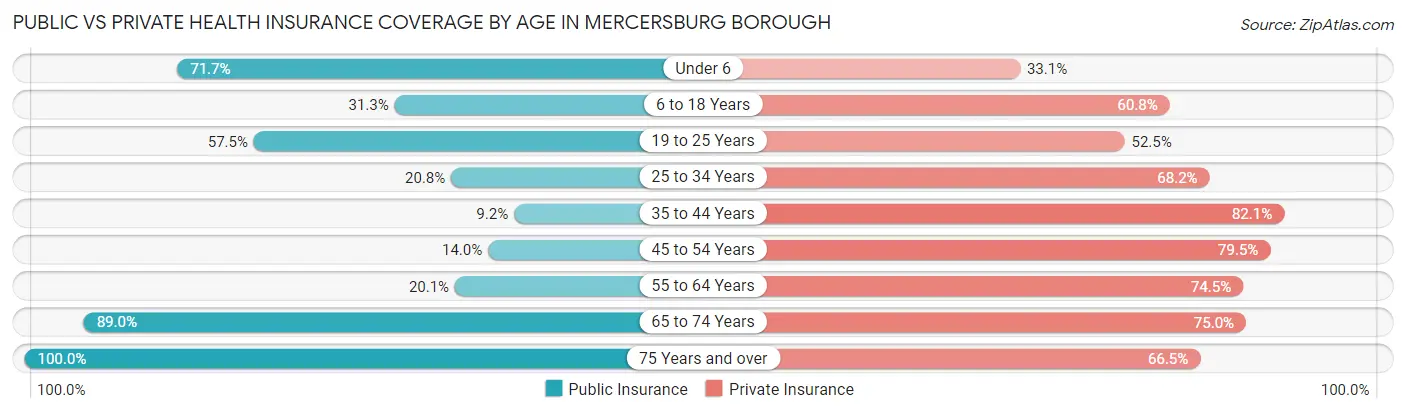
| Age Bracket | Public Insurance | Private Insurance |
| Under 6 | 91 (71.7%) | 42 (33.1%) |
| 6 to 18 Years | 104 (31.3%) | 202 (60.8%) |
| 19 to 25 Years | 81 (57.5%) | 74 (52.5%) |
| 25 to 34 Years | 40 (20.8%) | 131 (68.2%) |
| 35 to 44 Years | 23 (9.2%) | 206 (82.1%) |
| 45 to 54 Years | 45 (14.0%) | 256 (79.5%) |
| 55 to 64 Years | 67 (20.1%) | 248 (74.5%) |
| 65 to 74 Years | 146 (89.0%) | 123 (75.0%) |
| 75 Years and over | 206 (100.0%) | 137 (66.5%) |
| Total | 803 (38.8%) | 1,419 (68.6%) |
Disability Status by Sex by Age in Mercersburg borough
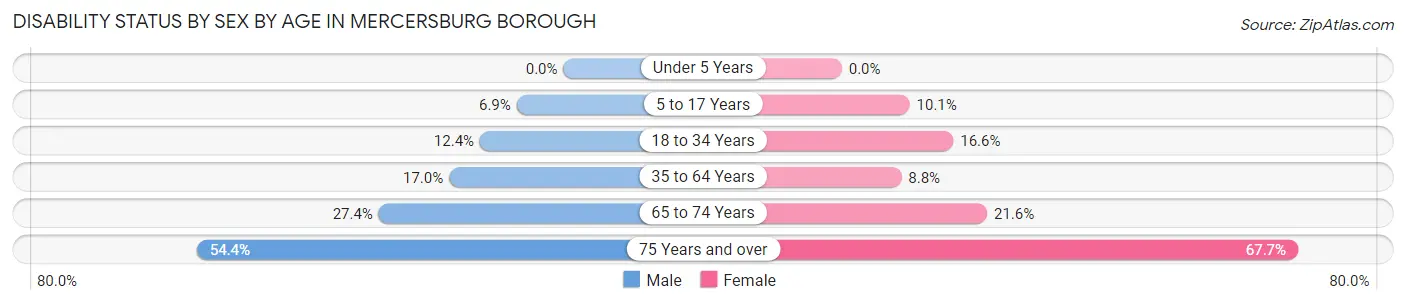
| Age Bracket | Male | Female |
| Under 5 Years | 0 (0.0%) | 0 (0.0%) |
| 5 to 17 Years | 10 (6.9%) | 14 (10.1%) |
| 18 to 34 Years | 29 (12.4%) | 26 (16.6%) |
| 35 to 64 Years | 75 (17.0%) | 41 (8.8%) |
| 65 to 74 Years | 17 (27.4%) | 22 (21.6%) |
| 75 Years and over | 43 (54.4%) | 86 (67.7%) |
Disability Class by Sex by Age in Mercersburg borough
Disability Class: Hearing Difficulty
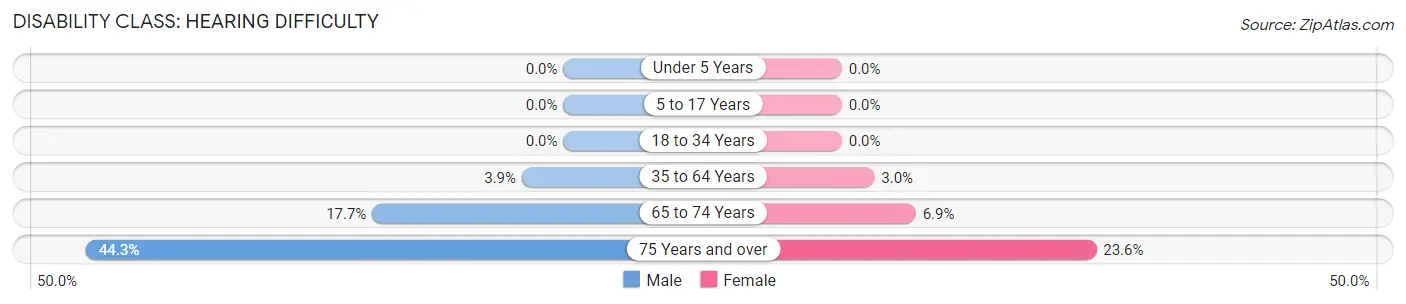
| Age Bracket | Male | Female |
| Under 5 Years | 0 (0.0%) | 0 (0.0%) |
| 5 to 17 Years | 0 (0.0%) | 0 (0.0%) |
| 18 to 34 Years | 0 (0.0%) | 0 (0.0%) |
| 35 to 64 Years | 17 (3.8%) | 14 (3.0%) |
| 65 to 74 Years | 11 (17.7%) | 7 (6.9%) |
| 75 Years and over | 35 (44.3%) | 30 (23.6%) |
Disability Class: Vision Difficulty
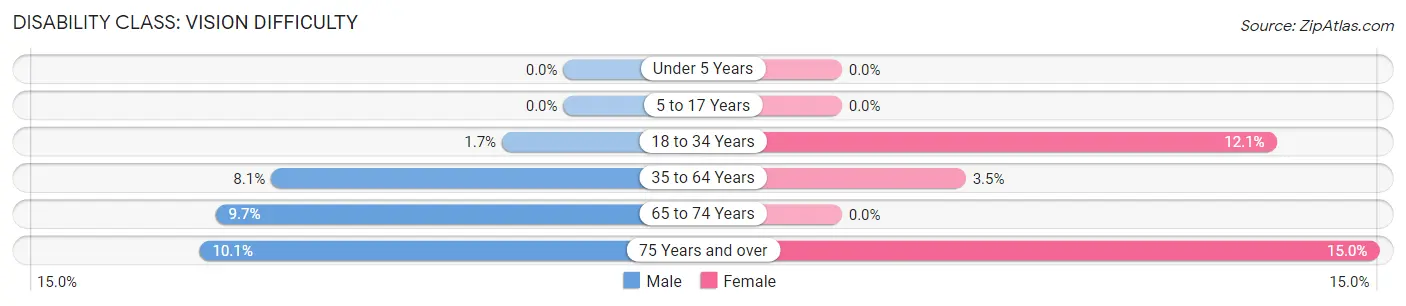
| Age Bracket | Male | Female |
| Under 5 Years | 0 (0.0%) | 0 (0.0%) |
| 5 to 17 Years | 0 (0.0%) | 0 (0.0%) |
| 18 to 34 Years | 4 (1.7%) | 19 (12.1%) |
| 35 to 64 Years | 36 (8.1%) | 16 (3.5%) |
| 65 to 74 Years | 6 (9.7%) | 0 (0.0%) |
| 75 Years and over | 8 (10.1%) | 19 (15.0%) |
Disability Class: Cognitive Difficulty
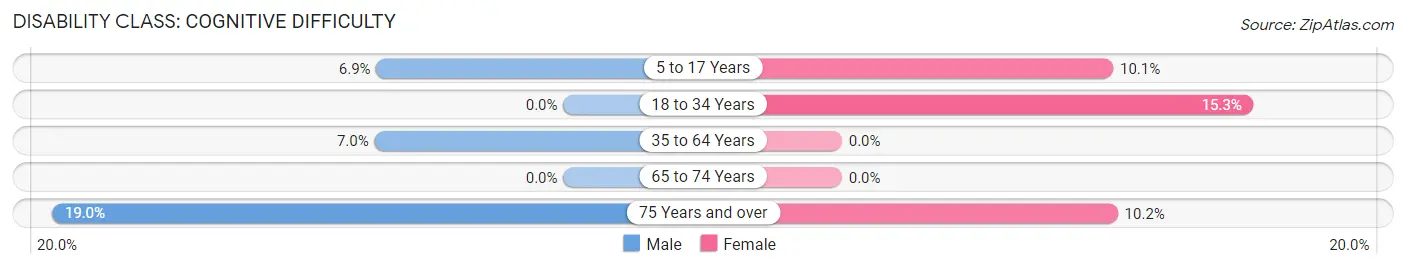
| Age Bracket | Male | Female |
| 5 to 17 Years | 10 (6.9%) | 14 (10.1%) |
| 18 to 34 Years | 0 (0.0%) | 24 (15.3%) |
| 35 to 64 Years | 31 (7.0%) | 0 (0.0%) |
| 65 to 74 Years | 0 (0.0%) | 0 (0.0%) |
| 75 Years and over | 15 (19.0%) | 13 (10.2%) |
Disability Class: Ambulatory Difficulty
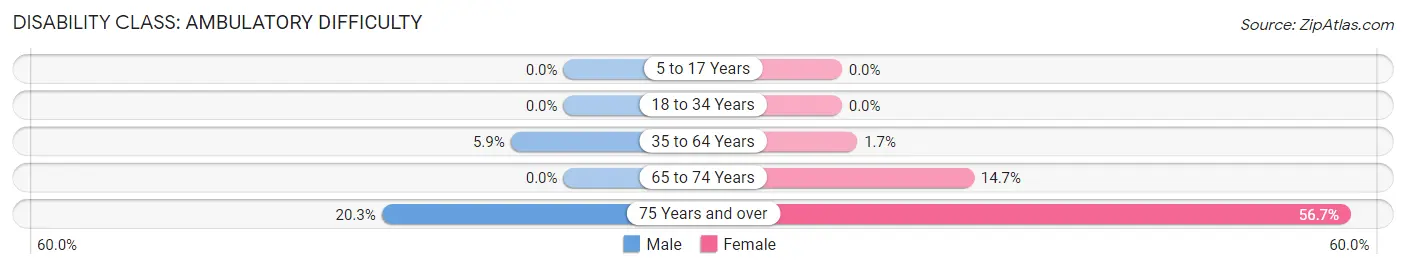
| Age Bracket | Male | Female |
| 5 to 17 Years | 0 (0.0%) | 0 (0.0%) |
| 18 to 34 Years | 0 (0.0%) | 0 (0.0%) |
| 35 to 64 Years | 26 (5.9%) | 8 (1.7%) |
| 65 to 74 Years | 0 (0.0%) | 15 (14.7%) |
| 75 Years and over | 16 (20.3%) | 72 (56.7%) |
Disability Class: Self-Care Difficulty
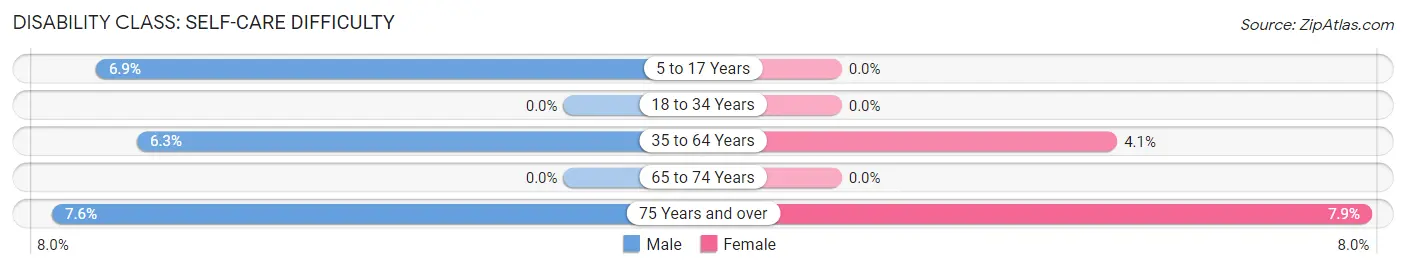
| Age Bracket | Male | Female |
| 5 to 17 Years | 10 (6.9%) | 0 (0.0%) |
| 18 to 34 Years | 0 (0.0%) | 0 (0.0%) |
| 35 to 64 Years | 28 (6.3%) | 19 (4.1%) |
| 65 to 74 Years | 0 (0.0%) | 0 (0.0%) |
| 75 Years and over | 6 (7.6%) | 10 (7.9%) |
Technology Access in Mercersburg borough
Computing Device Access in Mercersburg borough
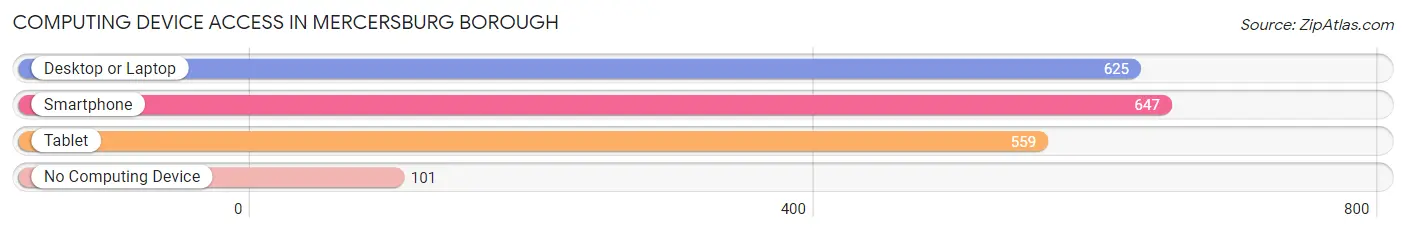
| Device Type | # Households | % Households |
| Desktop or Laptop | 625 | 73.9% |
| Smartphone | 647 | 76.5% |
| Tablet | 559 | 66.1% |
| No Computing Device | 101 | 11.9% |
| Total | 846 | 100.0% |
Internet Access in Mercersburg borough
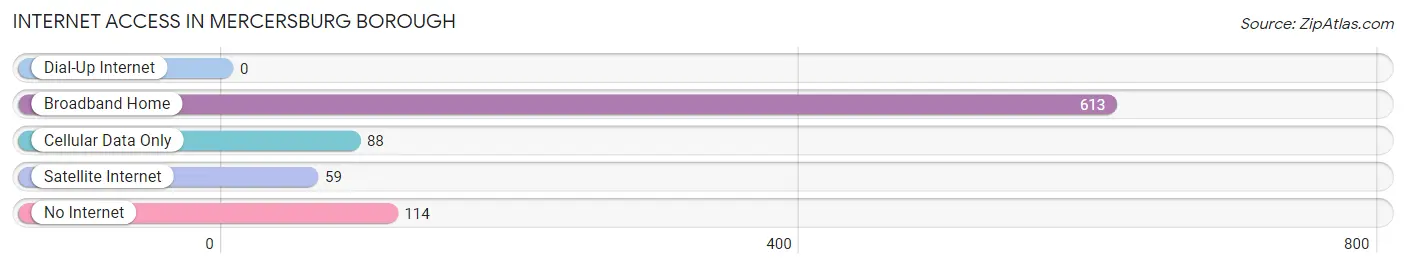
| Internet Type | # Households | % Households |
| Dial-Up Internet | 0 | 0.0% |
| Broadband Home | 613 | 72.5% |
| Cellular Data Only | 88 | 10.4% |
| Satellite Internet | 59 | 7.0% |
| No Internet | 114 | 13.5% |
| Total | 846 | 100.0% |
Mercersburg borough Summary
Mercersburg Borough is a small borough located in Franklin County, Pennsylvania. It is situated in the Cumberland Valley, approximately 10 miles south of Chambersburg and 15 miles north of Hagerstown, Maryland. The population of Mercersburg Borough was 1,541 at the 2010 census.
History
Mercersburg Borough was founded in 1817 by John Mercer, a Revolutionary War veteran. The town was named after him and was incorporated in 1832. The town was originally a farming community, but it soon became a center for industry and commerce. The first industry in the area was a grist mill, which was built in 1820. This was followed by a sawmill, a tannery, and a woolen mill.
The town was also home to several churches, including the First Presbyterian Church, which was founded in 1820. The town also had a school, which was established in 1825.
In the late 19th century, Mercersburg Borough became a popular tourist destination. The town was home to several hotels, including the Merceburg Hotel, which was built in 1876. The town also had a number of stores, including a general store, a drug store, and a hardware store.
Geography
Mercersburg Borough is located at 39°45'45" North, 77°45'45" West (39.7625, -77.7625). The borough has a total area of 0.6 square miles, all of which is land.
The borough is located in the Cumberland Valley, which is a part of the Great Appalachian Valley. The valley is surrounded by the Blue Ridge Mountains to the east and the Allegheny Mountains to the west.
Economy
The economy of Mercersburg Borough is largely based on agriculture and tourism. The town is home to several farms, which produce a variety of crops, including corn, soybeans, and hay. The town is also home to several wineries, which produce a variety of wines.
The town is also home to several businesses, including restaurants, retail stores, and professional services. The town is also home to several bed and breakfasts, which attract tourists from all over the country.
Demographics
As of the 2010 census, the population of Mercersburg Borough was 1,541. The racial makeup of the borough was 97.2% White, 0.7% African American, 0.2% Native American, 0.3% Asian, 0.1% from other races, and 1.5% from two or more races. Hispanic or Latino of any race were 0.7% of the population.
The median income for a household in the borough was $45,000, and the median income for a family was $50,000. The per capita income for the borough was $20,000. About 8.3% of families and 10.2% of the population were below the poverty line, including 14.3% of those under age 18 and 6.3% of those age 65 or over.
Common Questions
What is the Total Population of Mercersburg borough?
Total Population of Mercersburg borough is 2,083.
What is the Total Male Population of Mercersburg borough?
Total Male Population of Mercersburg borough is 1,026.
What is the Total Female Population of Mercersburg borough?
Total Female Population of Mercersburg borough is 1,057.
What is the Ratio of Males per 100 Females in Mercersburg borough?
There are 97.07 Males per 100 Females in Mercersburg borough.
What is the Ratio of Females per 100 Males in Mercersburg borough?
There are 103.02 Females per 100 Males in Mercersburg borough.
What is the Median Population Age in Mercersburg borough?
Median Population Age in Mercersburg borough is 43.8 Years.
What is the Average Family Size in Mercersburg borough
Average Family Size in Mercersburg borough is 3.1 People.
What is the Average Household Size in Mercersburg borough
Average Household Size in Mercersburg borough is 2.4 People.
What is Per Capita Income in Mercersburg borough?
Per Capita income in Mercersburg borough is $37,153.
What is the Median Family Income in Mercersburg borough?
Median Family Income in Mercersburg borough is $81,731.
What is the Median Household income in Mercersburg borough?
Median Household Income in Mercersburg borough is $71,905.
What is Income or Wage Gap in Mercersburg borough?
Income or Wage Gap in Mercersburg borough is 20.4%.
Women in Mercersburg borough earn 79.6 cents for every dollar earned by a man.
What is Inequality or Gini Index in Mercersburg borough?
Inequality or Gini Index in Mercersburg borough is 0.46.
How Large is the Labor Force in Mercersburg borough?
There are 1,201 People in the Labor Forcein in Mercersburg borough.
What is the Percentage of People in the Labor Force in Mercersburg borough?
70.4% of People are in the Labor Force in Mercersburg borough.
What is the Unemployment Rate in Mercersburg borough?
Unemployment Rate in Mercersburg borough is 2.7%.