Mansfield borough, PA
Mansfield borough Overview
3,024
TOTAL POPULATION
1,379
MALE POPULATION
1,645
FEMALE POPULATION
83.83
MALES / 100 FEMALES
119.29
FEMALES / 100 MALES
29.8
MEDIAN AGE
2.8
AVG FAMILY SIZE
2.2
AVG HOUSEHOLD SIZE
$25,199
PER CAPITA INCOME
$64,943
AVG FAMILY INCOME
$40,565
AVG HOUSEHOLD INCOME
45.1%
WAGE / INCOME GAP [ % ]
54.9¢/ $1
WAGE / INCOME GAP [ $ ]
0.49
INEQUALITY / GINI INDEX
1,661
LABOR FORCE [ PEOPLE ]
65.3%
PERCENT IN LABOR FORCE
6.4%
UNEMPLOYMENT RATE
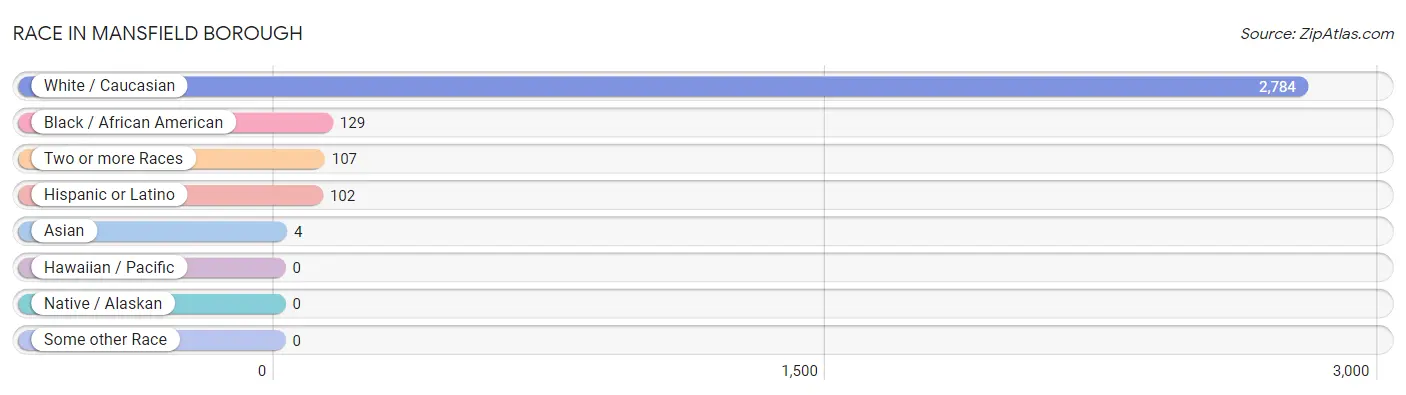
Race in Mansfield borough
The most populous races in Mansfield borough are White / Caucasian (2,784 | 92.1%), Black / African American (129 | 4.3%), and Two or more Races (107 | 3.5%).
| Race | # Population | % Population |
| Asian | 4 | 0.1% |
| Black / African American | 129 | 4.3% |
| Hawaiian / Pacific | 0 | 0.0% |
| Hispanic or Latino | 102 | 3.4% |
| Native / Alaskan | 0 | 0.0% |
| White / Caucasian | 2,784 | 92.1% |
| Two or more Races | 107 | 3.5% |
| Some other Race | 0 | 0.0% |
| Total | 3,024 | 100.0% |
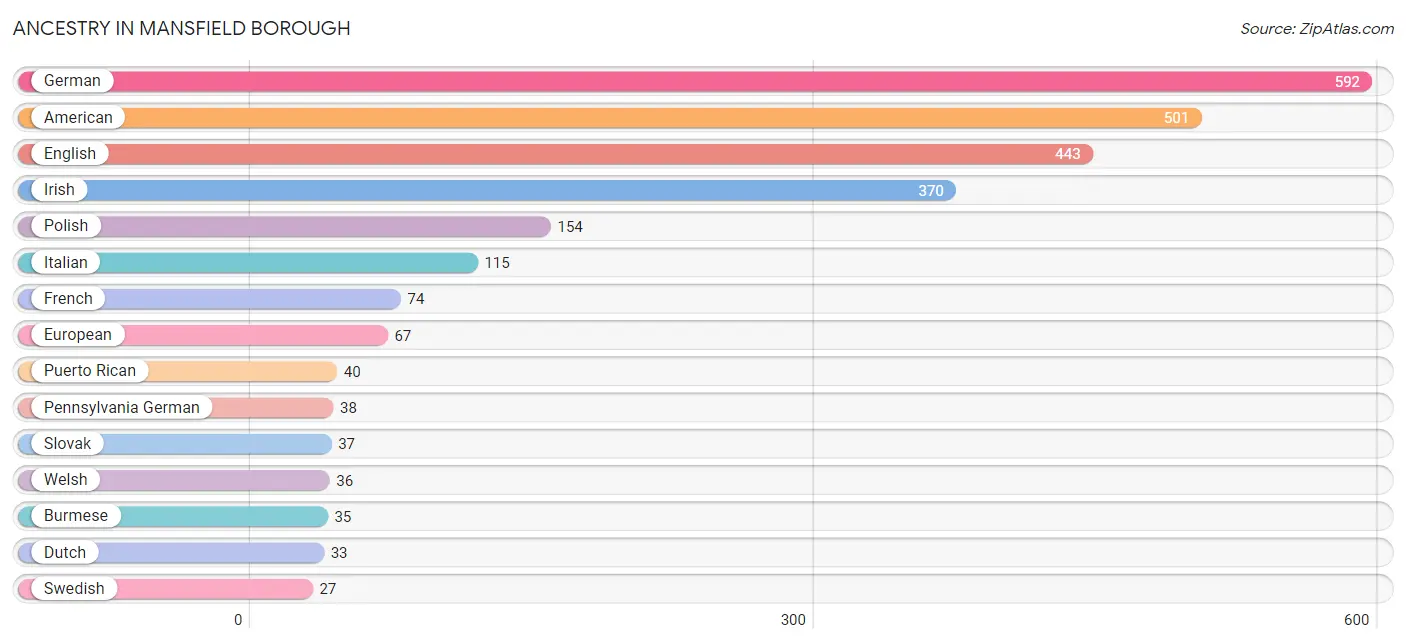
Ancestry in Mansfield borough
The most populous ancestries reported in Mansfield borough are German (592 | 19.6%), American (501 | 16.6%), English (443 | 14.6%), Irish (370 | 12.2%), and Polish (154 | 5.1%), together accounting for 68.1% of all Mansfield borough residents.
| Ancestry | # Population | % Population |
| African | 7 | 0.2% |
| American | 501 | 16.6% |
| Arab | 20 | 0.7% |
| British West Indian | 3 | 0.1% |
| Burmese | 35 | 1.2% |
| Colombian | 2 | 0.1% |
| Croatian | 5 | 0.2% |
| Czech | 6 | 0.2% |
| Czechoslovakian | 4 | 0.1% |
| Dominican | 14 | 0.5% |
| Dutch | 33 | 1.1% |
| Egyptian | 2 | 0.1% |
| English | 443 | 14.6% |
| European | 67 | 2.2% |
| Finnish | 16 | 0.5% |
| French | 74 | 2.5% |
| French Canadian | 11 | 0.4% |
| German | 592 | 19.6% |
| Irish | 370 | 12.2% |
| Italian | 115 | 3.8% |
| Mexican | 18 | 0.6% |
| Mexican American Indian | 14 | 0.5% |
| Norwegian | 12 | 0.4% |
| Pennsylvania German | 38 | 1.3% |
| Polish | 154 | 5.1% |
| Portuguese | 15 | 0.5% |
| Puerto Rican | 40 | 1.3% |
| Russian | 5 | 0.2% |
| Scandinavian | 4 | 0.1% |
| Scotch-Irish | 9 | 0.3% |
| Scottish | 22 | 0.7% |
| Slovak | 37 | 1.2% |
| South American | 2 | 0.1% |
| Spanish | 25 | 0.8% |
| Sri Lankan | 6 | 0.2% |
| Subsaharan African | 7 | 0.2% |
| Swedish | 27 | 0.9% |
| Syrian | 18 | 0.6% |
| Ukrainian | 16 | 0.5% |
| Welsh | 36 | 1.2% | View All 40 Rows |
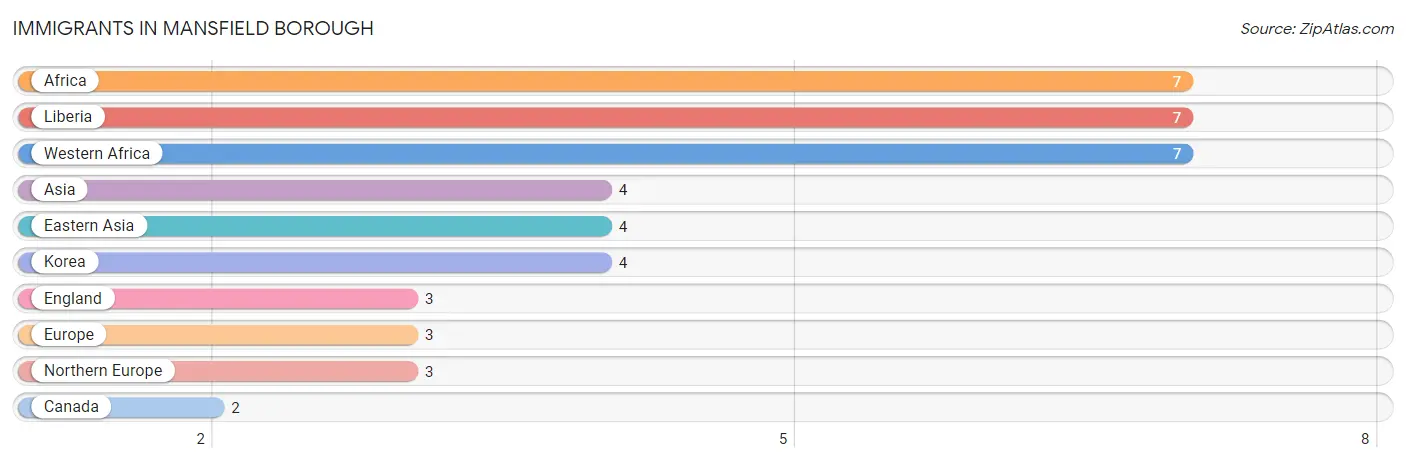
Immigrants in Mansfield borough
The most numerous immigrant groups reported in Mansfield borough came from Africa (7 | 0.2%), Liberia (7 | 0.2%), Western Africa (7 | 0.2%), Asia (4 | 0.1%), and Eastern Asia (4 | 0.1%), together accounting for 0.9% of all Mansfield borough residents.
| Immigration Origin | # Population | % Population |
| Africa | 7 | 0.2% |
| Asia | 4 | 0.1% |
| Canada | 2 | 0.1% |
| Eastern Asia | 4 | 0.1% |
| England | 3 | 0.1% |
| Europe | 3 | 0.1% |
| Korea | 4 | 0.1% |
| Liberia | 7 | 0.2% |
| Northern Europe | 3 | 0.1% |
| Western Africa | 7 | 0.2% | View All 10 Rows |
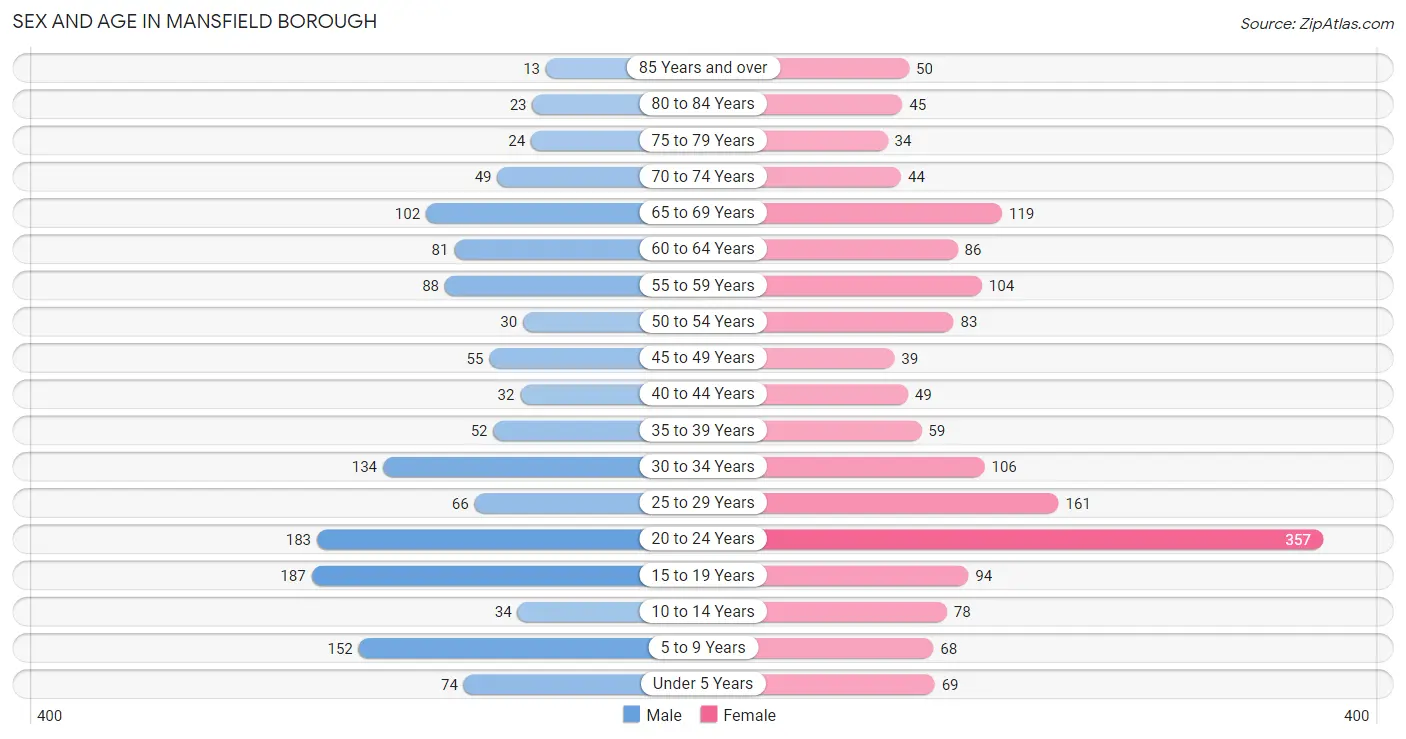
Sex and Age in Mansfield borough
Sex and Age in Mansfield borough
The most populous age groups in Mansfield borough are 15 to 19 Years (187 | 13.6%) for men and 20 to 24 Years (357 | 21.7%) for women.
| Age Bracket | Male | Female |
| Under 5 Years | 74 (5.4%) | 69 (4.2%) |
| 5 to 9 Years | 152 (11.0%) | 68 (4.1%) |
| 10 to 14 Years | 34 (2.5%) | 78 (4.7%) |
| 15 to 19 Years | 187 (13.6%) | 94 (5.7%) |
| 20 to 24 Years | 183 (13.3%) | 357 (21.7%) |
| 25 to 29 Years | 66 (4.8%) | 161 (9.8%) |
| 30 to 34 Years | 134 (9.7%) | 106 (6.4%) |
| 35 to 39 Years | 52 (3.8%) | 59 (3.6%) |
| 40 to 44 Years | 32 (2.3%) | 49 (3.0%) |
| 45 to 49 Years | 55 (4.0%) | 39 (2.4%) |
| 50 to 54 Years | 30 (2.2%) | 83 (5.1%) |
| 55 to 59 Years | 88 (6.4%) | 104 (6.3%) |
| 60 to 64 Years | 81 (5.9%) | 86 (5.2%) |
| 65 to 69 Years | 102 (7.4%) | 119 (7.2%) |
| 70 to 74 Years | 49 (3.5%) | 44 (2.7%) |
| 75 to 79 Years | 24 (1.7%) | 34 (2.1%) |
| 80 to 84 Years | 23 (1.7%) | 45 (2.7%) |
| 85 Years and over | 13 (0.9%) | 50 (3.0%) |
| Total | 1,379 (100.0%) | 1,645 (100.0%) |
Families and Households in Mansfield borough
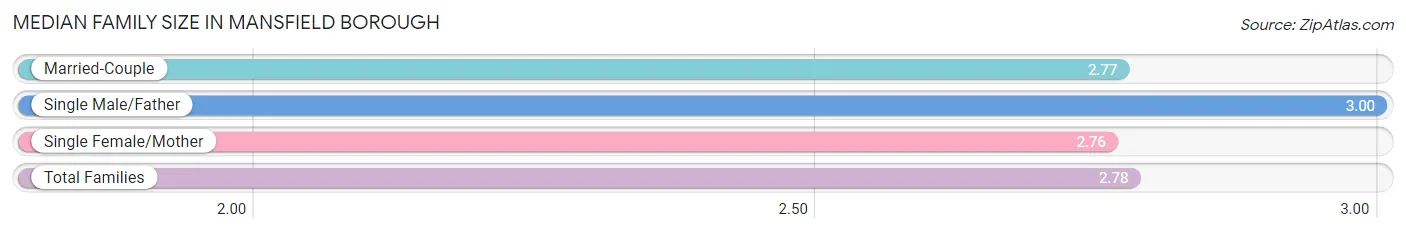
Median Family Size in Mansfield borough
The median family size in Mansfield borough is 2.78 persons per family, with single male/father families (32 | 4.7%) accounting for the largest median family size of 3 persons per family. On the other hand, single female/mother families (228 | 33.8%) represent the smallest median family size with 2.76 persons per family.
| Family Type | # Families | Family Size |
| Married-Couple | 415 (61.5%) | 2.77 |
| Single Male/Father | 32 (4.7%) | 3.00 |
| Single Female/Mother | 228 (33.8%) | 2.76 |
| Total Families | 675 (100.0%) | 2.78 |
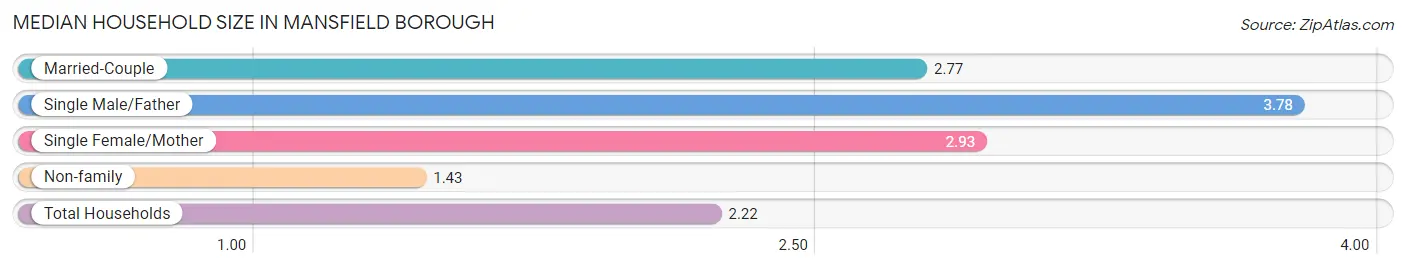
Median Household Size in Mansfield borough
The median household size in Mansfield borough is 2.22 persons per household, with single male/father households (32 | 2.6%) accounting for the largest median household size of 3.78 persons per household. non-family households (556 | 45.2%) represent the smallest median household size with 1.43 persons per household.
| Household Type | # Households | Household Size |
| Married-Couple | 415 (33.7%) | 2.77 |
| Single Male/Father | 32 (2.6%) | 3.78 |
| Single Female/Mother | 228 (18.5%) | 2.93 |
| Non-family | 556 (45.2%) | 1.43 |
| Total Households | 1,231 (100.0%) | 2.22 |
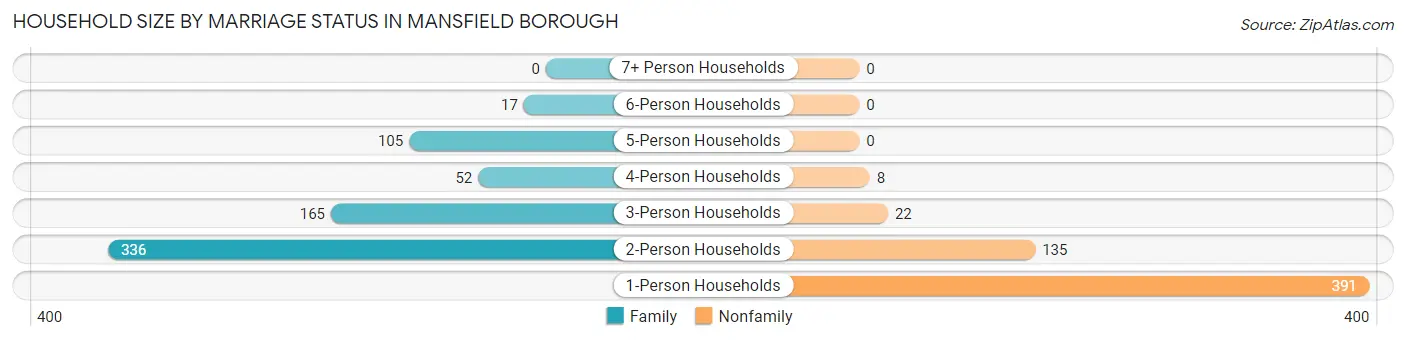
Household Size by Marriage Status in Mansfield borough
Out of a total of 1,231 households in Mansfield borough, 675 (54.8%) are family households, while 556 (45.2%) are nonfamily households. The most numerous type of family households are 2-person households, comprising 336, and the most common type of nonfamily households are 1-person households, comprising 391.
| Household Size | Family Households | Nonfamily Households |
| 1-Person Households | - | 391 (31.8%) |
| 2-Person Households | 336 (27.3%) | 135 (11.0%) |
| 3-Person Households | 165 (13.4%) | 22 (1.8%) |
| 4-Person Households | 52 (4.2%) | 8 (0.6%) |
| 5-Person Households | 105 (8.5%) | 0 (0.0%) |
| 6-Person Households | 17 (1.4%) | 0 (0.0%) |
| 7+ Person Households | 0 (0.0%) | 0 (0.0%) |
| Total | 675 (54.8%) | 556 (45.2%) |
Female Fertility in Mansfield borough
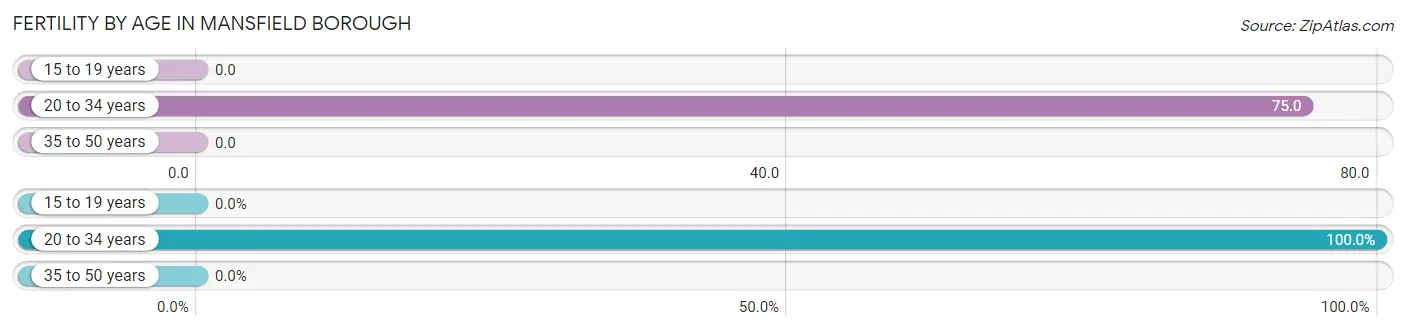
Fertility by Age in Mansfield borough
Average fertility rate in Mansfield borough is 53.0 births per 1,000 women. Women in the age bracket of 20 to 34 years have the highest fertility rate with 75.0 births per 1,000 women. Women in the age bracket of 20 to 34 years acount for 100.0% of all women with births.
| Age Bracket | Women with Births | Births / 1,000 Women |
| 15 to 19 years | 0 (0.0%) | 0.0 |
| 20 to 34 years | 47 (100.0%) | 75.0 |
| 35 to 50 years | 0 (0.0%) | 0.0 |
| Total | 47 (100.0%) | 53.0 |
Fertility by Age by Marriage Status in Mansfield borough
31.9% of women with births (47) in Mansfield borough are married. The highest percentage of unmarried women with births falls into 20 to 34 years age bracket with 68.1% of them unmarried at the time of birth, while the lowest percentage of unmarried women with births belong to 20 to 34 years age bracket with 68.1% of them unmarried.
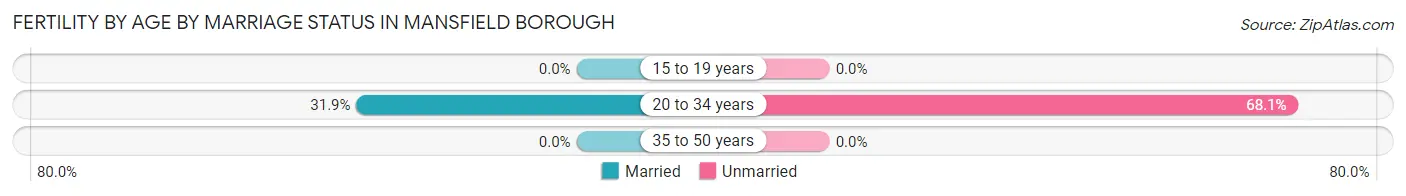
| Age Bracket | Married | Unmarried |
| 15 to 19 years | 0 (0.0%) | 0 (0.0%) |
| 20 to 34 years | 15 (31.9%) | 32 (68.1%) |
| 35 to 50 years | 0 (0.0%) | 0 (0.0%) |
| Total | 15 (31.9%) | 32 (68.1%) |
Fertility by Education in Mansfield borough
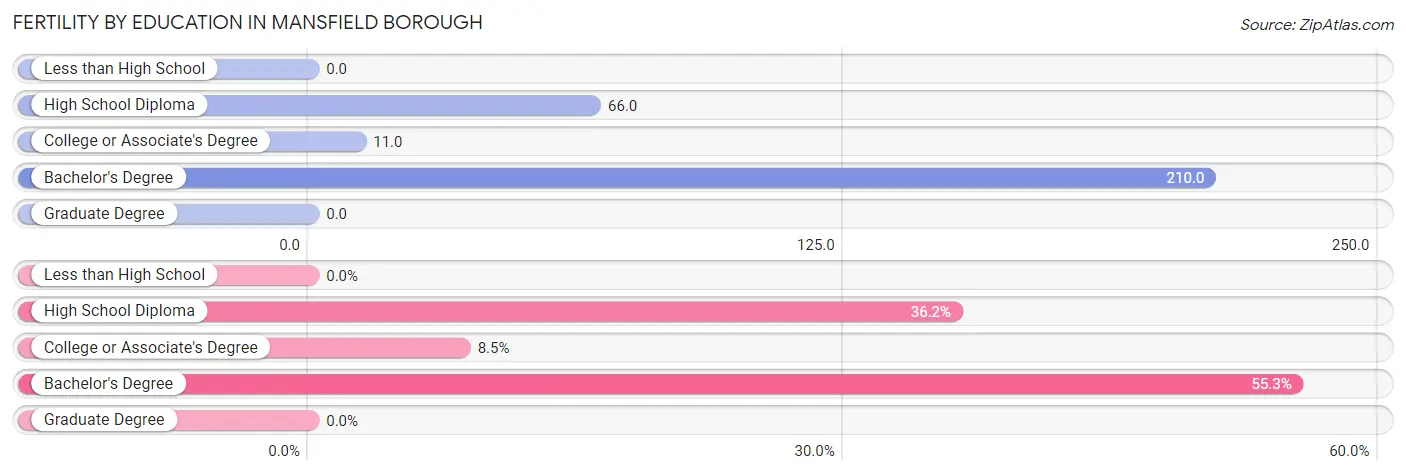
| Educational Attainment | Women with Births | Births / 1,000 Women |
| Less than High School | 0 (0.0%) | 0.0 |
| High School Diploma | 17 (36.2%) | 66.0 |
| College or Associate's Degree | 4 (8.5%) | 11.0 |
| Bachelor's Degree | 26 (55.3%) | 210.0 |
| Graduate Degree | 0 (0.0%) | 0.0 |
| Total | 47 (100.0%) | 53.0 |
Fertility by Education by Marriage Status in Mansfield borough
68.1% of women with births in Mansfield borough are unmarried. Women with the educational attainment of college or associate's degree are most likely to be married with 100.0% of them married at childbirth, while women with the educational attainment of high school diploma are least likely to be married with 100.0% of them unmarried at childbirth.
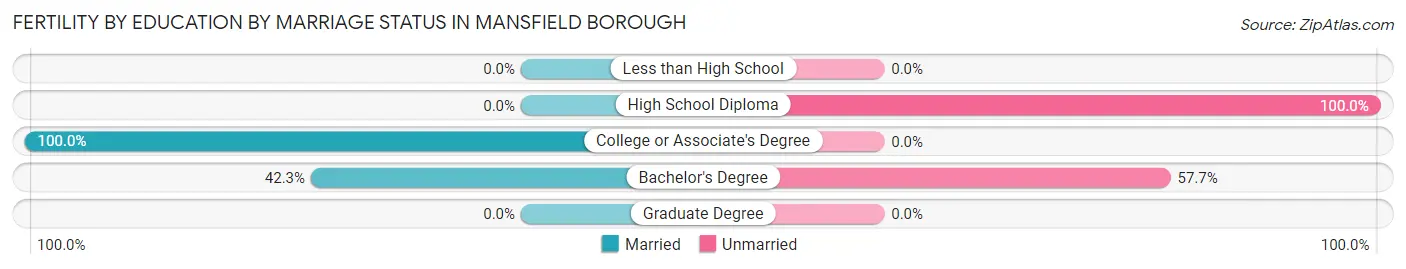
| Educational Attainment | Married | Unmarried |
| Less than High School | 0 (0.0%) | 0 (0.0%) |
| High School Diploma | 0 (0.0%) | 17 (100.0%) |
| College or Associate's Degree | 4 (100.0%) | 0 (0.0%) |
| Bachelor's Degree | 11 (42.3%) | 15 (57.7%) |
| Graduate Degree | 0 (0.0%) | 0 (0.0%) |
| Total | 15 (31.9%) | 32 (68.1%) |
Income in Mansfield borough
Income Overview in Mansfield borough
Per Capita Income in Mansfield borough is $25,199, while median incomes of families and households are $64,943 and $40,565 respectively.
| Characteristic | Number | Measure |
| Per Capita Income | 3,024 | $25,199 |
| Median Family Income | 675 | $64,943 |
| Mean Family Income | 675 | $71,335 |
| Median Household Income | 1,231 | $40,565 |
| Mean Household Income | 1,231 | $59,318 |
| Income Deficit | 675 | $0 |
| Wage / Income Gap (%) | 3,024 | 45.10% |
| Wage / Income Gap ($) | 3,024 | 54.90¢ per $1 |
| Gini / Inequality Index | 3,024 | 0.49 |
Earnings by Sex in Mansfield borough
Average Earnings in Mansfield borough are $16,193, $26,563 for men and $14,583 for women, a difference of 45.1%.
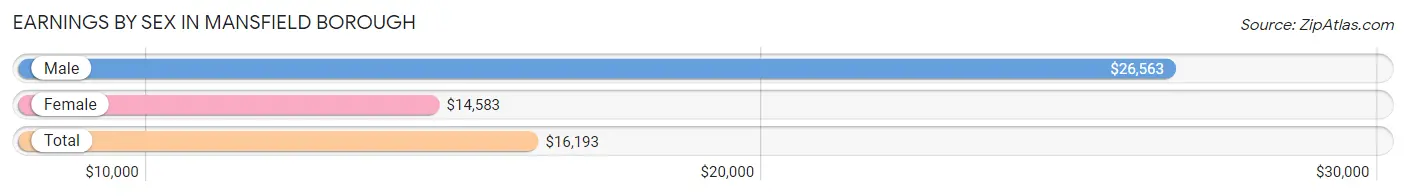
| Sex | Number | Average Earnings |
| Male | 825 (44.2%) | $26,563 |
| Female | 1,041 (55.8%) | $14,583 |
| Total | 1,866 (100.0%) | $16,193 |
Earnings by Sex by Income Bracket in Mansfield borough
The most common earnings brackets in Mansfield borough are $5,000 to $7,499 for men (121 | 14.7%) and $10,000 to $12,499 for women (128 | 12.3%).
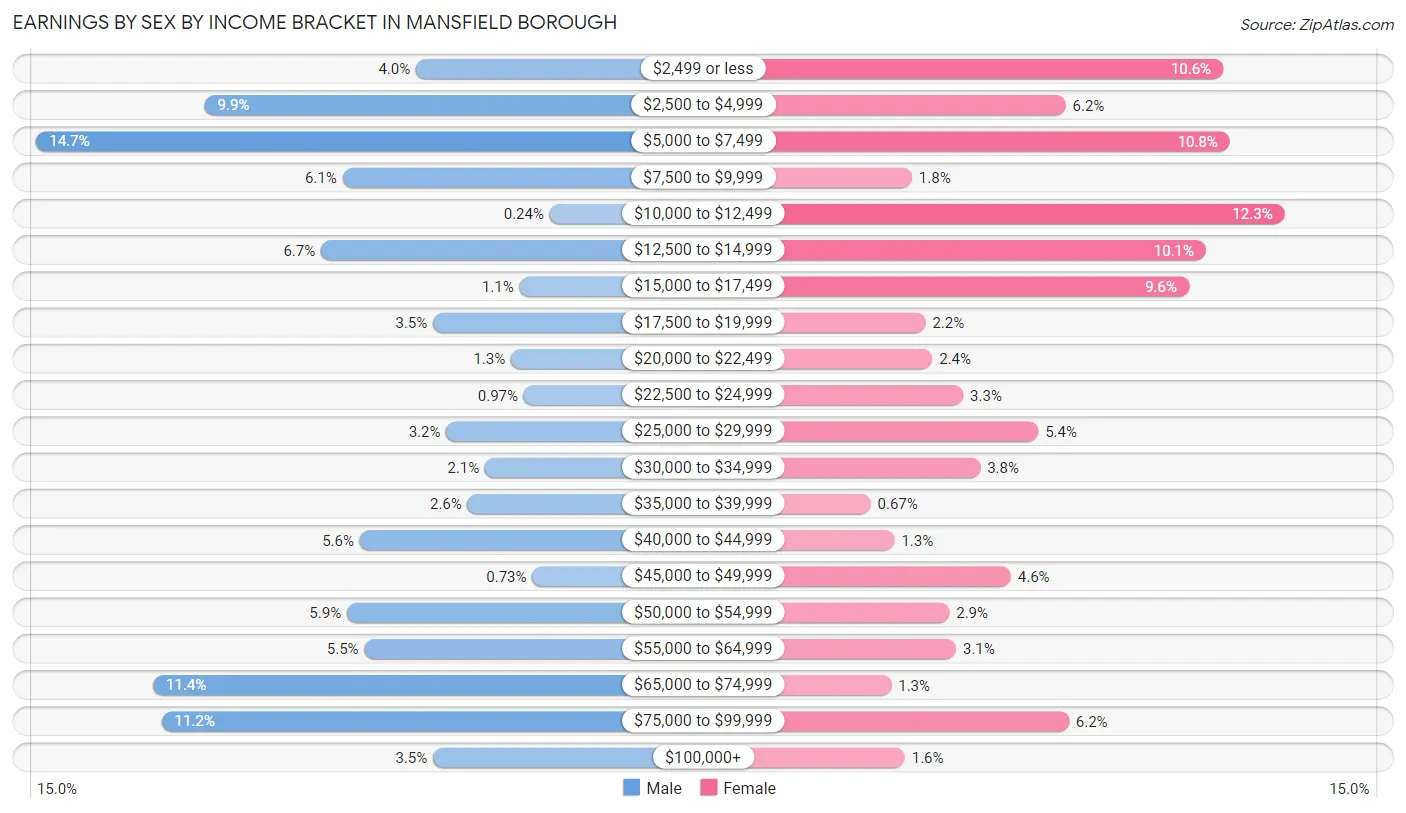
| Income | Male | Female |
| $2,499 or less | 33 (4.0%) | 110 (10.6%) |
| $2,500 to $4,999 | 82 (9.9%) | 64 (6.1%) |
| $5,000 to $7,499 | 121 (14.7%) | 112 (10.8%) |
| $7,500 to $9,999 | 50 (6.1%) | 19 (1.8%) |
| $10,000 to $12,499 | 2 (0.2%) | 128 (12.3%) |
| $12,500 to $14,999 | 55 (6.7%) | 105 (10.1%) |
| $15,000 to $17,499 | 9 (1.1%) | 100 (9.6%) |
| $17,500 to $19,999 | 29 (3.5%) | 23 (2.2%) |
| $20,000 to $22,499 | 11 (1.3%) | 25 (2.4%) |
| $22,500 to $24,999 | 8 (1.0%) | 34 (3.3%) |
| $25,000 to $29,999 | 26 (3.2%) | 56 (5.4%) |
| $30,000 to $34,999 | 17 (2.1%) | 39 (3.7%) |
| $35,000 to $39,999 | 21 (2.5%) | 7 (0.7%) |
| $40,000 to $44,999 | 46 (5.6%) | 14 (1.3%) |
| $45,000 to $49,999 | 6 (0.7%) | 48 (4.6%) |
| $50,000 to $54,999 | 49 (5.9%) | 30 (2.9%) |
| $55,000 to $64,999 | 45 (5.4%) | 32 (3.1%) |
| $65,000 to $74,999 | 94 (11.4%) | 13 (1.3%) |
| $75,000 to $99,999 | 92 (11.2%) | 65 (6.2%) |
| $100,000+ | 29 (3.5%) | 17 (1.6%) |
| Total | 825 (100.0%) | 1,041 (100.0%) |
Earnings by Sex by Educational Attainment in Mansfield borough
Average earnings in Mansfield borough are $54,038 for men and $17,384 for women, a difference of 67.8%. Men with an educational attainment of graduate degree enjoy the highest average annual earnings of $70,750, while those with high school diploma education earn the least with $32,647. Women with an educational attainment of graduate degree earn the most with the average annual earnings of $62,083, while those with bachelor's degree education have the smallest earnings of $12,981.
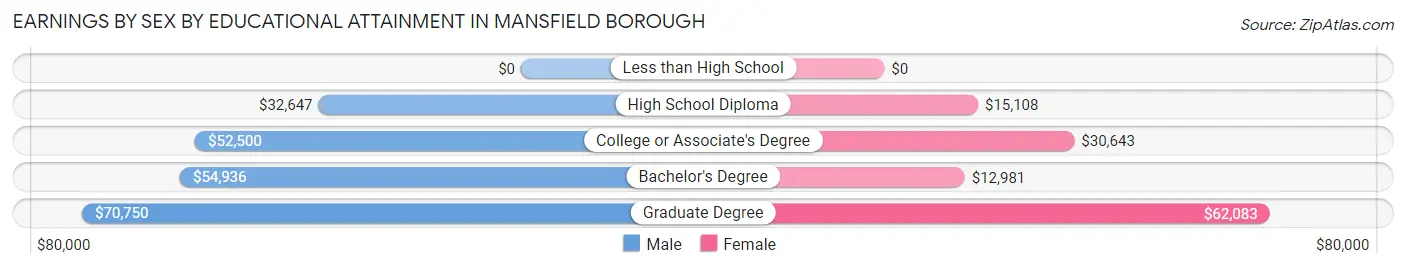
| Educational Attainment | Male Income | Female Income |
| Less than High School | - | - |
| High School Diploma | $32,647 | $15,108 |
| College or Associate's Degree | $52,500 | $30,643 |
| Bachelor's Degree | $54,936 | $12,981 |
| Graduate Degree | $70,750 | $62,083 |
| Total | $54,038 | $17,384 |
Family Income in Mansfield borough
Family Income Brackets in Mansfield borough
According to the Mansfield borough family income data, there are 162 families falling into the $100,000 to $149,999 income range, which is the most common income bracket and makes up 24.0% of all families. Conversely, the $25,000 to $34,999 income bracket is the least frequent group with only 9 families (1.3%) belonging to this category.
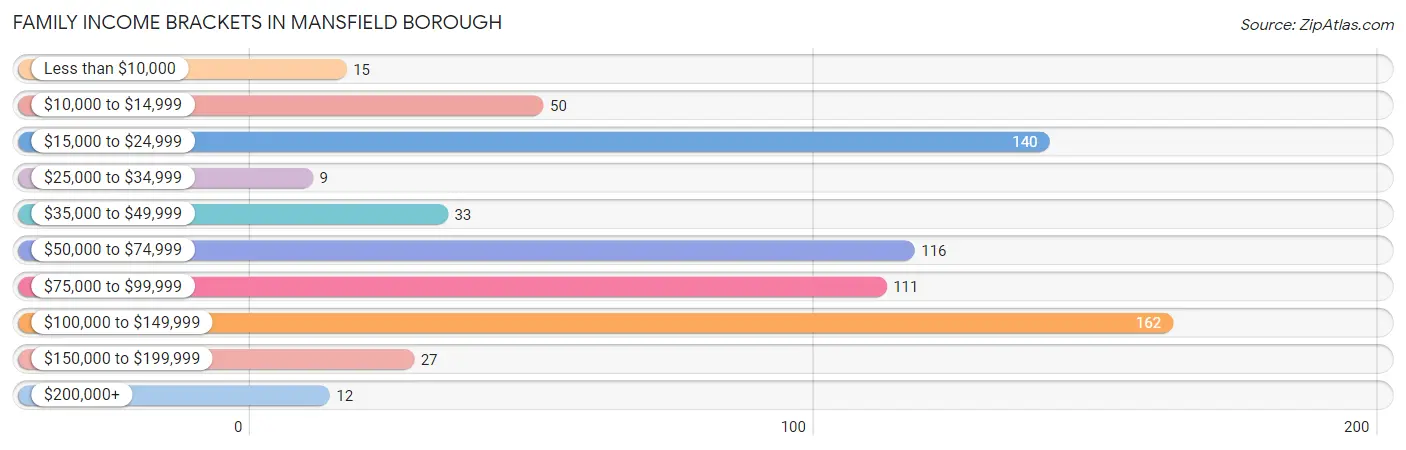
| Income Bracket | # Families | % Families |
| Less than $10,000 | 15 | 2.2% |
| $10,000 to $14,999 | 50 | 7.4% |
| $15,000 to $24,999 | 140 | 20.7% |
| $25,000 to $34,999 | 9 | 1.3% |
| $35,000 to $49,999 | 33 | 4.9% |
| $50,000 to $74,999 | 116 | 17.2% |
| $75,000 to $99,999 | 111 | 16.4% |
| $100,000 to $149,999 | 162 | 24.0% |
| $150,000 to $199,999 | 27 | 4.0% |
| $200,000+ | 12 | 1.8% |
Family Income by Famaliy Size in Mansfield borough
5-person families (98 | 14.5%) account for the highest median family income in Mansfield borough with $127,992 per family, while 2-person families (369 | 54.7%) have the highest median income of $32,188 per family member.
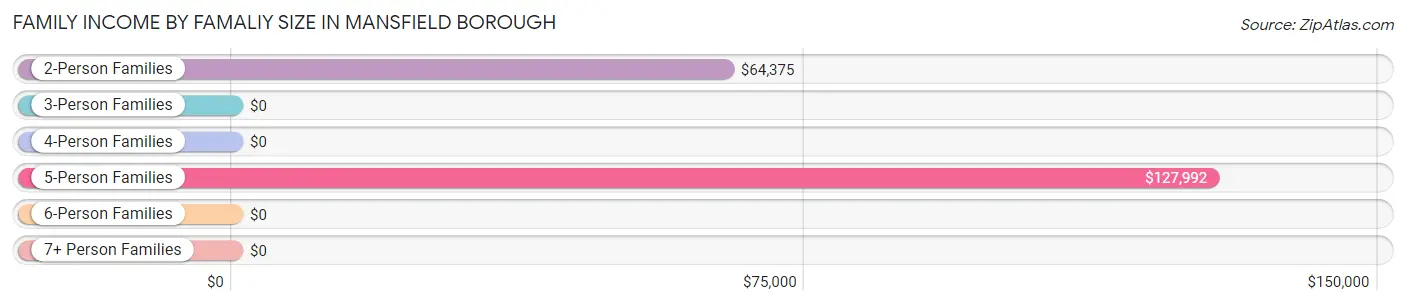
| Income Bracket | # Families | Median Income |
| 2-Person Families | 369 (54.7%) | $64,375 |
| 3-Person Families | 155 (23.0%) | $0 |
| 4-Person Families | 36 (5.3%) | $0 |
| 5-Person Families | 98 (14.5%) | $127,992 |
| 6-Person Families | 17 (2.5%) | $0 |
| 7+ Person Families | 0 (0.0%) | $0 |
| Total | 675 (100.0%) | $64,943 |
Family Income by Number of Earners in Mansfield borough
The median family income in Mansfield borough is $64,943, with families comprising 3+ earners (26) having the highest median family income of $126,500, while families with 1 earner (307) have the lowest median family income of $23,385, accounting for 3.8% and 45.5% of families, respectively.
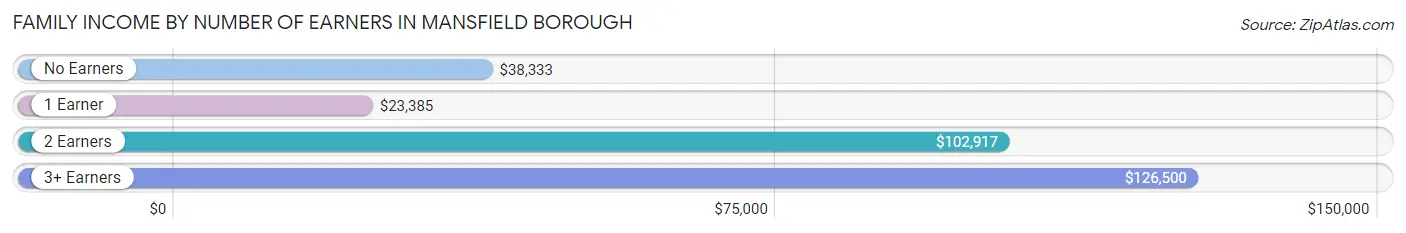
| Number of Earners | # Families | Median Income |
| No Earners | 76 (11.3%) | $38,333 |
| 1 Earner | 307 (45.5%) | $23,385 |
| 2 Earners | 266 (39.4%) | $102,917 |
| 3+ Earners | 26 (3.8%) | $126,500 |
| Total | 675 (100.0%) | $64,943 |
Household Income in Mansfield borough
Household Income Brackets in Mansfield borough
With 297 households falling in the category, the $15,000 to $24,999 income range is the most frequent in Mansfield borough, accounting for 24.1% of all households. In contrast, only 30 households (2.4%) fall into the $200,000+ income bracket, making it the least populous group.
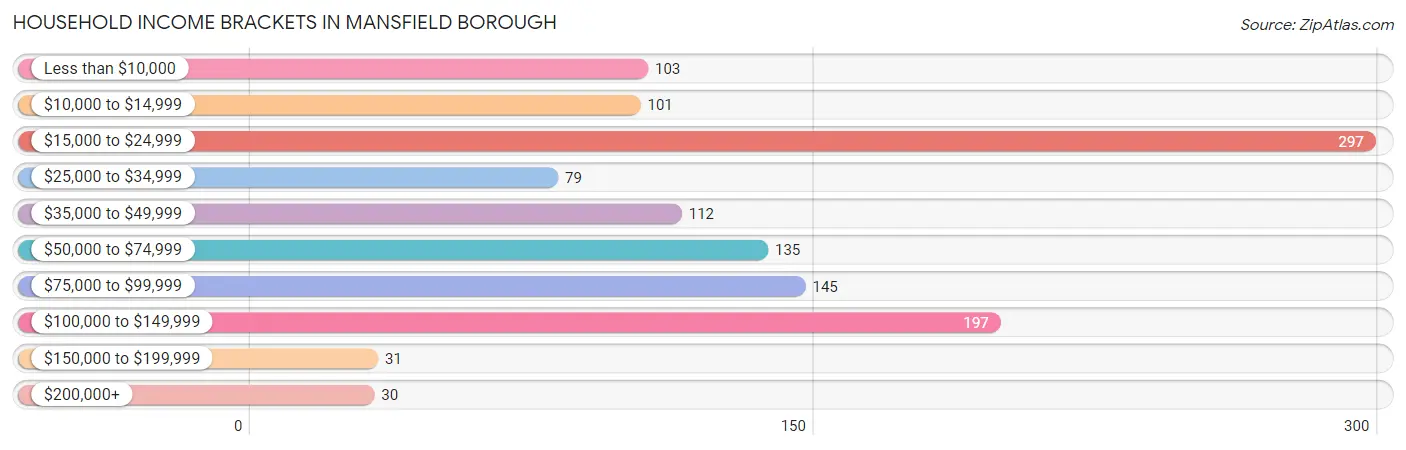
| Income Bracket | # Households | % Households |
| Less than $10,000 | 103 | 8.4% |
| $10,000 to $14,999 | 101 | 8.2% |
| $15,000 to $24,999 | 297 | 24.1% |
| $25,000 to $34,999 | 79 | 6.4% |
| $35,000 to $49,999 | 112 | 9.1% |
| $50,000 to $74,999 | 135 | 11.0% |
| $75,000 to $99,999 | 145 | 11.8% |
| $100,000 to $149,999 | 197 | 16.0% |
| $150,000 to $199,999 | 31 | 2.5% |
| $200,000+ | 30 | 2.4% |
Household Income by Householder Age in Mansfield borough
The median household income in Mansfield borough is $40,565, with the highest median household income of $64,792 found in the 65+ years age bracket for the primary householder. A total of 293 households (23.8%) fall into this category. Meanwhile, the 15 to 24 years age bracket for the primary householder has the lowest median household income of $22,228, with 197 households (16.0%) in this group.
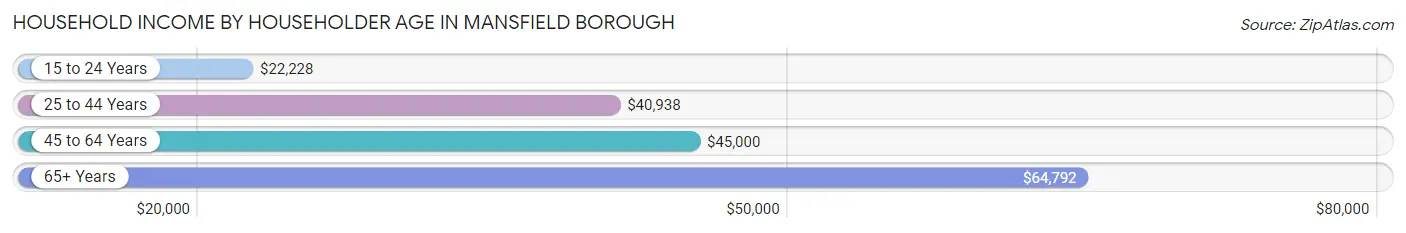
| Income Bracket | # Households | Median Income |
| 15 to 24 Years | 197 (16.0%) | $22,228 |
| 25 to 44 Years | 371 (30.1%) | $40,938 |
| 45 to 64 Years | 370 (30.1%) | $45,000 |
| 65+ Years | 293 (23.8%) | $64,792 |
| Total | 1,231 (100.0%) | $40,565 |
Poverty in Mansfield borough
Income Below Poverty by Sex and Age in Mansfield borough
With 29.7% poverty level for males and 30.4% for females among the residents of Mansfield borough, under 5 year old males and 6 to 11 year old females are the most vulnerable to poverty, with 49 males (66.2%) and 57 females (65.5%) in their respective age groups living below the poverty level.
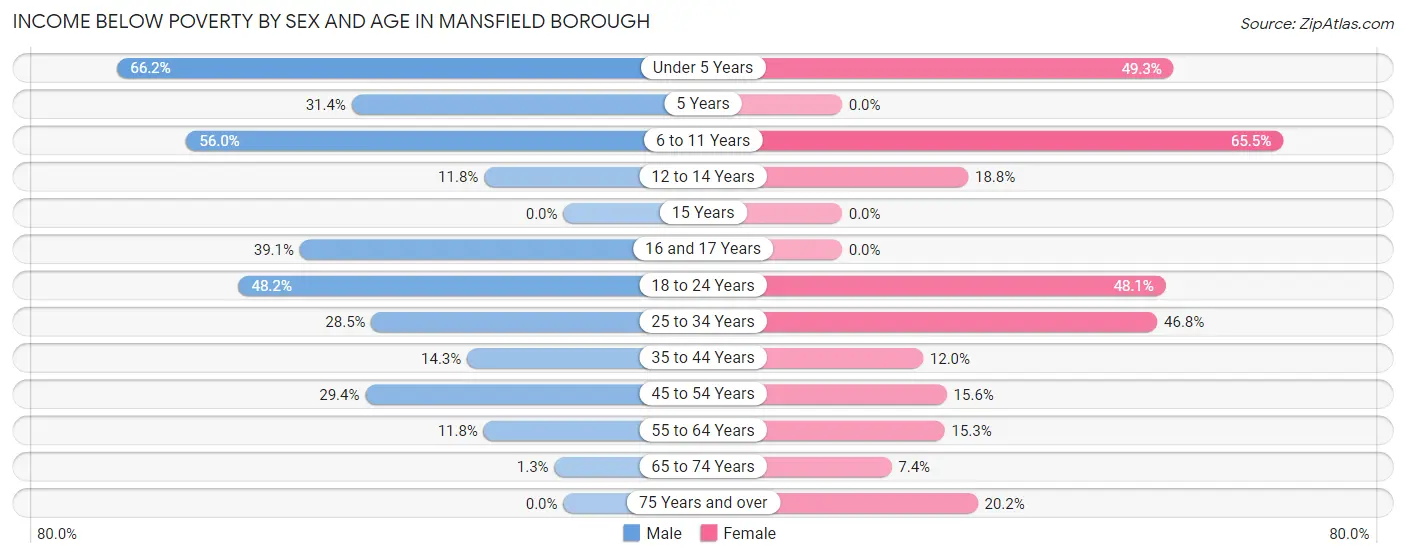
| Age Bracket | Male | Female |
| Under 5 Years | 49 (66.2%) | 34 (49.3%) |
| 5 Years | 11 (31.4%) | 0 (0.0%) |
| 6 to 11 Years | 75 (56.0%) | 57 (65.5%) |
| 12 to 14 Years | 2 (11.8%) | 9 (18.8%) |
| 15 Years | 0 (0.0%) | 0 (0.0%) |
| 16 and 17 Years | 18 (39.1%) | 0 (0.0%) |
| 18 to 24 Years | 109 (48.2%) | 126 (48.1%) |
| 25 to 34 Years | 57 (28.5%) | 125 (46.8%) |
| 35 to 44 Years | 12 (14.3%) | 13 (12.0%) |
| 45 to 54 Years | 25 (29.4%) | 19 (15.6%) |
| 55 to 64 Years | 20 (11.8%) | 29 (15.3%) |
| 65 to 74 Years | 2 (1.3%) | 12 (7.4%) |
| 75 Years and over | 0 (0.0%) | 26 (20.2%) |
| Total | 380 (29.7%) | 450 (30.4%) |
Income Above Poverty by Sex and Age in Mansfield borough
According to the poverty statistics in Mansfield borough, males aged 75 years and over and females aged 5 years are the age groups that are most secure financially, with 100.0% of males and 100.0% of females in these age groups living above the poverty line.
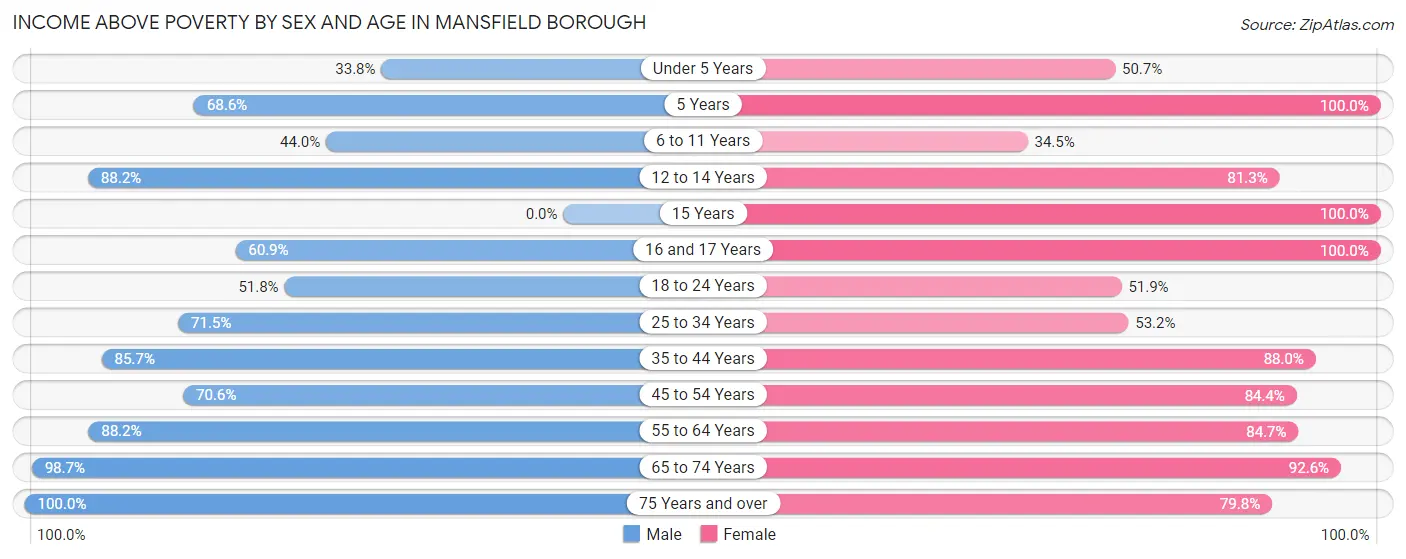
| Age Bracket | Male | Female |
| Under 5 Years | 25 (33.8%) | 35 (50.7%) |
| 5 Years | 24 (68.6%) | 11 (100.0%) |
| 6 to 11 Years | 59 (44.0%) | 30 (34.5%) |
| 12 to 14 Years | 15 (88.2%) | 39 (81.2%) |
| 15 Years | 0 (0.0%) | 5 (100.0%) |
| 16 and 17 Years | 28 (60.9%) | 20 (100.0%) |
| 18 to 24 Years | 117 (51.8%) | 136 (51.9%) |
| 25 to 34 Years | 143 (71.5%) | 142 (53.2%) |
| 35 to 44 Years | 72 (85.7%) | 95 (88.0%) |
| 45 to 54 Years | 60 (70.6%) | 103 (84.4%) |
| 55 to 64 Years | 149 (88.2%) | 161 (84.7%) |
| 65 to 74 Years | 149 (98.7%) | 151 (92.6%) |
| 75 Years and over | 60 (100.0%) | 103 (79.8%) |
| Total | 901 (70.3%) | 1,031 (69.6%) |
Income Below Poverty Among Married-Couple Families in Mansfield borough
The poverty statistics for married-couple families in Mansfield borough show that 1.5% or 6 of the total 415 families live below the poverty line. Families with 3 or 4 children have the highest poverty rate of 7.8%, comprising of 6 families. On the other hand, families with no children have the lowest poverty rate of 0.0%, which includes 0 families.
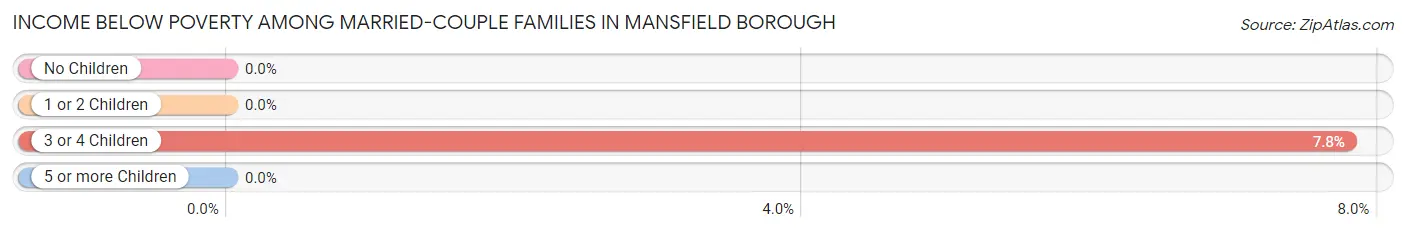
| Children | Above Poverty | Below Poverty |
| No Children | 276 (100.0%) | 0 (0.0%) |
| 1 or 2 Children | 62 (100.0%) | 0 (0.0%) |
| 3 or 4 Children | 71 (92.2%) | 6 (7.8%) |
| 5 or more Children | 0 (0.0%) | 0 (0.0%) |
| Total | 409 (98.6%) | 6 (1.5%) |
Income Below Poverty Among Single-Parent Households in Mansfield borough
According to the poverty data in Mansfield borough, 50.0% or 16 single-father households and 43.9% or 100 single-mother households are living below the poverty line. Among single-father households, those with 1 or 2 children have the highest poverty rate, with 16 households (59.3%) experiencing poverty. Likewise, among single-mother households, those with 1 or 2 children have the highest poverty rate, with 80 households (58.8%) falling below the poverty line.
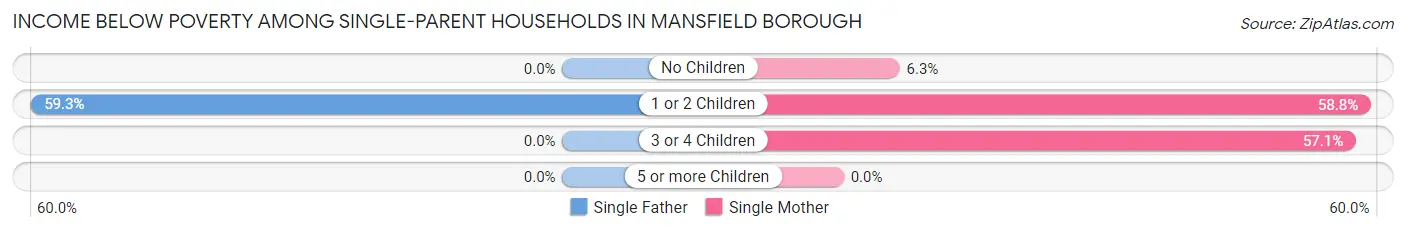
| Children | Single Father | Single Mother |
| No Children | 0 (0.0%) | 4 (6.2%) |
| 1 or 2 Children | 16 (59.3%) | 80 (58.8%) |
| 3 or 4 Children | 0 (0.0%) | 16 (57.1%) |
| 5 or more Children | 0 (0.0%) | 0 (0.0%) |
| Total | 16 (50.0%) | 100 (43.9%) |
Income Below Poverty Among Married-Couple vs Single-Parent Households in Mansfield borough
The poverty data for Mansfield borough shows that 6 of the married-couple family households (1.5%) and 116 of the single-parent households (44.6%) are living below the poverty level. Within the married-couple family households, those with 3 or 4 children have the highest poverty rate, with 6 households (7.8%) falling below the poverty line. Among the single-parent households, those with 1 or 2 children have the highest poverty rate, with 96 household (58.9%) living below poverty.
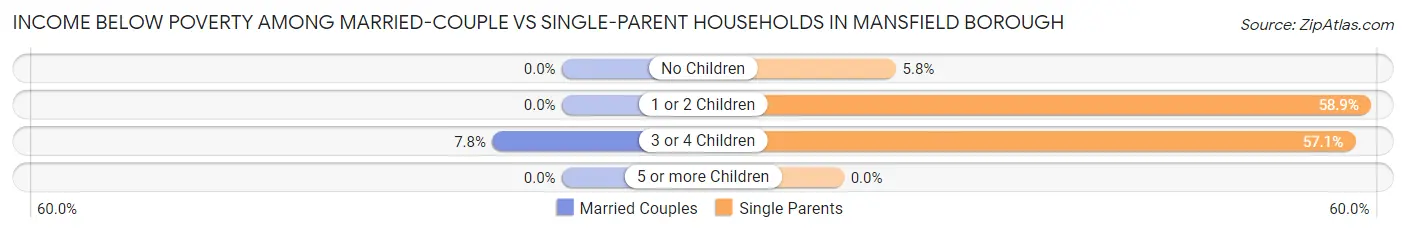
| Children | Married-Couple Families | Single-Parent Households |
| No Children | 0 (0.0%) | 4 (5.8%) |
| 1 or 2 Children | 0 (0.0%) | 96 (58.9%) |
| 3 or 4 Children | 6 (7.8%) | 16 (57.1%) |
| 5 or more Children | 0 (0.0%) | 0 (0.0%) |
| Total | 6 (1.5%) | 116 (44.6%) |
Employment Characteristics in Mansfield borough
Employment by Class of Employer in Mansfield borough
Among the 1,527 employed individuals in Mansfield borough, private company employees (826 | 54.1%), not-for-profit organizations (195 | 12.8%), and self-employed (not incorporated) (149 | 9.8%) make up the most common classes of employment.
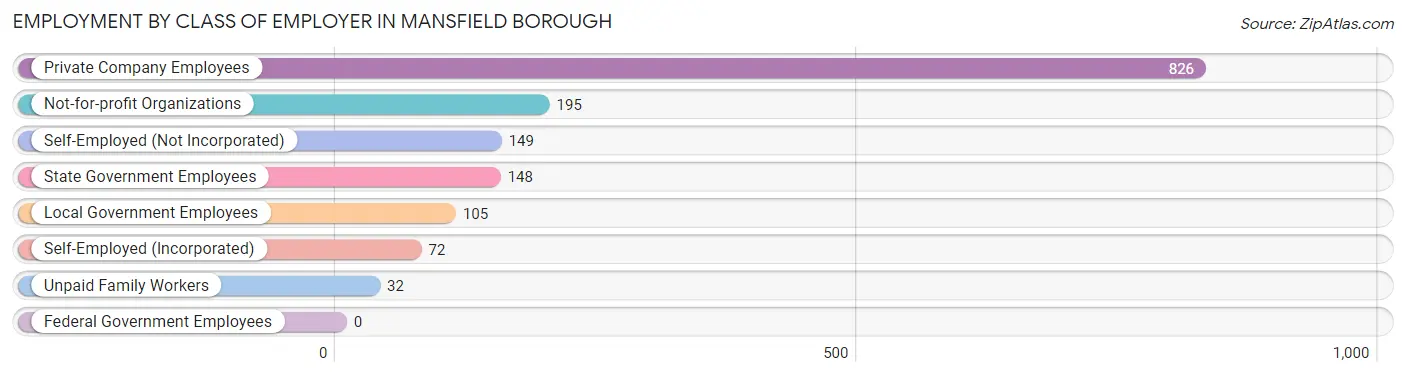
| Employer Class | # Employees | % Employees |
| Private Company Employees | 826 | 54.1% |
| Self-Employed (Incorporated) | 72 | 4.7% |
| Self-Employed (Not Incorporated) | 149 | 9.8% |
| Not-for-profit Organizations | 195 | 12.8% |
| Local Government Employees | 105 | 6.9% |
| State Government Employees | 148 | 9.7% |
| Federal Government Employees | 0 | 0.0% |
| Unpaid Family Workers | 32 | 2.1% |
| Total | 1,527 | 100.0% |
Employment Status by Age in Mansfield borough
According to the labor force statistics for Mansfield borough, out of the total population over 16 years of age (2,544), 65.3% or 1,661 individuals are in the labor force, with 6.4% or 106 of them unemployed. The age group with the highest labor force participation rate is 30 to 34 years, with 87.9% or 211 individuals in the labor force. Within the labor force, the 35 to 44 years age range has the highest percentage of unemployed individuals, with 24.4% or 33 of them being unemployed.
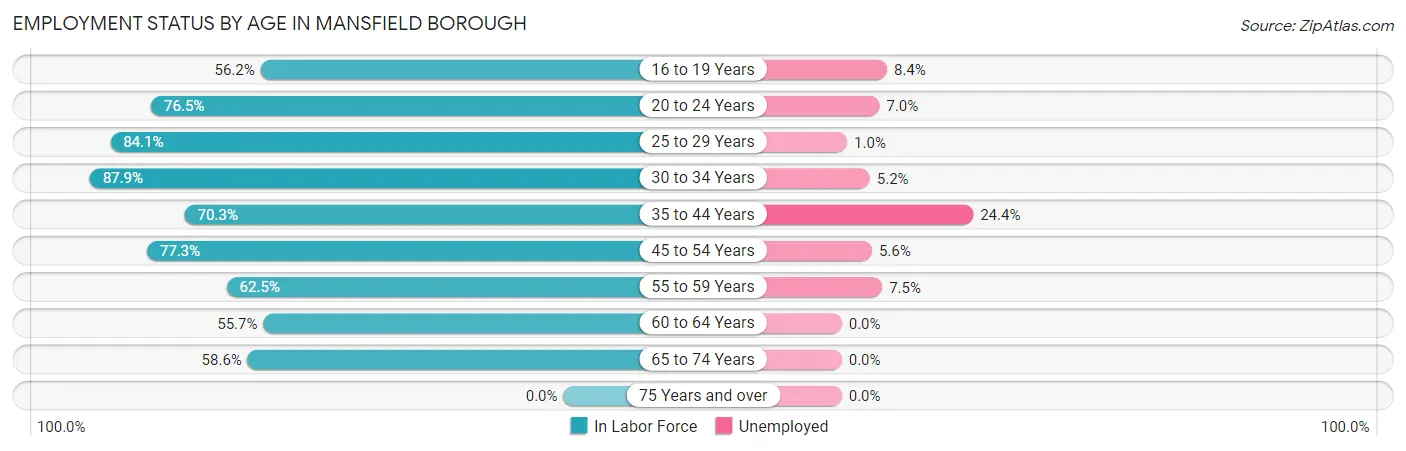
| Age Bracket | In Labor Force | Unemployed |
| 16 to 19 Years | 155 (56.2%) | 13 (8.4%) |
| 20 to 24 Years | 413 (76.5%) | 29 (7.0%) |
| 25 to 29 Years | 191 (84.1%) | 2 (1.0%) |
| 30 to 34 Years | 211 (87.9%) | 11 (5.2%) |
| 35 to 44 Years | 135 (70.3%) | 33 (24.4%) |
| 45 to 54 Years | 160 (77.3%) | 9 (5.6%) |
| 55 to 59 Years | 120 (62.5%) | 9 (7.5%) |
| 60 to 64 Years | 93 (55.7%) | 0 (0.0%) |
| 65 to 74 Years | 184 (58.6%) | 0 (0.0%) |
| 75 Years and over | 0 (0.0%) | 0 (0.0%) |
| Total | 1,661 (65.3%) | 106 (6.4%) |
Employment Status by Educational Attainment in Mansfield borough
According to labor force statistics for Mansfield borough, 74.3% of individuals (910) out of the total population between 25 and 64 years of age (1,225) are in the labor force, with 7.0% or 64 of them being unemployed. The group with the highest labor force participation rate are those with the educational attainment of bachelor's degree or higher, with 85.3% or 399 individuals in the labor force. Within the labor force, individuals with high school diploma education have the highest percentage of unemployment, with 11.0% or 28 of them being unemployed.
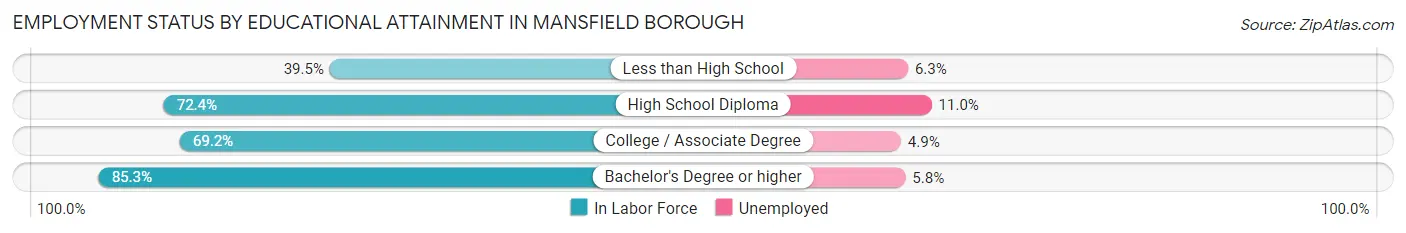
| Educational Attainment | In Labor Force | Unemployed |
| Less than High School | 32 (39.5%) | 5 (6.3%) |
| High School Diploma | 254 (72.4%) | 39 (11.0%) |
| College / Associate Degree | 225 (69.2%) | 16 (4.9%) |
| Bachelor's Degree or higher | 399 (85.3%) | 27 (5.8%) |
| Total | 910 (74.3%) | 86 (7.0%) |
Employment Occupations by Sex in Mansfield borough
Management, Business, Science and Arts Occupations
The most common Management, Business, Science and Arts occupations in Mansfield borough are Community & Social Service (245 | 15.8%), Education Instruction & Library (186 | 11.9%), Computers, Engineering & Science (107 | 6.9%), Management (92 | 5.9%), and Architecture & Engineering (85 | 5.5%).
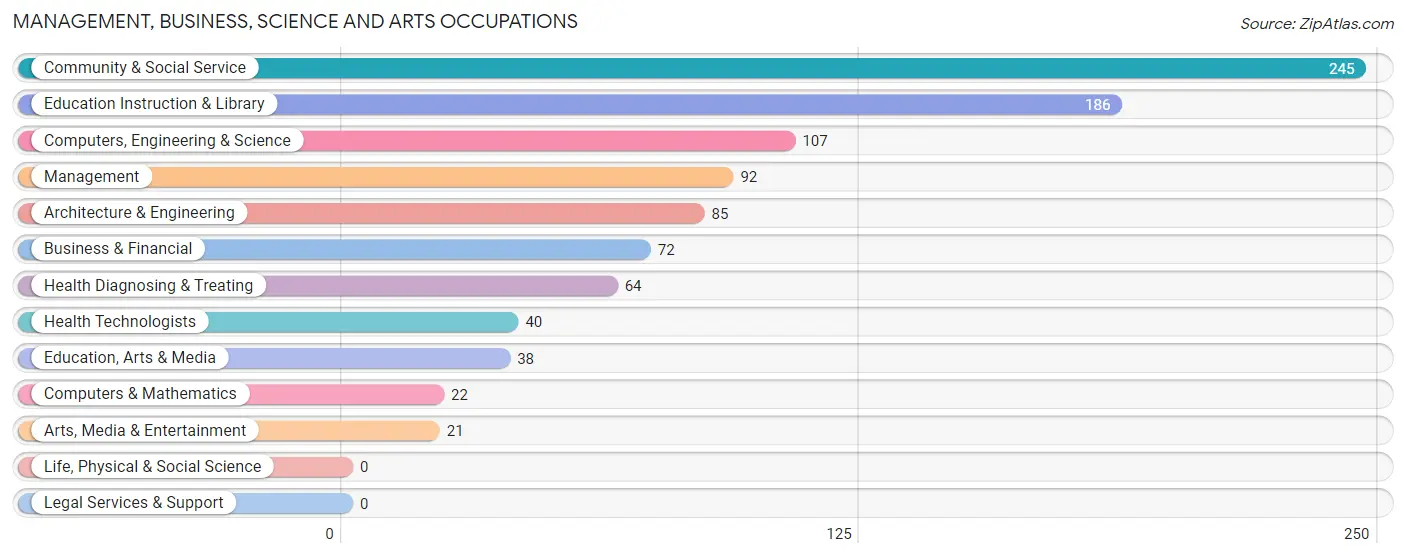
Management, Business, Science and Arts Occupations by Sex
Within the Management, Business, Science and Arts occupations in Mansfield borough, the most male-oriented occupations are Business & Financial (94.4%), Architecture & Engineering (94.1%), and Computers, Engineering & Science (80.4%), while the most female-oriented occupations are Health Technologists (85.0%), Education Instruction & Library (82.8%), and Health Diagnosing & Treating (79.7%).
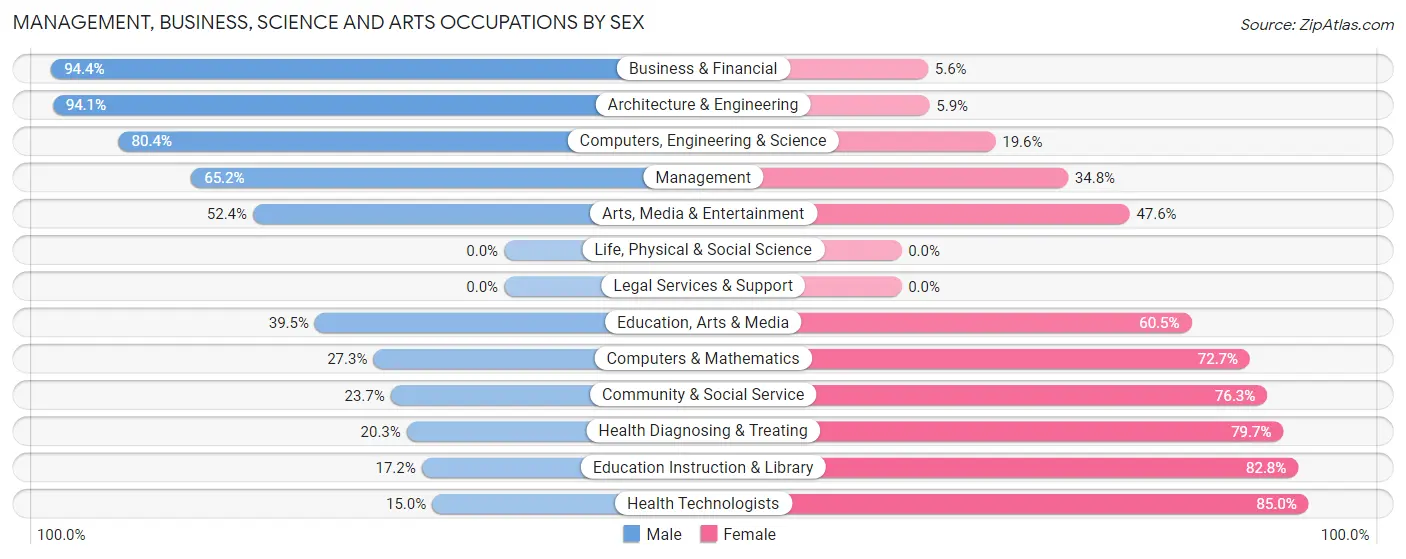
| Occupation | Male | Female |
| Management | 60 (65.2%) | 32 (34.8%) |
| Business & Financial | 68 (94.4%) | 4 (5.6%) |
| Computers, Engineering & Science | 86 (80.4%) | 21 (19.6%) |
| Computers & Mathematics | 6 (27.3%) | 16 (72.7%) |
| Architecture & Engineering | 80 (94.1%) | 5 (5.9%) |
| Life, Physical & Social Science | 0 (0.0%) | 0 (0.0%) |
| Community & Social Service | 58 (23.7%) | 187 (76.3%) |
| Education, Arts & Media | 15 (39.5%) | 23 (60.5%) |
| Legal Services & Support | 0 (0.0%) | 0 (0.0%) |
| Education Instruction & Library | 32 (17.2%) | 154 (82.8%) |
| Arts, Media & Entertainment | 11 (52.4%) | 10 (47.6%) |
| Health Diagnosing & Treating | 13 (20.3%) | 51 (79.7%) |
| Health Technologists | 6 (15.0%) | 34 (85.0%) |
| Total (Category) | 285 (49.1%) | 295 (50.9%) |
| Total (Overall) | 722 (46.4%) | 834 (53.6%) |
Services Occupations
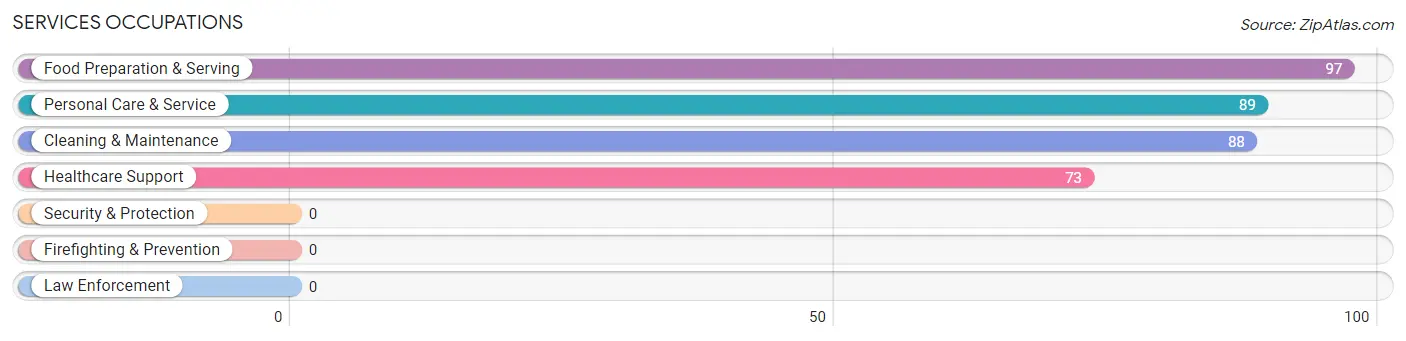
The most common Services occupations in Mansfield borough are Food Preparation & Serving (97 | 6.2%), Personal Care & Service (89 | 5.7%), Cleaning & Maintenance (88 | 5.7%), and Healthcare Support (73 | 4.7%).
Services Occupations by Sex
Within the Services occupations in Mansfield borough, the most male-oriented occupations are Food Preparation & Serving (71.1%), Cleaning & Maintenance (30.7%), and Personal Care & Service (13.5%), while the most female-oriented occupations are Healthcare Support (90.4%), Personal Care & Service (86.5%), and Cleaning & Maintenance (69.3%).
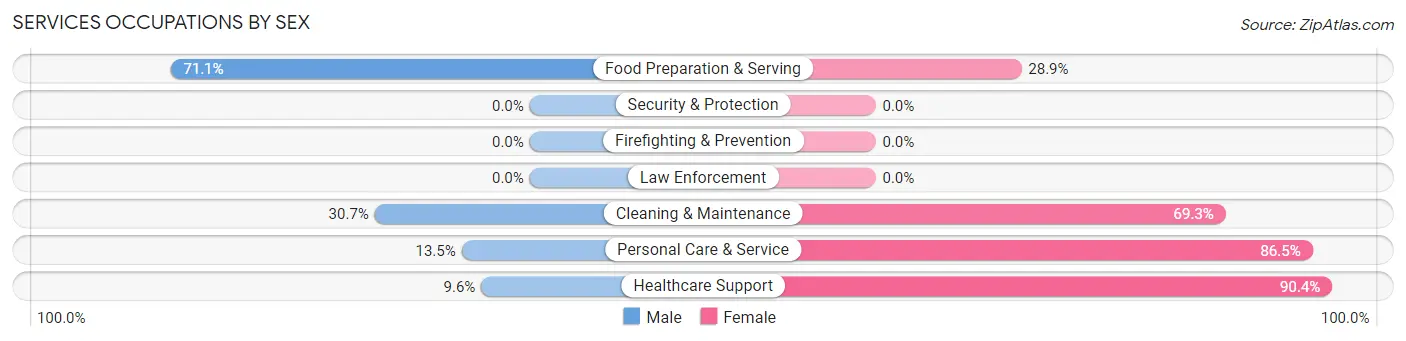
| Occupation | Male | Female |
| Healthcare Support | 7 (9.6%) | 66 (90.4%) |
| Security & Protection | 0 (0.0%) | 0 (0.0%) |
| Firefighting & Prevention | 0 (0.0%) | 0 (0.0%) |
| Law Enforcement | 0 (0.0%) | 0 (0.0%) |
| Food Preparation & Serving | 69 (71.1%) | 28 (28.9%) |
| Cleaning & Maintenance | 27 (30.7%) | 61 (69.3%) |
| Personal Care & Service | 12 (13.5%) | 77 (86.5%) |
| Total (Category) | 115 (33.1%) | 232 (66.9%) |
| Total (Overall) | 722 (46.4%) | 834 (53.6%) |
Sales and Office Occupations
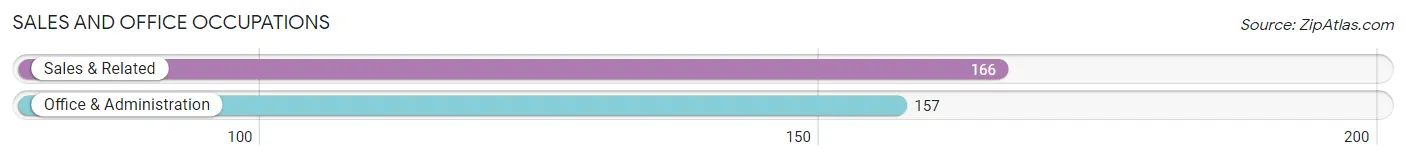
The most common Sales and Office occupations in Mansfield borough are Sales & Related (166 | 10.7%), and Office & Administration (157 | 10.1%).
Sales and Office Occupations by Sex
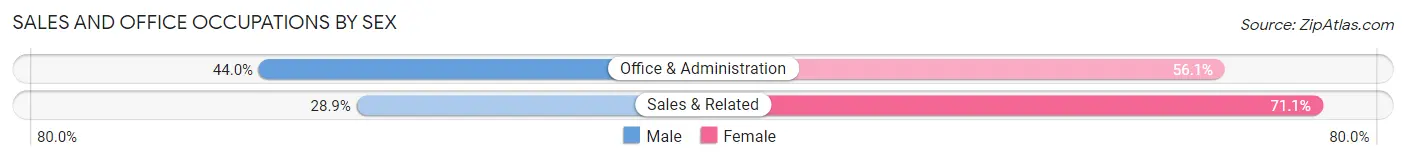
| Occupation | Male | Female |
| Sales & Related | 48 (28.9%) | 118 (71.1%) |
| Office & Administration | 69 (44.0%) | 88 (56.0%) |
| Total (Category) | 117 (36.2%) | 206 (63.8%) |
| Total (Overall) | 722 (46.4%) | 834 (53.6%) |
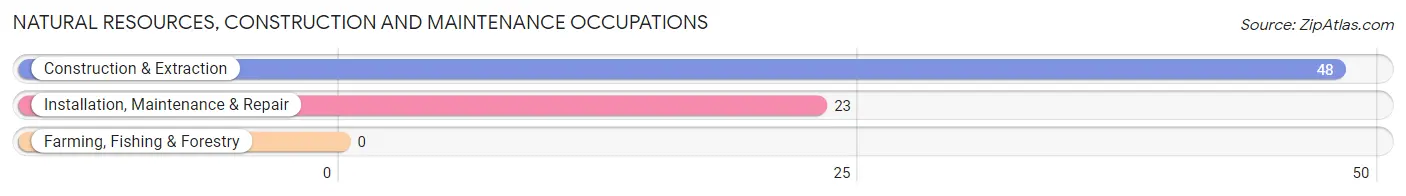
Natural Resources, Construction and Maintenance Occupations
The most common Natural Resources, Construction and Maintenance occupations in Mansfield borough are Construction & Extraction (48 | 3.1%), and Installation, Maintenance & Repair (23 | 1.5%).
Natural Resources, Construction and Maintenance Occupations by Sex
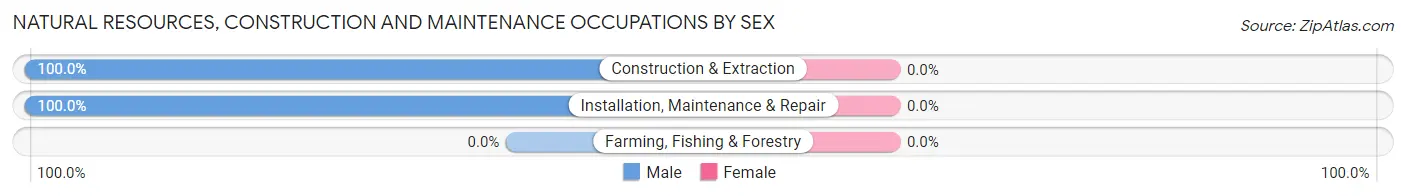
| Occupation | Male | Female |
| Farming, Fishing & Forestry | 0 (0.0%) | 0 (0.0%) |
| Construction & Extraction | 48 (100.0%) | 0 (0.0%) |
| Installation, Maintenance & Repair | 23 (100.0%) | 0 (0.0%) |
| Total (Category) | 71 (100.0%) | 0 (0.0%) |
| Total (Overall) | 722 (46.4%) | 834 (53.6%) |
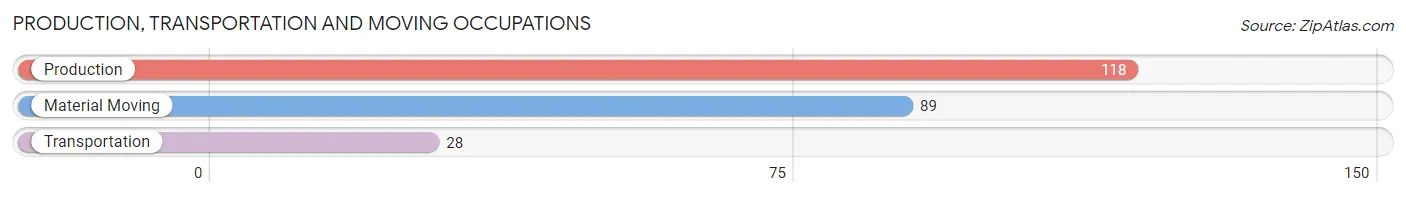
Production, Transportation and Moving Occupations
The most common Production, Transportation and Moving occupations in Mansfield borough are Production (118 | 7.6%), Material Moving (89 | 5.7%), and Transportation (28 | 1.8%).
Production, Transportation and Moving Occupations by Sex
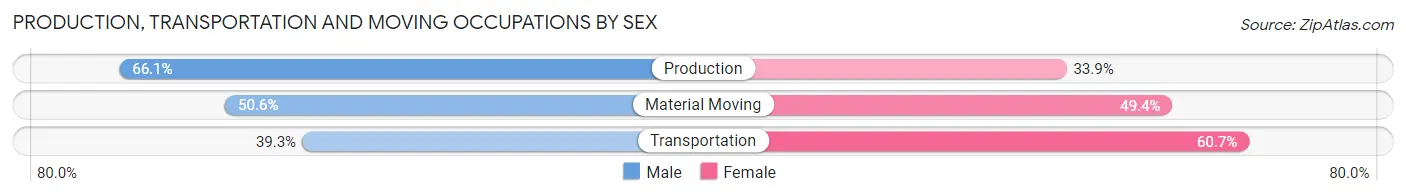
| Occupation | Male | Female |
| Production | 78 (66.1%) | 40 (33.9%) |
| Transportation | 11 (39.3%) | 17 (60.7%) |
| Material Moving | 45 (50.6%) | 44 (49.4%) |
| Total (Category) | 134 (57.0%) | 101 (43.0%) |
| Total (Overall) | 722 (46.4%) | 834 (53.6%) |
Employment Industries by Sex in Mansfield borough
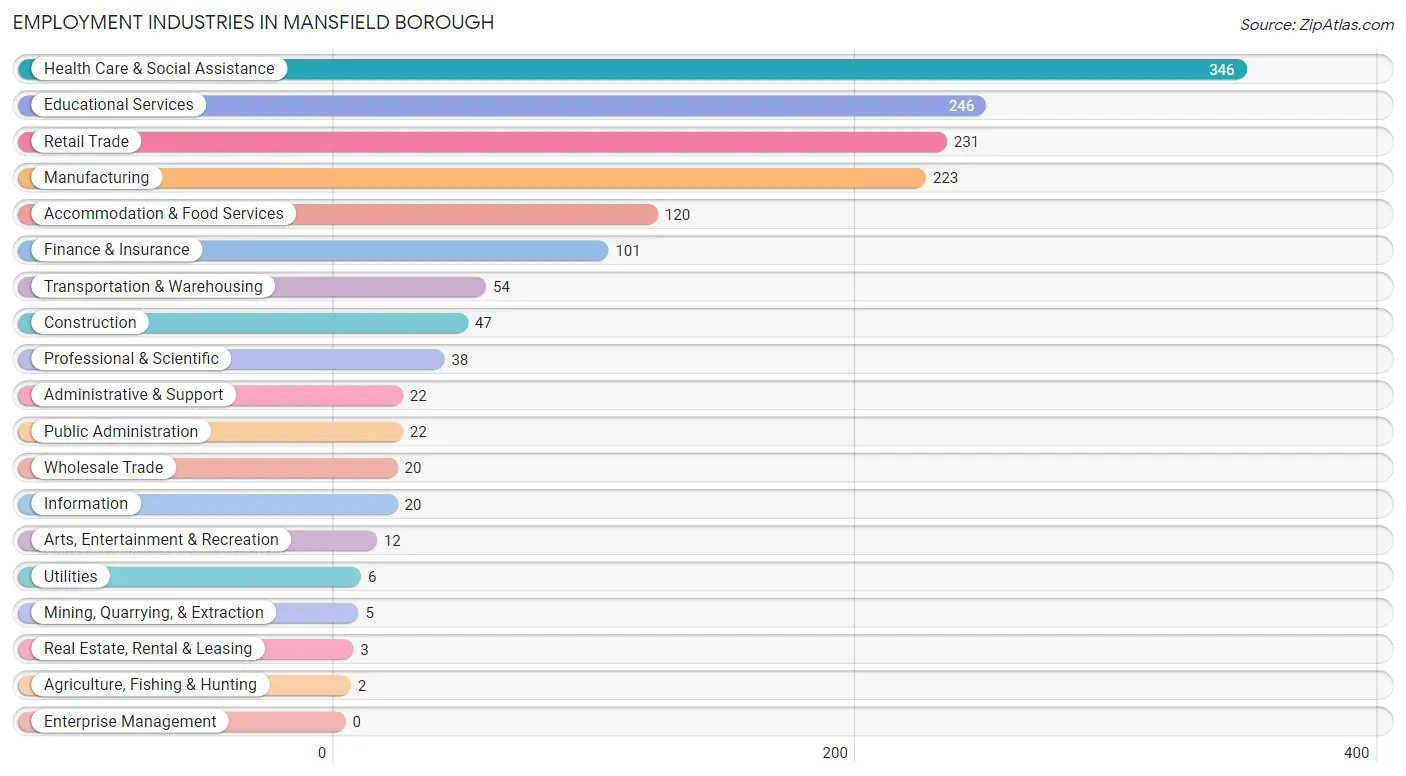
Employment Industries in Mansfield borough
The major employment industries in Mansfield borough include Health Care & Social Assistance (346 | 22.2%), Educational Services (246 | 15.8%), Retail Trade (231 | 14.8%), Manufacturing (223 | 14.3%), and Accommodation & Food Services (120 | 7.7%).
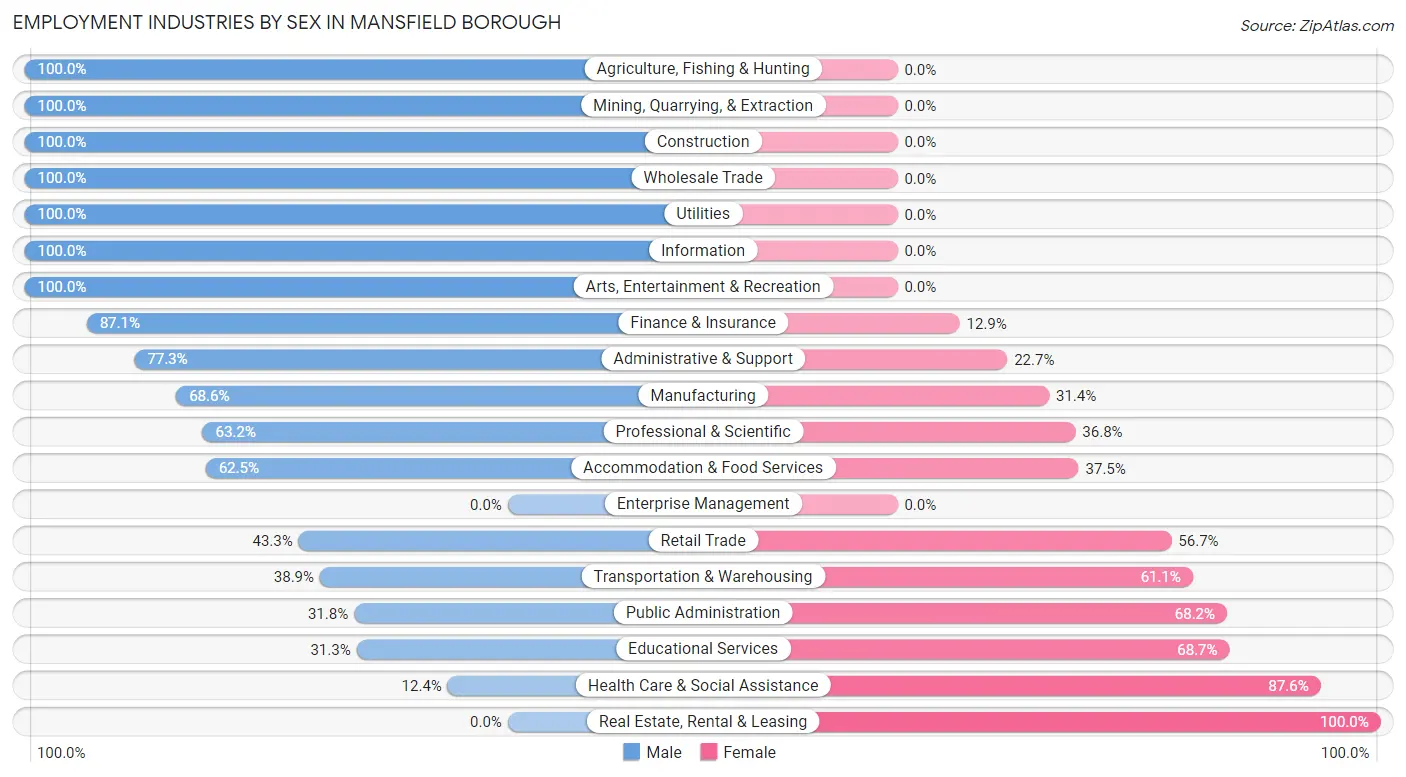
Employment Industries by Sex in Mansfield borough
The Mansfield borough industries that see more men than women are Agriculture, Fishing & Hunting (100.0%), Mining, Quarrying, & Extraction (100.0%), and Construction (100.0%), whereas the industries that tend to have a higher number of women are Real Estate, Rental & Leasing (100.0%), Health Care & Social Assistance (87.6%), and Educational Services (68.7%).
| Industry | Male | Female |
| Agriculture, Fishing & Hunting | 2 (100.0%) | 0 (0.0%) |
| Mining, Quarrying, & Extraction | 5 (100.0%) | 0 (0.0%) |
| Construction | 47 (100.0%) | 0 (0.0%) |
| Manufacturing | 153 (68.6%) | 70 (31.4%) |
| Wholesale Trade | 20 (100.0%) | 0 (0.0%) |
| Retail Trade | 100 (43.3%) | 131 (56.7%) |
| Transportation & Warehousing | 21 (38.9%) | 33 (61.1%) |
| Utilities | 6 (100.0%) | 0 (0.0%) |
| Information | 20 (100.0%) | 0 (0.0%) |
| Finance & Insurance | 88 (87.1%) | 13 (12.9%) |
| Real Estate, Rental & Leasing | 0 (0.0%) | 3 (100.0%) |
| Professional & Scientific | 24 (63.2%) | 14 (36.8%) |
| Enterprise Management | 0 (0.0%) | 0 (0.0%) |
| Administrative & Support | 17 (77.3%) | 5 (22.7%) |
| Educational Services | 77 (31.3%) | 169 (68.7%) |
| Health Care & Social Assistance | 43 (12.4%) | 303 (87.6%) |
| Arts, Entertainment & Recreation | 12 (100.0%) | 0 (0.0%) |
| Accommodation & Food Services | 75 (62.5%) | 45 (37.5%) |
| Public Administration | 7 (31.8%) | 15 (68.2%) |
| Total | 722 (46.4%) | 834 (53.6%) |
Education in Mansfield borough
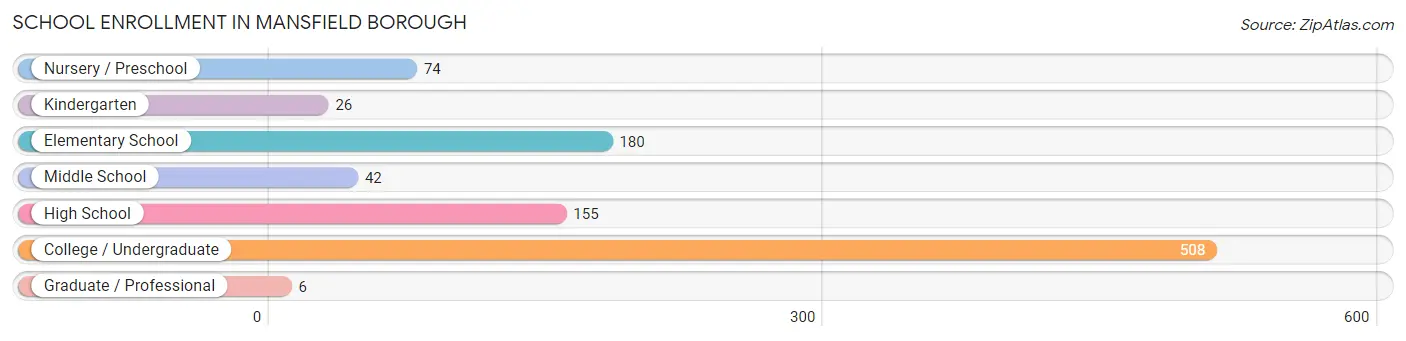
School Enrollment in Mansfield borough
The most common levels of schooling among the 991 students in Mansfield borough are college / undergraduate (508 | 51.3%), elementary school (180 | 18.2%), and high school (155 | 15.6%).
| School Level | # Students | % Students |
| Nursery / Preschool | 74 | 7.5% |
| Kindergarten | 26 | 2.6% |
| Elementary School | 180 | 18.2% |
| Middle School | 42 | 4.2% |
| High School | 155 | 15.6% |
| College / Undergraduate | 508 | 51.3% |
| Graduate / Professional | 6 | 0.6% |
| Total | 991 | 100.0% |
School Enrollment by Age by Funding Source in Mansfield borough
Out of a total of 991 students who are enrolled in schools in Mansfield borough, 46 (4.6%) attend a private institution, while the remaining 945 (95.4%) are enrolled in public schools. The age group of 15 to 17 year olds has the highest likelihood of being enrolled in private schools, with 8 (11.8% in the age bracket) enrolled. Conversely, the age group of 3 to 4 year olds has the lowest likelihood of being enrolled in a private school, with 50 (100.0% in the age bracket) attending a public institution.
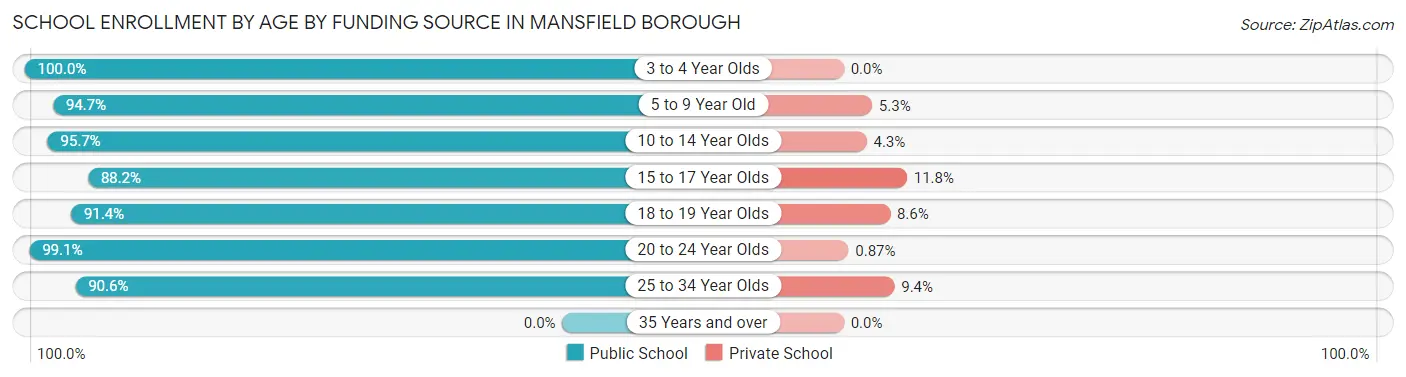
| Age Bracket | Public School | Private School |
| 3 to 4 Year Olds | 50 (100.0%) | 0 (0.0%) |
| 5 to 9 Year Old | 198 (94.7%) | 11 (5.3%) |
| 10 to 14 Year Olds | 90 (95.7%) | 4 (4.3%) |
| 15 to 17 Year Olds | 60 (88.2%) | 8 (11.8%) |
| 18 to 19 Year Olds | 159 (91.4%) | 15 (8.6%) |
| 20 to 24 Year Olds | 340 (99.1%) | 3 (0.9%) |
| 25 to 34 Year Olds | 48 (90.6%) | 5 (9.4%) |
| 35 Years and over | 0 (0.0%) | 0 (0.0%) |
| Total | 945 (95.4%) | 46 (4.6%) |
Educational Attainment by Field of Study in Mansfield borough
Education (168 | 25.9%), business (112 | 17.3%), liberal arts & history (77 | 11.9%), arts & humanities (51 | 7.9%), and visual & performing arts (44 | 6.8%) are the most common fields of study among 649 individuals in Mansfield borough who have obtained a bachelor's degree or higher.
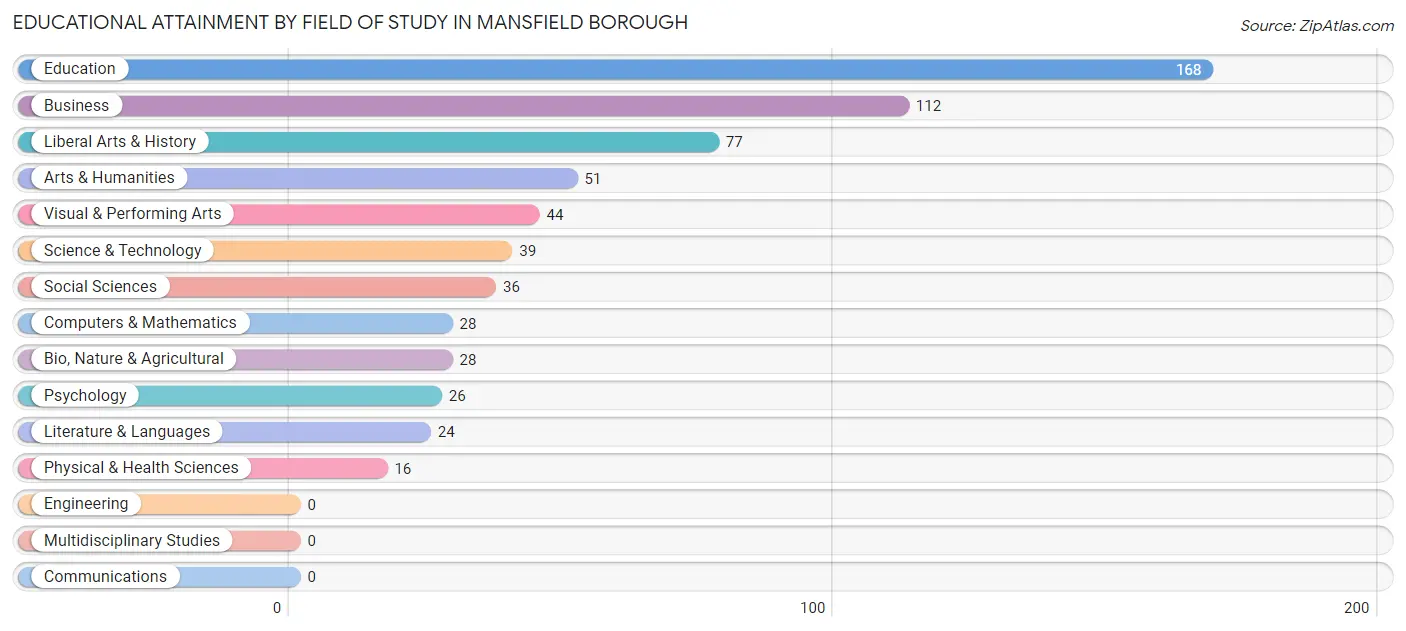
| Field of Study | # Graduates | % Graduates |
| Computers & Mathematics | 28 | 4.3% |
| Bio, Nature & Agricultural | 28 | 4.3% |
| Physical & Health Sciences | 16 | 2.5% |
| Psychology | 26 | 4.0% |
| Social Sciences | 36 | 5.6% |
| Engineering | 0 | 0.0% |
| Multidisciplinary Studies | 0 | 0.0% |
| Science & Technology | 39 | 6.0% |
| Business | 112 | 17.3% |
| Education | 168 | 25.9% |
| Literature & Languages | 24 | 3.7% |
| Liberal Arts & History | 77 | 11.9% |
| Visual & Performing Arts | 44 | 6.8% |
| Communications | 0 | 0.0% |
| Arts & Humanities | 51 | 7.9% |
| Total | 649 | 100.0% |
Transportation & Commute in Mansfield borough
Vehicle Availability by Sex in Mansfield borough
The most prevalent vehicle ownership categories in Mansfield borough are males with 2 vehicles (346, accounting for 56.7%) and females with 2 vehicles (272, making up 47.5%).
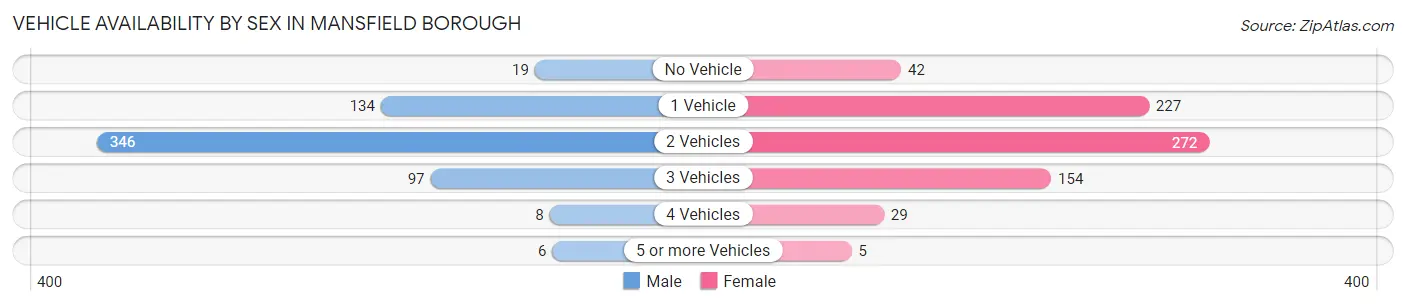
| Vehicles Available | Male | Female |
| No Vehicle | 19 (3.1%) | 42 (5.8%) |
| 1 Vehicle | 134 (22.0%) | 227 (31.1%) |
| 2 Vehicles | 346 (56.7%) | 272 (37.3%) |
| 3 Vehicles | 97 (15.9%) | 154 (21.1%) |
| 4 Vehicles | 8 (1.3%) | 29 (4.0%) |
| 5 or more Vehicles | 6 (1.0%) | 5 (0.7%) |
| Total | 610 (100.0%) | 729 (100.0%) |
Commute Time in Mansfield borough
The most frequently occuring commute durations in Mansfield borough are 5 to 9 minutes (443 commuters, 31.3%), 10 to 14 minutes (192 commuters, 13.6%), and 20 to 24 minutes (180 commuters, 12.7%).
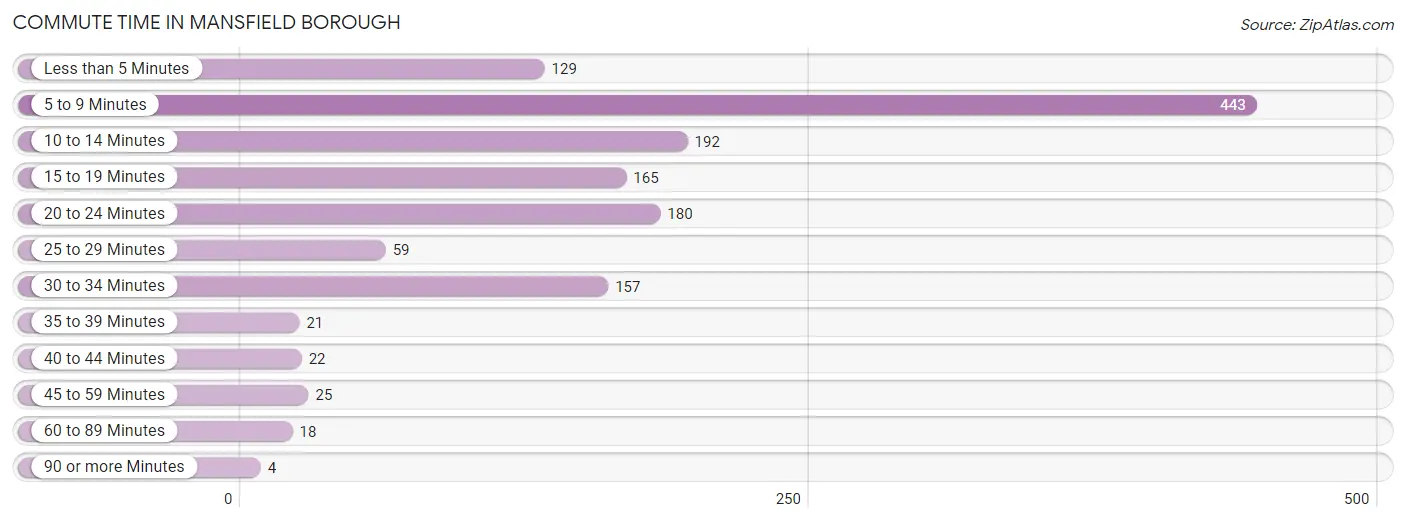
| Commute Time | # Commuters | % Commuters |
| Less than 5 Minutes | 129 | 9.1% |
| 5 to 9 Minutes | 443 | 31.3% |
| 10 to 14 Minutes | 192 | 13.6% |
| 15 to 19 Minutes | 165 | 11.7% |
| 20 to 24 Minutes | 180 | 12.7% |
| 25 to 29 Minutes | 59 | 4.2% |
| 30 to 34 Minutes | 157 | 11.1% |
| 35 to 39 Minutes | 21 | 1.5% |
| 40 to 44 Minutes | 22 | 1.5% |
| 45 to 59 Minutes | 25 | 1.8% |
| 60 to 89 Minutes | 18 | 1.3% |
| 90 or more Minutes | 4 | 0.3% |
Commute Time by Sex in Mansfield borough
The most common commute times in Mansfield borough are 5 to 9 minutes (167 commuters, 26.9%) for males and 5 to 9 minutes (276 commuters, 34.8%) for females.
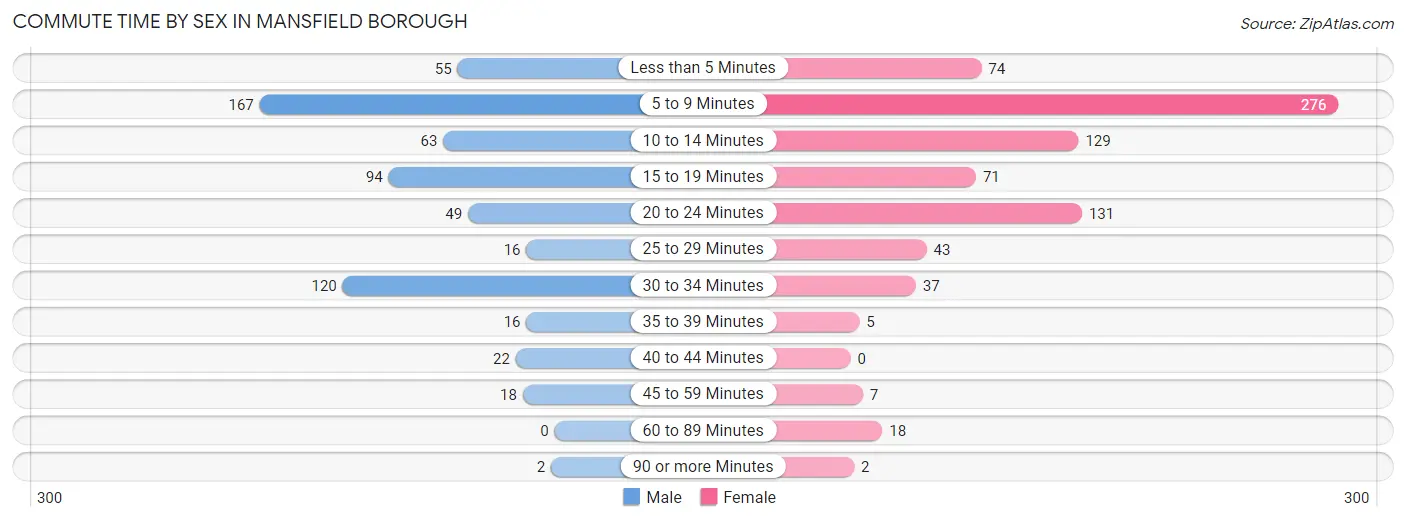
| Commute Time | Male | Female |
| Less than 5 Minutes | 55 (8.8%) | 74 (9.3%) |
| 5 to 9 Minutes | 167 (26.9%) | 276 (34.8%) |
| 10 to 14 Minutes | 63 (10.1%) | 129 (16.3%) |
| 15 to 19 Minutes | 94 (15.1%) | 71 (8.9%) |
| 20 to 24 Minutes | 49 (7.9%) | 131 (16.5%) |
| 25 to 29 Minutes | 16 (2.6%) | 43 (5.4%) |
| 30 to 34 Minutes | 120 (19.3%) | 37 (4.7%) |
| 35 to 39 Minutes | 16 (2.6%) | 5 (0.6%) |
| 40 to 44 Minutes | 22 (3.5%) | 0 (0.0%) |
| 45 to 59 Minutes | 18 (2.9%) | 7 (0.9%) |
| 60 to 89 Minutes | 0 (0.0%) | 18 (2.3%) |
| 90 or more Minutes | 2 (0.3%) | 2 (0.3%) |
Time of Departure to Work by Sex in Mansfield borough
The most frequent times of departure to work in Mansfield borough are 6:00 AM to 6:29 AM (100, 16.1%) for males and 7:30 AM to 7:59 AM (149, 18.8%) for females.
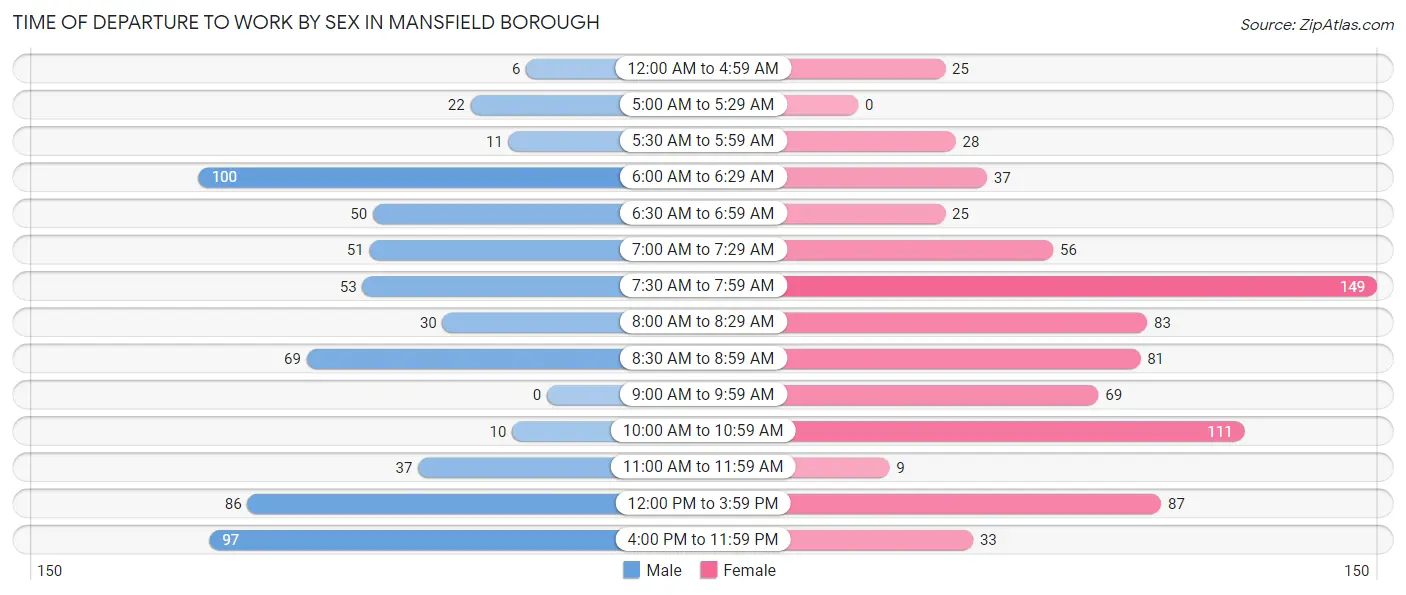
| Time of Departure | Male | Female |
| 12:00 AM to 4:59 AM | 6 (1.0%) | 25 (3.2%) |
| 5:00 AM to 5:29 AM | 22 (3.5%) | 0 (0.0%) |
| 5:30 AM to 5:59 AM | 11 (1.8%) | 28 (3.5%) |
| 6:00 AM to 6:29 AM | 100 (16.1%) | 37 (4.7%) |
| 6:30 AM to 6:59 AM | 50 (8.0%) | 25 (3.2%) |
| 7:00 AM to 7:29 AM | 51 (8.2%) | 56 (7.1%) |
| 7:30 AM to 7:59 AM | 53 (8.5%) | 149 (18.8%) |
| 8:00 AM to 8:29 AM | 30 (4.8%) | 83 (10.5%) |
| 8:30 AM to 8:59 AM | 69 (11.1%) | 81 (10.2%) |
| 9:00 AM to 9:59 AM | 0 (0.0%) | 69 (8.7%) |
| 10:00 AM to 10:59 AM | 10 (1.6%) | 111 (14.0%) |
| 11:00 AM to 11:59 AM | 37 (5.9%) | 9 (1.1%) |
| 12:00 PM to 3:59 PM | 86 (13.8%) | 87 (11.0%) |
| 4:00 PM to 11:59 PM | 97 (15.6%) | 33 (4.2%) |
| Total | 622 (100.0%) | 793 (100.0%) |
Housing Occupancy in Mansfield borough
Occupancy by Ownership in Mansfield borough
Of the total 1,231 dwellings in Mansfield borough, owner-occupied units account for 579 (47.0%), while renter-occupied units make up 652 (53.0%).
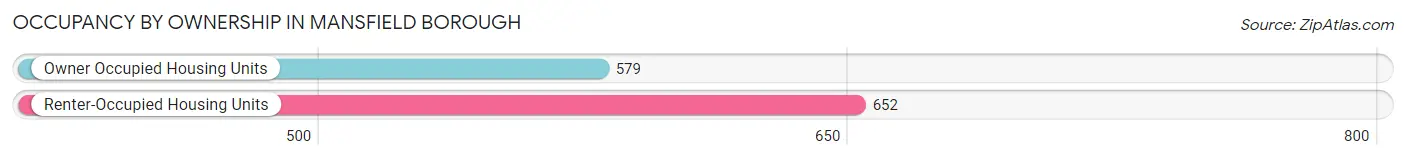
| Occupancy | # Housing Units | % Housing Units |
| Owner Occupied Housing Units | 579 | 47.0% |
| Renter-Occupied Housing Units | 652 | 53.0% |
| Total Occupied Housing Units | 1,231 | 100.0% |
Occupancy by Household Size in Mansfield borough
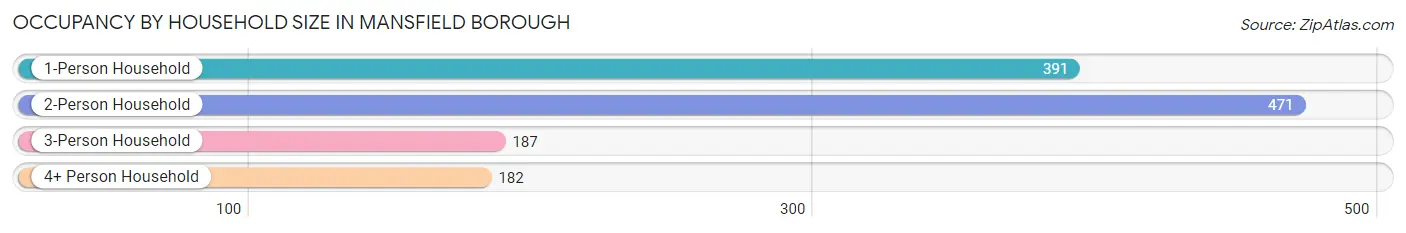
| Household Size | # Housing Units | % Housing Units |
| 1-Person Household | 391 | 31.8% |
| 2-Person Household | 471 | 38.3% |
| 3-Person Household | 187 | 15.2% |
| 4+ Person Household | 182 | 14.8% |
| Total Housing Units | 1,231 | 100.0% |
Occupancy by Ownership by Household Size in Mansfield borough
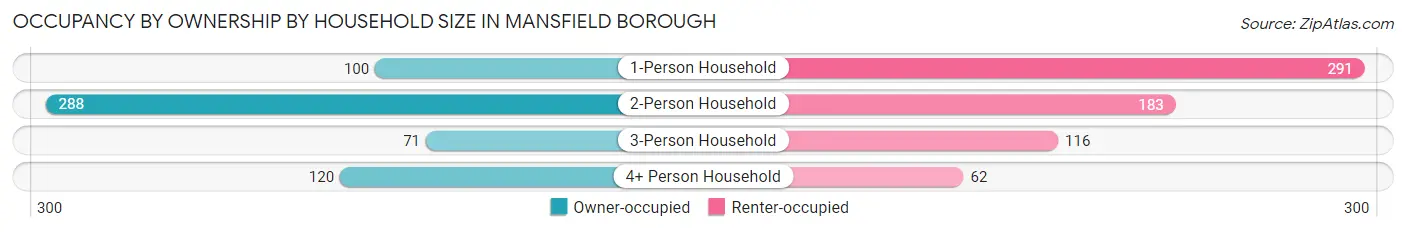
| Household Size | Owner-occupied | Renter-occupied |
| 1-Person Household | 100 (25.6%) | 291 (74.4%) |
| 2-Person Household | 288 (61.2%) | 183 (38.9%) |
| 3-Person Household | 71 (38.0%) | 116 (62.0%) |
| 4+ Person Household | 120 (65.9%) | 62 (34.1%) |
| Total Housing Units | 579 (47.0%) | 652 (53.0%) |
Occupancy by Educational Attainment in Mansfield borough
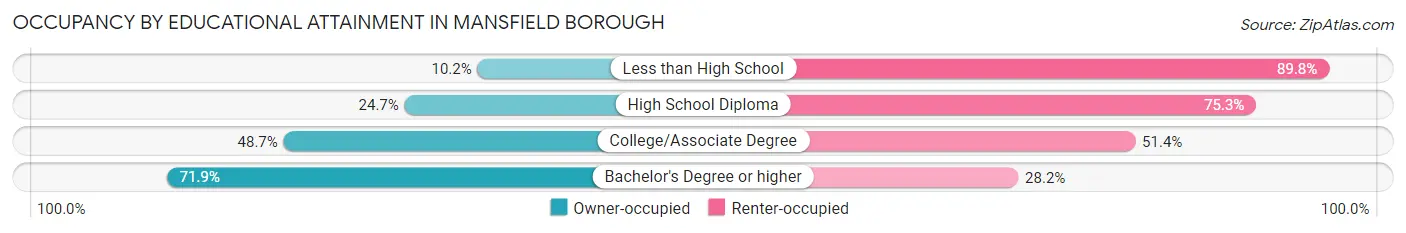
| Household Size | Owner-occupied | Renter-occupied |
| Less than High School | 5 (10.2%) | 44 (89.8%) |
| High School Diploma | 90 (24.7%) | 275 (75.3%) |
| College/Associate Degree | 216 (48.6%) | 228 (51.3%) |
| Bachelor's Degree or higher | 268 (71.9%) | 105 (28.1%) |
Occupancy by Age of Householder in Mansfield borough
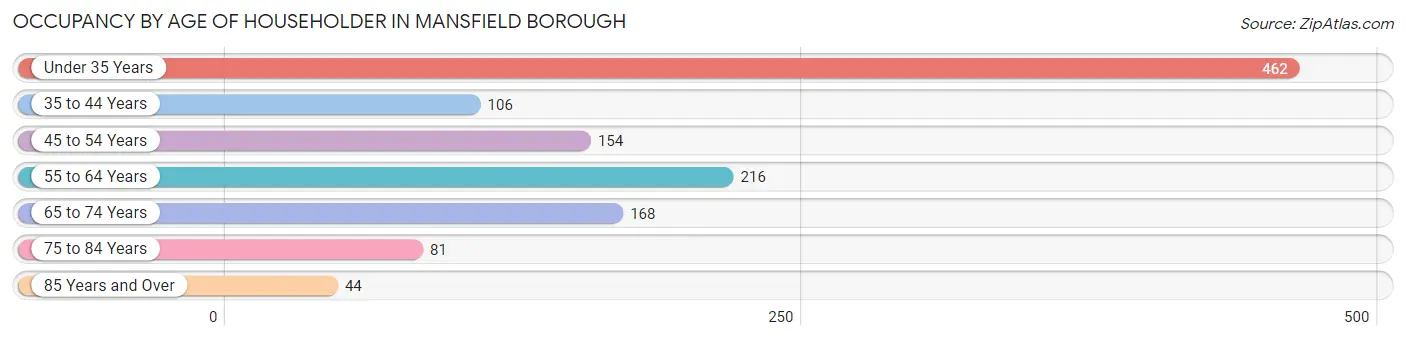
| Age Bracket | # Households | % Households |
| Under 35 Years | 462 | 37.5% |
| 35 to 44 Years | 106 | 8.6% |
| 45 to 54 Years | 154 | 12.5% |
| 55 to 64 Years | 216 | 17.5% |
| 65 to 74 Years | 168 | 13.7% |
| 75 to 84 Years | 81 | 6.6% |
| 85 Years and Over | 44 | 3.6% |
| Total | 1,231 | 100.0% |
Housing Finances in Mansfield borough
Median Income by Occupancy in Mansfield borough
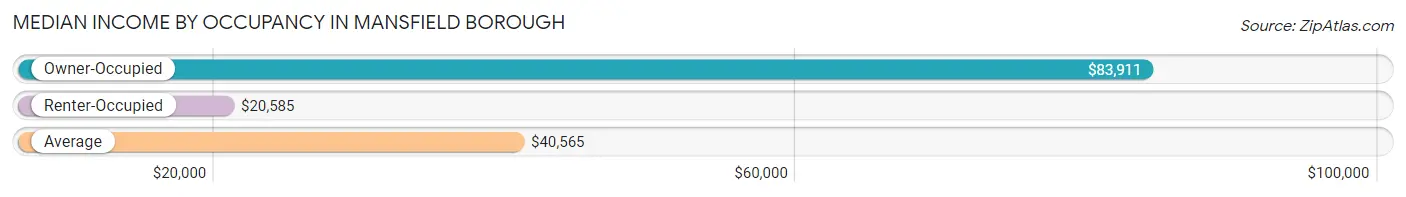
| Occupancy Type | # Households | Median Income |
| Owner-Occupied | 579 (47.0%) | $83,911 |
| Renter-Occupied | 652 (53.0%) | $20,585 |
| Average | 1,231 (100.0%) | $40,565 |
Occupancy by Householder Income Bracket in Mansfield borough
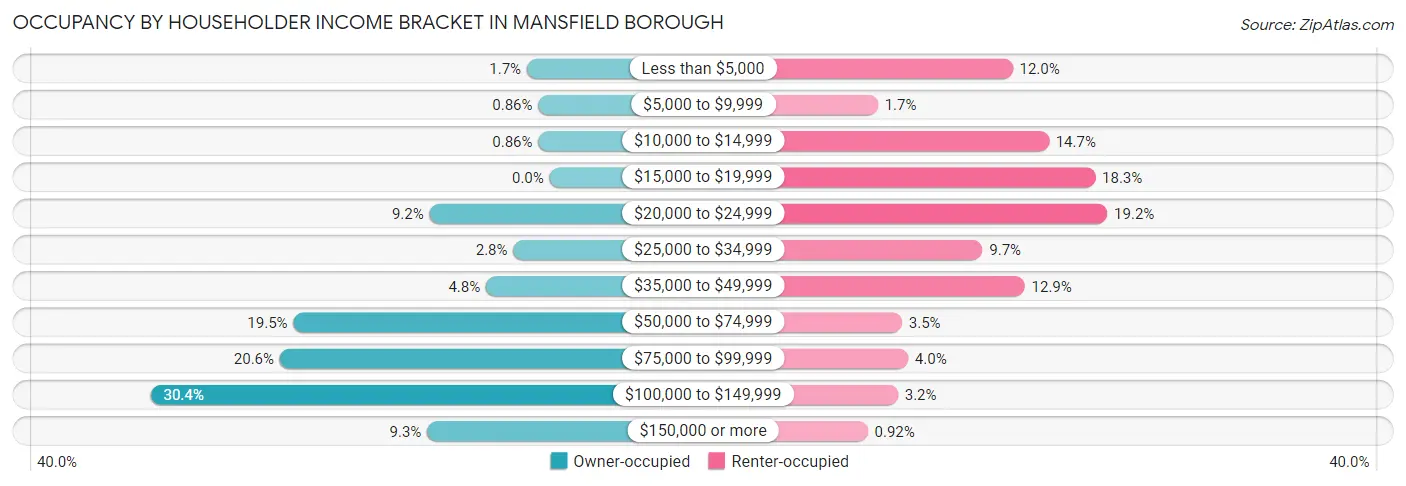
| Income Bracket | Owner-occupied | Renter-occupied |
| Less than $5,000 | 10 (1.7%) | 78 (12.0%) |
| $5,000 to $9,999 | 5 (0.9%) | 11 (1.7%) |
| $10,000 to $14,999 | 5 (0.9%) | 96 (14.7%) |
| $15,000 to $19,999 | 0 (0.0%) | 119 (18.2%) |
| $20,000 to $24,999 | 53 (9.1%) | 125 (19.2%) |
| $25,000 to $34,999 | 16 (2.8%) | 63 (9.7%) |
| $35,000 to $49,999 | 28 (4.8%) | 84 (12.9%) |
| $50,000 to $74,999 | 113 (19.5%) | 23 (3.5%) |
| $75,000 to $99,999 | 119 (20.5%) | 26 (4.0%) |
| $100,000 to $149,999 | 176 (30.4%) | 21 (3.2%) |
| $150,000 or more | 54 (9.3%) | 6 (0.9%) |
| Total | 579 (100.0%) | 652 (100.0%) |
Monthly Housing Cost Tiers in Mansfield borough
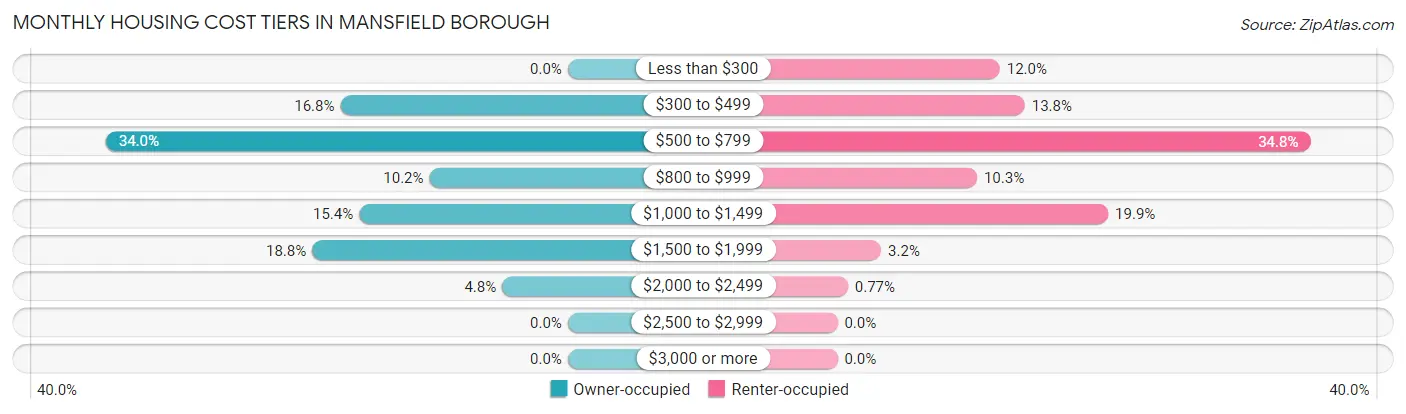
| Monthly Cost | Owner-occupied | Renter-occupied |
| Less than $300 | 0 (0.0%) | 78 (12.0%) |
| $300 to $499 | 97 (16.8%) | 90 (13.8%) |
| $500 to $799 | 197 (34.0%) | 227 (34.8%) |
| $800 to $999 | 59 (10.2%) | 67 (10.3%) |
| $1,000 to $1,499 | 89 (15.4%) | 130 (19.9%) |
| $1,500 to $1,999 | 109 (18.8%) | 21 (3.2%) |
| $2,000 to $2,499 | 28 (4.8%) | 5 (0.8%) |
| $2,500 to $2,999 | 0 (0.0%) | 0 (0.0%) |
| $3,000 or more | 0 (0.0%) | 0 (0.0%) |
| Total | 579 (100.0%) | 652 (100.0%) |
Physical Housing Characteristics in Mansfield borough
Housing Structures in Mansfield borough
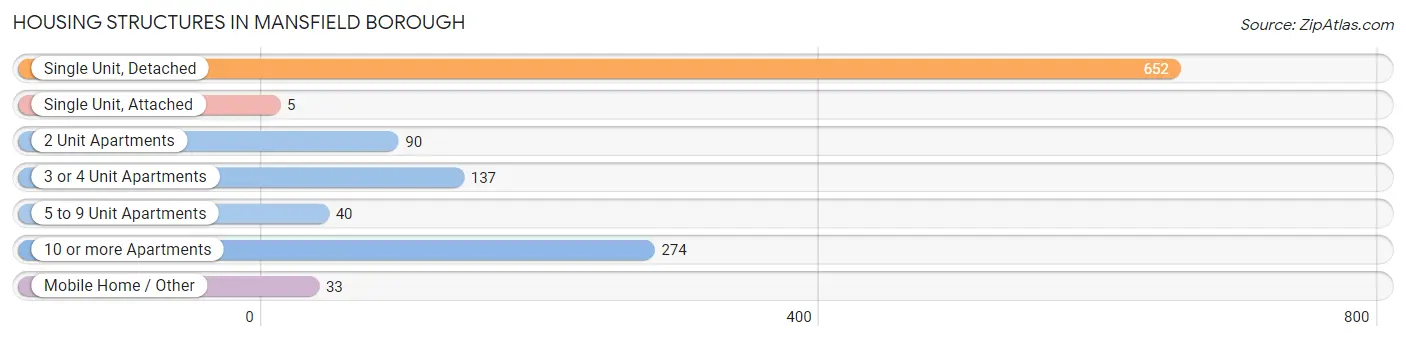
| Structure Type | # Housing Units | % Housing Units |
| Single Unit, Detached | 652 | 53.0% |
| Single Unit, Attached | 5 | 0.4% |
| 2 Unit Apartments | 90 | 7.3% |
| 3 or 4 Unit Apartments | 137 | 11.1% |
| 5 to 9 Unit Apartments | 40 | 3.3% |
| 10 or more Apartments | 274 | 22.3% |
| Mobile Home / Other | 33 | 2.7% |
| Total | 1,231 | 100.0% |
Housing Structures by Occupancy in Mansfield borough
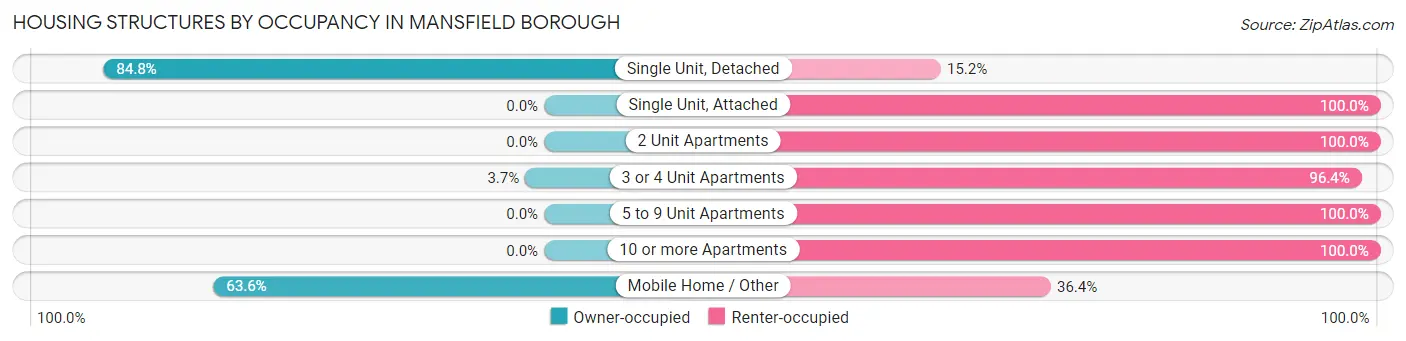
| Structure Type | Owner-occupied | Renter-occupied |
| Single Unit, Detached | 553 (84.8%) | 99 (15.2%) |
| Single Unit, Attached | 0 (0.0%) | 5 (100.0%) |
| 2 Unit Apartments | 0 (0.0%) | 90 (100.0%) |
| 3 or 4 Unit Apartments | 5 (3.6%) | 132 (96.4%) |
| 5 to 9 Unit Apartments | 0 (0.0%) | 40 (100.0%) |
| 10 or more Apartments | 0 (0.0%) | 274 (100.0%) |
| Mobile Home / Other | 21 (63.6%) | 12 (36.4%) |
| Total | 579 (47.0%) | 652 (53.0%) |
Housing Structures by Number of Rooms in Mansfield borough
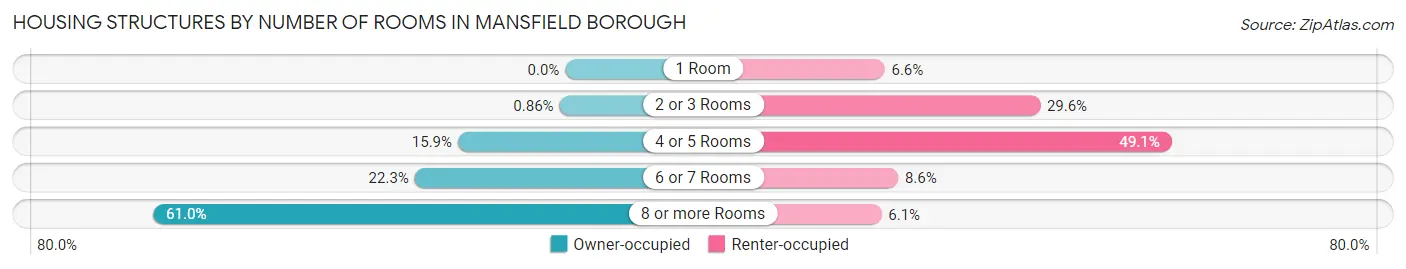
| Number of Rooms | Owner-occupied | Renter-occupied |
| 1 Room | 0 (0.0%) | 43 (6.6%) |
| 2 or 3 Rooms | 5 (0.9%) | 193 (29.6%) |
| 4 or 5 Rooms | 92 (15.9%) | 320 (49.1%) |
| 6 or 7 Rooms | 129 (22.3%) | 56 (8.6%) |
| 8 or more Rooms | 353 (61.0%) | 40 (6.1%) |
| Total | 579 (100.0%) | 652 (100.0%) |
Housing Structure by Heating Type in Mansfield borough
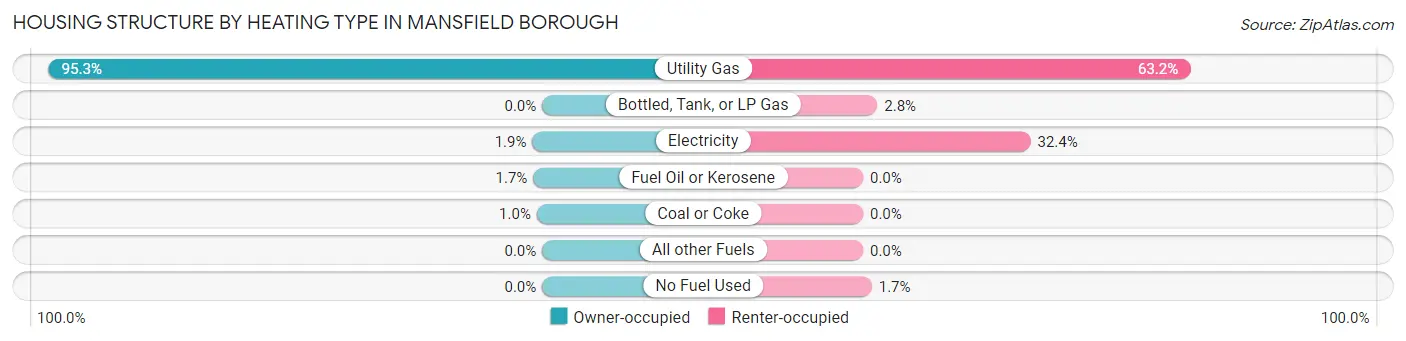
| Heating Type | Owner-occupied | Renter-occupied |
| Utility Gas | 552 (95.3%) | 412 (63.2%) |
| Bottled, Tank, or LP Gas | 0 (0.0%) | 18 (2.8%) |
| Electricity | 11 (1.9%) | 211 (32.4%) |
| Fuel Oil or Kerosene | 10 (1.7%) | 0 (0.0%) |
| Coal or Coke | 6 (1.0%) | 0 (0.0%) |
| All other Fuels | 0 (0.0%) | 0 (0.0%) |
| No Fuel Used | 0 (0.0%) | 11 (1.7%) |
| Total | 579 (100.0%) | 652 (100.0%) |
Household Vehicle Usage in Mansfield borough
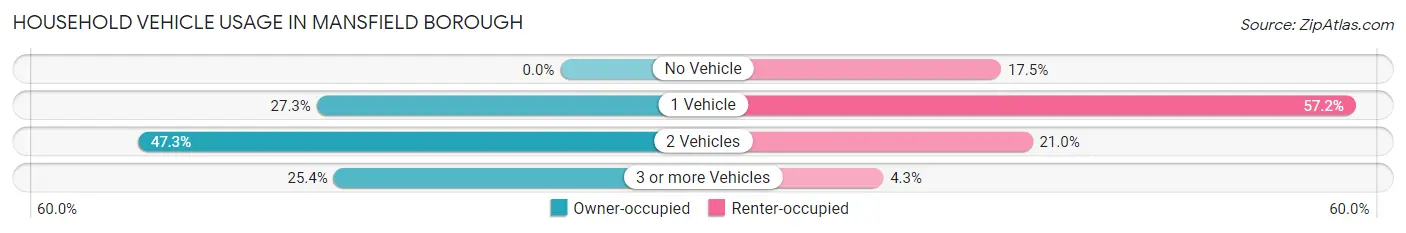
| Vehicles per Household | Owner-occupied | Renter-occupied |
| No Vehicle | 0 (0.0%) | 114 (17.5%) |
| 1 Vehicle | 158 (27.3%) | 373 (57.2%) |
| 2 Vehicles | 274 (47.3%) | 137 (21.0%) |
| 3 or more Vehicles | 147 (25.4%) | 28 (4.3%) |
| Total | 579 (100.0%) | 652 (100.0%) |
Real Estate & Mortgages in Mansfield borough
Real Estate and Mortgage Overview in Mansfield borough
| Characteristic | Without Mortgage | With Mortgage |
| Housing Units | 257 | 322 |
| Median Property Value | $172,800 | $150,000 |
| Median Household Income | $53,229 | $37 |
| Monthly Housing Costs | $595 | $0 |
| Real Estate Taxes | $2,689 | $0 |
Property Value by Mortgage Status in Mansfield borough
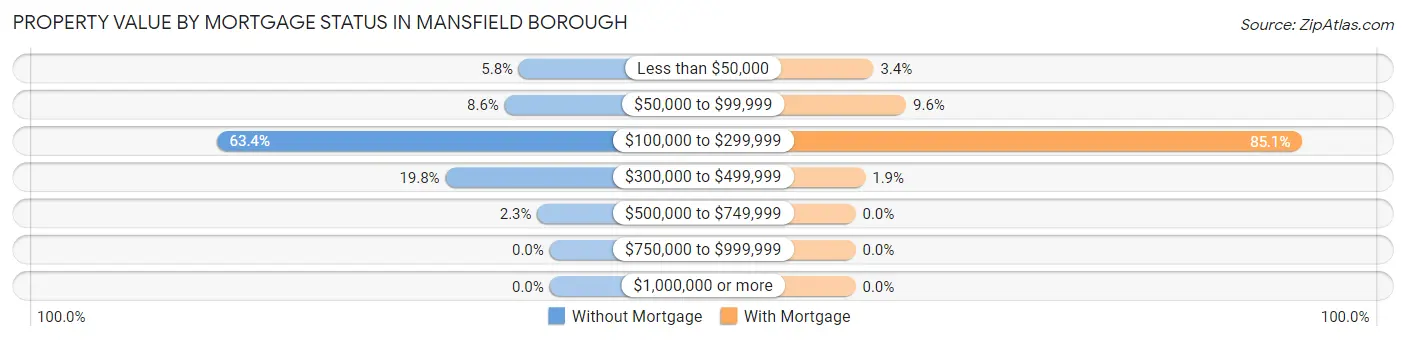
| Property Value | Without Mortgage | With Mortgage |
| Less than $50,000 | 15 (5.8%) | 11 (3.4%) |
| $50,000 to $99,999 | 22 (8.6%) | 31 (9.6%) |
| $100,000 to $299,999 | 163 (63.4%) | 274 (85.1%) |
| $300,000 to $499,999 | 51 (19.8%) | 6 (1.9%) |
| $500,000 to $749,999 | 6 (2.3%) | 0 (0.0%) |
| $750,000 to $999,999 | 0 (0.0%) | 0 (0.0%) |
| $1,000,000 or more | 0 (0.0%) | 0 (0.0%) |
| Total | 257 (100.0%) | 322 (100.0%) |
Household Income by Mortgage Status in Mansfield borough
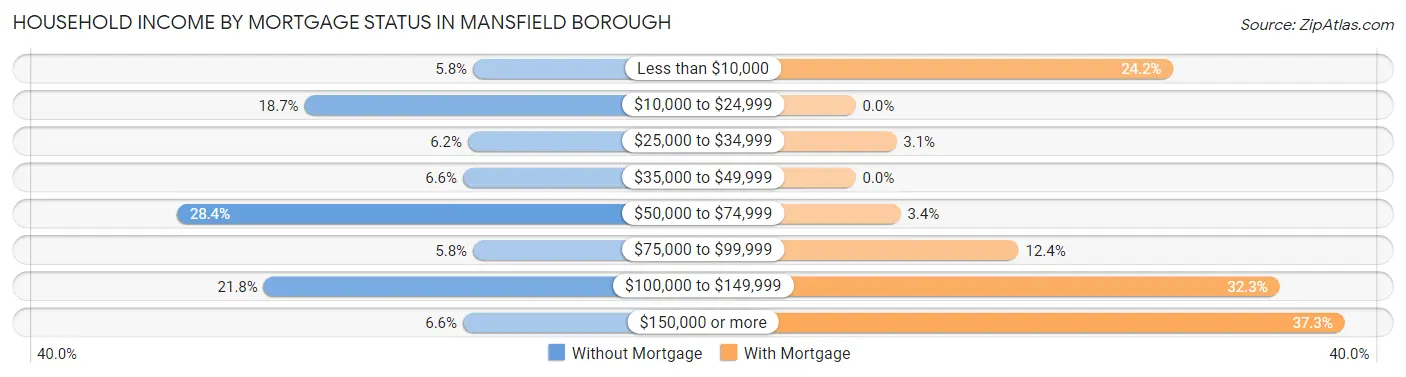
| Household Income | Without Mortgage | With Mortgage |
| Less than $10,000 | 15 (5.8%) | 78 (24.2%) |
| $10,000 to $24,999 | 48 (18.7%) | 0 (0.0%) |
| $25,000 to $34,999 | 16 (6.2%) | 10 (3.1%) |
| $35,000 to $49,999 | 17 (6.6%) | 0 (0.0%) |
| $50,000 to $74,999 | 73 (28.4%) | 11 (3.4%) |
| $75,000 to $99,999 | 15 (5.8%) | 40 (12.4%) |
| $100,000 to $149,999 | 56 (21.8%) | 104 (32.3%) |
| $150,000 or more | 17 (6.6%) | 120 (37.3%) |
| Total | 257 (100.0%) | 322 (100.0%) |
Property Value to Household Income Ratio in Mansfield borough
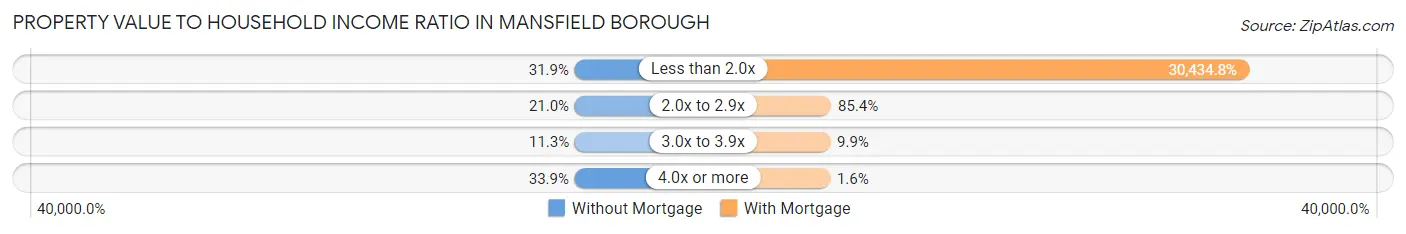
| Value-to-Income Ratio | Without Mortgage | With Mortgage |
| Less than 2.0x | 82 (31.9%) | 98,000 (30,434.8%) |
| 2.0x to 2.9x | 54 (21.0%) | 275 (85.4%) |
| 3.0x to 3.9x | 29 (11.3%) | 32 (9.9%) |
| 4.0x or more | 87 (33.9%) | 5 (1.5%) |
| Total | 257 (100.0%) | 322 (100.0%) |
Real Estate Taxes by Mortgage Status in Mansfield borough
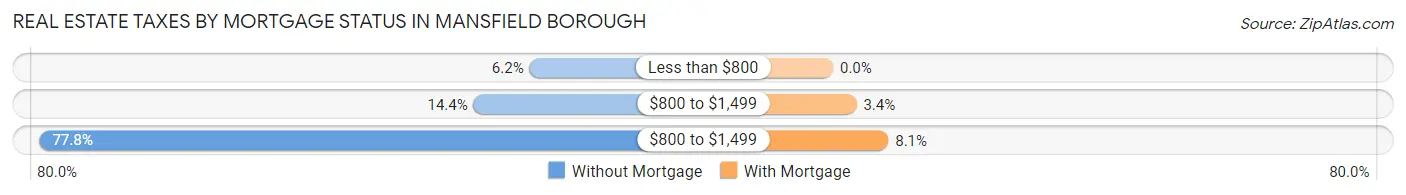
| Property Taxes | Without Mortgage | With Mortgage |
| Less than $800 | 16 (6.2%) | 0 (0.0%) |
| $800 to $1,499 | 37 (14.4%) | 11 (3.4%) |
| $800 to $1,499 | 200 (77.8%) | 26 (8.1%) |
| Total | 257 (100.0%) | 322 (100.0%) |
Health & Disability in Mansfield borough
Health Insurance Coverage by Age in Mansfield borough
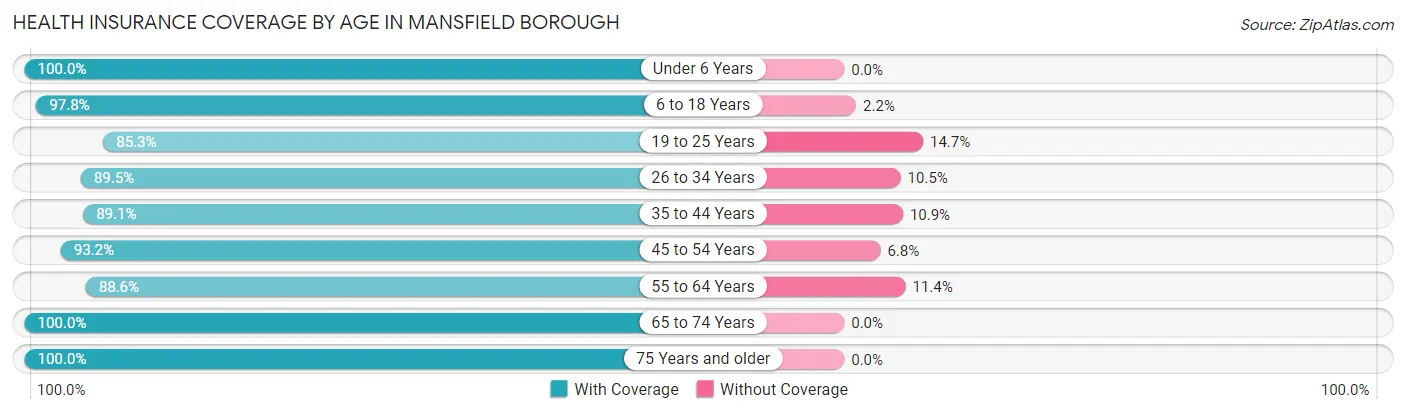
| Age Bracket | With Coverage | Without Coverage |
| Under 6 Years | 189 (100.0%) | 0 (0.0%) |
| 6 to 18 Years | 399 (97.8%) | 9 (2.2%) |
| 19 to 25 Years | 662 (85.3%) | 114 (14.7%) |
| 26 to 34 Years | 349 (89.5%) | 41 (10.5%) |
| 35 to 44 Years | 171 (89.1%) | 21 (10.9%) |
| 45 to 54 Years | 193 (93.2%) | 14 (6.8%) |
| 55 to 64 Years | 318 (88.6%) | 41 (11.4%) |
| 65 to 74 Years | 314 (100.0%) | 0 (0.0%) |
| 75 Years and older | 189 (100.0%) | 0 (0.0%) |
| Total | 2,784 (92.1%) | 240 (7.9%) |
Health Insurance Coverage by Citizenship Status in Mansfield borough
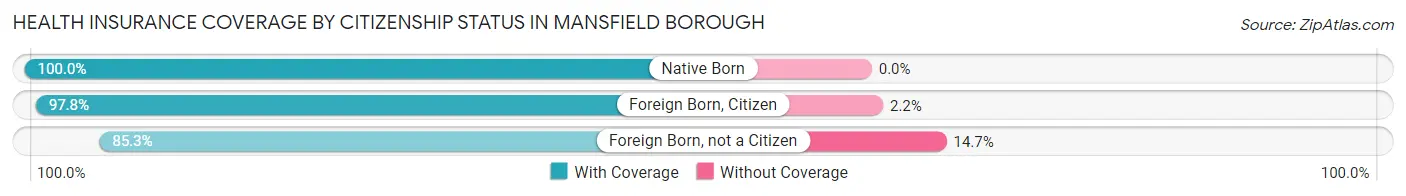
| Citizenship Status | With Coverage | Without Coverage |
| Native Born | 189 (100.0%) | 0 (0.0%) |
| Foreign Born, Citizen | 399 (97.8%) | 9 (2.2%) |
| Foreign Born, not a Citizen | 662 (85.3%) | 114 (14.7%) |
Health Insurance Coverage by Household Income in Mansfield borough
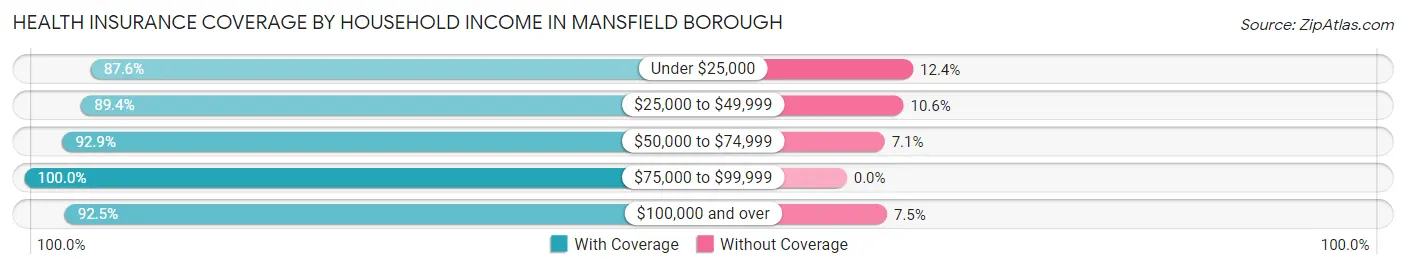
| Household Income | With Coverage | Without Coverage |
| Under $25,000 | 776 (87.6%) | 110 (12.4%) |
| $25,000 to $49,999 | 395 (89.4%) | 47 (10.6%) |
| $50,000 to $74,999 | 314 (92.9%) | 24 (7.1%) |
| $75,000 to $99,999 | 326 (100.0%) | 0 (0.0%) |
| $100,000 and over | 687 (92.5%) | 56 (7.5%) |
Public vs Private Health Insurance Coverage by Age in Mansfield borough
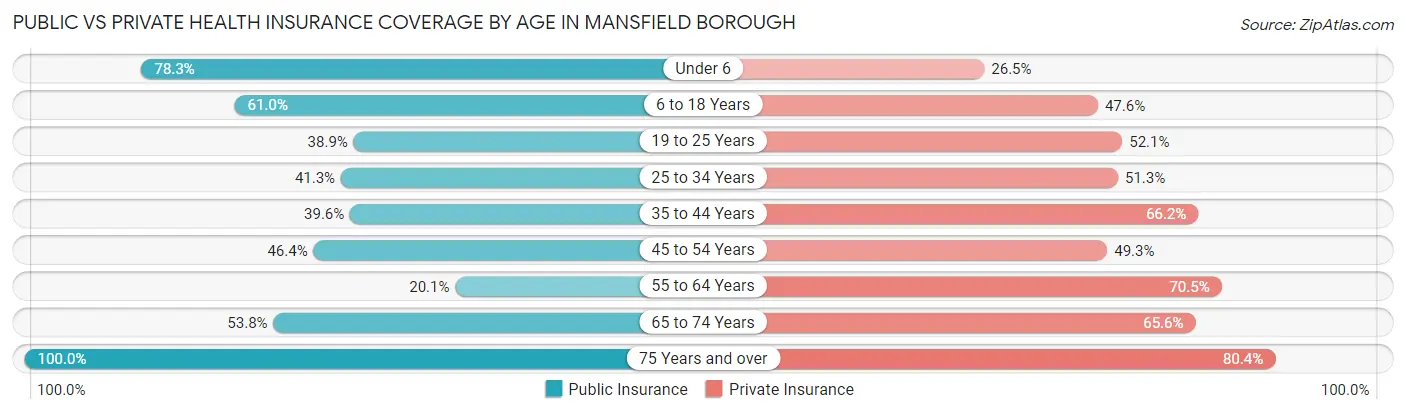
| Age Bracket | Public Insurance | Private Insurance |
| Under 6 | 148 (78.3%) | 50 (26.5%) |
| 6 to 18 Years | 249 (61.0%) | 194 (47.5%) |
| 19 to 25 Years | 302 (38.9%) | 404 (52.1%) |
| 25 to 34 Years | 161 (41.3%) | 200 (51.3%) |
| 35 to 44 Years | 76 (39.6%) | 127 (66.1%) |
| 45 to 54 Years | 96 (46.4%) | 102 (49.3%) |
| 55 to 64 Years | 72 (20.1%) | 253 (70.5%) |
| 65 to 74 Years | 169 (53.8%) | 206 (65.6%) |
| 75 Years and over | 189 (100.0%) | 152 (80.4%) |
| Total | 1,462 (48.3%) | 1,688 (55.8%) |
Disability Status by Sex by Age in Mansfield borough
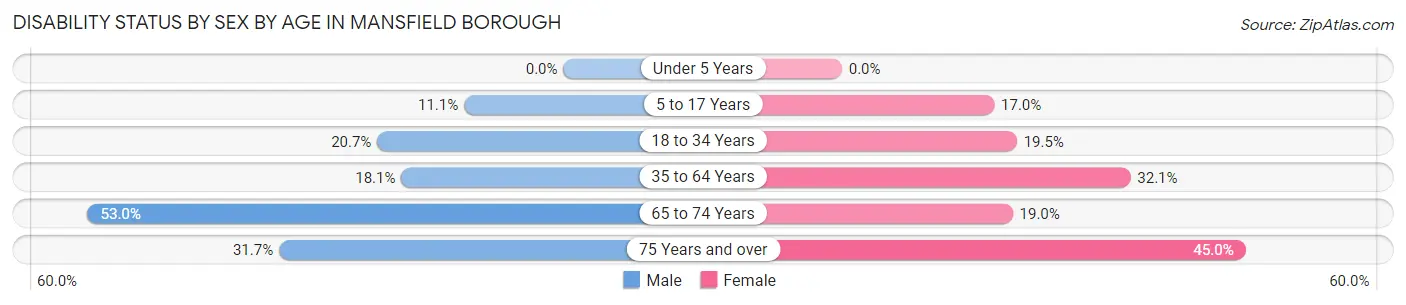
| Age Bracket | Male | Female |
| Under 5 Years | 0 (0.0%) | 0 (0.0%) |
| 5 to 17 Years | 26 (11.1%) | 29 (17.0%) |
| 18 to 34 Years | 108 (20.7%) | 135 (19.5%) |
| 35 to 64 Years | 61 (18.0%) | 135 (32.1%) |
| 65 to 74 Years | 80 (53.0%) | 31 (19.0%) |
| 75 Years and over | 19 (31.7%) | 58 (45.0%) |
Disability Class by Sex by Age in Mansfield borough
Disability Class: Hearing Difficulty
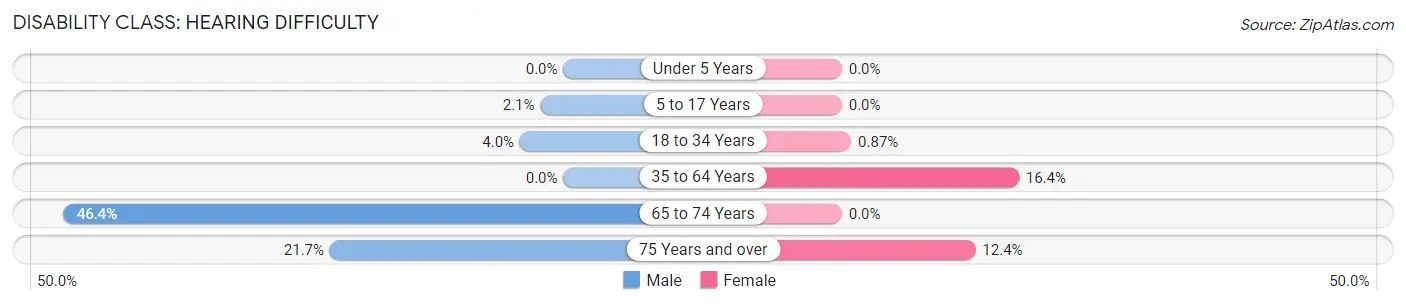
| Age Bracket | Male | Female |
| Under 5 Years | 0 (0.0%) | 0 (0.0%) |
| 5 to 17 Years | 5 (2.1%) | 0 (0.0%) |
| 18 to 34 Years | 21 (4.0%) | 6 (0.9%) |
| 35 to 64 Years | 0 (0.0%) | 69 (16.4%) |
| 65 to 74 Years | 70 (46.4%) | 0 (0.0%) |
| 75 Years and over | 13 (21.7%) | 16 (12.4%) |
Disability Class: Vision Difficulty
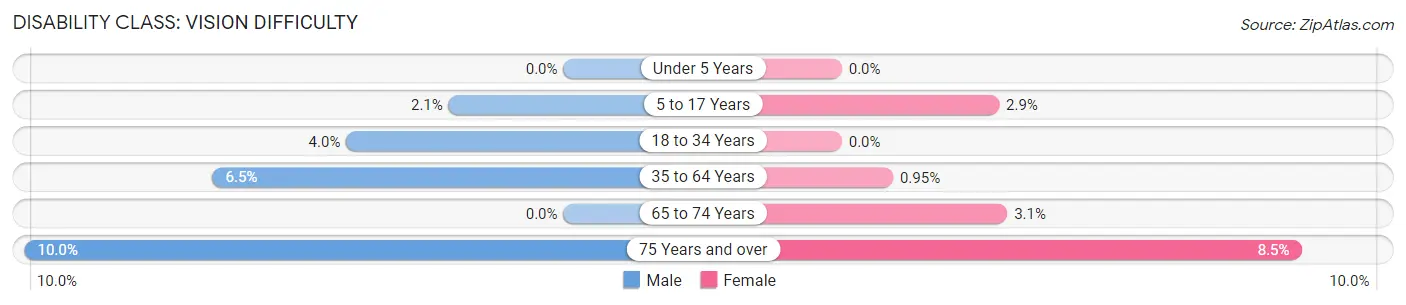
| Age Bracket | Male | Female |
| Under 5 Years | 0 (0.0%) | 0 (0.0%) |
| 5 to 17 Years | 5 (2.1%) | 5 (2.9%) |
| 18 to 34 Years | 21 (4.0%) | 0 (0.0%) |
| 35 to 64 Years | 22 (6.5%) | 4 (0.9%) |
| 65 to 74 Years | 0 (0.0%) | 5 (3.1%) |
| 75 Years and over | 6 (10.0%) | 11 (8.5%) |
Disability Class: Cognitive Difficulty
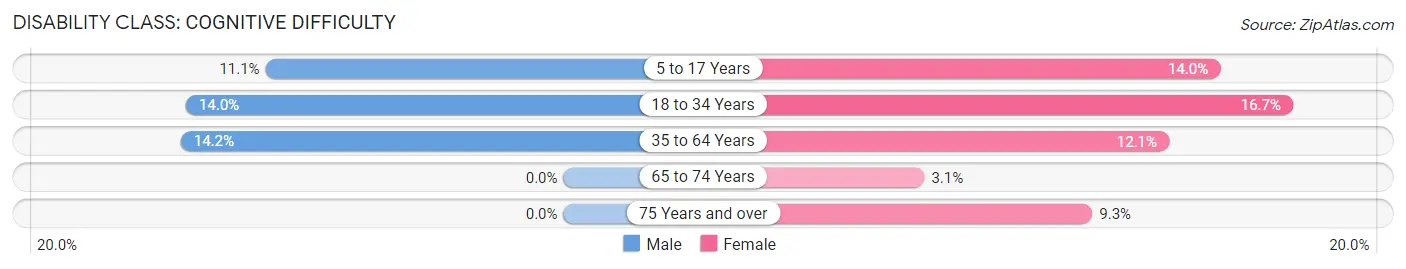
| Age Bracket | Male | Female |
| 5 to 17 Years | 26 (11.1%) | 24 (14.0%) |
| 18 to 34 Years | 73 (14.0%) | 116 (16.7%) |
| 35 to 64 Years | 48 (14.2%) | 51 (12.1%) |
| 65 to 74 Years | 0 (0.0%) | 5 (3.1%) |
| 75 Years and over | 0 (0.0%) | 12 (9.3%) |
Disability Class: Ambulatory Difficulty
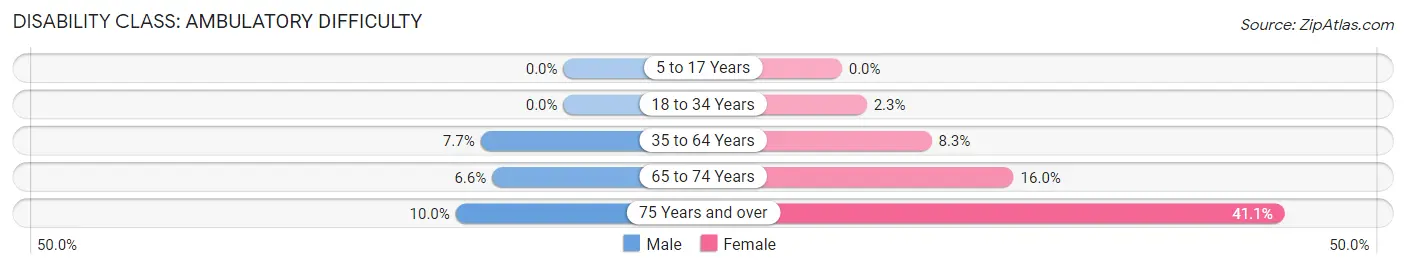
| Age Bracket | Male | Female |
| 5 to 17 Years | 0 (0.0%) | 0 (0.0%) |
| 18 to 34 Years | 0 (0.0%) | 16 (2.3%) |
| 35 to 64 Years | 26 (7.7%) | 35 (8.3%) |
| 65 to 74 Years | 10 (6.6%) | 26 (16.0%) |
| 75 Years and over | 6 (10.0%) | 53 (41.1%) |
Disability Class: Self-Care Difficulty
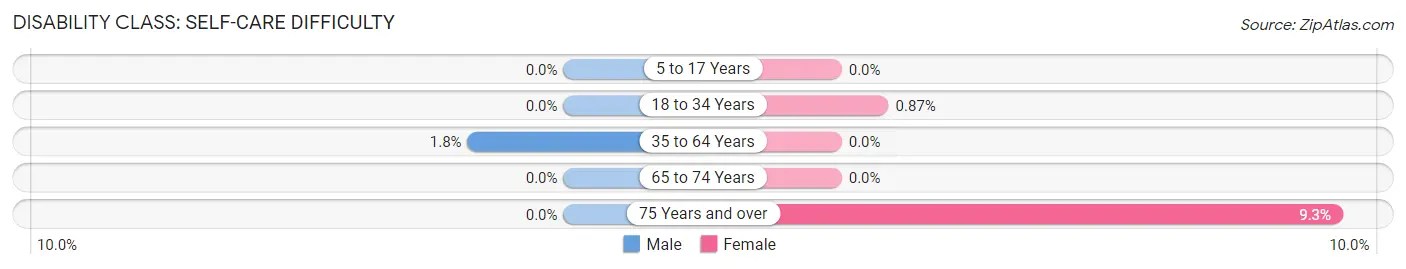
| Age Bracket | Male | Female |
| 5 to 17 Years | 0 (0.0%) | 0 (0.0%) |
| 18 to 34 Years | 0 (0.0%) | 6 (0.9%) |
| 35 to 64 Years | 6 (1.8%) | 0 (0.0%) |
| 65 to 74 Years | 0 (0.0%) | 0 (0.0%) |
| 75 Years and over | 0 (0.0%) | 12 (9.3%) |
Technology Access in Mansfield borough
Computing Device Access in Mansfield borough
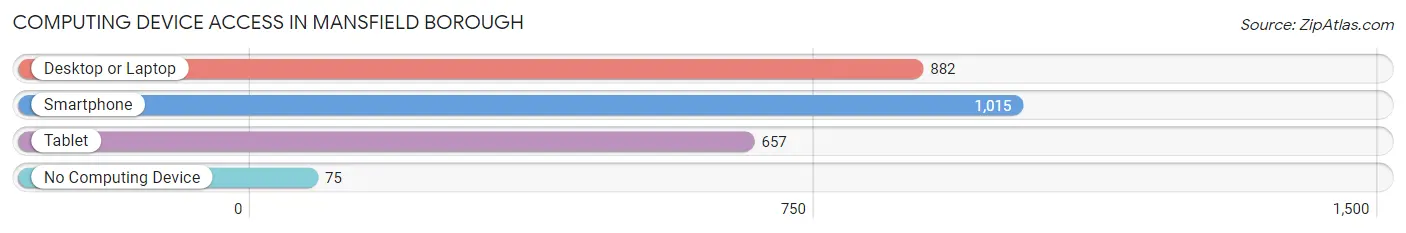
| Device Type | # Households | % Households |
| Desktop or Laptop | 882 | 71.7% |
| Smartphone | 1,015 | 82.5% |
| Tablet | 657 | 53.4% |
| No Computing Device | 75 | 6.1% |
| Total | 1,231 | 100.0% |
Internet Access in Mansfield borough
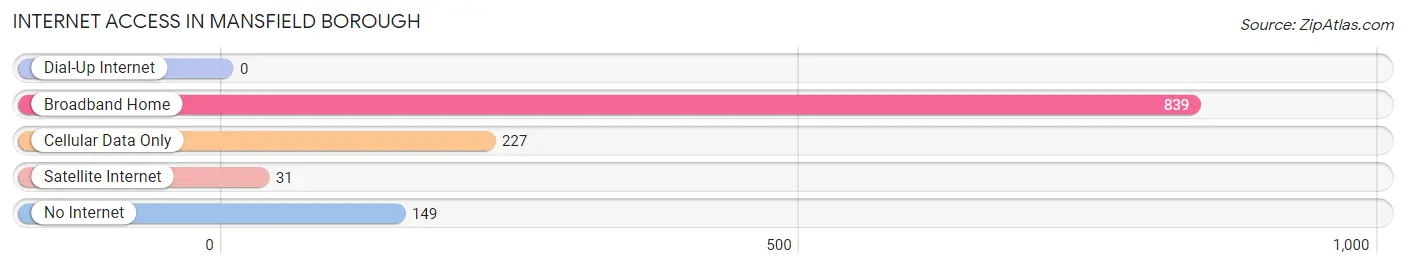
| Internet Type | # Households | % Households |
| Dial-Up Internet | 0 | 0.0% |
| Broadband Home | 839 | 68.2% |
| Cellular Data Only | 227 | 18.4% |
| Satellite Internet | 31 | 2.5% |
| No Internet | 149 | 12.1% |
| Total | 1,231 | 100.0% |
Mansfield borough Summary
Mansfield Borough is a small borough located in Tioga County, Pennsylvania. It is situated in the northern part of the state, approximately 30 miles from the New York border. The borough is home to a population of approximately 2,000 people, and is part of the Wellsboro Micropolitan Statistical Area.
History
Mansfield Borough was founded in 1845 by a group of settlers from Connecticut. The town was named after Mansfield, Connecticut, the hometown of the settlers. The town was originally a farming community, but soon developed into a small industrial center. The first industry in the area was a sawmill, which was built in 1848. This was followed by a gristmill, a tannery, and a woolen mill.
In the late 19th century, the town became a popular tourist destination, due to its proximity to the Grand Canyon of the Susquehanna River. The town was also home to a number of resorts, including the Mansfield Hotel, which was built in 1891.
Geography
Mansfield Borough is located in the northern part of Tioga County, Pennsylvania. It is situated in the Appalachian Mountains, and is approximately 30 miles from the New York border. The borough is bordered by the boroughs of Wellsboro, Lawrenceville, and Westfield. The borough is situated on the banks of the Tioga River, and is surrounded by rolling hills and forests.
The borough has a total area of 1.2 square miles, all of which is land. The borough is located at an elevation of 1,845 feet above sea level.
Economy
Mansfield Borough is a small, rural community with a limited economy. The primary industries in the area are tourism and agriculture. The town is home to a number of small businesses, including restaurants, retail stores, and service providers.
The borough is also home to a number of manufacturing companies, including a plastics manufacturer, a metal fabricator, and a woodworking company. The borough is also home to a number of educational institutions, including Mansfield University and the Mansfield Area School District.
Demographics
As of the 2010 census, the population of Mansfield Borough was 2,000. The racial makeup of the borough was 97.2% White, 0.7% African American, 0.3% Native American, 0.2% Asian, 0.1% from other races, and 1.5% from two or more races. Hispanic or Latino of any race were 0.7% of the population.
The median income for a household in the borough was $37,500, and the median income for a family was $45,000. The per capita income for the borough was $19,000. Approximately 11.2% of the population was below the poverty line.
Common Questions
What is the Total Population of Mansfield borough?
Total Population of Mansfield borough is 3,024.
What is the Total Male Population of Mansfield borough?
Total Male Population of Mansfield borough is 1,379.
What is the Total Female Population of Mansfield borough?
Total Female Population of Mansfield borough is 1,645.
What is the Ratio of Males per 100 Females in Mansfield borough?
There are 83.83 Males per 100 Females in Mansfield borough.
What is the Ratio of Females per 100 Males in Mansfield borough?
There are 119.29 Females per 100 Males in Mansfield borough.
What is the Median Population Age in Mansfield borough?
Median Population Age in Mansfield borough is 29.8 Years.
What is the Average Family Size in Mansfield borough
Average Family Size in Mansfield borough is 2.8 People.
What is the Average Household Size in Mansfield borough
Average Household Size in Mansfield borough is 2.2 People.
What is Per Capita Income in Mansfield borough?
Per Capita income in Mansfield borough is $25,199.
What is the Median Family Income in Mansfield borough?
Median Family Income in Mansfield borough is $64,943.
What is the Median Household income in Mansfield borough?
Median Household Income in Mansfield borough is $40,565.
What is Income or Wage Gap in Mansfield borough?
Income or Wage Gap in Mansfield borough is 45.1%.
Women in Mansfield borough earn 54.9 cents for every dollar earned by a man.
What is Inequality or Gini Index in Mansfield borough?
Inequality or Gini Index in Mansfield borough is 0.49.
How Large is the Labor Force in Mansfield borough?
There are 1,661 People in the Labor Forcein in Mansfield borough.
What is the Percentage of People in the Labor Force in Mansfield borough?
65.3% of People are in the Labor Force in Mansfield borough.
What is the Unemployment Rate in Mansfield borough?
Unemployment Rate in Mansfield borough is 6.4%.