Lincoln borough, PA
Lincoln borough Overview
998
TOTAL POPULATION
566
MALE POPULATION
432
FEMALE POPULATION
131.02
MALES / 100 FEMALES
76.33
FEMALES / 100 MALES
49.5
MEDIAN AGE
3.1
AVG FAMILY SIZE
2.3
AVG HOUSEHOLD SIZE
$45,747
PER CAPITA INCOME
$102,500
AVG FAMILY INCOME
$73,203
AVG HOUSEHOLD INCOME
47.4%
WAGE / INCOME GAP [ % ]
52.6¢/ $1
WAGE / INCOME GAP [ $ ]
0.45
INEQUALITY / GINI INDEX
530
LABOR FORCE [ PEOPLE ]
60.1%
PERCENT IN LABOR FORCE
3.6%
UNEMPLOYMENT RATE
Race in Lincoln borough
The most populous races in Lincoln borough are White / Caucasian (972 | 97.4%), Hispanic or Latino (26 | 2.6%), and Two or more Races (17 | 1.7%).
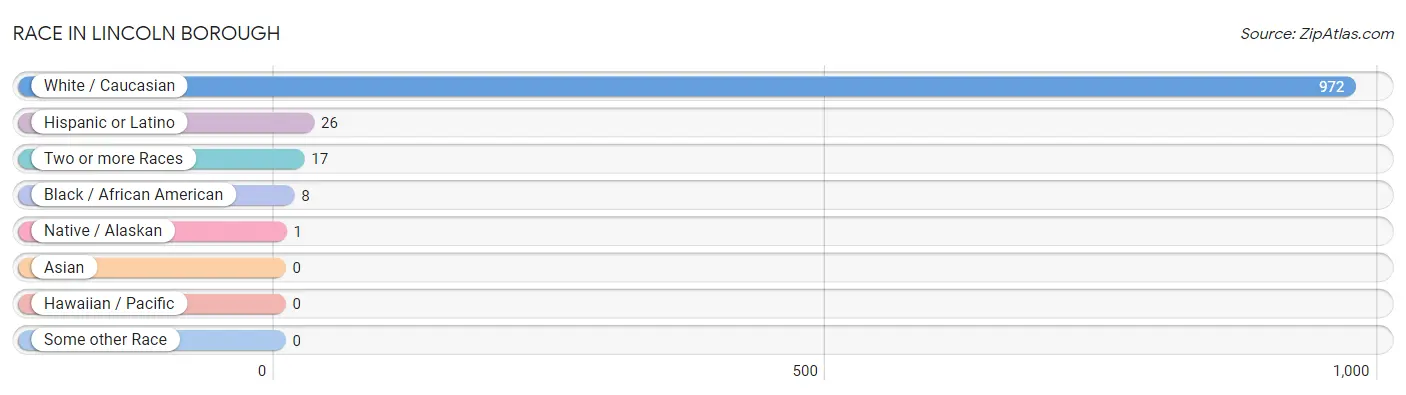
| Race | # Population | % Population |
| Asian | 0 | 0.0% |
| Black / African American | 8 | 0.8% |
| Hawaiian / Pacific | 0 | 0.0% |
| Hispanic or Latino | 26 | 2.6% |
| Native / Alaskan | 1 | 0.1% |
| White / Caucasian | 972 | 97.4% |
| Two or more Races | 17 | 1.7% |
| Some other Race | 0 | 0.0% |
| Total | 998 | 100.0% |
Ancestry in Lincoln borough
The most populous ancestries reported in Lincoln borough are German (389 | 39.0%), Irish (168 | 16.8%), Italian (111 | 11.1%), English (96 | 9.6%), and Polish (85 | 8.5%), together accounting for 85.1% of all Lincoln borough residents.
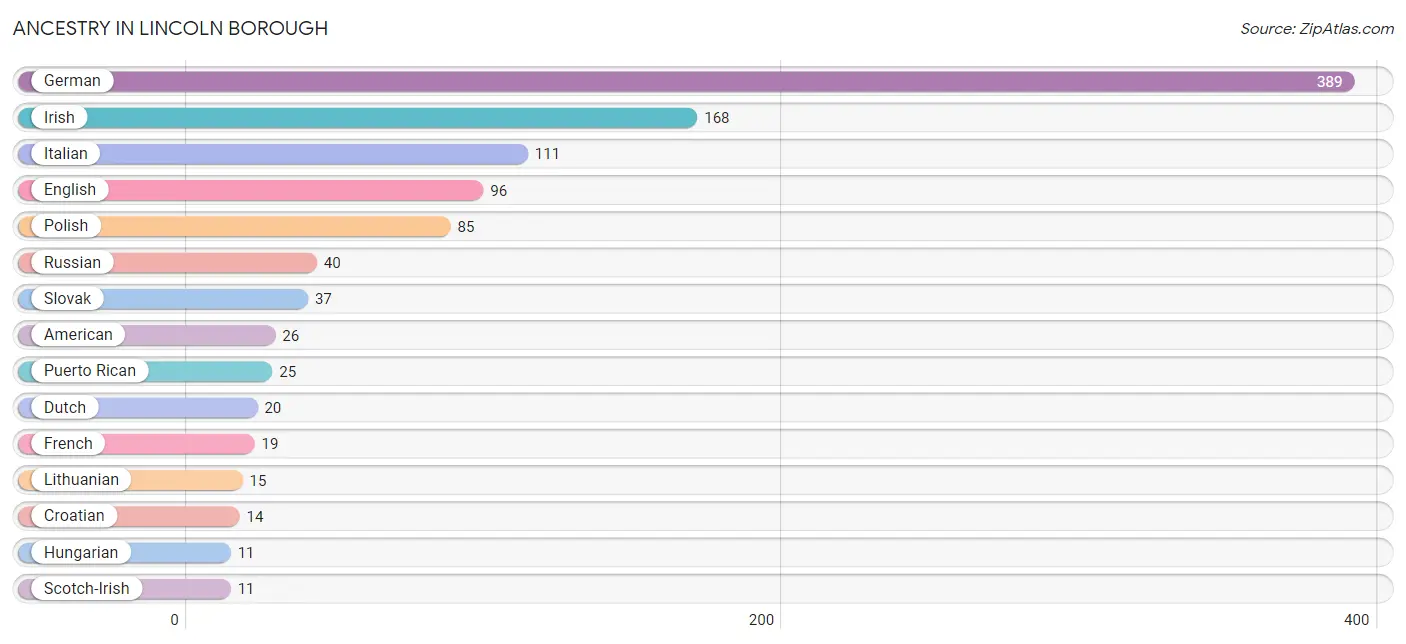
| Ancestry | # Population | % Population |
| African | 2 | 0.2% |
| American | 26 | 2.6% |
| Austrian | 3 | 0.3% |
| British | 1 | 0.1% |
| Burmese | 2 | 0.2% |
| Carpatho Rusyn | 2 | 0.2% |
| Croatian | 14 | 1.4% |
| Czech | 1 | 0.1% |
| Czechoslovakian | 4 | 0.4% |
| Dutch | 20 | 2.0% |
| Eastern European | 4 | 0.4% |
| English | 96 | 9.6% |
| French | 19 | 1.9% |
| German | 389 | 39.0% |
| Hungarian | 11 | 1.1% |
| Irish | 168 | 16.8% |
| Italian | 111 | 11.1% |
| Lithuanian | 15 | 1.5% |
| Mexican | 1 | 0.1% |
| Polish | 85 | 8.5% |
| Puerto Rican | 25 | 2.5% |
| Russian | 40 | 4.0% |
| Scotch-Irish | 11 | 1.1% |
| Scottish | 7 | 0.7% |
| Slavic | 2 | 0.2% |
| Slovak | 37 | 3.7% |
| Subsaharan African | 2 | 0.2% |
| Ukrainian | 9 | 0.9% |
| Welsh | 6 | 0.6% | View All 29 Rows |
Immigrants in Lincoln borough
The most numerous immigrant groups reported in Lincoln borough came from Europe (17 | 1.7%), Eastern Europe (11 | 1.1%), Poland (11 | 1.1%), Germany (6 | 0.6%), and Western Europe (6 | 0.6%), together accounting for 5.1% of all Lincoln borough residents.
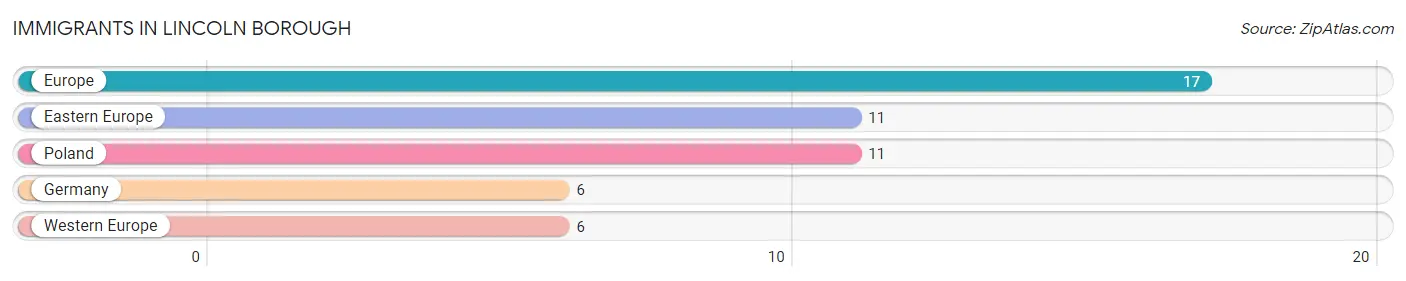
| Immigration Origin | # Population | % Population |
| Eastern Europe | 11 | 1.1% |
| Europe | 17 | 1.7% |
| Germany | 6 | 0.6% |
| Poland | 11 | 1.1% |
| Western Europe | 6 | 0.6% | View All 5 Rows |
Sex and Age in Lincoln borough
Sex and Age in Lincoln borough
The most populous age groups in Lincoln borough are 20 to 24 Years (61 | 10.8%) for men and 55 to 59 Years (56 | 13.0%) for women.
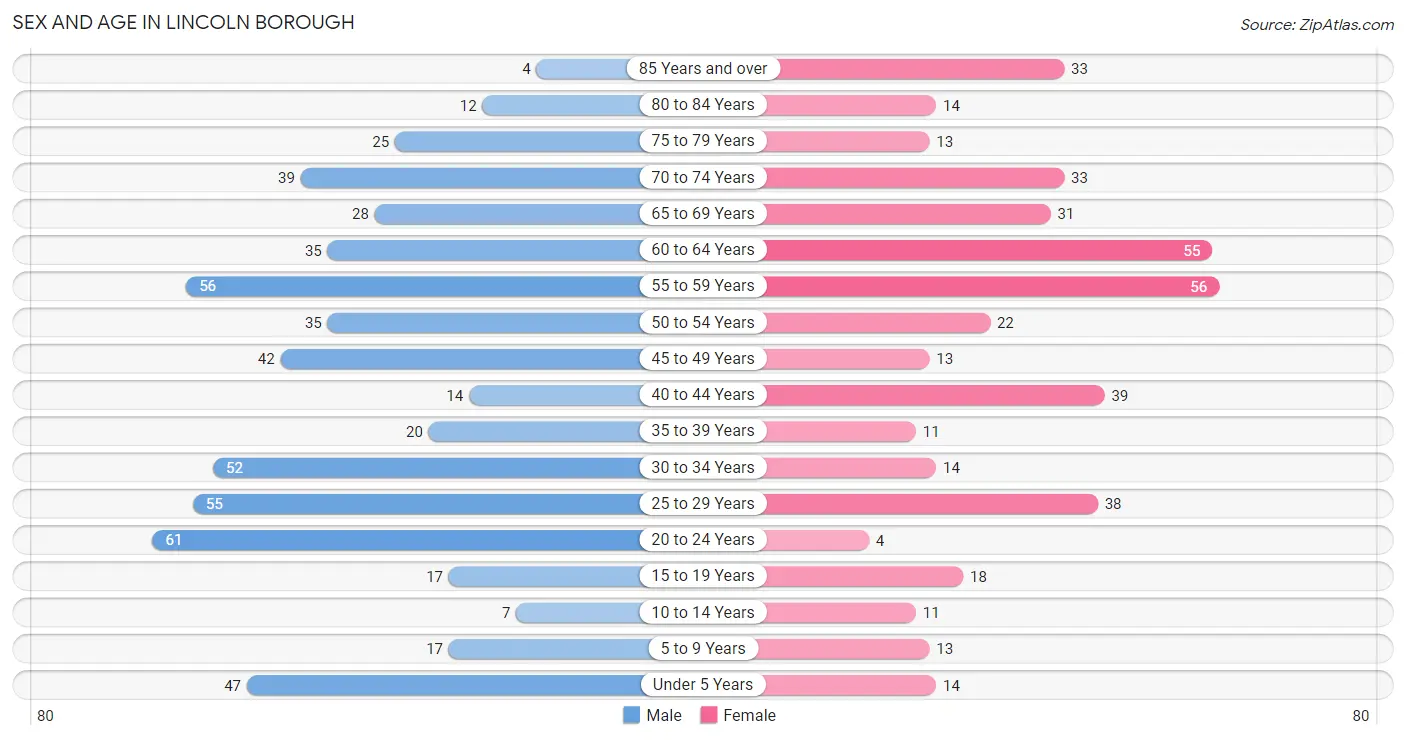
| Age Bracket | Male | Female |
| Under 5 Years | 47 (8.3%) | 14 (3.2%) |
| 5 to 9 Years | 17 (3.0%) | 13 (3.0%) |
| 10 to 14 Years | 7 (1.2%) | 11 (2.5%) |
| 15 to 19 Years | 17 (3.0%) | 18 (4.2%) |
| 20 to 24 Years | 61 (10.8%) | 4 (0.9%) |
| 25 to 29 Years | 55 (9.7%) | 38 (8.8%) |
| 30 to 34 Years | 52 (9.2%) | 14 (3.2%) |
| 35 to 39 Years | 20 (3.5%) | 11 (2.5%) |
| 40 to 44 Years | 14 (2.5%) | 39 (9.0%) |
| 45 to 49 Years | 42 (7.4%) | 13 (3.0%) |
| 50 to 54 Years | 35 (6.2%) | 22 (5.1%) |
| 55 to 59 Years | 56 (9.9%) | 56 (13.0%) |
| 60 to 64 Years | 35 (6.2%) | 55 (12.7%) |
| 65 to 69 Years | 28 (5.0%) | 31 (7.2%) |
| 70 to 74 Years | 39 (6.9%) | 33 (7.6%) |
| 75 to 79 Years | 25 (4.4%) | 13 (3.0%) |
| 80 to 84 Years | 12 (2.1%) | 14 (3.2%) |
| 85 Years and over | 4 (0.7%) | 33 (7.6%) |
| Total | 566 (100.0%) | 432 (100.0%) |
Families and Households in Lincoln borough
Median Family Size in Lincoln borough
The median family size in Lincoln borough is 3.13 persons per family, with married-couple families (227 | 88.7%) accounting for the largest median family size of 3.23 persons per family. On the other hand, single male/father families (4 | 1.6%) represent the smallest median family size with 2.25 persons per family.
| Family Type | # Families | Family Size |
| Married-Couple | 227 (88.7%) | 3.23 |
| Single Male/Father | 4 (1.6%) | 2.25 |
| Single Female/Mother | 25 (9.8%) | 2.36 |
| Total Families | 256 (100.0%) | 3.13 |
Median Household Size in Lincoln borough
The median household size in Lincoln borough is 2.30 persons per household, with married-couple households (227 | 53.2%) accounting for the largest median household size of 3.23 persons per household. non-family households (171 | 40.1%) represent the smallest median household size with 1.04 persons per household.
| Household Type | # Households | Household Size |
| Married-Couple | 227 (53.2%) | 3.23 |
| Single Male/Father | 4 (0.9%) | 2.25 |
| Single Female/Mother | 25 (5.9%) | 2.56 |
| Non-family | 171 (40.1%) | 1.04 |
| Total Households | 427 (100.0%) | 2.30 |
Household Size by Marriage Status in Lincoln borough
Out of a total of 427 households in Lincoln borough, 256 (60.0%) are family households, while 171 (40.1%) are nonfamily households. The most numerous type of family households are 2-person households, comprising 111, and the most common type of nonfamily households are 1-person households, comprising 166.
| Household Size | Family Households | Nonfamily Households |
| 1-Person Households | - | 166 (38.9%) |
| 2-Person Households | 111 (26.0%) | 5 (1.2%) |
| 3-Person Households | 82 (19.2%) | 0 (0.0%) |
| 4-Person Households | 29 (6.8%) | 0 (0.0%) |
| 5-Person Households | 18 (4.2%) | 0 (0.0%) |
| 6-Person Households | 16 (3.7%) | 0 (0.0%) |
| 7+ Person Households | 0 (0.0%) | 0 (0.0%) |
| Total | 256 (60.0%) | 171 (40.1%) |
Female Fertility in Lincoln borough
Fertility by Age in Lincoln borough
Average fertility rate in Lincoln borough is 36.0 births per 1,000 women. Women in the age bracket of 20 to 34 years have the highest fertility rate with 89.0 births per 1,000 women. Women in the age bracket of 20 to 34 years acount for 100.0% of all women with births.
| Age Bracket | Women with Births | Births / 1,000 Women |
| 15 to 19 years | 0 (0.0%) | 0.0 |
| 20 to 34 years | 5 (100.0%) | 89.0 |
| 35 to 50 years | 0 (0.0%) | 0.0 |
| Total | 5 (100.0%) | 36.0 |
Fertility by Age by Marriage Status in Lincoln borough
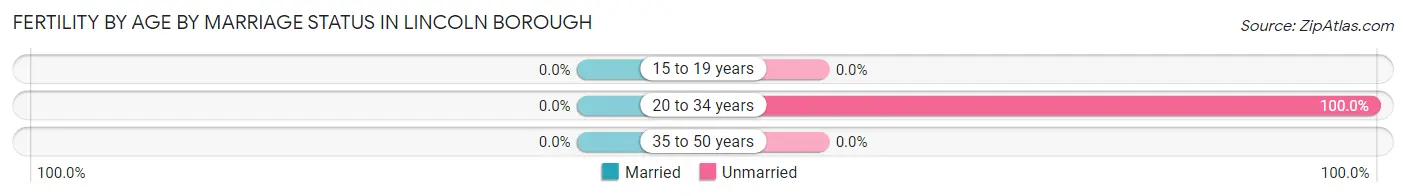
| Age Bracket | Married | Unmarried |
| 15 to 19 years | 0 (0.0%) | 0 (0.0%) |
| 20 to 34 years | 0 (0.0%) | 5 (100.0%) |
| 35 to 50 years | 0 (0.0%) | 0 (0.0%) |
| Total | 0 (0.0%) | 5 (100.0%) |
Fertility by Education in Lincoln borough
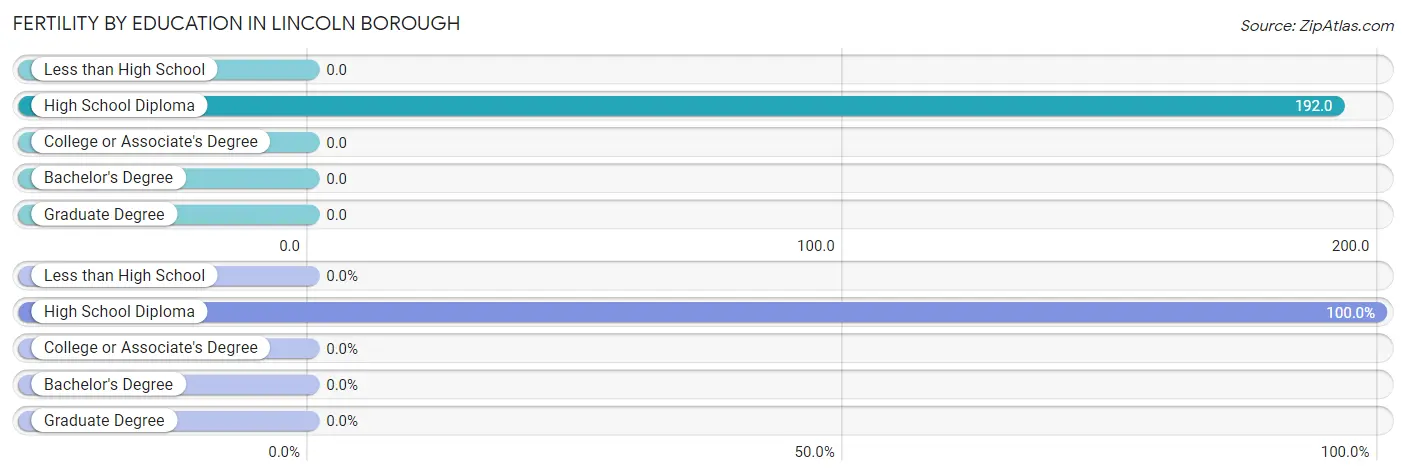
| Educational Attainment | Women with Births | Births / 1,000 Women |
| Less than High School | 0 (0.0%) | 0.0 |
| High School Diploma | 5 (100.0%) | 192.0 |
| College or Associate's Degree | 0 (0.0%) | 0.0 |
| Bachelor's Degree | 0 (0.0%) | 0.0 |
| Graduate Degree | 0 (0.0%) | 0.0 |
| Total | 5 (100.0%) | 36.0 |
Fertility by Education by Marriage Status in Lincoln borough
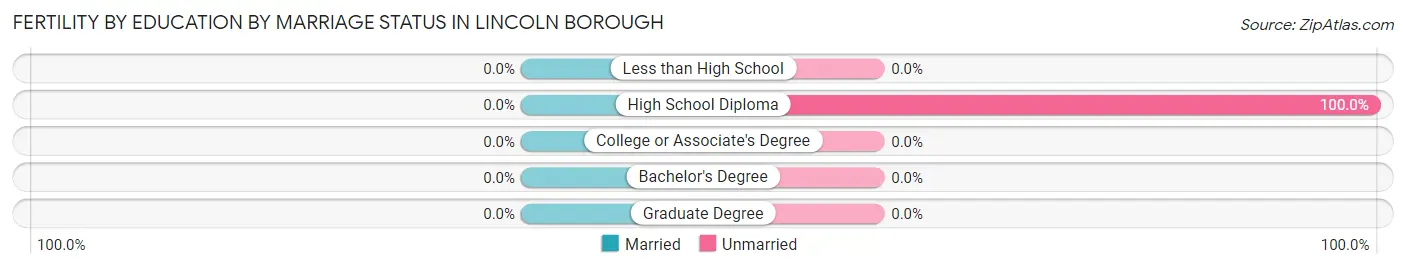
| Educational Attainment | Married | Unmarried |
| Less than High School | 0 (0.0%) | 0 (0.0%) |
| High School Diploma | 0 (0.0%) | 5 (100.0%) |
| College or Associate's Degree | 0 (0.0%) | 0 (0.0%) |
| Bachelor's Degree | 0 (0.0%) | 0 (0.0%) |
| Graduate Degree | 0 (0.0%) | 0 (0.0%) |
| Total | 0 (0.0%) | 5 (100.0%) |
Income in Lincoln borough
Income Overview in Lincoln borough
Per Capita Income in Lincoln borough is $45,747, while median incomes of families and households are $102,500 and $73,203 respectively.
| Characteristic | Number | Measure |
| Per Capita Income | 998 | $45,747 |
| Median Family Income | 256 | $102,500 |
| Mean Family Income | 256 | $120,805 |
| Median Household Income | 427 | $73,203 |
| Mean Household Income | 427 | $105,103 |
| Income Deficit | 256 | $0 |
| Wage / Income Gap (%) | 998 | 47.42% |
| Wage / Income Gap ($) | 998 | 52.58¢ per $1 |
| Gini / Inequality Index | 998 | 0.45 |
Earnings by Sex in Lincoln borough
Average Earnings in Lincoln borough are $42,500, $53,571 for men and $28,167 for women, a difference of 47.4%.
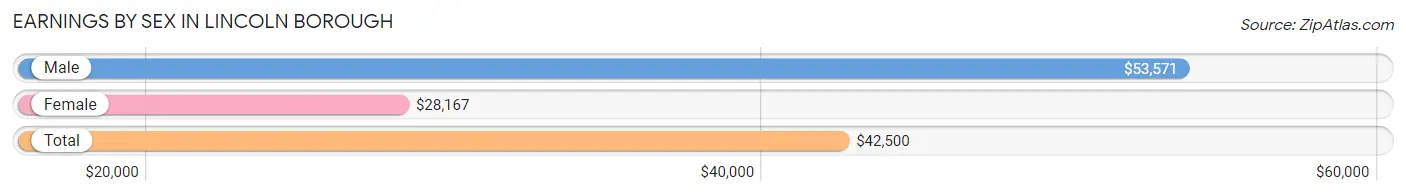
| Sex | Number | Average Earnings |
| Male | 360 (63.8%) | $53,571 |
| Female | 204 (36.2%) | $28,167 |
| Total | 564 (100.0%) | $42,500 |
Earnings by Sex by Income Bracket in Lincoln borough
The most common earnings brackets in Lincoln borough are $100,000+ for men (52 | 14.4%) and $2,499 or less for women (43 | 21.1%).
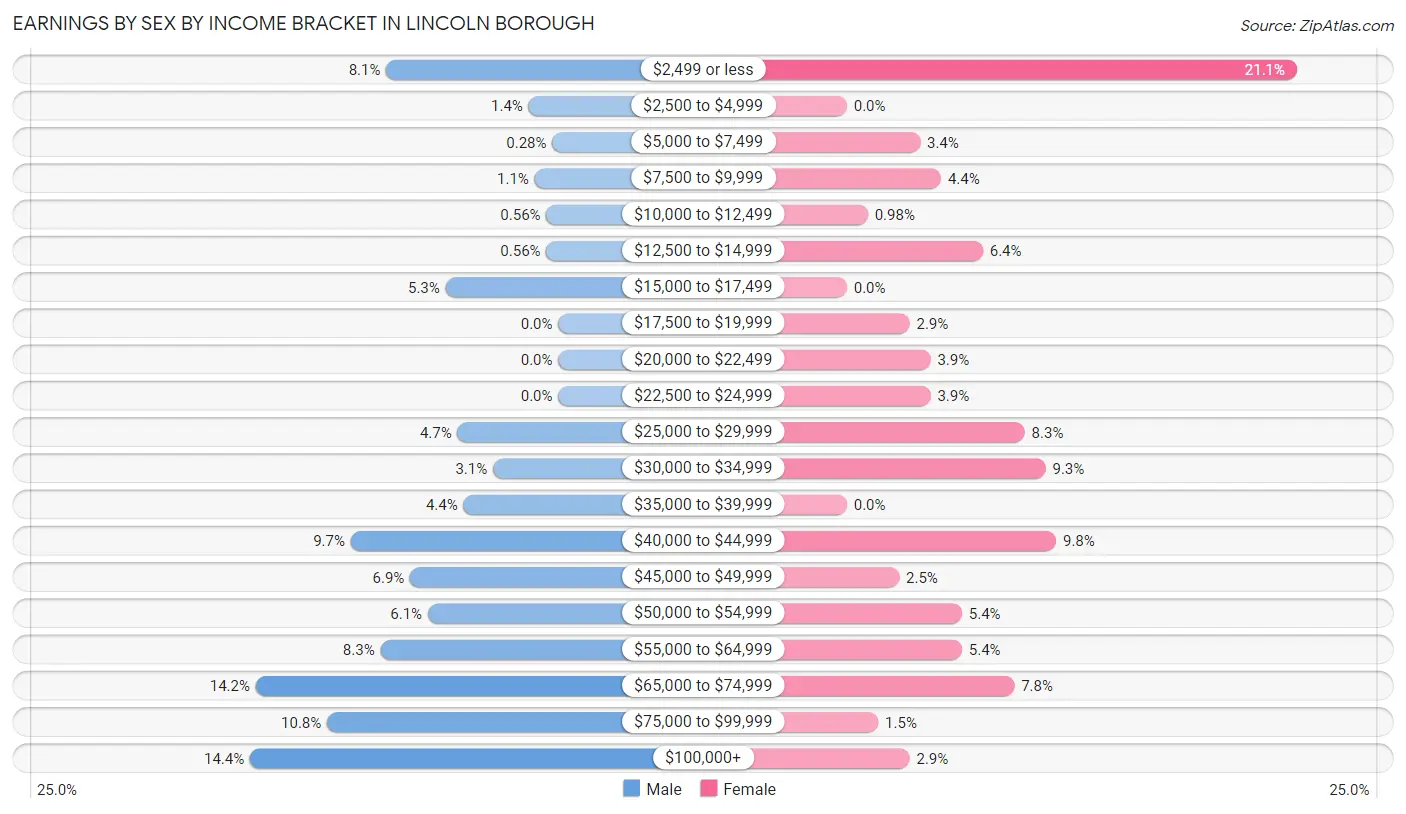
| Income | Male | Female |
| $2,499 or less | 29 (8.1%) | 43 (21.1%) |
| $2,500 to $4,999 | 5 (1.4%) | 0 (0.0%) |
| $5,000 to $7,499 | 1 (0.3%) | 7 (3.4%) |
| $7,500 to $9,999 | 4 (1.1%) | 9 (4.4%) |
| $10,000 to $12,499 | 2 (0.6%) | 2 (1.0%) |
| $12,500 to $14,999 | 2 (0.6%) | 13 (6.4%) |
| $15,000 to $17,499 | 19 (5.3%) | 0 (0.0%) |
| $17,500 to $19,999 | 0 (0.0%) | 6 (2.9%) |
| $20,000 to $22,499 | 0 (0.0%) | 8 (3.9%) |
| $22,500 to $24,999 | 0 (0.0%) | 8 (3.9%) |
| $25,000 to $29,999 | 17 (4.7%) | 17 (8.3%) |
| $30,000 to $34,999 | 11 (3.1%) | 19 (9.3%) |
| $35,000 to $39,999 | 16 (4.4%) | 0 (0.0%) |
| $40,000 to $44,999 | 35 (9.7%) | 20 (9.8%) |
| $45,000 to $49,999 | 25 (6.9%) | 5 (2.5%) |
| $50,000 to $54,999 | 22 (6.1%) | 11 (5.4%) |
| $55,000 to $64,999 | 30 (8.3%) | 11 (5.4%) |
| $65,000 to $74,999 | 51 (14.2%) | 16 (7.8%) |
| $75,000 to $99,999 | 39 (10.8%) | 3 (1.5%) |
| $100,000+ | 52 (14.4%) | 6 (2.9%) |
| Total | 360 (100.0%) | 204 (100.0%) |
Earnings by Sex by Educational Attainment in Lincoln borough
Average earnings in Lincoln borough are $60,208 for men and $29,250 for women, a difference of 51.4%. Men with an educational attainment of college or associate's degree enjoy the highest average annual earnings of $74,091, while those with high school diploma education earn the least with $50,781. Women with an educational attainment of graduate degree earn the most with the average annual earnings of $71,250, while those with high school diploma education have the smallest earnings of $21,406.
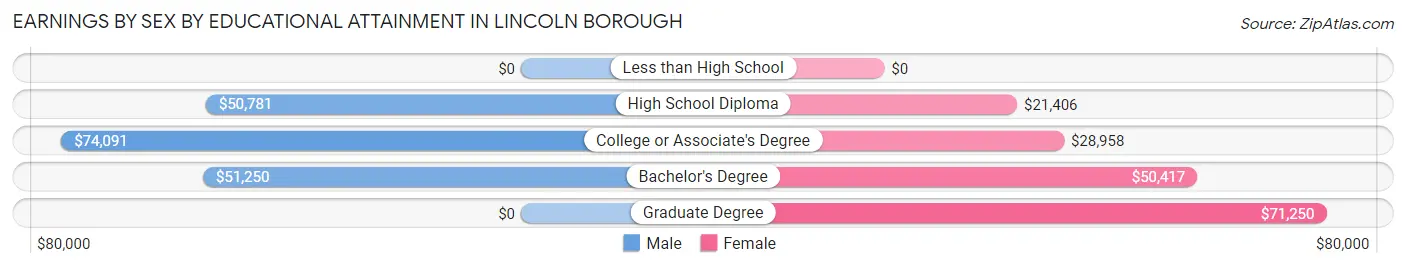
| Educational Attainment | Male Income | Female Income |
| Less than High School | - | - |
| High School Diploma | $50,781 | $21,406 |
| College or Associate's Degree | $74,091 | $28,958 |
| Bachelor's Degree | $51,250 | $50,417 |
| Graduate Degree | - | - |
| Total | $60,208 | $29,250 |
Family Income in Lincoln borough
Family Income Brackets in Lincoln borough
According to the Lincoln borough family income data, there are 72 families falling into the $50,000 to $74,999 income range, which is the most common income bracket and makes up 28.1% of all families.
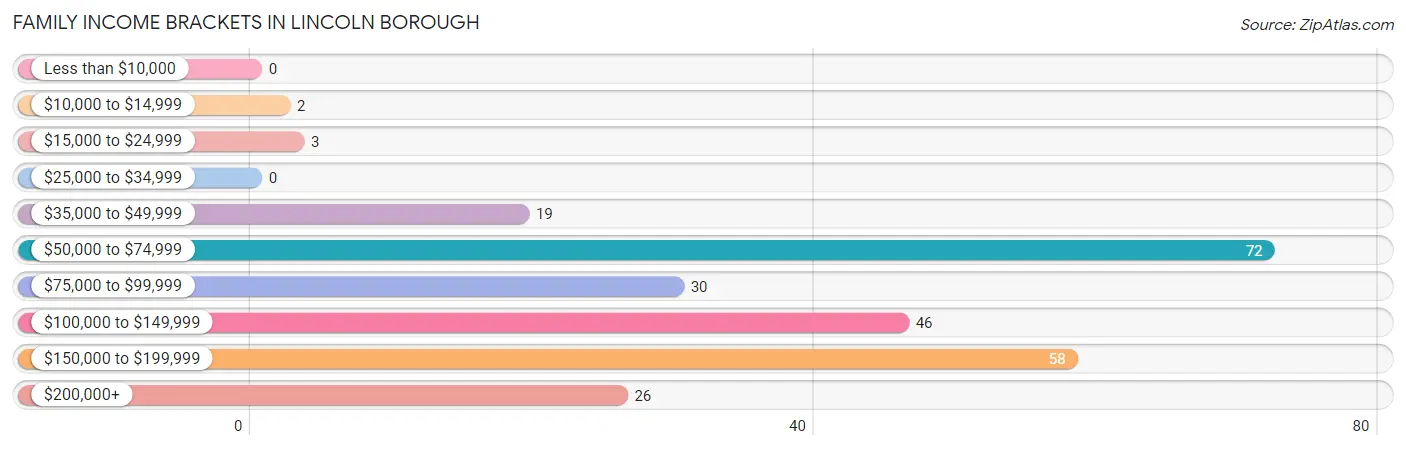
| Income Bracket | # Families | % Families |
| Less than $10,000 | 0 | 0.0% |
| $10,000 to $14,999 | 2 | 0.8% |
| $15,000 to $24,999 | 3 | 1.2% |
| $25,000 to $34,999 | 0 | 0.0% |
| $35,000 to $49,999 | 19 | 7.4% |
| $50,000 to $74,999 | 72 | 28.1% |
| $75,000 to $99,999 | 30 | 11.7% |
| $100,000 to $149,999 | 46 | 18.0% |
| $150,000 to $199,999 | 58 | 22.7% |
| $200,000+ | 26 | 10.2% |
Family Income by Famaliy Size in Lincoln borough
4-person families (29 | 11.3%) account for the highest median family income in Lincoln borough with $172,875 per family, while 4-person families (29 | 11.3%) have the highest median income of $43,219 per family member.
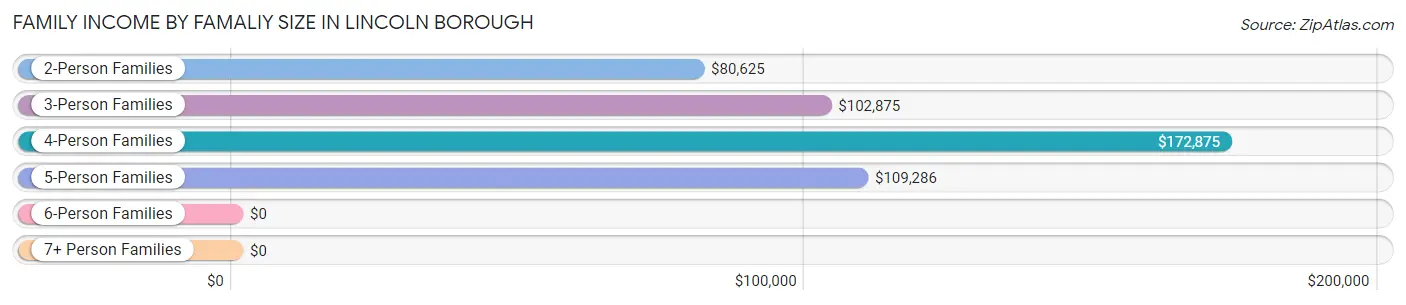
| Income Bracket | # Families | Median Income |
| 2-Person Families | 116 (45.3%) | $80,625 |
| 3-Person Families | 77 (30.1%) | $102,875 |
| 4-Person Families | 29 (11.3%) | $172,875 |
| 5-Person Families | 18 (7.0%) | $109,286 |
| 6-Person Families | 16 (6.2%) | $0 |
| 7+ Person Families | 0 (0.0%) | $0 |
| Total | 256 (100.0%) | $102,500 |
Family Income by Number of Earners in Lincoln borough
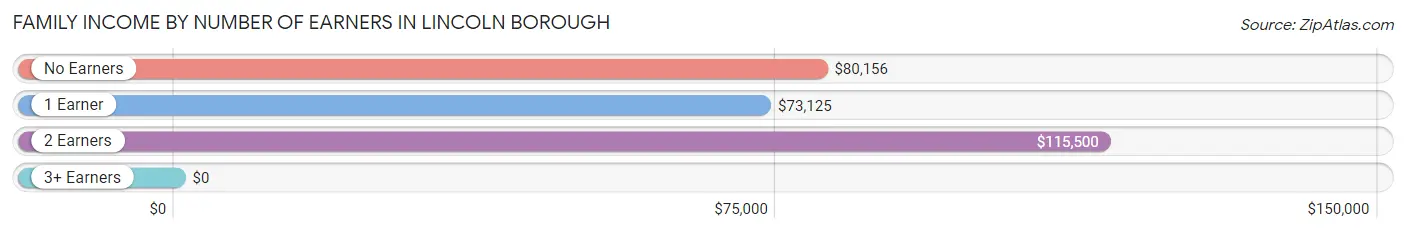
| Number of Earners | # Families | Median Income |
| No Earners | 49 (19.1%) | $80,156 |
| 1 Earner | 42 (16.4%) | $73,125 |
| 2 Earners | 114 (44.5%) | $115,500 |
| 3+ Earners | 51 (19.9%) | $0 |
| Total | 256 (100.0%) | $102,500 |
Household Income in Lincoln borough
Household Income Brackets in Lincoln borough
With 144 households falling in the category, the $50,000 to $74,999 income range is the most frequent in Lincoln borough, accounting for 33.7% of all households. In contrast, only 7 households (1.6%) fall into the $10,000 to $14,999 income bracket, making it the least populous group.
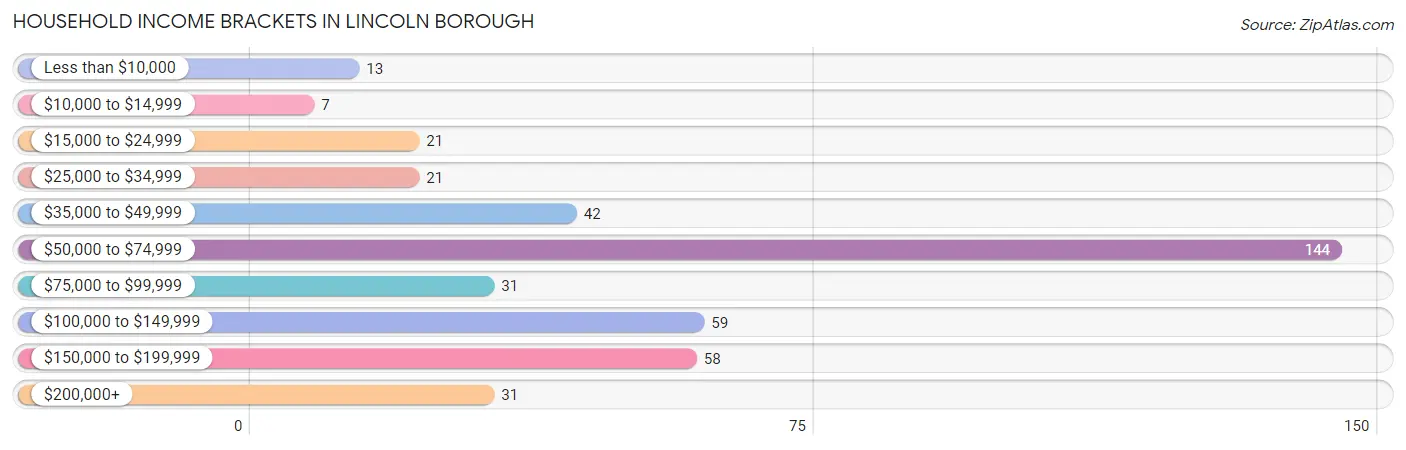
| Income Bracket | # Households | % Households |
| Less than $10,000 | 13 | 3.0% |
| $10,000 to $14,999 | 7 | 1.6% |
| $15,000 to $24,999 | 21 | 4.9% |
| $25,000 to $34,999 | 21 | 4.9% |
| $35,000 to $49,999 | 42 | 9.8% |
| $50,000 to $74,999 | 144 | 33.7% |
| $75,000 to $99,999 | 31 | 7.3% |
| $100,000 to $149,999 | 59 | 13.8% |
| $150,000 to $199,999 | 58 | 13.6% |
| $200,000+ | 31 | 7.3% |
Household Income by Householder Age in Lincoln borough
The median household income in Lincoln borough is $73,203, with the highest median household income of $92,500 found in the 45 to 64 years age bracket for the primary householder. A total of 196 households (45.9%) fall into this category.
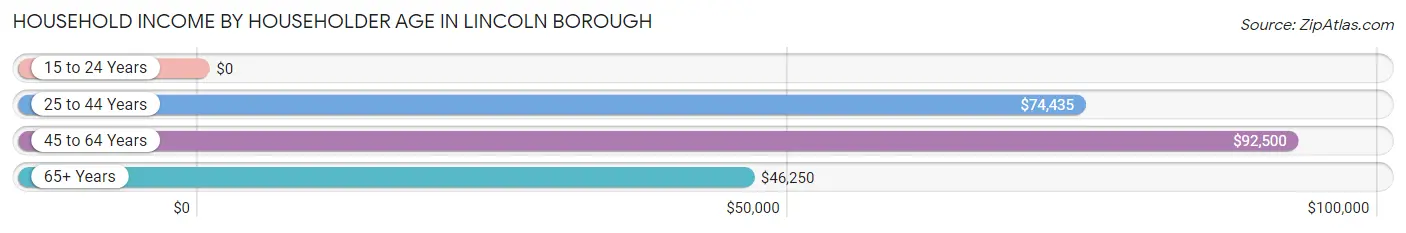
| Income Bracket | # Households | Median Income |
| 15 to 24 Years | 0 (0.0%) | $0 |
| 25 to 44 Years | 97 (22.7%) | $74,435 |
| 45 to 64 Years | 196 (45.9%) | $92,500 |
| 65+ Years | 134 (31.4%) | $46,250 |
| Total | 427 (100.0%) | $73,203 |
Poverty in Lincoln borough
Income Below Poverty by Sex and Age in Lincoln borough
With 3.5% poverty level for males and 4.9% for females among the residents of Lincoln borough, 55 to 64 year old males and 18 to 24 year old females are the most vulnerable to poverty, with 10 males (11.0%) and 1 females (10.0%) in their respective age groups living below the poverty level.
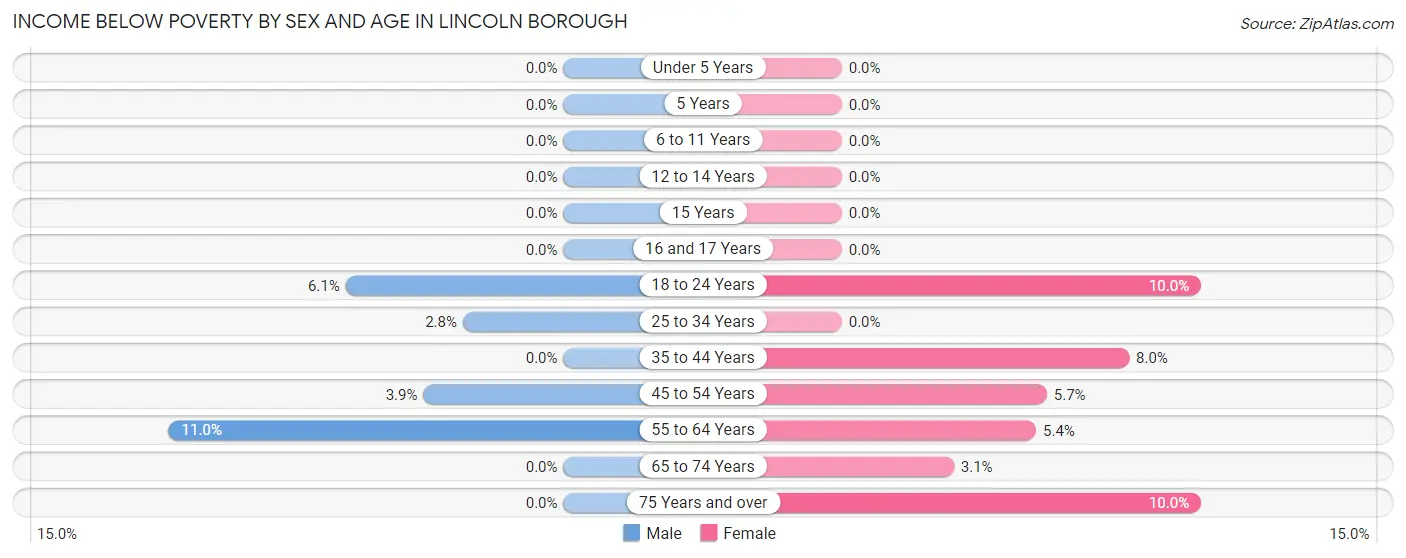
| Age Bracket | Male | Female |
| Under 5 Years | 0 (0.0%) | 0 (0.0%) |
| 5 Years | 0 (0.0%) | 0 (0.0%) |
| 6 to 11 Years | 0 (0.0%) | 0 (0.0%) |
| 12 to 14 Years | 0 (0.0%) | 0 (0.0%) |
| 15 Years | 0 (0.0%) | 0 (0.0%) |
| 16 and 17 Years | 0 (0.0%) | 0 (0.0%) |
| 18 to 24 Years | 4 (6.1%) | 1 (10.0%) |
| 25 to 34 Years | 3 (2.8%) | 0 (0.0%) |
| 35 to 44 Years | 0 (0.0%) | 4 (8.0%) |
| 45 to 54 Years | 3 (3.9%) | 2 (5.7%) |
| 55 to 64 Years | 10 (11.0%) | 6 (5.4%) |
| 65 to 74 Years | 0 (0.0%) | 2 (3.1%) |
| 75 Years and over | 0 (0.0%) | 6 (10.0%) |
| Total | 20 (3.5%) | 21 (4.9%) |
Income Above Poverty by Sex and Age in Lincoln borough
According to the poverty statistics in Lincoln borough, males aged under 5 years and females aged under 5 years are the age groups that are most secure financially, with 100.0% of males and 100.0% of females in these age groups living above the poverty line.
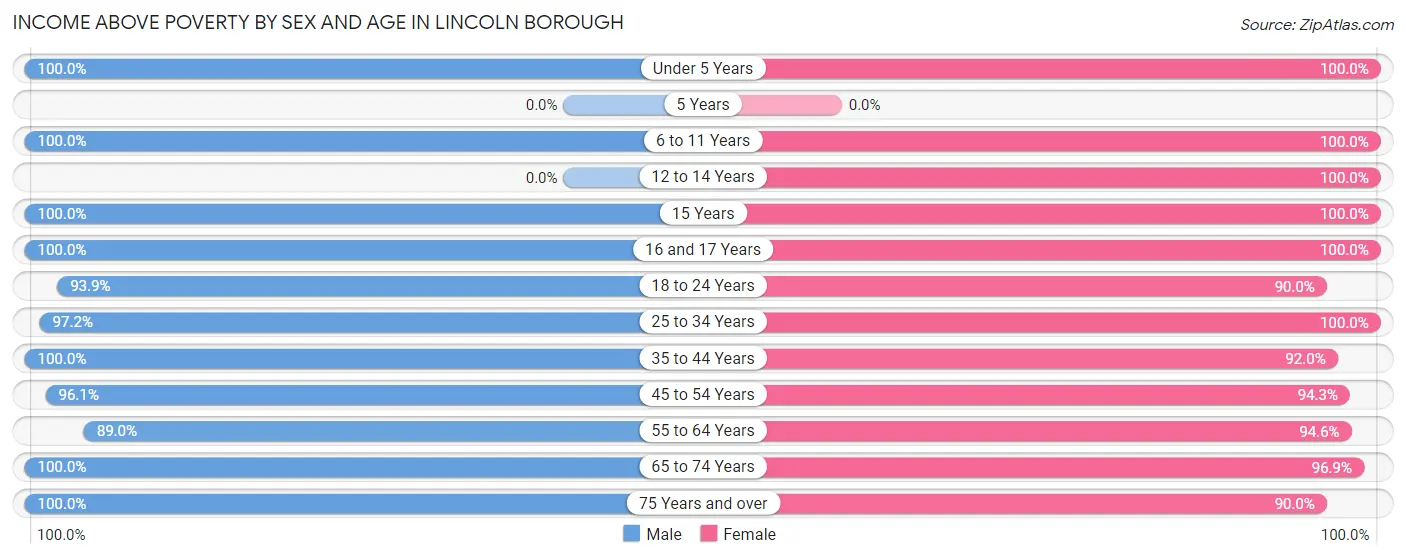
| Age Bracket | Male | Female |
| Under 5 Years | 47 (100.0%) | 14 (100.0%) |
| 5 Years | 0 (0.0%) | 0 (0.0%) |
| 6 to 11 Years | 22 (100.0%) | 13 (100.0%) |
| 12 to 14 Years | 0 (0.0%) | 11 (100.0%) |
| 15 Years | 3 (100.0%) | 4 (100.0%) |
| 16 and 17 Years | 9 (100.0%) | 8 (100.0%) |
| 18 to 24 Years | 62 (93.9%) | 9 (90.0%) |
| 25 to 34 Years | 104 (97.2%) | 52 (100.0%) |
| 35 to 44 Years | 34 (100.0%) | 46 (92.0%) |
| 45 to 54 Years | 74 (96.1%) | 33 (94.3%) |
| 55 to 64 Years | 81 (89.0%) | 105 (94.6%) |
| 65 to 74 Years | 67 (100.0%) | 62 (96.9%) |
| 75 Years and over | 41 (100.0%) | 54 (90.0%) |
| Total | 544 (96.5%) | 411 (95.1%) |
Income Below Poverty Among Married-Couple Families in Lincoln borough
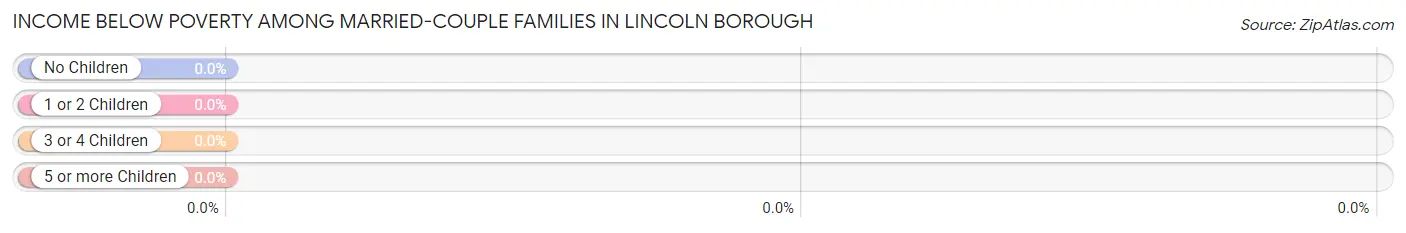
| Children | Above Poverty | Below Poverty |
| No Children | 154 (100.0%) | 0 (0.0%) |
| 1 or 2 Children | 62 (100.0%) | 0 (0.0%) |
| 3 or 4 Children | 11 (100.0%) | 0 (0.0%) |
| 5 or more Children | 0 (0.0%) | 0 (0.0%) |
| Total | 227 (100.0%) | 0 (0.0%) |
Income Below Poverty Among Single-Parent Households in Lincoln borough
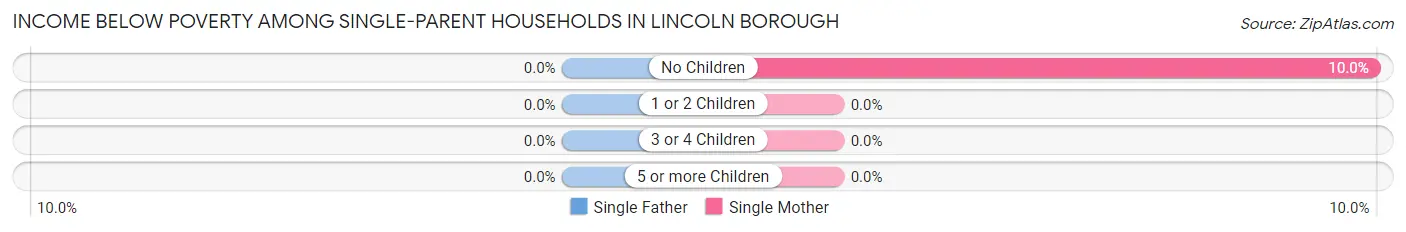
| Children | Single Father | Single Mother |
| No Children | 0 (0.0%) | 2 (10.0%) |
| 1 or 2 Children | 0 (0.0%) | 0 (0.0%) |
| 3 or 4 Children | 0 (0.0%) | 0 (0.0%) |
| 5 or more Children | 0 (0.0%) | 0 (0.0%) |
| Total | 0 (0.0%) | 2 (8.0%) |
Income Below Poverty Among Married-Couple vs Single-Parent Households in Lincoln borough
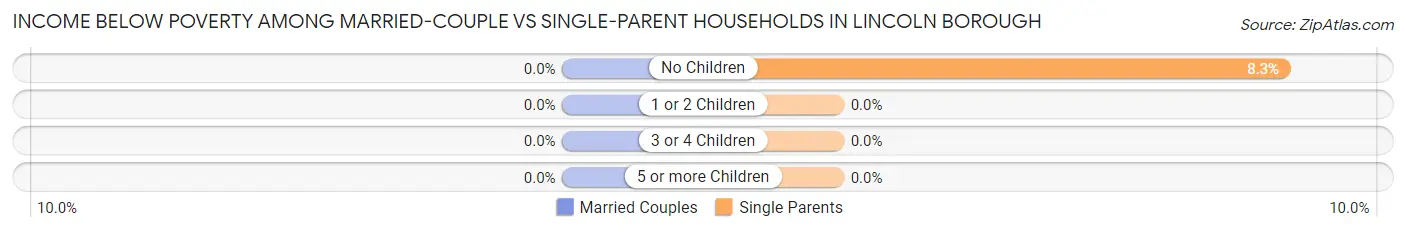
| Children | Married-Couple Families | Single-Parent Households |
| No Children | 0 (0.0%) | 2 (8.3%) |
| 1 or 2 Children | 0 (0.0%) | 0 (0.0%) |
| 3 or 4 Children | 0 (0.0%) | 0 (0.0%) |
| 5 or more Children | 0 (0.0%) | 0 (0.0%) |
| Total | 0 (0.0%) | 2 (6.9%) |
Employment Characteristics in Lincoln borough
Employment by Class of Employer in Lincoln borough
Among the 488 employed individuals in Lincoln borough, private company employees (335 | 68.6%), not-for-profit organizations (109 | 22.3%), and local government employees (15 | 3.1%) make up the most common classes of employment.
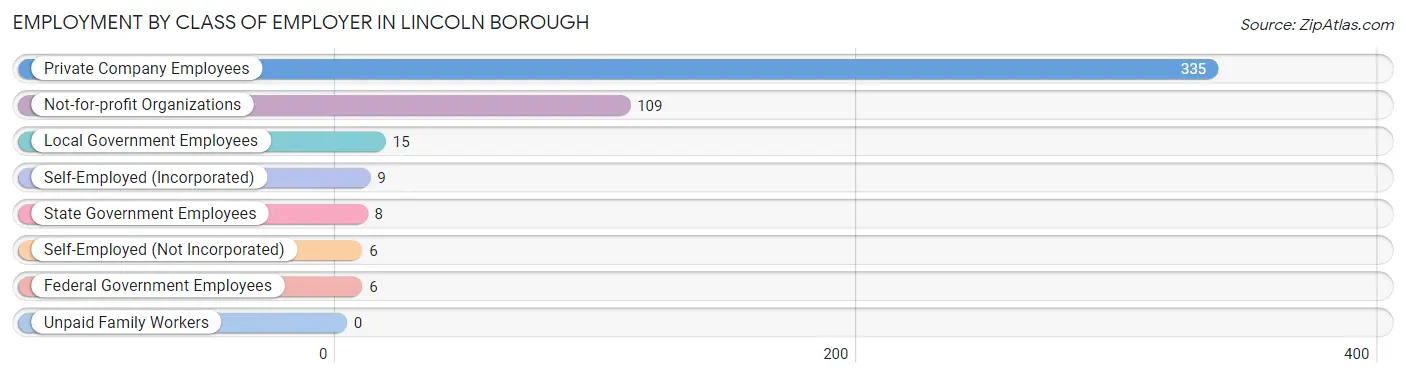
| Employer Class | # Employees | % Employees |
| Private Company Employees | 335 | 68.6% |
| Self-Employed (Incorporated) | 9 | 1.8% |
| Self-Employed (Not Incorporated) | 6 | 1.2% |
| Not-for-profit Organizations | 109 | 22.3% |
| Local Government Employees | 15 | 3.1% |
| State Government Employees | 8 | 1.6% |
| Federal Government Employees | 6 | 1.2% |
| Unpaid Family Workers | 0 | 0.0% |
| Total | 488 | 100.0% |
Employment Status by Age in Lincoln borough
According to the labor force statistics for Lincoln borough, out of the total population over 16 years of age (882), 60.1% or 530 individuals are in the labor force, with 3.6% or 19 of them unemployed. The age group with the highest labor force participation rate is 30 to 34 years, with 100.0% or 66 individuals in the labor force. Within the labor force, the 65 to 74 years age range has the highest percentage of unemployed individuals, with 12.5% or 5 of them being unemployed.
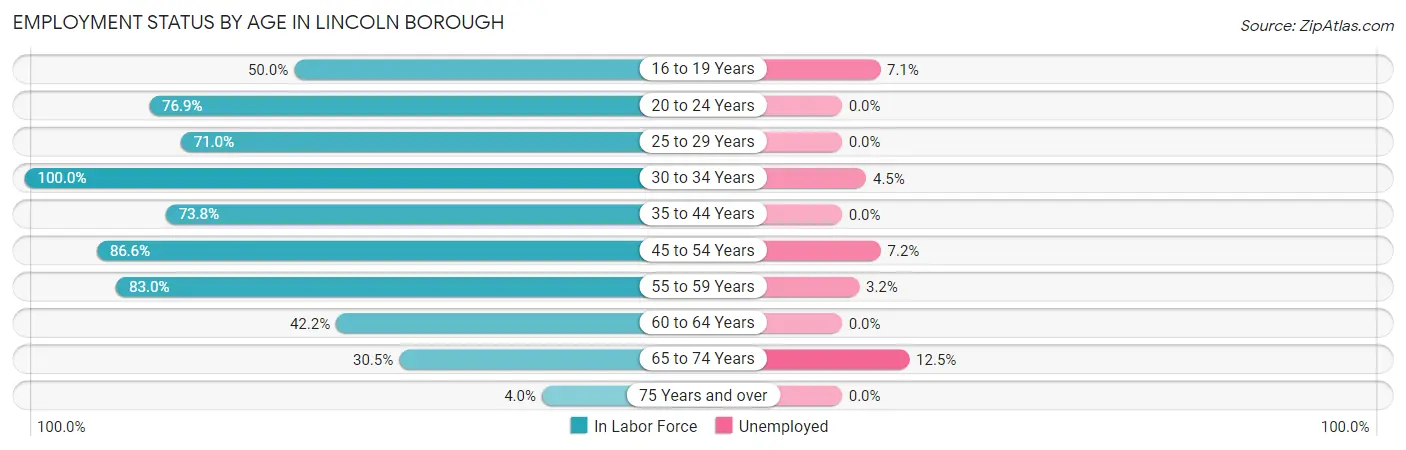
| Age Bracket | In Labor Force | Unemployed |
| 16 to 19 Years | 14 (50.0%) | 1 (7.1%) |
| 20 to 24 Years | 50 (76.9%) | 0 (0.0%) |
| 25 to 29 Years | 66 (71.0%) | 0 (0.0%) |
| 30 to 34 Years | 66 (100.0%) | 3 (4.5%) |
| 35 to 44 Years | 62 (73.8%) | 0 (0.0%) |
| 45 to 54 Years | 97 (86.6%) | 7 (7.2%) |
| 55 to 59 Years | 93 (83.0%) | 3 (3.2%) |
| 60 to 64 Years | 38 (42.2%) | 0 (0.0%) |
| 65 to 74 Years | 40 (30.5%) | 5 (12.5%) |
| 75 Years and over | 4 (4.0%) | 0 (0.0%) |
| Total | 530 (60.1%) | 19 (3.6%) |
Employment Status by Educational Attainment in Lincoln borough
According to labor force statistics for Lincoln borough, 75.8% of individuals (422) out of the total population between 25 and 64 years of age (557) are in the labor force, with 3.1% or 13 of them being unemployed. The group with the highest labor force participation rate are those with the educational attainment of college / associate degree, with 83.4% or 186 individuals in the labor force. Within the labor force, individuals with bachelor's degree or higher education have the highest percentage of unemployment, with 4.6% or 3 of them being unemployed.
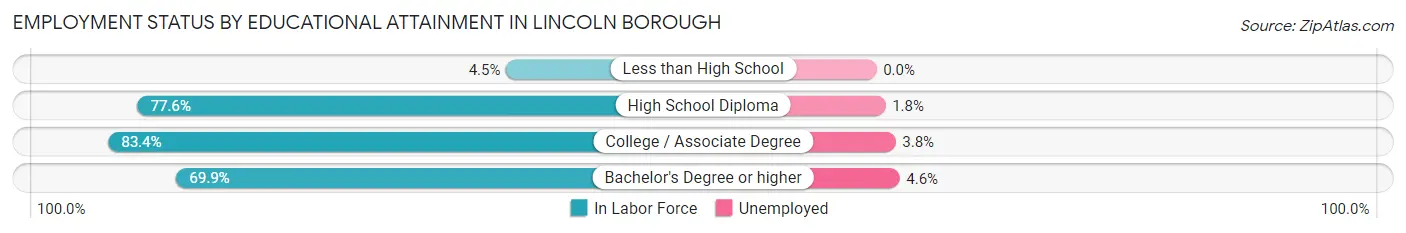
| Educational Attainment | In Labor Force | Unemployed |
| Less than High School | 1 (4.5%) | 0 (0.0%) |
| High School Diploma | 170 (77.6%) | 4 (1.8%) |
| College / Associate Degree | 186 (83.4%) | 8 (3.8%) |
| Bachelor's Degree or higher | 65 (69.9%) | 4 (4.6%) |
| Total | 422 (75.8%) | 17 (3.1%) |
Employment Occupations by Sex in Lincoln borough
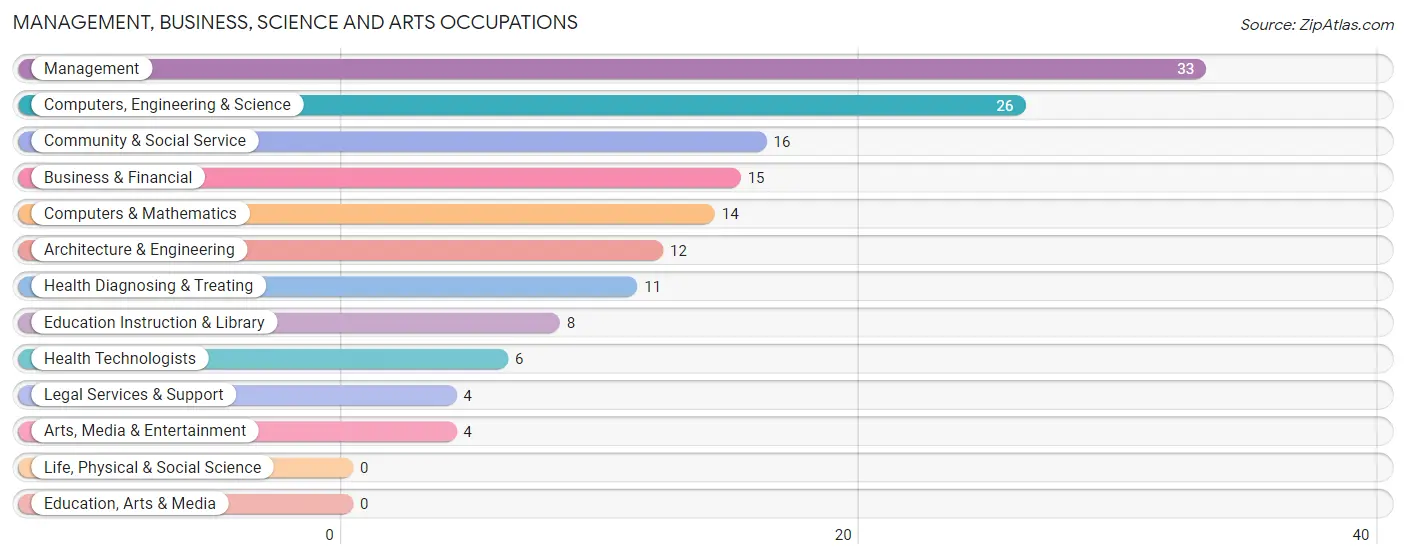
Management, Business, Science and Arts Occupations
The most common Management, Business, Science and Arts occupations in Lincoln borough are Management (33 | 6.5%), Computers, Engineering & Science (26 | 5.1%), Community & Social Service (16 | 3.1%), Business & Financial (15 | 2.9%), and Computers & Mathematics (14 | 2.7%).
Management, Business, Science and Arts Occupations by Sex
Within the Management, Business, Science and Arts occupations in Lincoln borough, the most male-oriented occupations are Legal Services & Support (100.0%), Business & Financial (66.7%), and Management (57.6%), while the most female-oriented occupations are Arts, Media & Entertainment (100.0%), Computers & Mathematics (85.7%), and Health Diagnosing & Treating (81.8%).
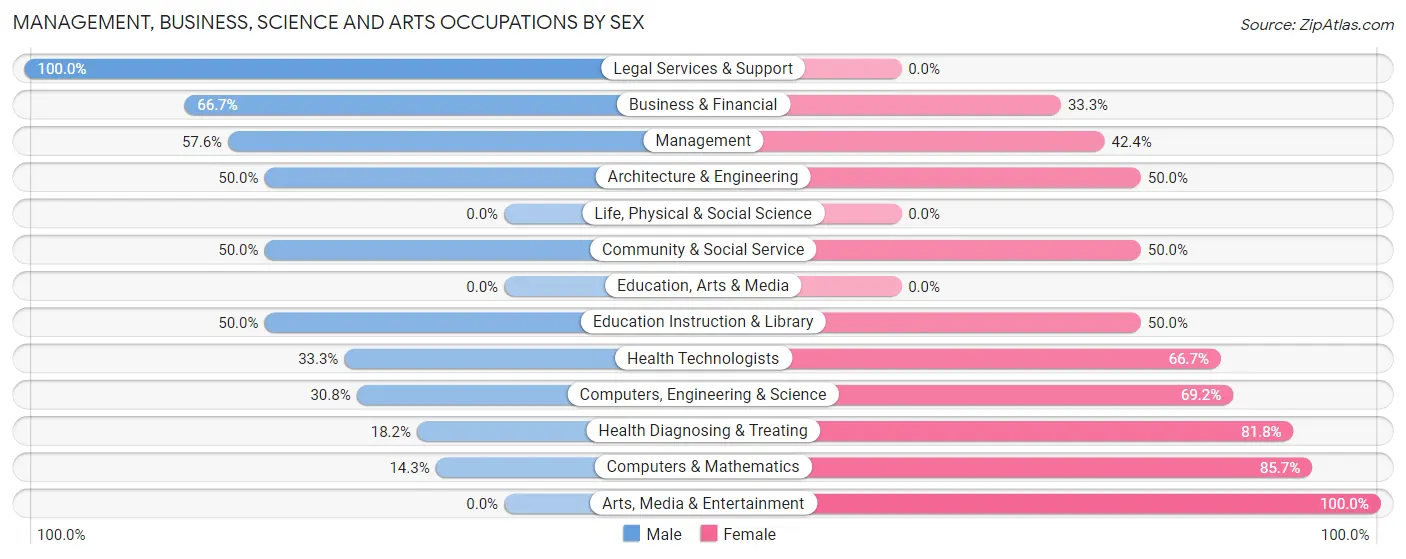
| Occupation | Male | Female |
| Management | 19 (57.6%) | 14 (42.4%) |
| Business & Financial | 10 (66.7%) | 5 (33.3%) |
| Computers, Engineering & Science | 8 (30.8%) | 18 (69.2%) |
| Computers & Mathematics | 2 (14.3%) | 12 (85.7%) |
| Architecture & Engineering | 6 (50.0%) | 6 (50.0%) |
| Life, Physical & Social Science | 0 (0.0%) | 0 (0.0%) |
| Community & Social Service | 8 (50.0%) | 8 (50.0%) |
| Education, Arts & Media | 0 (0.0%) | 0 (0.0%) |
| Legal Services & Support | 4 (100.0%) | 0 (0.0%) |
| Education Instruction & Library | 4 (50.0%) | 4 (50.0%) |
| Arts, Media & Entertainment | 0 (0.0%) | 4 (100.0%) |
| Health Diagnosing & Treating | 2 (18.2%) | 9 (81.8%) |
| Health Technologists | 2 (33.3%) | 4 (66.7%) |
| Total (Category) | 47 (46.5%) | 54 (53.5%) |
| Total (Overall) | 349 (68.3%) | 162 (31.7%) |
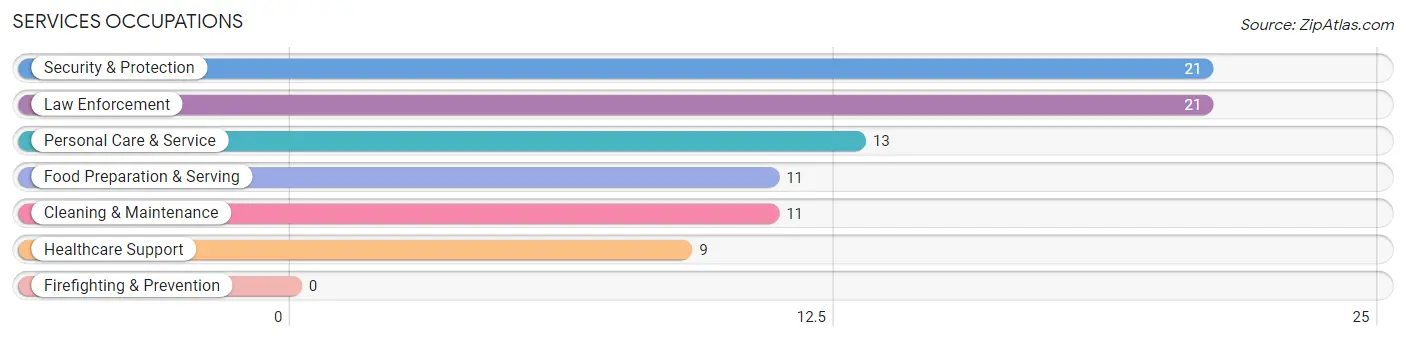
Services Occupations
The most common Services occupations in Lincoln borough are Security & Protection (21 | 4.1%), Law Enforcement (21 | 4.1%), Personal Care & Service (13 | 2.5%), Food Preparation & Serving (11 | 2.1%), and Cleaning & Maintenance (11 | 2.1%).
Services Occupations by Sex
Within the Services occupations in Lincoln borough, the most male-oriented occupations are Security & Protection (100.0%), Law Enforcement (100.0%), and Cleaning & Maintenance (63.6%), while the most female-oriented occupations are Healthcare Support (100.0%), Food Preparation & Serving (100.0%), and Personal Care & Service (84.6%).
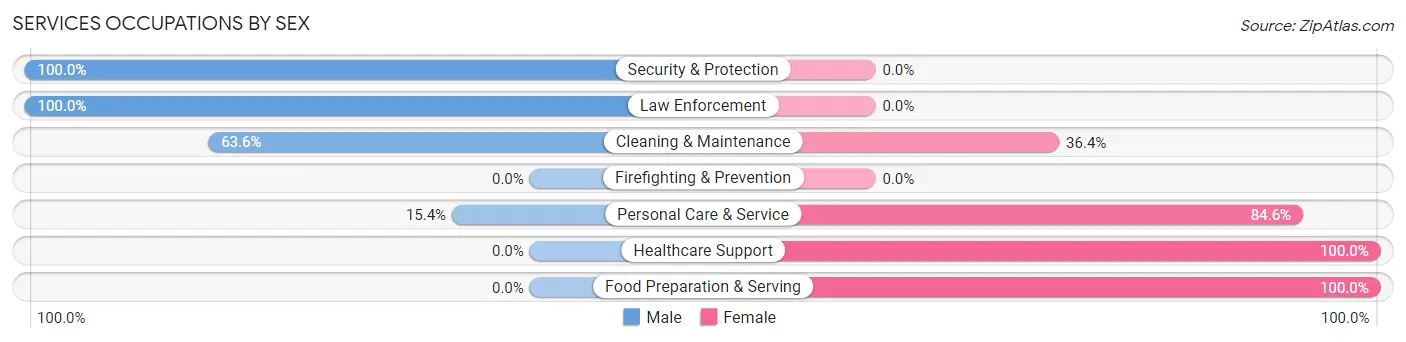
| Occupation | Male | Female |
| Healthcare Support | 0 (0.0%) | 9 (100.0%) |
| Security & Protection | 21 (100.0%) | 0 (0.0%) |
| Firefighting & Prevention | 0 (0.0%) | 0 (0.0%) |
| Law Enforcement | 21 (100.0%) | 0 (0.0%) |
| Food Preparation & Serving | 0 (0.0%) | 11 (100.0%) |
| Cleaning & Maintenance | 7 (63.6%) | 4 (36.4%) |
| Personal Care & Service | 2 (15.4%) | 11 (84.6%) |
| Total (Category) | 30 (46.2%) | 35 (53.8%) |
| Total (Overall) | 349 (68.3%) | 162 (31.7%) |
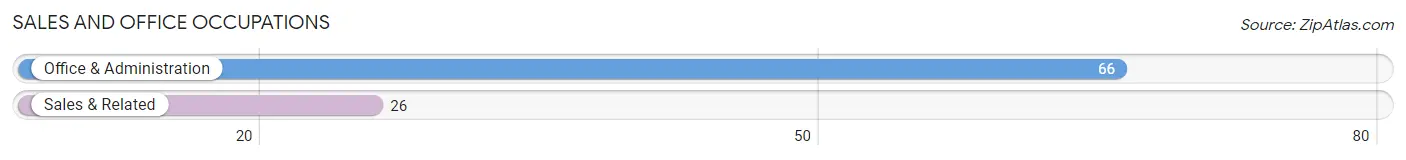
Sales and Office Occupations
The most common Sales and Office occupations in Lincoln borough are Office & Administration (66 | 12.9%), and Sales & Related (26 | 5.1%).
Sales and Office Occupations by Sex
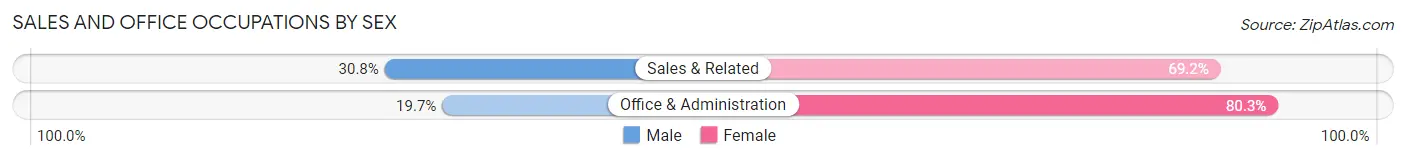
| Occupation | Male | Female |
| Sales & Related | 8 (30.8%) | 18 (69.2%) |
| Office & Administration | 13 (19.7%) | 53 (80.3%) |
| Total (Category) | 21 (22.8%) | 71 (77.2%) |
| Total (Overall) | 349 (68.3%) | 162 (31.7%) |
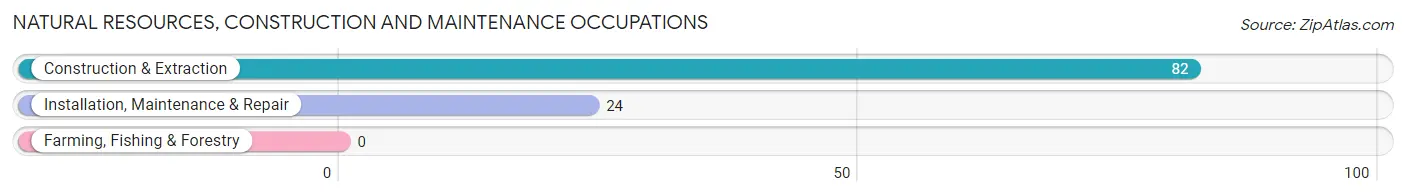
Natural Resources, Construction and Maintenance Occupations
The most common Natural Resources, Construction and Maintenance occupations in Lincoln borough are Construction & Extraction (82 | 16.1%), and Installation, Maintenance & Repair (24 | 4.7%).
Natural Resources, Construction and Maintenance Occupations by Sex
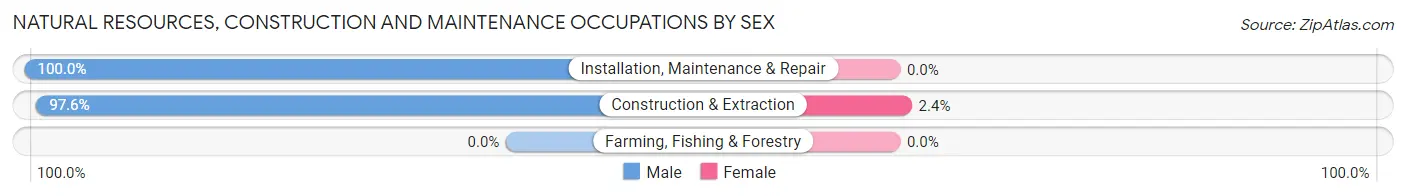
| Occupation | Male | Female |
| Farming, Fishing & Forestry | 0 (0.0%) | 0 (0.0%) |
| Construction & Extraction | 80 (97.6%) | 2 (2.4%) |
| Installation, Maintenance & Repair | 24 (100.0%) | 0 (0.0%) |
| Total (Category) | 104 (98.1%) | 2 (1.9%) |
| Total (Overall) | 349 (68.3%) | 162 (31.7%) |
Production, Transportation and Moving Occupations
The most common Production, Transportation and Moving occupations in Lincoln borough are Material Moving (74 | 14.5%), Production (63 | 12.3%), and Transportation (10 | 2.0%).
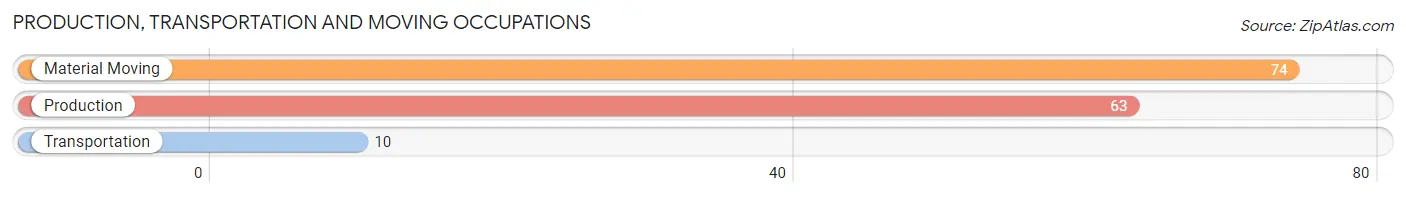
Production, Transportation and Moving Occupations by Sex
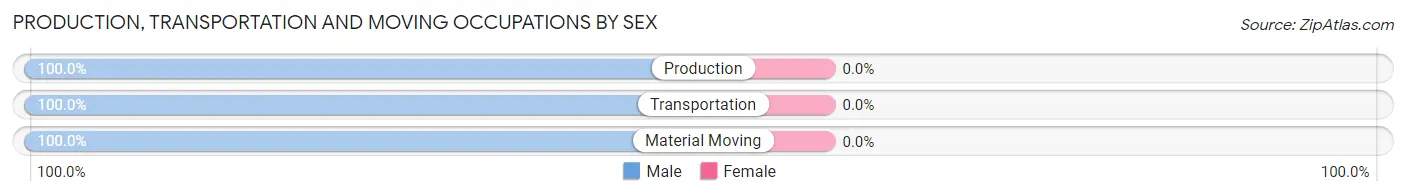
| Occupation | Male | Female |
| Production | 63 (100.0%) | 0 (0.0%) |
| Transportation | 10 (100.0%) | 0 (0.0%) |
| Material Moving | 74 (100.0%) | 0 (0.0%) |
| Total (Category) | 147 (100.0%) | 0 (0.0%) |
| Total (Overall) | 349 (68.3%) | 162 (31.7%) |
Employment Industries by Sex in Lincoln borough
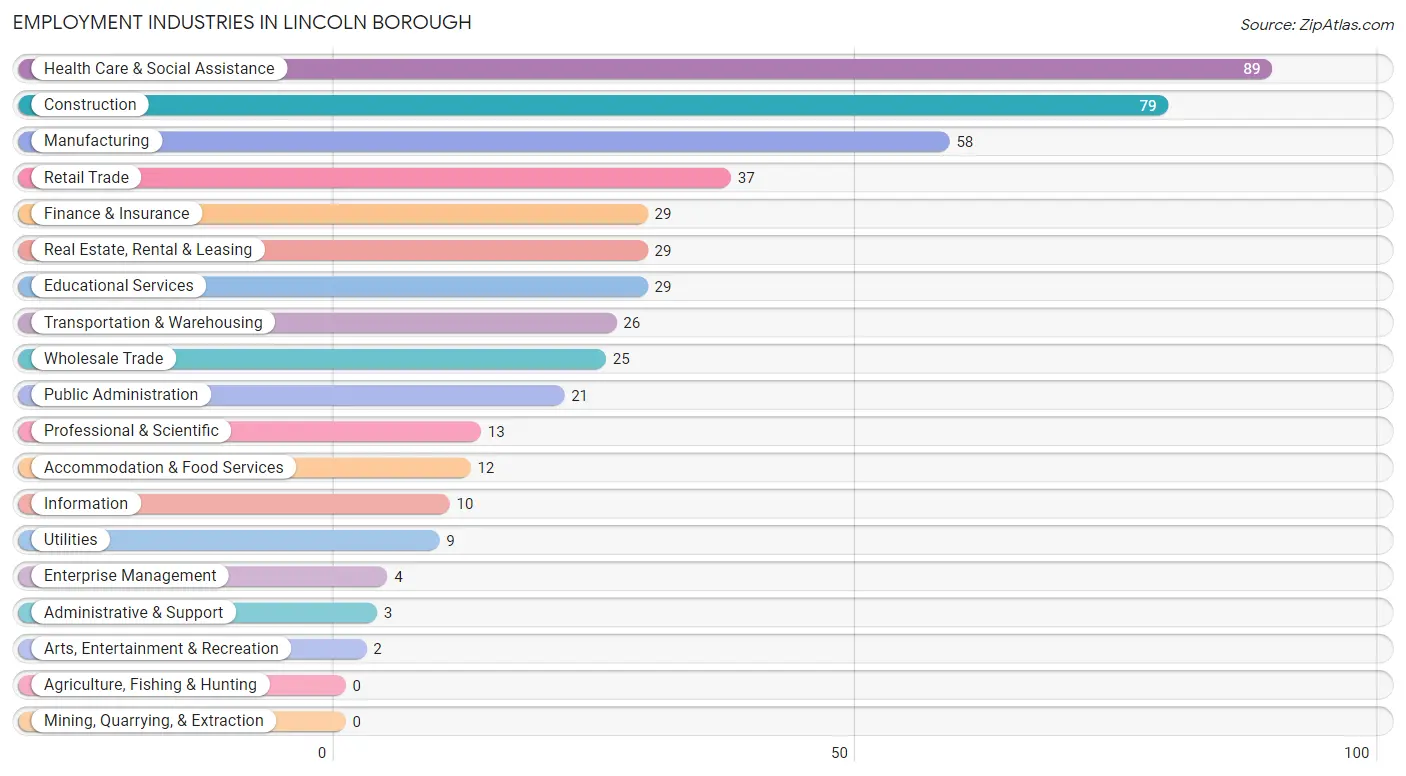
Employment Industries in Lincoln borough
The major employment industries in Lincoln borough include Health Care & Social Assistance (89 | 17.4%), Construction (79 | 15.5%), Manufacturing (58 | 11.4%), Retail Trade (37 | 7.2%), and Finance & Insurance (29 | 5.7%).
Employment Industries by Sex in Lincoln borough
The Lincoln borough industries that see more men than women are Wholesale Trade (100.0%), Utilities (100.0%), and Professional & Scientific (100.0%), whereas the industries that tend to have a higher number of women are Arts, Entertainment & Recreation (100.0%), Retail Trade (78.4%), and Finance & Insurance (72.4%).
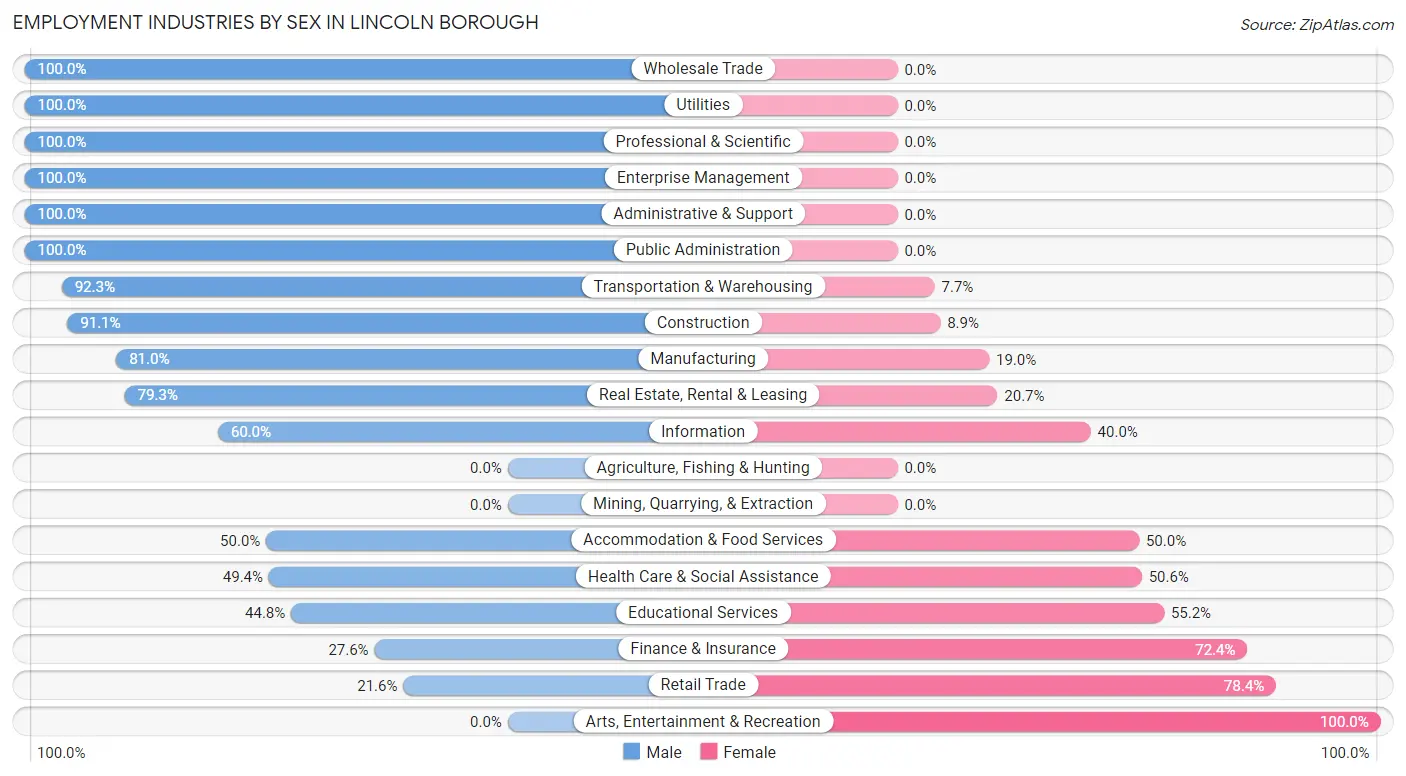
| Industry | Male | Female |
| Agriculture, Fishing & Hunting | 0 (0.0%) | 0 (0.0%) |
| Mining, Quarrying, & Extraction | 0 (0.0%) | 0 (0.0%) |
| Construction | 72 (91.1%) | 7 (8.9%) |
| Manufacturing | 47 (81.0%) | 11 (19.0%) |
| Wholesale Trade | 25 (100.0%) | 0 (0.0%) |
| Retail Trade | 8 (21.6%) | 29 (78.4%) |
| Transportation & Warehousing | 24 (92.3%) | 2 (7.7%) |
| Utilities | 9 (100.0%) | 0 (0.0%) |
| Information | 6 (60.0%) | 4 (40.0%) |
| Finance & Insurance | 8 (27.6%) | 21 (72.4%) |
| Real Estate, Rental & Leasing | 23 (79.3%) | 6 (20.7%) |
| Professional & Scientific | 13 (100.0%) | 0 (0.0%) |
| Enterprise Management | 4 (100.0%) | 0 (0.0%) |
| Administrative & Support | 3 (100.0%) | 0 (0.0%) |
| Educational Services | 13 (44.8%) | 16 (55.2%) |
| Health Care & Social Assistance | 44 (49.4%) | 45 (50.6%) |
| Arts, Entertainment & Recreation | 0 (0.0%) | 2 (100.0%) |
| Accommodation & Food Services | 6 (50.0%) | 6 (50.0%) |
| Public Administration | 21 (100.0%) | 0 (0.0%) |
| Total | 349 (68.3%) | 162 (31.7%) |
Education in Lincoln borough
School Enrollment in Lincoln borough
The most common levels of schooling among the 117 students in Lincoln borough are college / undergraduate (36 | 30.8%), high school (29 | 24.8%), and elementary school (19 | 16.2%).
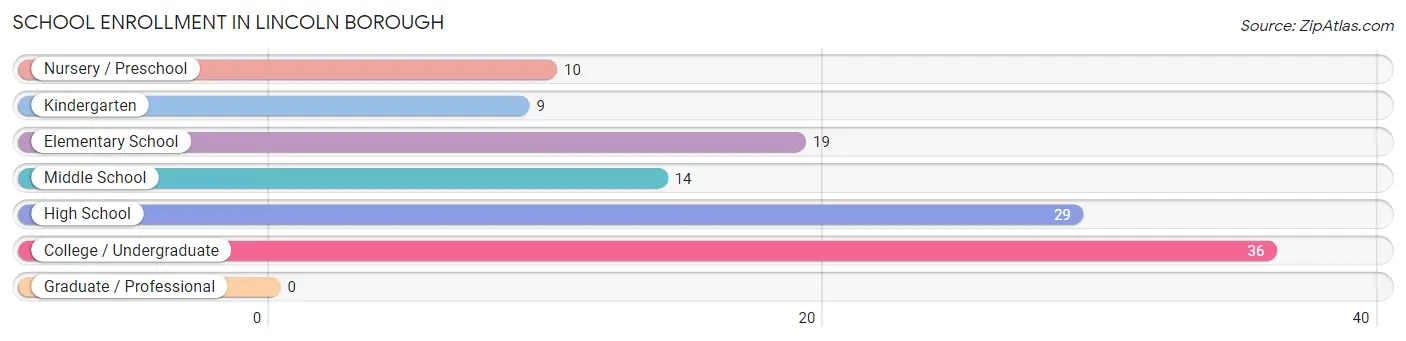
| School Level | # Students | % Students |
| Nursery / Preschool | 10 | 8.6% |
| Kindergarten | 9 | 7.7% |
| Elementary School | 19 | 16.2% |
| Middle School | 14 | 12.0% |
| High School | 29 | 24.8% |
| College / Undergraduate | 36 | 30.8% |
| Graduate / Professional | 0 | 0.0% |
| Total | 117 | 100.0% |
School Enrollment by Age by Funding Source in Lincoln borough
Out of a total of 117 students who are enrolled in schools in Lincoln borough, 7 (6.0%) attend a private institution, while the remaining 110 (94.0%) are enrolled in public schools. The age group of 20 to 24 year olds has the highest likelihood of being enrolled in private schools, with 4 (50.0% in the age bracket) enrolled. Conversely, the age group of 3 to 4 year olds has the lowest likelihood of being enrolled in a private school, with 8 (100.0% in the age bracket) attending a public institution.
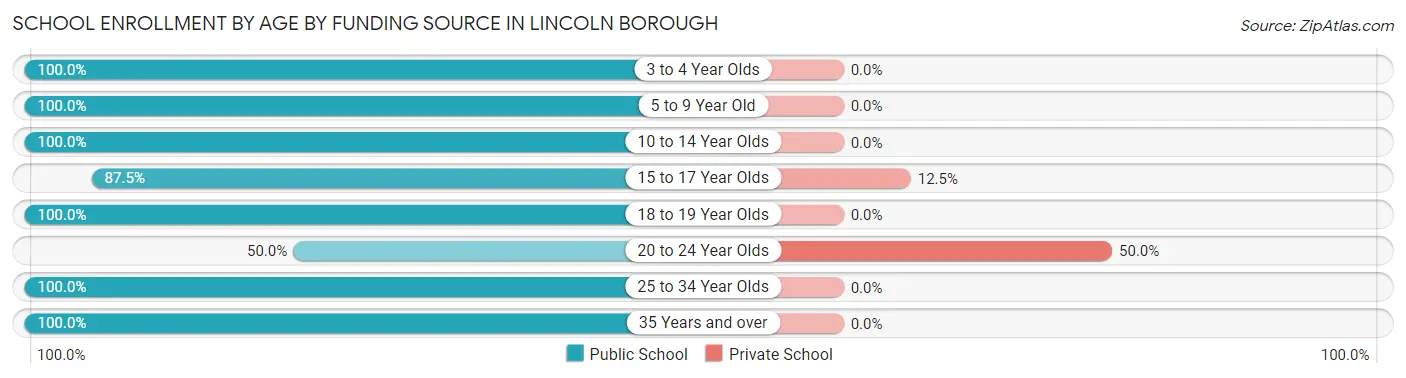
| Age Bracket | Public School | Private School |
| 3 to 4 Year Olds | 8 (100.0%) | 0 (0.0%) |
| 5 to 9 Year Old | 30 (100.0%) | 0 (0.0%) |
| 10 to 14 Year Olds | 18 (100.0%) | 0 (0.0%) |
| 15 to 17 Year Olds | 21 (87.5%) | 3 (12.5%) |
| 18 to 19 Year Olds | 6 (100.0%) | 0 (0.0%) |
| 20 to 24 Year Olds | 4 (50.0%) | 4 (50.0%) |
| 25 to 34 Year Olds | 2 (100.0%) | 0 (0.0%) |
| 35 Years and over | 21 (100.0%) | 0 (0.0%) |
| Total | 110 (94.0%) | 7 (6.0%) |
Educational Attainment by Field of Study in Lincoln borough
Business (41 | 28.3%), arts & humanities (23 | 15.9%), education (14 | 9.7%), computers & mathematics (12 | 8.3%), and bio, nature & agricultural (12 | 8.3%) are the most common fields of study among 145 individuals in Lincoln borough who have obtained a bachelor's degree or higher.
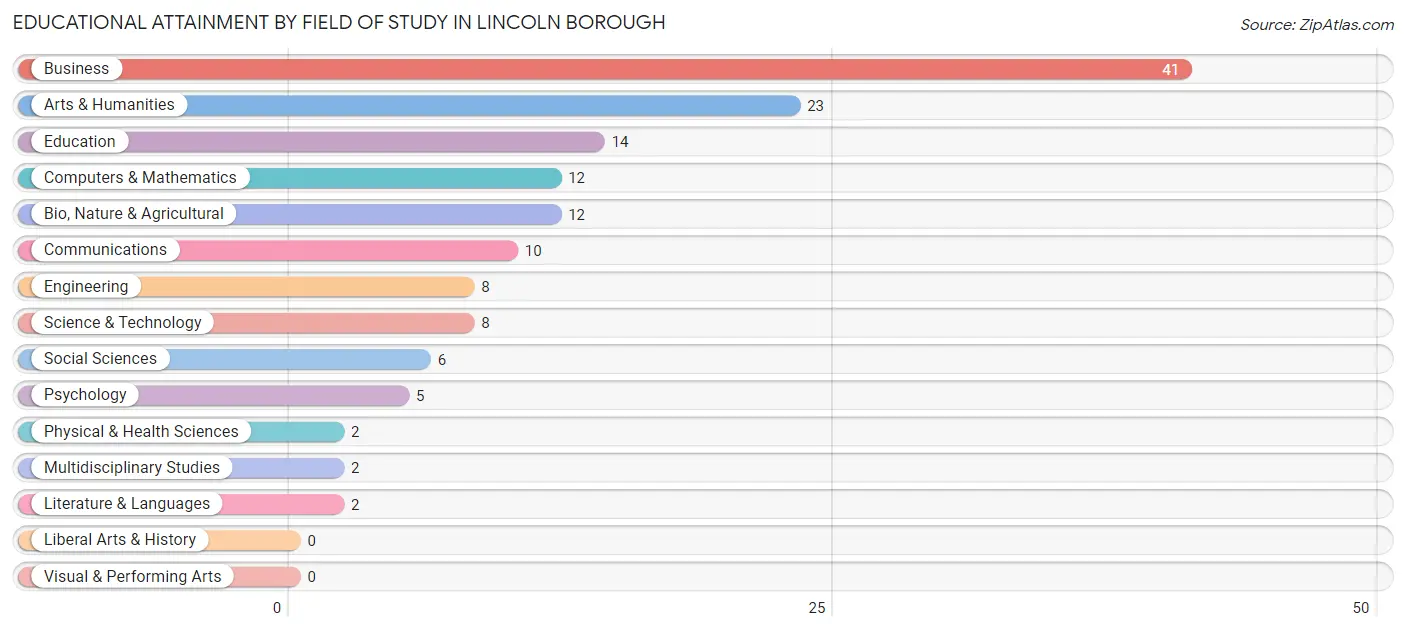
| Field of Study | # Graduates | % Graduates |
| Computers & Mathematics | 12 | 8.3% |
| Bio, Nature & Agricultural | 12 | 8.3% |
| Physical & Health Sciences | 2 | 1.4% |
| Psychology | 5 | 3.5% |
| Social Sciences | 6 | 4.1% |
| Engineering | 8 | 5.5% |
| Multidisciplinary Studies | 2 | 1.4% |
| Science & Technology | 8 | 5.5% |
| Business | 41 | 28.3% |
| Education | 14 | 9.7% |
| Literature & Languages | 2 | 1.4% |
| Liberal Arts & History | 0 | 0.0% |
| Visual & Performing Arts | 0 | 0.0% |
| Communications | 10 | 6.9% |
| Arts & Humanities | 23 | 15.9% |
| Total | 145 | 100.0% |
Transportation & Commute in Lincoln borough
Vehicle Availability by Sex in Lincoln borough
The most prevalent vehicle ownership categories in Lincoln borough are males with 2 vehicles (80, accounting for 24.2%) and females with 2 vehicles (71, making up 51.0%).
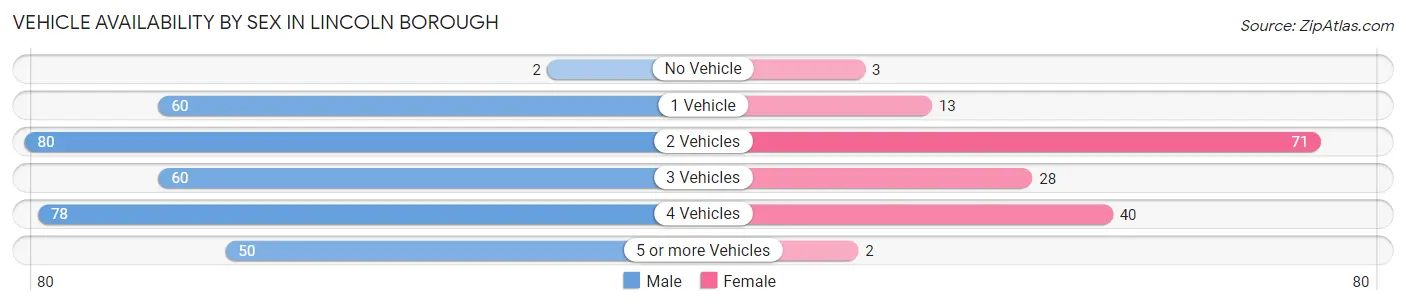
| Vehicles Available | Male | Female |
| No Vehicle | 2 (0.6%) | 3 (1.9%) |
| 1 Vehicle | 60 (18.2%) | 13 (8.3%) |
| 2 Vehicles | 80 (24.2%) | 71 (45.2%) |
| 3 Vehicles | 60 (18.2%) | 28 (17.8%) |
| 4 Vehicles | 78 (23.6%) | 40 (25.5%) |
| 5 or more Vehicles | 50 (15.1%) | 2 (1.3%) |
| Total | 330 (100.0%) | 157 (100.0%) |
Commute Time in Lincoln borough
The most frequently occuring commute durations in Lincoln borough are 15 to 19 minutes (131 commuters, 28.8%), 20 to 24 minutes (74 commuters, 16.3%), and 60 to 89 minutes (43 commuters, 9.5%).
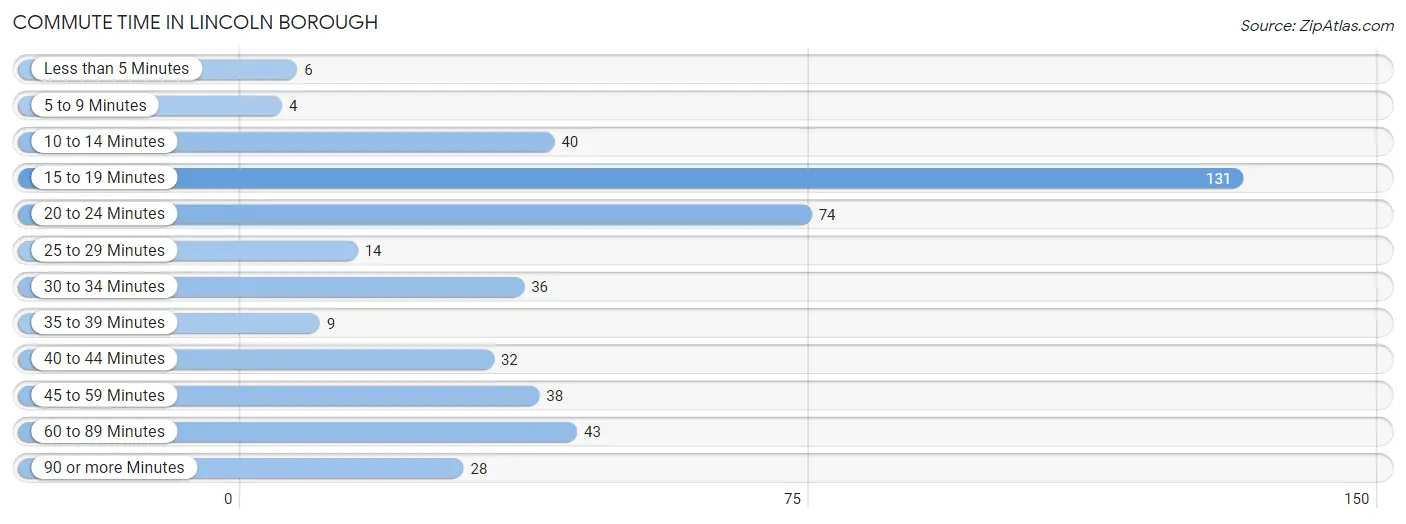
| Commute Time | # Commuters | % Commuters |
| Less than 5 Minutes | 6 | 1.3% |
| 5 to 9 Minutes | 4 | 0.9% |
| 10 to 14 Minutes | 40 | 8.8% |
| 15 to 19 Minutes | 131 | 28.8% |
| 20 to 24 Minutes | 74 | 16.3% |
| 25 to 29 Minutes | 14 | 3.1% |
| 30 to 34 Minutes | 36 | 7.9% |
| 35 to 39 Minutes | 9 | 2.0% |
| 40 to 44 Minutes | 32 | 7.0% |
| 45 to 59 Minutes | 38 | 8.4% |
| 60 to 89 Minutes | 43 | 9.5% |
| 90 or more Minutes | 28 | 6.1% |
Commute Time by Sex in Lincoln borough
The most common commute times in Lincoln borough are 15 to 19 minutes (90 commuters, 27.9%) for males and 15 to 19 minutes (41 commuters, 31.1%) for females.
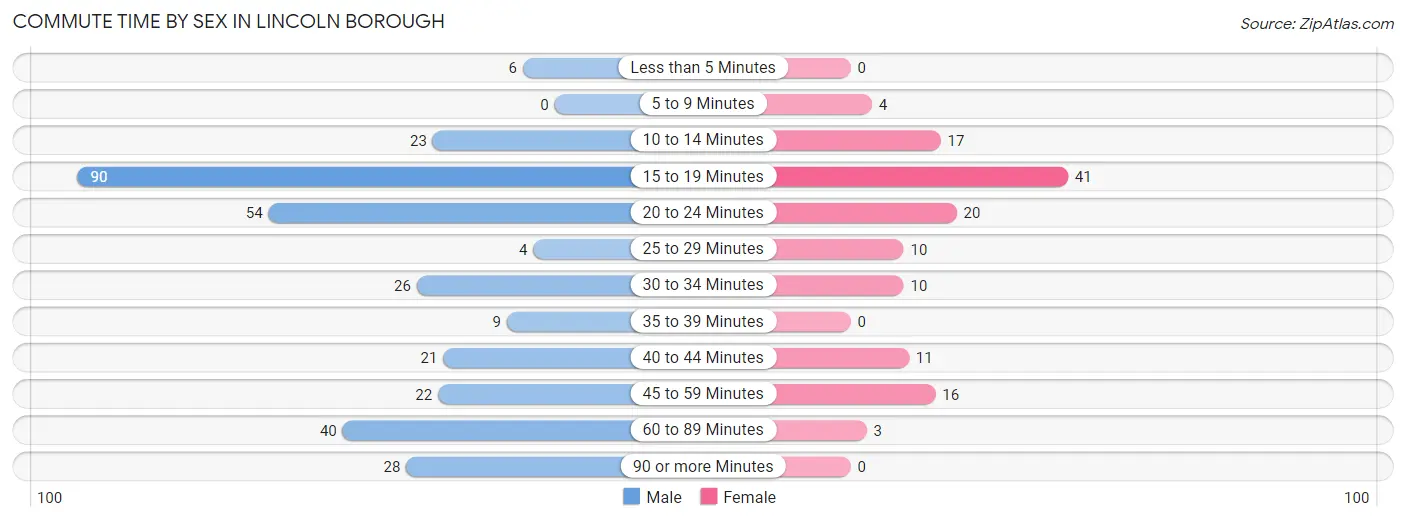
| Commute Time | Male | Female |
| Less than 5 Minutes | 6 (1.9%) | 0 (0.0%) |
| 5 to 9 Minutes | 0 (0.0%) | 4 (3.0%) |
| 10 to 14 Minutes | 23 (7.1%) | 17 (12.9%) |
| 15 to 19 Minutes | 90 (27.9%) | 41 (31.1%) |
| 20 to 24 Minutes | 54 (16.7%) | 20 (15.1%) |
| 25 to 29 Minutes | 4 (1.2%) | 10 (7.6%) |
| 30 to 34 Minutes | 26 (8.1%) | 10 (7.6%) |
| 35 to 39 Minutes | 9 (2.8%) | 0 (0.0%) |
| 40 to 44 Minutes | 21 (6.5%) | 11 (8.3%) |
| 45 to 59 Minutes | 22 (6.8%) | 16 (12.1%) |
| 60 to 89 Minutes | 40 (12.4%) | 3 (2.3%) |
| 90 or more Minutes | 28 (8.7%) | 0 (0.0%) |
Time of Departure to Work by Sex in Lincoln borough
The most frequent times of departure to work in Lincoln borough are 6:00 AM to 6:29 AM (89, 27.6%) for males and 7:00 AM to 7:29 AM (28, 21.2%) for females.
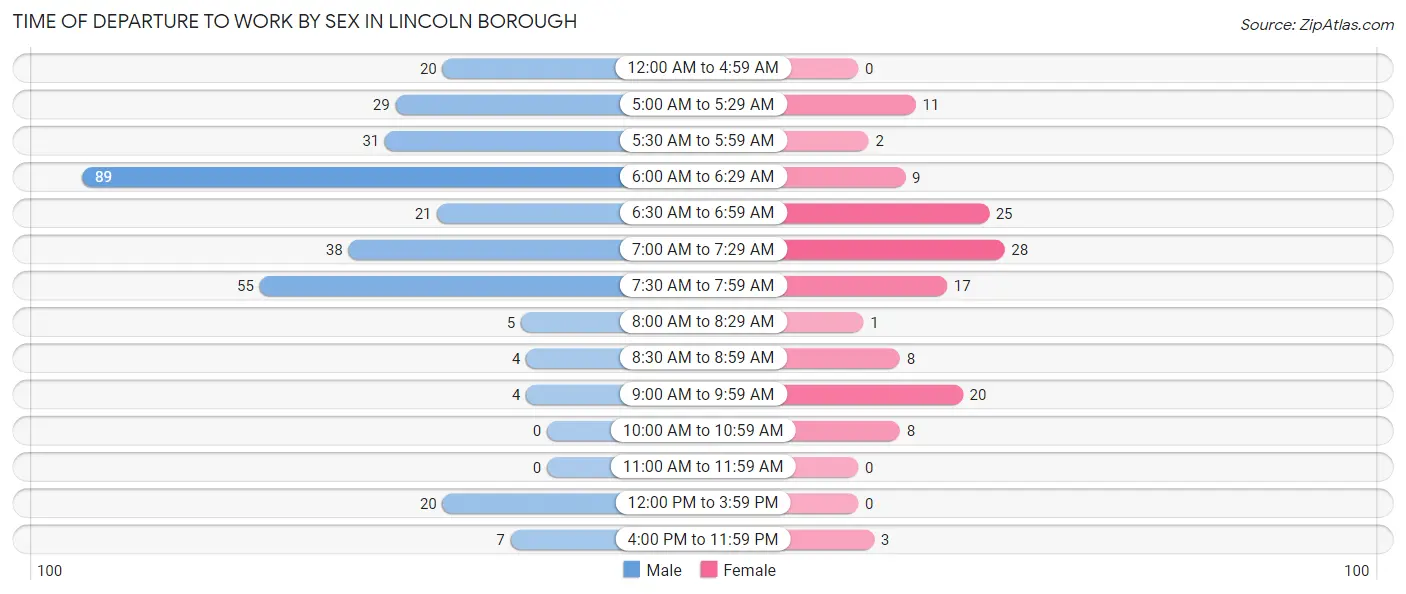
| Time of Departure | Male | Female |
| 12:00 AM to 4:59 AM | 20 (6.2%) | 0 (0.0%) |
| 5:00 AM to 5:29 AM | 29 (9.0%) | 11 (8.3%) |
| 5:30 AM to 5:59 AM | 31 (9.6%) | 2 (1.5%) |
| 6:00 AM to 6:29 AM | 89 (27.6%) | 9 (6.8%) |
| 6:30 AM to 6:59 AM | 21 (6.5%) | 25 (18.9%) |
| 7:00 AM to 7:29 AM | 38 (11.8%) | 28 (21.2%) |
| 7:30 AM to 7:59 AM | 55 (17.0%) | 17 (12.9%) |
| 8:00 AM to 8:29 AM | 5 (1.5%) | 1 (0.8%) |
| 8:30 AM to 8:59 AM | 4 (1.2%) | 8 (6.1%) |
| 9:00 AM to 9:59 AM | 4 (1.2%) | 20 (15.1%) |
| 10:00 AM to 10:59 AM | 0 (0.0%) | 8 (6.1%) |
| 11:00 AM to 11:59 AM | 0 (0.0%) | 0 (0.0%) |
| 12:00 PM to 3:59 PM | 20 (6.2%) | 0 (0.0%) |
| 4:00 PM to 11:59 PM | 7 (2.2%) | 3 (2.3%) |
| Total | 323 (100.0%) | 132 (100.0%) |
Housing Occupancy in Lincoln borough
Occupancy by Ownership in Lincoln borough
Of the total 427 dwellings in Lincoln borough, owner-occupied units account for 339 (79.4%), while renter-occupied units make up 88 (20.6%).
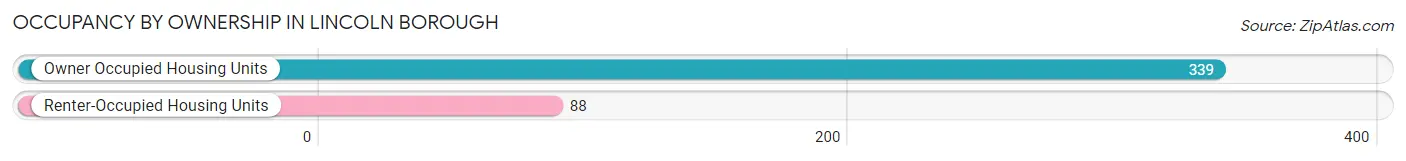
| Occupancy | # Housing Units | % Housing Units |
| Owner Occupied Housing Units | 339 | 79.4% |
| Renter-Occupied Housing Units | 88 | 20.6% |
| Total Occupied Housing Units | 427 | 100.0% |
Occupancy by Household Size in Lincoln borough
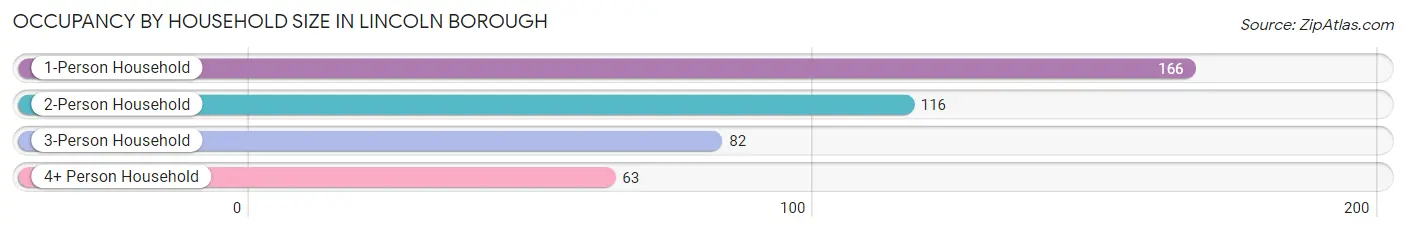
| Household Size | # Housing Units | % Housing Units |
| 1-Person Household | 166 | 38.9% |
| 2-Person Household | 116 | 27.2% |
| 3-Person Household | 82 | 19.2% |
| 4+ Person Household | 63 | 14.7% |
| Total Housing Units | 427 | 100.0% |
Occupancy by Ownership by Household Size in Lincoln borough
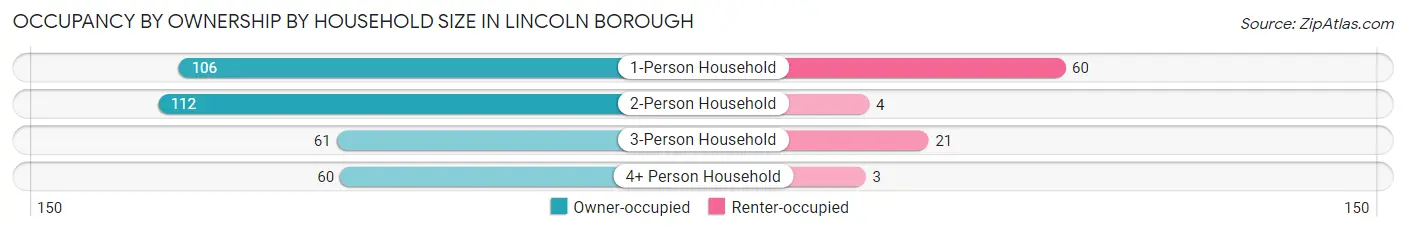
| Household Size | Owner-occupied | Renter-occupied |
| 1-Person Household | 106 (63.9%) | 60 (36.1%) |
| 2-Person Household | 112 (96.6%) | 4 (3.5%) |
| 3-Person Household | 61 (74.4%) | 21 (25.6%) |
| 4+ Person Household | 60 (95.2%) | 3 (4.8%) |
| Total Housing Units | 339 (79.4%) | 88 (20.6%) |
Occupancy by Educational Attainment in Lincoln borough
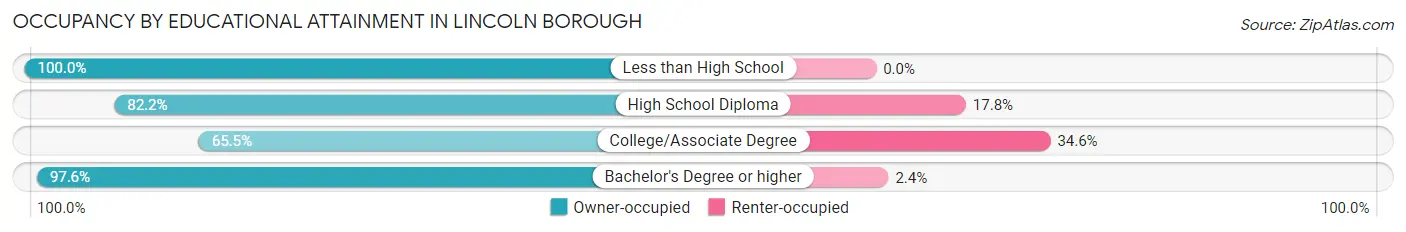
| Household Size | Owner-occupied | Renter-occupied |
| Less than High School | 17 (100.0%) | 0 (0.0%) |
| High School Diploma | 134 (82.2%) | 29 (17.8%) |
| College/Associate Degree | 108 (65.4%) | 57 (34.5%) |
| Bachelor's Degree or higher | 80 (97.6%) | 2 (2.4%) |
Occupancy by Age of Householder in Lincoln borough
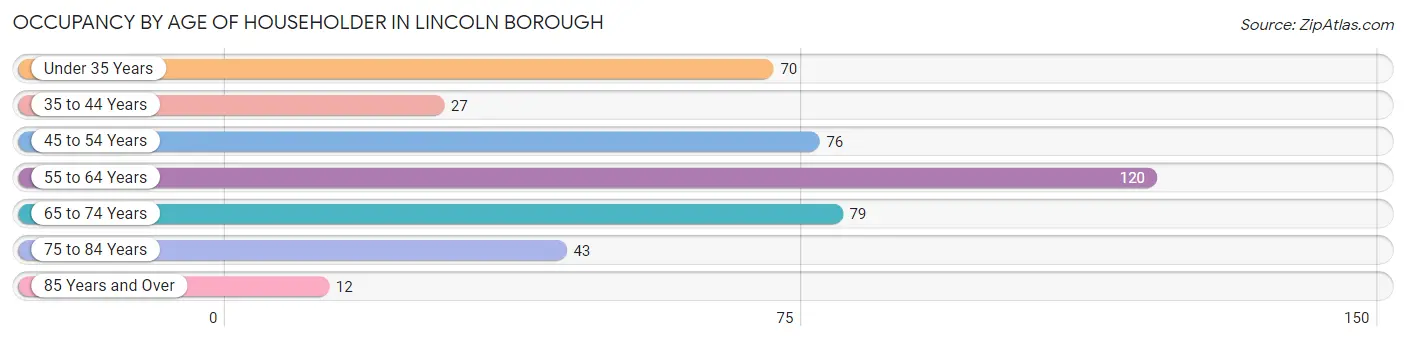
| Age Bracket | # Households | % Households |
| Under 35 Years | 70 | 16.4% |
| 35 to 44 Years | 27 | 6.3% |
| 45 to 54 Years | 76 | 17.8% |
| 55 to 64 Years | 120 | 28.1% |
| 65 to 74 Years | 79 | 18.5% |
| 75 to 84 Years | 43 | 10.1% |
| 85 Years and Over | 12 | 2.8% |
| Total | 427 | 100.0% |
Housing Finances in Lincoln borough
Median Income by Occupancy in Lincoln borough
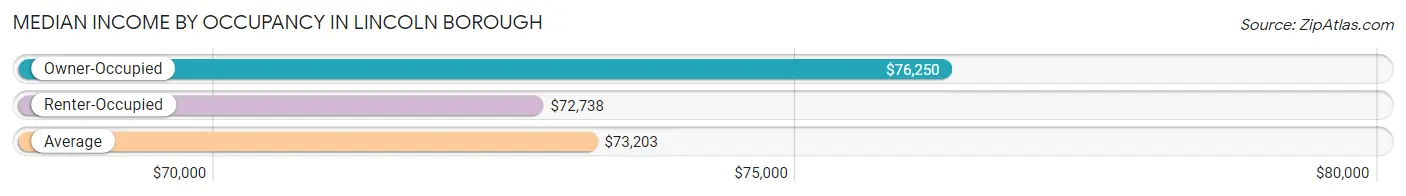
| Occupancy Type | # Households | Median Income |
| Owner-Occupied | 339 (79.4%) | $76,250 |
| Renter-Occupied | 88 (20.6%) | $72,738 |
| Average | 427 (100.0%) | $73,203 |
Occupancy by Householder Income Bracket in Lincoln borough
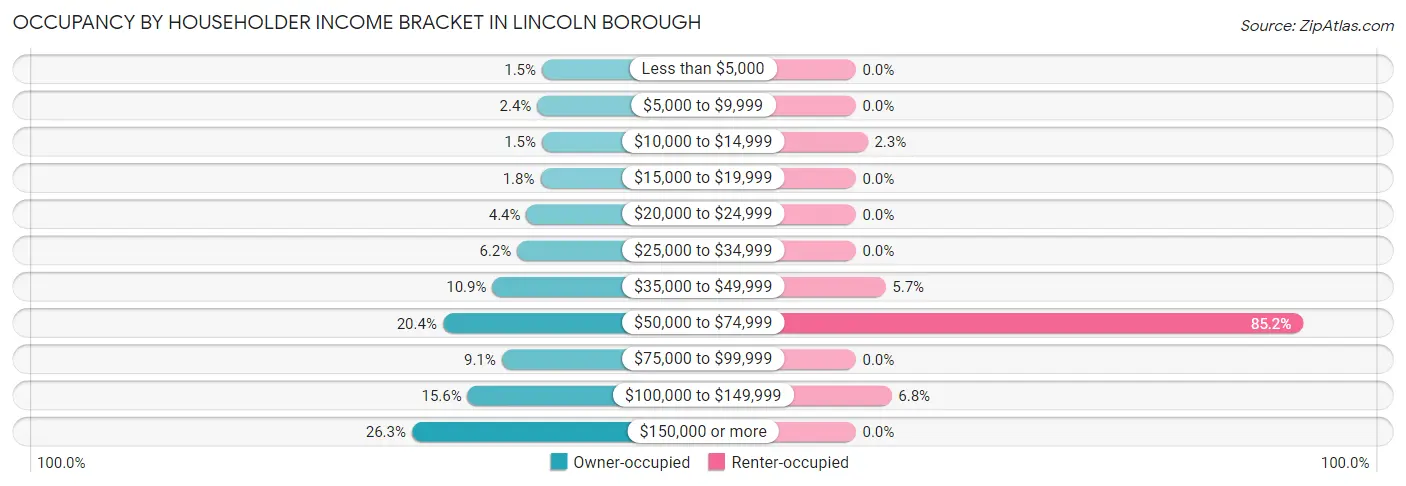
| Income Bracket | Owner-occupied | Renter-occupied |
| Less than $5,000 | 5 (1.5%) | 0 (0.0%) |
| $5,000 to $9,999 | 8 (2.4%) | 0 (0.0%) |
| $10,000 to $14,999 | 5 (1.5%) | 2 (2.3%) |
| $15,000 to $19,999 | 6 (1.8%) | 0 (0.0%) |
| $20,000 to $24,999 | 15 (4.4%) | 0 (0.0%) |
| $25,000 to $34,999 | 21 (6.2%) | 0 (0.0%) |
| $35,000 to $49,999 | 37 (10.9%) | 5 (5.7%) |
| $50,000 to $74,999 | 69 (20.3%) | 75 (85.2%) |
| $75,000 to $99,999 | 31 (9.1%) | 0 (0.0%) |
| $100,000 to $149,999 | 53 (15.6%) | 6 (6.8%) |
| $150,000 or more | 89 (26.3%) | 0 (0.0%) |
| Total | 339 (100.0%) | 88 (100.0%) |
Monthly Housing Cost Tiers in Lincoln borough
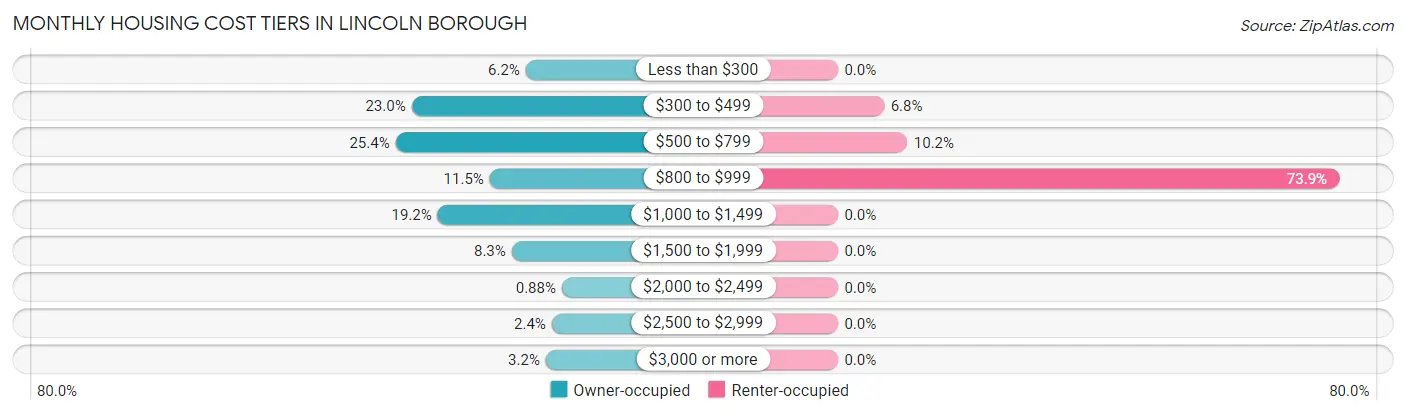
| Monthly Cost | Owner-occupied | Renter-occupied |
| Less than $300 | 21 (6.2%) | 0 (0.0%) |
| $300 to $499 | 78 (23.0%) | 6 (6.8%) |
| $500 to $799 | 86 (25.4%) | 9 (10.2%) |
| $800 to $999 | 39 (11.5%) | 65 (73.9%) |
| $1,000 to $1,499 | 65 (19.2%) | 0 (0.0%) |
| $1,500 to $1,999 | 28 (8.3%) | 0 (0.0%) |
| $2,000 to $2,499 | 3 (0.9%) | 0 (0.0%) |
| $2,500 to $2,999 | 8 (2.4%) | 0 (0.0%) |
| $3,000 or more | 11 (3.2%) | 0 (0.0%) |
| Total | 339 (100.0%) | 88 (100.0%) |
Physical Housing Characteristics in Lincoln borough
Housing Structures in Lincoln borough
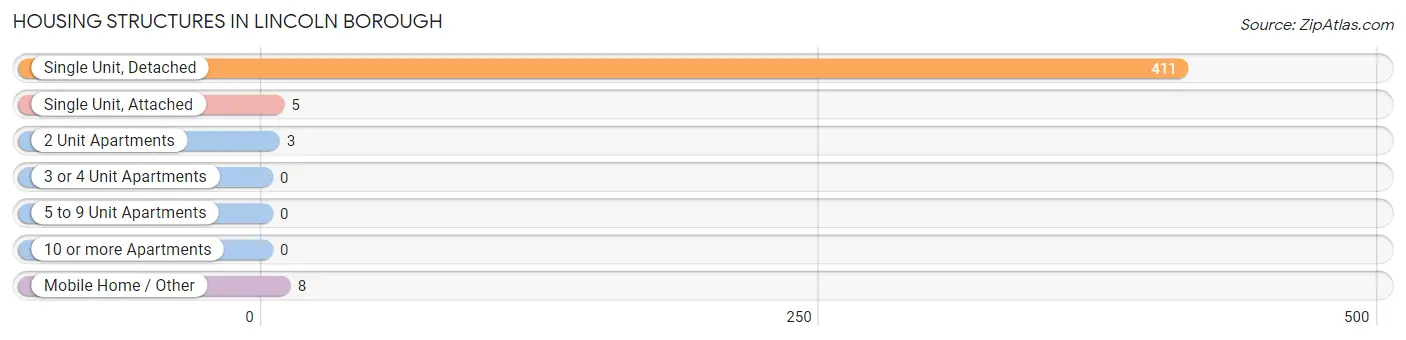
| Structure Type | # Housing Units | % Housing Units |
| Single Unit, Detached | 411 | 96.3% |
| Single Unit, Attached | 5 | 1.2% |
| 2 Unit Apartments | 3 | 0.7% |
| 3 or 4 Unit Apartments | 0 | 0.0% |
| 5 to 9 Unit Apartments | 0 | 0.0% |
| 10 or more Apartments | 0 | 0.0% |
| Mobile Home / Other | 8 | 1.9% |
| Total | 427 | 100.0% |
Housing Structures by Occupancy in Lincoln borough
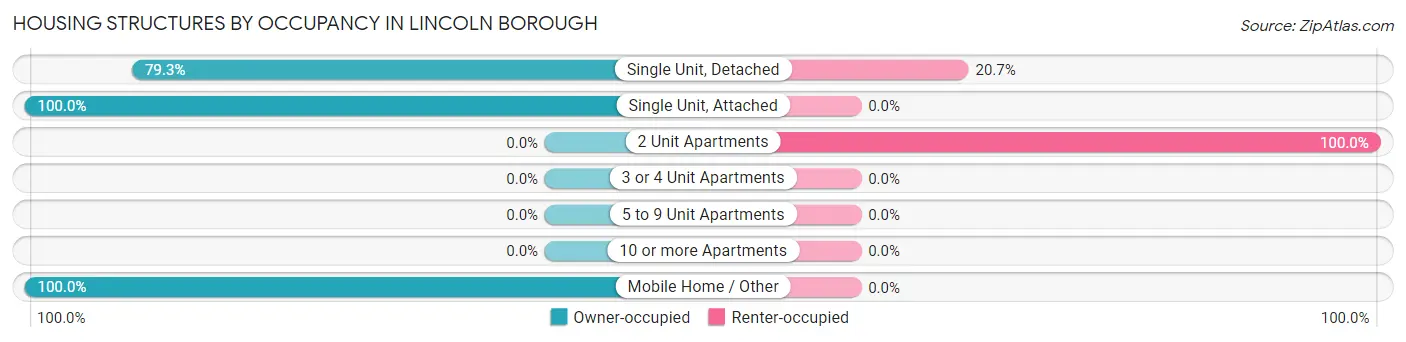
| Structure Type | Owner-occupied | Renter-occupied |
| Single Unit, Detached | 326 (79.3%) | 85 (20.7%) |
| Single Unit, Attached | 5 (100.0%) | 0 (0.0%) |
| 2 Unit Apartments | 0 (0.0%) | 3 (100.0%) |
| 3 or 4 Unit Apartments | 0 (0.0%) | 0 (0.0%) |
| 5 to 9 Unit Apartments | 0 (0.0%) | 0 (0.0%) |
| 10 or more Apartments | 0 (0.0%) | 0 (0.0%) |
| Mobile Home / Other | 8 (100.0%) | 0 (0.0%) |
| Total | 339 (79.4%) | 88 (20.6%) |
Housing Structures by Number of Rooms in Lincoln borough
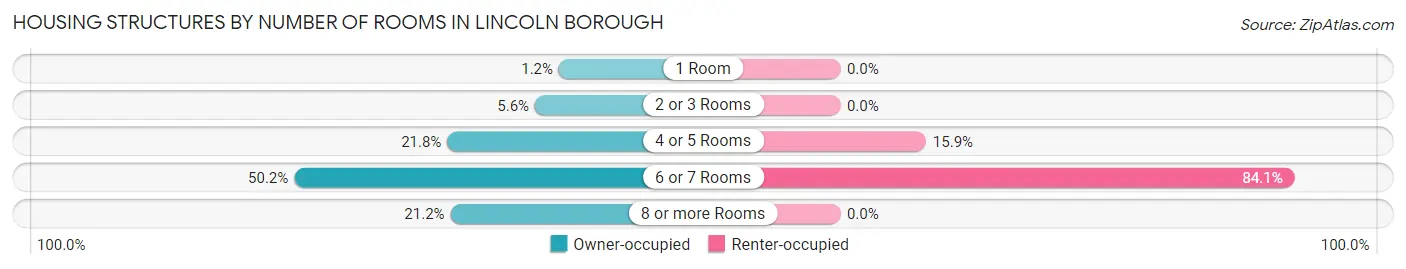
| Number of Rooms | Owner-occupied | Renter-occupied |
| 1 Room | 4 (1.2%) | 0 (0.0%) |
| 2 or 3 Rooms | 19 (5.6%) | 0 (0.0%) |
| 4 or 5 Rooms | 74 (21.8%) | 14 (15.9%) |
| 6 or 7 Rooms | 170 (50.1%) | 74 (84.1%) |
| 8 or more Rooms | 72 (21.2%) | 0 (0.0%) |
| Total | 339 (100.0%) | 88 (100.0%) |
Housing Structure by Heating Type in Lincoln borough
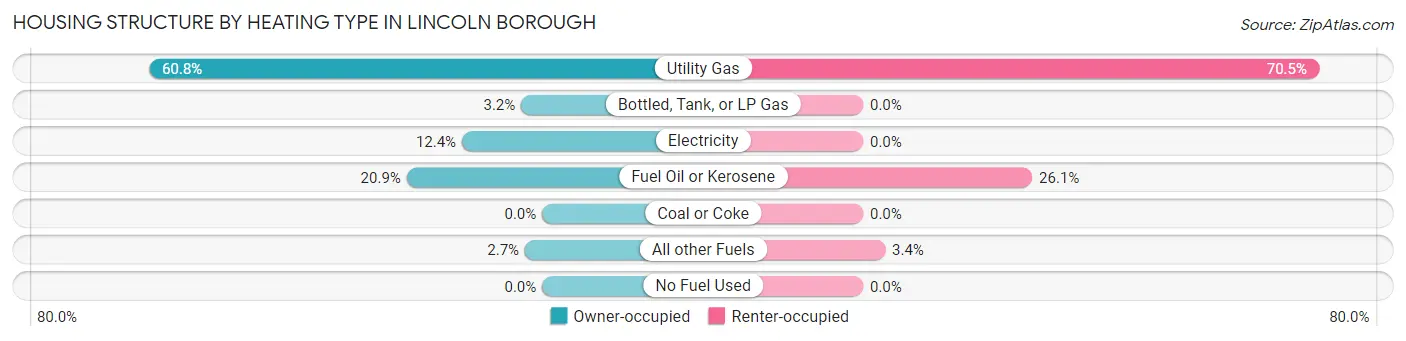
| Heating Type | Owner-occupied | Renter-occupied |
| Utility Gas | 206 (60.8%) | 62 (70.5%) |
| Bottled, Tank, or LP Gas | 11 (3.2%) | 0 (0.0%) |
| Electricity | 42 (12.4%) | 0 (0.0%) |
| Fuel Oil or Kerosene | 71 (20.9%) | 23 (26.1%) |
| Coal or Coke | 0 (0.0%) | 0 (0.0%) |
| All other Fuels | 9 (2.6%) | 3 (3.4%) |
| No Fuel Used | 0 (0.0%) | 0 (0.0%) |
| Total | 339 (100.0%) | 88 (100.0%) |
Household Vehicle Usage in Lincoln borough
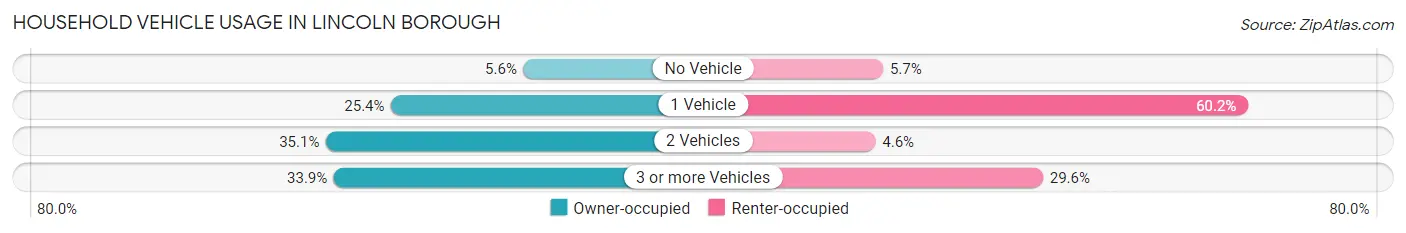
| Vehicles per Household | Owner-occupied | Renter-occupied |
| No Vehicle | 19 (5.6%) | 5 (5.7%) |
| 1 Vehicle | 86 (25.4%) | 53 (60.2%) |
| 2 Vehicles | 119 (35.1%) | 4 (4.5%) |
| 3 or more Vehicles | 115 (33.9%) | 26 (29.5%) |
| Total | 339 (100.0%) | 88 (100.0%) |
Real Estate & Mortgages in Lincoln borough
Real Estate and Mortgage Overview in Lincoln borough
| Characteristic | Without Mortgage | With Mortgage |
| Housing Units | 206 | 133 |
| Median Property Value | $103,000 | $122,200 |
| Median Household Income | $68,750 | $45 |
| Monthly Housing Costs | $517 | $6 |
| Real Estate Taxes | $2,200 | $0 |
Property Value by Mortgage Status in Lincoln borough
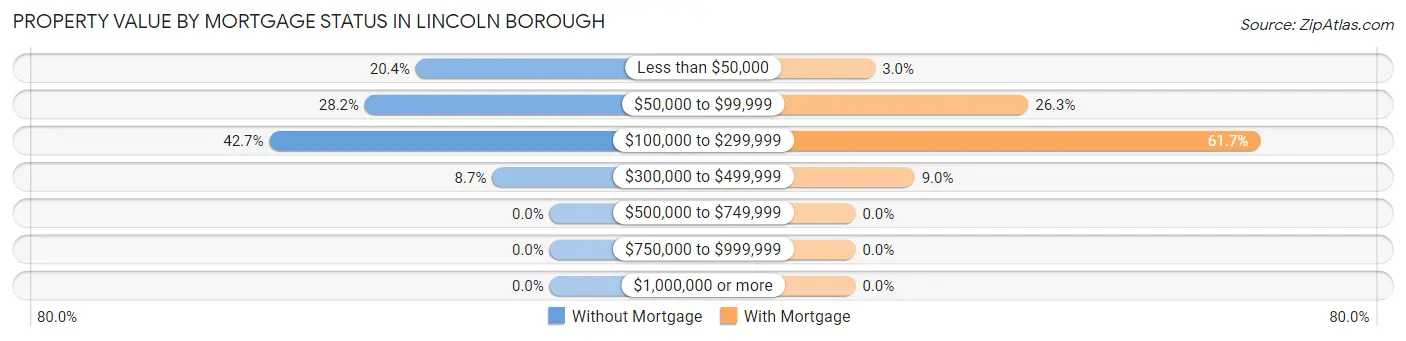
| Property Value | Without Mortgage | With Mortgage |
| Less than $50,000 | 42 (20.4%) | 4 (3.0%) |
| $50,000 to $99,999 | 58 (28.2%) | 35 (26.3%) |
| $100,000 to $299,999 | 88 (42.7%) | 82 (61.7%) |
| $300,000 to $499,999 | 18 (8.7%) | 12 (9.0%) |
| $500,000 to $749,999 | 0 (0.0%) | 0 (0.0%) |
| $750,000 to $999,999 | 0 (0.0%) | 0 (0.0%) |
| $1,000,000 or more | 0 (0.0%) | 0 (0.0%) |
| Total | 206 (100.0%) | 133 (100.0%) |
Household Income by Mortgage Status in Lincoln borough
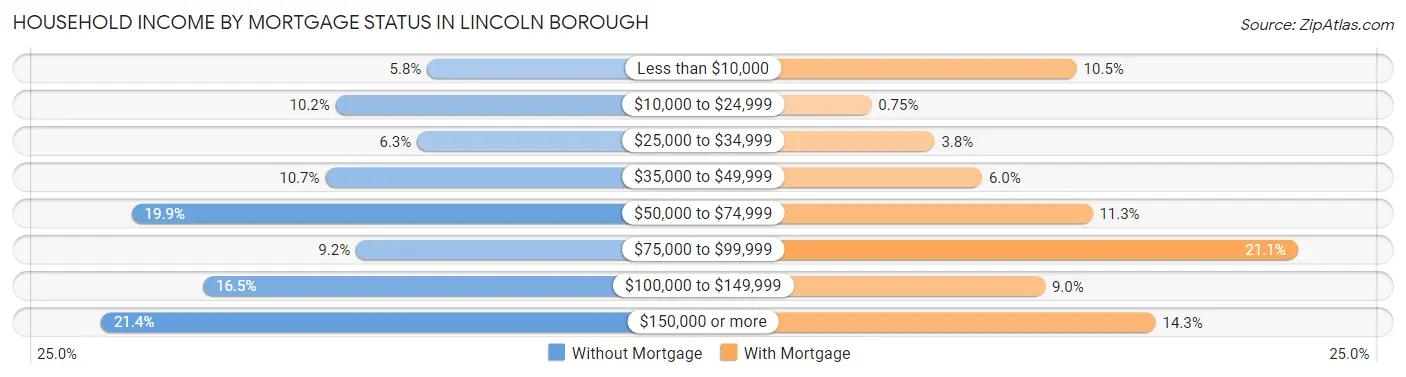
| Household Income | Without Mortgage | With Mortgage |
| Less than $10,000 | 12 (5.8%) | 14 (10.5%) |
| $10,000 to $24,999 | 21 (10.2%) | 1 (0.7%) |
| $25,000 to $34,999 | 13 (6.3%) | 5 (3.8%) |
| $35,000 to $49,999 | 22 (10.7%) | 8 (6.0%) |
| $50,000 to $74,999 | 41 (19.9%) | 15 (11.3%) |
| $75,000 to $99,999 | 19 (9.2%) | 28 (21.0%) |
| $100,000 to $149,999 | 34 (16.5%) | 12 (9.0%) |
| $150,000 or more | 44 (21.4%) | 19 (14.3%) |
| Total | 206 (100.0%) | 133 (100.0%) |
Property Value to Household Income Ratio in Lincoln borough
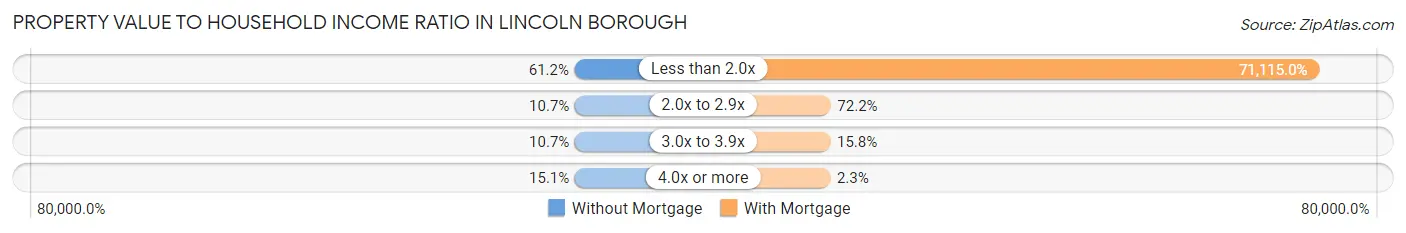
| Value-to-Income Ratio | Without Mortgage | With Mortgage |
| Less than 2.0x | 126 (61.2%) | 94,583 (71,115.0%) |
| 2.0x to 2.9x | 22 (10.7%) | 96 (72.2%) |
| 3.0x to 3.9x | 22 (10.7%) | 21 (15.8%) |
| 4.0x or more | 31 (15.0%) | 3 (2.3%) |
| Total | 206 (100.0%) | 133 (100.0%) |
Real Estate Taxes by Mortgage Status in Lincoln borough
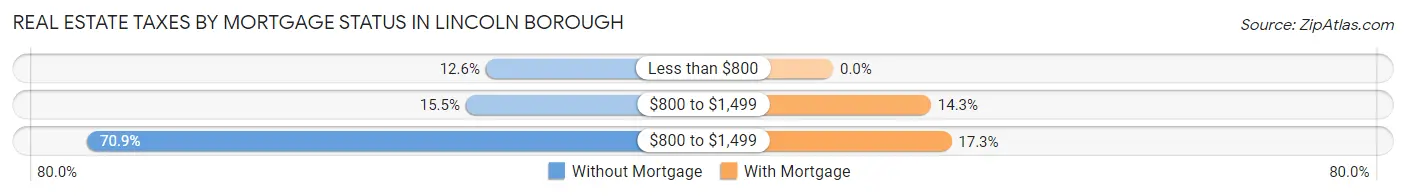
| Property Taxes | Without Mortgage | With Mortgage |
| Less than $800 | 26 (12.6%) | 0 (0.0%) |
| $800 to $1,499 | 32 (15.5%) | 19 (14.3%) |
| $800 to $1,499 | 146 (70.9%) | 23 (17.3%) |
| Total | 206 (100.0%) | 133 (100.0%) |
Health & Disability in Lincoln borough
Health Insurance Coverage by Age in Lincoln borough
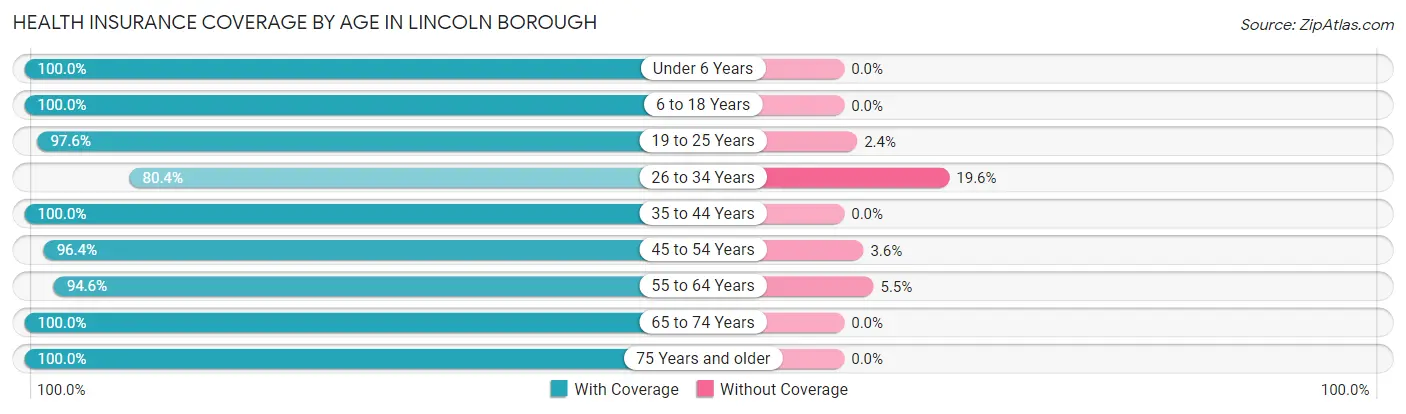
| Age Bracket | With Coverage | Without Coverage |
| Under 6 Years | 63 (100.0%) | 0 (0.0%) |
| 6 to 18 Years | 74 (100.0%) | 0 (0.0%) |
| 19 to 25 Years | 81 (97.6%) | 2 (2.4%) |
| 26 to 34 Years | 119 (80.4%) | 29 (19.6%) |
| 35 to 44 Years | 84 (100.0%) | 0 (0.0%) |
| 45 to 54 Years | 108 (96.4%) | 4 (3.6%) |
| 55 to 64 Years | 191 (94.6%) | 11 (5.4%) |
| 65 to 74 Years | 131 (100.0%) | 0 (0.0%) |
| 75 Years and older | 101 (100.0%) | 0 (0.0%) |
| Total | 952 (95.4%) | 46 (4.6%) |
Health Insurance Coverage by Citizenship Status in Lincoln borough
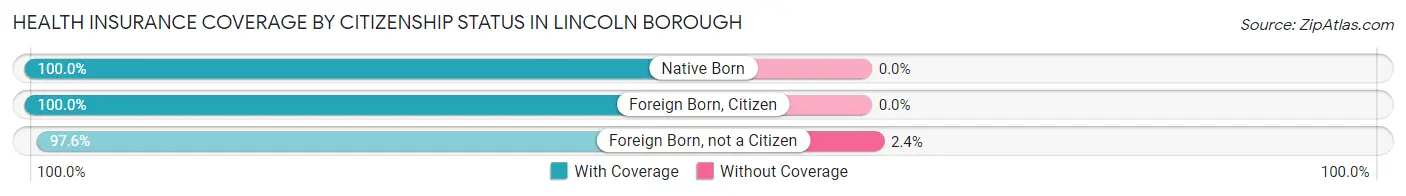
| Citizenship Status | With Coverage | Without Coverage |
| Native Born | 63 (100.0%) | 0 (0.0%) |
| Foreign Born, Citizen | 74 (100.0%) | 0 (0.0%) |
| Foreign Born, not a Citizen | 81 (97.6%) | 2 (2.4%) |
Health Insurance Coverage by Household Income in Lincoln borough
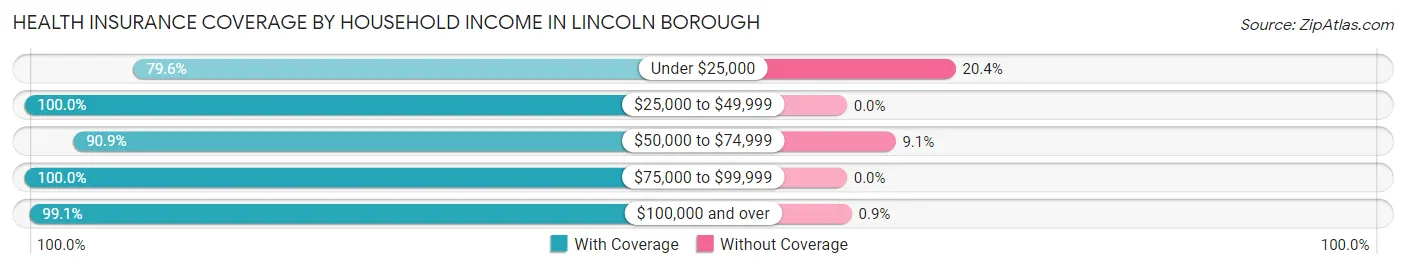
| Household Income | With Coverage | Without Coverage |
| Under $25,000 | 43 (79.6%) | 11 (20.4%) |
| $25,000 to $49,999 | 77 (100.0%) | 0 (0.0%) |
| $50,000 to $74,999 | 309 (90.9%) | 31 (9.1%) |
| $75,000 to $99,999 | 71 (100.0%) | 0 (0.0%) |
| $100,000 and over | 438 (99.1%) | 4 (0.9%) |
Public vs Private Health Insurance Coverage by Age in Lincoln borough
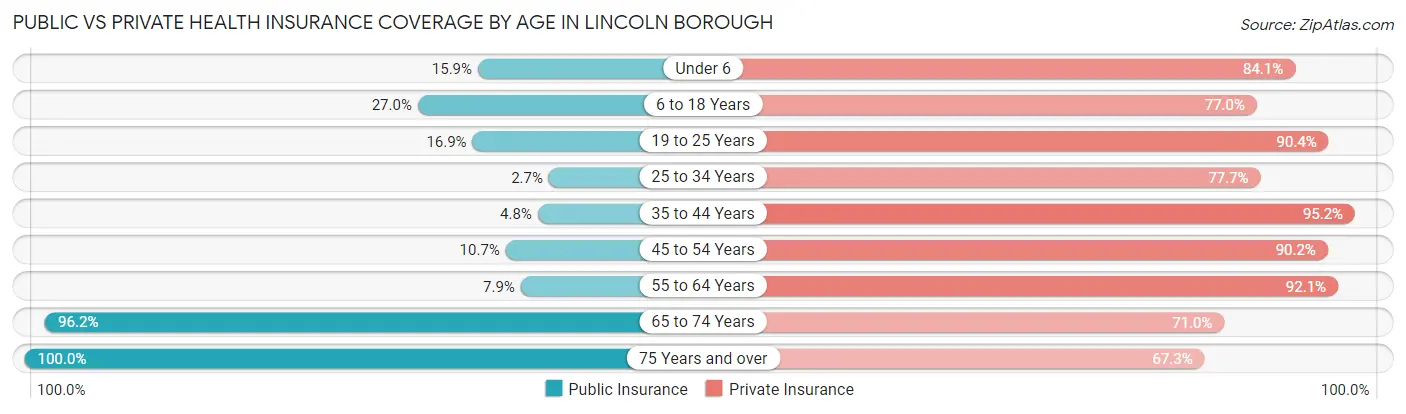
| Age Bracket | Public Insurance | Private Insurance |
| Under 6 | 10 (15.9%) | 53 (84.1%) |
| 6 to 18 Years | 20 (27.0%) | 57 (77.0%) |
| 19 to 25 Years | 14 (16.9%) | 75 (90.4%) |
| 25 to 34 Years | 4 (2.7%) | 115 (77.7%) |
| 35 to 44 Years | 4 (4.8%) | 80 (95.2%) |
| 45 to 54 Years | 12 (10.7%) | 101 (90.2%) |
| 55 to 64 Years | 16 (7.9%) | 186 (92.1%) |
| 65 to 74 Years | 126 (96.2%) | 93 (71.0%) |
| 75 Years and over | 101 (100.0%) | 68 (67.3%) |
| Total | 307 (30.8%) | 828 (83.0%) |
Disability Status by Sex by Age in Lincoln borough
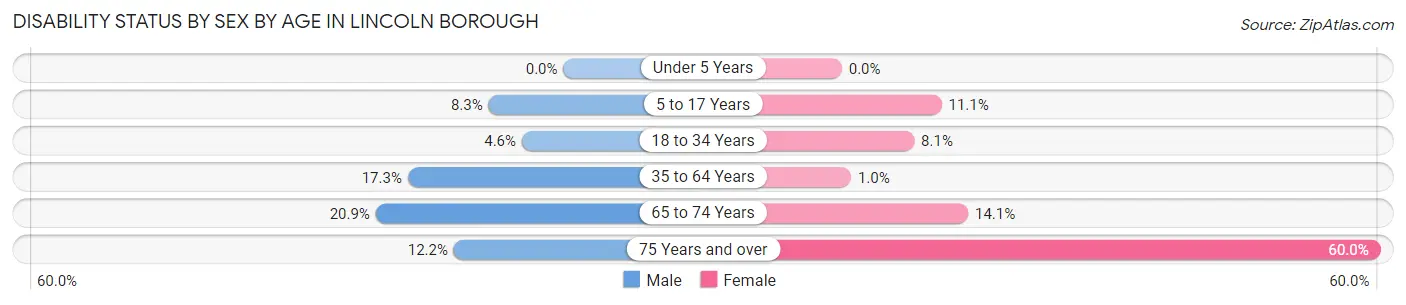
| Age Bracket | Male | Female |
| Under 5 Years | 0 (0.0%) | 0 (0.0%) |
| 5 to 17 Years | 3 (8.3%) | 4 (11.1%) |
| 18 to 34 Years | 8 (4.6%) | 5 (8.1%) |
| 35 to 64 Years | 35 (17.3%) | 2 (1.0%) |
| 65 to 74 Years | 14 (20.9%) | 9 (14.1%) |
| 75 Years and over | 5 (12.2%) | 36 (60.0%) |
Disability Class by Sex by Age in Lincoln borough
Disability Class: Hearing Difficulty
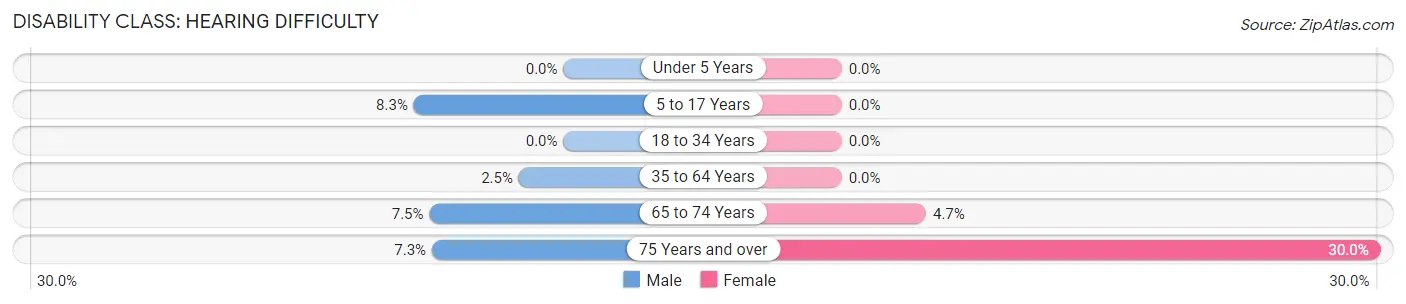
| Age Bracket | Male | Female |
| Under 5 Years | 0 (0.0%) | 0 (0.0%) |
| 5 to 17 Years | 3 (8.3%) | 0 (0.0%) |
| 18 to 34 Years | 0 (0.0%) | 0 (0.0%) |
| 35 to 64 Years | 5 (2.5%) | 0 (0.0%) |
| 65 to 74 Years | 5 (7.5%) | 3 (4.7%) |
| 75 Years and over | 3 (7.3%) | 18 (30.0%) |
Disability Class: Vision Difficulty
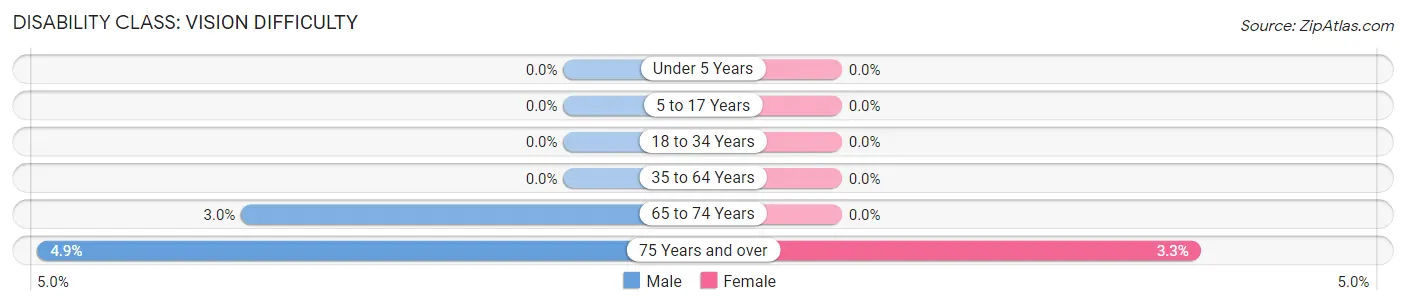
| Age Bracket | Male | Female |
| Under 5 Years | 0 (0.0%) | 0 (0.0%) |
| 5 to 17 Years | 0 (0.0%) | 0 (0.0%) |
| 18 to 34 Years | 0 (0.0%) | 0 (0.0%) |
| 35 to 64 Years | 0 (0.0%) | 0 (0.0%) |
| 65 to 74 Years | 2 (3.0%) | 0 (0.0%) |
| 75 Years and over | 2 (4.9%) | 2 (3.3%) |
Disability Class: Cognitive Difficulty
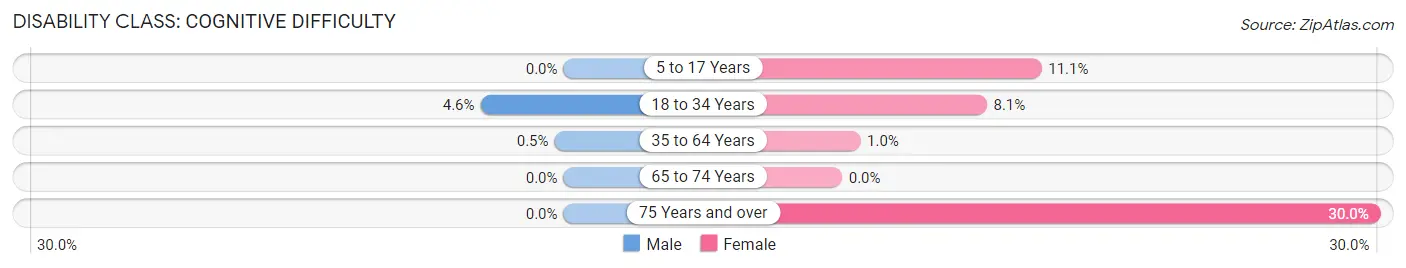
| Age Bracket | Male | Female |
| 5 to 17 Years | 0 (0.0%) | 4 (11.1%) |
| 18 to 34 Years | 8 (4.6%) | 5 (8.1%) |
| 35 to 64 Years | 1 (0.5%) | 2 (1.0%) |
| 65 to 74 Years | 0 (0.0%) | 0 (0.0%) |
| 75 Years and over | 0 (0.0%) | 18 (30.0%) |
Disability Class: Ambulatory Difficulty
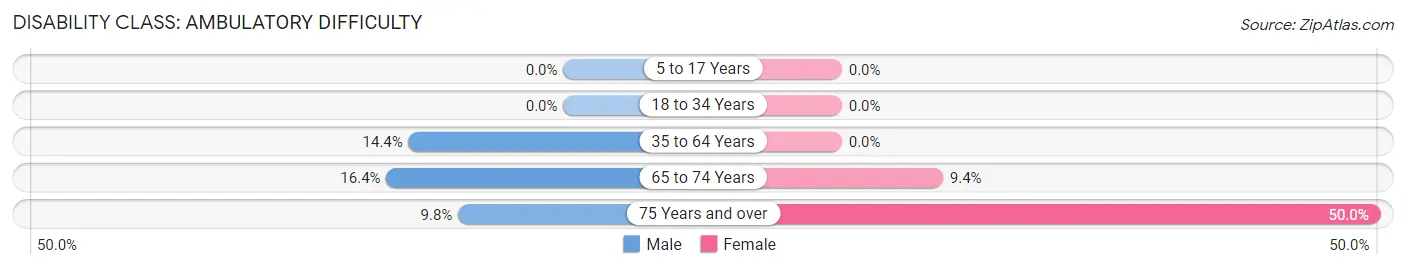
| Age Bracket | Male | Female |
| 5 to 17 Years | 0 (0.0%) | 0 (0.0%) |
| 18 to 34 Years | 0 (0.0%) | 0 (0.0%) |
| 35 to 64 Years | 29 (14.4%) | 0 (0.0%) |
| 65 to 74 Years | 11 (16.4%) | 6 (9.4%) |
| 75 Years and over | 4 (9.8%) | 30 (50.0%) |
Disability Class: Self-Care Difficulty
| Age Bracket | Male | Female |
| 5 to 17 Years | 0 (0.0%) | 0 (0.0%) |
| 18 to 34 Years | 0 (0.0%) | 0 (0.0%) |
| 35 to 64 Years | 3 (1.5%) | 0 (0.0%) |
| 65 to 74 Years | 0 (0.0%) | 0 (0.0%) |
| 75 Years and over | 2 (4.9%) | 19 (31.7%) |
Technology Access in Lincoln borough
Computing Device Access in Lincoln borough
| Device Type | # Households | % Households |
| Desktop or Laptop | 326 | 76.3% |
| Smartphone | 329 | 77.0% |
| Tablet | 247 | 57.9% |
| No Computing Device | 42 | 9.8% |
| Total | 427 | 100.0% |
Internet Access in Lincoln borough
| Internet Type | # Households | % Households |
| Dial-Up Internet | 0 | 0.0% |
| Broadband Home | 315 | 73.8% |
| Cellular Data Only | 36 | 8.4% |
| Satellite Internet | 5 | 1.2% |
| No Internet | 70 | 16.4% |
| Total | 427 | 100.0% |
Lincoln borough Summary
Lincoln Borough is a small borough located in Allegheny County, Pennsylvania. It is situated in the western part of the county, just south of the city of Pittsburgh. The borough was incorporated in 1868 and is home to approximately 1,400 people.
Geography
Lincoln Borough is located in the western part of Allegheny County, Pennsylvania. It is situated just south of the city of Pittsburgh and is bordered by the boroughs of West View, Ross Township, and Bellevue. The borough is approximately 1.5 square miles in size and is situated at an elevation of 890 feet above sea level. The borough is located in the Allegheny Plateau region of Pennsylvania and is characterized by rolling hills and valleys. The borough is drained by the Ohio River and its tributaries, including the Allegheny River and the Beaver River.
Economy
The economy of Lincoln Borough is largely based on the service industry. The borough is home to a variety of small businesses, including restaurants, retail stores, and professional services. The borough is also home to a number of manufacturing companies, including a steel mill and a paper mill. The borough is also home to a number of educational institutions, including a community college and a technical school.
Demographics
As of the 2010 census, the population of Lincoln Borough was 1,400. The racial makeup of the borough was 94.3% White, 2.3% African American, 0.3% Native American, 0.7% Asian, 0.1% Pacific Islander, and 2.3% from other races. The median household income in the borough was $37,500, and the median family income was $45,000. The per capita income in the borough was $19,000.
History
Lincoln Borough was incorporated in 1868. The borough was named after President Abraham Lincoln, who had been assassinated in 1865. The borough was originally a farming community, but it began to grow in the late 19th century as the steel industry began to expand in the region. The borough was home to a number of steel mills, which provided employment for many of the borough's residents. The borough also became home to a number of educational institutions, including a community college and a technical school. The borough continued to grow throughout the 20th century, and today it is a vibrant community with a diverse economy.
Common Questions
What is the Total Population of Lincoln borough?
Total Population of Lincoln borough is 998.
What is the Total Male Population of Lincoln borough?
Total Male Population of Lincoln borough is 566.
What is the Total Female Population of Lincoln borough?
Total Female Population of Lincoln borough is 432.
What is the Ratio of Males per 100 Females in Lincoln borough?
There are 131.02 Males per 100 Females in Lincoln borough.
What is the Ratio of Females per 100 Males in Lincoln borough?
There are 76.33 Females per 100 Males in Lincoln borough.
What is the Median Population Age in Lincoln borough?
Median Population Age in Lincoln borough is 49.5 Years.
What is the Average Family Size in Lincoln borough
Average Family Size in Lincoln borough is 3.1 People.
What is the Average Household Size in Lincoln borough
Average Household Size in Lincoln borough is 2.3 People.
What is Per Capita Income in Lincoln borough?
Per Capita income in Lincoln borough is $45,747.
What is the Median Family Income in Lincoln borough?
Median Family Income in Lincoln borough is $102,500.
What is the Median Household income in Lincoln borough?
Median Household Income in Lincoln borough is $73,203.
What is Income or Wage Gap in Lincoln borough?
Income or Wage Gap in Lincoln borough is 47.4%.
Women in Lincoln borough earn 52.6 cents for every dollar earned by a man.
What is Inequality or Gini Index in Lincoln borough?
Inequality or Gini Index in Lincoln borough is 0.45.
How Large is the Labor Force in Lincoln borough?
There are 530 People in the Labor Forcein in Lincoln borough.
What is the Percentage of People in the Labor Force in Lincoln borough?
60.1% of People are in the Labor Force in Lincoln borough.
What is the Unemployment Rate in Lincoln borough?
Unemployment Rate in Lincoln borough is 3.6%.