Lilly borough, PA
Lilly borough Overview
777
TOTAL POPULATION
365
MALE POPULATION
412
FEMALE POPULATION
88.59
MALES / 100 FEMALES
112.88
FEMALES / 100 MALES
42.4
MEDIAN AGE
2.7
AVG FAMILY SIZE
2.4
AVG HOUSEHOLD SIZE
$27,291
PER CAPITA INCOME
$60,625
AVG FAMILY INCOME
$54,250
AVG HOUSEHOLD INCOME
37.3%
WAGE / INCOME GAP [ % ]
62.7¢/ $1
WAGE / INCOME GAP [ $ ]
0.37
INEQUALITY / GINI INDEX
343
LABOR FORCE [ PEOPLE ]
55.4%
PERCENT IN LABOR FORCE
6.1%
UNEMPLOYMENT RATE
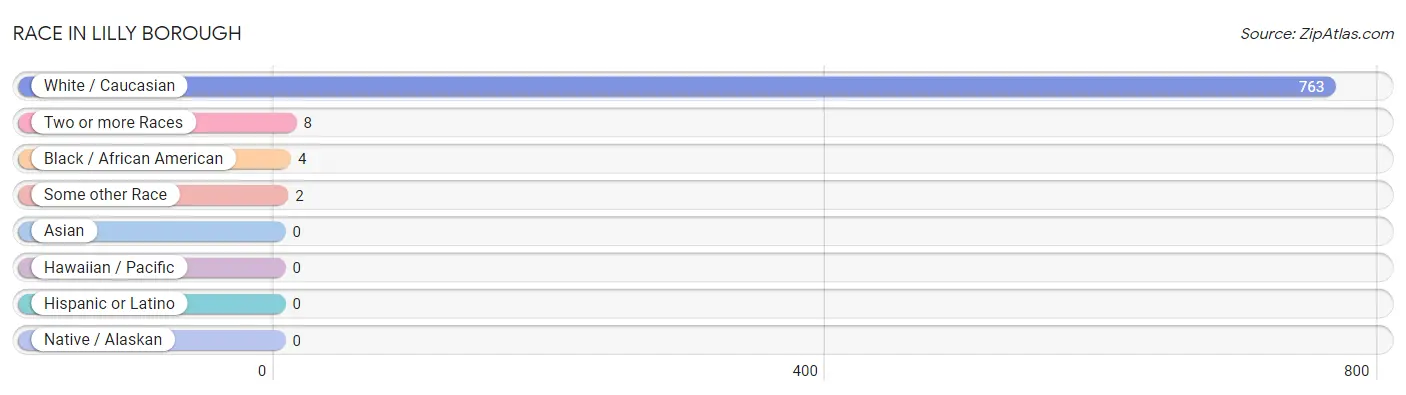
Race in Lilly borough
The most populous races in Lilly borough are White / Caucasian (763 | 98.2%), Two or more Races (8 | 1.0%), and Black / African American (4 | 0.5%).
| Race | # Population | % Population |
| Asian | 0 | 0.0% |
| Black / African American | 4 | 0.5% |
| Hawaiian / Pacific | 0 | 0.0% |
| Hispanic or Latino | 0 | 0.0% |
| Native / Alaskan | 0 | 0.0% |
| White / Caucasian | 763 | 98.2% |
| Two or more Races | 8 | 1.0% |
| Some other Race | 2 | 0.3% |
| Total | 777 | 100.0% |
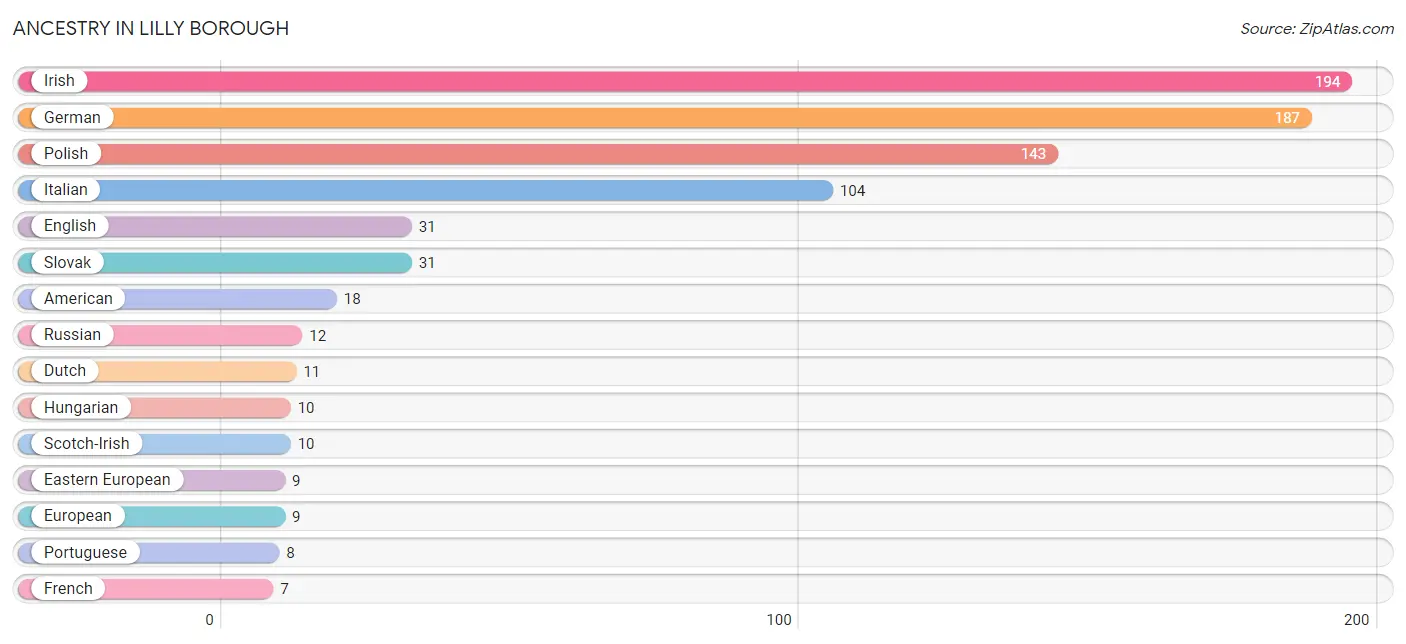
Ancestry in Lilly borough
The most populous ancestries reported in Lilly borough are Irish (194 | 25.0%), German (187 | 24.1%), Polish (143 | 18.4%), Italian (104 | 13.4%), and English (31 | 4.0%), together accounting for 84.8% of all Lilly borough residents.
| Ancestry | # Population | % Population |
| American | 18 | 2.3% |
| Austrian | 2 | 0.3% |
| Dutch | 11 | 1.4% |
| Eastern European | 9 | 1.2% |
| English | 31 | 4.0% |
| European | 9 | 1.2% |
| French | 7 | 0.9% |
| German | 187 | 24.1% |
| Hungarian | 10 | 1.3% |
| Irish | 194 | 25.0% |
| Italian | 104 | 13.4% |
| Lithuanian | 6 | 0.8% |
| Polish | 143 | 18.4% |
| Portuguese | 8 | 1.0% |
| Russian | 12 | 1.5% |
| Scotch-Irish | 10 | 1.3% |
| Scottish | 5 | 0.6% |
| Slavic | 6 | 0.8% |
| Slovak | 31 | 4.0% |
| Swiss | 3 | 0.4% |
| Welsh | 5 | 0.6% | View All 21 Rows |
Immigrants in Lilly borough

| Immigration Origin | # Population | % Population | View All 0 Rows |
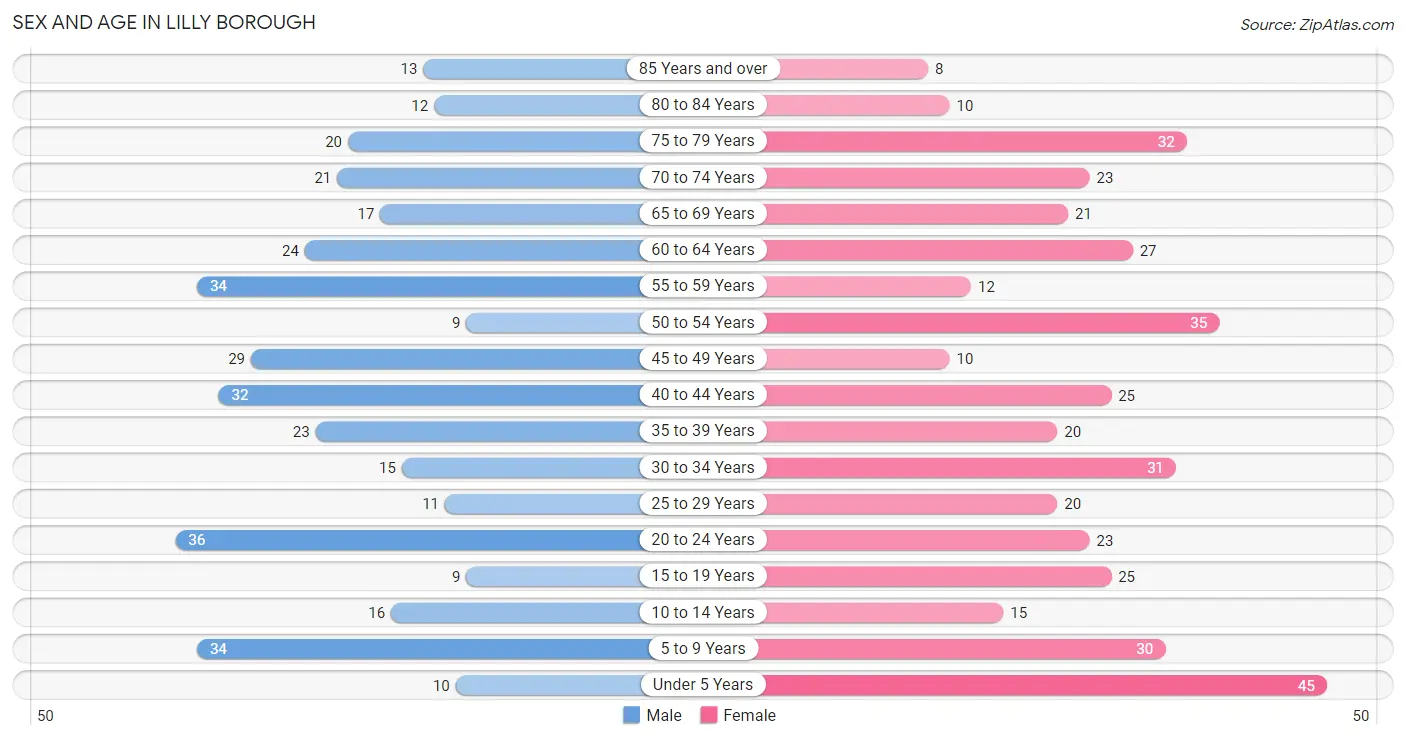
Sex and Age in Lilly borough
Sex and Age in Lilly borough
The most populous age groups in Lilly borough are 20 to 24 Years (36 | 9.9%) for men and Under 5 Years (45 | 10.9%) for women.
| Age Bracket | Male | Female |
| Under 5 Years | 10 (2.7%) | 45 (10.9%) |
| 5 to 9 Years | 34 (9.3%) | 30 (7.3%) |
| 10 to 14 Years | 16 (4.4%) | 15 (3.6%) |
| 15 to 19 Years | 9 (2.5%) | 25 (6.1%) |
| 20 to 24 Years | 36 (9.9%) | 23 (5.6%) |
| 25 to 29 Years | 11 (3.0%) | 20 (4.9%) |
| 30 to 34 Years | 15 (4.1%) | 31 (7.5%) |
| 35 to 39 Years | 23 (6.3%) | 20 (4.9%) |
| 40 to 44 Years | 32 (8.8%) | 25 (6.1%) |
| 45 to 49 Years | 29 (8.0%) | 10 (2.4%) |
| 50 to 54 Years | 9 (2.5%) | 35 (8.5%) |
| 55 to 59 Years | 34 (9.3%) | 12 (2.9%) |
| 60 to 64 Years | 24 (6.6%) | 27 (6.6%) |
| 65 to 69 Years | 17 (4.7%) | 21 (5.1%) |
| 70 to 74 Years | 21 (5.8%) | 23 (5.6%) |
| 75 to 79 Years | 20 (5.5%) | 32 (7.8%) |
| 80 to 84 Years | 12 (3.3%) | 10 (2.4%) |
| 85 Years and over | 13 (3.6%) | 8 (1.9%) |
| Total | 365 (100.0%) | 412 (100.0%) |
Families and Households in Lilly borough
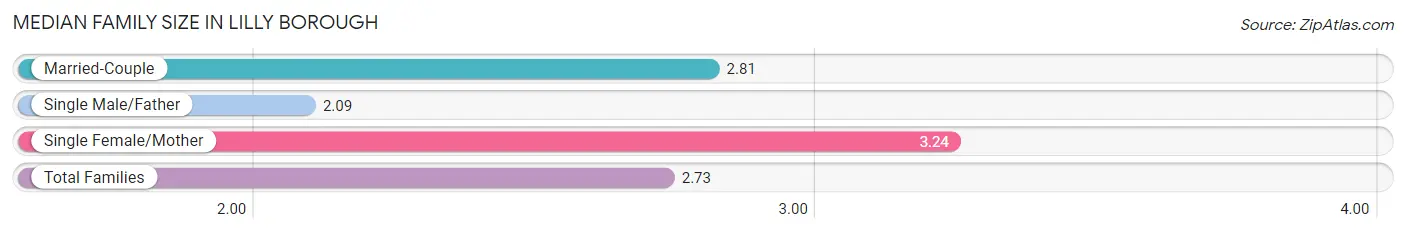
Median Family Size in Lilly borough
The median family size in Lilly borough is 2.73 persons per family, with single female/mother families (37 | 16.8%) accounting for the largest median family size of 3.24 persons per family. On the other hand, single male/father families (46 | 20.9%) represent the smallest median family size with 2.09 persons per family.
| Family Type | # Families | Family Size |
| Married-Couple | 137 (62.3%) | 2.81 |
| Single Male/Father | 46 (20.9%) | 2.09 |
| Single Female/Mother | 37 (16.8%) | 3.24 |
| Total Families | 220 (100.0%) | 2.73 |
Median Household Size in Lilly borough
The median household size in Lilly borough is 2.36 persons per household, with single female/mother households (37 | 11.4%) accounting for the largest median household size of 3.49 persons per household. non-family households (106 | 32.5%) represent the smallest median household size with 1.16 persons per household.
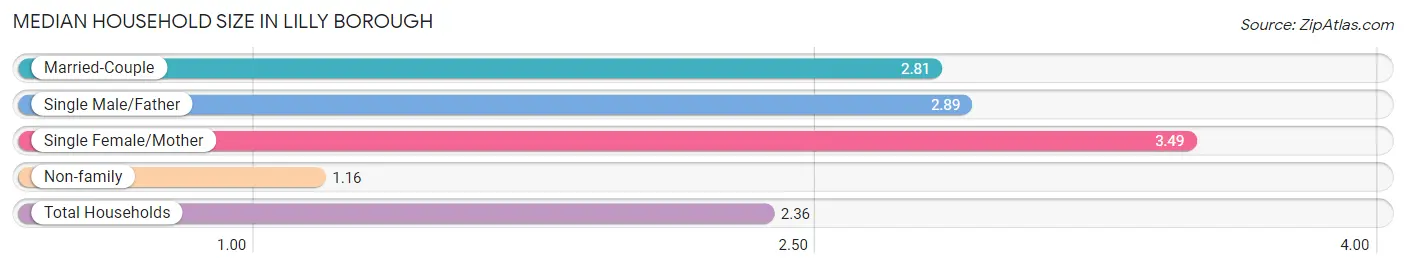
| Household Type | # Households | Household Size |
| Married-Couple | 137 (42.0%) | 2.81 |
| Single Male/Father | 46 (14.1%) | 2.89 |
| Single Female/Mother | 37 (11.4%) | 3.49 |
| Non-family | 106 (32.5%) | 1.16 |
| Total Households | 326 (100.0%) | 2.36 |
Household Size by Marriage Status in Lilly borough
Out of a total of 326 households in Lilly borough, 220 (67.5%) are family households, while 106 (32.5%) are nonfamily households. The most numerous type of family households are 2-person households, comprising 106, and the most common type of nonfamily households are 1-person households, comprising 92.
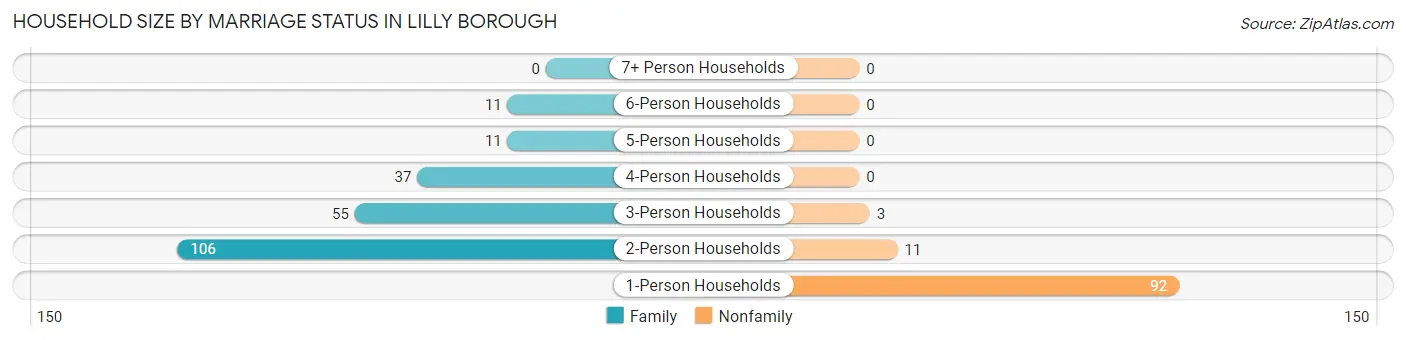
| Household Size | Family Households | Nonfamily Households |
| 1-Person Households | - | 92 (28.2%) |
| 2-Person Households | 106 (32.5%) | 11 (3.4%) |
| 3-Person Households | 55 (16.9%) | 3 (0.9%) |
| 4-Person Households | 37 (11.4%) | 0 (0.0%) |
| 5-Person Households | 11 (3.4%) | 0 (0.0%) |
| 6-Person Households | 11 (3.4%) | 0 (0.0%) |
| 7+ Person Households | 0 (0.0%) | 0 (0.0%) |
| Total | 220 (67.5%) | 106 (32.5%) |
Female Fertility in Lilly borough
Fertility by Age in Lilly borough
Average fertility rate in Lilly borough is 165.0 births per 1,000 women. Women in the age bracket of 20 to 34 years have the highest fertility rate with 297.0 births per 1,000 women. Women in the age bracket of 20 to 34 years acount for 81.5% of all women with births.
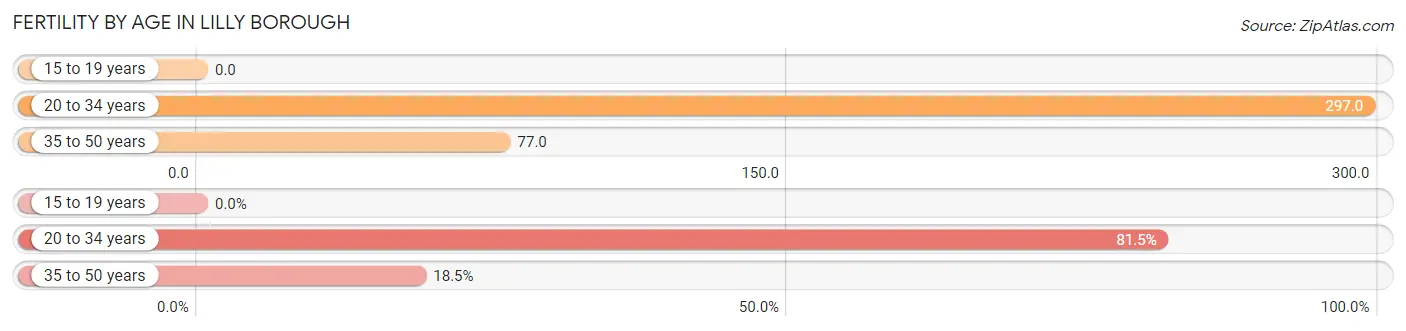
| Age Bracket | Women with Births | Births / 1,000 Women |
| 15 to 19 years | 0 (0.0%) | 0.0 |
| 20 to 34 years | 22 (81.5%) | 297.0 |
| 35 to 50 years | 5 (18.5%) | 77.0 |
| Total | 27 (100.0%) | 165.0 |
Fertility by Age by Marriage Status in Lilly borough
63.0% of women with births (27) in Lilly borough are married. The highest percentage of unmarried women with births falls into 20 to 34 years age bracket with 45.5% of them unmarried at the time of birth, while the lowest percentage of unmarried women with births belong to 35 to 50 years age bracket with 0.0% of them unmarried.
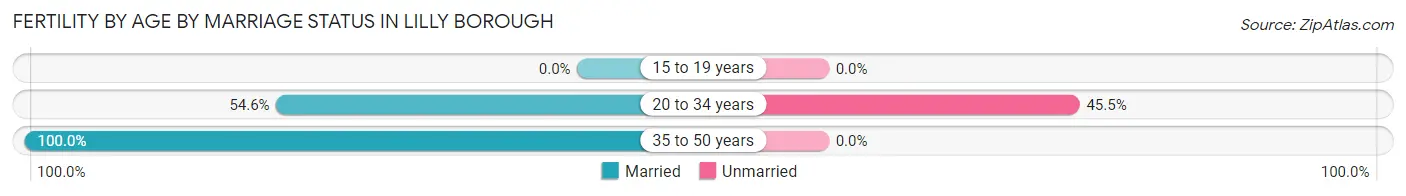
| Age Bracket | Married | Unmarried |
| 15 to 19 years | 0 (0.0%) | 0 (0.0%) |
| 20 to 34 years | 12 (54.5%) | 10 (45.5%) |
| 35 to 50 years | 5 (100.0%) | 0 (0.0%) |
| Total | 17 (63.0%) | 10 (37.0%) |
Fertility by Education in Lilly borough
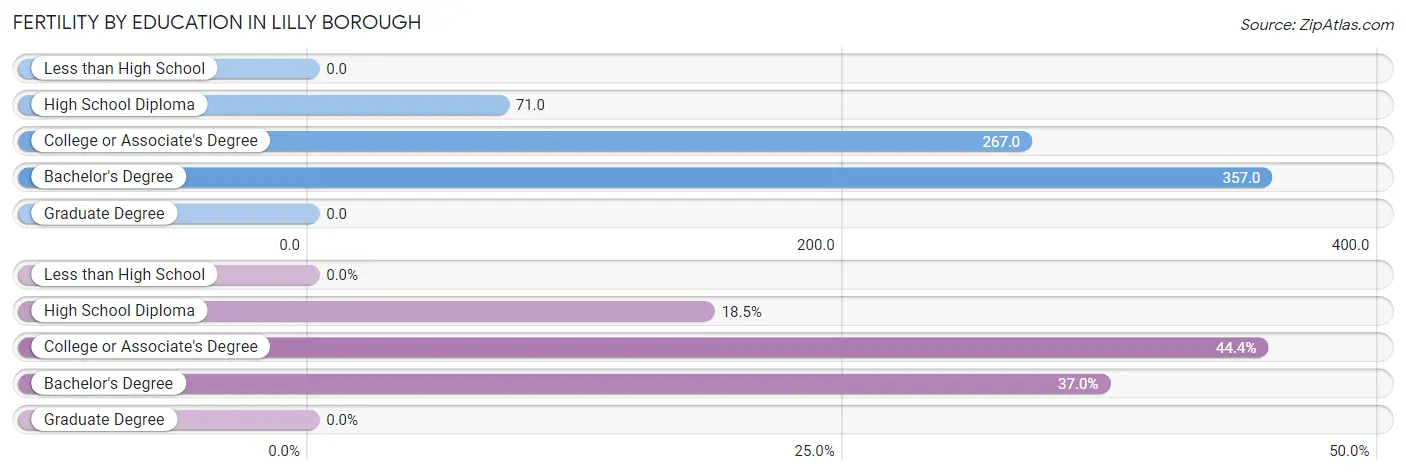
| Educational Attainment | Women with Births | Births / 1,000 Women |
| Less than High School | 0 (0.0%) | 0.0 |
| High School Diploma | 5 (18.5%) | 71.0 |
| College or Associate's Degree | 12 (44.4%) | 267.0 |
| Bachelor's Degree | 10 (37.0%) | 357.0 |
| Graduate Degree | 0 (0.0%) | 0.0 |
| Total | 27 (100.0%) | 165.0 |
Fertility by Education by Marriage Status in Lilly borough
37.0% of women with births in Lilly borough are unmarried. Women with the educational attainment of high school diploma are most likely to be married with 100.0% of them married at childbirth, while women with the educational attainment of bachelor's degree are least likely to be married with 100.0% of them unmarried at childbirth.
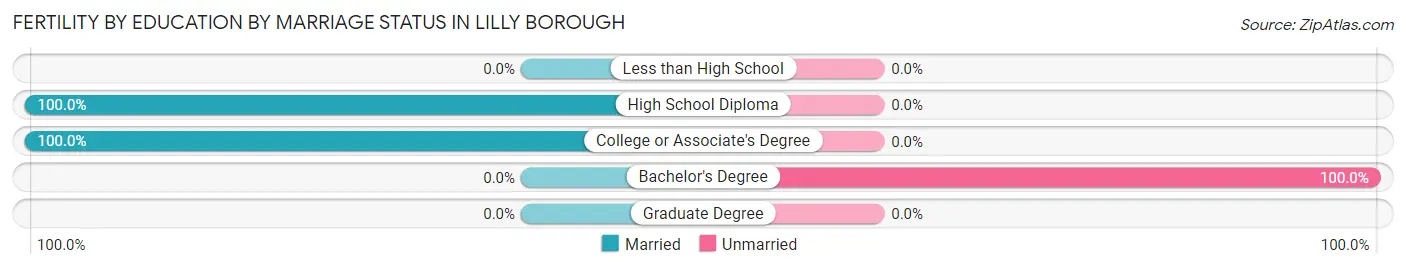
| Educational Attainment | Married | Unmarried |
| Less than High School | 0 (0.0%) | 0 (0.0%) |
| High School Diploma | 5 (100.0%) | 0 (0.0%) |
| College or Associate's Degree | 12 (100.0%) | 0 (0.0%) |
| Bachelor's Degree | 0 (0.0%) | 10 (100.0%) |
| Graduate Degree | 0 (0.0%) | 0 (0.0%) |
| Total | 17 (63.0%) | 10 (37.0%) |
Income in Lilly borough
Income Overview in Lilly borough
Per Capita Income in Lilly borough is $27,291, while median incomes of families and households are $60,625 and $54,250 respectively.
| Characteristic | Number | Measure |
| Per Capita Income | 777 | $27,291 |
| Median Family Income | 220 | $60,625 |
| Mean Family Income | 220 | $72,763 |
| Median Household Income | 326 | $54,250 |
| Mean Household Income | 326 | $64,478 |
| Income Deficit | 220 | $0 |
| Wage / Income Gap (%) | 777 | 37.27% |
| Wage / Income Gap ($) | 777 | 62.73¢ per $1 |
| Gini / Inequality Index | 777 | 0.37 |
Earnings by Sex in Lilly borough
Average Earnings in Lilly borough are $34,188, $40,250 for men and $25,250 for women, a difference of 37.3%.
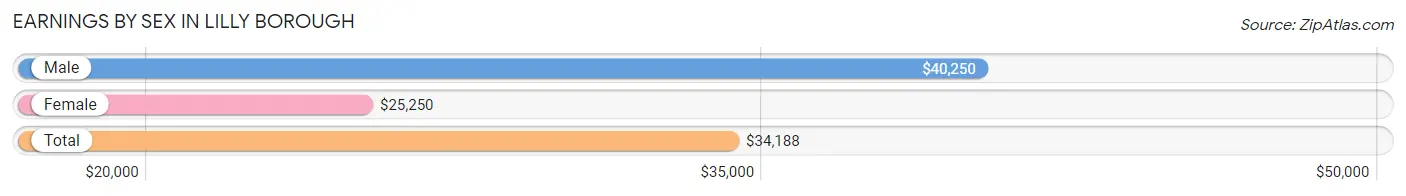
| Sex | Number | Average Earnings |
| Male | 190 (53.2%) | $40,250 |
| Female | 167 (46.8%) | $25,250 |
| Total | 357 (100.0%) | $34,188 |
Earnings by Sex by Income Bracket in Lilly borough
The most common earnings brackets in Lilly borough are $25,000 to $29,999 for men (22 | 11.6%) and $2,499 or less for women (23 | 13.8%).
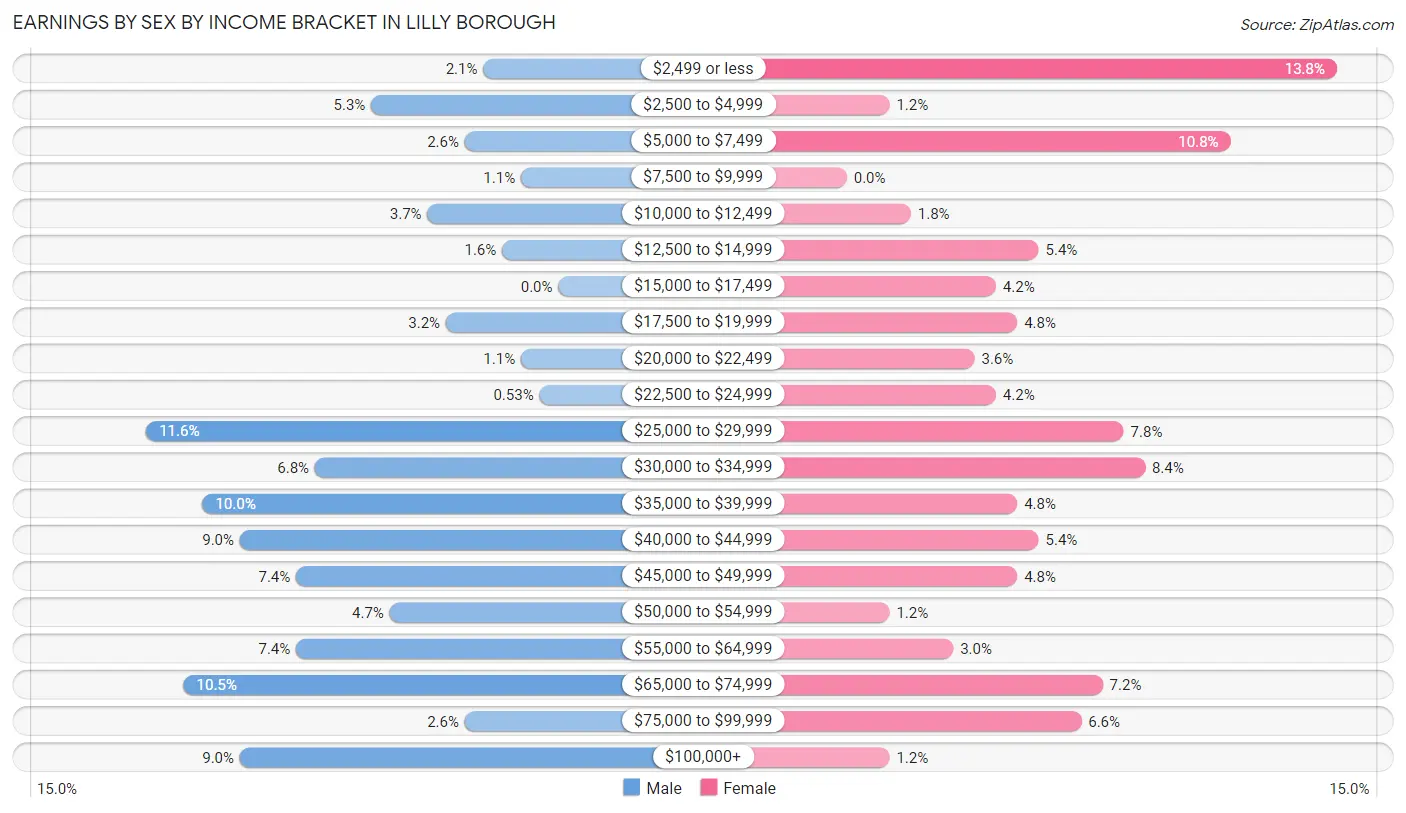
| Income | Male | Female |
| $2,499 or less | 4 (2.1%) | 23 (13.8%) |
| $2,500 to $4,999 | 10 (5.3%) | 2 (1.2%) |
| $5,000 to $7,499 | 5 (2.6%) | 18 (10.8%) |
| $7,500 to $9,999 | 2 (1.1%) | 0 (0.0%) |
| $10,000 to $12,499 | 7 (3.7%) | 3 (1.8%) |
| $12,500 to $14,999 | 3 (1.6%) | 9 (5.4%) |
| $15,000 to $17,499 | 0 (0.0%) | 7 (4.2%) |
| $17,500 to $19,999 | 6 (3.2%) | 8 (4.8%) |
| $20,000 to $22,499 | 2 (1.1%) | 6 (3.6%) |
| $22,500 to $24,999 | 1 (0.5%) | 7 (4.2%) |
| $25,000 to $29,999 | 22 (11.6%) | 13 (7.8%) |
| $30,000 to $34,999 | 13 (6.8%) | 14 (8.4%) |
| $35,000 to $39,999 | 19 (10.0%) | 8 (4.8%) |
| $40,000 to $44,999 | 17 (8.9%) | 9 (5.4%) |
| $45,000 to $49,999 | 14 (7.4%) | 8 (4.8%) |
| $50,000 to $54,999 | 9 (4.7%) | 2 (1.2%) |
| $55,000 to $64,999 | 14 (7.4%) | 5 (3.0%) |
| $65,000 to $74,999 | 20 (10.5%) | 12 (7.2%) |
| $75,000 to $99,999 | 5 (2.6%) | 11 (6.6%) |
| $100,000+ | 17 (8.9%) | 2 (1.2%) |
| Total | 190 (100.0%) | 167 (100.0%) |
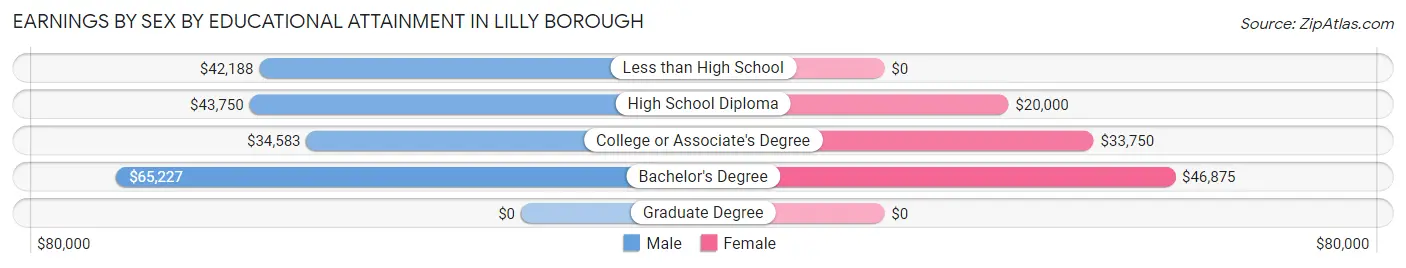
Earnings by Sex by Educational Attainment in Lilly borough
Average earnings in Lilly borough are $44,821 for men and $29,531 for women, a difference of 34.1%. Men with an educational attainment of bachelor's degree enjoy the highest average annual earnings of $65,227, while those with college or associate's degree education earn the least with $34,583. Women with an educational attainment of bachelor's degree earn the most with the average annual earnings of $46,875, while those with high school diploma education have the smallest earnings of $20,000.
| Educational Attainment | Male Income | Female Income |
| Less than High School | $42,188 | $0 |
| High School Diploma | $43,750 | $20,000 |
| College or Associate's Degree | $34,583 | $33,750 |
| Bachelor's Degree | $65,227 | $46,875 |
| Graduate Degree | - | - |
| Total | $44,821 | $29,531 |
Family Income in Lilly borough
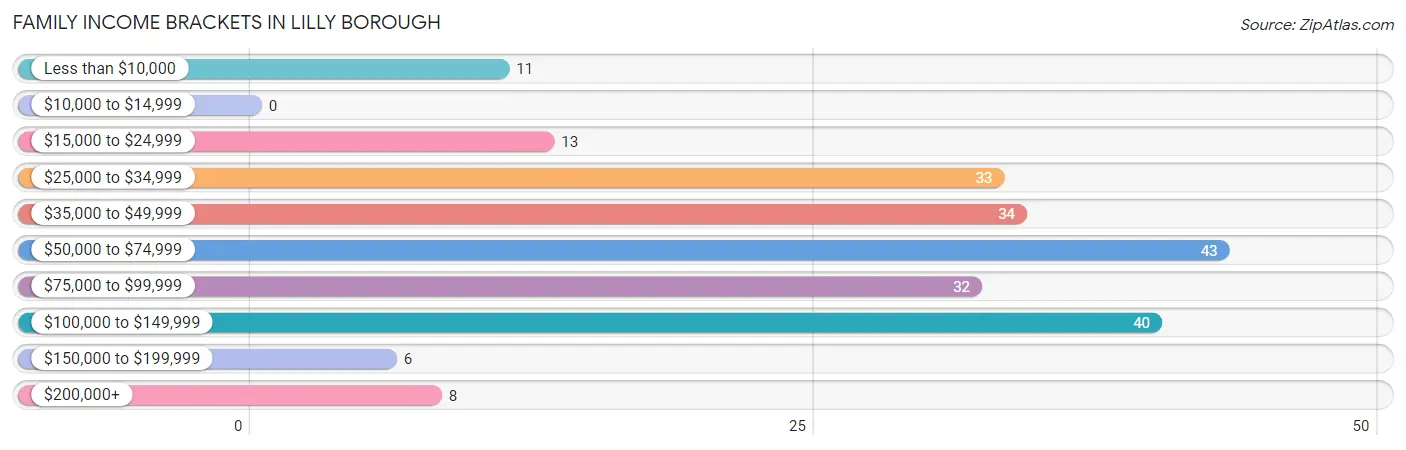
Family Income Brackets in Lilly borough
According to the Lilly borough family income data, there are 43 families falling into the $50,000 to $74,999 income range, which is the most common income bracket and makes up 19.6% of all families.
| Income Bracket | # Families | % Families |
| Less than $10,000 | 11 | 5.0% |
| $10,000 to $14,999 | 0 | 0.0% |
| $15,000 to $24,999 | 13 | 5.9% |
| $25,000 to $34,999 | 33 | 15.0% |
| $35,000 to $49,999 | 34 | 15.5% |
| $50,000 to $74,999 | 43 | 19.5% |
| $75,000 to $99,999 | 32 | 14.5% |
| $100,000 to $149,999 | 40 | 18.2% |
| $150,000 to $199,999 | 6 | 2.7% |
| $200,000+ | 8 | 3.6% |
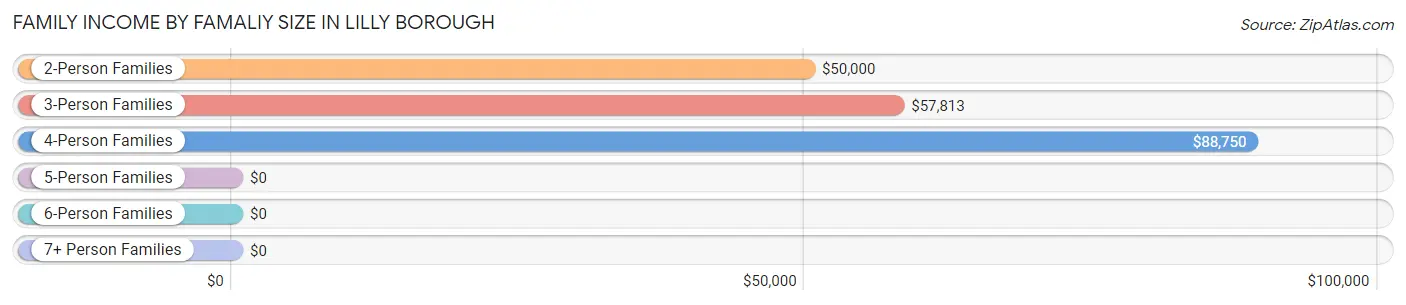
Family Income by Famaliy Size in Lilly borough
4-person families (37 | 16.8%) account for the highest median family income in Lilly borough with $88,750 per family, while 2-person families (136 | 61.8%) have the highest median income of $25,000 per family member.
| Income Bracket | # Families | Median Income |
| 2-Person Families | 136 (61.8%) | $50,000 |
| 3-Person Families | 33 (15.0%) | $57,813 |
| 4-Person Families | 37 (16.8%) | $88,750 |
| 5-Person Families | 10 (4.5%) | $0 |
| 6-Person Families | 4 (1.8%) | $0 |
| 7+ Person Families | 0 (0.0%) | $0 |
| Total | 220 (100.0%) | $60,625 |
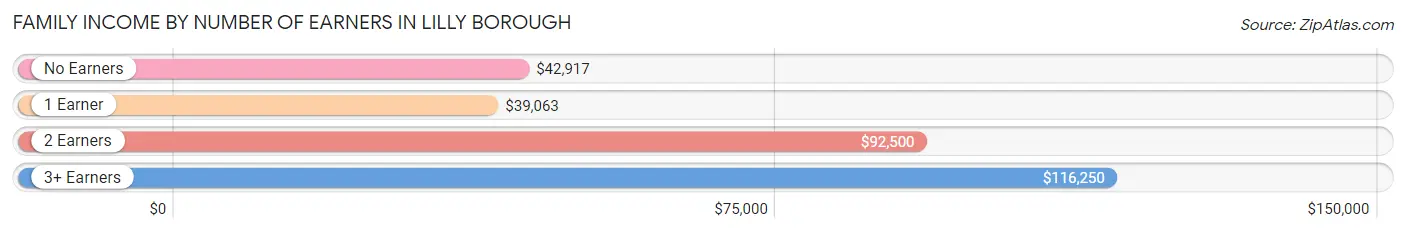
Family Income by Number of Earners in Lilly borough
The median family income in Lilly borough is $60,625, with families comprising 3+ earners (14) having the highest median family income of $116,250, while families with 1 earner (99) have the lowest median family income of $39,063, accounting for 6.4% and 45.0% of families, respectively.
| Number of Earners | # Families | Median Income |
| No Earners | 47 (21.4%) | $42,917 |
| 1 Earner | 99 (45.0%) | $39,063 |
| 2 Earners | 60 (27.3%) | $92,500 |
| 3+ Earners | 14 (6.4%) | $116,250 |
| Total | 220 (100.0%) | $60,625 |
Household Income in Lilly borough
Household Income Brackets in Lilly borough
With 77 households falling in the category, the $50,000 to $74,999 income range is the most frequent in Lilly borough, accounting for 23.6% of all households. In contrast, only 6 households (1.8%) fall into the $150,000 to $199,999 income bracket, making it the least populous group.
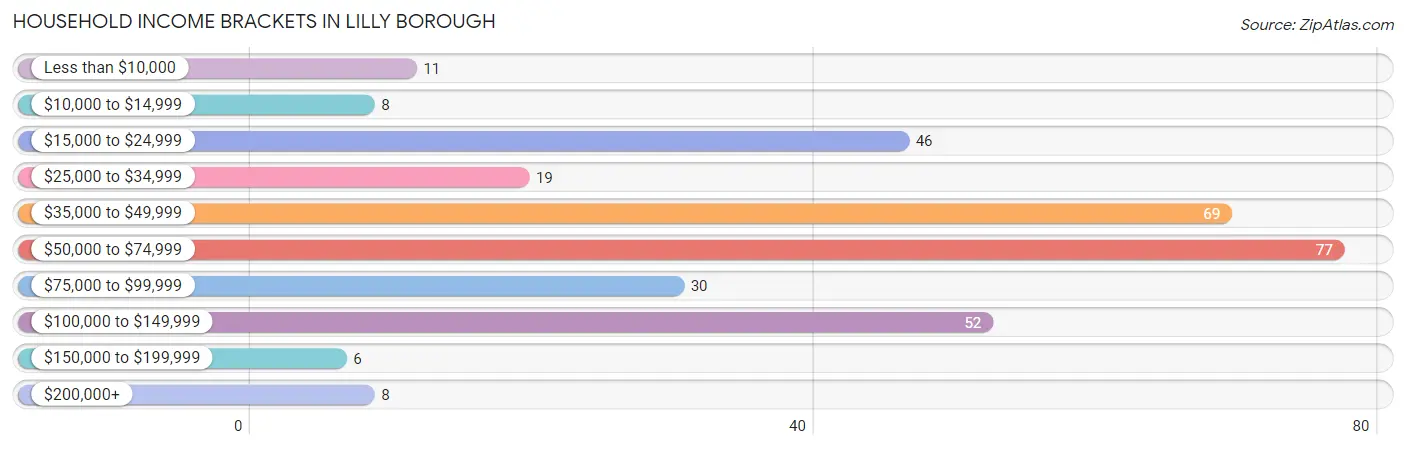
| Income Bracket | # Households | % Households |
| Less than $10,000 | 11 | 3.4% |
| $10,000 to $14,999 | 8 | 2.5% |
| $15,000 to $24,999 | 46 | 14.1% |
| $25,000 to $34,999 | 19 | 5.8% |
| $35,000 to $49,999 | 69 | 21.2% |
| $50,000 to $74,999 | 77 | 23.6% |
| $75,000 to $99,999 | 30 | 9.2% |
| $100,000 to $149,999 | 52 | 16.0% |
| $150,000 to $199,999 | 6 | 1.8% |
| $200,000+ | 8 | 2.5% |
Household Income by Householder Age in Lilly borough
The median household income in Lilly borough is $54,250, with the highest median household income of $74,167 found in the 45 to 64 years age bracket for the primary householder. A total of 96 households (29.4%) fall into this category. Meanwhile, the 15 to 24 years age bracket for the primary householder has the lowest median household income of $0, with 21 households (6.4%) in this group.
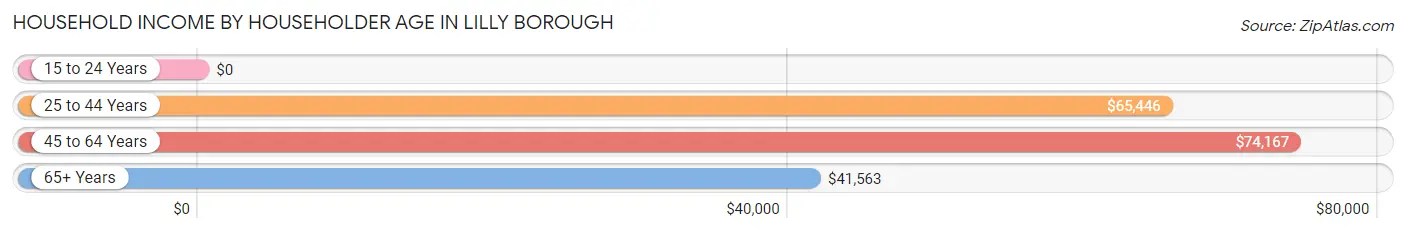
| Income Bracket | # Households | Median Income |
| 15 to 24 Years | 21 (6.4%) | $0 |
| 25 to 44 Years | 93 (28.5%) | $65,446 |
| 45 to 64 Years | 96 (29.4%) | $74,167 |
| 65+ Years | 116 (35.6%) | $41,563 |
| Total | 326 (100.0%) | $54,250 |
Poverty in Lilly borough
Income Below Poverty by Sex and Age in Lilly borough
With 7.0% poverty level for males and 13.6% for females among the residents of Lilly borough, 18 to 24 year old males and 18 to 24 year old females are the most vulnerable to poverty, with 8 males (22.2%) and 15 females (51.7%) in their respective age groups living below the poverty level.
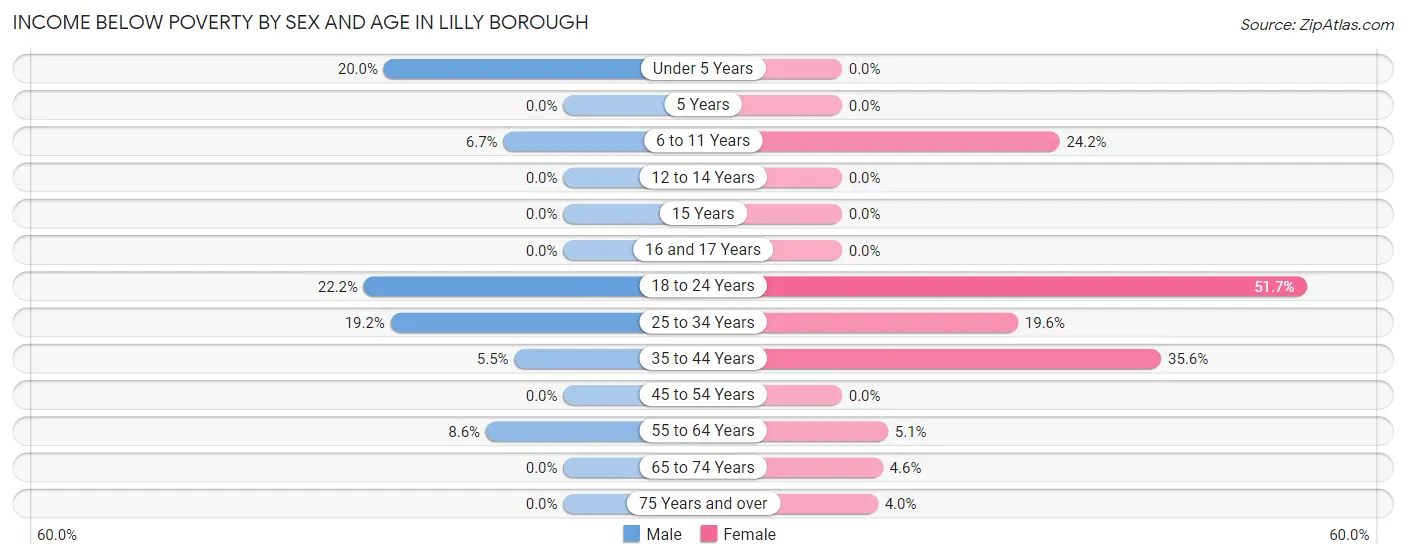
| Age Bracket | Male | Female |
| Under 5 Years | 2 (20.0%) | 0 (0.0%) |
| 5 Years | 0 (0.0%) | 0 (0.0%) |
| 6 to 11 Years | 2 (6.7%) | 8 (24.2%) |
| 12 to 14 Years | 0 (0.0%) | 0 (0.0%) |
| 15 Years | 0 (0.0%) | 0 (0.0%) |
| 16 and 17 Years | 0 (0.0%) | 0 (0.0%) |
| 18 to 24 Years | 8 (22.2%) | 15 (51.7%) |
| 25 to 34 Years | 5 (19.2%) | 10 (19.6%) |
| 35 to 44 Years | 3 (5.4%) | 16 (35.6%) |
| 45 to 54 Years | 0 (0.0%) | 0 (0.0%) |
| 55 to 64 Years | 5 (8.6%) | 2 (5.1%) |
| 65 to 74 Years | 0 (0.0%) | 2 (4.5%) |
| 75 Years and over | 0 (0.0%) | 2 (4.0%) |
| Total | 25 (7.0%) | 55 (13.6%) |
Income Above Poverty by Sex and Age in Lilly borough
According to the poverty statistics in Lilly borough, males aged 5 years and females aged under 5 years are the age groups that are most secure financially, with 100.0% of males and 100.0% of females in these age groups living above the poverty line.
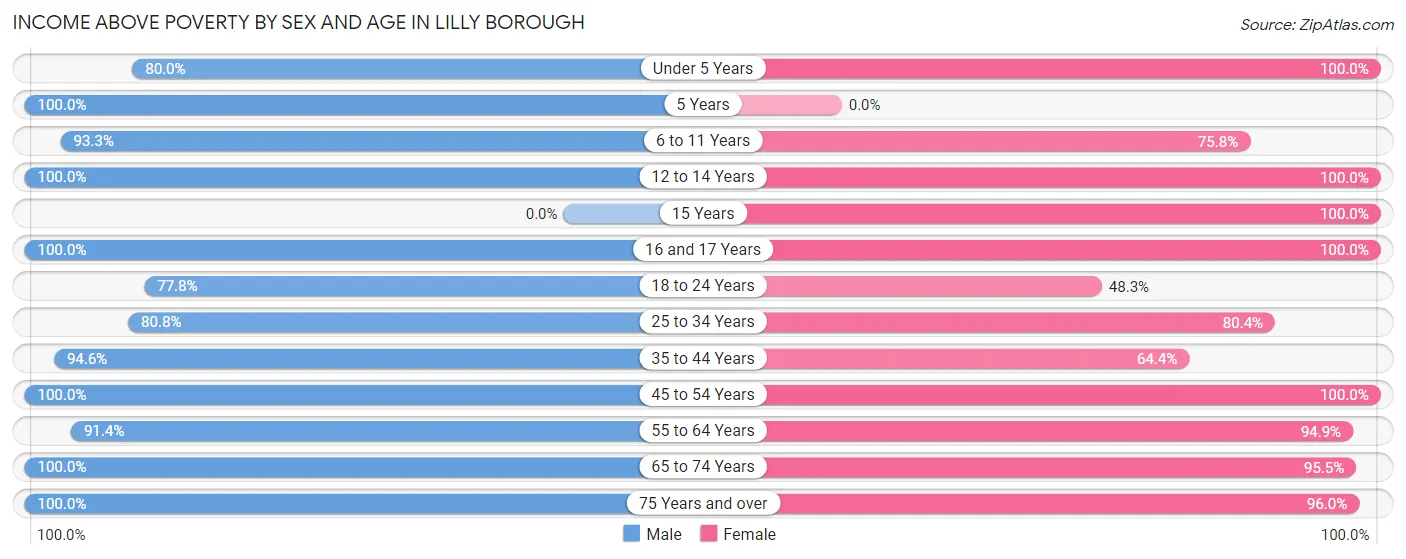
| Age Bracket | Male | Female |
| Under 5 Years | 8 (80.0%) | 45 (100.0%) |
| 5 Years | 4 (100.0%) | 0 (0.0%) |
| 6 to 11 Years | 28 (93.3%) | 25 (75.8%) |
| 12 to 14 Years | 7 (100.0%) | 5 (100.0%) |
| 15 Years | 0 (0.0%) | 8 (100.0%) |
| 16 and 17 Years | 9 (100.0%) | 11 (100.0%) |
| 18 to 24 Years | 28 (77.8%) | 14 (48.3%) |
| 25 to 34 Years | 21 (80.8%) | 41 (80.4%) |
| 35 to 44 Years | 52 (94.6%) | 29 (64.4%) |
| 45 to 54 Years | 38 (100.0%) | 45 (100.0%) |
| 55 to 64 Years | 53 (91.4%) | 37 (94.9%) |
| 65 to 74 Years | 38 (100.0%) | 42 (95.5%) |
| 75 Years and over | 45 (100.0%) | 48 (96.0%) |
| Total | 331 (93.0%) | 350 (86.4%) |
Income Below Poverty Among Married-Couple Families in Lilly borough
The poverty statistics for married-couple families in Lilly borough show that 1.5% or 2 of the total 137 families live below the poverty line. Families with no children have the highest poverty rate of 2.1%, comprising of 2 families. On the other hand, families with 1 or 2 children have the lowest poverty rate of 0.0%, which includes 0 families.
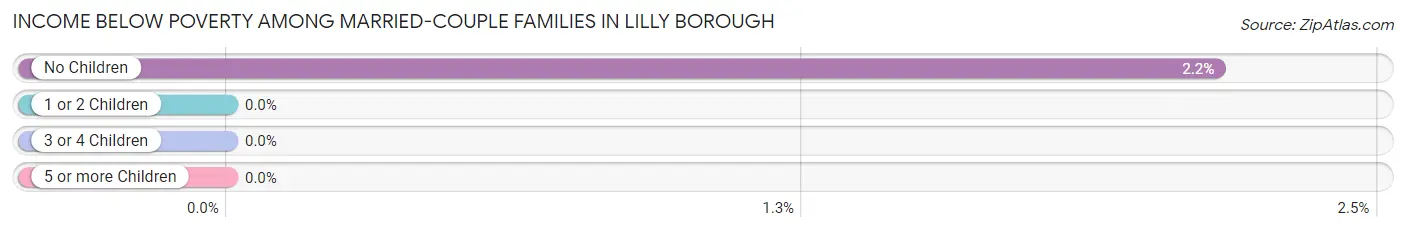
| Children | Above Poverty | Below Poverty |
| No Children | 91 (97.9%) | 2 (2.1%) |
| 1 or 2 Children | 40 (100.0%) | 0 (0.0%) |
| 3 or 4 Children | 4 (100.0%) | 0 (0.0%) |
| 5 or more Children | 0 (0.0%) | 0 (0.0%) |
| Total | 135 (98.5%) | 2 (1.5%) |
Income Below Poverty Among Single-Parent Households in Lilly borough
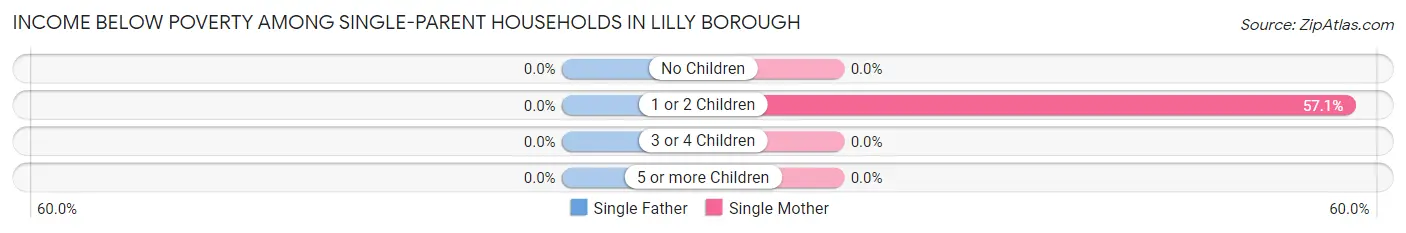
| Children | Single Father | Single Mother |
| No Children | 0 (0.0%) | 0 (0.0%) |
| 1 or 2 Children | 0 (0.0%) | 12 (57.1%) |
| 3 or 4 Children | 0 (0.0%) | 0 (0.0%) |
| 5 or more Children | 0 (0.0%) | 0 (0.0%) |
| Total | 0 (0.0%) | 12 (32.4%) |
Income Below Poverty Among Married-Couple vs Single-Parent Households in Lilly borough
The poverty data for Lilly borough shows that 2 of the married-couple family households (1.5%) and 12 of the single-parent households (14.5%) are living below the poverty level. Within the married-couple family households, those with no children have the highest poverty rate, with 2 households (2.1%) falling below the poverty line. Among the single-parent households, those with 1 or 2 children have the highest poverty rate, with 12 household (23.5%) living below poverty.
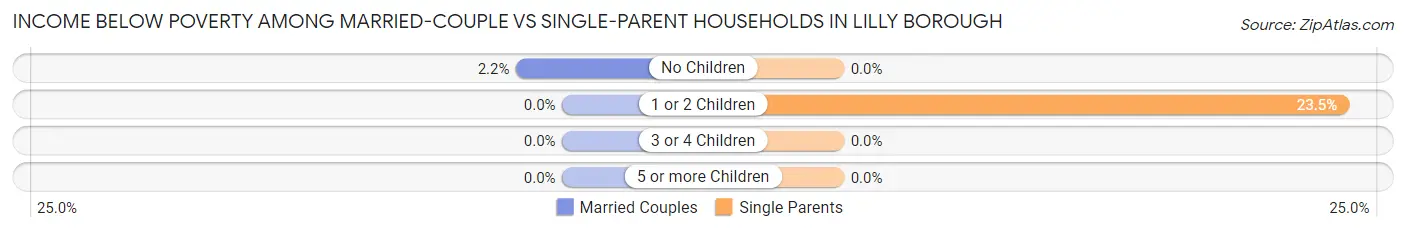
| Children | Married-Couple Families | Single-Parent Households |
| No Children | 2 (2.1%) | 0 (0.0%) |
| 1 or 2 Children | 0 (0.0%) | 12 (23.5%) |
| 3 or 4 Children | 0 (0.0%) | 0 (0.0%) |
| 5 or more Children | 0 (0.0%) | 0 (0.0%) |
| Total | 2 (1.5%) | 12 (14.5%) |
Employment Characteristics in Lilly borough
Employment by Class of Employer in Lilly borough
Among the 313 employed individuals in Lilly borough, private company employees (209 | 66.8%), not-for-profit organizations (36 | 11.5%), and state government employees (32 | 10.2%) make up the most common classes of employment.
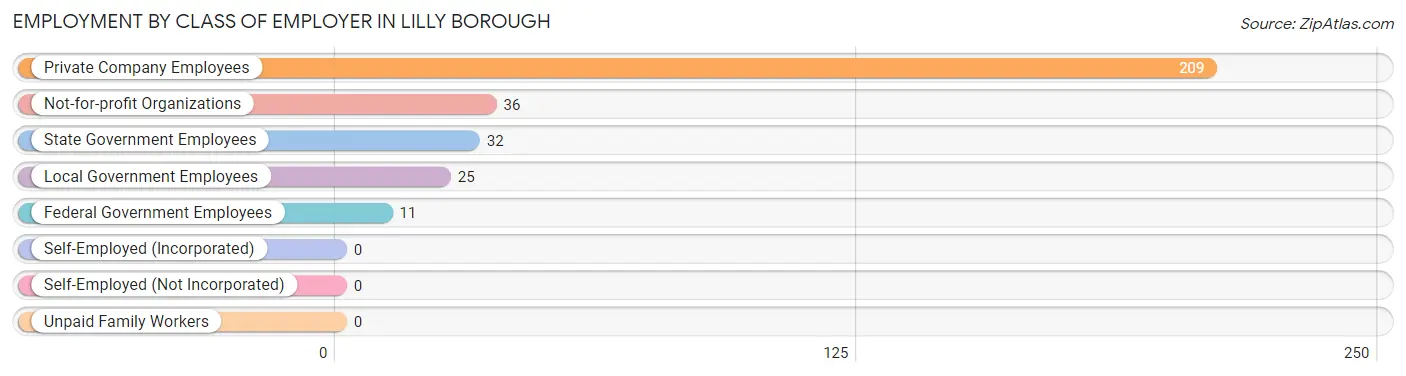
| Employer Class | # Employees | % Employees |
| Private Company Employees | 209 | 66.8% |
| Self-Employed (Incorporated) | 0 | 0.0% |
| Self-Employed (Not Incorporated) | 0 | 0.0% |
| Not-for-profit Organizations | 36 | 11.5% |
| Local Government Employees | 25 | 8.0% |
| State Government Employees | 32 | 10.2% |
| Federal Government Employees | 11 | 3.5% |
| Unpaid Family Workers | 0 | 0.0% |
| Total | 313 | 100.0% |
Employment Status by Age in Lilly borough
According to the labor force statistics for Lilly borough, out of the total population over 16 years of age (619), 55.4% or 343 individuals are in the labor force, with 6.1% or 21 of them unemployed. The age group with the highest labor force participation rate is 45 to 54 years, with 91.6% or 76 individuals in the labor force. Within the labor force, the 16 to 19 years age range has the highest percentage of unemployed individuals, with 60.0% or 3 of them being unemployed.
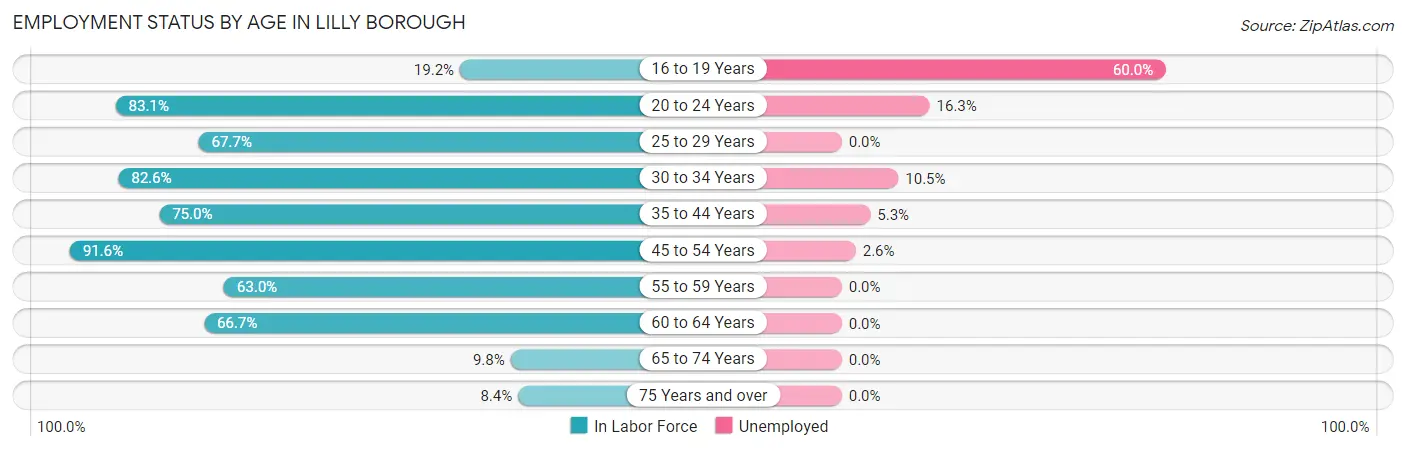
| Age Bracket | In Labor Force | Unemployed |
| 16 to 19 Years | 5 (19.2%) | 3 (60.0%) |
| 20 to 24 Years | 49 (83.1%) | 8 (16.3%) |
| 25 to 29 Years | 21 (67.7%) | 0 (0.0%) |
| 30 to 34 Years | 38 (82.6%) | 4 (10.5%) |
| 35 to 44 Years | 75 (75.0%) | 4 (5.3%) |
| 45 to 54 Years | 76 (91.6%) | 2 (2.6%) |
| 55 to 59 Years | 29 (63.0%) | 0 (0.0%) |
| 60 to 64 Years | 34 (66.7%) | 0 (0.0%) |
| 65 to 74 Years | 8 (9.8%) | 0 (0.0%) |
| 75 Years and over | 8 (8.4%) | 0 (0.0%) |
| Total | 343 (55.4%) | 21 (6.1%) |
Employment Status by Educational Attainment in Lilly borough
According to labor force statistics for Lilly borough, 76.5% of individuals (273) out of the total population between 25 and 64 years of age (357) are in the labor force, with 3.7% or 10 of them being unemployed. The group with the highest labor force participation rate are those with the educational attainment of bachelor's degree or higher, with 100.0% or 63 individuals in the labor force. Within the labor force, individuals with bachelor's degree or higher education have the highest percentage of unemployment, with 6.3% or 4 of them being unemployed.
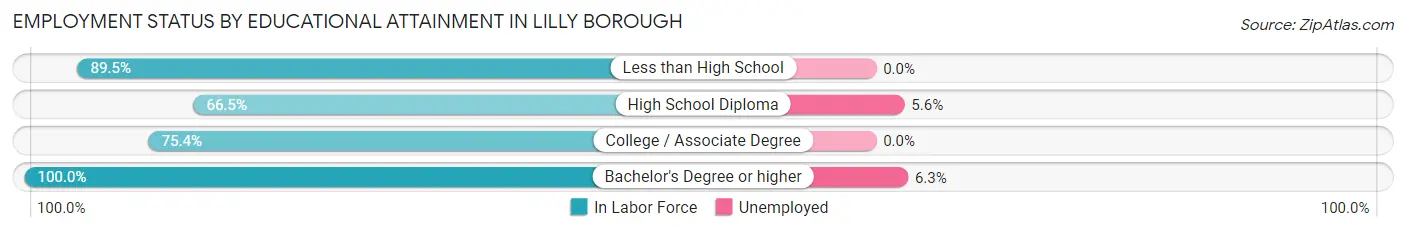
| Educational Attainment | In Labor Force | Unemployed |
| Less than High School | 17 (89.5%) | 0 (0.0%) |
| High School Diploma | 107 (66.5%) | 9 (5.6%) |
| College / Associate Degree | 86 (75.4%) | 0 (0.0%) |
| Bachelor's Degree or higher | 63 (100.0%) | 4 (6.3%) |
| Total | 273 (76.5%) | 13 (3.7%) |
Employment Occupations by Sex in Lilly borough
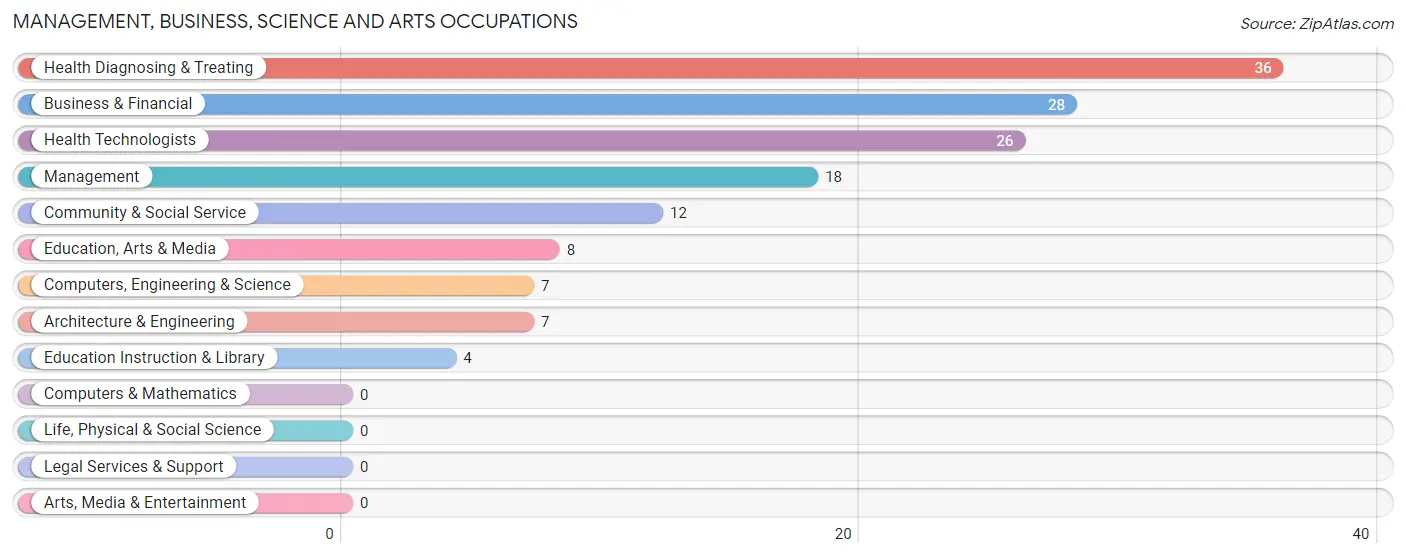
Management, Business, Science and Arts Occupations
The most common Management, Business, Science and Arts occupations in Lilly borough are Health Diagnosing & Treating (36 | 11.2%), Business & Financial (28 | 8.7%), Health Technologists (26 | 8.1%), Management (18 | 5.6%), and Community & Social Service (12 | 3.7%).
Management, Business, Science and Arts Occupations by Sex
Within the Management, Business, Science and Arts occupations in Lilly borough, the most male-oriented occupations are Computers, Engineering & Science (100.0%), Architecture & Engineering (100.0%), and Education, Arts & Media (100.0%), while the most female-oriented occupations are Education Instruction & Library (100.0%), Health Technologists (88.5%), and Health Diagnosing & Treating (72.2%).
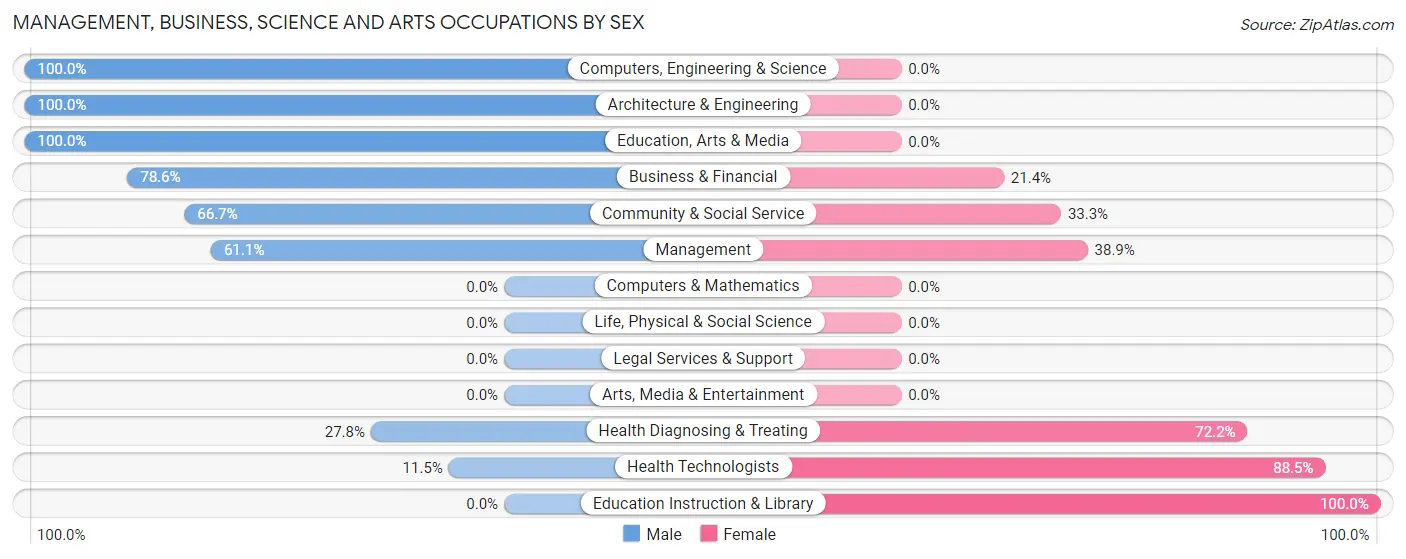
| Occupation | Male | Female |
| Management | 11 (61.1%) | 7 (38.9%) |
| Business & Financial | 22 (78.6%) | 6 (21.4%) |
| Computers, Engineering & Science | 7 (100.0%) | 0 (0.0%) |
| Computers & Mathematics | 0 (0.0%) | 0 (0.0%) |
| Architecture & Engineering | 7 (100.0%) | 0 (0.0%) |
| Life, Physical & Social Science | 0 (0.0%) | 0 (0.0%) |
| Community & Social Service | 8 (66.7%) | 4 (33.3%) |
| Education, Arts & Media | 8 (100.0%) | 0 (0.0%) |
| Legal Services & Support | 0 (0.0%) | 0 (0.0%) |
| Education Instruction & Library | 0 (0.0%) | 4 (100.0%) |
| Arts, Media & Entertainment | 0 (0.0%) | 0 (0.0%) |
| Health Diagnosing & Treating | 10 (27.8%) | 26 (72.2%) |
| Health Technologists | 3 (11.5%) | 23 (88.5%) |
| Total (Category) | 58 (57.4%) | 43 (42.6%) |
| Total (Overall) | 175 (54.3%) | 147 (45.7%) |
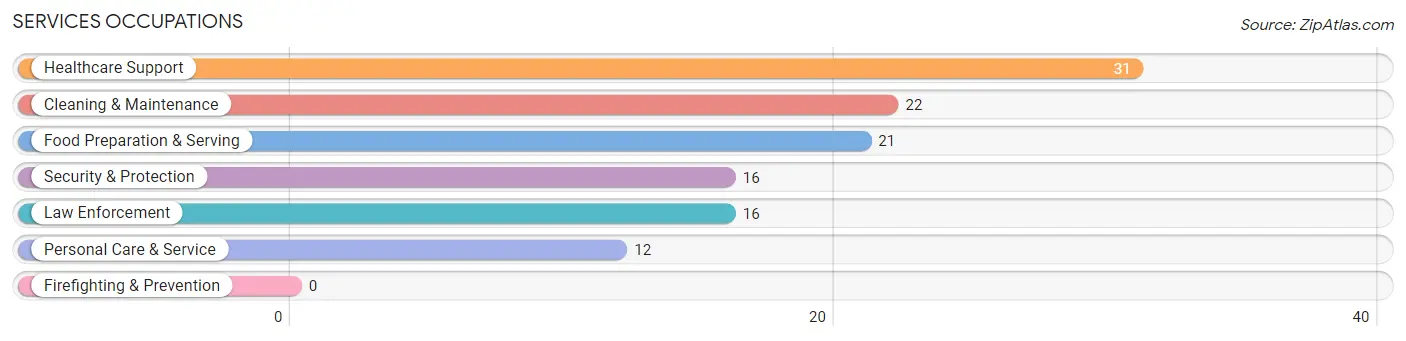
Services Occupations
The most common Services occupations in Lilly borough are Healthcare Support (31 | 9.6%), Cleaning & Maintenance (22 | 6.8%), Food Preparation & Serving (21 | 6.5%), Security & Protection (16 | 5.0%), and Law Enforcement (16 | 5.0%).
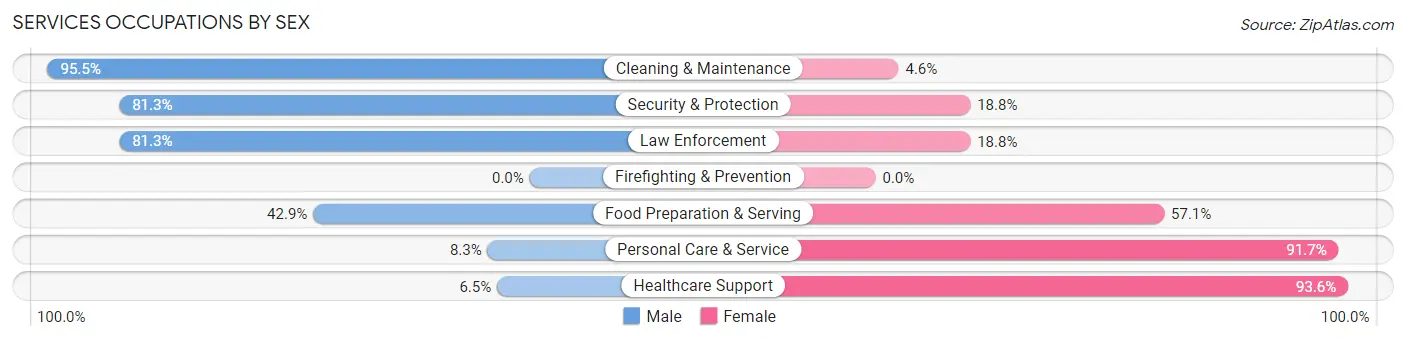
Services Occupations by Sex
Within the Services occupations in Lilly borough, the most male-oriented occupations are Cleaning & Maintenance (95.5%), Security & Protection (81.2%), and Law Enforcement (81.2%), while the most female-oriented occupations are Healthcare Support (93.5%), Personal Care & Service (91.7%), and Food Preparation & Serving (57.1%).
| Occupation | Male | Female |
| Healthcare Support | 2 (6.5%) | 29 (93.5%) |
| Security & Protection | 13 (81.2%) | 3 (18.8%) |
| Firefighting & Prevention | 0 (0.0%) | 0 (0.0%) |
| Law Enforcement | 13 (81.2%) | 3 (18.8%) |
| Food Preparation & Serving | 9 (42.9%) | 12 (57.1%) |
| Cleaning & Maintenance | 21 (95.5%) | 1 (4.5%) |
| Personal Care & Service | 1 (8.3%) | 11 (91.7%) |
| Total (Category) | 46 (45.1%) | 56 (54.9%) |
| Total (Overall) | 175 (54.3%) | 147 (45.7%) |
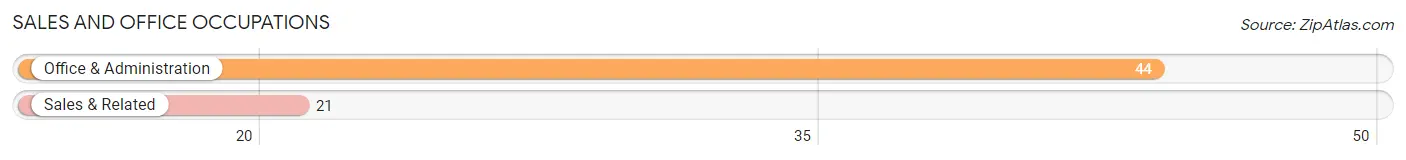
Sales and Office Occupations
The most common Sales and Office occupations in Lilly borough are Office & Administration (44 | 13.7%), and Sales & Related (21 | 6.5%).
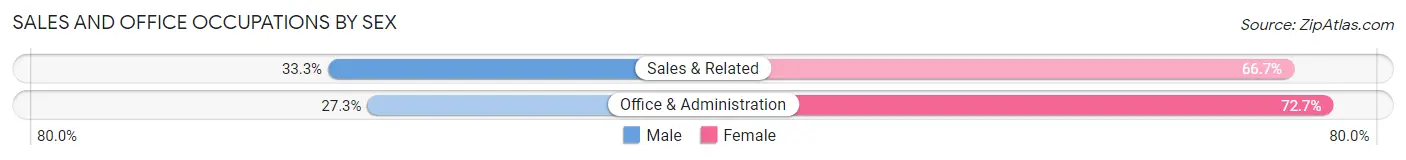
Sales and Office Occupations by Sex
| Occupation | Male | Female |
| Sales & Related | 7 (33.3%) | 14 (66.7%) |
| Office & Administration | 12 (27.3%) | 32 (72.7%) |
| Total (Category) | 19 (29.2%) | 46 (70.8%) |
| Total (Overall) | 175 (54.3%) | 147 (45.7%) |
Natural Resources, Construction and Maintenance Occupations
The most common Natural Resources, Construction and Maintenance occupations in Lilly borough are Construction & Extraction (8 | 2.5%), and Installation, Maintenance & Repair (5 | 1.5%).
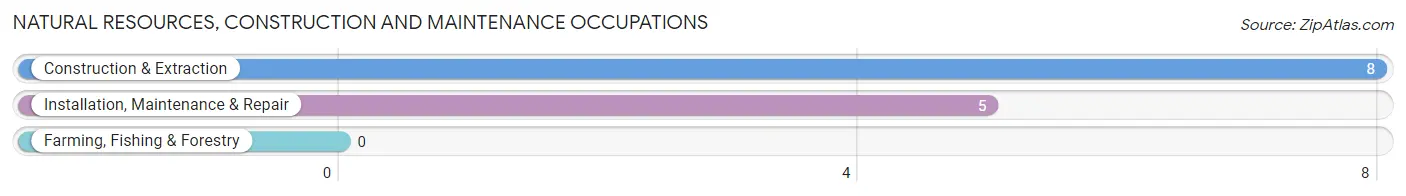
Natural Resources, Construction and Maintenance Occupations by Sex
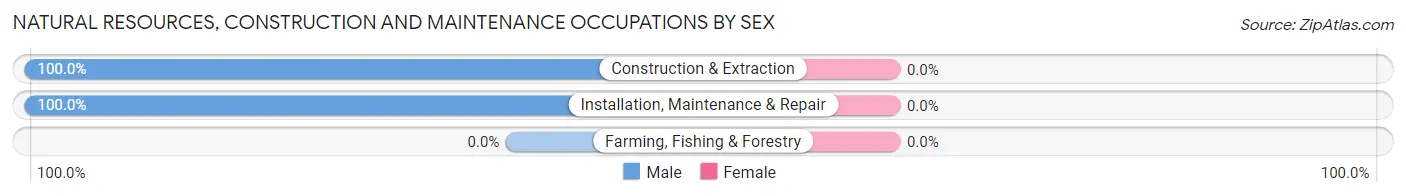
| Occupation | Male | Female |
| Farming, Fishing & Forestry | 0 (0.0%) | 0 (0.0%) |
| Construction & Extraction | 8 (100.0%) | 0 (0.0%) |
| Installation, Maintenance & Repair | 5 (100.0%) | 0 (0.0%) |
| Total (Category) | 13 (100.0%) | 0 (0.0%) |
| Total (Overall) | 175 (54.3%) | 147 (45.7%) |
Production, Transportation and Moving Occupations
The most common Production, Transportation and Moving occupations in Lilly borough are Production (16 | 5.0%), Transportation (15 | 4.7%), and Material Moving (10 | 3.1%).
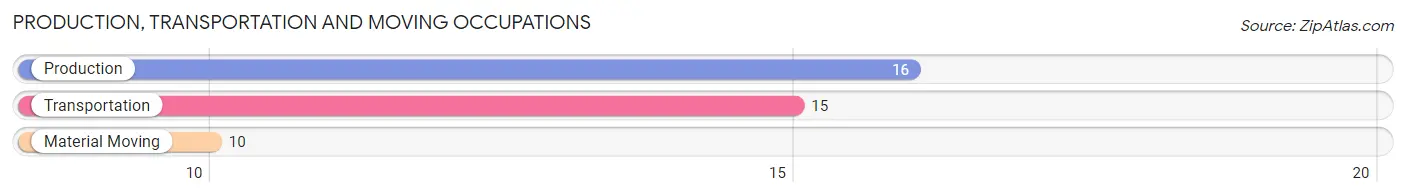
Production, Transportation and Moving Occupations by Sex
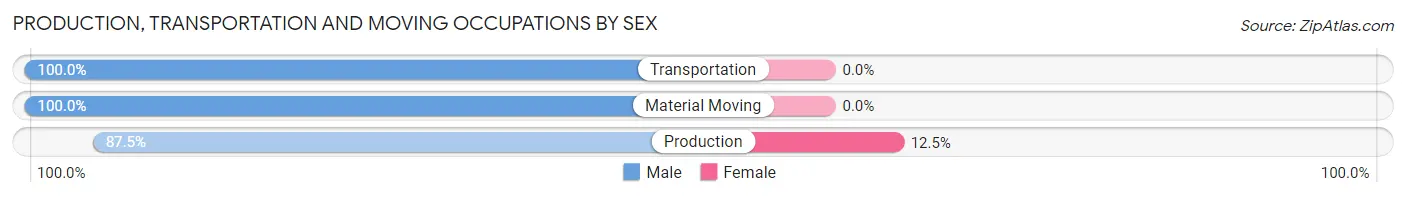
| Occupation | Male | Female |
| Production | 14 (87.5%) | 2 (12.5%) |
| Transportation | 15 (100.0%) | 0 (0.0%) |
| Material Moving | 10 (100.0%) | 0 (0.0%) |
| Total (Category) | 39 (95.1%) | 2 (4.9%) |
| Total (Overall) | 175 (54.3%) | 147 (45.7%) |
Employment Industries by Sex in Lilly borough
Employment Industries in Lilly borough
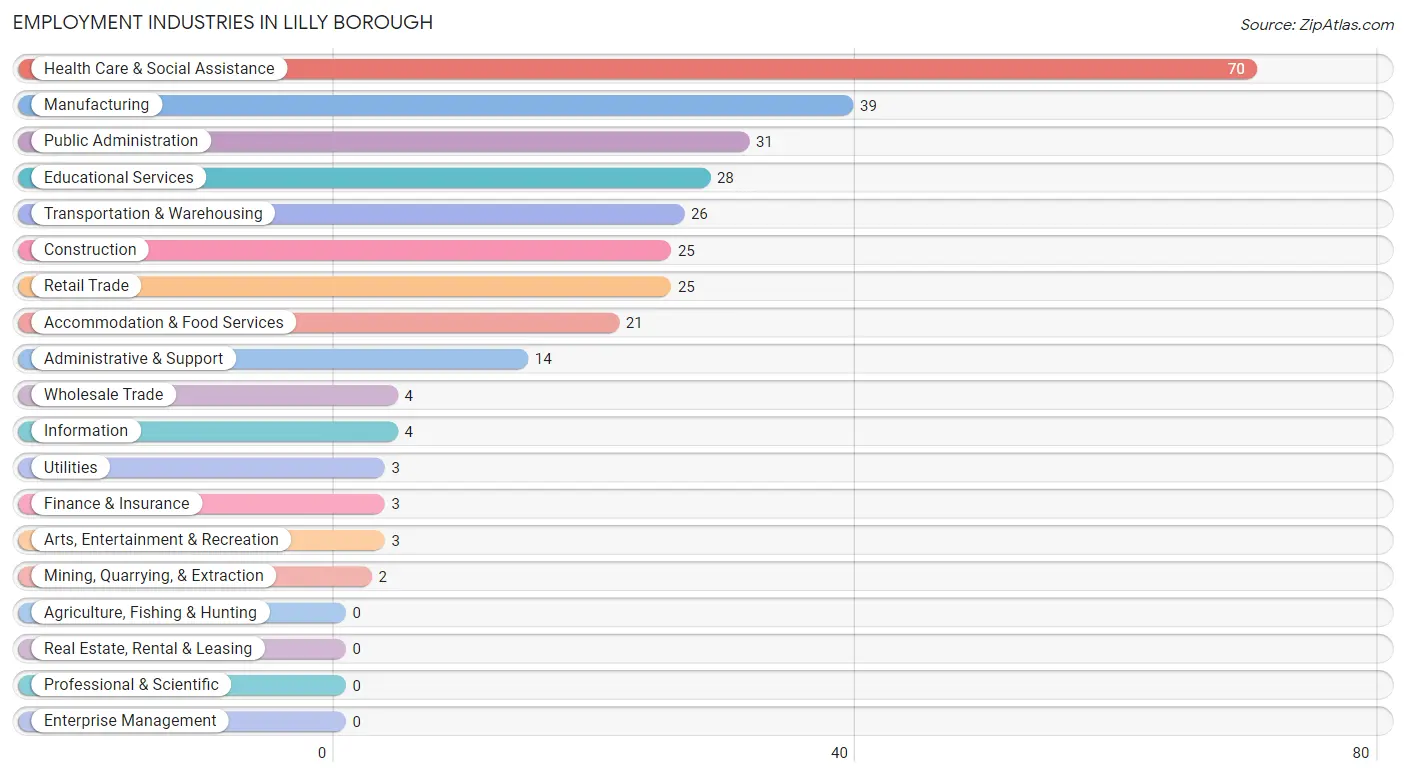
The major employment industries in Lilly borough include Health Care & Social Assistance (70 | 21.7%), Manufacturing (39 | 12.1%), Public Administration (31 | 9.6%), Educational Services (28 | 8.7%), and Transportation & Warehousing (26 | 8.1%).
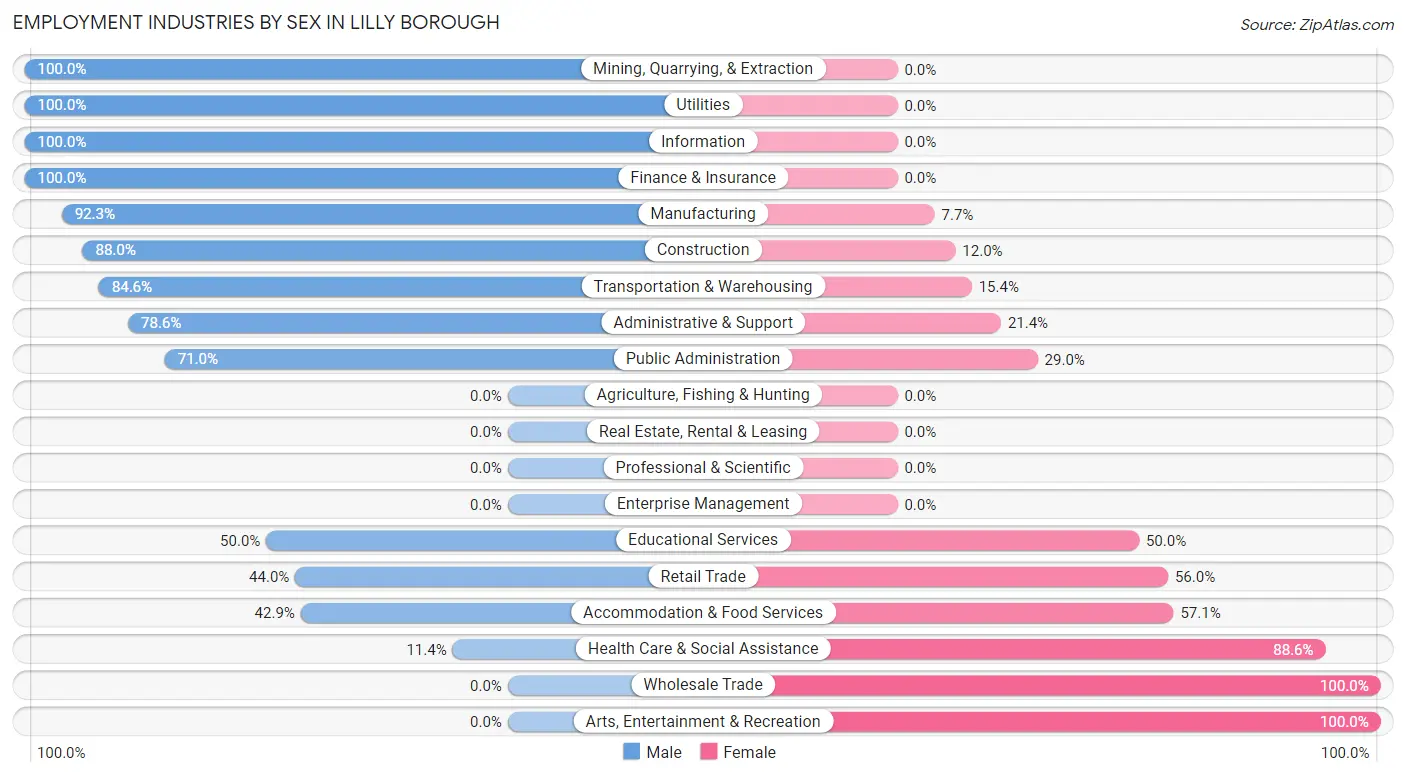
Employment Industries by Sex in Lilly borough
The Lilly borough industries that see more men than women are Mining, Quarrying, & Extraction (100.0%), Utilities (100.0%), and Information (100.0%), whereas the industries that tend to have a higher number of women are Wholesale Trade (100.0%), Arts, Entertainment & Recreation (100.0%), and Health Care & Social Assistance (88.6%).
| Industry | Male | Female |
| Agriculture, Fishing & Hunting | 0 (0.0%) | 0 (0.0%) |
| Mining, Quarrying, & Extraction | 2 (100.0%) | 0 (0.0%) |
| Construction | 22 (88.0%) | 3 (12.0%) |
| Manufacturing | 36 (92.3%) | 3 (7.7%) |
| Wholesale Trade | 0 (0.0%) | 4 (100.0%) |
| Retail Trade | 11 (44.0%) | 14 (56.0%) |
| Transportation & Warehousing | 22 (84.6%) | 4 (15.4%) |
| Utilities | 3 (100.0%) | 0 (0.0%) |
| Information | 4 (100.0%) | 0 (0.0%) |
| Finance & Insurance | 3 (100.0%) | 0 (0.0%) |
| Real Estate, Rental & Leasing | 0 (0.0%) | 0 (0.0%) |
| Professional & Scientific | 0 (0.0%) | 0 (0.0%) |
| Enterprise Management | 0 (0.0%) | 0 (0.0%) |
| Administrative & Support | 11 (78.6%) | 3 (21.4%) |
| Educational Services | 14 (50.0%) | 14 (50.0%) |
| Health Care & Social Assistance | 8 (11.4%) | 62 (88.6%) |
| Arts, Entertainment & Recreation | 0 (0.0%) | 3 (100.0%) |
| Accommodation & Food Services | 9 (42.9%) | 12 (57.1%) |
| Public Administration | 22 (71.0%) | 9 (29.0%) |
| Total | 175 (54.3%) | 147 (45.7%) |
Education in Lilly borough
School Enrollment in Lilly borough
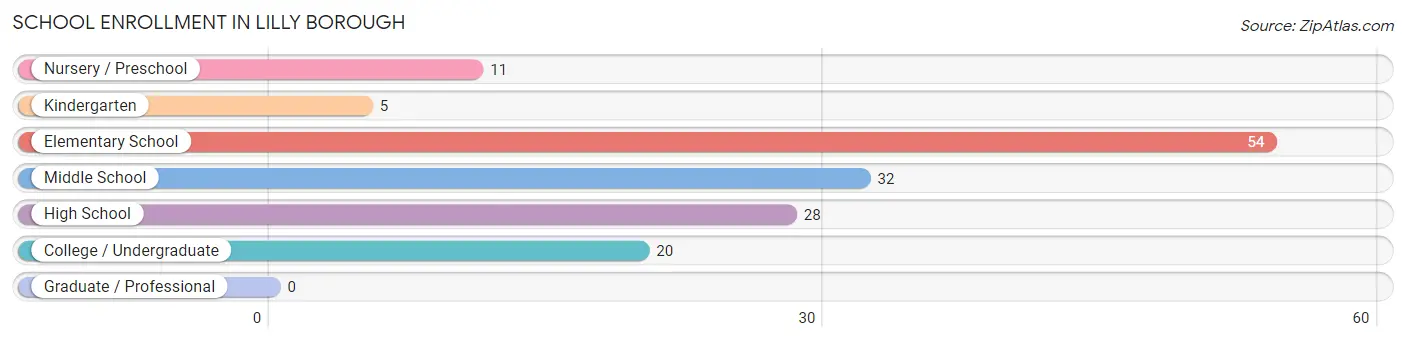
The most common levels of schooling among the 150 students in Lilly borough are elementary school (54 | 36.0%), middle school (32 | 21.3%), and high school (28 | 18.7%).
| School Level | # Students | % Students |
| Nursery / Preschool | 11 | 7.3% |
| Kindergarten | 5 | 3.3% |
| Elementary School | 54 | 36.0% |
| Middle School | 32 | 21.3% |
| High School | 28 | 18.7% |
| College / Undergraduate | 20 | 13.3% |
| Graduate / Professional | 0 | 0.0% |
| Total | 150 | 100.0% |
School Enrollment by Age by Funding Source in Lilly borough
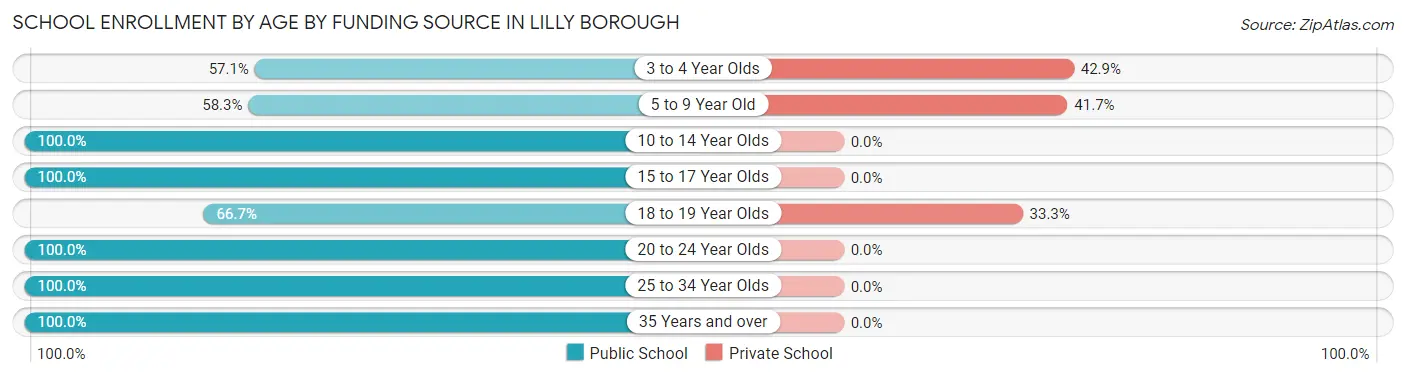
Out of a total of 150 students who are enrolled in schools in Lilly borough, 30 (20.0%) attend a private institution, while the remaining 120 (80.0%) are enrolled in public schools. The age group of 3 to 4 year olds has the highest likelihood of being enrolled in private schools, with 3 (42.9% in the age bracket) enrolled. Conversely, the age group of 10 to 14 year olds has the lowest likelihood of being enrolled in a private school, with 31 (100.0% in the age bracket) attending a public institution.
| Age Bracket | Public School | Private School |
| 3 to 4 Year Olds | 4 (57.1%) | 3 (42.9%) |
| 5 to 9 Year Old | 35 (58.3%) | 25 (41.7%) |
| 10 to 14 Year Olds | 31 (100.0%) | 0 (0.0%) |
| 15 to 17 Year Olds | 28 (100.0%) | 0 (0.0%) |
| 18 to 19 Year Olds | 4 (66.7%) | 2 (33.3%) |
| 20 to 24 Year Olds | 7 (100.0%) | 0 (0.0%) |
| 25 to 34 Year Olds | 4 (100.0%) | 0 (0.0%) |
| 35 Years and over | 7 (100.0%) | 0 (0.0%) |
| Total | 120 (80.0%) | 30 (20.0%) |
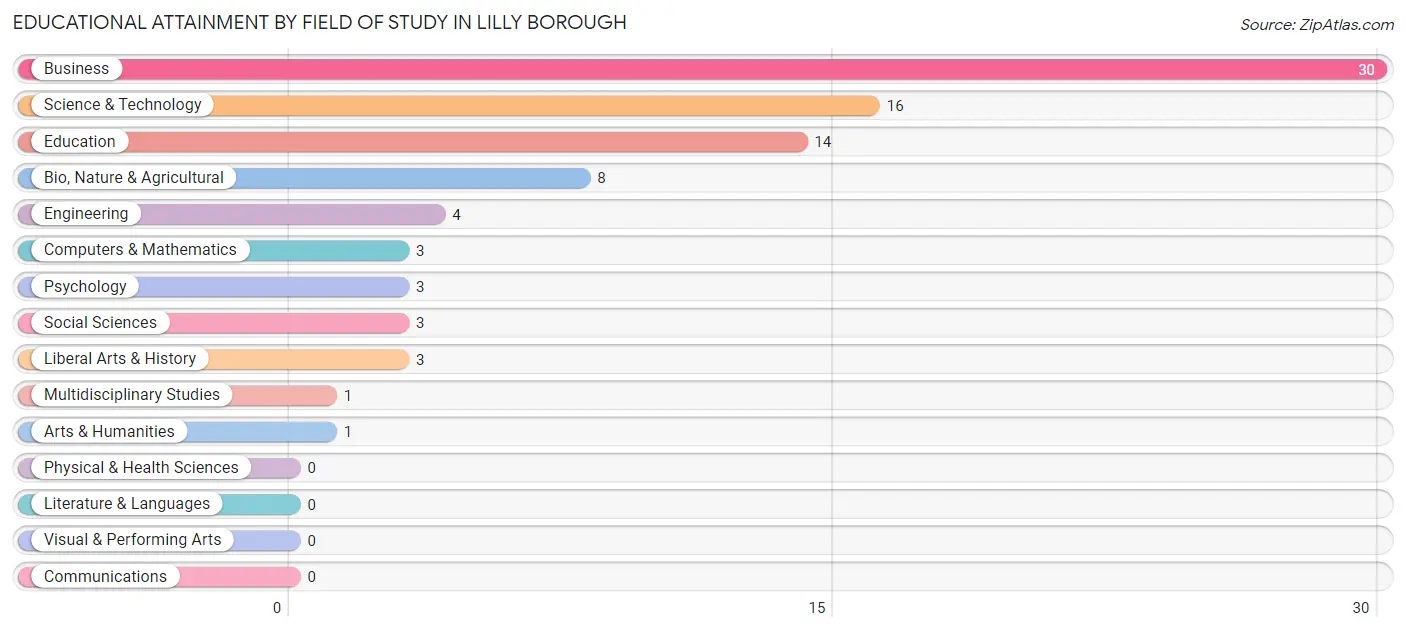
Educational Attainment by Field of Study in Lilly borough
Business (30 | 34.9%), science & technology (16 | 18.6%), education (14 | 16.3%), bio, nature & agricultural (8 | 9.3%), and engineering (4 | 4.6%) are the most common fields of study among 86 individuals in Lilly borough who have obtained a bachelor's degree or higher.
| Field of Study | # Graduates | % Graduates |
| Computers & Mathematics | 3 | 3.5% |
| Bio, Nature & Agricultural | 8 | 9.3% |
| Physical & Health Sciences | 0 | 0.0% |
| Psychology | 3 | 3.5% |
| Social Sciences | 3 | 3.5% |
| Engineering | 4 | 4.6% |
| Multidisciplinary Studies | 1 | 1.2% |
| Science & Technology | 16 | 18.6% |
| Business | 30 | 34.9% |
| Education | 14 | 16.3% |
| Literature & Languages | 0 | 0.0% |
| Liberal Arts & History | 3 | 3.5% |
| Visual & Performing Arts | 0 | 0.0% |
| Communications | 0 | 0.0% |
| Arts & Humanities | 1 | 1.2% |
| Total | 86 | 100.0% |
Transportation & Commute in Lilly borough
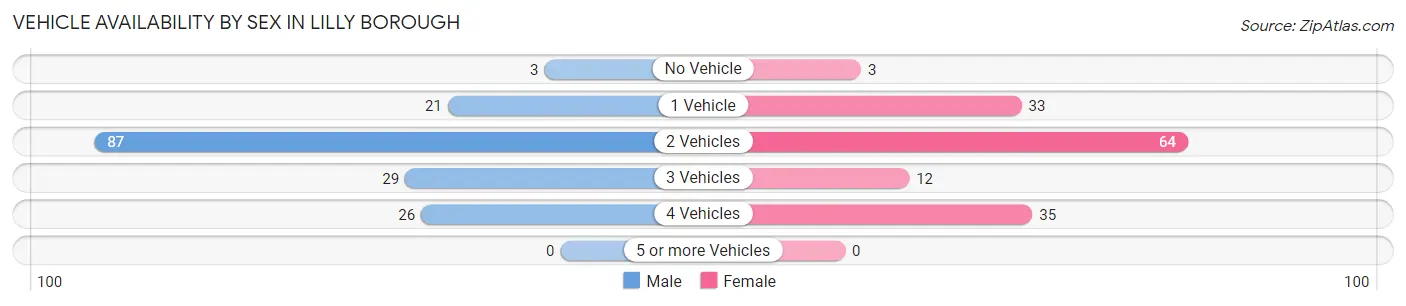
Vehicle Availability by Sex in Lilly borough
The most prevalent vehicle ownership categories in Lilly borough are males with 2 vehicles (87, accounting for 52.4%) and females with 2 vehicles (64, making up 59.2%).
| Vehicles Available | Male | Female |
| No Vehicle | 3 (1.8%) | 3 (2.0%) |
| 1 Vehicle | 21 (12.7%) | 33 (22.5%) |
| 2 Vehicles | 87 (52.4%) | 64 (43.5%) |
| 3 Vehicles | 29 (17.5%) | 12 (8.2%) |
| 4 Vehicles | 26 (15.7%) | 35 (23.8%) |
| 5 or more Vehicles | 0 (0.0%) | 0 (0.0%) |
| Total | 166 (100.0%) | 147 (100.0%) |
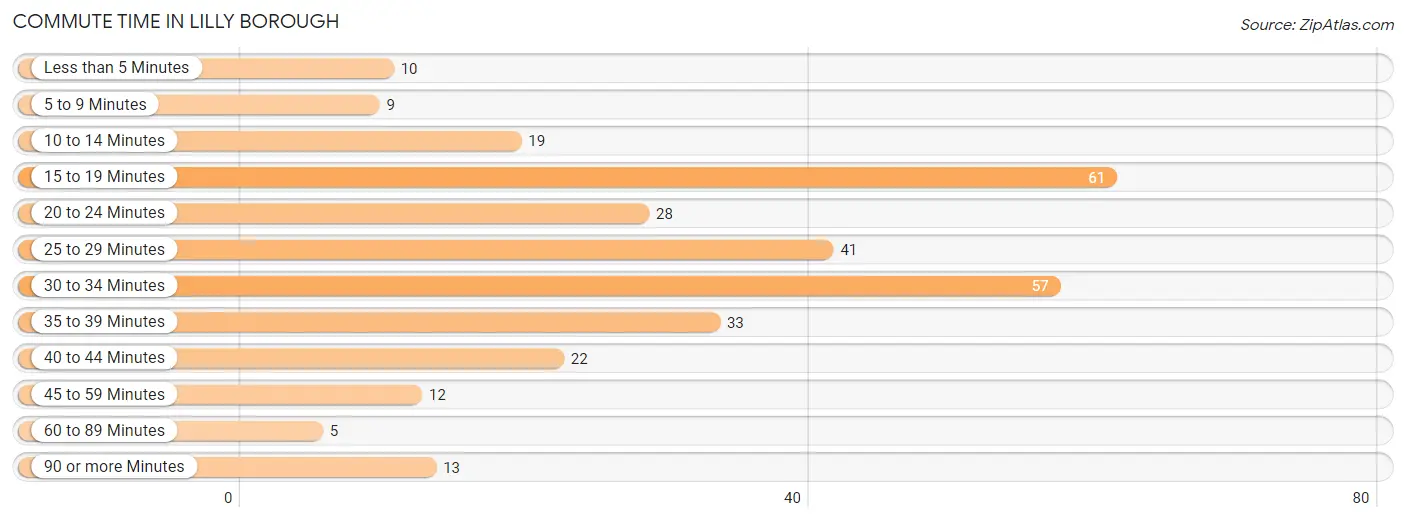
Commute Time in Lilly borough
The most frequently occuring commute durations in Lilly borough are 15 to 19 minutes (61 commuters, 19.7%), 30 to 34 minutes (57 commuters, 18.4%), and 25 to 29 minutes (41 commuters, 13.2%).
| Commute Time | # Commuters | % Commuters |
| Less than 5 Minutes | 10 | 3.2% |
| 5 to 9 Minutes | 9 | 2.9% |
| 10 to 14 Minutes | 19 | 6.1% |
| 15 to 19 Minutes | 61 | 19.7% |
| 20 to 24 Minutes | 28 | 9.0% |
| 25 to 29 Minutes | 41 | 13.2% |
| 30 to 34 Minutes | 57 | 18.4% |
| 35 to 39 Minutes | 33 | 10.6% |
| 40 to 44 Minutes | 22 | 7.1% |
| 45 to 59 Minutes | 12 | 3.9% |
| 60 to 89 Minutes | 5 | 1.6% |
| 90 or more Minutes | 13 | 4.2% |
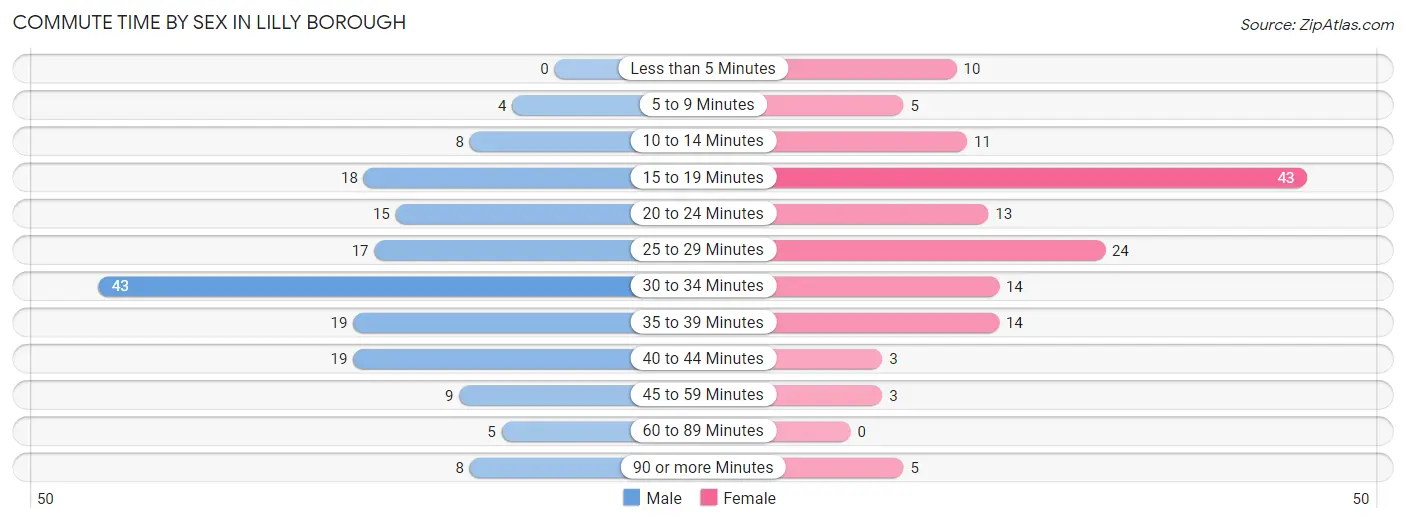
Commute Time by Sex in Lilly borough
The most common commute times in Lilly borough are 30 to 34 minutes (43 commuters, 26.1%) for males and 15 to 19 minutes (43 commuters, 29.7%) for females.
| Commute Time | Male | Female |
| Less than 5 Minutes | 0 (0.0%) | 10 (6.9%) |
| 5 to 9 Minutes | 4 (2.4%) | 5 (3.5%) |
| 10 to 14 Minutes | 8 (4.9%) | 11 (7.6%) |
| 15 to 19 Minutes | 18 (10.9%) | 43 (29.7%) |
| 20 to 24 Minutes | 15 (9.1%) | 13 (9.0%) |
| 25 to 29 Minutes | 17 (10.3%) | 24 (16.6%) |
| 30 to 34 Minutes | 43 (26.1%) | 14 (9.7%) |
| 35 to 39 Minutes | 19 (11.5%) | 14 (9.7%) |
| 40 to 44 Minutes | 19 (11.5%) | 3 (2.1%) |
| 45 to 59 Minutes | 9 (5.4%) | 3 (2.1%) |
| 60 to 89 Minutes | 5 (3.0%) | 0 (0.0%) |
| 90 or more Minutes | 8 (4.9%) | 5 (3.5%) |
Time of Departure to Work by Sex in Lilly borough
The most frequent times of departure to work in Lilly borough are 6:00 AM to 6:29 AM (45, 27.3%) for males and 6:30 AM to 6:59 AM (26, 17.9%) for females.
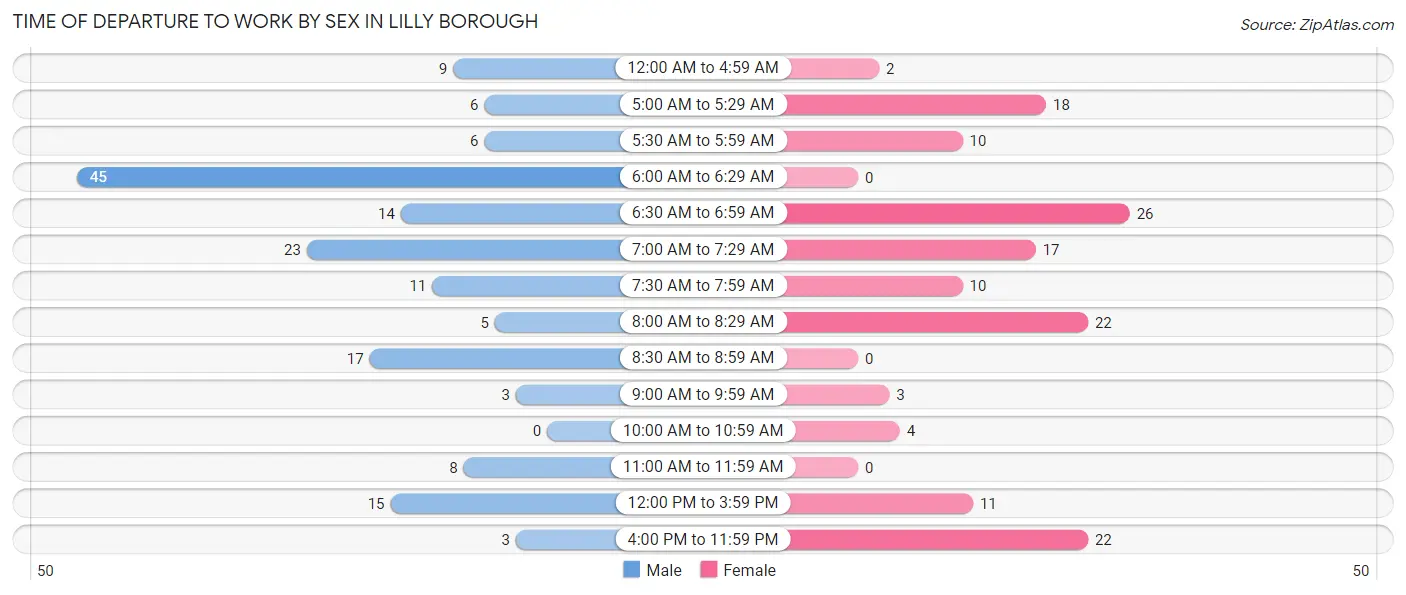
| Time of Departure | Male | Female |
| 12:00 AM to 4:59 AM | 9 (5.4%) | 2 (1.4%) |
| 5:00 AM to 5:29 AM | 6 (3.6%) | 18 (12.4%) |
| 5:30 AM to 5:59 AM | 6 (3.6%) | 10 (6.9%) |
| 6:00 AM to 6:29 AM | 45 (27.3%) | 0 (0.0%) |
| 6:30 AM to 6:59 AM | 14 (8.5%) | 26 (17.9%) |
| 7:00 AM to 7:29 AM | 23 (13.9%) | 17 (11.7%) |
| 7:30 AM to 7:59 AM | 11 (6.7%) | 10 (6.9%) |
| 8:00 AM to 8:29 AM | 5 (3.0%) | 22 (15.2%) |
| 8:30 AM to 8:59 AM | 17 (10.3%) | 0 (0.0%) |
| 9:00 AM to 9:59 AM | 3 (1.8%) | 3 (2.1%) |
| 10:00 AM to 10:59 AM | 0 (0.0%) | 4 (2.8%) |
| 11:00 AM to 11:59 AM | 8 (4.9%) | 0 (0.0%) |
| 12:00 PM to 3:59 PM | 15 (9.1%) | 11 (7.6%) |
| 4:00 PM to 11:59 PM | 3 (1.8%) | 22 (15.2%) |
| Total | 165 (100.0%) | 145 (100.0%) |
Housing Occupancy in Lilly borough
Occupancy by Ownership in Lilly borough
Of the total 326 dwellings in Lilly borough, owner-occupied units account for 291 (89.3%), while renter-occupied units make up 35 (10.7%).
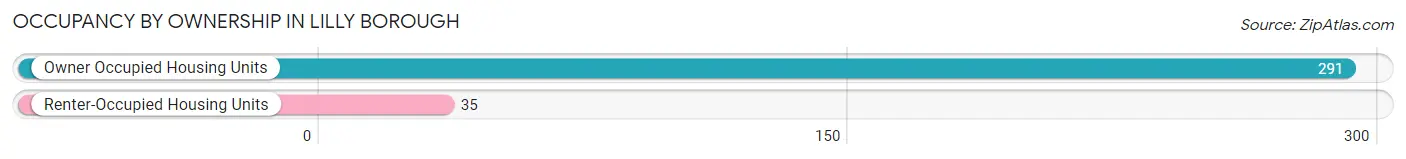
| Occupancy | # Housing Units | % Housing Units |
| Owner Occupied Housing Units | 291 | 89.3% |
| Renter-Occupied Housing Units | 35 | 10.7% |
| Total Occupied Housing Units | 326 | 100.0% |
Occupancy by Household Size in Lilly borough
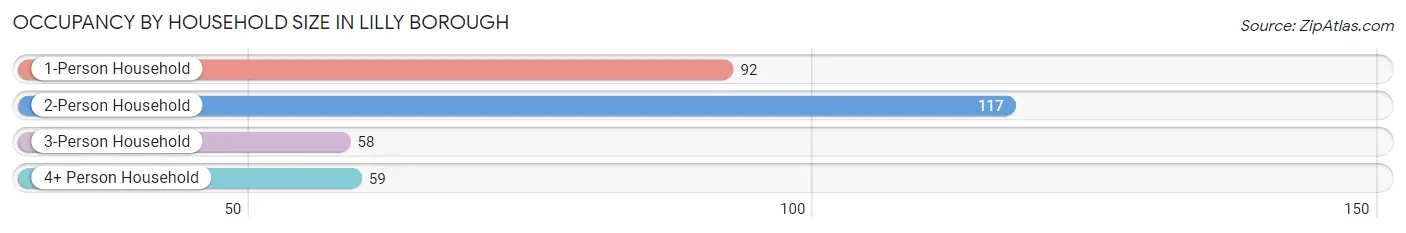
| Household Size | # Housing Units | % Housing Units |
| 1-Person Household | 92 | 28.2% |
| 2-Person Household | 117 | 35.9% |
| 3-Person Household | 58 | 17.8% |
| 4+ Person Household | 59 | 18.1% |
| Total Housing Units | 326 | 100.0% |
Occupancy by Ownership by Household Size in Lilly borough
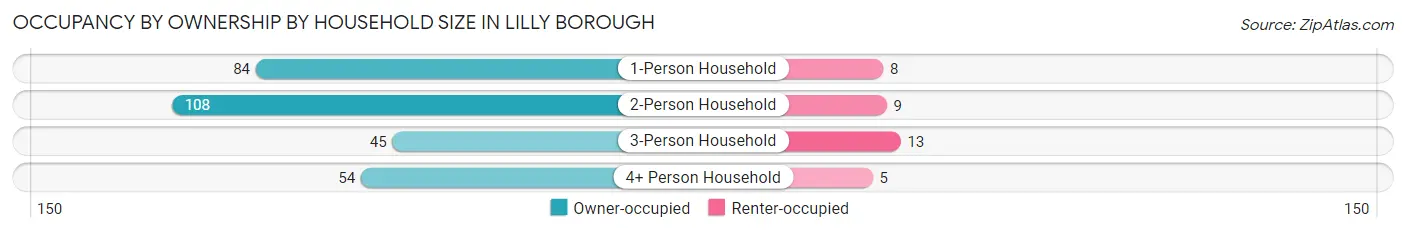
| Household Size | Owner-occupied | Renter-occupied |
| 1-Person Household | 84 (91.3%) | 8 (8.7%) |
| 2-Person Household | 108 (92.3%) | 9 (7.7%) |
| 3-Person Household | 45 (77.6%) | 13 (22.4%) |
| 4+ Person Household | 54 (91.5%) | 5 (8.5%) |
| Total Housing Units | 291 (89.3%) | 35 (10.7%) |
Occupancy by Educational Attainment in Lilly borough
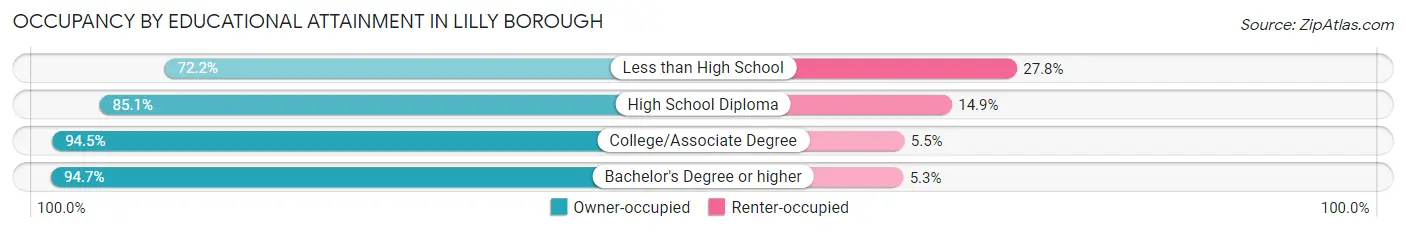
| Household Size | Owner-occupied | Renter-occupied |
| Less than High School | 13 (72.2%) | 5 (27.8%) |
| High School Diploma | 120 (85.1%) | 21 (14.9%) |
| College/Associate Degree | 86 (94.5%) | 5 (5.5%) |
| Bachelor's Degree or higher | 72 (94.7%) | 4 (5.3%) |
Occupancy by Age of Householder in Lilly borough
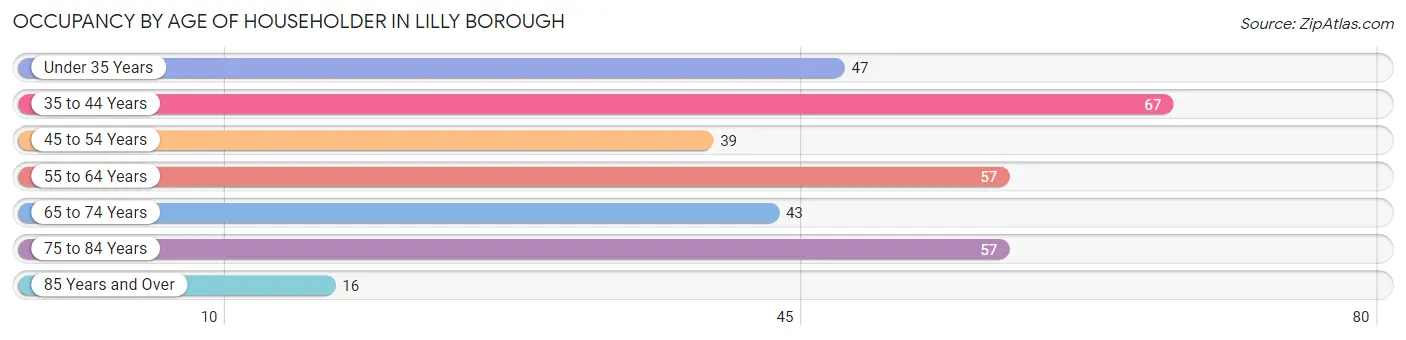
| Age Bracket | # Households | % Households |
| Under 35 Years | 47 | 14.4% |
| 35 to 44 Years | 67 | 20.5% |
| 45 to 54 Years | 39 | 12.0% |
| 55 to 64 Years | 57 | 17.5% |
| 65 to 74 Years | 43 | 13.2% |
| 75 to 84 Years | 57 | 17.5% |
| 85 Years and Over | 16 | 4.9% |
| Total | 326 | 100.0% |
Housing Finances in Lilly borough
Median Income by Occupancy in Lilly borough
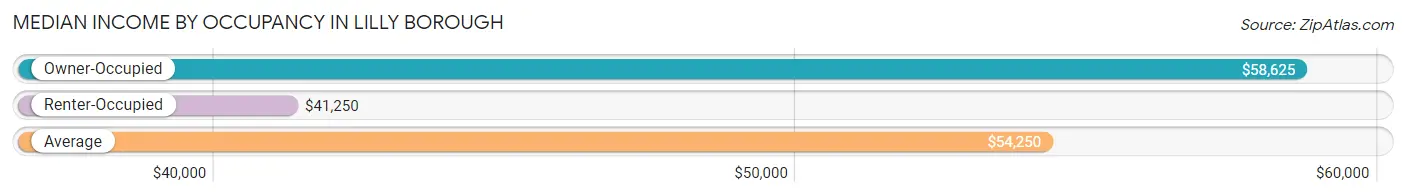
| Occupancy Type | # Households | Median Income |
| Owner-Occupied | 291 (89.3%) | $58,625 |
| Renter-Occupied | 35 (10.7%) | $41,250 |
| Average | 326 (100.0%) | $54,250 |
Occupancy by Householder Income Bracket in Lilly borough
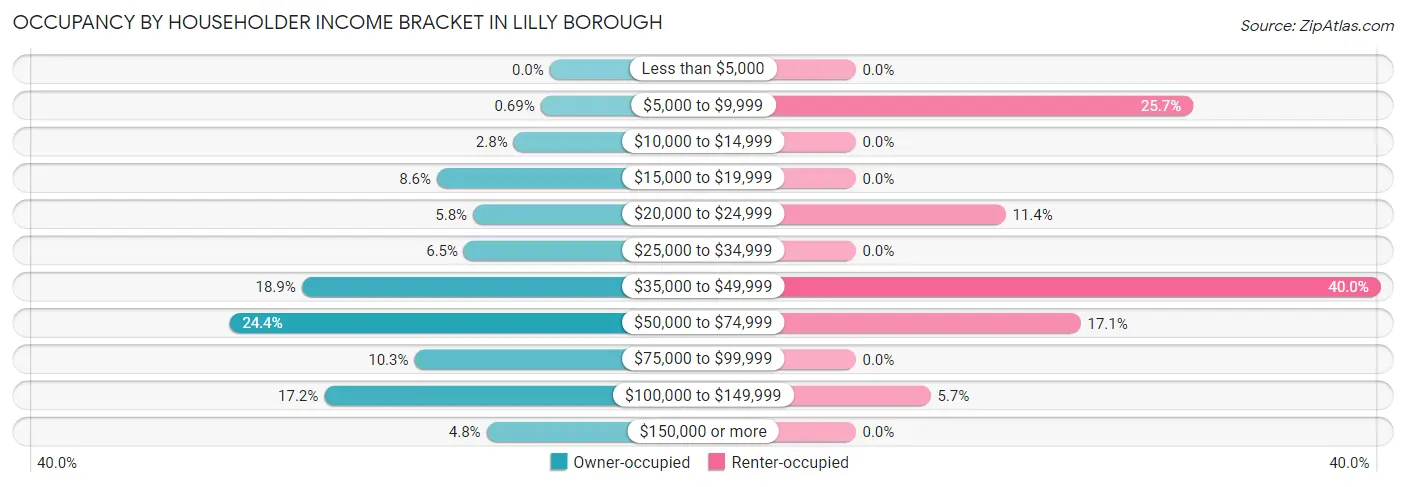
| Income Bracket | Owner-occupied | Renter-occupied |
| Less than $5,000 | 0 (0.0%) | 0 (0.0%) |
| $5,000 to $9,999 | 2 (0.7%) | 9 (25.7%) |
| $10,000 to $14,999 | 8 (2.8%) | 0 (0.0%) |
| $15,000 to $19,999 | 25 (8.6%) | 0 (0.0%) |
| $20,000 to $24,999 | 17 (5.8%) | 4 (11.4%) |
| $25,000 to $34,999 | 19 (6.5%) | 0 (0.0%) |
| $35,000 to $49,999 | 55 (18.9%) | 14 (40.0%) |
| $50,000 to $74,999 | 71 (24.4%) | 6 (17.1%) |
| $75,000 to $99,999 | 30 (10.3%) | 0 (0.0%) |
| $100,000 to $149,999 | 50 (17.2%) | 2 (5.7%) |
| $150,000 or more | 14 (4.8%) | 0 (0.0%) |
| Total | 291 (100.0%) | 35 (100.0%) |
Monthly Housing Cost Tiers in Lilly borough
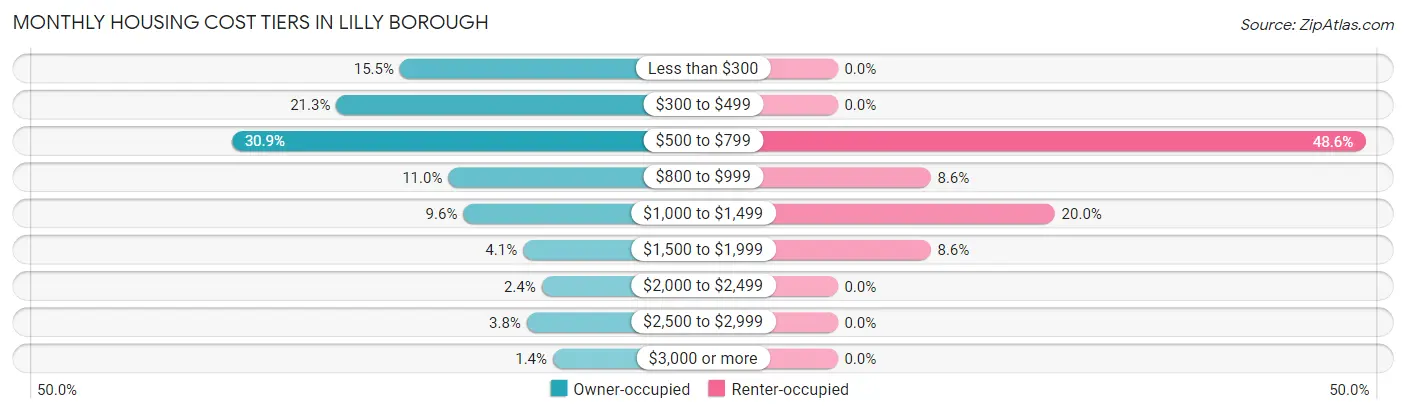
| Monthly Cost | Owner-occupied | Renter-occupied |
| Less than $300 | 45 (15.5%) | 0 (0.0%) |
| $300 to $499 | 62 (21.3%) | 0 (0.0%) |
| $500 to $799 | 90 (30.9%) | 17 (48.6%) |
| $800 to $999 | 32 (11.0%) | 3 (8.6%) |
| $1,000 to $1,499 | 28 (9.6%) | 7 (20.0%) |
| $1,500 to $1,999 | 12 (4.1%) | 3 (8.6%) |
| $2,000 to $2,499 | 7 (2.4%) | 0 (0.0%) |
| $2,500 to $2,999 | 11 (3.8%) | 0 (0.0%) |
| $3,000 or more | 4 (1.4%) | 0 (0.0%) |
| Total | 291 (100.0%) | 35 (100.0%) |
Physical Housing Characteristics in Lilly borough
Housing Structures in Lilly borough
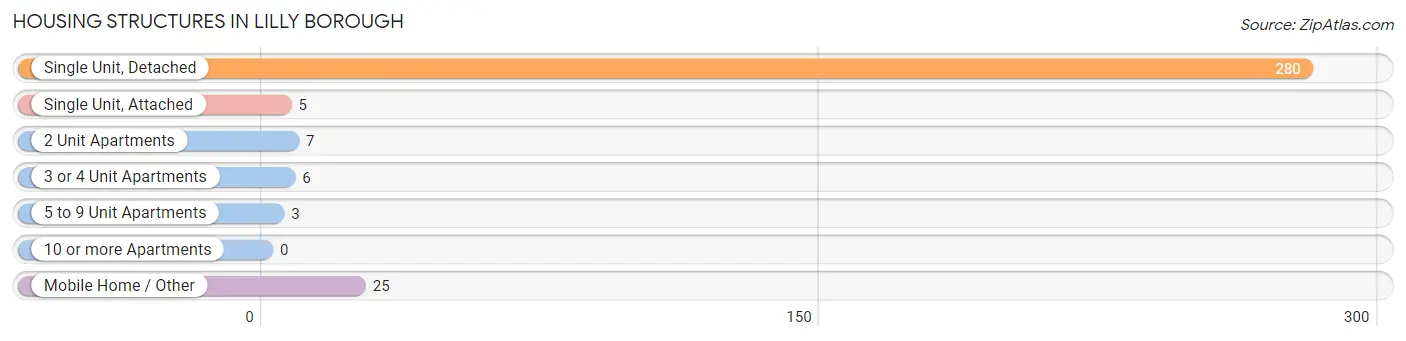
| Structure Type | # Housing Units | % Housing Units |
| Single Unit, Detached | 280 | 85.9% |
| Single Unit, Attached | 5 | 1.5% |
| 2 Unit Apartments | 7 | 2.1% |
| 3 or 4 Unit Apartments | 6 | 1.8% |
| 5 to 9 Unit Apartments | 3 | 0.9% |
| 10 or more Apartments | 0 | 0.0% |
| Mobile Home / Other | 25 | 7.7% |
| Total | 326 | 100.0% |
Housing Structures by Occupancy in Lilly borough
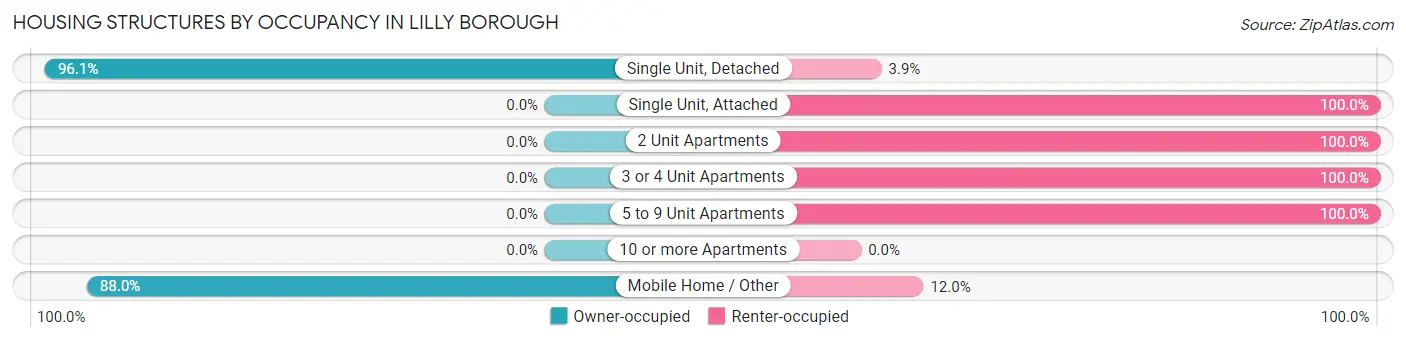
| Structure Type | Owner-occupied | Renter-occupied |
| Single Unit, Detached | 269 (96.1%) | 11 (3.9%) |
| Single Unit, Attached | 0 (0.0%) | 5 (100.0%) |
| 2 Unit Apartments | 0 (0.0%) | 7 (100.0%) |
| 3 or 4 Unit Apartments | 0 (0.0%) | 6 (100.0%) |
| 5 to 9 Unit Apartments | 0 (0.0%) | 3 (100.0%) |
| 10 or more Apartments | 0 (0.0%) | 0 (0.0%) |
| Mobile Home / Other | 22 (88.0%) | 3 (12.0%) |
| Total | 291 (89.3%) | 35 (10.7%) |
Housing Structures by Number of Rooms in Lilly borough
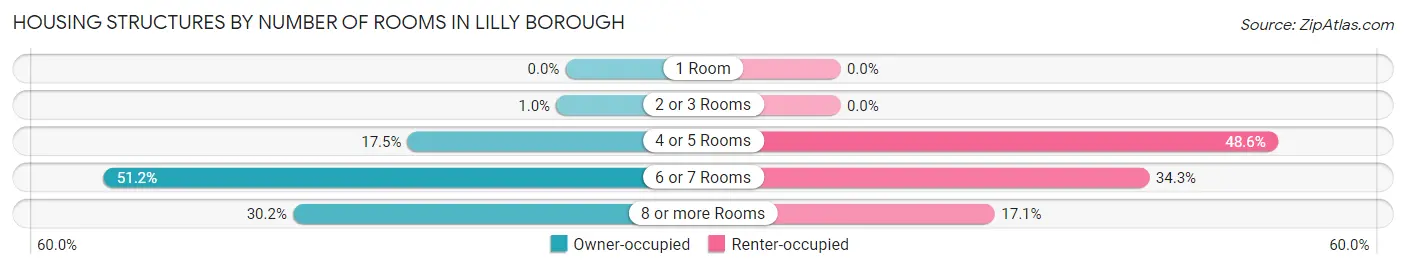
| Number of Rooms | Owner-occupied | Renter-occupied |
| 1 Room | 0 (0.0%) | 0 (0.0%) |
| 2 or 3 Rooms | 3 (1.0%) | 0 (0.0%) |
| 4 or 5 Rooms | 51 (17.5%) | 17 (48.6%) |
| 6 or 7 Rooms | 149 (51.2%) | 12 (34.3%) |
| 8 or more Rooms | 88 (30.2%) | 6 (17.1%) |
| Total | 291 (100.0%) | 35 (100.0%) |
Housing Structure by Heating Type in Lilly borough
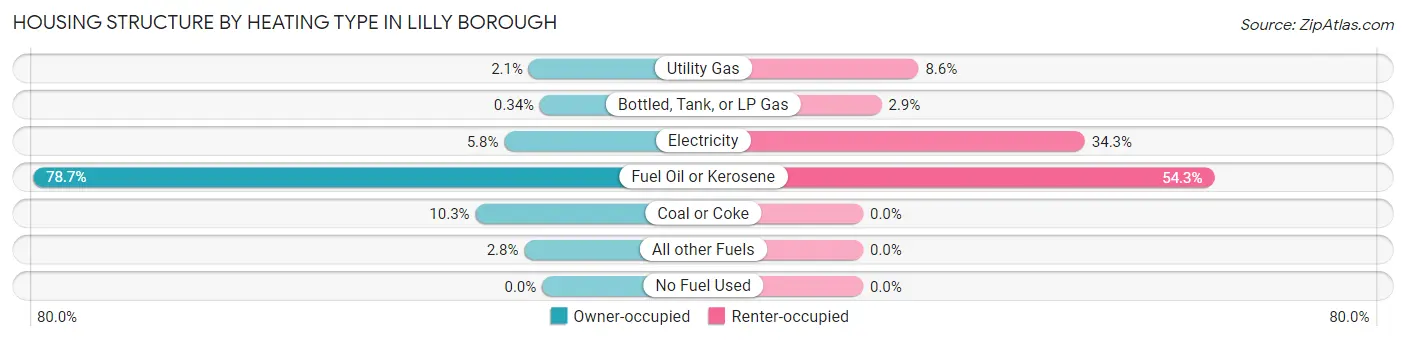
| Heating Type | Owner-occupied | Renter-occupied |
| Utility Gas | 6 (2.1%) | 3 (8.6%) |
| Bottled, Tank, or LP Gas | 1 (0.3%) | 1 (2.9%) |
| Electricity | 17 (5.8%) | 12 (34.3%) |
| Fuel Oil or Kerosene | 229 (78.7%) | 19 (54.3%) |
| Coal or Coke | 30 (10.3%) | 0 (0.0%) |
| All other Fuels | 8 (2.8%) | 0 (0.0%) |
| No Fuel Used | 0 (0.0%) | 0 (0.0%) |
| Total | 291 (100.0%) | 35 (100.0%) |
Household Vehicle Usage in Lilly borough
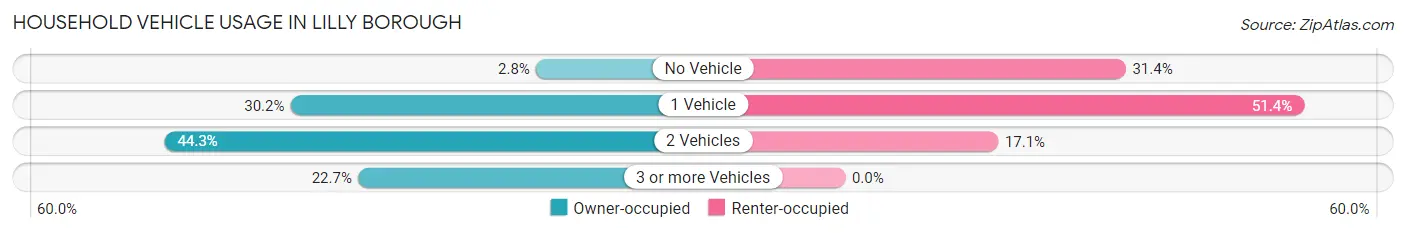
| Vehicles per Household | Owner-occupied | Renter-occupied |
| No Vehicle | 8 (2.8%) | 11 (31.4%) |
| 1 Vehicle | 88 (30.2%) | 18 (51.4%) |
| 2 Vehicles | 129 (44.3%) | 6 (17.1%) |
| 3 or more Vehicles | 66 (22.7%) | 0 (0.0%) |
| Total | 291 (100.0%) | 35 (100.0%) |
Real Estate & Mortgages in Lilly borough
Real Estate and Mortgage Overview in Lilly borough
| Characteristic | Without Mortgage | With Mortgage |
| Housing Units | 168 | 123 |
| Median Property Value | $99,400 | $95,000 |
| Median Household Income | $49,286 | $12 |
| Monthly Housing Costs | $434 | $4 |
| Real Estate Taxes | $981 | $7 |
Property Value by Mortgage Status in Lilly borough
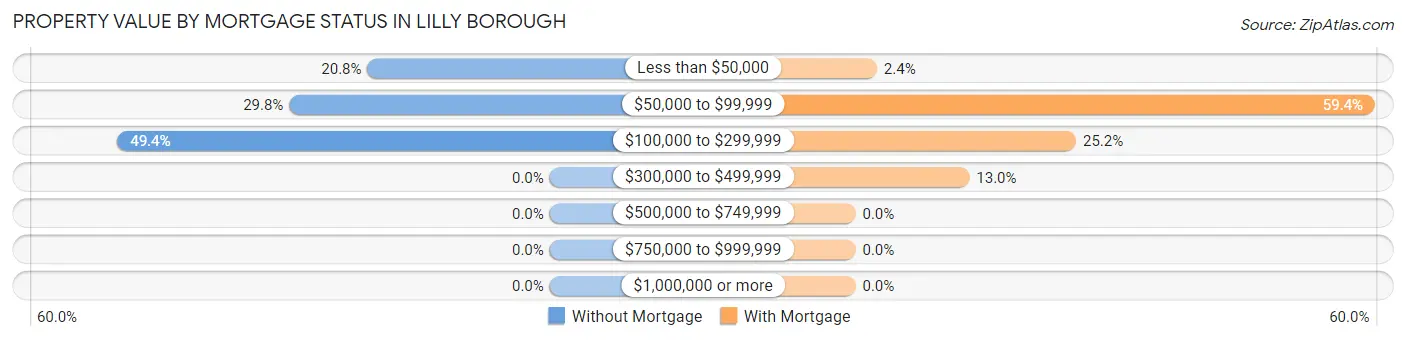
| Property Value | Without Mortgage | With Mortgage |
| Less than $50,000 | 35 (20.8%) | 3 (2.4%) |
| $50,000 to $99,999 | 50 (29.8%) | 73 (59.4%) |
| $100,000 to $299,999 | 83 (49.4%) | 31 (25.2%) |
| $300,000 to $499,999 | 0 (0.0%) | 16 (13.0%) |
| $500,000 to $749,999 | 0 (0.0%) | 0 (0.0%) |
| $750,000 to $999,999 | 0 (0.0%) | 0 (0.0%) |
| $1,000,000 or more | 0 (0.0%) | 0 (0.0%) |
| Total | 168 (100.0%) | 123 (100.0%) |
Household Income by Mortgage Status in Lilly borough
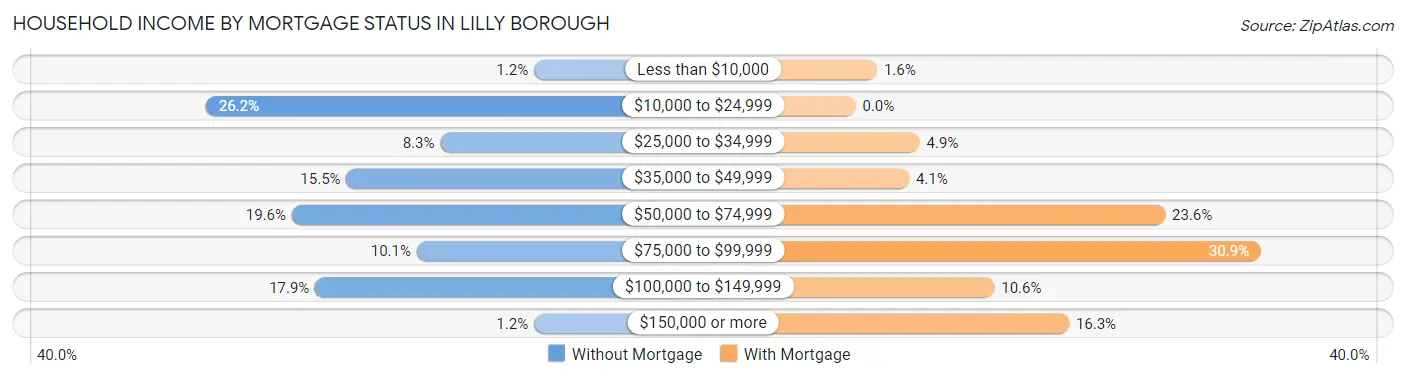
| Household Income | Without Mortgage | With Mortgage |
| Less than $10,000 | 2 (1.2%) | 2 (1.6%) |
| $10,000 to $24,999 | 44 (26.2%) | 0 (0.0%) |
| $25,000 to $34,999 | 14 (8.3%) | 6 (4.9%) |
| $35,000 to $49,999 | 26 (15.5%) | 5 (4.1%) |
| $50,000 to $74,999 | 33 (19.6%) | 29 (23.6%) |
| $75,000 to $99,999 | 17 (10.1%) | 38 (30.9%) |
| $100,000 to $149,999 | 30 (17.9%) | 13 (10.6%) |
| $150,000 or more | 2 (1.2%) | 20 (16.3%) |
| Total | 168 (100.0%) | 123 (100.0%) |
Property Value to Household Income Ratio in Lilly borough
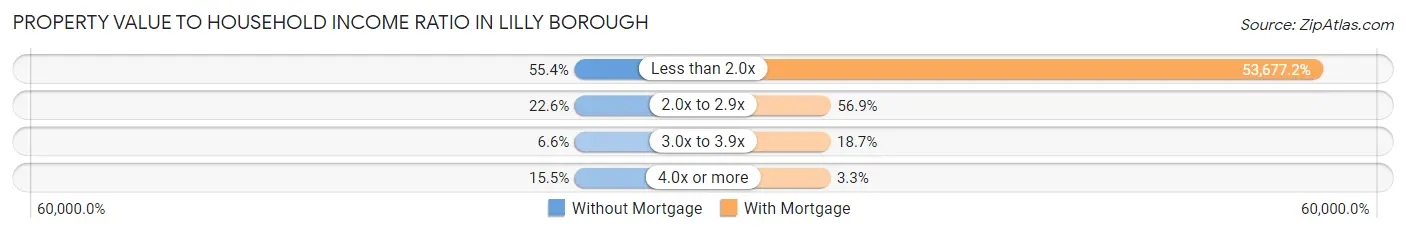
| Value-to-Income Ratio | Without Mortgage | With Mortgage |
| Less than 2.0x | 93 (55.4%) | 66,023 (53,677.2%) |
| 2.0x to 2.9x | 38 (22.6%) | 70 (56.9%) |
| 3.0x to 3.9x | 11 (6.6%) | 23 (18.7%) |
| 4.0x or more | 26 (15.5%) | 4 (3.3%) |
| Total | 168 (100.0%) | 123 (100.0%) |
Real Estate Taxes by Mortgage Status in Lilly borough
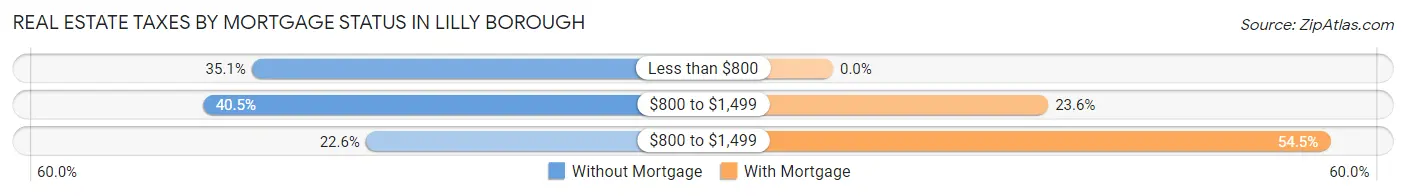
| Property Taxes | Without Mortgage | With Mortgage |
| Less than $800 | 59 (35.1%) | 0 (0.0%) |
| $800 to $1,499 | 68 (40.5%) | 29 (23.6%) |
| $800 to $1,499 | 38 (22.6%) | 67 (54.5%) |
| Total | 168 (100.0%) | 123 (100.0%) |
Health & Disability in Lilly borough
Health Insurance Coverage by Age in Lilly borough
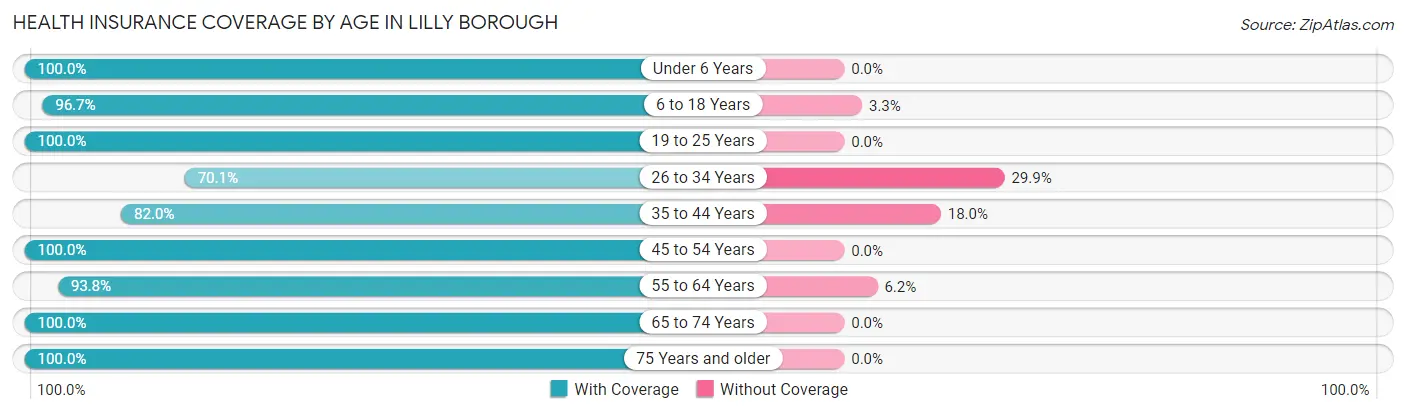
| Age Bracket | With Coverage | Without Coverage |
| Under 6 Years | 59 (100.0%) | 0 (0.0%) |
| 6 to 18 Years | 117 (96.7%) | 4 (3.3%) |
| 19 to 25 Years | 63 (100.0%) | 0 (0.0%) |
| 26 to 34 Years | 54 (70.1%) | 23 (29.9%) |
| 35 to 44 Years | 82 (82.0%) | 18 (18.0%) |
| 45 to 54 Years | 83 (100.0%) | 0 (0.0%) |
| 55 to 64 Years | 91 (93.8%) | 6 (6.2%) |
| 65 to 74 Years | 82 (100.0%) | 0 (0.0%) |
| 75 Years and older | 95 (100.0%) | 0 (0.0%) |
| Total | 726 (93.4%) | 51 (6.6%) |
Health Insurance Coverage by Citizenship Status in Lilly borough
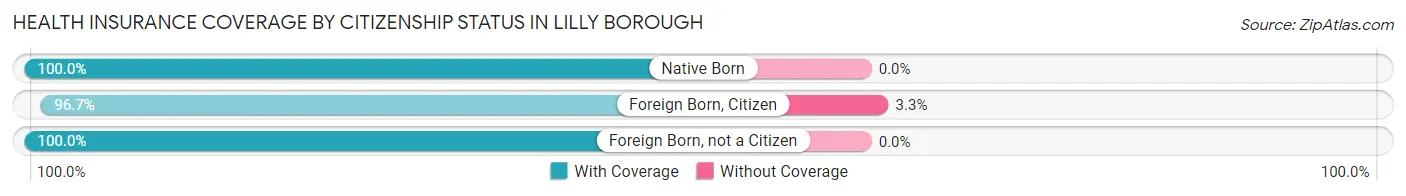
| Citizenship Status | With Coverage | Without Coverage |
| Native Born | 59 (100.0%) | 0 (0.0%) |
| Foreign Born, Citizen | 117 (96.7%) | 4 (3.3%) |
| Foreign Born, not a Citizen | 63 (100.0%) | 0 (0.0%) |
Health Insurance Coverage by Household Income in Lilly borough
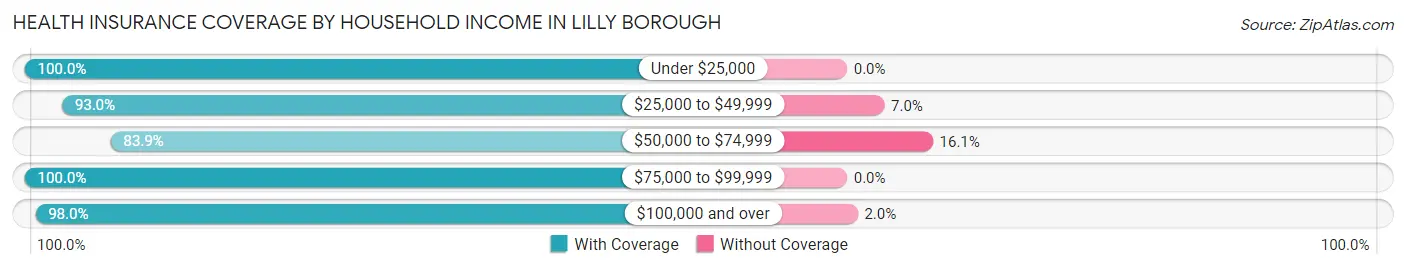
| Household Income | With Coverage | Without Coverage |
| Under $25,000 | 98 (100.0%) | 0 (0.0%) |
| $25,000 to $49,999 | 173 (93.0%) | 13 (7.0%) |
| $50,000 to $74,999 | 167 (83.9%) | 32 (16.1%) |
| $75,000 to $99,999 | 87 (100.0%) | 0 (0.0%) |
| $100,000 and over | 196 (98.0%) | 4 (2.0%) |
Public vs Private Health Insurance Coverage by Age in Lilly borough
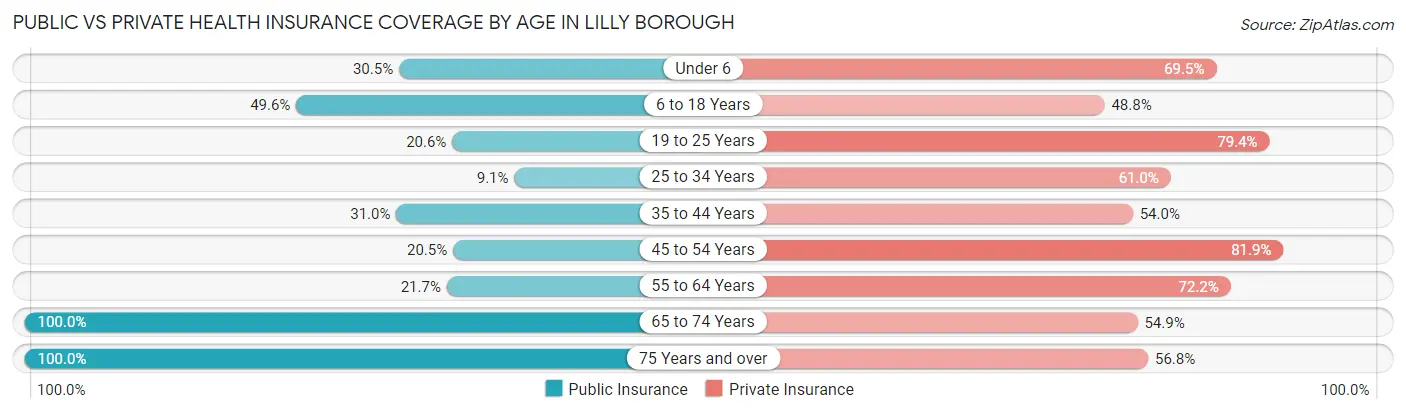
| Age Bracket | Public Insurance | Private Insurance |
| Under 6 | 18 (30.5%) | 41 (69.5%) |
| 6 to 18 Years | 60 (49.6%) | 59 (48.8%) |
| 19 to 25 Years | 13 (20.6%) | 50 (79.4%) |
| 25 to 34 Years | 7 (9.1%) | 47 (61.0%) |
| 35 to 44 Years | 31 (31.0%) | 54 (54.0%) |
| 45 to 54 Years | 17 (20.5%) | 68 (81.9%) |
| 55 to 64 Years | 21 (21.6%) | 70 (72.2%) |
| 65 to 74 Years | 82 (100.0%) | 45 (54.9%) |
| 75 Years and over | 95 (100.0%) | 54 (56.8%) |
| Total | 344 (44.3%) | 488 (62.8%) |
Disability Status by Sex by Age in Lilly borough
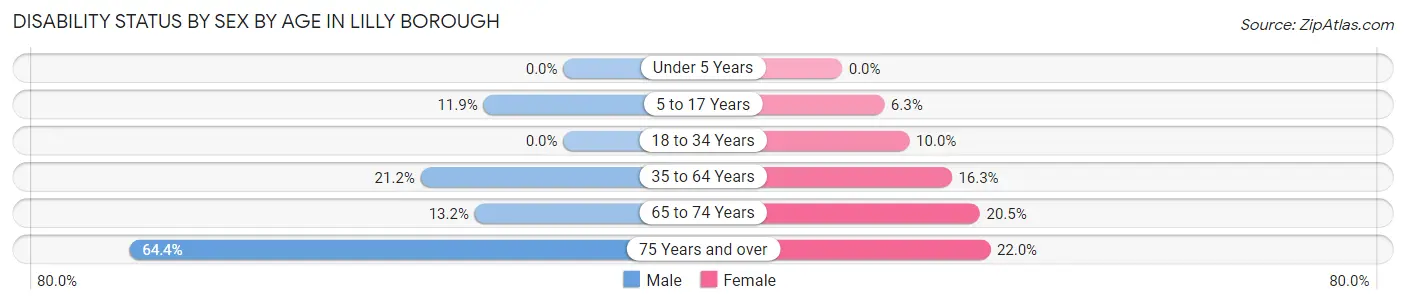
| Age Bracket | Male | Female |
| Under 5 Years | 0 (0.0%) | 0 (0.0%) |
| 5 to 17 Years | 7 (11.9%) | 4 (6.2%) |
| 18 to 34 Years | 0 (0.0%) | 8 (10.0%) |
| 35 to 64 Years | 32 (21.2%) | 21 (16.3%) |
| 65 to 74 Years | 5 (13.2%) | 9 (20.4%) |
| 75 Years and over | 29 (64.4%) | 11 (22.0%) |
Disability Class by Sex by Age in Lilly borough
Disability Class: Hearing Difficulty
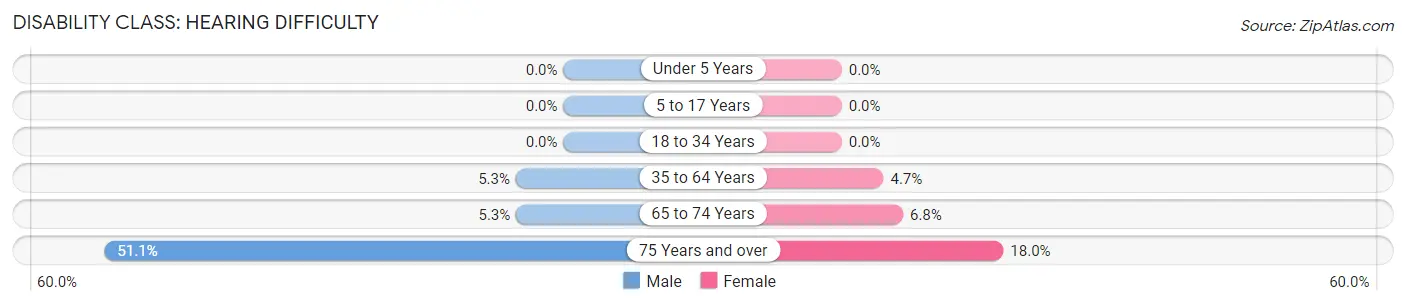
| Age Bracket | Male | Female |
| Under 5 Years | 0 (0.0%) | 0 (0.0%) |
| 5 to 17 Years | 0 (0.0%) | 0 (0.0%) |
| 18 to 34 Years | 0 (0.0%) | 0 (0.0%) |
| 35 to 64 Years | 8 (5.3%) | 6 (4.6%) |
| 65 to 74 Years | 2 (5.3%) | 3 (6.8%) |
| 75 Years and over | 23 (51.1%) | 9 (18.0%) |
Disability Class: Vision Difficulty
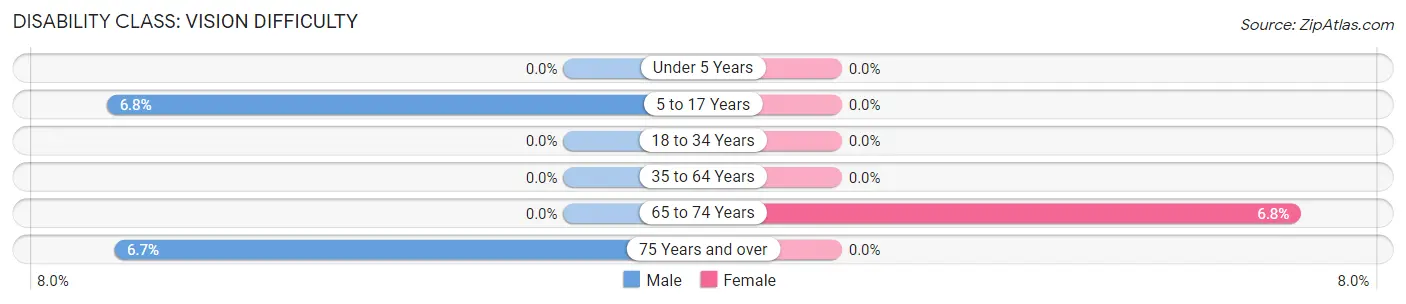
| Age Bracket | Male | Female |
| Under 5 Years | 0 (0.0%) | 0 (0.0%) |
| 5 to 17 Years | 4 (6.8%) | 0 (0.0%) |
| 18 to 34 Years | 0 (0.0%) | 0 (0.0%) |
| 35 to 64 Years | 0 (0.0%) | 0 (0.0%) |
| 65 to 74 Years | 0 (0.0%) | 3 (6.8%) |
| 75 Years and over | 3 (6.7%) | 0 (0.0%) |
Disability Class: Cognitive Difficulty
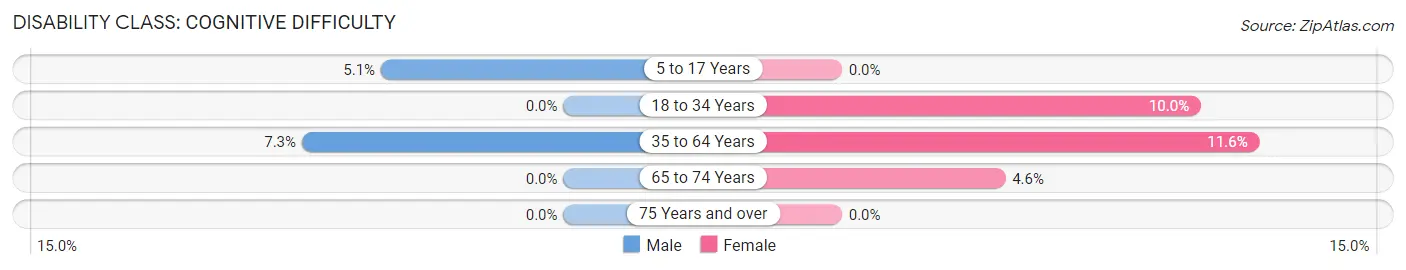
| Age Bracket | Male | Female |
| 5 to 17 Years | 3 (5.1%) | 0 (0.0%) |
| 18 to 34 Years | 0 (0.0%) | 8 (10.0%) |
| 35 to 64 Years | 11 (7.3%) | 15 (11.6%) |
| 65 to 74 Years | 0 (0.0%) | 2 (4.5%) |
| 75 Years and over | 0 (0.0%) | 0 (0.0%) |
Disability Class: Ambulatory Difficulty
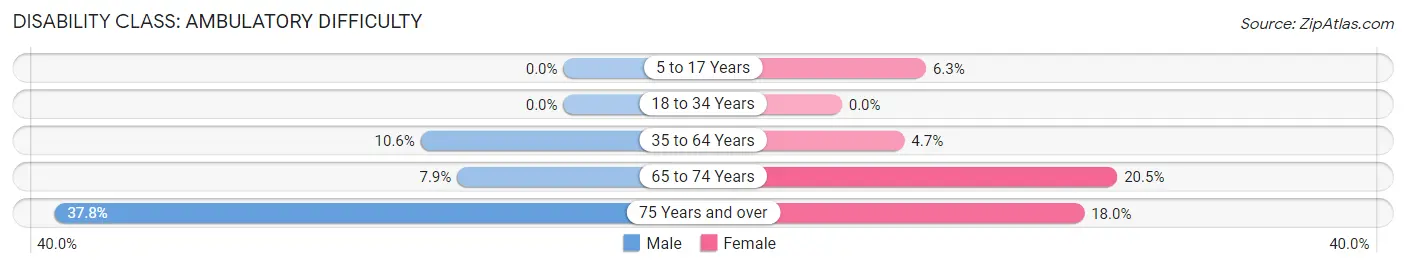
| Age Bracket | Male | Female |
| 5 to 17 Years | 0 (0.0%) | 4 (6.2%) |
| 18 to 34 Years | 0 (0.0%) | 0 (0.0%) |
| 35 to 64 Years | 16 (10.6%) | 6 (4.6%) |
| 65 to 74 Years | 3 (7.9%) | 9 (20.4%) |
| 75 Years and over | 17 (37.8%) | 9 (18.0%) |
Disability Class: Self-Care Difficulty
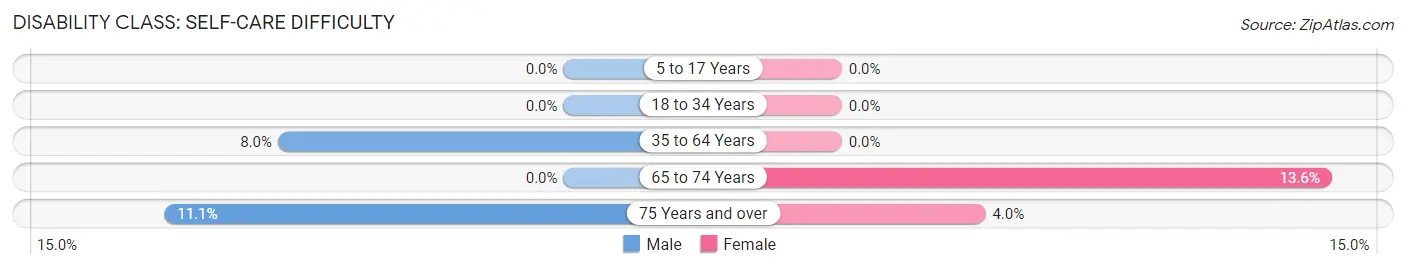
| Age Bracket | Male | Female |
| 5 to 17 Years | 0 (0.0%) | 0 (0.0%) |
| 18 to 34 Years | 0 (0.0%) | 0 (0.0%) |
| 35 to 64 Years | 12 (8.0%) | 0 (0.0%) |
| 65 to 74 Years | 0 (0.0%) | 6 (13.6%) |
| 75 Years and over | 5 (11.1%) | 2 (4.0%) |
Technology Access in Lilly borough
Computing Device Access in Lilly borough
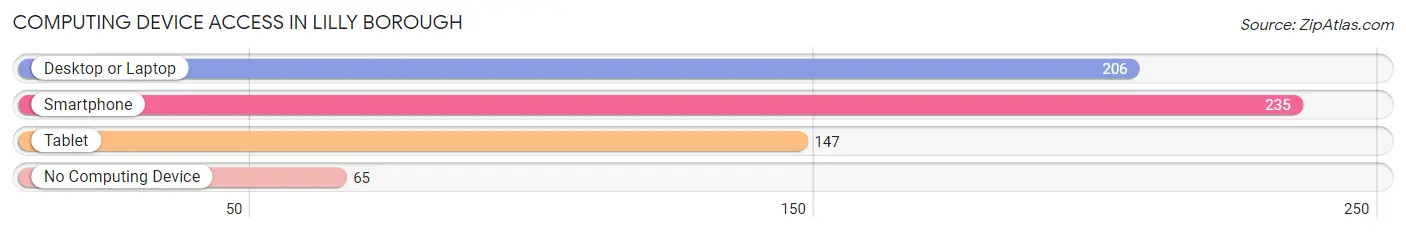
| Device Type | # Households | % Households |
| Desktop or Laptop | 206 | 63.2% |
| Smartphone | 235 | 72.1% |
| Tablet | 147 | 45.1% |
| No Computing Device | 65 | 19.9% |
| Total | 326 | 100.0% |
Internet Access in Lilly borough
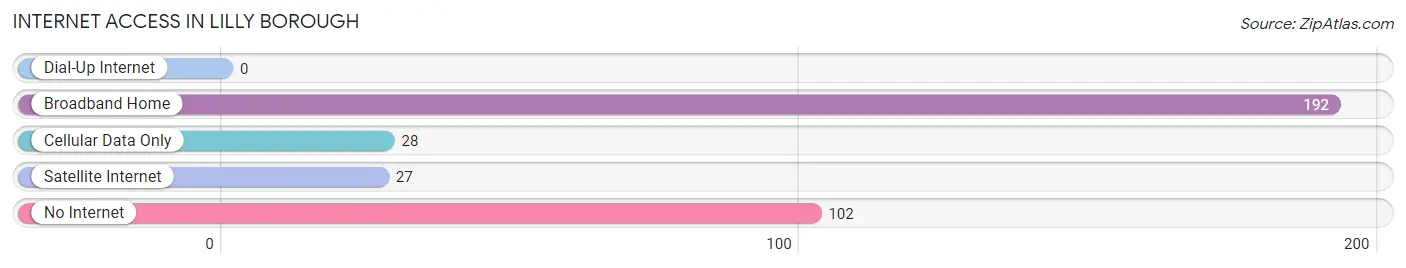
| Internet Type | # Households | % Households |
| Dial-Up Internet | 0 | 0.0% |
| Broadband Home | 192 | 58.9% |
| Cellular Data Only | 28 | 8.6% |
| Satellite Internet | 27 | 8.3% |
| No Internet | 102 | 31.3% |
| Total | 326 | 100.0% |
Lilly borough Summary
Lilly Borough is a small borough located in Cambria County, Pennsylvania. It is situated in the foothills of the Allegheny Mountains, approximately 10 miles east of Johnstown. The borough was founded in 1872 and is home to a population of approximately 1,500 people.
Geography
Lilly Borough is located in the foothills of the Allegheny Mountains, approximately 10 miles east of Johnstown. The borough is situated in a valley surrounded by hills and mountains. The terrain is mostly hilly and wooded, with some flat areas. The borough is located in the Eastern Standard Time Zone and has an elevation of 1,845 feet.
The borough is located in the Conemaugh River watershed and is bordered by the townships of Jackson, East Taylor, and West Taylor. The borough is served by two major highways, US Route 219 and Pennsylvania Route 403.
Climate
Lilly Borough has a humid continental climate, with cold winters and warm summers. The average annual temperature is 48°F, with an average high of 68°F in July and an average low of 28°F in January. The average annual precipitation is 40 inches, with an average of 4 inches of snowfall per year.
Demographics
As of the 2010 census, the population of Lilly Borough was 1,521, with a population density of 1,092 people per square mile. The median age was 43.7 years, with a gender ratio of 49.3% male and 50.7% female. The median household income was $37,917, and the median family income was $45,938.
The racial makeup of the borough was 97.2% White, 0.7% African American, 0.2% Native American, 0.3% Asian, 0.2% from other races, and 1.4% from two or more races. Hispanic or Latino of any race were 0.7% of the population.
Economy
Lilly Borough is a small, rural community with a primarily agricultural economy. The borough is home to several small businesses, including a grocery store, a hardware store, and a few restaurants. The borough is also home to a few manufacturing companies, including a furniture manufacturer and a metal fabrication company.
The borough is served by the Conemaugh Valley School District, which includes two elementary schools, a middle school, and a high school. The borough is also home to a branch of the Cambria County Library.
Conclusion
Lilly Borough is a small borough located in Cambria County, Pennsylvania. It is situated in the foothills of the Allegheny Mountains, approximately 10 miles east of Johnstown. The borough was founded in 1872 and is home to a population of approximately 1,500 people. The borough has a humid continental climate, with cold winters and warm summers. The racial makeup of the borough is 97.2% White, 0.7% African American, 0.2% Native American, 0.3% Asian, 0.2% from other races, and 1.4% from two or more races. The borough has a primarily agricultural economy, with several small businesses and manufacturing companies. The borough is served by the Conemaugh Valley School District and is home to a branch of the Cambria County Library.
Common Questions
What is the Total Population of Lilly borough?
Total Population of Lilly borough is 777.
What is the Total Male Population of Lilly borough?
Total Male Population of Lilly borough is 365.
What is the Total Female Population of Lilly borough?
Total Female Population of Lilly borough is 412.
What is the Ratio of Males per 100 Females in Lilly borough?
There are 88.59 Males per 100 Females in Lilly borough.
What is the Ratio of Females per 100 Males in Lilly borough?
There are 112.88 Females per 100 Males in Lilly borough.
What is the Median Population Age in Lilly borough?
Median Population Age in Lilly borough is 42.4 Years.
What is the Average Family Size in Lilly borough
Average Family Size in Lilly borough is 2.7 People.
What is the Average Household Size in Lilly borough
Average Household Size in Lilly borough is 2.4 People.
What is Per Capita Income in Lilly borough?
Per Capita income in Lilly borough is $27,291.
What is the Median Family Income in Lilly borough?
Median Family Income in Lilly borough is $60,625.
What is the Median Household income in Lilly borough?
Median Household Income in Lilly borough is $54,250.
What is Income or Wage Gap in Lilly borough?
Income or Wage Gap in Lilly borough is 37.3%.
Women in Lilly borough earn 62.7 cents for every dollar earned by a man.
What is Inequality or Gini Index in Lilly borough?
Inequality or Gini Index in Lilly borough is 0.37.
How Large is the Labor Force in Lilly borough?
There are 343 People in the Labor Forcein in Lilly borough.
What is the Percentage of People in the Labor Force in Lilly borough?
55.4% of People are in the Labor Force in Lilly borough.
What is the Unemployment Rate in Lilly borough?
Unemployment Rate in Lilly borough is 6.1%.