Lemont Furnace, PA
Lemont Furnace Map
Lemont Furnace Overview
1,034
TOTAL POPULATION
575
MALE POPULATION
459
FEMALE POPULATION
125.27
MALES / 100 FEMALES
79.83
FEMALES / 100 MALES
28.5
MEDIAN AGE
4.1
AVG FAMILY SIZE
3.1
AVG HOUSEHOLD SIZE
$20,251
PER CAPITA INCOME
$61,328
AVG FAMILY INCOME
$46,250
AVG HOUSEHOLD INCOME
32.6%
WAGE / INCOME GAP [ % ]
67.4¢/ $1
WAGE / INCOME GAP [ $ ]
0.37
INEQUALITY / GINI INDEX
391
LABOR FORCE [ PEOPLE ]
48.6%
PERCENT IN LABOR FORCE
4.3%
UNEMPLOYMENT RATE
Lemont Furnace Zip Codes
Race in Lemont Furnace
The most populous races in Lemont Furnace are White / Caucasian (704 | 68.1%), Black / African American (237 | 22.9%), and Two or more Races (74 | 7.2%).
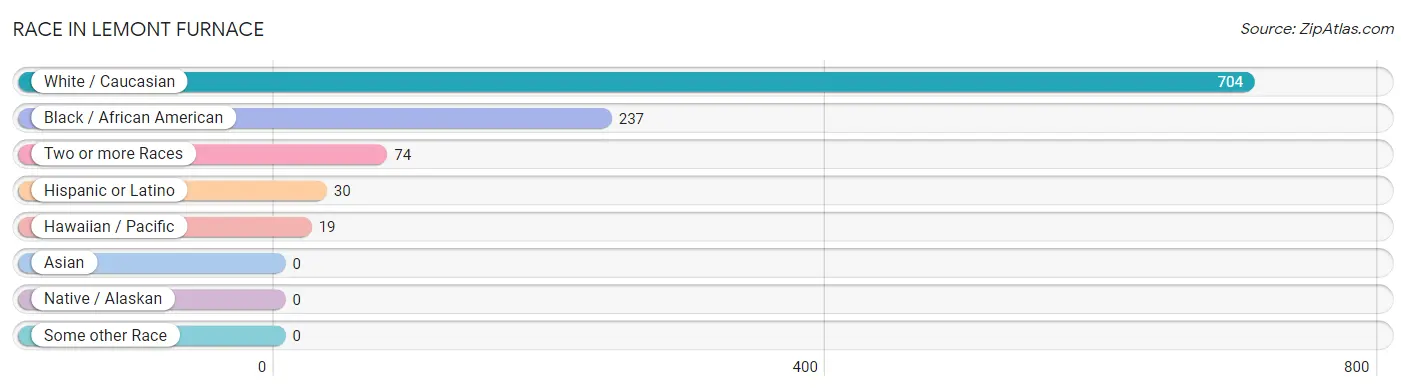
| Race | # Population | % Population |
| Asian | 0 | 0.0% |
| Black / African American | 237 | 22.9% |
| Hawaiian / Pacific | 19 | 1.8% |
| Hispanic or Latino | 30 | 2.9% |
| Native / Alaskan | 0 | 0.0% |
| White / Caucasian | 704 | 68.1% |
| Two or more Races | 74 | 7.2% |
| Some other Race | 0 | 0.0% |
| Total | 1,034 | 100.0% |
Ancestry in Lemont Furnace
The most populous ancestries reported in Lemont Furnace are German (155 | 15.0%), Irish (120 | 11.6%), Dutch (91 | 8.8%), Spanish (30 | 2.9%), and Italian (27 | 2.6%), together accounting for 40.9% of all Lemont Furnace residents.
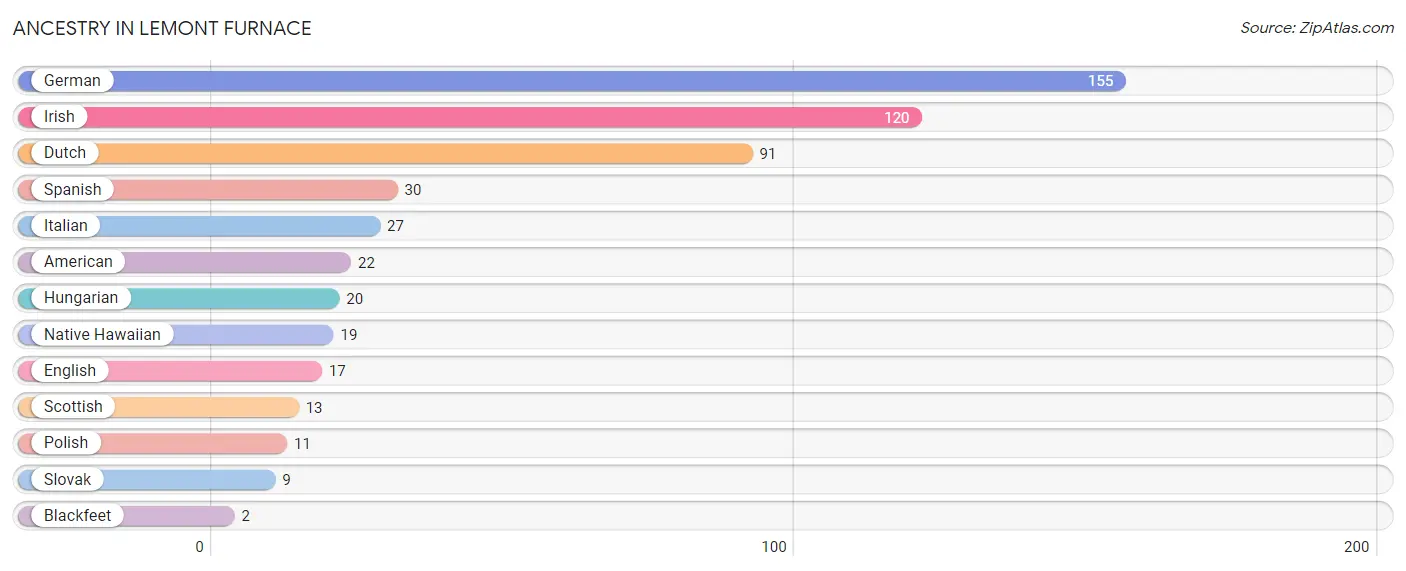
| Ancestry | # Population | % Population |
| American | 22 | 2.1% |
| Blackfeet | 2 | 0.2% |
| Dutch | 91 | 8.8% |
| English | 17 | 1.6% |
| German | 155 | 15.0% |
| Hungarian | 20 | 1.9% |
| Irish | 120 | 11.6% |
| Italian | 27 | 2.6% |
| Native Hawaiian | 19 | 1.8% |
| Polish | 11 | 1.1% |
| Scottish | 13 | 1.3% |
| Slovak | 9 | 0.9% |
| Spanish | 30 | 2.9% | View All 13 Rows |
Immigrants in Lemont Furnace

| Immigration Origin | # Population | % Population | View All 0 Rows |
Sex and Age in Lemont Furnace
Sex and Age in Lemont Furnace
The most populous age groups in Lemont Furnace are 20 to 24 Years (118 | 20.5%) for men and 20 to 24 Years (100 | 21.8%) for women.
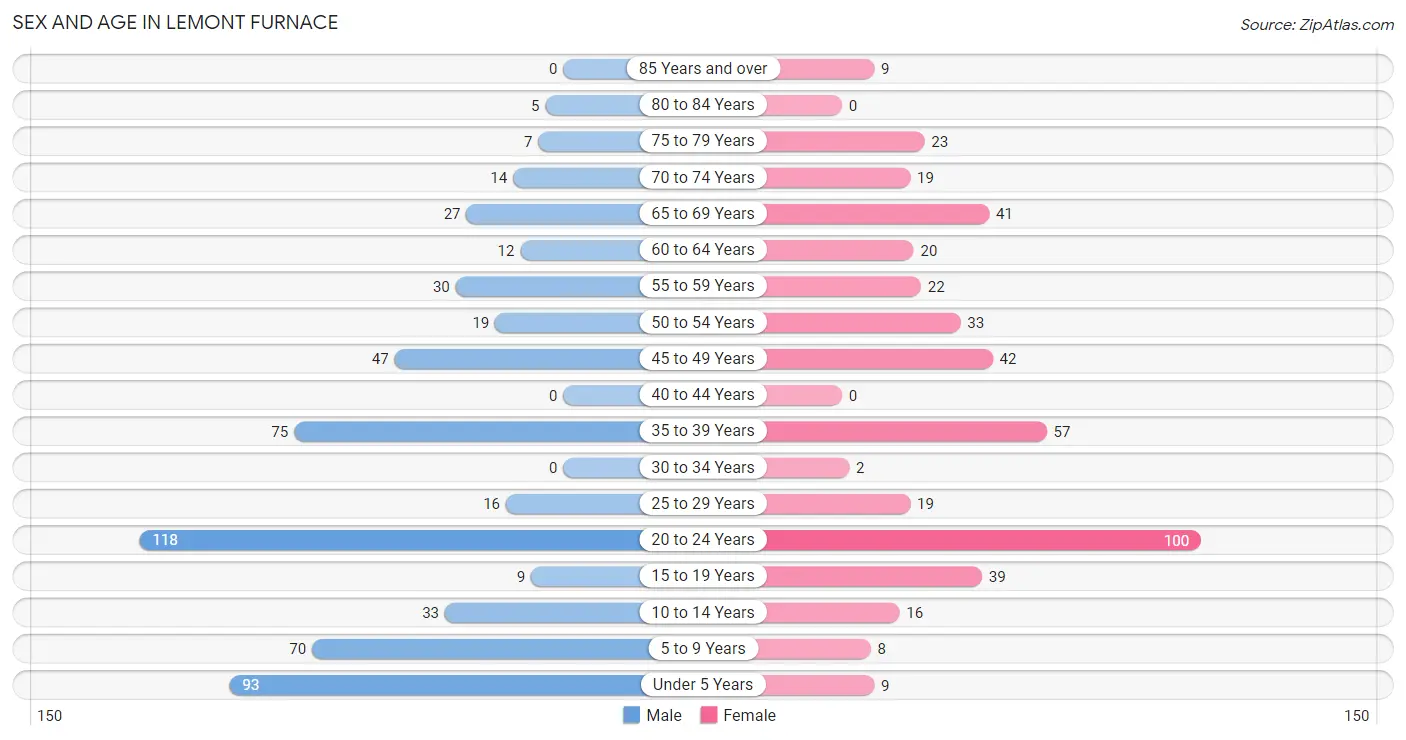
| Age Bracket | Male | Female |
| Under 5 Years | 93 (16.2%) | 9 (2.0%) |
| 5 to 9 Years | 70 (12.2%) | 8 (1.7%) |
| 10 to 14 Years | 33 (5.7%) | 16 (3.5%) |
| 15 to 19 Years | 9 (1.6%) | 39 (8.5%) |
| 20 to 24 Years | 118 (20.5%) | 100 (21.8%) |
| 25 to 29 Years | 16 (2.8%) | 19 (4.1%) |
| 30 to 34 Years | 0 (0.0%) | 2 (0.4%) |
| 35 to 39 Years | 75 (13.0%) | 57 (12.4%) |
| 40 to 44 Years | 0 (0.0%) | 0 (0.0%) |
| 45 to 49 Years | 47 (8.2%) | 42 (9.1%) |
| 50 to 54 Years | 19 (3.3%) | 33 (7.2%) |
| 55 to 59 Years | 30 (5.2%) | 22 (4.8%) |
| 60 to 64 Years | 12 (2.1%) | 20 (4.4%) |
| 65 to 69 Years | 27 (4.7%) | 41 (8.9%) |
| 70 to 74 Years | 14 (2.4%) | 19 (4.1%) |
| 75 to 79 Years | 7 (1.2%) | 23 (5.0%) |
| 80 to 84 Years | 5 (0.9%) | 0 (0.0%) |
| 85 Years and over | 0 (0.0%) | 9 (2.0%) |
| Total | 575 (100.0%) | 459 (100.0%) |
Families and Households in Lemont Furnace
Median Family Size in Lemont Furnace
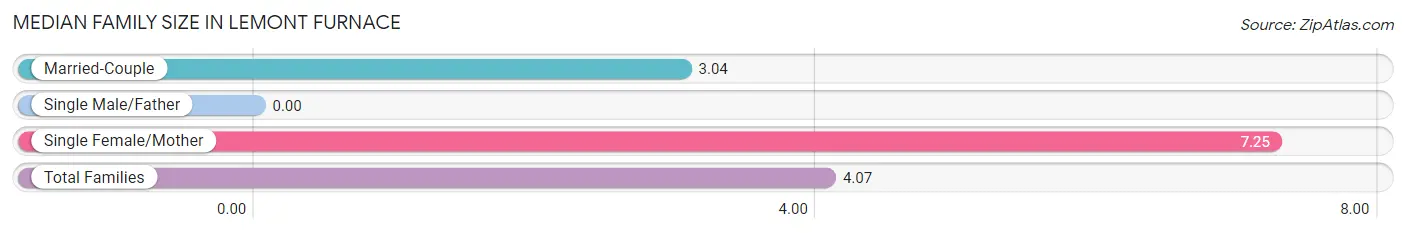
| Family Type | # Families | Family Size |
| Married-Couple | 161 (75.6%) | 3.04 |
| Single Male/Father | 0 (0.0%) | - |
| Single Female/Mother | 52 (24.4%) | 7.25 |
| Total Families | 213 (100.0%) | 4.07 |
Median Household Size in Lemont Furnace
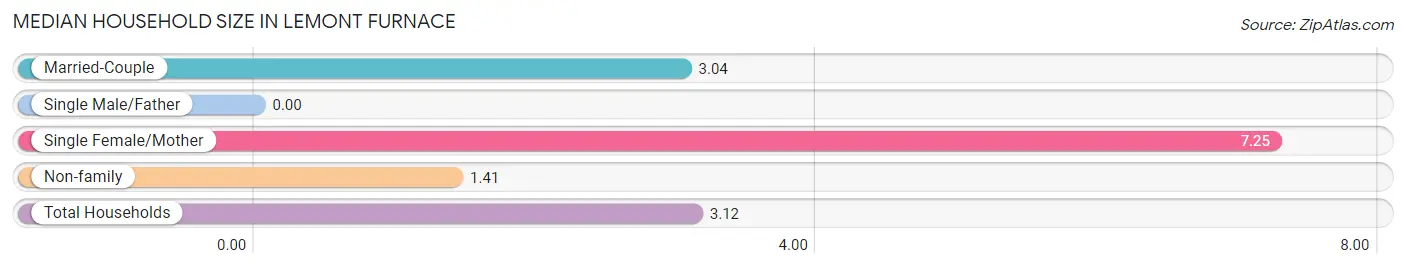
| Household Type | # Households | Household Size |
| Married-Couple | 161 (48.6%) | 3.04 |
| Single Male/Father | 0 (0.0%) | - |
| Single Female/Mother | 52 (15.7%) | 7.25 |
| Non-family | 118 (35.6%) | 1.41 |
| Total Households | 331 (100.0%) | 3.12 |
Household Size by Marriage Status in Lemont Furnace
Out of a total of 331 households in Lemont Furnace, 213 (64.3%) are family households, while 118 (35.6%) are nonfamily households. The most numerous type of family households are 2-person households, comprising 104, and the most common type of nonfamily households are 1-person households, comprising 76.
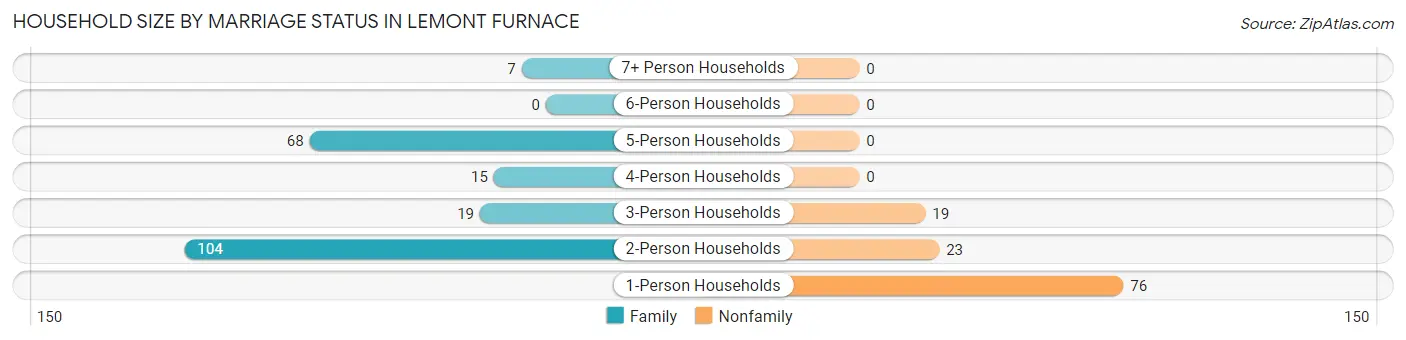
| Household Size | Family Households | Nonfamily Households |
| 1-Person Households | - | 76 (23.0%) |
| 2-Person Households | 104 (31.4%) | 23 (7.0%) |
| 3-Person Households | 19 (5.7%) | 19 (5.7%) |
| 4-Person Households | 15 (4.5%) | 0 (0.0%) |
| 5-Person Households | 68 (20.5%) | 0 (0.0%) |
| 6-Person Households | 0 (0.0%) | 0 (0.0%) |
| 7+ Person Households | 7 (2.1%) | 0 (0.0%) |
| Total | 213 (64.3%) | 118 (35.6%) |
Female Fertility in Lemont Furnace
Fertility by Age in Lemont Furnace
| Age Bracket | Women with Births | Births / 1,000 Women |
| 15 to 19 years | 0 (0.0%) | 0.0 |
| 20 to 34 years | 0 (0.0%) | 0.0 |
| 35 to 50 years | 0 (0.0%) | 0.0 |
| Total | 0 (0.0%) | 0.0 |
Fertility by Age by Marriage Status in Lemont Furnace
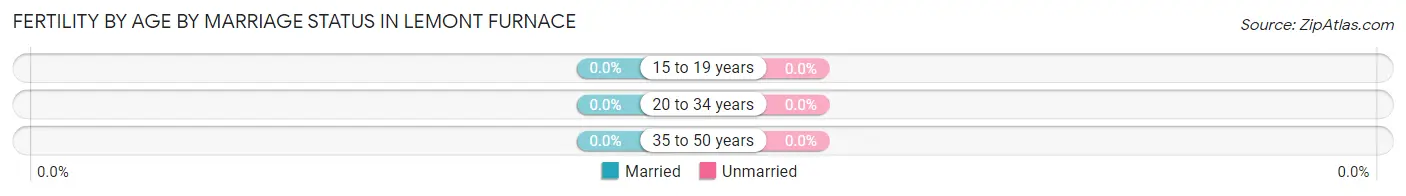
| Age Bracket | Married | Unmarried |
| 15 to 19 years | 0 (0.0%) | 0 (0.0%) |
| 20 to 34 years | 0 (0.0%) | 0 (0.0%) |
| 35 to 50 years | 0 (0.0%) | 0 (0.0%) |
| Total | 0 (0.0%) | 0 (0.0%) |
Fertility by Education in Lemont Furnace
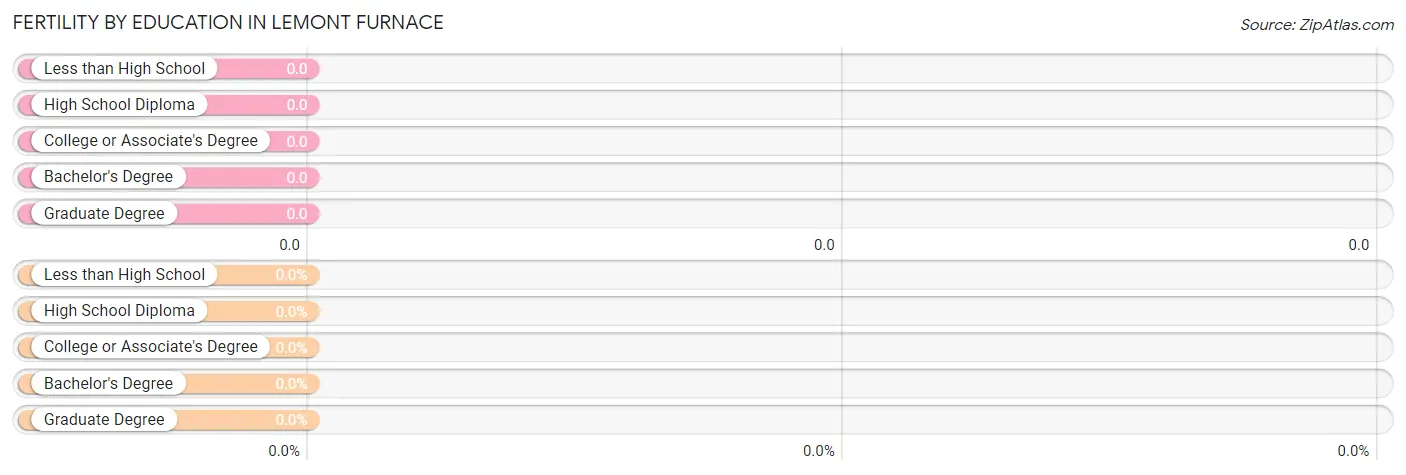
| Educational Attainment | Women with Births | Births / 1,000 Women |
| Less than High School | 0 (0.0%) | 0.0 |
| High School Diploma | 0 (0.0%) | 0.0 |
| College or Associate's Degree | 0 (0.0%) | 0.0 |
| Bachelor's Degree | 0 (0.0%) | 0.0 |
| Graduate Degree | 0 (0.0%) | 0.0 |
| Total | 0 (0.0%) | 0.0 |
Fertility by Education by Marriage Status in Lemont Furnace
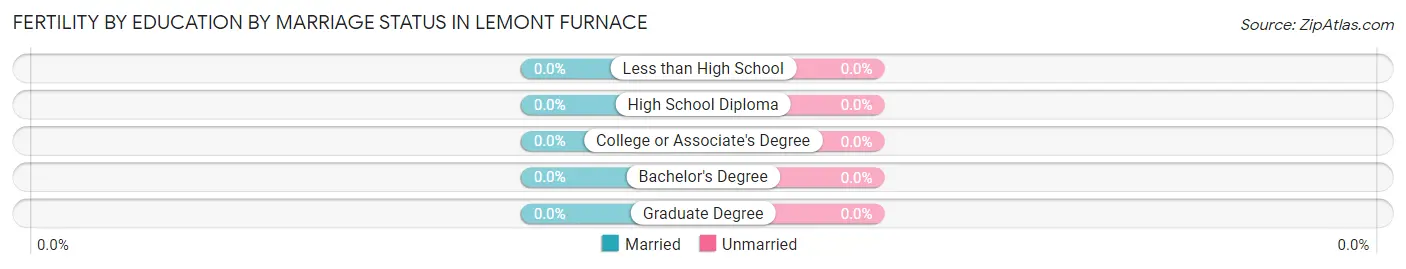
| Educational Attainment | Married | Unmarried |
| Less than High School | 0 (0.0%) | 0 (0.0%) |
| High School Diploma | 0 (0.0%) | 0 (0.0%) |
| College or Associate's Degree | 0 (0.0%) | 0 (0.0%) |
| Bachelor's Degree | 0 (0.0%) | 0 (0.0%) |
| Graduate Degree | 0 (0.0%) | 0 (0.0%) |
| Total | 0 (0.0%) | 0 (0.0%) |
Income in Lemont Furnace
Income Overview in Lemont Furnace
Per Capita Income in Lemont Furnace is $20,251, while median incomes of families and households are $61,328 and $46,250 respectively.
| Characteristic | Number | Measure |
| Per Capita Income | 1,034 | $20,251 |
| Median Family Income | 213 | $61,328 |
| Mean Family Income | 213 | $74,931 |
| Median Household Income | 331 | $46,250 |
| Mean Household Income | 331 | $60,395 |
| Income Deficit | 213 | $0 |
| Wage / Income Gap (%) | 1,034 | 32.56% |
| Wage / Income Gap ($) | 1,034 | 67.44¢ per $1 |
| Gini / Inequality Index | 1,034 | 0.37 |
Earnings by Sex in Lemont Furnace
Average Earnings in Lemont Furnace are $32,566, $42,292 for men and $28,520 for women, a difference of 32.6%.
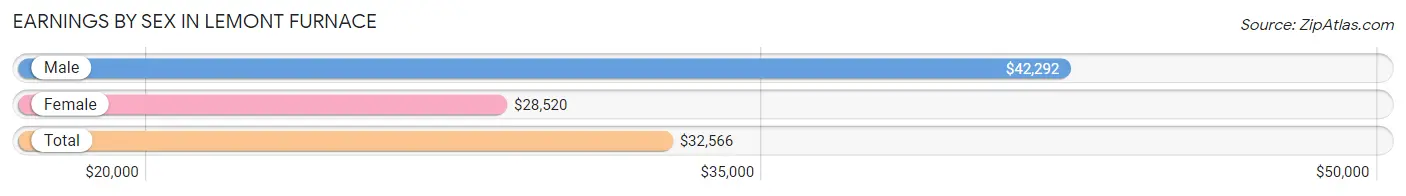
| Sex | Number | Average Earnings |
| Male | 149 (33.9%) | $42,292 |
| Female | 290 (66.1%) | $28,520 |
| Total | 439 (100.0%) | $32,566 |
Earnings by Sex by Income Bracket in Lemont Furnace
The most common earnings brackets in Lemont Furnace are $50,000 to $54,999 for men (34 | 22.8%) and $25,000 to $29,999 for women (76 | 26.2%).
| Income | Male | Female |
| $2,499 or less | 0 (0.0%) | 39 (13.5%) |
| $2,500 to $4,999 | 0 (0.0%) | 0 (0.0%) |
| $5,000 to $7,499 | 6 (4.0%) | 8 (2.8%) |
| $7,500 to $9,999 | 0 (0.0%) | 20 (6.9%) |
| $10,000 to $12,499 | 0 (0.0%) | 0 (0.0%) |
| $12,500 to $14,999 | 0 (0.0%) | 27 (9.3%) |
| $15,000 to $17,499 | 0 (0.0%) | 20 (6.9%) |
| $17,500 to $19,999 | 16 (10.7%) | 0 (0.0%) |
| $20,000 to $22,499 | 0 (0.0%) | 0 (0.0%) |
| $22,500 to $24,999 | 0 (0.0%) | 0 (0.0%) |
| $25,000 to $29,999 | 0 (0.0%) | 76 (26.2%) |
| $30,000 to $34,999 | 26 (17.4%) | 0 (0.0%) |
| $35,000 to $39,999 | 10 (6.7%) | 47 (16.2%) |
| $40,000 to $44,999 | 18 (12.1%) | 42 (14.5%) |
| $45,000 to $49,999 | 9 (6.0%) | 0 (0.0%) |
| $50,000 to $54,999 | 34 (22.8%) | 11 (3.8%) |
| $55,000 to $64,999 | 16 (10.7%) | 0 (0.0%) |
| $65,000 to $74,999 | 0 (0.0%) | 0 (0.0%) |
| $75,000 to $99,999 | 0 (0.0%) | 0 (0.0%) |
| $100,000+ | 14 (9.4%) | 0 (0.0%) |
| Total | 149 (100.0%) | 290 (100.0%) |
Earnings by Sex by Educational Attainment in Lemont Furnace
Average earnings in Lemont Furnace are $52,757 for men and $36,011 for women, a difference of 31.7%. Men with an educational attainment of high school diploma enjoy the highest average annual earnings of $52,978, while those with high school diploma education earn the least with $52,978. Women with an educational attainment of college or associate's degree earn the most with the average annual earnings of $35,718, while those with high school diploma education have the smallest earnings of $14,259.
| Educational Attainment | Male Income | Female Income |
| Less than High School | - | - |
| High School Diploma | $52,978 | $14,259 |
| College or Associate's Degree | - | - |
| Bachelor's Degree | - | - |
| Graduate Degree | - | - |
| Total | $52,757 | $36,011 |
Family Income in Lemont Furnace
Family Income Brackets in Lemont Furnace
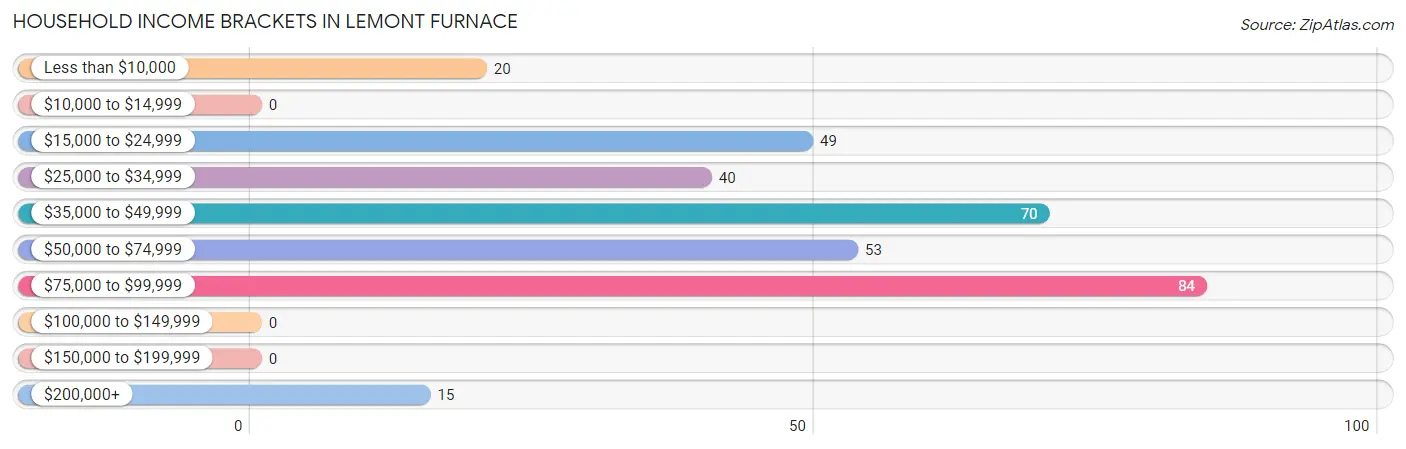
According to the Lemont Furnace family income data, there are 84 families falling into the $75,000 to $99,999 income range, which is the most common income bracket and makes up 39.4% of all families.
| Income Bracket | # Families | % Families |
| Less than $10,000 | 0 | 0.0% |
| $10,000 to $14,999 | 0 | 0.0% |
| $15,000 to $24,999 | 0 | 0.0% |
| $25,000 to $34,999 | 40 | 18.8% |
| $35,000 to $49,999 | 51 | 23.9% |
| $50,000 to $74,999 | 23 | 10.8% |
| $75,000 to $99,999 | 84 | 39.4% |
| $100,000 to $149,999 | 0 | 0.0% |
| $150,000 to $199,999 | 0 | 0.0% |
| $200,000+ | 15 | 7.0% |
Family Income by Famaliy Size in Lemont Furnace
2-person families (104 | 48.8%) account for the highest median family income in Lemont Furnace with $55,357 per family, while 2-person families (104 | 48.8%) have the highest median income of $27,678 per family member.
| Income Bracket | # Families | Median Income |
| 2-Person Families | 104 (48.8%) | $55,357 |
| 3-Person Families | 19 (8.9%) | $0 |
| 4-Person Families | 15 (7.0%) | $0 |
| 5-Person Families | 68 (31.9%) | $0 |
| 6-Person Families | 0 (0.0%) | $0 |
| 7+ Person Families | 7 (3.3%) | $0 |
| Total | 213 (100.0%) | $61,328 |
Family Income by Number of Earners in Lemont Furnace
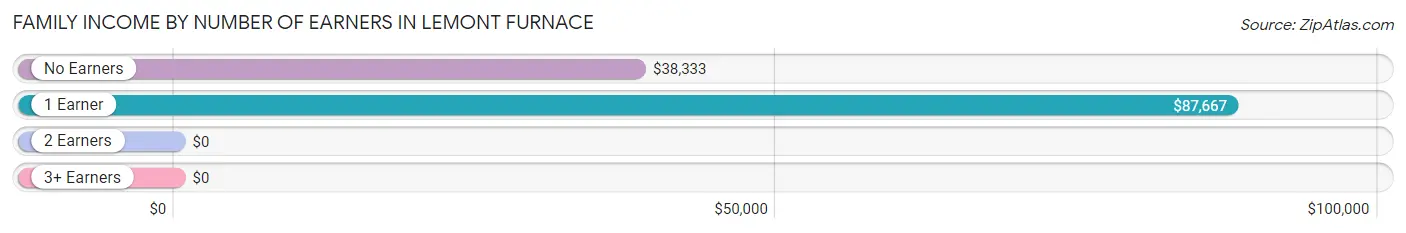
| Number of Earners | # Families | Median Income |
| No Earners | 46 (21.6%) | $38,333 |
| 1 Earner | 86 (40.4%) | $87,667 |
| 2 Earners | 39 (18.3%) | $0 |
| 3+ Earners | 42 (19.7%) | $0 |
| Total | 213 (100.0%) | $61,328 |
Household Income in Lemont Furnace
Household Income Brackets in Lemont Furnace
With 84 households falling in the category, the $75,000 to $99,999 income range is the most frequent in Lemont Furnace, accounting for 25.4% of all households.
| Income Bracket | # Households | % Households |
| Less than $10,000 | 20 | 6.0% |
| $10,000 to $14,999 | 0 | 0.0% |
| $15,000 to $24,999 | 49 | 14.8% |
| $25,000 to $34,999 | 40 | 12.1% |
| $35,000 to $49,999 | 70 | 21.1% |
| $50,000 to $74,999 | 53 | 16.0% |
| $75,000 to $99,999 | 84 | 25.4% |
| $100,000 to $149,999 | 0 | 0.0% |
| $150,000 to $199,999 | 0 | 0.0% |
| $200,000+ | 15 | 4.5% |
Household Income by Householder Age in Lemont Furnace
The median household income in Lemont Furnace is $46,250, with the highest median household income of $91,393 found in the 25 to 44 years age bracket for the primary householder. A total of 61 households (18.4%) fall into this category. Meanwhile, the 15 to 24 years age bracket for the primary householder has the lowest median household income of $0, with 39 households (11.8%) in this group.
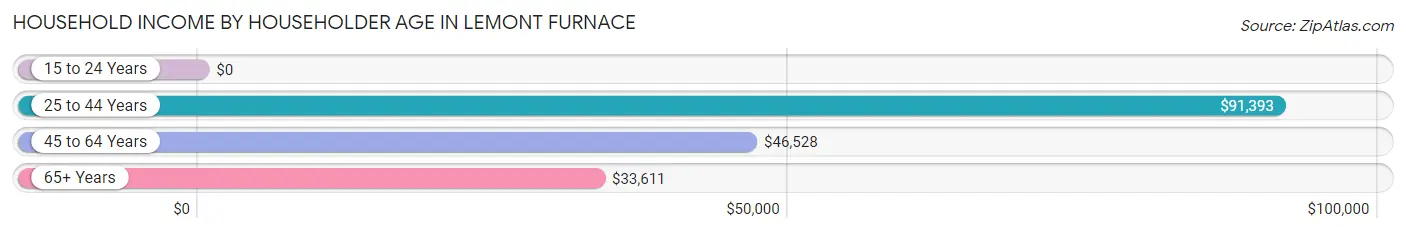
| Income Bracket | # Households | Median Income |
| 15 to 24 Years | 39 (11.8%) | $0 |
| 25 to 44 Years | 61 (18.4%) | $91,393 |
| 45 to 64 Years | 137 (41.4%) | $46,528 |
| 65+ Years | 94 (28.4%) | $33,611 |
| Total | 331 (100.0%) | $46,250 |
Poverty in Lemont Furnace
Income Below Poverty by Sex and Age in Lemont Furnace
With 3.5% poverty level for males and 8.5% for females among the residents of Lemont Furnace, 45 to 54 year old males and 25 to 34 year old females are the most vulnerable to poverty, with 19 males (28.8%) and 8 females (38.1%) in their respective age groups living below the poverty level.
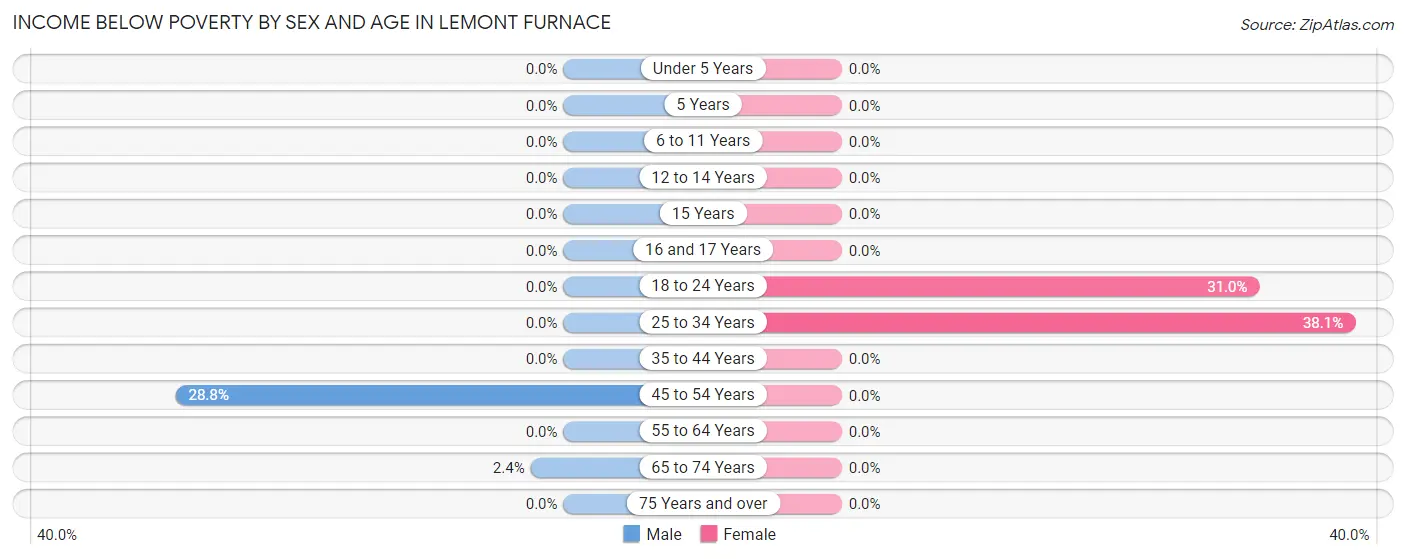
| Age Bracket | Male | Female |
| Under 5 Years | 0 (0.0%) | 0 (0.0%) |
| 5 Years | 0 (0.0%) | 0 (0.0%) |
| 6 to 11 Years | 0 (0.0%) | 0 (0.0%) |
| 12 to 14 Years | 0 (0.0%) | 0 (0.0%) |
| 15 Years | 0 (0.0%) | 0 (0.0%) |
| 16 and 17 Years | 0 (0.0%) | 0 (0.0%) |
| 18 to 24 Years | 0 (0.0%) | 31 (31.0%) |
| 25 to 34 Years | 0 (0.0%) | 8 (38.1%) |
| 35 to 44 Years | 0 (0.0%) | 0 (0.0%) |
| 45 to 54 Years | 19 (28.8%) | 0 (0.0%) |
| 55 to 64 Years | 0 (0.0%) | 0 (0.0%) |
| 65 to 74 Years | 1 (2.4%) | 0 (0.0%) |
| 75 Years and over | 0 (0.0%) | 0 (0.0%) |
| Total | 20 (3.5%) | 39 (8.5%) |
Income Above Poverty by Sex and Age in Lemont Furnace
According to the poverty statistics in Lemont Furnace, males aged under 5 years and females aged under 5 years are the age groups that are most secure financially, with 100.0% of males and 100.0% of females in these age groups living above the poverty line.
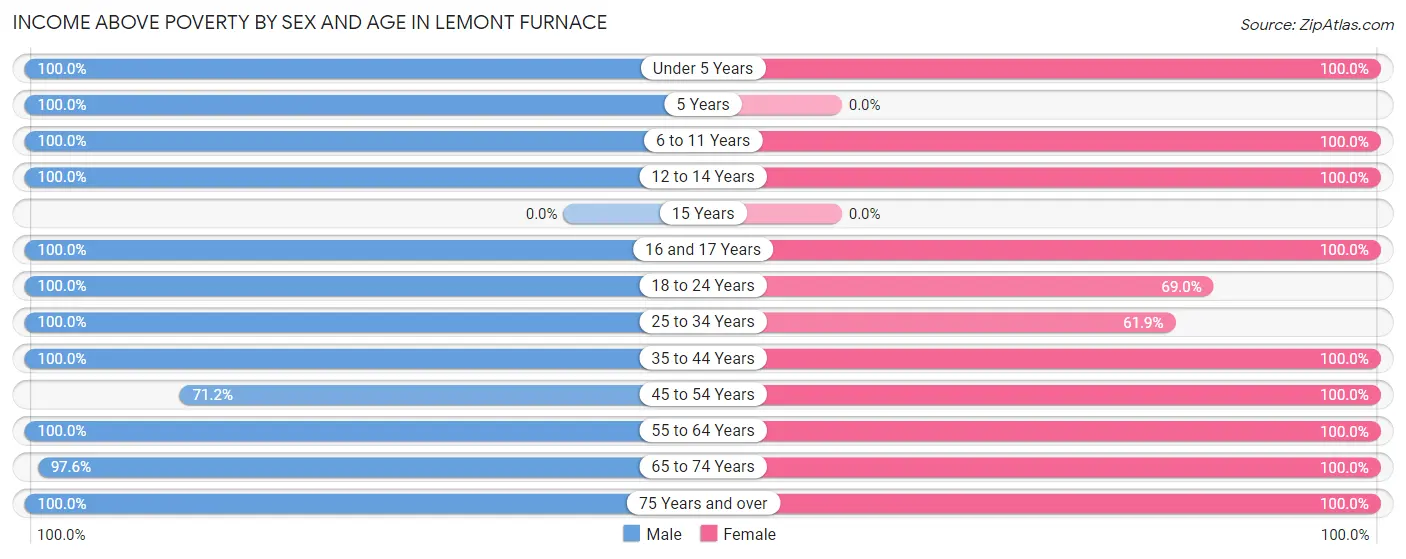
| Age Bracket | Male | Female |
| Under 5 Years | 93 (100.0%) | 9 (100.0%) |
| 5 Years | 14 (100.0%) | 0 (0.0%) |
| 6 to 11 Years | 56 (100.0%) | 16 (100.0%) |
| 12 to 14 Years | 33 (100.0%) | 8 (100.0%) |
| 15 Years | 0 (0.0%) | 0 (0.0%) |
| 16 and 17 Years | 9 (100.0%) | 39 (100.0%) |
| 18 to 24 Years | 118 (100.0%) | 69 (69.0%) |
| 25 to 34 Years | 16 (100.0%) | 13 (61.9%) |
| 35 to 44 Years | 75 (100.0%) | 57 (100.0%) |
| 45 to 54 Years | 47 (71.2%) | 75 (100.0%) |
| 55 to 64 Years | 42 (100.0%) | 42 (100.0%) |
| 65 to 74 Years | 40 (97.6%) | 60 (100.0%) |
| 75 Years and over | 12 (100.0%) | 32 (100.0%) |
| Total | 555 (96.5%) | 420 (91.5%) |
Income Below Poverty Among Married-Couple Families in Lemont Furnace
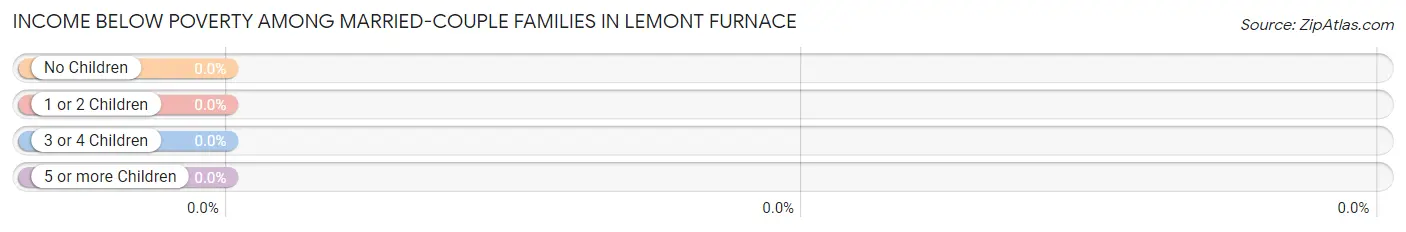
| Children | Above Poverty | Below Poverty |
| No Children | 98 (100.0%) | 0 (0.0%) |
| 1 or 2 Children | 28 (100.0%) | 0 (0.0%) |
| 3 or 4 Children | 35 (100.0%) | 0 (0.0%) |
| 5 or more Children | 0 (0.0%) | 0 (0.0%) |
| Total | 161 (100.0%) | 0 (0.0%) |
Income Below Poverty Among Single-Parent Households in Lemont Furnace
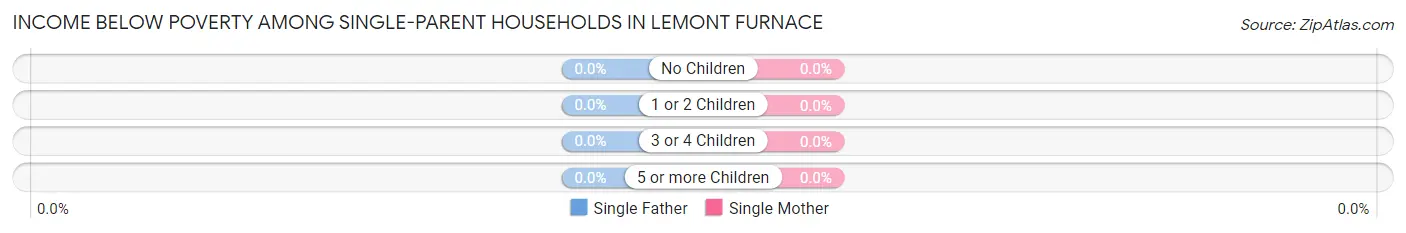
| Children | Single Father | Single Mother |
| No Children | 0 (0.0%) | 0 (0.0%) |
| 1 or 2 Children | 0 (0.0%) | 0 (0.0%) |
| 3 or 4 Children | 0 (0.0%) | 0 (0.0%) |
| 5 or more Children | 0 (0.0%) | 0 (0.0%) |
| Total | 0 (0.0%) | 0 (0.0%) |
Income Below Poverty Among Married-Couple vs Single-Parent Households in Lemont Furnace
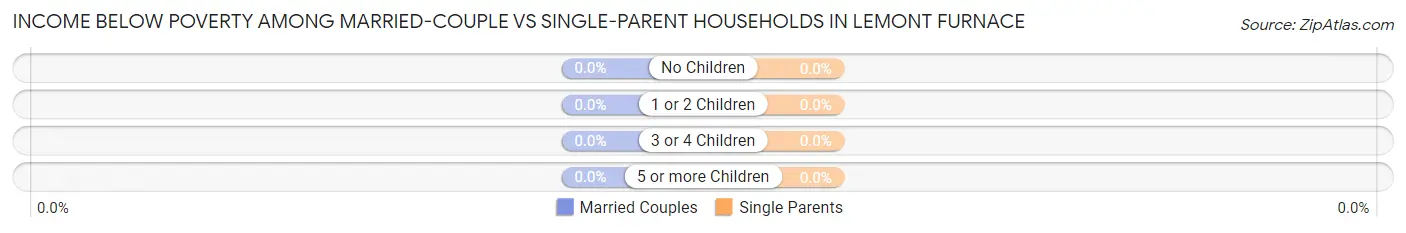
| Children | Married-Couple Families | Single-Parent Households |
| No Children | 0 (0.0%) | 0 (0.0%) |
| 1 or 2 Children | 0 (0.0%) | 0 (0.0%) |
| 3 or 4 Children | 0 (0.0%) | 0 (0.0%) |
| 5 or more Children | 0 (0.0%) | 0 (0.0%) |
| Total | 0 (0.0%) | 0 (0.0%) |
Employment Characteristics in Lemont Furnace
Employment by Class of Employer in Lemont Furnace
Among the 374 employed individuals in Lemont Furnace, private company employees (293 | 78.3%), local government employees (40 | 10.7%), and state government employees (16 | 4.3%) make up the most common classes of employment.
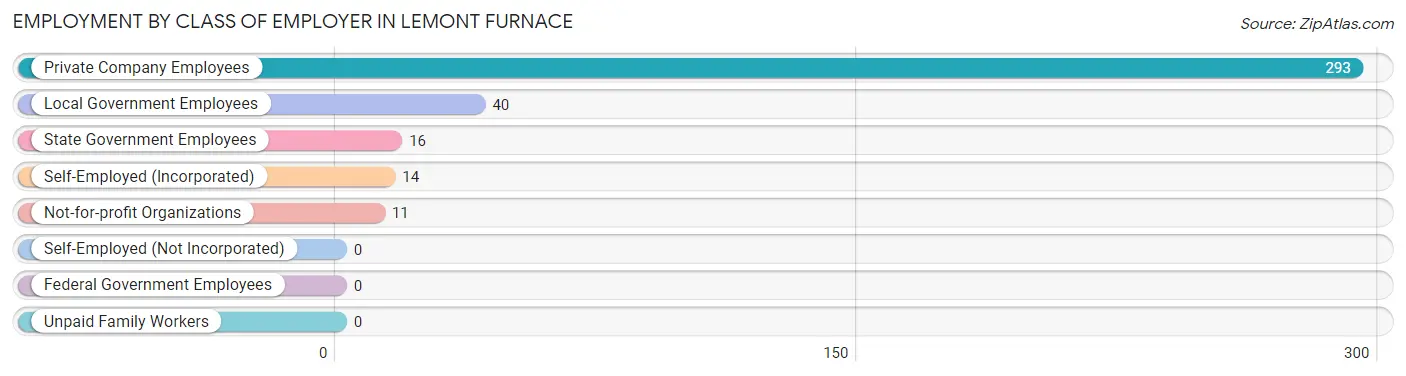
| Employer Class | # Employees | % Employees |
| Private Company Employees | 293 | 78.3% |
| Self-Employed (Incorporated) | 14 | 3.7% |
| Self-Employed (Not Incorporated) | 0 | 0.0% |
| Not-for-profit Organizations | 11 | 2.9% |
| Local Government Employees | 40 | 10.7% |
| State Government Employees | 16 | 4.3% |
| Federal Government Employees | 0 | 0.0% |
| Unpaid Family Workers | 0 | 0.0% |
| Total | 374 | 100.0% |
Employment Status by Age in Lemont Furnace
According to the labor force statistics for Lemont Furnace, out of the total population over 16 years of age (805), 48.6% or 391 individuals are in the labor force, with 4.3% or 17 of them unemployed. The age group with the highest labor force participation rate is 25 to 29 years, with 100.0% or 35 individuals in the labor force. Within the labor force, the 20 to 24 years age range has the highest percentage of unemployed individuals, with 9.2% or 11 of them being unemployed.
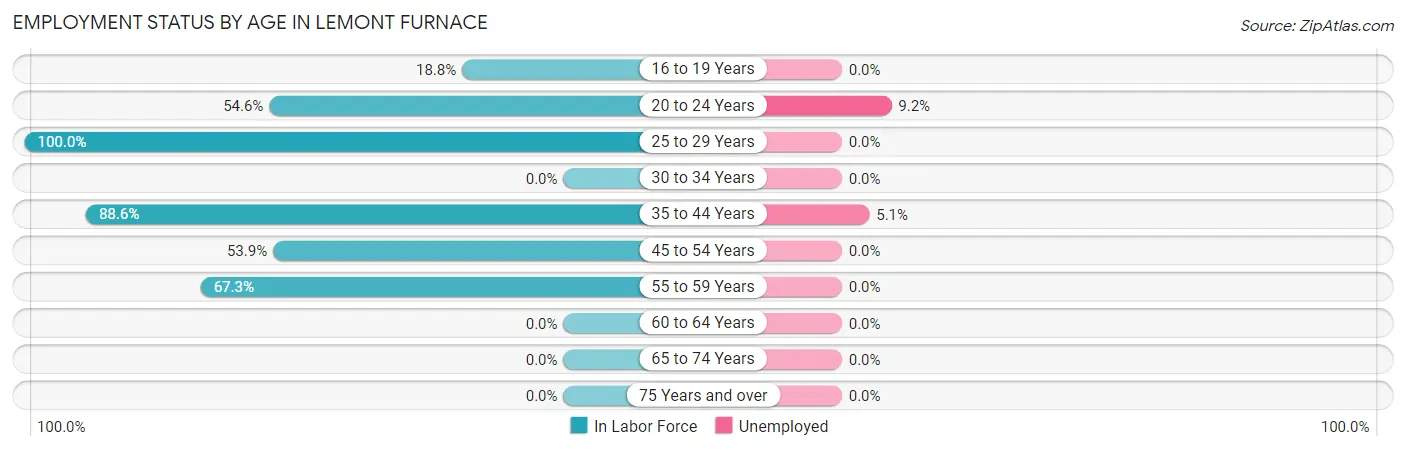
| Age Bracket | In Labor Force | Unemployed |
| 16 to 19 Years | 9 (18.8%) | 0 (0.0%) |
| 20 to 24 Years | 119 (54.6%) | 11 (9.2%) |
| 25 to 29 Years | 35 (100.0%) | 0 (0.0%) |
| 30 to 34 Years | 0 (0.0%) | 0 (0.0%) |
| 35 to 44 Years | 117 (88.6%) | 6 (5.1%) |
| 45 to 54 Years | 76 (53.9%) | 0 (0.0%) |
| 55 to 59 Years | 35 (67.3%) | 0 (0.0%) |
| 60 to 64 Years | 0 (0.0%) | 0 (0.0%) |
| 65 to 74 Years | 0 (0.0%) | 0 (0.0%) |
| 75 Years and over | 0 (0.0%) | 0 (0.0%) |
| Total | 391 (48.6%) | 17 (4.3%) |
Employment Status by Educational Attainment in Lemont Furnace
According to labor force statistics for Lemont Furnace, 66.8% of individuals (263) out of the total population between 25 and 64 years of age (394) are in the labor force, with 2.3% or 6 of them being unemployed. The group with the highest labor force participation rate are those with the educational attainment of less than high school, with 86.7% or 13 individuals in the labor force. Within the labor force, individuals with less than high school education have the highest percentage of unemployment, with 46.2% or 6 of them being unemployed.
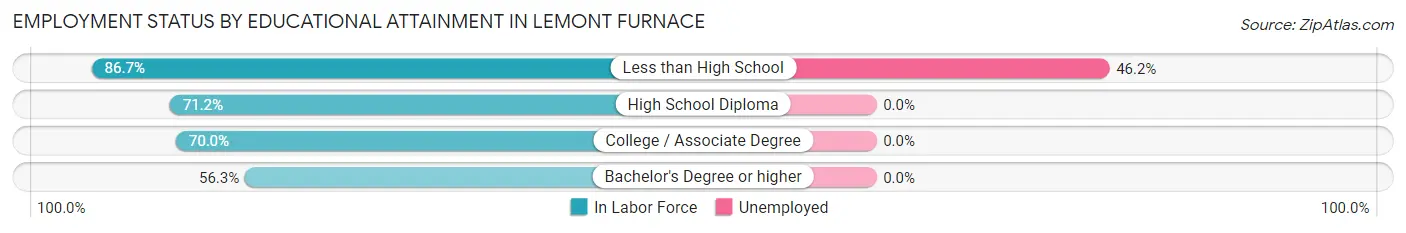
| Educational Attainment | In Labor Force | Unemployed |
| Less than High School | 13 (86.7%) | 7 (46.2%) |
| High School Diploma | 109 (71.2%) | 0 (0.0%) |
| College / Associate Degree | 70 (70.0%) | 0 (0.0%) |
| Bachelor's Degree or higher | 71 (56.3%) | 0 (0.0%) |
| Total | 263 (66.8%) | 9 (2.3%) |
Employment Occupations by Sex in Lemont Furnace
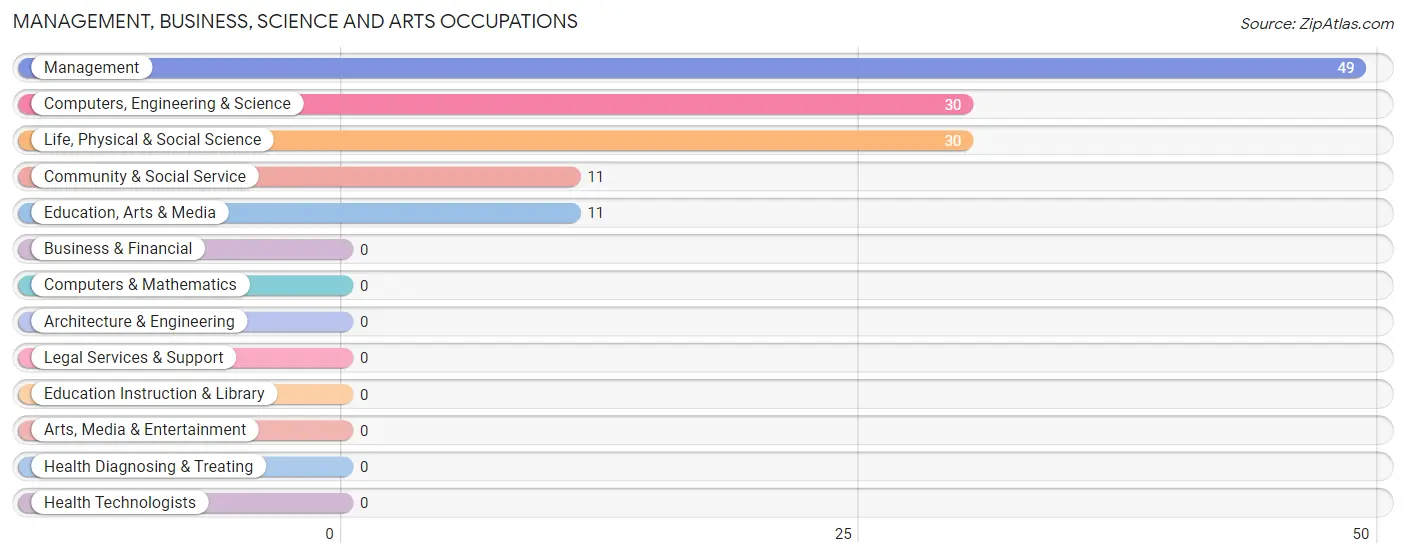
Management, Business, Science and Arts Occupations
The most common Management, Business, Science and Arts occupations in Lemont Furnace are Management (49 | 13.1%), Computers, Engineering & Science (30 | 8.0%), Life, Physical & Social Science (30 | 8.0%), Community & Social Service (11 | 2.9%), and Education, Arts & Media (11 | 2.9%).
Management, Business, Science and Arts Occupations by Sex
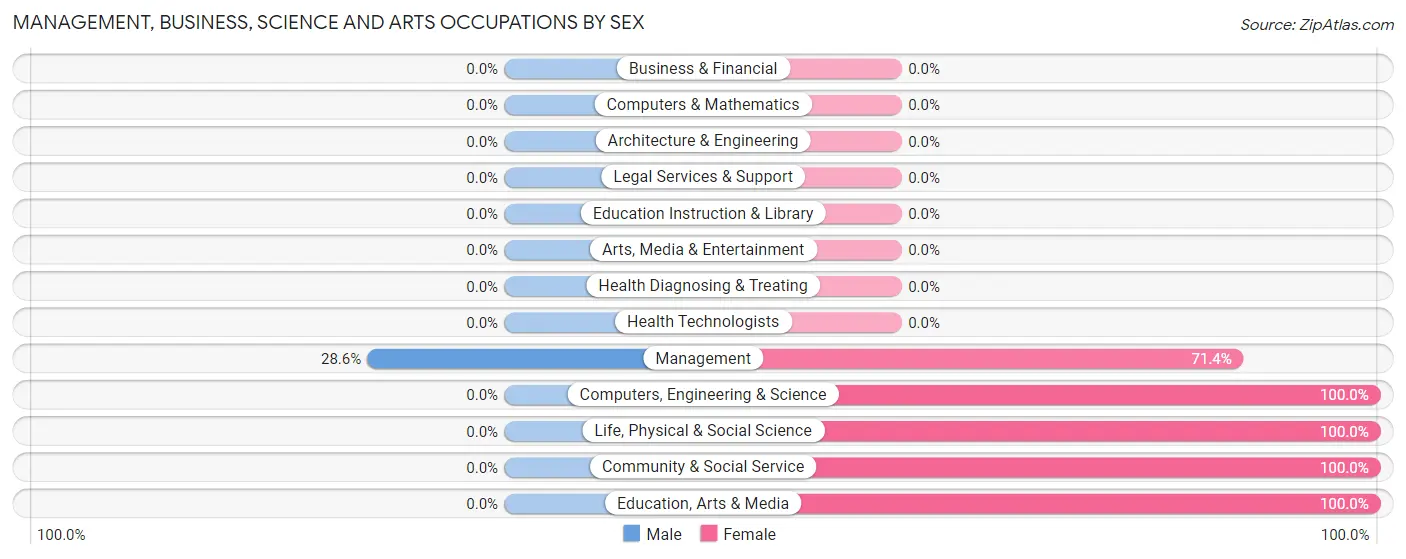
| Occupation | Male | Female |
| Management | 14 (28.6%) | 35 (71.4%) |
| Business & Financial | 0 (0.0%) | 0 (0.0%) |
| Computers, Engineering & Science | 0 (0.0%) | 30 (100.0%) |
| Computers & Mathematics | 0 (0.0%) | 0 (0.0%) |
| Architecture & Engineering | 0 (0.0%) | 0 (0.0%) |
| Life, Physical & Social Science | 0 (0.0%) | 30 (100.0%) |
| Community & Social Service | 0 (0.0%) | 11 (100.0%) |
| Education, Arts & Media | 0 (0.0%) | 11 (100.0%) |
| Legal Services & Support | 0 (0.0%) | 0 (0.0%) |
| Education Instruction & Library | 0 (0.0%) | 0 (0.0%) |
| Arts, Media & Entertainment | 0 (0.0%) | 0 (0.0%) |
| Health Diagnosing & Treating | 0 (0.0%) | 0 (0.0%) |
| Health Technologists | 0 (0.0%) | 0 (0.0%) |
| Total (Category) | 14 (15.6%) | 76 (84.4%) |
| Total (Overall) | 143 (38.2%) | 231 (61.8%) |
Services Occupations
The most common Services occupations in Lemont Furnace are Cleaning & Maintenance (69 | 18.4%), and Healthcare Support (27 | 7.2%).
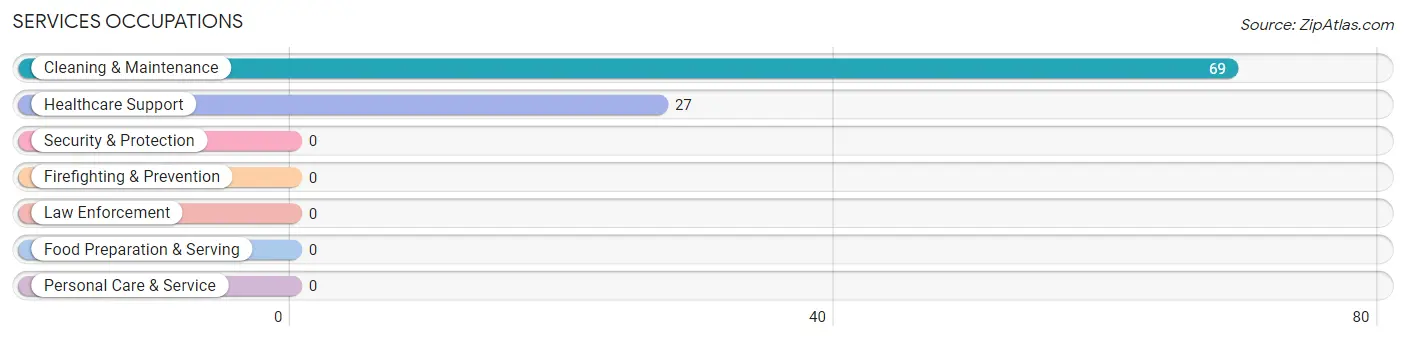
Services Occupations by Sex
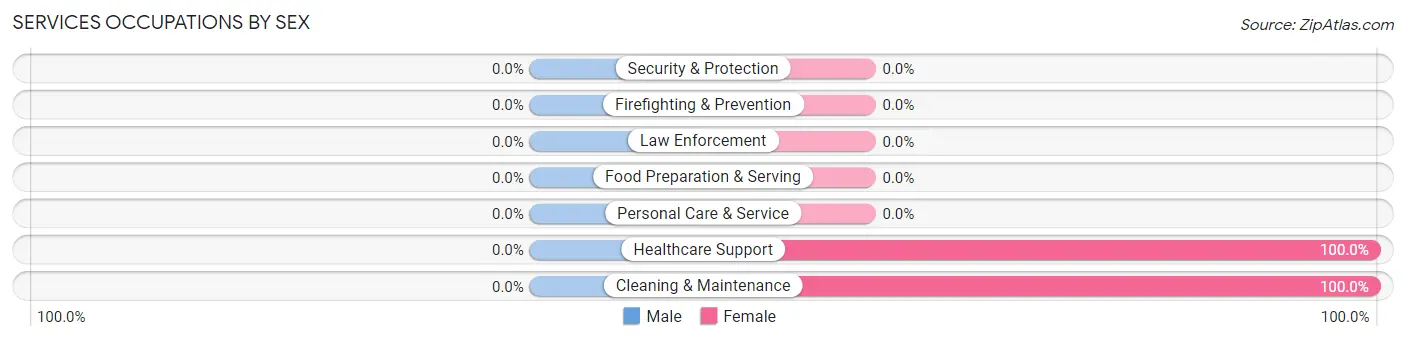
| Occupation | Male | Female |
| Healthcare Support | 0 (0.0%) | 27 (100.0%) |
| Security & Protection | 0 (0.0%) | 0 (0.0%) |
| Firefighting & Prevention | 0 (0.0%) | 0 (0.0%) |
| Law Enforcement | 0 (0.0%) | 0 (0.0%) |
| Food Preparation & Serving | 0 (0.0%) | 0 (0.0%) |
| Cleaning & Maintenance | 0 (0.0%) | 69 (100.0%) |
| Personal Care & Service | 0 (0.0%) | 0 (0.0%) |
| Total (Category) | 0 (0.0%) | 96 (100.0%) |
| Total (Overall) | 143 (38.2%) | 231 (61.8%) |
Sales and Office Occupations
The most common Sales and Office occupations in Lemont Furnace are Sales & Related (72 | 19.3%), and Office & Administration (7 | 1.9%).
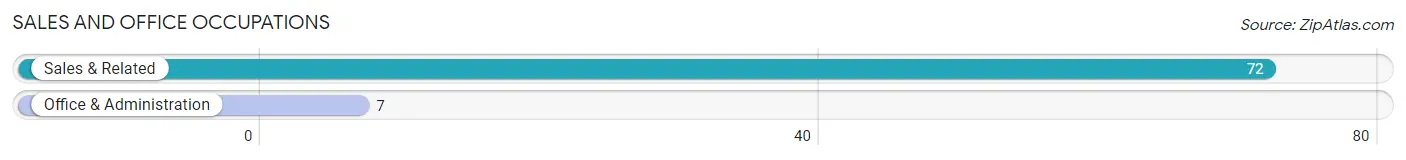
Sales and Office Occupations by Sex
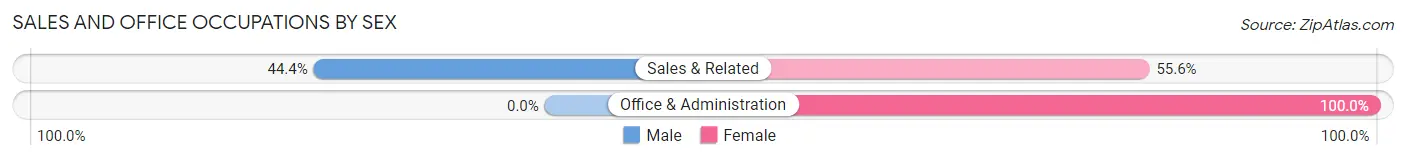
| Occupation | Male | Female |
| Sales & Related | 32 (44.4%) | 40 (55.6%) |
| Office & Administration | 0 (0.0%) | 7 (100.0%) |
| Total (Category) | 32 (40.5%) | 47 (59.5%) |
| Total (Overall) | 143 (38.2%) | 231 (61.8%) |
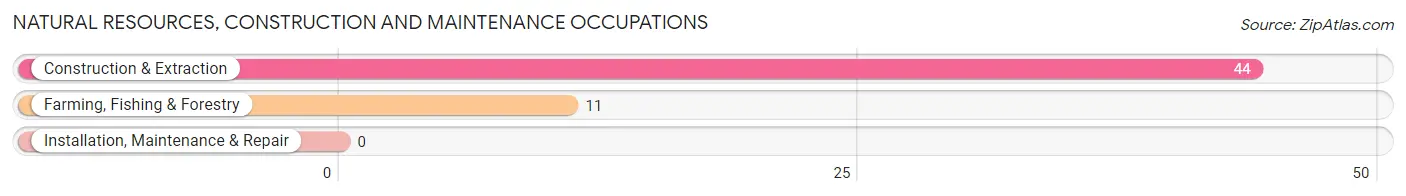
Natural Resources, Construction and Maintenance Occupations
The most common Natural Resources, Construction and Maintenance occupations in Lemont Furnace are Construction & Extraction (44 | 11.8%), and Farming, Fishing & Forestry (11 | 2.9%).
Natural Resources, Construction and Maintenance Occupations by Sex
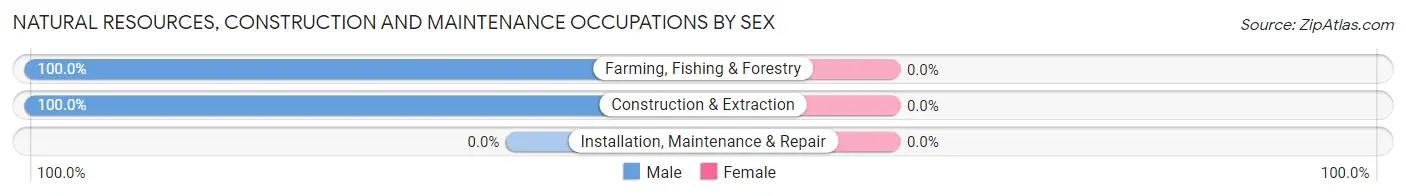
| Occupation | Male | Female |
| Farming, Fishing & Forestry | 11 (100.0%) | 0 (0.0%) |
| Construction & Extraction | 44 (100.0%) | 0 (0.0%) |
| Installation, Maintenance & Repair | 0 (0.0%) | 0 (0.0%) |
| Total (Category) | 55 (100.0%) | 0 (0.0%) |
| Total (Overall) | 143 (38.2%) | 231 (61.8%) |
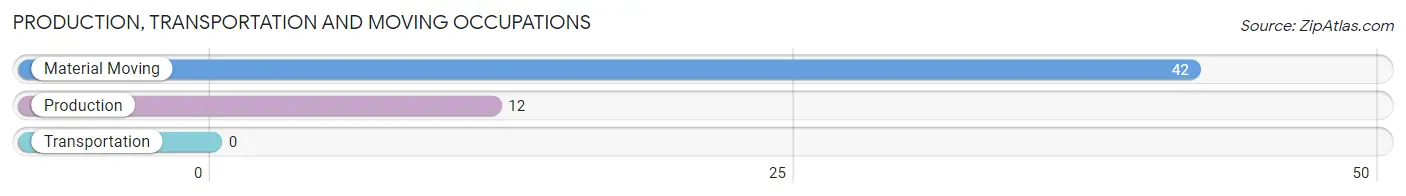
Production, Transportation and Moving Occupations
The most common Production, Transportation and Moving occupations in Lemont Furnace are Material Moving (42 | 11.2%), and Production (12 | 3.2%).
Production, Transportation and Moving Occupations by Sex
| Occupation | Male | Female |
| Production | 0 (0.0%) | 12 (100.0%) |
| Transportation | 0 (0.0%) | 0 (0.0%) |
| Material Moving | 42 (100.0%) | 0 (0.0%) |
| Total (Category) | 42 (77.8%) | 12 (22.2%) |
| Total (Overall) | 143 (38.2%) | 231 (61.8%) |
Employment Industries by Sex in Lemont Furnace
Employment Industries in Lemont Furnace
The major employment industries in Lemont Furnace include Administrative & Support (87 | 23.3%), Retail Trade (56 | 15.0%), Manufacturing (53 | 14.2%), Health Care & Social Assistance (45 | 12.0%), and Wholesale Trade (35 | 9.4%).
Employment Industries by Sex in Lemont Furnace
The Lemont Furnace industries that see more men than women are Construction (100.0%), Wholesale Trade (100.0%), and Transportation & Warehousing (100.0%), whereas the industries that tend to have a higher number of women are Finance & Insurance (100.0%), Health Care & Social Assistance (100.0%), and Public Administration (100.0%).
| Industry | Male | Female |
| Agriculture, Fishing & Hunting | 0 (0.0%) | 0 (0.0%) |
| Mining, Quarrying, & Extraction | 0 (0.0%) | 0 (0.0%) |
| Construction | 10 (100.0%) | 0 (0.0%) |
| Manufacturing | 41 (77.4%) | 12 (22.6%) |
| Wholesale Trade | 35 (100.0%) | 0 (0.0%) |
| Retail Trade | 16 (28.6%) | 40 (71.4%) |
| Transportation & Warehousing | 9 (100.0%) | 0 (0.0%) |
| Utilities | 0 (0.0%) | 0 (0.0%) |
| Information | 0 (0.0%) | 0 (0.0%) |
| Finance & Insurance | 0 (0.0%) | 35 (100.0%) |
| Real Estate, Rental & Leasing | 0 (0.0%) | 0 (0.0%) |
| Professional & Scientific | 14 (100.0%) | 0 (0.0%) |
| Enterprise Management | 0 (0.0%) | 0 (0.0%) |
| Administrative & Support | 18 (20.7%) | 69 (79.3%) |
| Educational Services | 0 (0.0%) | 0 (0.0%) |
| Health Care & Social Assistance | 0 (0.0%) | 45 (100.0%) |
| Arts, Entertainment & Recreation | 0 (0.0%) | 0 (0.0%) |
| Accommodation & Food Services | 0 (0.0%) | 0 (0.0%) |
| Public Administration | 0 (0.0%) | 30 (100.0%) |
| Total | 143 (38.2%) | 231 (61.8%) |
Education in Lemont Furnace
School Enrollment in Lemont Furnace
The most common levels of schooling among the 344 students in Lemont Furnace are graduate / professional (110 | 32.0%), elementary school (64 | 18.6%), and nursery / preschool (56 | 16.3%).
| School Level | # Students | % Students |
| Nursery / Preschool | 56 | 16.3% |
| Kindergarten | 0 | 0.0% |
| Elementary School | 64 | 18.6% |
| Middle School | 49 | 14.2% |
| High School | 45 | 13.1% |
| College / Undergraduate | 20 | 5.8% |
| Graduate / Professional | 110 | 32.0% |
| Total | 344 | 100.0% |
School Enrollment by Age by Funding Source in Lemont Furnace
Out of a total of 344 students who are enrolled in schools in Lemont Furnace, 81 (23.5%) attend a private institution, while the remaining 263 (76.5%) are enrolled in public schools. The age group of 3 to 4 year olds has the highest likelihood of being enrolled in private schools, with 42 (100.0% in the age bracket) enrolled. Conversely, the age group of 5 to 9 year old has the lowest likelihood of being enrolled in a private school, with 78 (100.0% in the age bracket) attending a public institution.
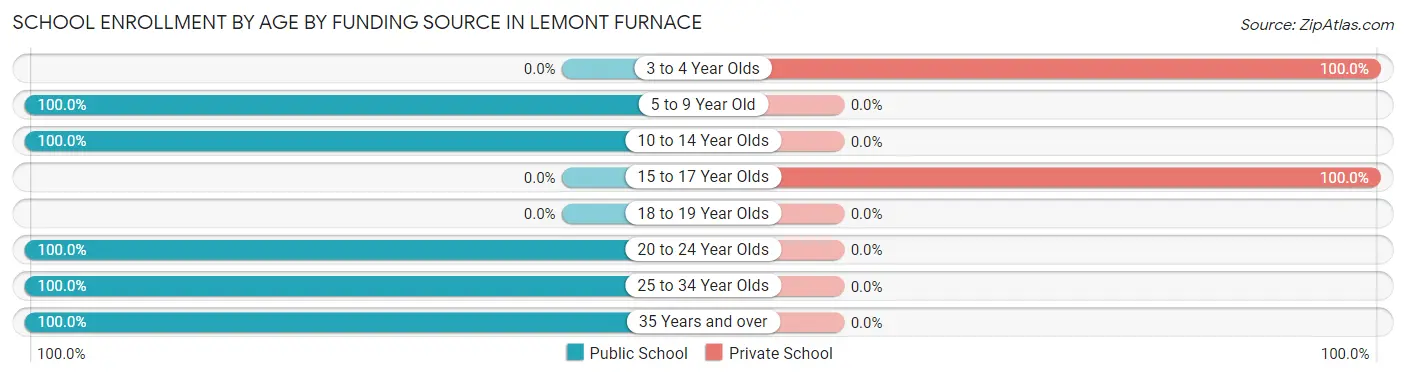
| Age Bracket | Public School | Private School |
| 3 to 4 Year Olds | 0 (0.0%) | 42 (100.0%) |
| 5 to 9 Year Old | 78 (100.0%) | 0 (0.0%) |
| 10 to 14 Year Olds | 49 (100.0%) | 0 (0.0%) |
| 15 to 17 Year Olds | 0 (0.0%) | 39 (100.0%) |
| 18 to 19 Year Olds | 0 (0.0%) | 0 (0.0%) |
| 20 to 24 Year Olds | 119 (100.0%) | 0 (0.0%) |
| 25 to 34 Year Olds | 11 (100.0%) | 0 (0.0%) |
| 35 Years and over | 6 (100.0%) | 0 (0.0%) |
| Total | 263 (76.5%) | 81 (23.5%) |
Educational Attainment by Field of Study in Lemont Furnace
Bio, nature & agricultural (59 | 46.8%), business (40 | 31.8%), visual & performing arts (16 | 12.7%), and arts & humanities (11 | 8.7%) are the most common fields of study among 126 individuals in Lemont Furnace who have obtained a bachelor's degree or higher.
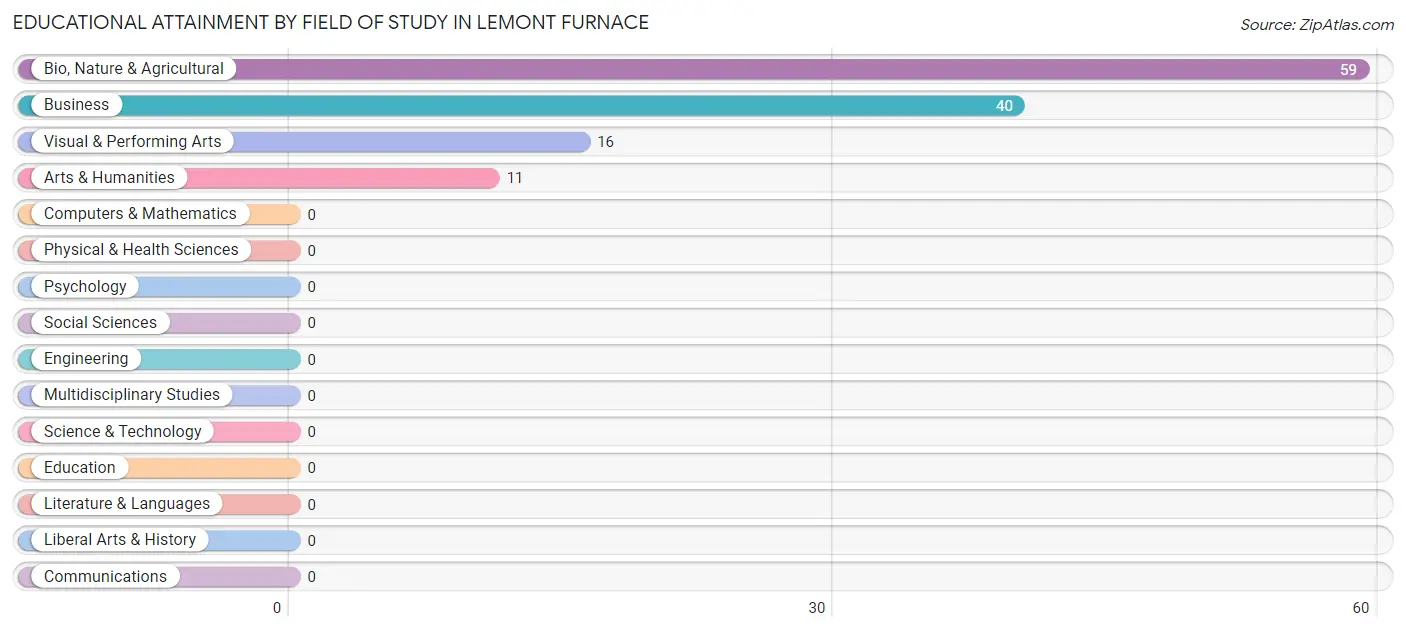
| Field of Study | # Graduates | % Graduates |
| Computers & Mathematics | 0 | 0.0% |
| Bio, Nature & Agricultural | 59 | 46.8% |
| Physical & Health Sciences | 0 | 0.0% |
| Psychology | 0 | 0.0% |
| Social Sciences | 0 | 0.0% |
| Engineering | 0 | 0.0% |
| Multidisciplinary Studies | 0 | 0.0% |
| Science & Technology | 0 | 0.0% |
| Business | 40 | 31.8% |
| Education | 0 | 0.0% |
| Literature & Languages | 0 | 0.0% |
| Liberal Arts & History | 0 | 0.0% |
| Visual & Performing Arts | 16 | 12.7% |
| Communications | 0 | 0.0% |
| Arts & Humanities | 11 | 8.7% |
| Total | 126 | 100.0% |
Transportation & Commute in Lemont Furnace
Vehicle Availability by Sex in Lemont Furnace
The most prevalent vehicle ownership categories in Lemont Furnace are males with 2 vehicles (80, accounting for 55.9%) and females with 2 vehicles (84, making up 34.6%).
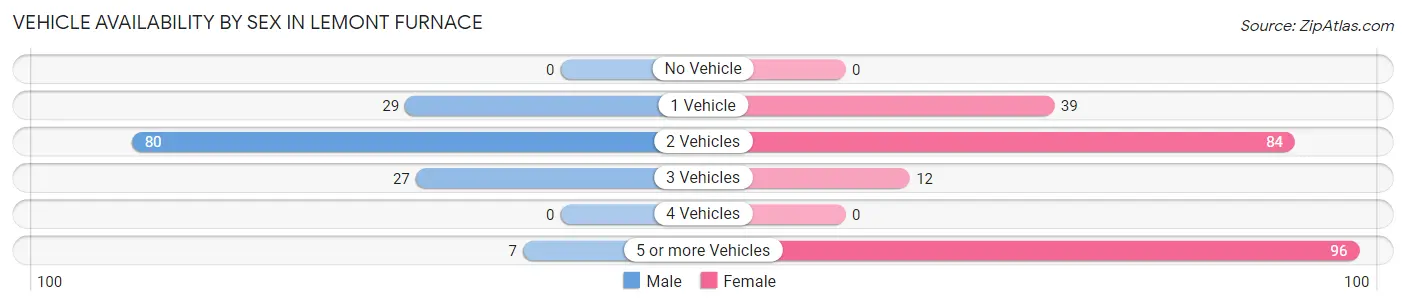
| Vehicles Available | Male | Female |
| No Vehicle | 0 (0.0%) | 0 (0.0%) |
| 1 Vehicle | 29 (20.3%) | 39 (16.9%) |
| 2 Vehicles | 80 (55.9%) | 84 (36.4%) |
| 3 Vehicles | 27 (18.9%) | 12 (5.2%) |
| 4 Vehicles | 0 (0.0%) | 0 (0.0%) |
| 5 or more Vehicles | 7 (4.9%) | 96 (41.6%) |
| Total | 143 (100.0%) | 231 (100.0%) |
Commute Time in Lemont Furnace
The most frequently occuring commute durations in Lemont Furnace are 15 to 19 minutes (97 commuters, 26.5%), 10 to 14 minutes (92 commuters, 25.1%), and 20 to 24 minutes (77 commuters, 21.0%).
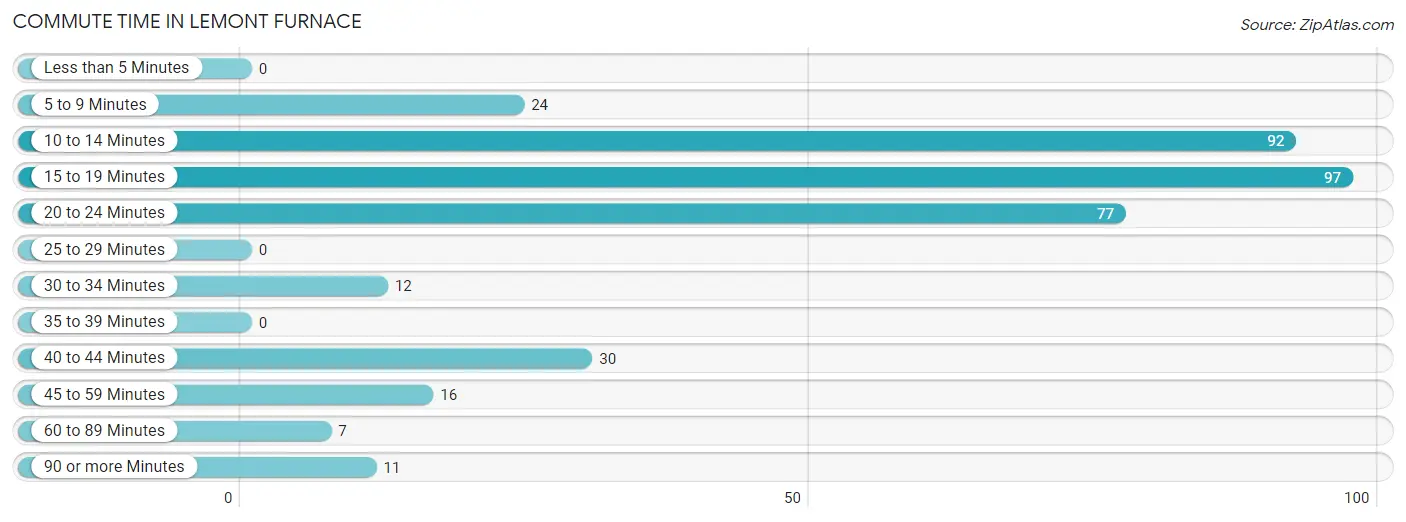
| Commute Time | # Commuters | % Commuters |
| Less than 5 Minutes | 0 | 0.0% |
| 5 to 9 Minutes | 24 | 6.6% |
| 10 to 14 Minutes | 92 | 25.1% |
| 15 to 19 Minutes | 97 | 26.5% |
| 20 to 24 Minutes | 77 | 21.0% |
| 25 to 29 Minutes | 0 | 0.0% |
| 30 to 34 Minutes | 12 | 3.3% |
| 35 to 39 Minutes | 0 | 0.0% |
| 40 to 44 Minutes | 30 | 8.2% |
| 45 to 59 Minutes | 16 | 4.4% |
| 60 to 89 Minutes | 7 | 1.9% |
| 90 or more Minutes | 11 | 3.0% |
Commute Time by Sex in Lemont Furnace
The most common commute times in Lemont Furnace are 20 to 24 minutes (50 commuters, 35.0%) for males and 15 to 19 minutes (78 commuters, 35.0%) for females.
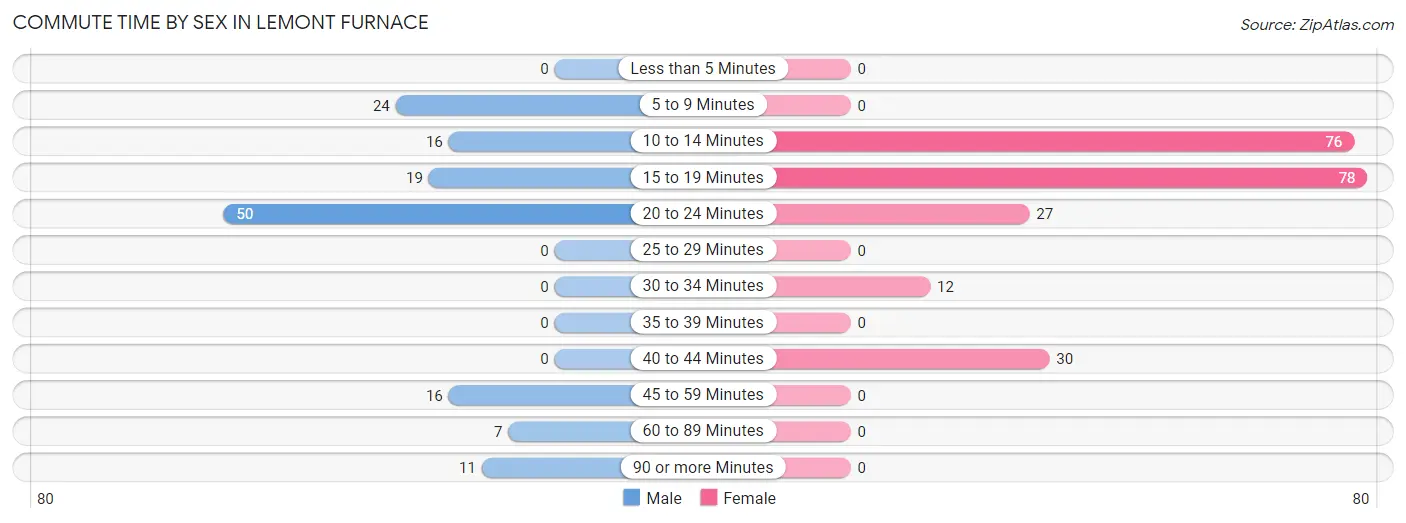
| Commute Time | Male | Female |
| Less than 5 Minutes | 0 (0.0%) | 0 (0.0%) |
| 5 to 9 Minutes | 24 (16.8%) | 0 (0.0%) |
| 10 to 14 Minutes | 16 (11.2%) | 76 (34.1%) |
| 15 to 19 Minutes | 19 (13.3%) | 78 (35.0%) |
| 20 to 24 Minutes | 50 (35.0%) | 27 (12.1%) |
| 25 to 29 Minutes | 0 (0.0%) | 0 (0.0%) |
| 30 to 34 Minutes | 0 (0.0%) | 12 (5.4%) |
| 35 to 39 Minutes | 0 (0.0%) | 0 (0.0%) |
| 40 to 44 Minutes | 0 (0.0%) | 30 (13.5%) |
| 45 to 59 Minutes | 16 (11.2%) | 0 (0.0%) |
| 60 to 89 Minutes | 7 (4.9%) | 0 (0.0%) |
| 90 or more Minutes | 11 (7.7%) | 0 (0.0%) |
Time of Departure to Work by Sex in Lemont Furnace
The most frequent times of departure to work in Lemont Furnace are 7:30 AM to 7:59 AM (34, 23.8%) for males and 9:00 AM to 9:59 AM (69, 30.9%) for females.
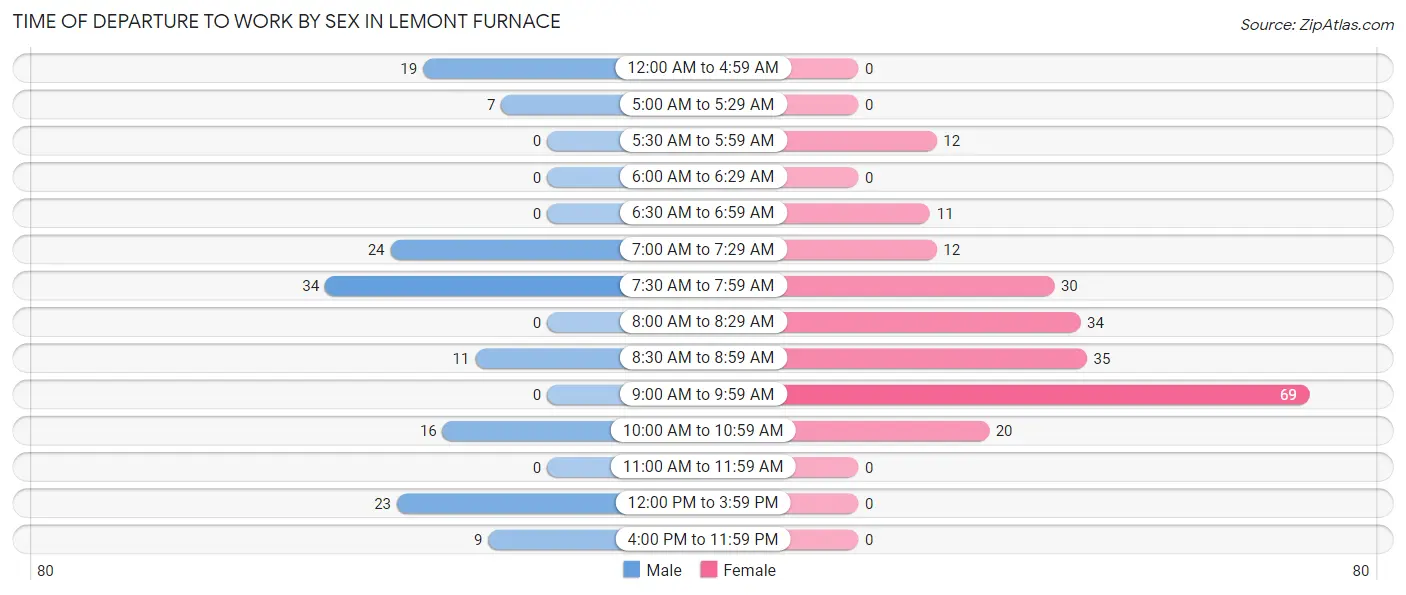
| Time of Departure | Male | Female |
| 12:00 AM to 4:59 AM | 19 (13.3%) | 0 (0.0%) |
| 5:00 AM to 5:29 AM | 7 (4.9%) | 0 (0.0%) |
| 5:30 AM to 5:59 AM | 0 (0.0%) | 12 (5.4%) |
| 6:00 AM to 6:29 AM | 0 (0.0%) | 0 (0.0%) |
| 6:30 AM to 6:59 AM | 0 (0.0%) | 11 (4.9%) |
| 7:00 AM to 7:29 AM | 24 (16.8%) | 12 (5.4%) |
| 7:30 AM to 7:59 AM | 34 (23.8%) | 30 (13.5%) |
| 8:00 AM to 8:29 AM | 0 (0.0%) | 34 (15.2%) |
| 8:30 AM to 8:59 AM | 11 (7.7%) | 35 (15.7%) |
| 9:00 AM to 9:59 AM | 0 (0.0%) | 69 (30.9%) |
| 10:00 AM to 10:59 AM | 16 (11.2%) | 20 (9.0%) |
| 11:00 AM to 11:59 AM | 0 (0.0%) | 0 (0.0%) |
| 12:00 PM to 3:59 PM | 23 (16.1%) | 0 (0.0%) |
| 4:00 PM to 11:59 PM | 9 (6.3%) | 0 (0.0%) |
| Total | 143 (100.0%) | 223 (100.0%) |
Housing Occupancy in Lemont Furnace
Occupancy by Ownership in Lemont Furnace
Of the total 331 dwellings in Lemont Furnace, owner-occupied units account for 262 (79.1%), while renter-occupied units make up 69 (20.8%).
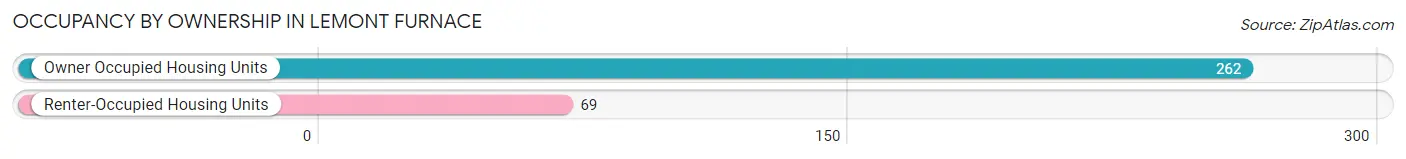
| Occupancy | # Housing Units | % Housing Units |
| Owner Occupied Housing Units | 262 | 79.1% |
| Renter-Occupied Housing Units | 69 | 20.8% |
| Total Occupied Housing Units | 331 | 100.0% |
Occupancy by Household Size in Lemont Furnace
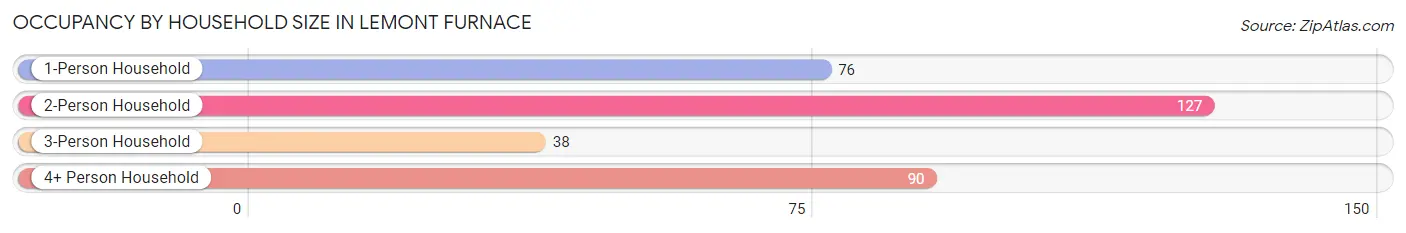
| Household Size | # Housing Units | % Housing Units |
| 1-Person Household | 76 | 23.0% |
| 2-Person Household | 127 | 38.4% |
| 3-Person Household | 38 | 11.5% |
| 4+ Person Household | 90 | 27.2% |
| Total Housing Units | 331 | 100.0% |
Occupancy by Ownership by Household Size in Lemont Furnace
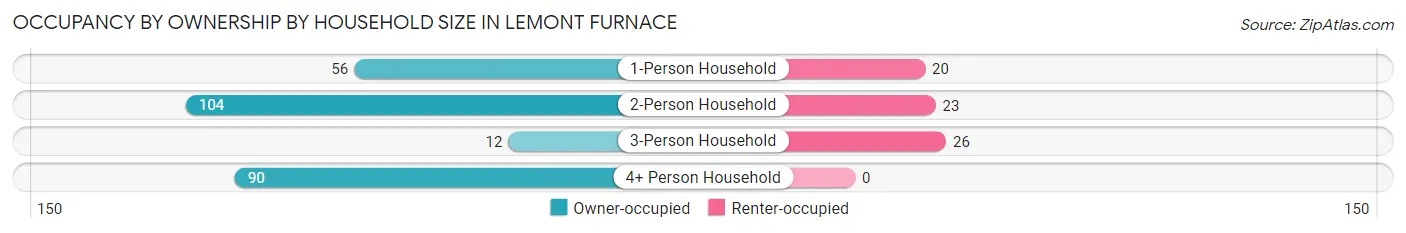
| Household Size | Owner-occupied | Renter-occupied |
| 1-Person Household | 56 (73.7%) | 20 (26.3%) |
| 2-Person Household | 104 (81.9%) | 23 (18.1%) |
| 3-Person Household | 12 (31.6%) | 26 (68.4%) |
| 4+ Person Household | 90 (100.0%) | 0 (0.0%) |
| Total Housing Units | 262 (79.1%) | 69 (20.8%) |
Occupancy by Educational Attainment in Lemont Furnace
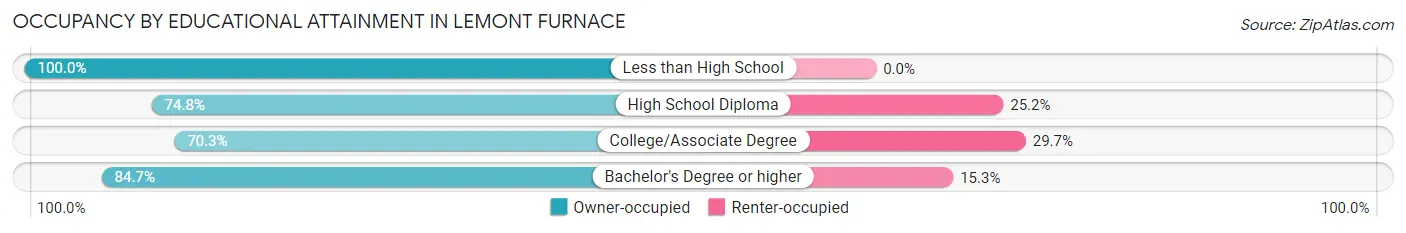
| Household Size | Owner-occupied | Renter-occupied |
| Less than High School | 45 (100.0%) | 0 (0.0%) |
| High School Diploma | 92 (74.8%) | 31 (25.2%) |
| College/Associate Degree | 64 (70.3%) | 27 (29.7%) |
| Bachelor's Degree or higher | 61 (84.7%) | 11 (15.3%) |
Occupancy by Age of Householder in Lemont Furnace
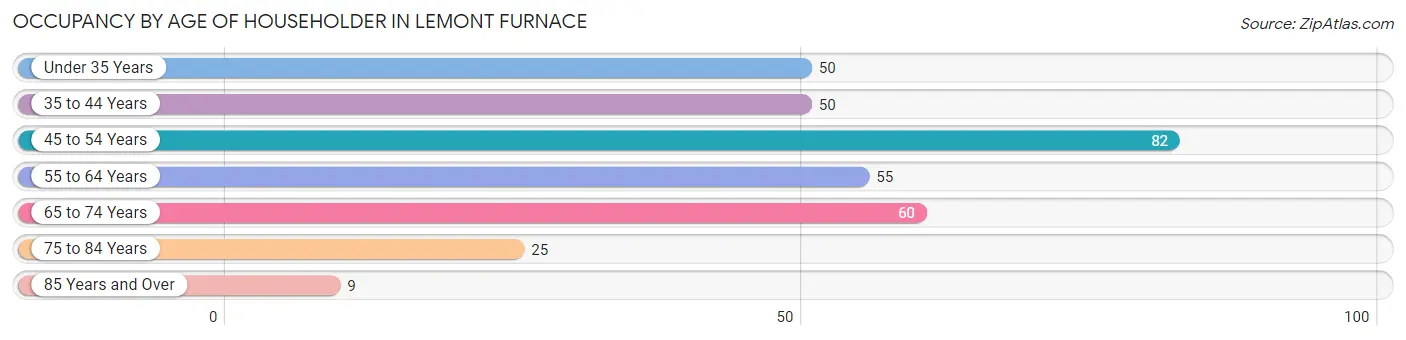
| Age Bracket | # Households | % Households |
| Under 35 Years | 50 | 15.1% |
| 35 to 44 Years | 50 | 15.1% |
| 45 to 54 Years | 82 | 24.8% |
| 55 to 64 Years | 55 | 16.6% |
| 65 to 74 Years | 60 | 18.1% |
| 75 to 84 Years | 25 | 7.5% |
| 85 Years and Over | 9 | 2.7% |
| Total | 331 | 100.0% |
Housing Finances in Lemont Furnace
Median Income by Occupancy in Lemont Furnace
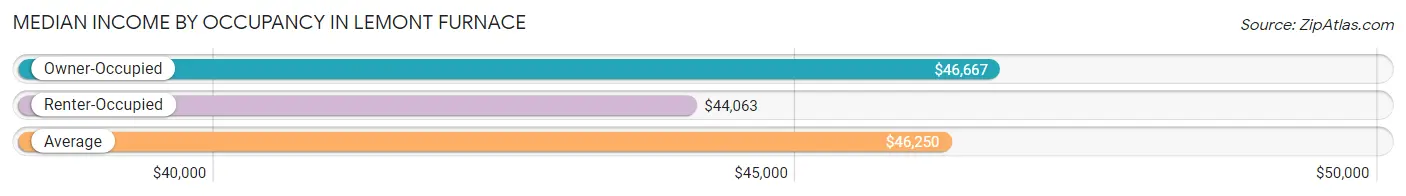
| Occupancy Type | # Households | Median Income |
| Owner-Occupied | 262 (79.1%) | $46,667 |
| Renter-Occupied | 69 (20.8%) | $44,063 |
| Average | 331 (100.0%) | $46,250 |
Occupancy by Householder Income Bracket in Lemont Furnace
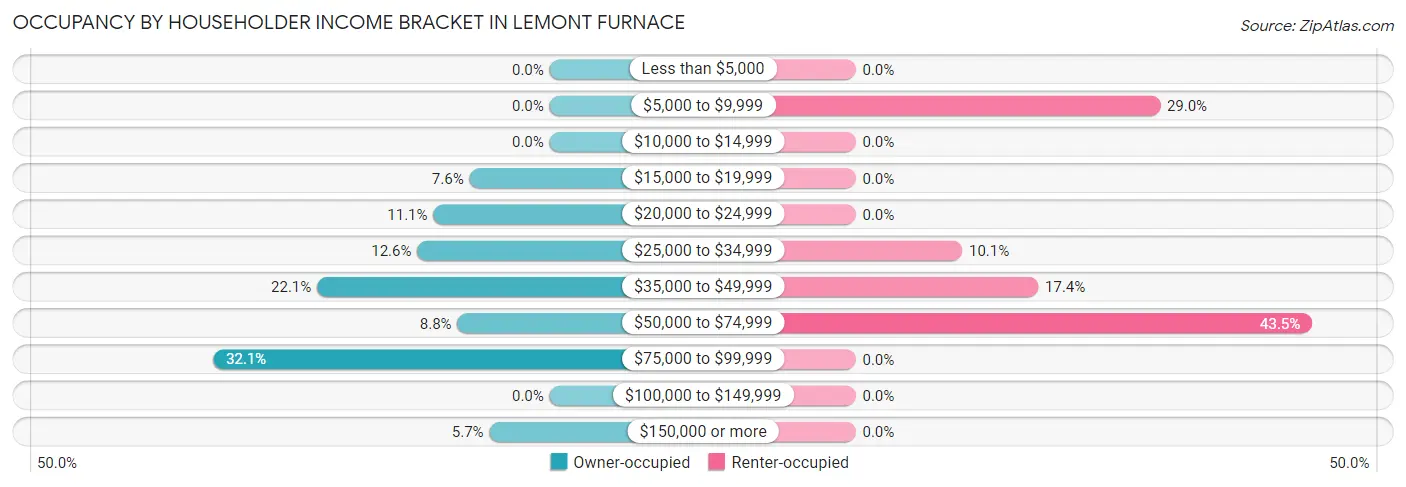
| Income Bracket | Owner-occupied | Renter-occupied |
| Less than $5,000 | 0 (0.0%) | 0 (0.0%) |
| $5,000 to $9,999 | 0 (0.0%) | 20 (29.0%) |
| $10,000 to $14,999 | 0 (0.0%) | 0 (0.0%) |
| $15,000 to $19,999 | 20 (7.6%) | 0 (0.0%) |
| $20,000 to $24,999 | 29 (11.1%) | 0 (0.0%) |
| $25,000 to $34,999 | 33 (12.6%) | 7 (10.1%) |
| $35,000 to $49,999 | 58 (22.1%) | 12 (17.4%) |
| $50,000 to $74,999 | 23 (8.8%) | 30 (43.5%) |
| $75,000 to $99,999 | 84 (32.1%) | 0 (0.0%) |
| $100,000 to $149,999 | 0 (0.0%) | 0 (0.0%) |
| $150,000 or more | 15 (5.7%) | 0 (0.0%) |
| Total | 262 (100.0%) | 69 (100.0%) |
Monthly Housing Cost Tiers in Lemont Furnace
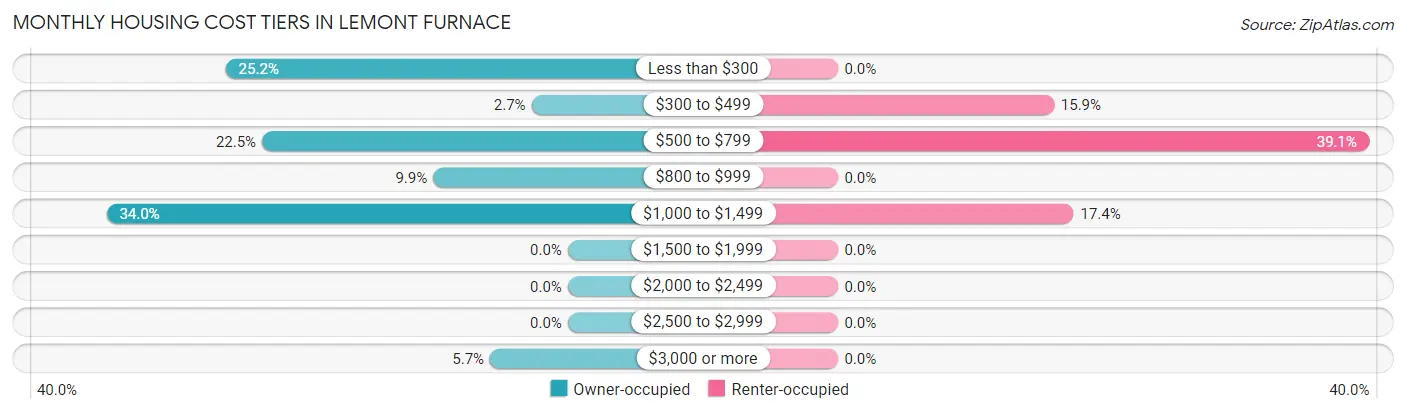
| Monthly Cost | Owner-occupied | Renter-occupied |
| Less than $300 | 66 (25.2%) | 0 (0.0%) |
| $300 to $499 | 7 (2.7%) | 11 (15.9%) |
| $500 to $799 | 59 (22.5%) | 27 (39.1%) |
| $800 to $999 | 26 (9.9%) | 0 (0.0%) |
| $1,000 to $1,499 | 89 (34.0%) | 12 (17.4%) |
| $1,500 to $1,999 | 0 (0.0%) | 0 (0.0%) |
| $2,000 to $2,499 | 0 (0.0%) | 0 (0.0%) |
| $2,500 to $2,999 | 0 (0.0%) | 0 (0.0%) |
| $3,000 or more | 15 (5.7%) | 0 (0.0%) |
| Total | 262 (100.0%) | 69 (100.0%) |
Physical Housing Characteristics in Lemont Furnace
Housing Structures in Lemont Furnace
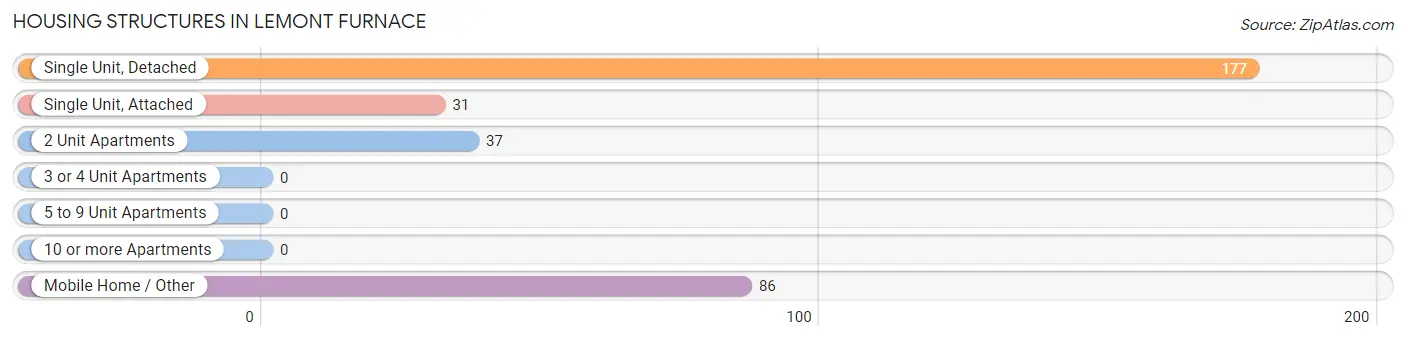
| Structure Type | # Housing Units | % Housing Units |
| Single Unit, Detached | 177 | 53.5% |
| Single Unit, Attached | 31 | 9.4% |
| 2 Unit Apartments | 37 | 11.2% |
| 3 or 4 Unit Apartments | 0 | 0.0% |
| 5 to 9 Unit Apartments | 0 | 0.0% |
| 10 or more Apartments | 0 | 0.0% |
| Mobile Home / Other | 86 | 26.0% |
| Total | 331 | 100.0% |
Housing Structures by Occupancy in Lemont Furnace
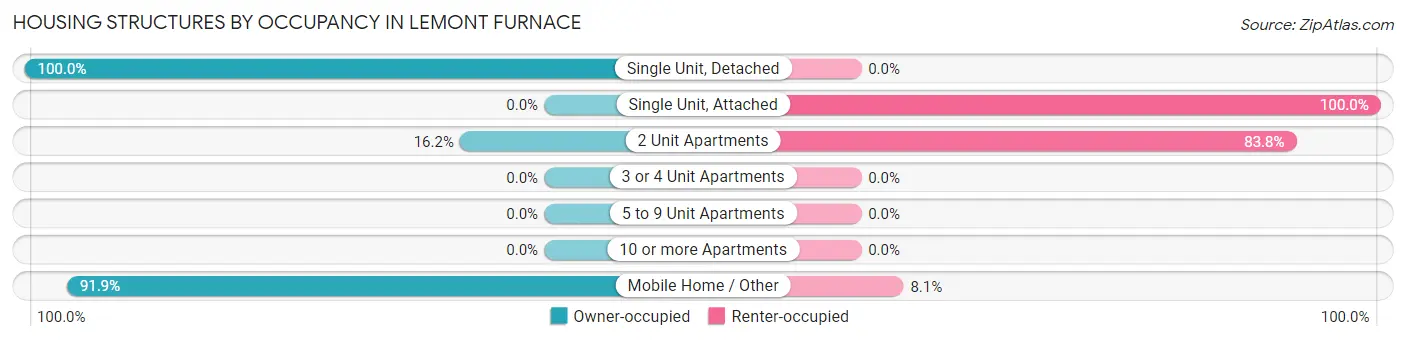
| Structure Type | Owner-occupied | Renter-occupied |
| Single Unit, Detached | 177 (100.0%) | 0 (0.0%) |
| Single Unit, Attached | 0 (0.0%) | 31 (100.0%) |
| 2 Unit Apartments | 6 (16.2%) | 31 (83.8%) |
| 3 or 4 Unit Apartments | 0 (0.0%) | 0 (0.0%) |
| 5 to 9 Unit Apartments | 0 (0.0%) | 0 (0.0%) |
| 10 or more Apartments | 0 (0.0%) | 0 (0.0%) |
| Mobile Home / Other | 79 (91.9%) | 7 (8.1%) |
| Total | 262 (79.1%) | 69 (20.8%) |
Housing Structures by Number of Rooms in Lemont Furnace
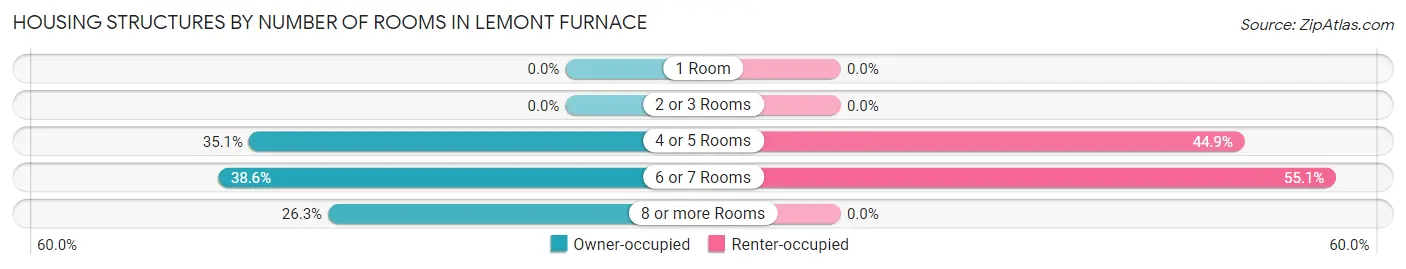
| Number of Rooms | Owner-occupied | Renter-occupied |
| 1 Room | 0 (0.0%) | 0 (0.0%) |
| 2 or 3 Rooms | 0 (0.0%) | 0 (0.0%) |
| 4 or 5 Rooms | 92 (35.1%) | 31 (44.9%) |
| 6 or 7 Rooms | 101 (38.6%) | 38 (55.1%) |
| 8 or more Rooms | 69 (26.3%) | 0 (0.0%) |
| Total | 262 (100.0%) | 69 (100.0%) |
Housing Structure by Heating Type in Lemont Furnace
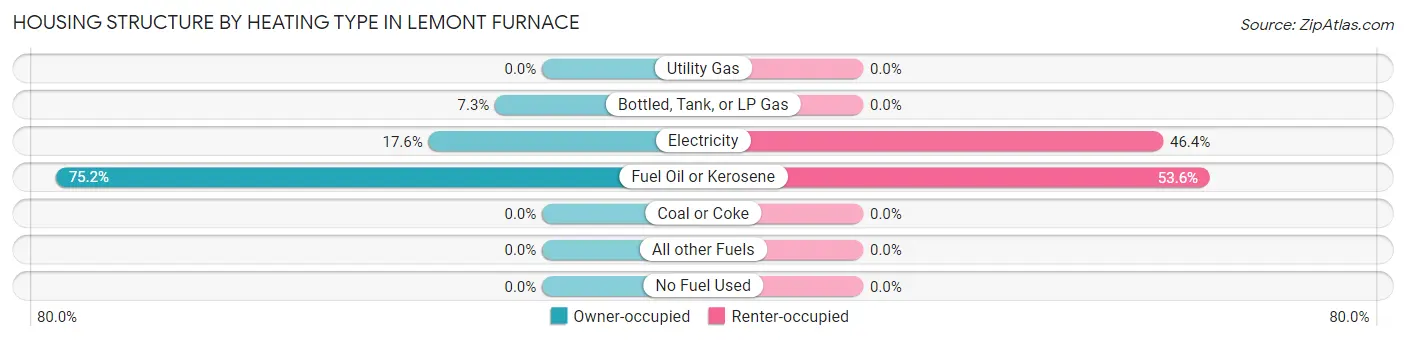
| Heating Type | Owner-occupied | Renter-occupied |
| Utility Gas | 0 (0.0%) | 0 (0.0%) |
| Bottled, Tank, or LP Gas | 19 (7.2%) | 0 (0.0%) |
| Electricity | 46 (17.6%) | 32 (46.4%) |
| Fuel Oil or Kerosene | 197 (75.2%) | 37 (53.6%) |
| Coal or Coke | 0 (0.0%) | 0 (0.0%) |
| All other Fuels | 0 (0.0%) | 0 (0.0%) |
| No Fuel Used | 0 (0.0%) | 0 (0.0%) |
| Total | 262 (100.0%) | 69 (100.0%) |
Household Vehicle Usage in Lemont Furnace
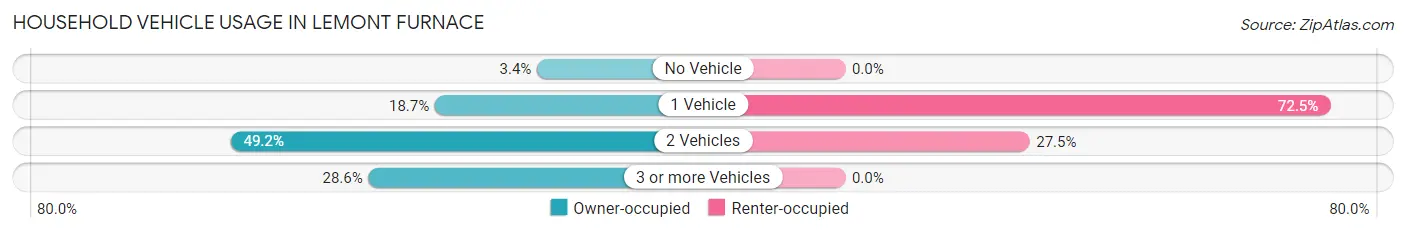
| Vehicles per Household | Owner-occupied | Renter-occupied |
| No Vehicle | 9 (3.4%) | 0 (0.0%) |
| 1 Vehicle | 49 (18.7%) | 50 (72.5%) |
| 2 Vehicles | 129 (49.2%) | 19 (27.5%) |
| 3 or more Vehicles | 75 (28.6%) | 0 (0.0%) |
| Total | 262 (100.0%) | 69 (100.0%) |
Real Estate & Mortgages in Lemont Furnace
Real Estate and Mortgage Overview in Lemont Furnace
| Characteristic | Without Mortgage | With Mortgage |
| Housing Units | 141 | 121 |
| Median Property Value | $48,900 | $140,300 |
| Median Household Income | $39,375 | $15 |
| Monthly Housing Costs | $464 | $15 |
| Real Estate Taxes | $1,135 | $18 |
Property Value by Mortgage Status in Lemont Furnace
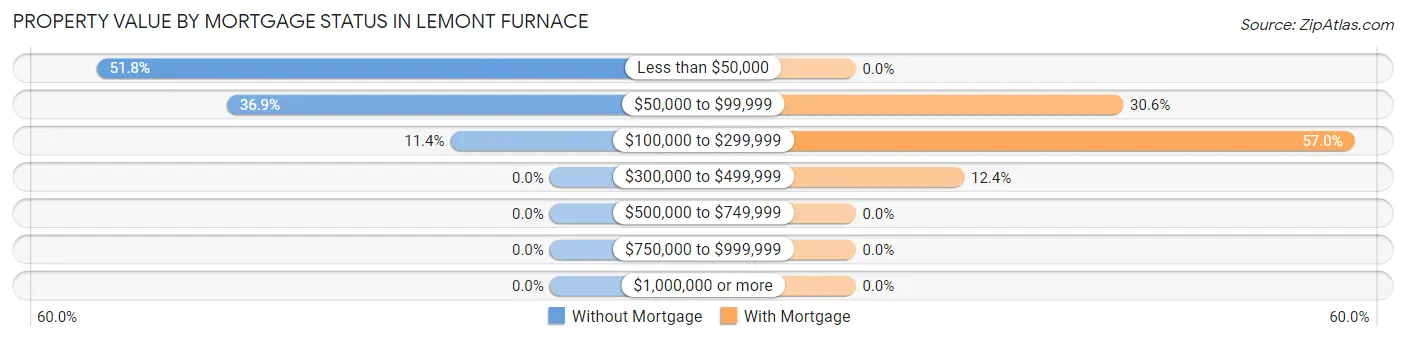
| Property Value | Without Mortgage | With Mortgage |
| Less than $50,000 | 73 (51.8%) | 0 (0.0%) |
| $50,000 to $99,999 | 52 (36.9%) | 37 (30.6%) |
| $100,000 to $299,999 | 16 (11.4%) | 69 (57.0%) |
| $300,000 to $499,999 | 0 (0.0%) | 15 (12.4%) |
| $500,000 to $749,999 | 0 (0.0%) | 0 (0.0%) |
| $750,000 to $999,999 | 0 (0.0%) | 0 (0.0%) |
| $1,000,000 or more | 0 (0.0%) | 0 (0.0%) |
| Total | 141 (100.0%) | 121 (100.0%) |
Household Income by Mortgage Status in Lemont Furnace
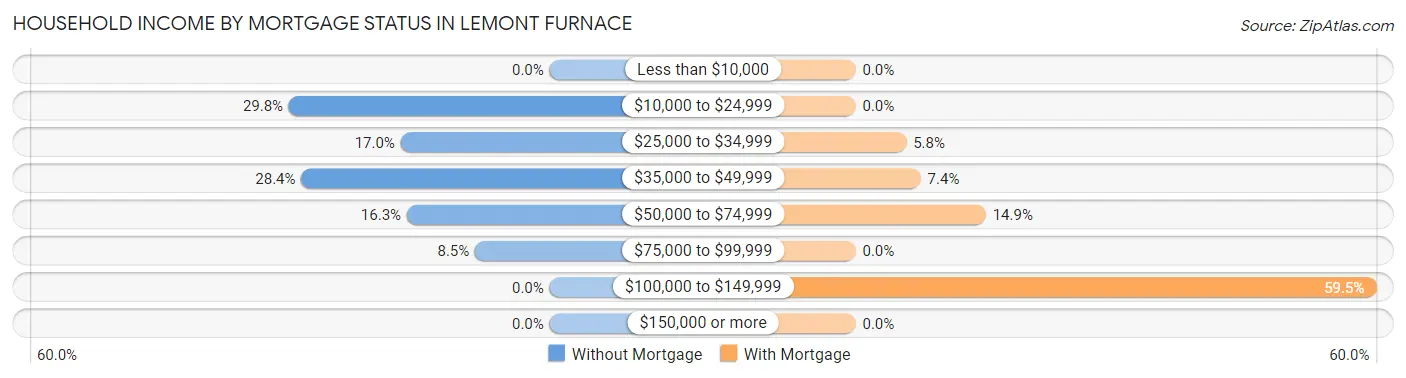
| Household Income | Without Mortgage | With Mortgage |
| Less than $10,000 | 0 (0.0%) | 0 (0.0%) |
| $10,000 to $24,999 | 42 (29.8%) | 0 (0.0%) |
| $25,000 to $34,999 | 24 (17.0%) | 7 (5.8%) |
| $35,000 to $49,999 | 40 (28.4%) | 9 (7.4%) |
| $50,000 to $74,999 | 23 (16.3%) | 18 (14.9%) |
| $75,000 to $99,999 | 12 (8.5%) | 0 (0.0%) |
| $100,000 to $149,999 | 0 (0.0%) | 72 (59.5%) |
| $150,000 or more | 0 (0.0%) | 0 (0.0%) |
| Total | 141 (100.0%) | 121 (100.0%) |
Property Value to Household Income Ratio in Lemont Furnace
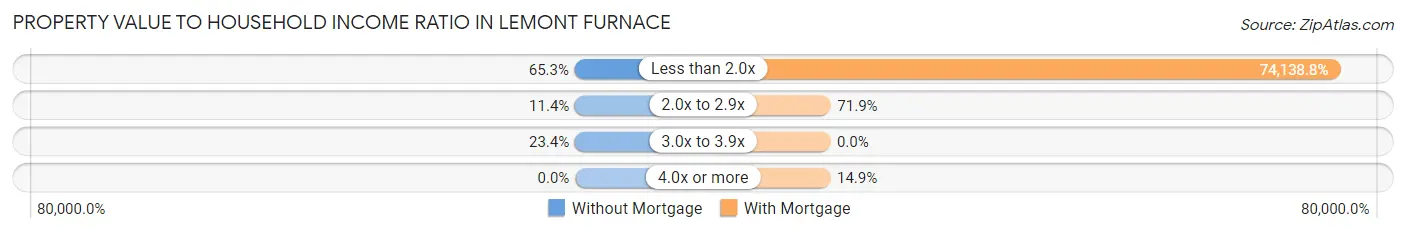
| Value-to-Income Ratio | Without Mortgage | With Mortgage |
| Less than 2.0x | 92 (65.2%) | 89,708 (74,138.8%) |
| 2.0x to 2.9x | 16 (11.4%) | 87 (71.9%) |
| 3.0x to 3.9x | 33 (23.4%) | 0 (0.0%) |
| 4.0x or more | 0 (0.0%) | 18 (14.9%) |
| Total | 141 (100.0%) | 121 (100.0%) |
Real Estate Taxes by Mortgage Status in Lemont Furnace
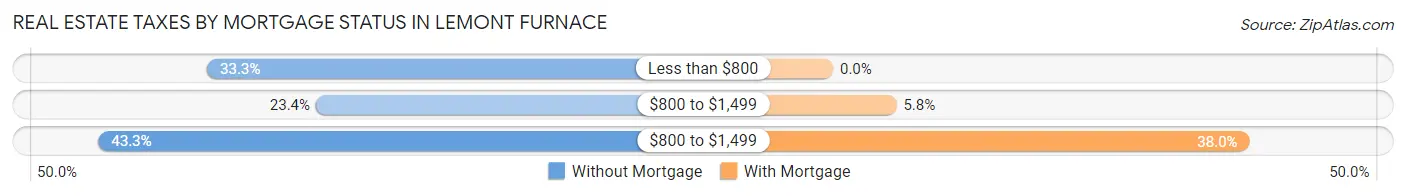
| Property Taxes | Without Mortgage | With Mortgage |
| Less than $800 | 47 (33.3%) | 0 (0.0%) |
| $800 to $1,499 | 33 (23.4%) | 7 (5.8%) |
| $800 to $1,499 | 61 (43.3%) | 46 (38.0%) |
| Total | 141 (100.0%) | 121 (100.0%) |
Health & Disability in Lemont Furnace
Health Insurance Coverage by Age in Lemont Furnace
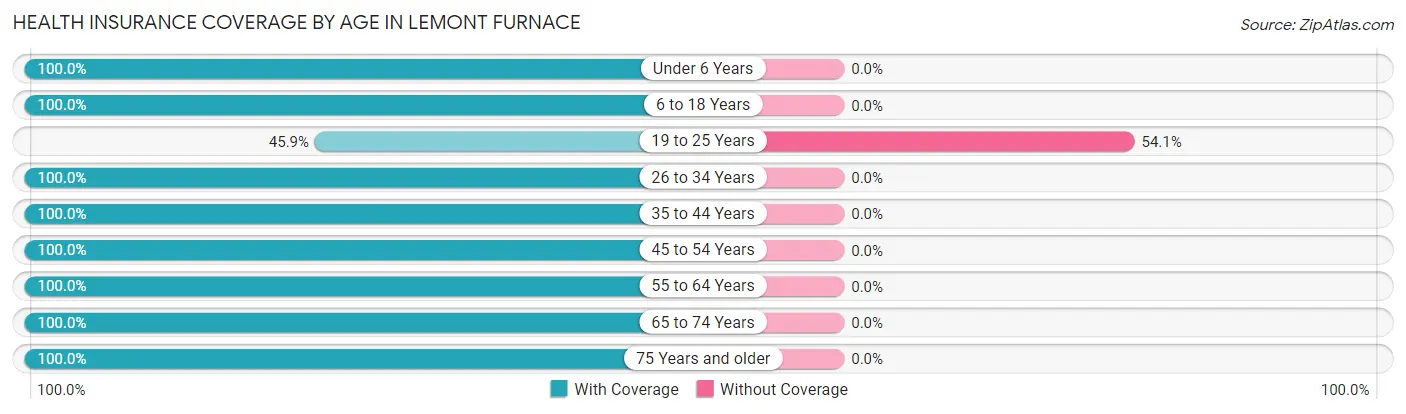
| Age Bracket | With Coverage | Without Coverage |
| Under 6 Years | 116 (100.0%) | 0 (0.0%) |
| 6 to 18 Years | 161 (100.0%) | 0 (0.0%) |
| 19 to 25 Years | 100 (45.9%) | 118 (54.1%) |
| 26 to 34 Years | 37 (100.0%) | 0 (0.0%) |
| 35 to 44 Years | 132 (100.0%) | 0 (0.0%) |
| 45 to 54 Years | 141 (100.0%) | 0 (0.0%) |
| 55 to 64 Years | 84 (100.0%) | 0 (0.0%) |
| 65 to 74 Years | 101 (100.0%) | 0 (0.0%) |
| 75 Years and older | 44 (100.0%) | 0 (0.0%) |
| Total | 916 (88.6%) | 118 (11.4%) |
Health Insurance Coverage by Citizenship Status in Lemont Furnace
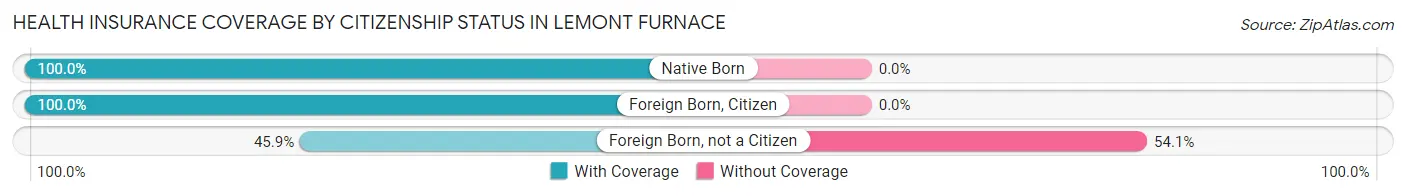
| Citizenship Status | With Coverage | Without Coverage |
| Native Born | 116 (100.0%) | 0 (0.0%) |
| Foreign Born, Citizen | 161 (100.0%) | 0 (0.0%) |
| Foreign Born, not a Citizen | 100 (45.9%) | 118 (54.1%) |
Health Insurance Coverage by Household Income in Lemont Furnace
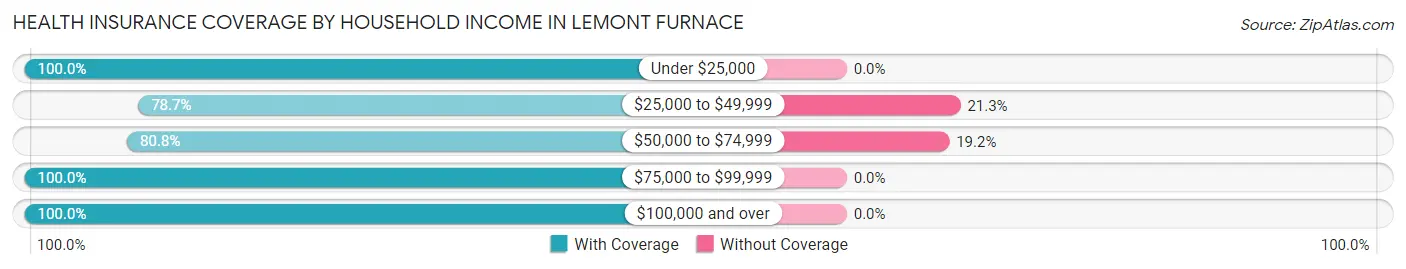
| Household Income | With Coverage | Without Coverage |
| Under $25,000 | 69 (100.0%) | 0 (0.0%) |
| $25,000 to $49,999 | 366 (78.7%) | 99 (21.3%) |
| $50,000 to $74,999 | 80 (80.8%) | 19 (19.2%) |
| $75,000 to $99,999 | 343 (100.0%) | 0 (0.0%) |
| $100,000 and over | 57 (100.0%) | 0 (0.0%) |
Public vs Private Health Insurance Coverage by Age in Lemont Furnace
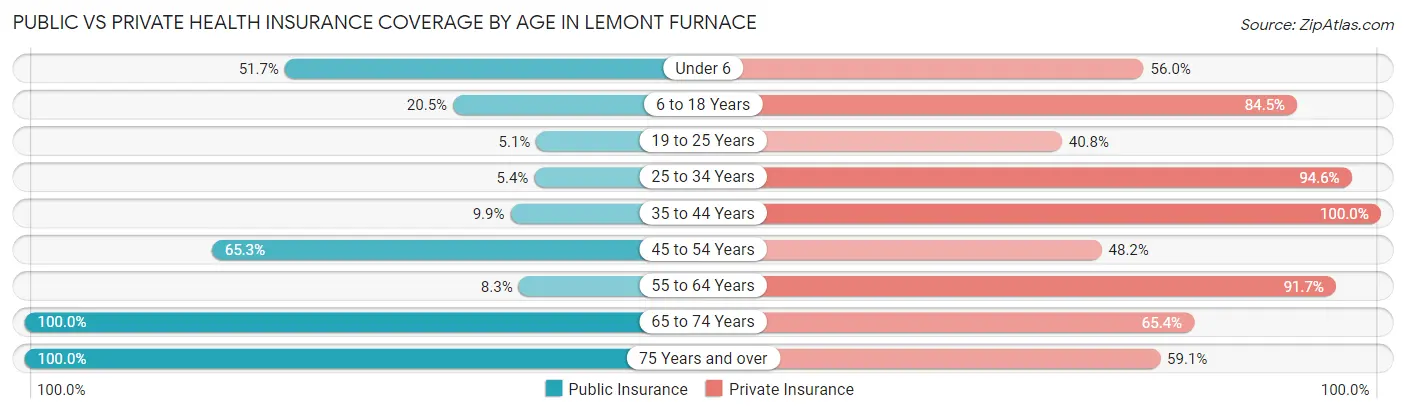
| Age Bracket | Public Insurance | Private Insurance |
| Under 6 | 60 (51.7%) | 65 (56.0%) |
| 6 to 18 Years | 33 (20.5%) | 136 (84.5%) |
| 19 to 25 Years | 11 (5.1%) | 89 (40.8%) |
| 25 to 34 Years | 2 (5.4%) | 35 (94.6%) |
| 35 to 44 Years | 13 (9.9%) | 132 (100.0%) |
| 45 to 54 Years | 92 (65.2%) | 68 (48.2%) |
| 55 to 64 Years | 7 (8.3%) | 77 (91.7%) |
| 65 to 74 Years | 101 (100.0%) | 66 (65.3%) |
| 75 Years and over | 44 (100.0%) | 26 (59.1%) |
| Total | 363 (35.1%) | 694 (67.1%) |
Disability Status by Sex by Age in Lemont Furnace
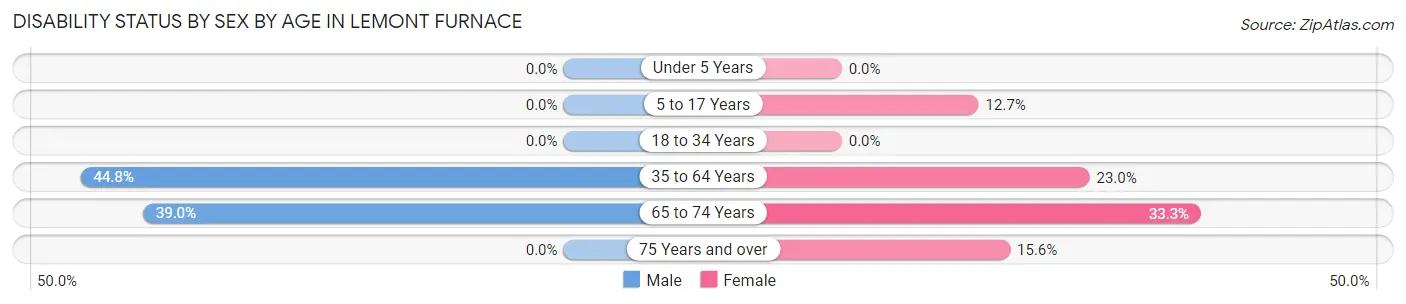
| Age Bracket | Male | Female |
| Under 5 Years | 0 (0.0%) | 0 (0.0%) |
| 5 to 17 Years | 0 (0.0%) | 8 (12.7%) |
| 18 to 34 Years | 0 (0.0%) | 0 (0.0%) |
| 35 to 64 Years | 82 (44.8%) | 40 (23.0%) |
| 65 to 74 Years | 16 (39.0%) | 20 (33.3%) |
| 75 Years and over | 0 (0.0%) | 5 (15.6%) |
Disability Class by Sex by Age in Lemont Furnace
Disability Class: Hearing Difficulty
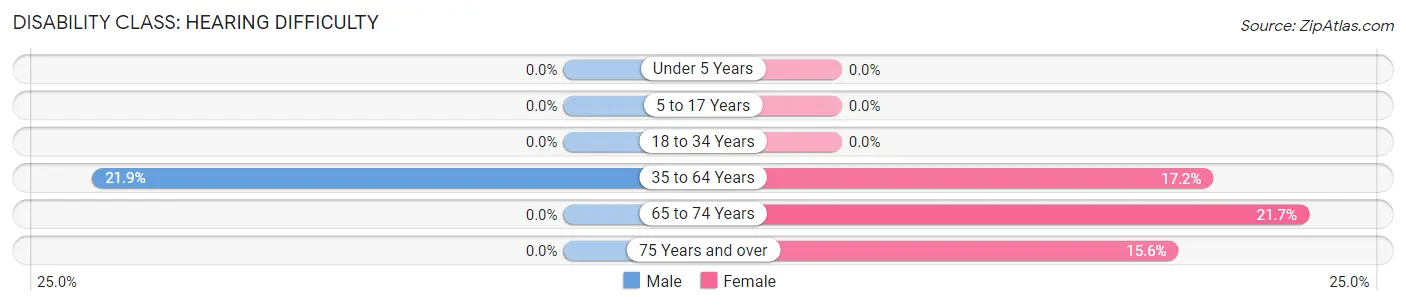
| Age Bracket | Male | Female |
| Under 5 Years | 0 (0.0%) | 0 (0.0%) |
| 5 to 17 Years | 0 (0.0%) | 0 (0.0%) |
| 18 to 34 Years | 0 (0.0%) | 0 (0.0%) |
| 35 to 64 Years | 40 (21.9%) | 30 (17.2%) |
| 65 to 74 Years | 0 (0.0%) | 13 (21.7%) |
| 75 Years and over | 0 (0.0%) | 5 (15.6%) |
Disability Class: Vision Difficulty
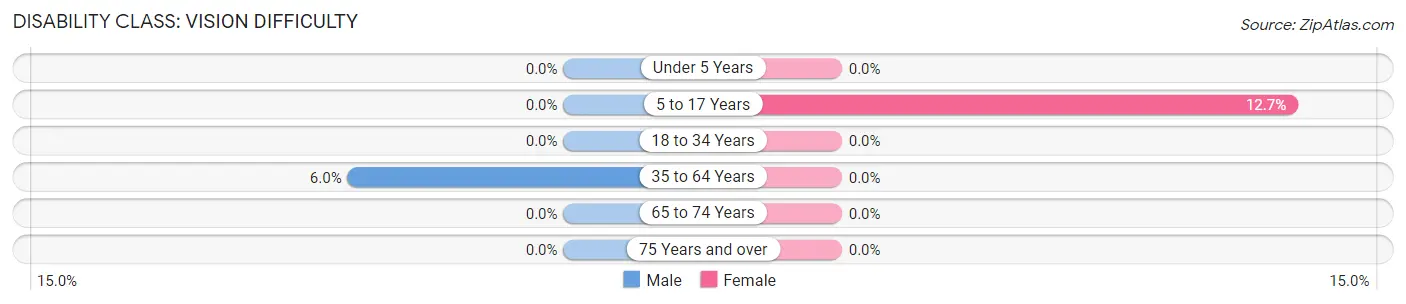
| Age Bracket | Male | Female |
| Under 5 Years | 0 (0.0%) | 0 (0.0%) |
| 5 to 17 Years | 0 (0.0%) | 8 (12.7%) |
| 18 to 34 Years | 0 (0.0%) | 0 (0.0%) |
| 35 to 64 Years | 11 (6.0%) | 0 (0.0%) |
| 65 to 74 Years | 0 (0.0%) | 0 (0.0%) |
| 75 Years and over | 0 (0.0%) | 0 (0.0%) |
Disability Class: Cognitive Difficulty
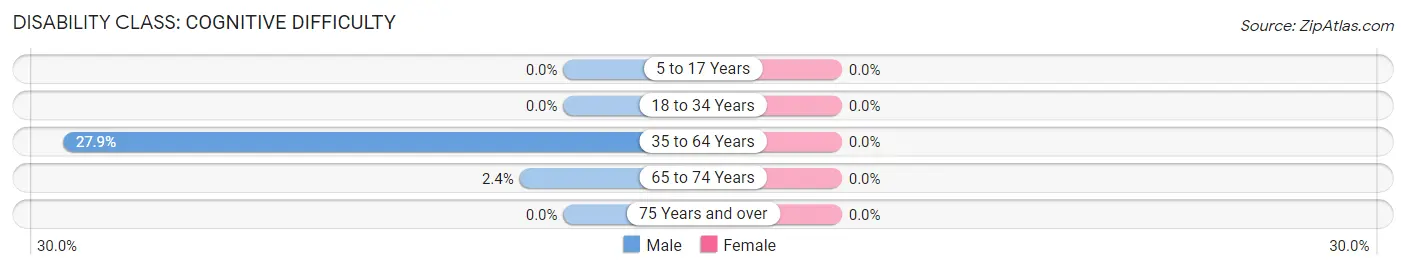
| Age Bracket | Male | Female |
| 5 to 17 Years | 0 (0.0%) | 0 (0.0%) |
| 18 to 34 Years | 0 (0.0%) | 0 (0.0%) |
| 35 to 64 Years | 51 (27.9%) | 0 (0.0%) |
| 65 to 74 Years | 1 (2.4%) | 0 (0.0%) |
| 75 Years and over | 0 (0.0%) | 0 (0.0%) |
Disability Class: Ambulatory Difficulty
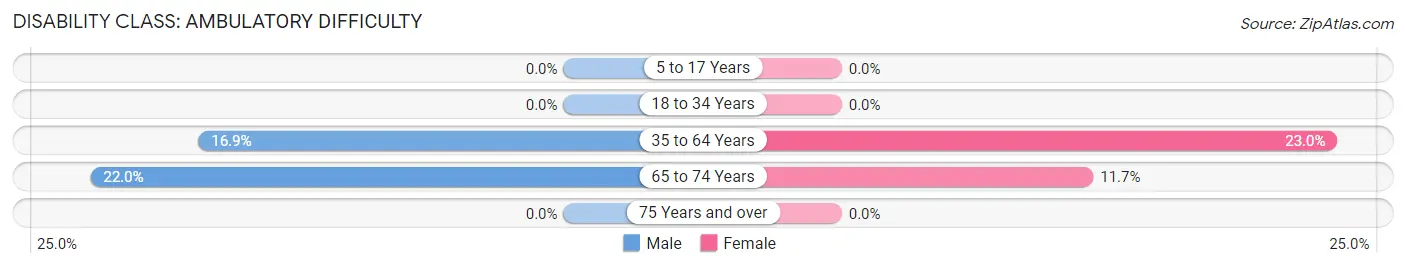
| Age Bracket | Male | Female |
| 5 to 17 Years | 0 (0.0%) | 0 (0.0%) |
| 18 to 34 Years | 0 (0.0%) | 0 (0.0%) |
| 35 to 64 Years | 31 (16.9%) | 40 (23.0%) |
| 65 to 74 Years | 9 (22.0%) | 7 (11.7%) |
| 75 Years and over | 0 (0.0%) | 0 (0.0%) |
Disability Class: Self-Care Difficulty
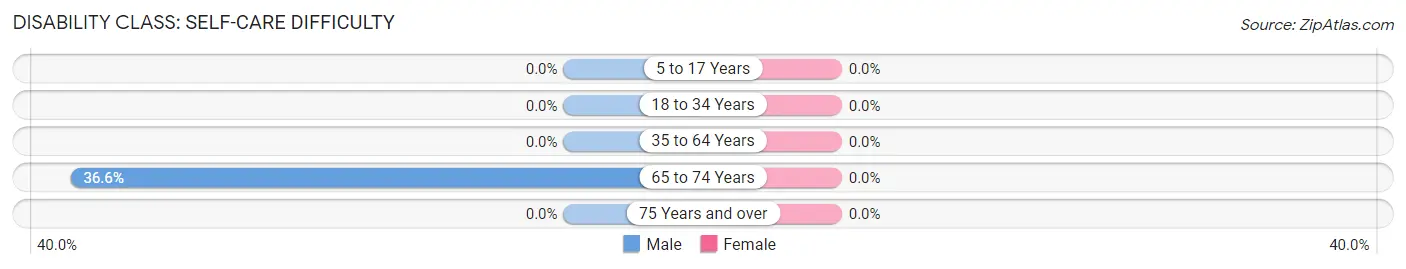
| Age Bracket | Male | Female |
| 5 to 17 Years | 0 (0.0%) | 0 (0.0%) |
| 18 to 34 Years | 0 (0.0%) | 0 (0.0%) |
| 35 to 64 Years | 0 (0.0%) | 0 (0.0%) |
| 65 to 74 Years | 15 (36.6%) | 0 (0.0%) |
| 75 Years and over | 0 (0.0%) | 0 (0.0%) |
Technology Access in Lemont Furnace
Computing Device Access in Lemont Furnace
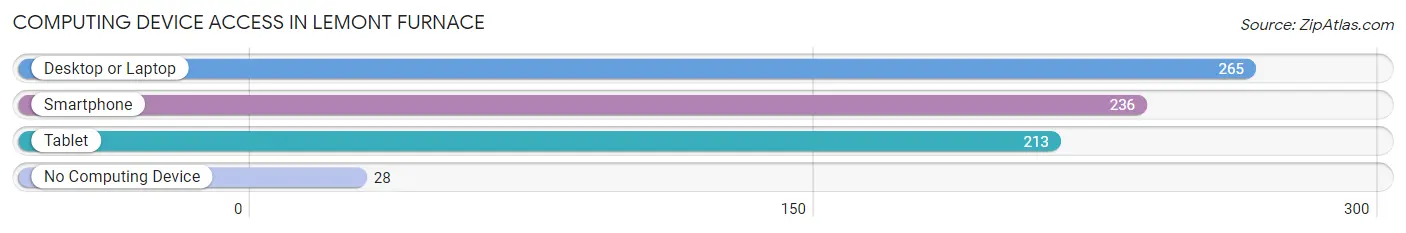
| Device Type | # Households | % Households |
| Desktop or Laptop | 265 | 80.1% |
| Smartphone | 236 | 71.3% |
| Tablet | 213 | 64.3% |
| No Computing Device | 28 | 8.5% |
| Total | 331 | 100.0% |
Internet Access in Lemont Furnace
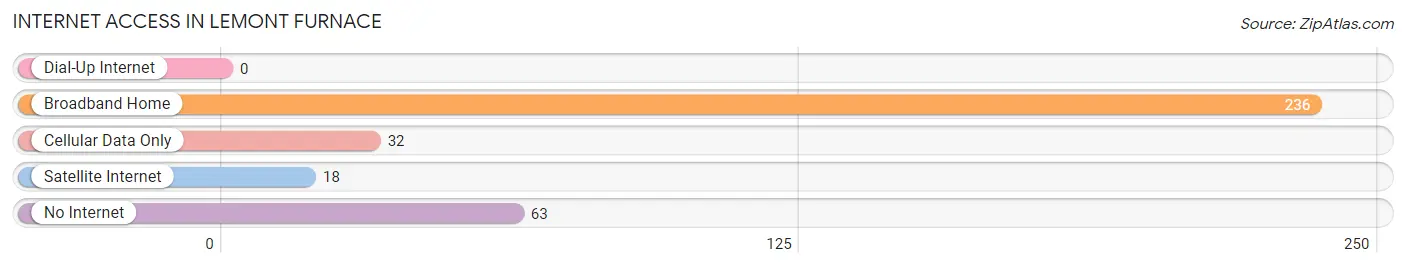
| Internet Type | # Households | % Households |
| Dial-Up Internet | 0 | 0.0% |
| Broadband Home | 236 | 71.3% |
| Cellular Data Only | 32 | 9.7% |
| Satellite Internet | 18 | 5.4% |
| No Internet | 63 | 19.0% |
| Total | 331 | 100.0% |
Lemont Furnace Summary
Lemont Furnace is a small borough located in Fayette County, Pennsylvania. It is situated in the southwestern part of the state, approximately 40 miles south of Pittsburgh. The borough is part of the Uniontown Metropolitan Statistical Area and is home to approximately 1,000 people.
Geography
Lemont Furnace is located in the southwestern part of Fayette County, Pennsylvania. It is situated in the Laurel Highlands region of the state, which is known for its rolling hills and lush forests. The borough is located along the banks of the Youghiogheny River, which is a tributary of the Monongahela River. The borough is bordered by the townships of Dunbar, Wharton, and Franklin. The total area of the borough is 0.6 square miles, all of which is land.
Climate
Lemont Furnace has a humid continental climate, with hot summers and cold winters. The average annual temperature is around 50°F, with an average high of around 75°F in the summer and an average low of around 25°F in the winter. The average annual precipitation is around 40 inches, with the majority of it falling in the spring and summer months.
Demographics
As of the 2010 census, there were 1,072 people, 441 households, and 287 families residing in the borough. The population density was 1,788.3 people per square mile. The racial makeup of the borough was 97.2% White, 0.9% African American, 0.2% Native American, 0.2% Asian, 0.2% from other races, and 1.3% from two or more races. Hispanic or Latino of any race were 0.7% of the population.
The median age in the borough was 43.2 years. 22.2% of residents were under the age of 18; 7.2% were between the ages of 18 and 24; 24.2% were from 25 to 44; 28.2% were from 45 to 64; and 18.2% were 65 years of age or older. The gender makeup of the borough was 48.2% male and 51.8% female.
Economy
Lemont Furnace is a small, rural borough with a limited economy. The majority of the borough’s residents are employed in the service sector, with many working in local restaurants, retail stores, and other service-related businesses. The borough is also home to a few small manufacturing companies, including a steel mill and a paper mill.
The median household income in the borough was $31,250, and the median family income was $37,500. About 15.2% of the population was below the poverty line.
History
Lemont Furnace was founded in 1845 by a group of settlers from the nearby town of Uniontown. The borough was named after the nearby limestone furnace, which was used to produce iron and steel. The furnace was in operation until the early 1900s, when it was closed due to the decline of the iron and steel industry in the area.
In the late 19th century, the borough was home to a number of coal mines, which provided employment for many of the borough’s residents. The coal mines were eventually closed in the early 20th century, due to the decline of the coal industry in the area.
Today, Lemont Furnace is a small, rural borough with a limited economy. The borough is home to a few small businesses, including a steel mill and a paper mill. The borough is also home to a number of recreational activities, including hiking, fishing, and camping.
Common Questions
What is the Total Population of Lemont Furnace?
Total Population of Lemont Furnace is 1,034.
What is the Total Male Population of Lemont Furnace?
Total Male Population of Lemont Furnace is 575.
What is the Total Female Population of Lemont Furnace?
Total Female Population of Lemont Furnace is 459.
What is the Ratio of Males per 100 Females in Lemont Furnace?
There are 125.27 Males per 100 Females in Lemont Furnace.
What is the Ratio of Females per 100 Males in Lemont Furnace?
There are 79.83 Females per 100 Males in Lemont Furnace.
What is the Median Population Age in Lemont Furnace?
Median Population Age in Lemont Furnace is 28.5 Years.
What is the Average Family Size in Lemont Furnace
Average Family Size in Lemont Furnace is 4.1 People.
What is the Average Household Size in Lemont Furnace
Average Household Size in Lemont Furnace is 3.1 People.
What is Per Capita Income in Lemont Furnace?
Per Capita income in Lemont Furnace is $20,251.
What is the Median Family Income in Lemont Furnace?
Median Family Income in Lemont Furnace is $61,328.
What is the Median Household income in Lemont Furnace?
Median Household Income in Lemont Furnace is $46,250.
What is Income or Wage Gap in Lemont Furnace?
Income or Wage Gap in Lemont Furnace is 32.6%.
Women in Lemont Furnace earn 67.4 cents for every dollar earned by a man.
What is Inequality or Gini Index in Lemont Furnace?
Inequality or Gini Index in Lemont Furnace is 0.37.
How Large is the Labor Force in Lemont Furnace?
There are 391 People in the Labor Forcein in Lemont Furnace.
What is the Percentage of People in the Labor Force in Lemont Furnace?
48.6% of People are in the Labor Force in Lemont Furnace.
What is the Unemployment Rate in Lemont Furnace?
Unemployment Rate in Lemont Furnace is 4.3%.