Hollidaysburg borough, PA
Hollidaysburg borough Overview
5,630
TOTAL POPULATION
2,691
MALE POPULATION
2,939
FEMALE POPULATION
91.56
MALES / 100 FEMALES
109.22
FEMALES / 100 MALES
48.6
MEDIAN AGE
2.8
AVG FAMILY SIZE
2.0
AVG HOUSEHOLD SIZE
$41,157
PER CAPITA INCOME
$83,906
AVG FAMILY INCOME
$65,142
AVG HOUSEHOLD INCOME
18.9%
WAGE / INCOME GAP [ % ]
81.1¢/ $1
WAGE / INCOME GAP [ $ ]
0.43
INEQUALITY / GINI INDEX
2,677
LABOR FORCE [ PEOPLE ]
55.6%
PERCENT IN LABOR FORCE
2.7%
UNEMPLOYMENT RATE
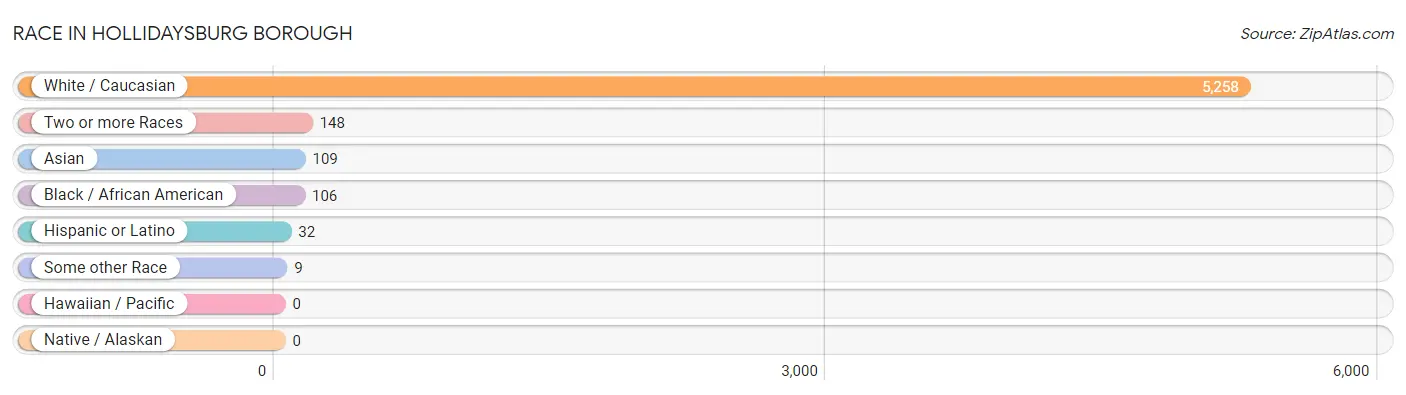
Race in Hollidaysburg borough
The most populous races in Hollidaysburg borough are White / Caucasian (5,258 | 93.4%), Two or more Races (148 | 2.6%), and Asian (109 | 1.9%).
| Race | # Population | % Population |
| Asian | 109 | 1.9% |
| Black / African American | 106 | 1.9% |
| Hawaiian / Pacific | 0 | 0.0% |
| Hispanic or Latino | 32 | 0.6% |
| Native / Alaskan | 0 | 0.0% |
| White / Caucasian | 5,258 | 93.4% |
| Two or more Races | 148 | 2.6% |
| Some other Race | 9 | 0.2% |
| Total | 5,630 | 100.0% |
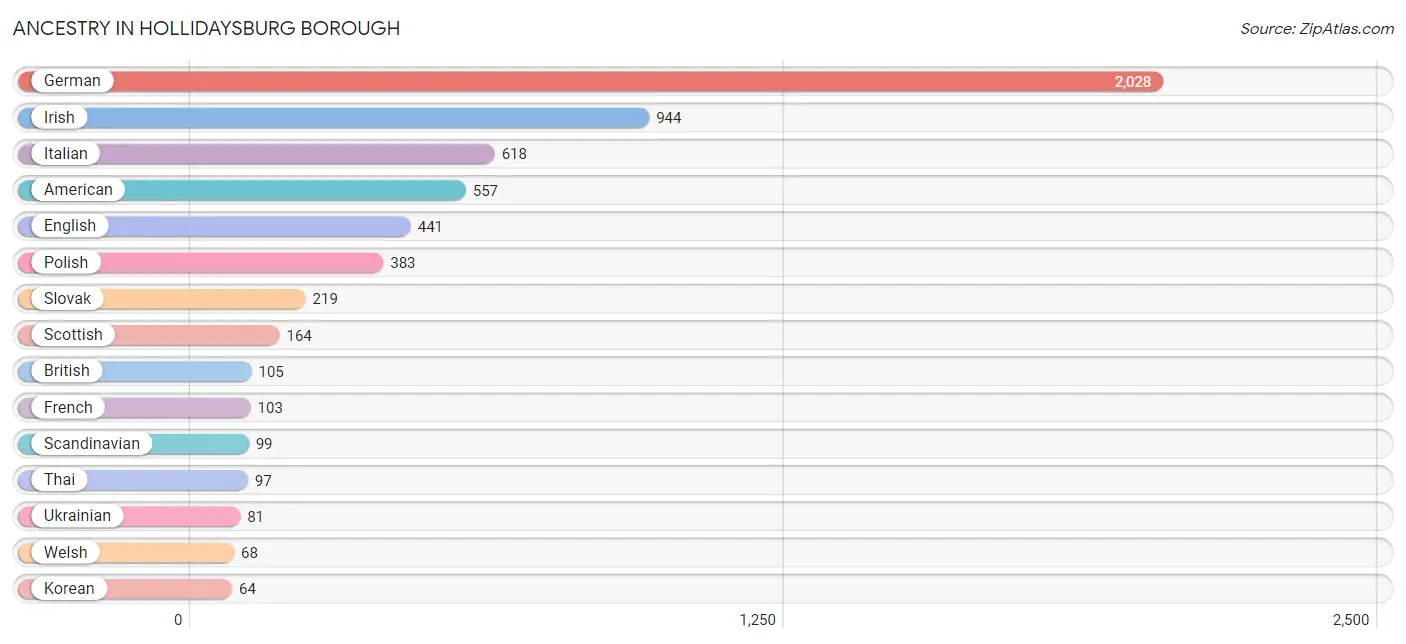
Ancestry in Hollidaysburg borough
The most populous ancestries reported in Hollidaysburg borough are German (2,028 | 36.0%), Irish (944 | 16.8%), Italian (618 | 11.0%), American (557 | 9.9%), and English (441 | 7.8%), together accounting for 81.5% of all Hollidaysburg borough residents.
| Ancestry | # Population | % Population |
| African | 1 | 0.0% |
| American | 557 | 9.9% |
| Austrian | 14 | 0.3% |
| Blackfeet | 22 | 0.4% |
| British | 105 | 1.9% |
| Burmese | 12 | 0.2% |
| Central American | 1 | 0.0% |
| Croatian | 22 | 0.4% |
| Czech | 31 | 0.5% |
| Danish | 7 | 0.1% |
| Dutch | 31 | 0.5% |
| Eastern European | 56 | 1.0% |
| English | 441 | 7.8% |
| European | 43 | 0.8% |
| French | 103 | 1.8% |
| German | 2,028 | 36.0% |
| Greek | 53 | 0.9% |
| Guatemalan | 1 | 0.0% |
| Hungarian | 26 | 0.5% |
| Irish | 944 | 16.8% |
| Italian | 618 | 11.0% |
| Korean | 64 | 1.1% |
| Lithuanian | 17 | 0.3% |
| Mexican | 22 | 0.4% |
| Northern European | 7 | 0.1% |
| Norwegian | 52 | 0.9% |
| Pennsylvania German | 28 | 0.5% |
| Polish | 383 | 6.8% |
| Romanian | 8 | 0.1% |
| Scandinavian | 99 | 1.8% |
| Scotch-Irish | 19 | 0.3% |
| Scottish | 164 | 2.9% |
| Slovak | 219 | 3.9% |
| Subsaharan African | 1 | 0.0% |
| Swedish | 64 | 1.1% |
| Swiss | 22 | 0.4% |
| Thai | 97 | 1.7% |
| Ukrainian | 81 | 1.4% |
| Welsh | 68 | 1.2% |
| West Indian | 47 | 0.8% | View All 40 Rows |
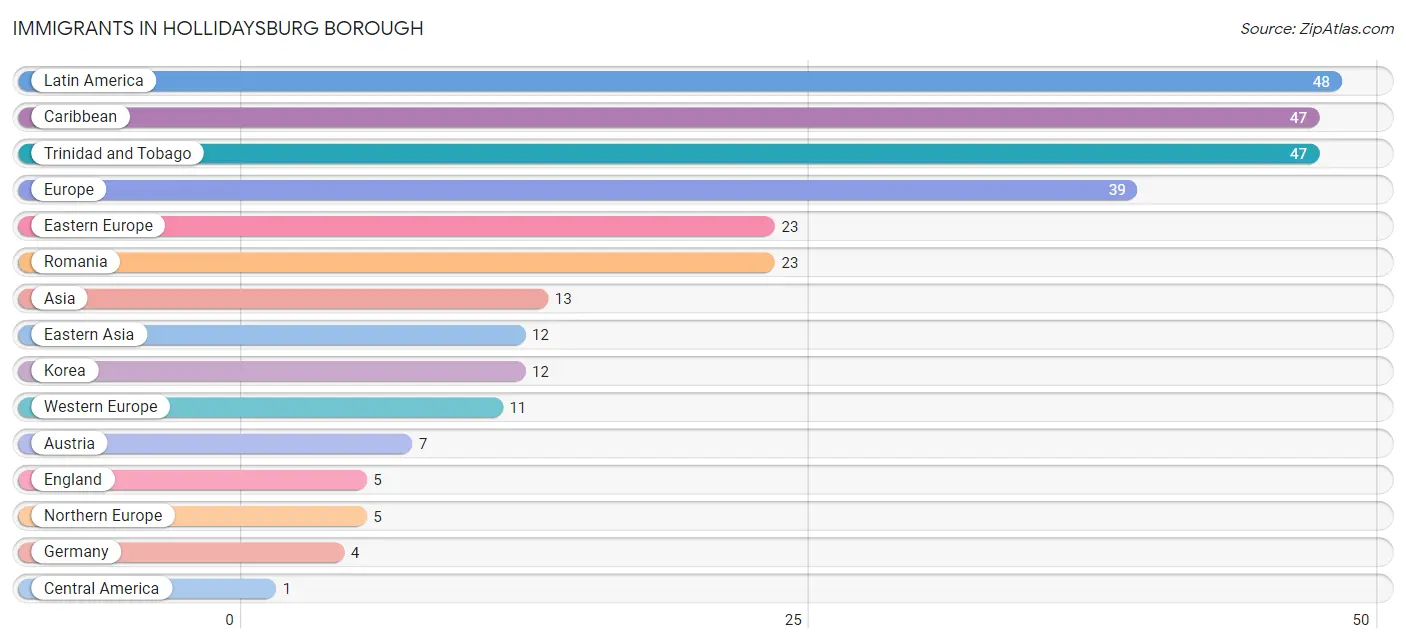
Immigrants in Hollidaysburg borough
The most numerous immigrant groups reported in Hollidaysburg borough came from Latin America (48 | 0.9%), Caribbean (47 | 0.8%), Trinidad and Tobago (47 | 0.8%), Europe (39 | 0.7%), and Eastern Europe (23 | 0.4%), together accounting for 3.6% of all Hollidaysburg borough residents.
| Immigration Origin | # Population | % Population |
| Asia | 13 | 0.2% |
| Austria | 7 | 0.1% |
| Caribbean | 47 | 0.8% |
| Central America | 1 | 0.0% |
| Eastern Asia | 12 | 0.2% |
| Eastern Europe | 23 | 0.4% |
| England | 5 | 0.1% |
| Europe | 39 | 0.7% |
| Germany | 4 | 0.1% |
| Guatemala | 1 | 0.0% |
| Korea | 12 | 0.2% |
| Latin America | 48 | 0.9% |
| Northern Europe | 5 | 0.1% |
| Romania | 23 | 0.4% |
| South Eastern Asia | 1 | 0.0% |
| Trinidad and Tobago | 47 | 0.8% |
| Vietnam | 1 | 0.0% |
| Western Europe | 11 | 0.2% | View All 18 Rows |
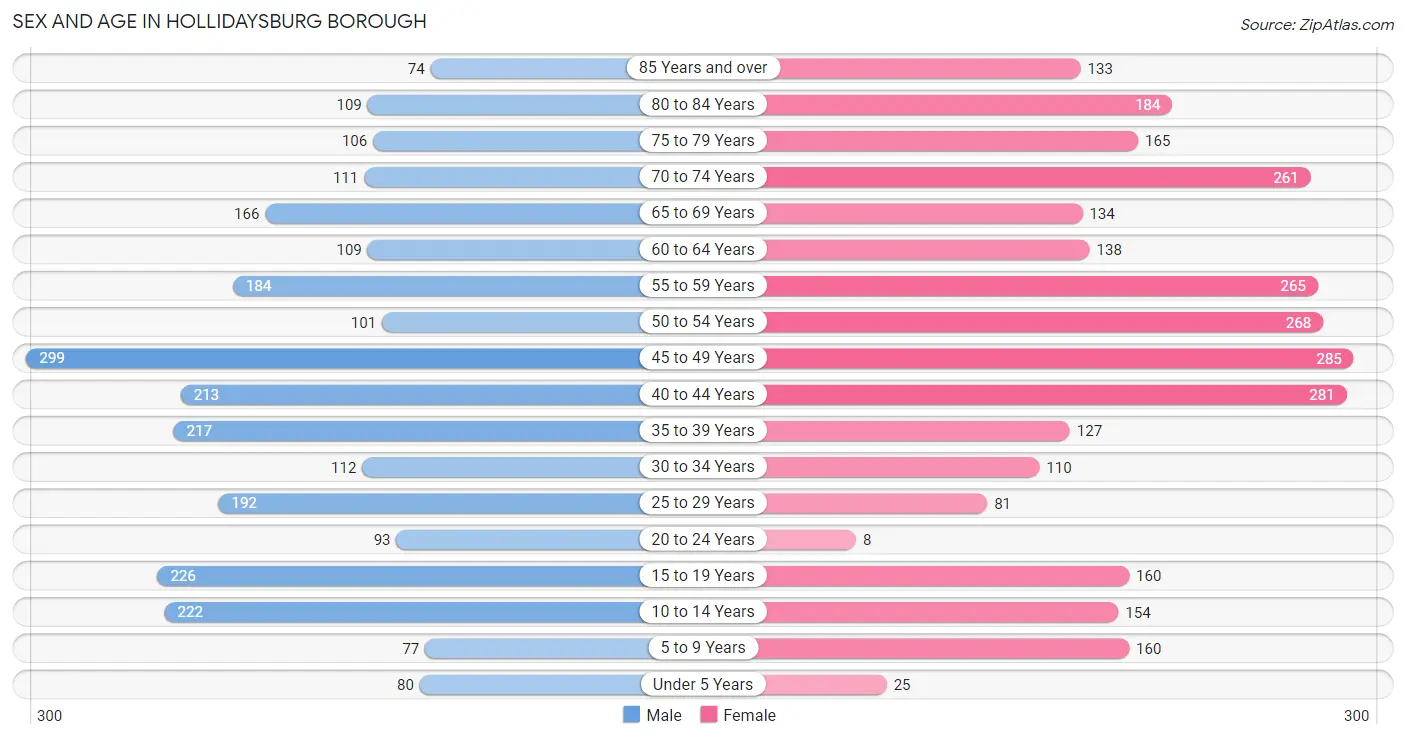
Sex and Age in Hollidaysburg borough
Sex and Age in Hollidaysburg borough
The most populous age groups in Hollidaysburg borough are 45 to 49 Years (299 | 11.1%) for men and 45 to 49 Years (285 | 9.7%) for women.
| Age Bracket | Male | Female |
| Under 5 Years | 80 (3.0%) | 25 (0.9%) |
| 5 to 9 Years | 77 (2.9%) | 160 (5.4%) |
| 10 to 14 Years | 222 (8.3%) | 154 (5.2%) |
| 15 to 19 Years | 226 (8.4%) | 160 (5.4%) |
| 20 to 24 Years | 93 (3.5%) | 8 (0.3%) |
| 25 to 29 Years | 192 (7.1%) | 81 (2.8%) |
| 30 to 34 Years | 112 (4.2%) | 110 (3.7%) |
| 35 to 39 Years | 217 (8.1%) | 127 (4.3%) |
| 40 to 44 Years | 213 (7.9%) | 281 (9.6%) |
| 45 to 49 Years | 299 (11.1%) | 285 (9.7%) |
| 50 to 54 Years | 101 (3.7%) | 268 (9.1%) |
| 55 to 59 Years | 184 (6.8%) | 265 (9.0%) |
| 60 to 64 Years | 109 (4.1%) | 138 (4.7%) |
| 65 to 69 Years | 166 (6.2%) | 134 (4.6%) |
| 70 to 74 Years | 111 (4.1%) | 261 (8.9%) |
| 75 to 79 Years | 106 (3.9%) | 165 (5.6%) |
| 80 to 84 Years | 109 (4.1%) | 184 (6.3%) |
| 85 Years and over | 74 (2.8%) | 133 (4.5%) |
| Total | 2,691 (100.0%) | 2,939 (100.0%) |
Families and Households in Hollidaysburg borough
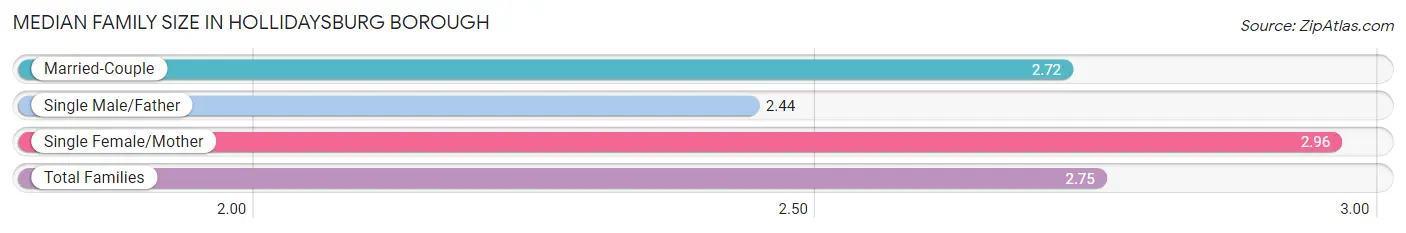
Median Family Size in Hollidaysburg borough
The median family size in Hollidaysburg borough is 2.75 persons per family, with single female/mother families (247 | 16.7%) accounting for the largest median family size of 2.96 persons per family. On the other hand, single male/father families (90 | 6.1%) represent the smallest median family size with 2.44 persons per family.
| Family Type | # Families | Family Size |
| Married-Couple | 1,142 (77.2%) | 2.72 |
| Single Male/Father | 90 (6.1%) | 2.44 |
| Single Female/Mother | 247 (16.7%) | 2.96 |
| Total Families | 1,479 (100.0%) | 2.75 |
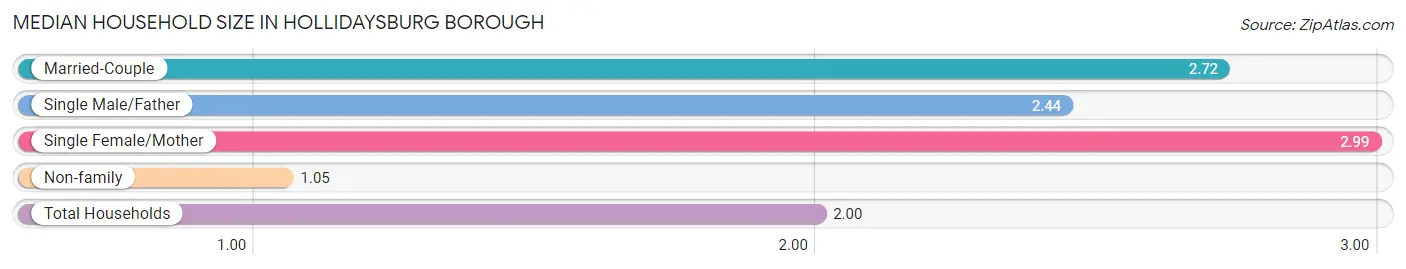
Median Household Size in Hollidaysburg borough
The median household size in Hollidaysburg borough is 2.00 persons per household, with single female/mother households (247 | 9.4%) accounting for the largest median household size of 2.99 persons per household. non-family households (1,160 | 44.0%) represent the smallest median household size with 1.05 persons per household.
| Household Type | # Households | Household Size |
| Married-Couple | 1,142 (43.3%) | 2.72 |
| Single Male/Father | 90 (3.4%) | 2.44 |
| Single Female/Mother | 247 (9.4%) | 2.99 |
| Non-family | 1,160 (44.0%) | 1.05 |
| Total Households | 2,639 (100.0%) | 2.00 |
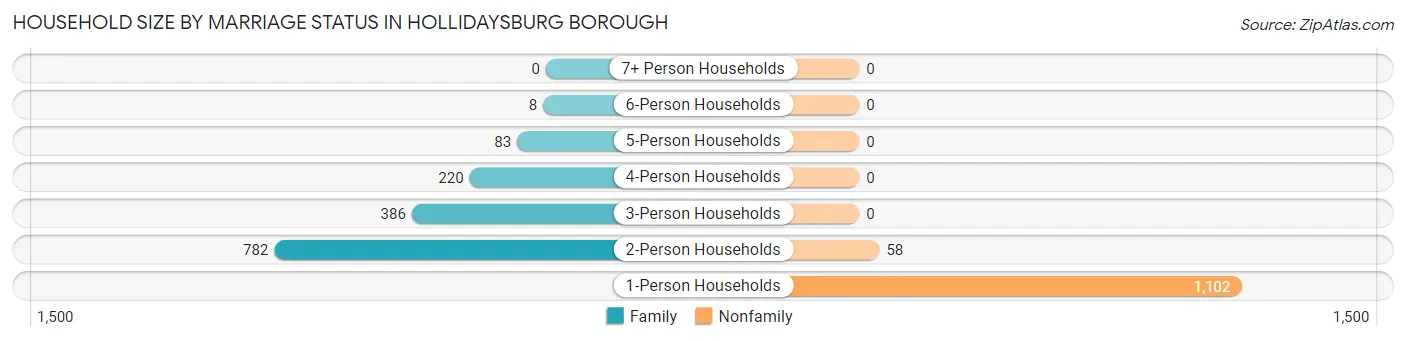
Household Size by Marriage Status in Hollidaysburg borough
Out of a total of 2,639 households in Hollidaysburg borough, 1,479 (56.0%) are family households, while 1,160 (44.0%) are nonfamily households. The most numerous type of family households are 2-person households, comprising 782, and the most common type of nonfamily households are 1-person households, comprising 1,102.
| Household Size | Family Households | Nonfamily Households |
| 1-Person Households | - | 1,102 (41.8%) |
| 2-Person Households | 782 (29.6%) | 58 (2.2%) |
| 3-Person Households | 386 (14.6%) | 0 (0.0%) |
| 4-Person Households | 220 (8.3%) | 0 (0.0%) |
| 5-Person Households | 83 (3.2%) | 0 (0.0%) |
| 6-Person Households | 8 (0.3%) | 0 (0.0%) |
| 7+ Person Households | 0 (0.0%) | 0 (0.0%) |
| Total | 1,479 (56.0%) | 1,160 (44.0%) |
Female Fertility in Hollidaysburg borough
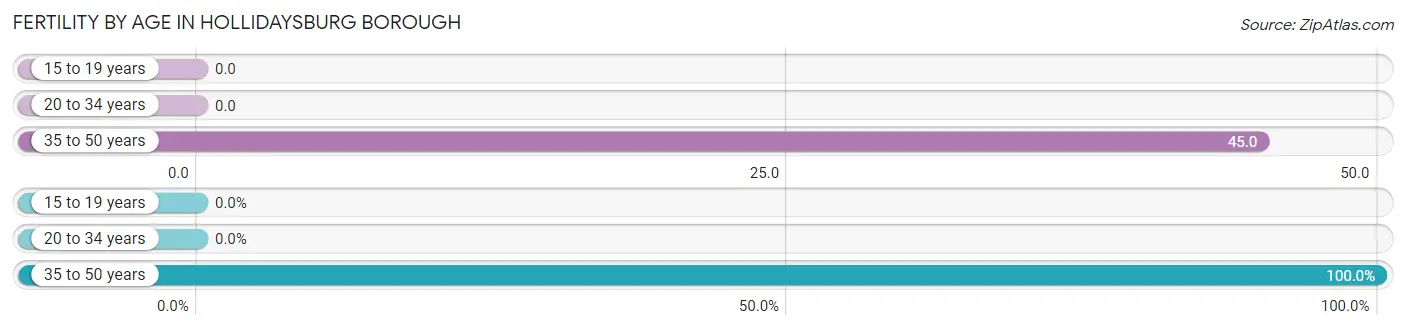
Fertility by Age in Hollidaysburg borough
Average fertility rate in Hollidaysburg borough is 30.0 births per 1,000 women. Women in the age bracket of 35 to 50 years have the highest fertility rate with 45.0 births per 1,000 women. Women in the age bracket of 35 to 50 years acount for 100.0% of all women with births.
| Age Bracket | Women with Births | Births / 1,000 Women |
| 15 to 19 years | 0 (0.0%) | 0.0 |
| 20 to 34 years | 0 (0.0%) | 0.0 |
| 35 to 50 years | 32 (100.0%) | 45.0 |
| Total | 32 (100.0%) | 30.0 |
Fertility by Age by Marriage Status in Hollidaysburg borough
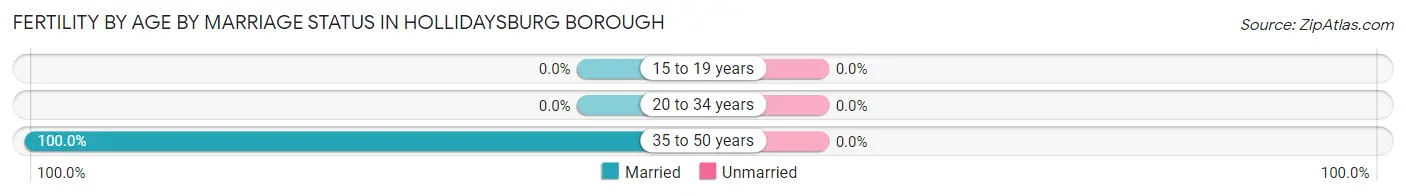
| Age Bracket | Married | Unmarried |
| 15 to 19 years | 0 (0.0%) | 0 (0.0%) |
| 20 to 34 years | 0 (0.0%) | 0 (0.0%) |
| 35 to 50 years | 32 (100.0%) | 0 (0.0%) |
| Total | 32 (100.0%) | 0 (0.0%) |
Fertility by Education in Hollidaysburg borough
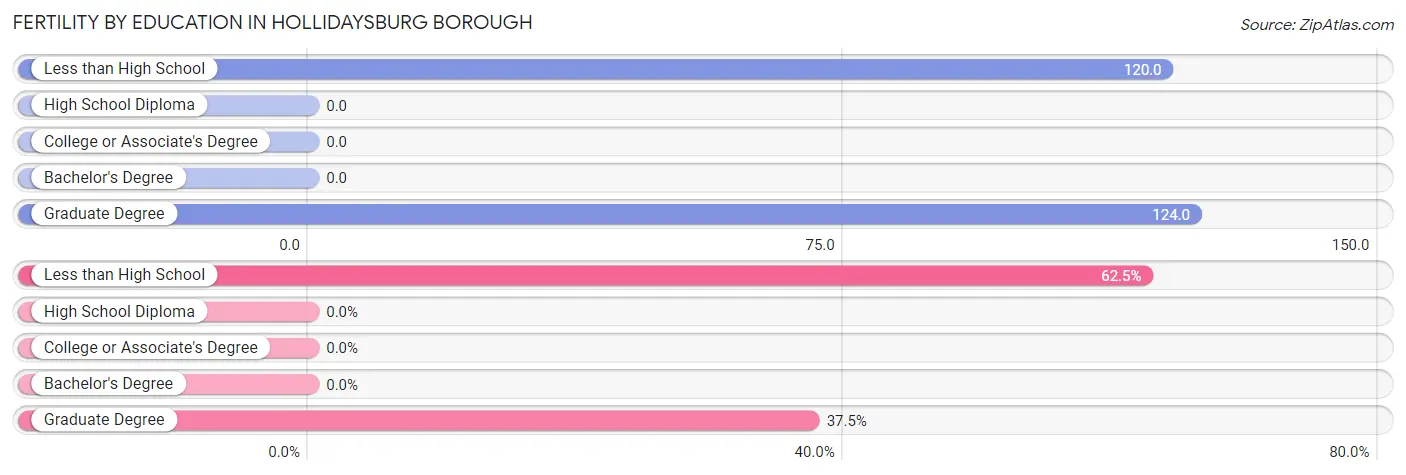
| Educational Attainment | Women with Births | Births / 1,000 Women |
| Less than High School | 20 (62.5%) | 120.0 |
| High School Diploma | 0 (0.0%) | 0.0 |
| College or Associate's Degree | 0 (0.0%) | 0.0 |
| Bachelor's Degree | 0 (0.0%) | 0.0 |
| Graduate Degree | 12 (37.5%) | 124.0 |
| Total | 32 (100.0%) | 30.0 |
Fertility by Education by Marriage Status in Hollidaysburg borough
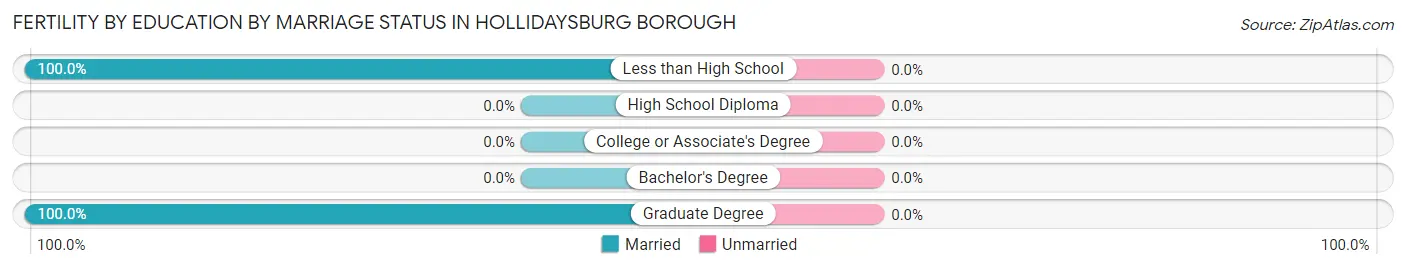
| Educational Attainment | Married | Unmarried |
| Less than High School | 20 (100.0%) | 0 (0.0%) |
| High School Diploma | 0 (0.0%) | 0 (0.0%) |
| College or Associate's Degree | 0 (0.0%) | 0 (0.0%) |
| Bachelor's Degree | 0 (0.0%) | 0 (0.0%) |
| Graduate Degree | 12 (100.0%) | 0 (0.0%) |
| Total | 32 (100.0%) | 0 (0.0%) |
Income in Hollidaysburg borough
Income Overview in Hollidaysburg borough
Per Capita Income in Hollidaysburg borough is $41,157, while median incomes of families and households are $83,906 and $65,142 respectively.
| Characteristic | Number | Measure |
| Per Capita Income | 5,630 | $41,157 |
| Median Family Income | 1,479 | $83,906 |
| Mean Family Income | 1,479 | $114,757 |
| Median Household Income | 2,639 | $65,142 |
| Mean Household Income | 2,639 | $85,453 |
| Income Deficit | 1,479 | $0 |
| Wage / Income Gap (%) | 5,630 | 18.95% |
| Wage / Income Gap ($) | 5,630 | 81.05¢ per $1 |
| Gini / Inequality Index | 5,630 | 0.43 |
Earnings by Sex in Hollidaysburg borough
Average Earnings in Hollidaysburg borough are $37,717, $42,768 for men and $34,665 for women, a difference of 19.0%.
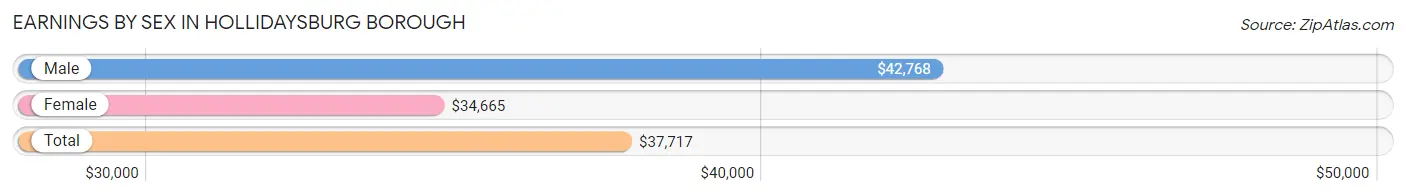
| Sex | Number | Average Earnings |
| Male | 1,447 (51.0%) | $42,768 |
| Female | 1,391 (49.0%) | $34,665 |
| Total | 2,838 (100.0%) | $37,717 |
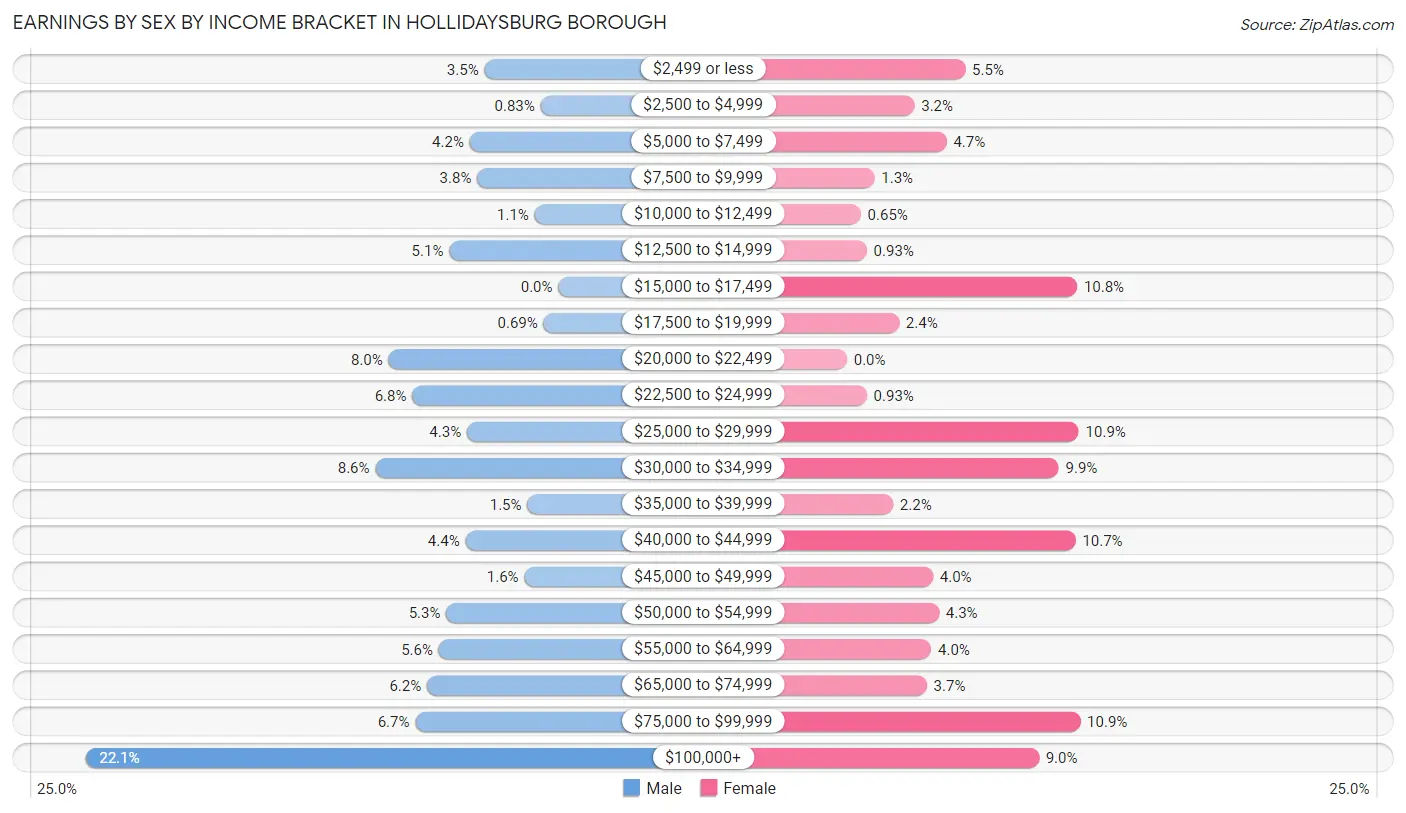
Earnings by Sex by Income Bracket in Hollidaysburg borough
The most common earnings brackets in Hollidaysburg borough are $100,000+ for men (320 | 22.1%) and $75,000 to $99,999 for women (152 | 10.9%).
| Income | Male | Female |
| $2,499 or less | 50 (3.5%) | 77 (5.5%) |
| $2,500 to $4,999 | 12 (0.8%) | 44 (3.2%) |
| $5,000 to $7,499 | 60 (4.2%) | 65 (4.7%) |
| $7,500 to $9,999 | 55 (3.8%) | 18 (1.3%) |
| $10,000 to $12,499 | 16 (1.1%) | 9 (0.6%) |
| $12,500 to $14,999 | 74 (5.1%) | 13 (0.9%) |
| $15,000 to $17,499 | 0 (0.0%) | 150 (10.8%) |
| $17,500 to $19,999 | 10 (0.7%) | 34 (2.4%) |
| $20,000 to $22,499 | 115 (8.0%) | 0 (0.0%) |
| $22,500 to $24,999 | 99 (6.8%) | 13 (0.9%) |
| $25,000 to $29,999 | 62 (4.3%) | 151 (10.9%) |
| $30,000 to $34,999 | 124 (8.6%) | 138 (9.9%) |
| $35,000 to $39,999 | 21 (1.5%) | 30 (2.2%) |
| $40,000 to $44,999 | 63 (4.3%) | 149 (10.7%) |
| $45,000 to $49,999 | 23 (1.6%) | 56 (4.0%) |
| $50,000 to $54,999 | 76 (5.2%) | 60 (4.3%) |
| $55,000 to $64,999 | 81 (5.6%) | 55 (4.0%) |
| $65,000 to $74,999 | 89 (6.1%) | 52 (3.7%) |
| $75,000 to $99,999 | 97 (6.7%) | 152 (10.9%) |
| $100,000+ | 320 (22.1%) | 125 (9.0%) |
| Total | 1,447 (100.0%) | 1,391 (100.0%) |
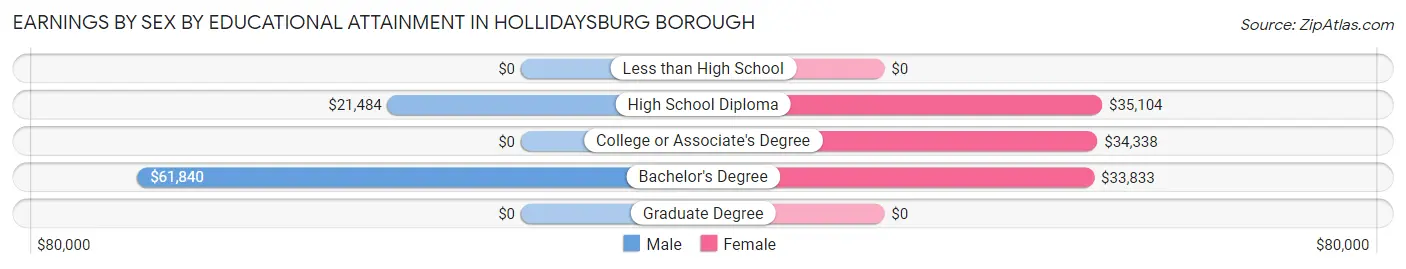
Earnings by Sex by Educational Attainment in Hollidaysburg borough
Average earnings in Hollidaysburg borough are $50,417 for men and $34,929 for women, a difference of 30.7%. Men with an educational attainment of bachelor's degree enjoy the highest average annual earnings of $61,840, while those with high school diploma education earn the least with $21,484. Women with an educational attainment of high school diploma earn the most with the average annual earnings of $35,104, while those with bachelor's degree education have the smallest earnings of $33,833.
| Educational Attainment | Male Income | Female Income |
| Less than High School | - | - |
| High School Diploma | $21,484 | $35,104 |
| College or Associate's Degree | - | - |
| Bachelor's Degree | $61,840 | $33,833 |
| Graduate Degree | - | - |
| Total | $50,417 | $34,929 |
Family Income in Hollidaysburg borough
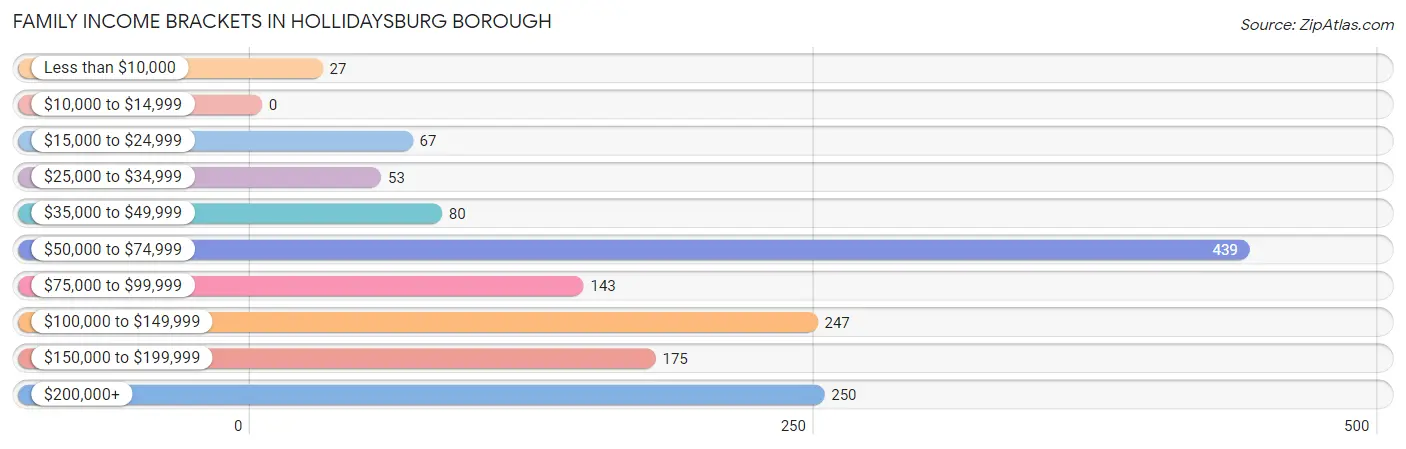
Family Income Brackets in Hollidaysburg borough
According to the Hollidaysburg borough family income data, there are 439 families falling into the $50,000 to $74,999 income range, which is the most common income bracket and makes up 29.7% of all families.
| Income Bracket | # Families | % Families |
| Less than $10,000 | 27 | 1.8% |
| $10,000 to $14,999 | 0 | 0.0% |
| $15,000 to $24,999 | 67 | 4.5% |
| $25,000 to $34,999 | 53 | 3.6% |
| $35,000 to $49,999 | 80 | 5.4% |
| $50,000 to $74,999 | 439 | 29.7% |
| $75,000 to $99,999 | 143 | 9.7% |
| $100,000 to $149,999 | 247 | 16.7% |
| $150,000 to $199,999 | 175 | 11.8% |
| $200,000+ | 250 | 16.9% |
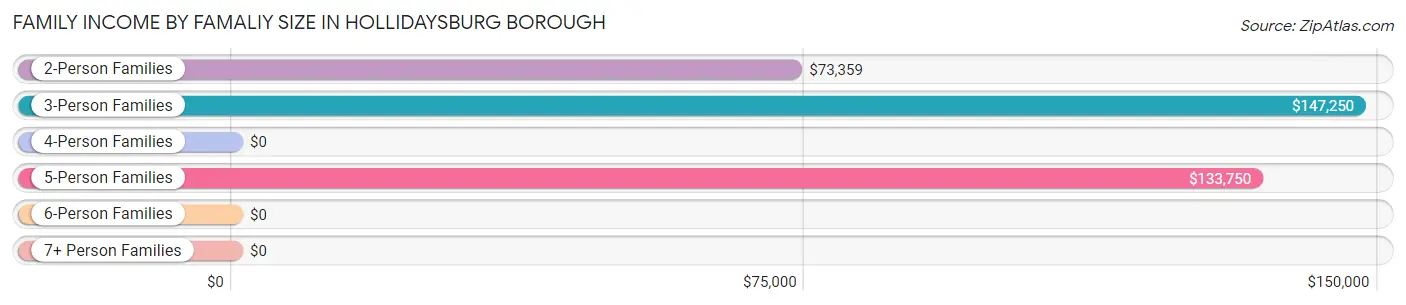
Family Income by Famaliy Size in Hollidaysburg borough
3-person families (385 | 26.0%) account for the highest median family income in Hollidaysburg borough with $147,250 per family, while 3-person families (385 | 26.0%) have the highest median income of $49,083 per family member.
| Income Bracket | # Families | Median Income |
| 2-Person Families | 783 (52.9%) | $73,359 |
| 3-Person Families | 385 (26.0%) | $147,250 |
| 4-Person Families | 220 (14.9%) | $0 |
| 5-Person Families | 83 (5.6%) | $133,750 |
| 6-Person Families | 8 (0.5%) | $0 |
| 7+ Person Families | 0 (0.0%) | $0 |
| Total | 1,479 (100.0%) | $83,906 |
Family Income by Number of Earners in Hollidaysburg borough
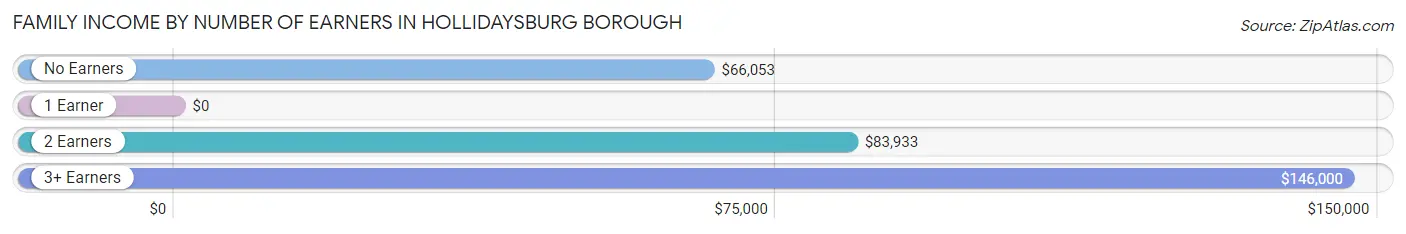
| Number of Earners | # Families | Median Income |
| No Earners | 336 (22.7%) | $66,053 |
| 1 Earner | 474 (32.1%) | $0 |
| 2 Earners | 579 (39.2%) | $83,933 |
| 3+ Earners | 90 (6.1%) | $146,000 |
| Total | 1,479 (100.0%) | $83,906 |
Household Income in Hollidaysburg borough
Household Income Brackets in Hollidaysburg borough
With 565 households falling in the category, the $50,000 to $74,999 income range is the most frequent in Hollidaysburg borough, accounting for 21.4% of all households. In contrast, only 58 households (2.2%) fall into the less than $10,000 income bracket, making it the least populous group.
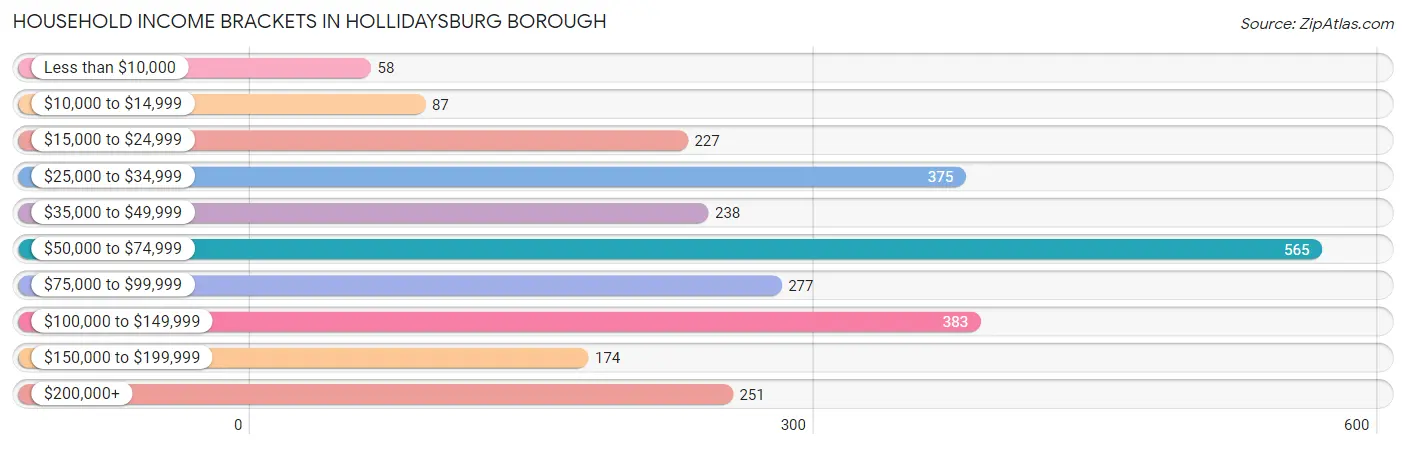
| Income Bracket | # Households | % Households |
| Less than $10,000 | 58 | 2.2% |
| $10,000 to $14,999 | 87 | 3.3% |
| $15,000 to $24,999 | 227 | 8.6% |
| $25,000 to $34,999 | 375 | 14.2% |
| $35,000 to $49,999 | 238 | 9.0% |
| $50,000 to $74,999 | 565 | 21.4% |
| $75,000 to $99,999 | 277 | 10.5% |
| $100,000 to $149,999 | 383 | 14.5% |
| $150,000 to $199,999 | 174 | 6.6% |
| $200,000+ | 251 | 9.5% |
Household Income by Householder Age in Hollidaysburg borough
The median household income in Hollidaysburg borough is $65,142, with the highest median household income of $99,783 found in the 45 to 64 years age bracket for the primary householder. A total of 1,056 households (40.0%) fall into this category. Meanwhile, the 15 to 24 years age bracket for the primary householder has the lowest median household income of $0, with 67 households (2.5%) in this group.
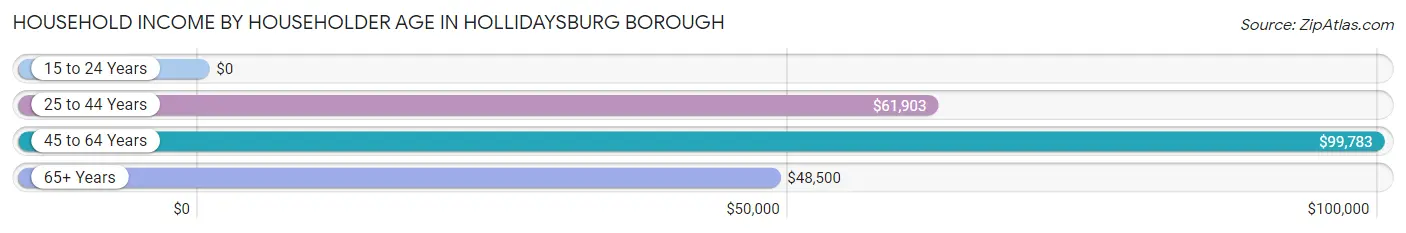
| Income Bracket | # Households | Median Income |
| 15 to 24 Years | 67 (2.5%) | $0 |
| 25 to 44 Years | 520 (19.7%) | $61,903 |
| 45 to 64 Years | 1,056 (40.0%) | $99,783 |
| 65+ Years | 996 (37.7%) | $48,500 |
| Total | 2,639 (100.0%) | $65,142 |
Poverty in Hollidaysburg borough
Income Below Poverty by Sex and Age in Hollidaysburg borough
With 7.1% poverty level for males and 6.6% for females among the residents of Hollidaysburg borough, under 5 year old males and 35 to 44 year old females are the most vulnerable to poverty, with 23 males (28.7%) and 74 females (18.1%) in their respective age groups living below the poverty level.
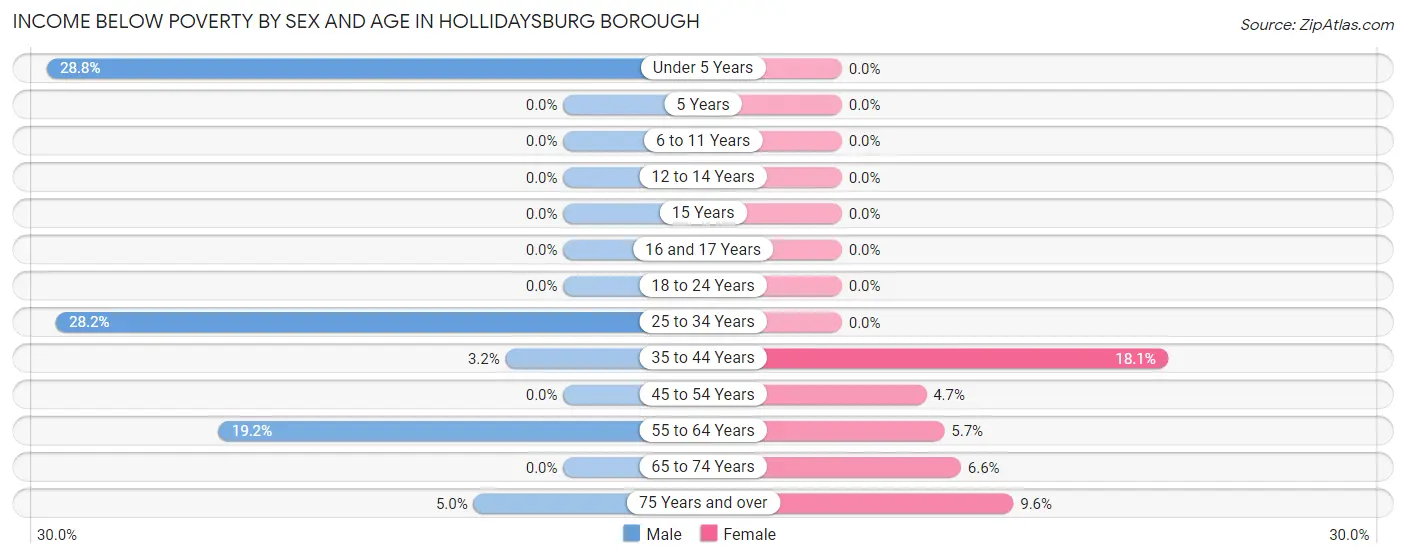
| Age Bracket | Male | Female |
| Under 5 Years | 23 (28.7%) | 0 (0.0%) |
| 5 Years | 0 (0.0%) | 0 (0.0%) |
| 6 to 11 Years | 0 (0.0%) | 0 (0.0%) |
| 12 to 14 Years | 0 (0.0%) | 0 (0.0%) |
| 15 Years | 0 (0.0%) | 0 (0.0%) |
| 16 and 17 Years | 0 (0.0%) | 0 (0.0%) |
| 18 to 24 Years | 0 (0.0%) | 0 (0.0%) |
| 25 to 34 Years | 74 (28.2%) | 0 (0.0%) |
| 35 to 44 Years | 12 (3.2%) | 74 (18.1%) |
| 45 to 54 Years | 0 (0.0%) | 26 (4.7%) |
| 55 to 64 Years | 56 (19.2%) | 23 (5.7%) |
| 65 to 74 Years | 0 (0.0%) | 26 (6.6%) |
| 75 Years and over | 14 (5.0%) | 36 (9.6%) |
| Total | 179 (7.1%) | 185 (6.6%) |
Income Above Poverty by Sex and Age in Hollidaysburg borough
According to the poverty statistics in Hollidaysburg borough, males aged 5 years and females aged under 5 years are the age groups that are most secure financially, with 100.0% of males and 100.0% of females in these age groups living above the poverty line.
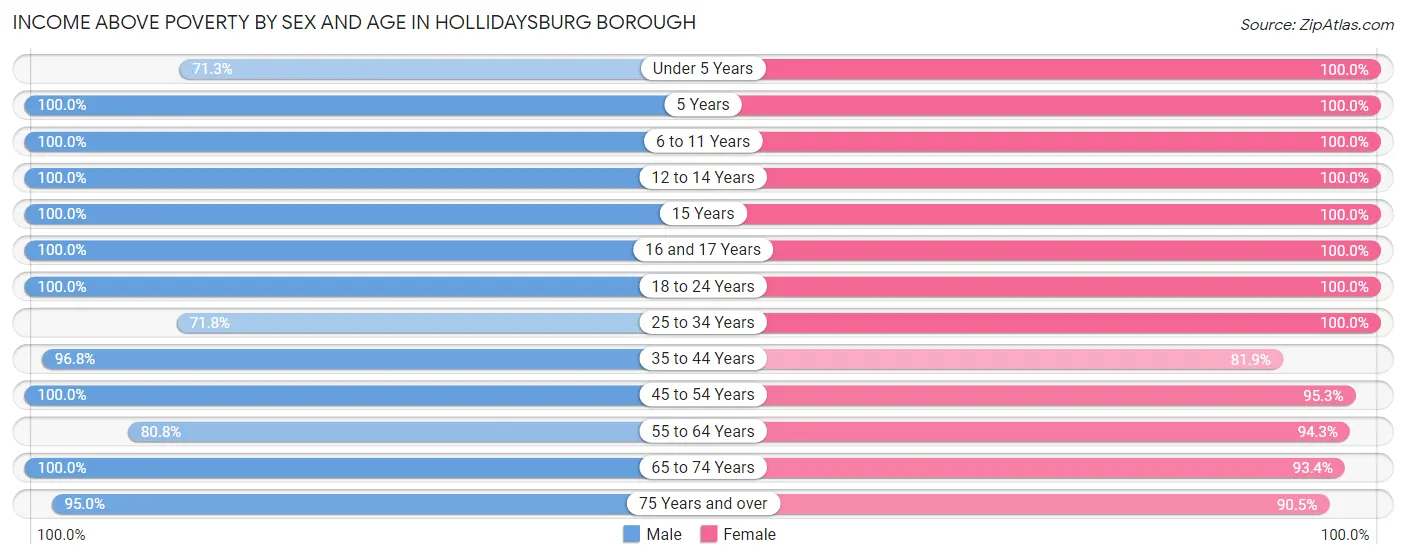
| Age Bracket | Male | Female |
| Under 5 Years | 57 (71.3%) | 25 (100.0%) |
| 5 Years | 12 (100.0%) | 35 (100.0%) |
| 6 to 11 Years | 131 (100.0%) | 178 (100.0%) |
| 12 to 14 Years | 156 (100.0%) | 101 (100.0%) |
| 15 Years | 60 (100.0%) | 38 (100.0%) |
| 16 and 17 Years | 87 (100.0%) | 74 (100.0%) |
| 18 to 24 Years | 138 (100.0%) | 56 (100.0%) |
| 25 to 34 Years | 188 (71.8%) | 177 (100.0%) |
| 35 to 44 Years | 361 (96.8%) | 334 (81.9%) |
| 45 to 54 Years | 392 (100.0%) | 527 (95.3%) |
| 55 to 64 Years | 236 (80.8%) | 380 (94.3%) |
| 65 to 74 Years | 270 (100.0%) | 366 (93.4%) |
| 75 Years and over | 266 (95.0%) | 341 (90.4%) |
| Total | 2,354 (92.9%) | 2,632 (93.4%) |
Income Below Poverty Among Married-Couple Families in Hollidaysburg borough
The poverty statistics for married-couple families in Hollidaysburg borough show that 2.3% or 26 of the total 1,142 families live below the poverty line. Families with 1 or 2 children have the highest poverty rate of 2.9%, comprising of 12 families. On the other hand, families with 3 or 4 children have the lowest poverty rate of 0.0%, which includes 0 families.
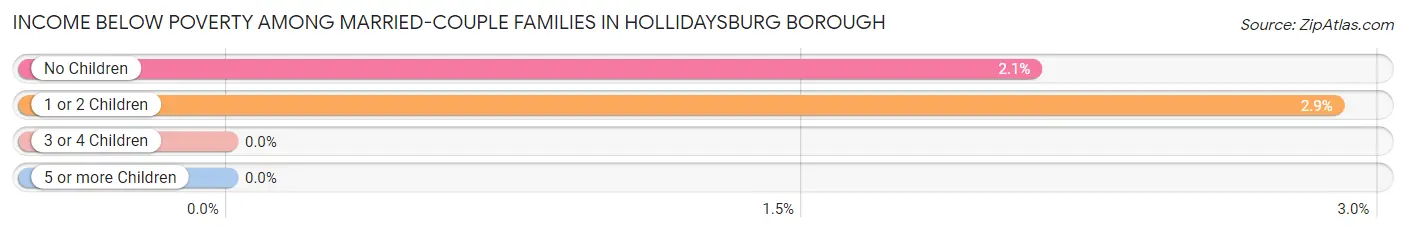
| Children | Above Poverty | Below Poverty |
| No Children | 652 (97.9%) | 14 (2.1%) |
| 1 or 2 Children | 403 (97.1%) | 12 (2.9%) |
| 3 or 4 Children | 61 (100.0%) | 0 (0.0%) |
| 5 or more Children | 0 (0.0%) | 0 (0.0%) |
| Total | 1,116 (97.7%) | 26 (2.3%) |
Income Below Poverty Among Single-Parent Households in Hollidaysburg borough
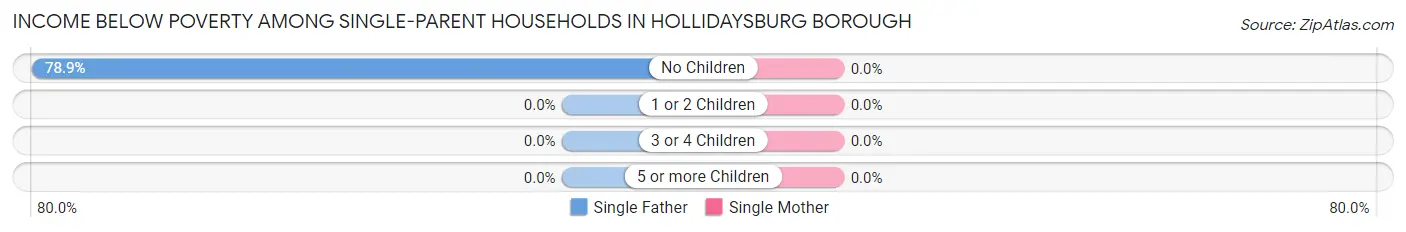
| Children | Single Father | Single Mother |
| No Children | 56 (78.9%) | 0 (0.0%) |
| 1 or 2 Children | 0 (0.0%) | 0 (0.0%) |
| 3 or 4 Children | 0 (0.0%) | 0 (0.0%) |
| 5 or more Children | 0 (0.0%) | 0 (0.0%) |
| Total | 56 (62.2%) | 0 (0.0%) |
Income Below Poverty Among Married-Couple vs Single-Parent Households in Hollidaysburg borough
The poverty data for Hollidaysburg borough shows that 26 of the married-couple family households (2.3%) and 56 of the single-parent households (16.6%) are living below the poverty level. Within the married-couple family households, those with 1 or 2 children have the highest poverty rate, with 12 households (2.9%) falling below the poverty line. Among the single-parent households, those with no children have the highest poverty rate, with 56 household (32.4%) living below poverty.
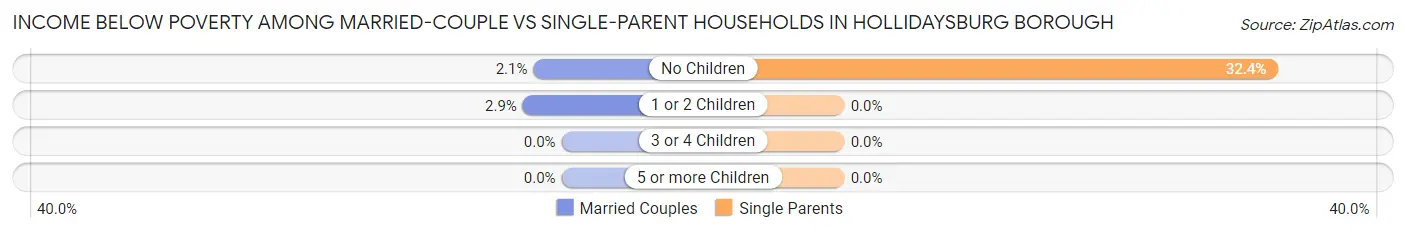
| Children | Married-Couple Families | Single-Parent Households |
| No Children | 14 (2.1%) | 56 (32.4%) |
| 1 or 2 Children | 12 (2.9%) | 0 (0.0%) |
| 3 or 4 Children | 0 (0.0%) | 0 (0.0%) |
| 5 or more Children | 0 (0.0%) | 0 (0.0%) |
| Total | 26 (2.3%) | 56 (16.6%) |
Employment Characteristics in Hollidaysburg borough
Employment by Class of Employer in Hollidaysburg borough
Among the 2,573 employed individuals in Hollidaysburg borough, private company employees (1,609 | 62.5%), not-for-profit organizations (388 | 15.1%), and local government employees (209 | 8.1%) make up the most common classes of employment.
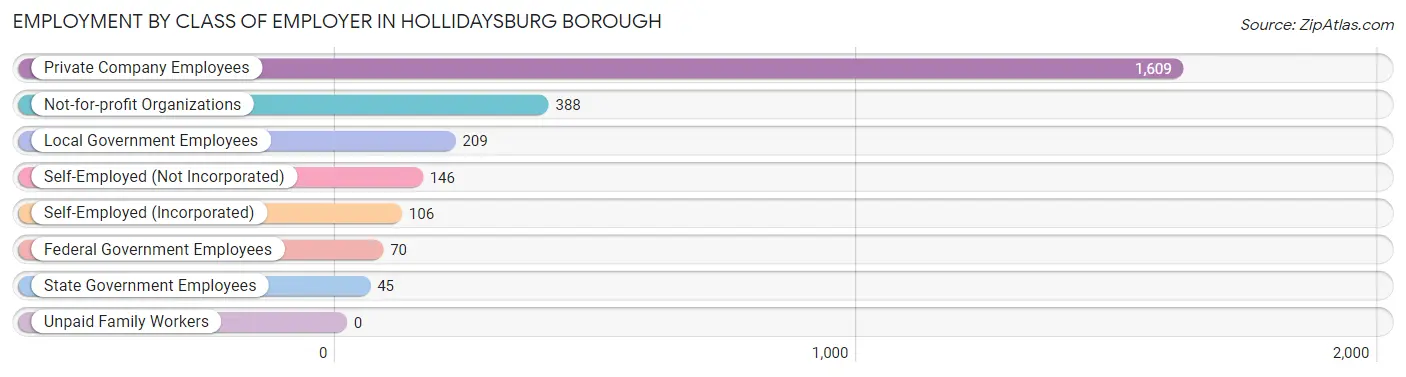
| Employer Class | # Employees | % Employees |
| Private Company Employees | 1,609 | 62.5% |
| Self-Employed (Incorporated) | 106 | 4.1% |
| Self-Employed (Not Incorporated) | 146 | 5.7% |
| Not-for-profit Organizations | 388 | 15.1% |
| Local Government Employees | 209 | 8.1% |
| State Government Employees | 45 | 1.8% |
| Federal Government Employees | 70 | 2.7% |
| Unpaid Family Workers | 0 | 0.0% |
| Total | 2,573 | 100.0% |
Employment Status by Age in Hollidaysburg borough
According to the labor force statistics for Hollidaysburg borough, out of the total population over 16 years of age (4,814), 55.6% or 2,677 individuals are in the labor force, with 2.7% or 72 of them unemployed. The age group with the highest labor force participation rate is 25 to 29 years, with 88.3% or 241 individuals in the labor force. Within the labor force, the 16 to 19 years age range has the highest percentage of unemployed individuals, with 17.3% or 18 of them being unemployed.
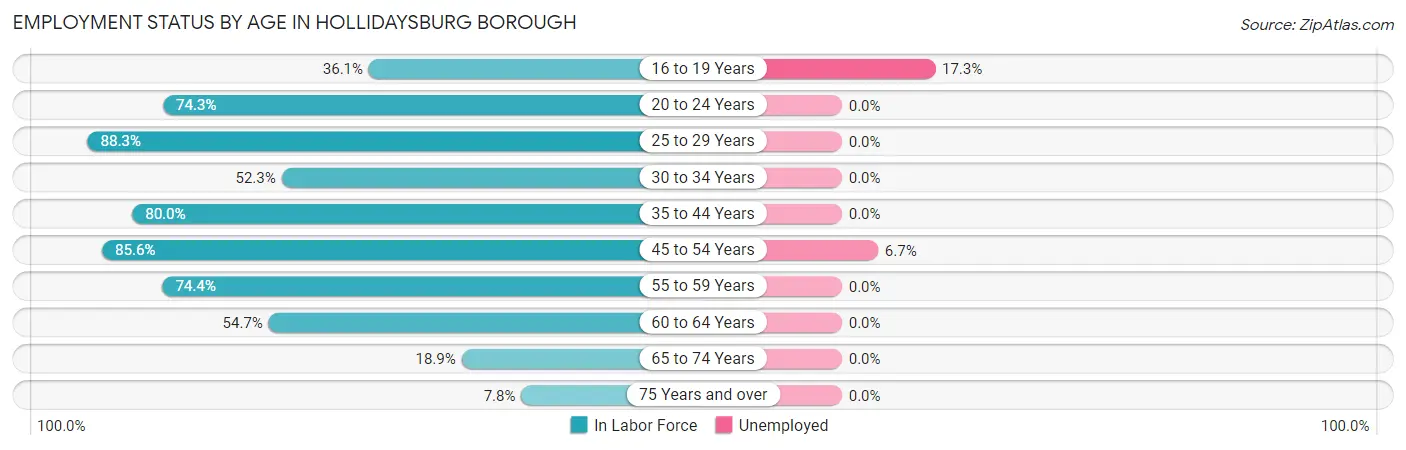
| Age Bracket | In Labor Force | Unemployed |
| 16 to 19 Years | 104 (36.1%) | 18 (17.3%) |
| 20 to 24 Years | 75 (74.3%) | 0 (0.0%) |
| 25 to 29 Years | 241 (88.3%) | 0 (0.0%) |
| 30 to 34 Years | 116 (52.3%) | 0 (0.0%) |
| 35 to 44 Years | 670 (80.0%) | 0 (0.0%) |
| 45 to 54 Years | 816 (85.6%) | 55 (6.7%) |
| 55 to 59 Years | 334 (74.4%) | 0 (0.0%) |
| 60 to 64 Years | 135 (54.7%) | 0 (0.0%) |
| 65 to 74 Years | 127 (18.9%) | 0 (0.0%) |
| 75 Years and over | 60 (7.8%) | 0 (0.0%) |
| Total | 2,677 (55.6%) | 72 (2.7%) |
Employment Status by Educational Attainment in Hollidaysburg borough
According to labor force statistics for Hollidaysburg borough, 77.5% of individuals (2,311) out of the total population between 25 and 64 years of age (2,982) are in the labor force, with 2.4% or 55 of them being unemployed. The group with the highest labor force participation rate are those with the educational attainment of bachelor's degree or higher, with 90.2% or 1,265 individuals in the labor force. Within the labor force, individuals with college / associate degree education have the highest percentage of unemployment, with 7.7% or 44 of them being unemployed.
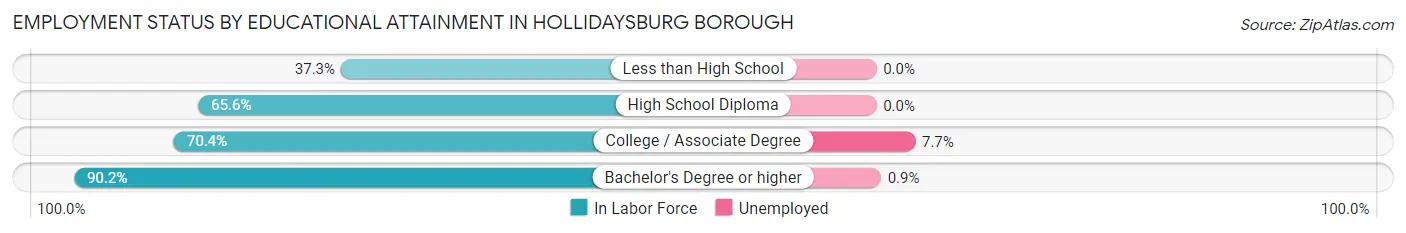
| Educational Attainment | In Labor Force | Unemployed |
| Less than High School | 38 (37.3%) | 0 (0.0%) |
| High School Diploma | 437 (65.6%) | 0 (0.0%) |
| College / Associate Degree | 572 (70.4%) | 63 (7.7%) |
| Bachelor's Degree or higher | 1,265 (90.2%) | 13 (0.9%) |
| Total | 2,311 (77.5%) | 72 (2.4%) |
Employment Occupations by Sex in Hollidaysburg borough
Management, Business, Science and Arts Occupations
The most common Management, Business, Science and Arts occupations in Hollidaysburg borough are Community & Social Service (528 | 20.3%), Computers, Engineering & Science (232 | 8.9%), Education, Arts & Media (196 | 7.5%), Management (180 | 6.9%), and Education Instruction & Library (176 | 6.8%).
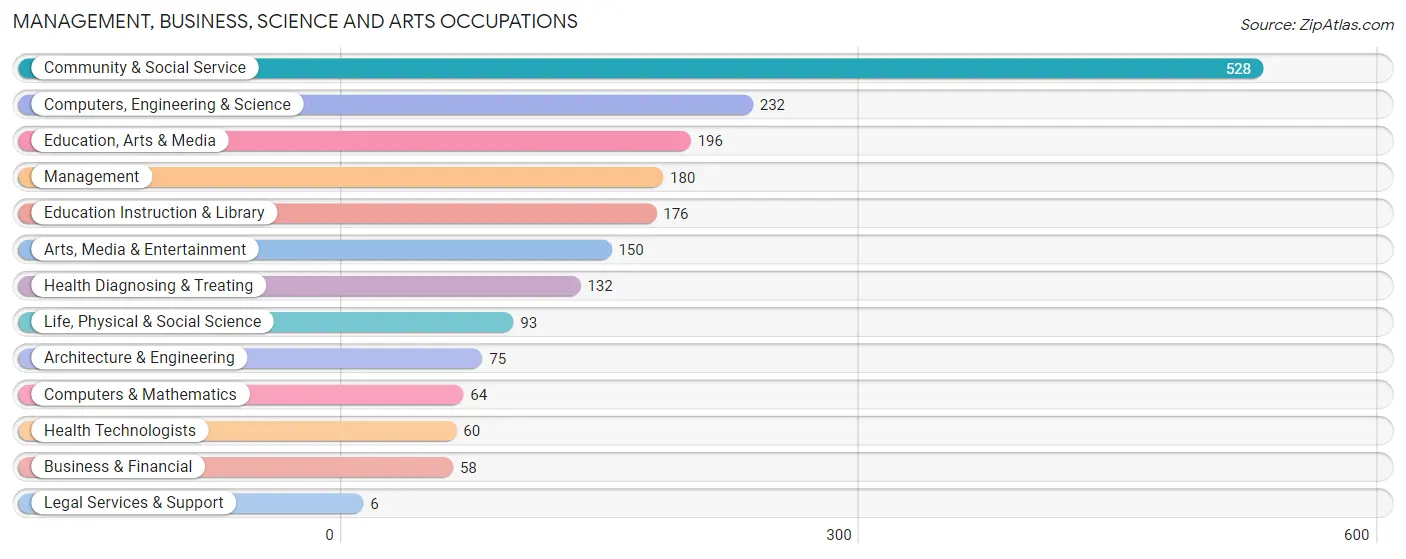
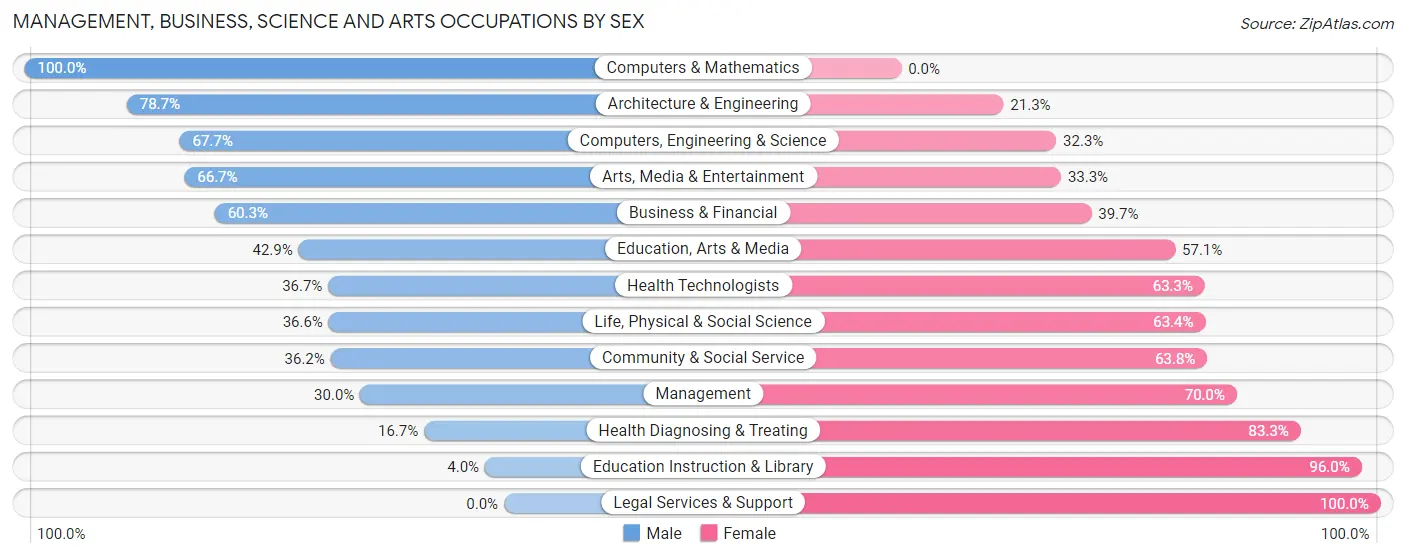
Management, Business, Science and Arts Occupations by Sex
Within the Management, Business, Science and Arts occupations in Hollidaysburg borough, the most male-oriented occupations are Computers & Mathematics (100.0%), Architecture & Engineering (78.7%), and Computers, Engineering & Science (67.7%), while the most female-oriented occupations are Legal Services & Support (100.0%), Education Instruction & Library (96.0%), and Health Diagnosing & Treating (83.3%).
| Occupation | Male | Female |
| Management | 54 (30.0%) | 126 (70.0%) |
| Business & Financial | 35 (60.3%) | 23 (39.7%) |
| Computers, Engineering & Science | 157 (67.7%) | 75 (32.3%) |
| Computers & Mathematics | 64 (100.0%) | 0 (0.0%) |
| Architecture & Engineering | 59 (78.7%) | 16 (21.3%) |
| Life, Physical & Social Science | 34 (36.6%) | 59 (63.4%) |
| Community & Social Service | 191 (36.2%) | 337 (63.8%) |
| Education, Arts & Media | 84 (42.9%) | 112 (57.1%) |
| Legal Services & Support | 0 (0.0%) | 6 (100.0%) |
| Education Instruction & Library | 7 (4.0%) | 169 (96.0%) |
| Arts, Media & Entertainment | 100 (66.7%) | 50 (33.3%) |
| Health Diagnosing & Treating | 22 (16.7%) | 110 (83.3%) |
| Health Technologists | 22 (36.7%) | 38 (63.3%) |
| Total (Category) | 459 (40.6%) | 671 (59.4%) |
| Total (Overall) | 1,362 (52.3%) | 1,243 (47.7%) |
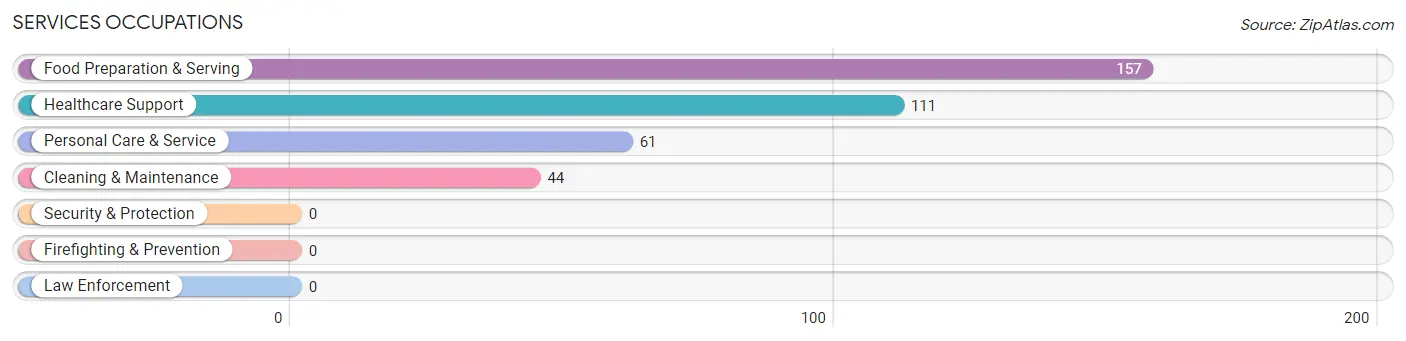
Services Occupations
The most common Services occupations in Hollidaysburg borough are Food Preparation & Serving (157 | 6.0%), Healthcare Support (111 | 4.3%), Personal Care & Service (61 | 2.3%), and Cleaning & Maintenance (44 | 1.7%).
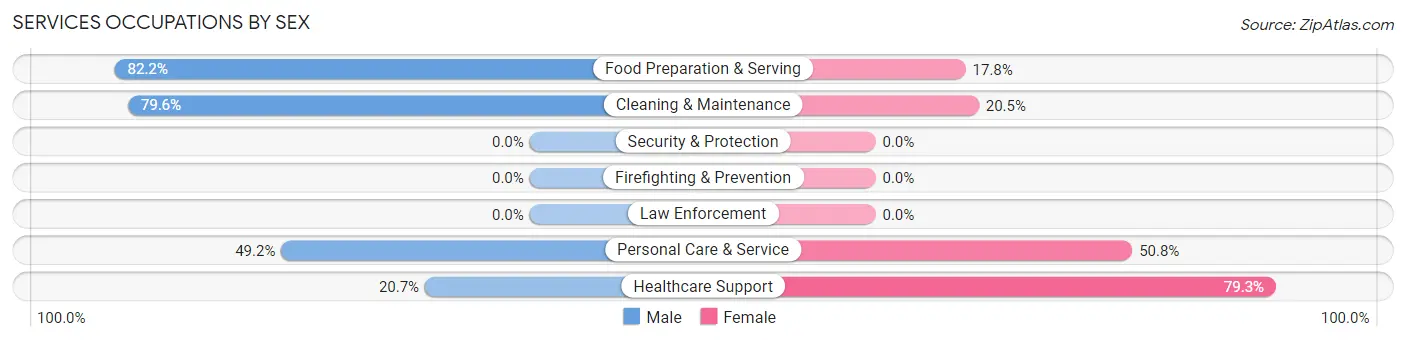
Services Occupations by Sex
Within the Services occupations in Hollidaysburg borough, the most male-oriented occupations are Food Preparation & Serving (82.2%), Cleaning & Maintenance (79.5%), and Personal Care & Service (49.2%), while the most female-oriented occupations are Healthcare Support (79.3%), Personal Care & Service (50.8%), and Cleaning & Maintenance (20.4%).
| Occupation | Male | Female |
| Healthcare Support | 23 (20.7%) | 88 (79.3%) |
| Security & Protection | 0 (0.0%) | 0 (0.0%) |
| Firefighting & Prevention | 0 (0.0%) | 0 (0.0%) |
| Law Enforcement | 0 (0.0%) | 0 (0.0%) |
| Food Preparation & Serving | 129 (82.2%) | 28 (17.8%) |
| Cleaning & Maintenance | 35 (79.5%) | 9 (20.4%) |
| Personal Care & Service | 30 (49.2%) | 31 (50.8%) |
| Total (Category) | 217 (58.2%) | 156 (41.8%) |
| Total (Overall) | 1,362 (52.3%) | 1,243 (47.7%) |
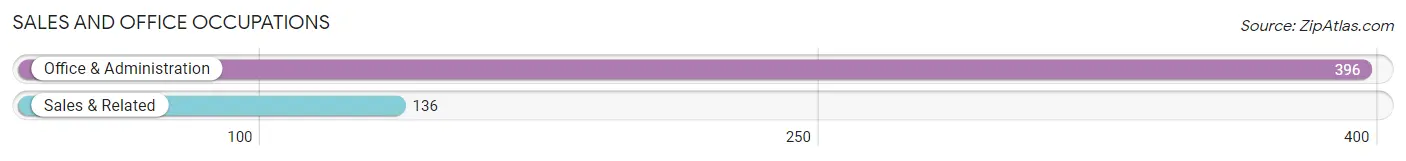
Sales and Office Occupations
The most common Sales and Office occupations in Hollidaysburg borough are Office & Administration (396 | 15.2%), and Sales & Related (136 | 5.2%).
Sales and Office Occupations by Sex
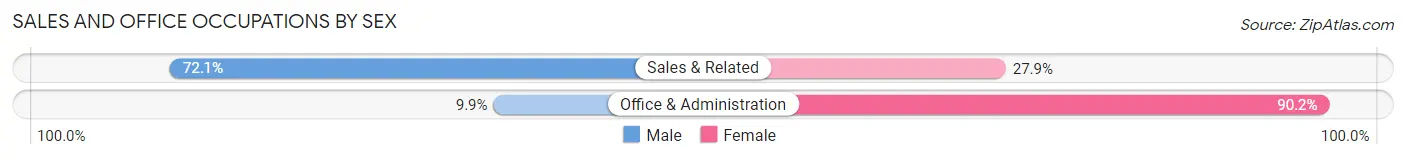
| Occupation | Male | Female |
| Sales & Related | 98 (72.1%) | 38 (27.9%) |
| Office & Administration | 39 (9.9%) | 357 (90.1%) |
| Total (Category) | 137 (25.8%) | 395 (74.3%) |
| Total (Overall) | 1,362 (52.3%) | 1,243 (47.7%) |
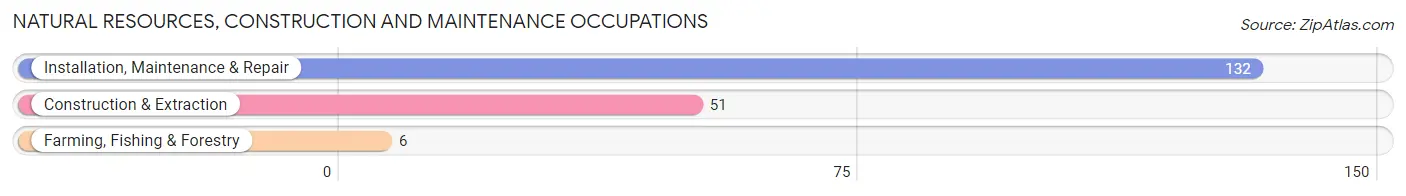
Natural Resources, Construction and Maintenance Occupations
The most common Natural Resources, Construction and Maintenance occupations in Hollidaysburg borough are Installation, Maintenance & Repair (132 | 5.1%), Construction & Extraction (51 | 2.0%), and Farming, Fishing & Forestry (6 | 0.2%).
Natural Resources, Construction and Maintenance Occupations by Sex
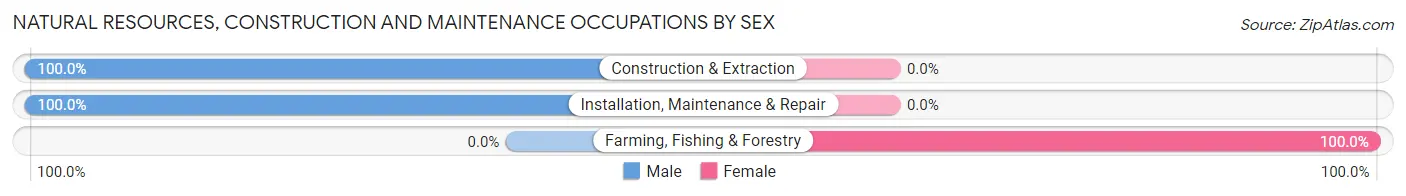
| Occupation | Male | Female |
| Farming, Fishing & Forestry | 0 (0.0%) | 6 (100.0%) |
| Construction & Extraction | 51 (100.0%) | 0 (0.0%) |
| Installation, Maintenance & Repair | 132 (100.0%) | 0 (0.0%) |
| Total (Category) | 183 (96.8%) | 6 (3.2%) |
| Total (Overall) | 1,362 (52.3%) | 1,243 (47.7%) |
Production, Transportation and Moving Occupations
The most common Production, Transportation and Moving occupations in Hollidaysburg borough are Production (195 | 7.5%), Material Moving (158 | 6.1%), and Transportation (28 | 1.1%).
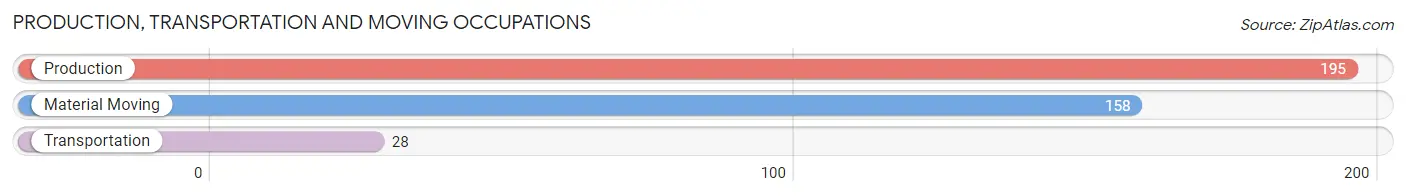
Production, Transportation and Moving Occupations by Sex
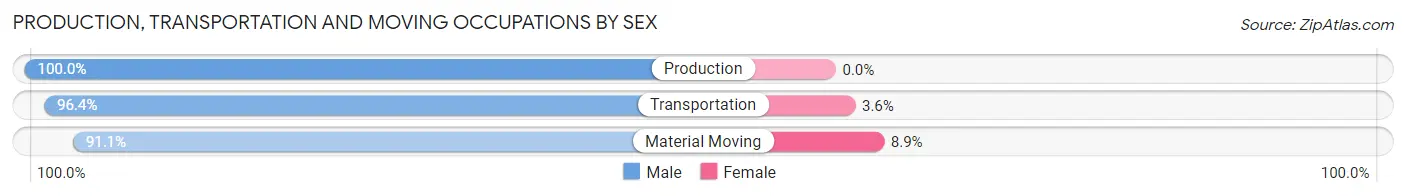
| Occupation | Male | Female |
| Production | 195 (100.0%) | 0 (0.0%) |
| Transportation | 27 (96.4%) | 1 (3.6%) |
| Material Moving | 144 (91.1%) | 14 (8.9%) |
| Total (Category) | 366 (96.1%) | 15 (3.9%) |
| Total (Overall) | 1,362 (52.3%) | 1,243 (47.7%) |
Employment Industries by Sex in Hollidaysburg borough
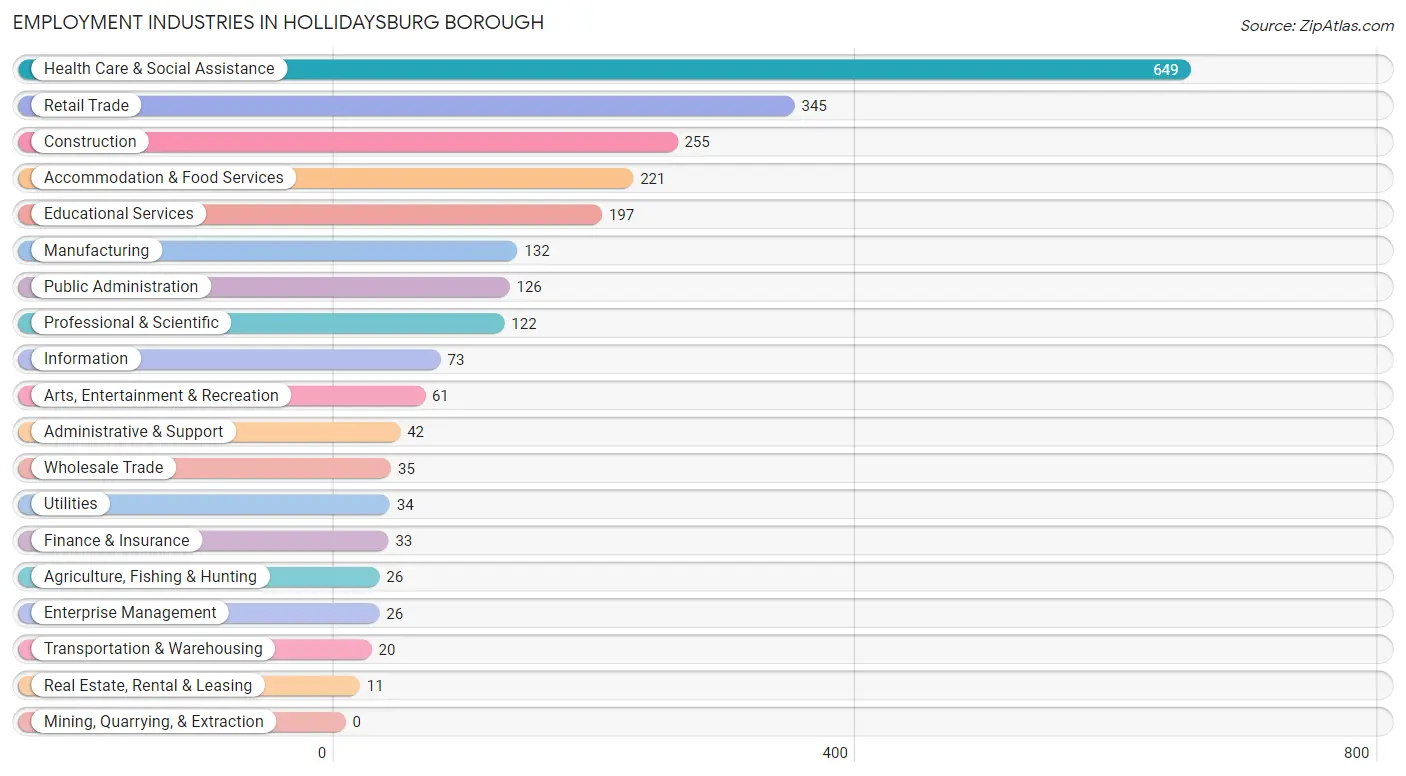
Employment Industries in Hollidaysburg borough
The major employment industries in Hollidaysburg borough include Health Care & Social Assistance (649 | 24.9%), Retail Trade (345 | 13.2%), Construction (255 | 9.8%), Accommodation & Food Services (221 | 8.5%), and Educational Services (197 | 7.6%).
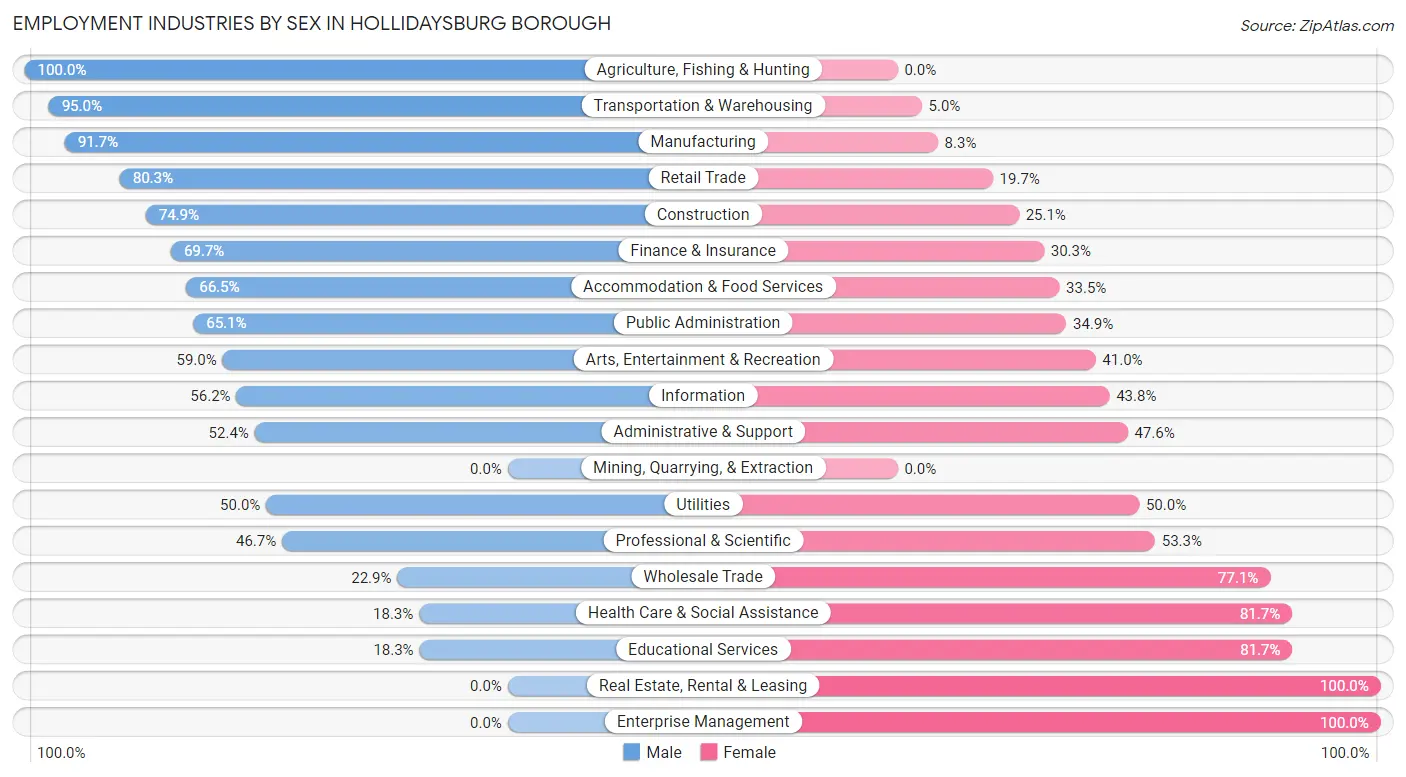
Employment Industries by Sex in Hollidaysburg borough
The Hollidaysburg borough industries that see more men than women are Agriculture, Fishing & Hunting (100.0%), Transportation & Warehousing (95.0%), and Manufacturing (91.7%), whereas the industries that tend to have a higher number of women are Real Estate, Rental & Leasing (100.0%), Enterprise Management (100.0%), and Educational Services (81.7%).
| Industry | Male | Female |
| Agriculture, Fishing & Hunting | 26 (100.0%) | 0 (0.0%) |
| Mining, Quarrying, & Extraction | 0 (0.0%) | 0 (0.0%) |
| Construction | 191 (74.9%) | 64 (25.1%) |
| Manufacturing | 121 (91.7%) | 11 (8.3%) |
| Wholesale Trade | 8 (22.9%) | 27 (77.1%) |
| Retail Trade | 277 (80.3%) | 68 (19.7%) |
| Transportation & Warehousing | 19 (95.0%) | 1 (5.0%) |
| Utilities | 17 (50.0%) | 17 (50.0%) |
| Information | 41 (56.2%) | 32 (43.8%) |
| Finance & Insurance | 23 (69.7%) | 10 (30.3%) |
| Real Estate, Rental & Leasing | 0 (0.0%) | 11 (100.0%) |
| Professional & Scientific | 57 (46.7%) | 65 (53.3%) |
| Enterprise Management | 0 (0.0%) | 26 (100.0%) |
| Administrative & Support | 22 (52.4%) | 20 (47.6%) |
| Educational Services | 36 (18.3%) | 161 (81.7%) |
| Health Care & Social Assistance | 119 (18.3%) | 530 (81.7%) |
| Arts, Entertainment & Recreation | 36 (59.0%) | 25 (41.0%) |
| Accommodation & Food Services | 147 (66.5%) | 74 (33.5%) |
| Public Administration | 82 (65.1%) | 44 (34.9%) |
| Total | 1,362 (52.3%) | 1,243 (47.7%) |
Education in Hollidaysburg borough
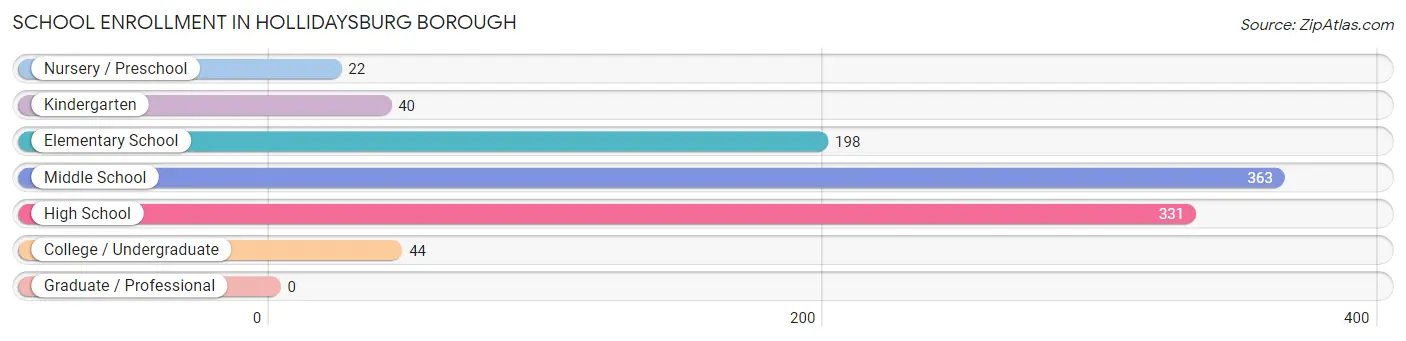
School Enrollment in Hollidaysburg borough
The most common levels of schooling among the 998 students in Hollidaysburg borough are middle school (363 | 36.4%), high school (331 | 33.2%), and elementary school (198 | 19.8%).
| School Level | # Students | % Students |
| Nursery / Preschool | 22 | 2.2% |
| Kindergarten | 40 | 4.0% |
| Elementary School | 198 | 19.8% |
| Middle School | 363 | 36.4% |
| High School | 331 | 33.2% |
| College / Undergraduate | 44 | 4.4% |
| Graduate / Professional | 0 | 0.0% |
| Total | 998 | 100.0% |
School Enrollment by Age by Funding Source in Hollidaysburg borough
Out of a total of 998 students who are enrolled in schools in Hollidaysburg borough, 85 (8.5%) attend a private institution, while the remaining 913 (91.5%) are enrolled in public schools. The age group of 3 to 4 year olds has the highest likelihood of being enrolled in private schools, with 22 (100.0% in the age bracket) enrolled. Conversely, the age group of 15 to 17 year olds has the lowest likelihood of being enrolled in a private school, with 259 (100.0% in the age bracket) attending a public institution.
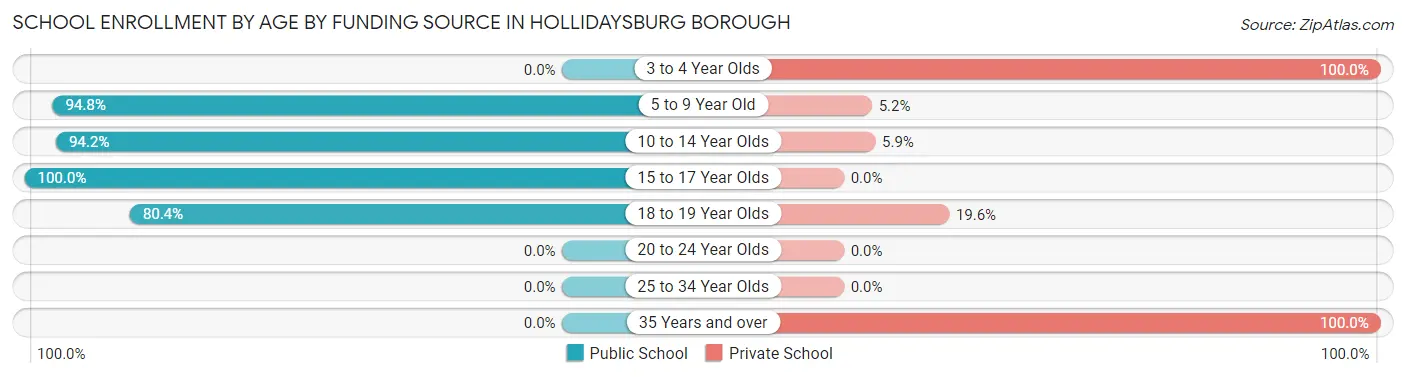
| Age Bracket | Public School | Private School |
| 3 to 4 Year Olds | 0 (0.0%) | 22 (100.0%) |
| 5 to 9 Year Old | 218 (94.8%) | 12 (5.2%) |
| 10 to 14 Year Olds | 354 (94.2%) | 22 (5.9%) |
| 15 to 17 Year Olds | 259 (100.0%) | 0 (0.0%) |
| 18 to 19 Year Olds | 82 (80.4%) | 20 (19.6%) |
| 20 to 24 Year Olds | 0 (0.0%) | 0 (0.0%) |
| 25 to 34 Year Olds | 0 (0.0%) | 0 (0.0%) |
| 35 Years and over | 0 (0.0%) | 9 (100.0%) |
| Total | 913 (91.5%) | 85 (8.5%) |
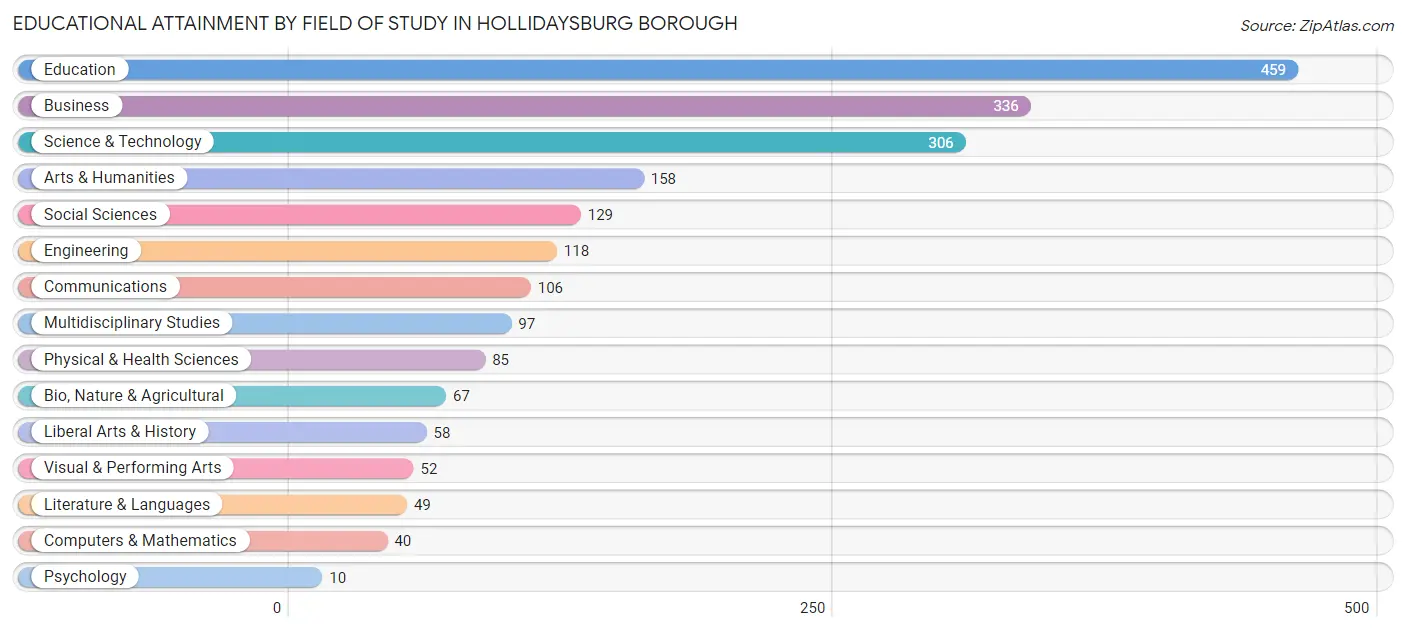
Educational Attainment by Field of Study in Hollidaysburg borough
Education (459 | 22.2%), business (336 | 16.2%), science & technology (306 | 14.8%), arts & humanities (158 | 7.6%), and social sciences (129 | 6.2%) are the most common fields of study among 2,070 individuals in Hollidaysburg borough who have obtained a bachelor's degree or higher.
| Field of Study | # Graduates | % Graduates |
| Computers & Mathematics | 40 | 1.9% |
| Bio, Nature & Agricultural | 67 | 3.2% |
| Physical & Health Sciences | 85 | 4.1% |
| Psychology | 10 | 0.5% |
| Social Sciences | 129 | 6.2% |
| Engineering | 118 | 5.7% |
| Multidisciplinary Studies | 97 | 4.7% |
| Science & Technology | 306 | 14.8% |
| Business | 336 | 16.2% |
| Education | 459 | 22.2% |
| Literature & Languages | 49 | 2.4% |
| Liberal Arts & History | 58 | 2.8% |
| Visual & Performing Arts | 52 | 2.5% |
| Communications | 106 | 5.1% |
| Arts & Humanities | 158 | 7.6% |
| Total | 2,070 | 100.0% |
Transportation & Commute in Hollidaysburg borough
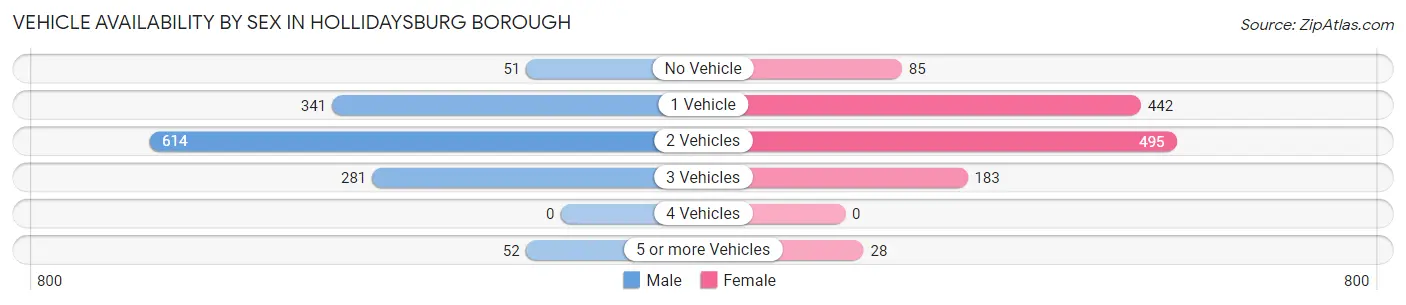
Vehicle Availability by Sex in Hollidaysburg borough
The most prevalent vehicle ownership categories in Hollidaysburg borough are males with 2 vehicles (614, accounting for 45.9%) and females with 2 vehicles (495, making up 49.8%).
| Vehicles Available | Male | Female |
| No Vehicle | 51 (3.8%) | 85 (6.9%) |
| 1 Vehicle | 341 (25.5%) | 442 (35.8%) |
| 2 Vehicles | 614 (45.9%) | 495 (40.2%) |
| 3 Vehicles | 281 (21.0%) | 183 (14.8%) |
| 4 Vehicles | 0 (0.0%) | 0 (0.0%) |
| 5 or more Vehicles | 52 (3.9%) | 28 (2.3%) |
| Total | 1,339 (100.0%) | 1,233 (100.0%) |
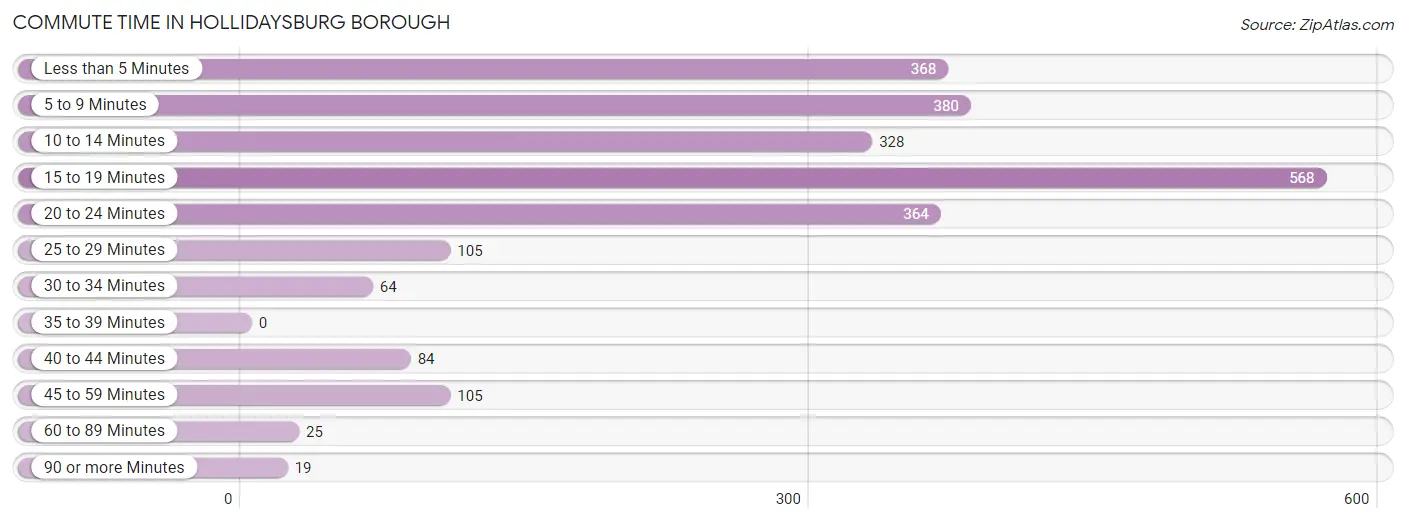
Commute Time in Hollidaysburg borough
The most frequently occuring commute durations in Hollidaysburg borough are 15 to 19 minutes (568 commuters, 23.6%), 5 to 9 minutes (380 commuters, 15.8%), and less than 5 minutes (368 commuters, 15.3%).
| Commute Time | # Commuters | % Commuters |
| Less than 5 Minutes | 368 | 15.3% |
| 5 to 9 Minutes | 380 | 15.8% |
| 10 to 14 Minutes | 328 | 13.6% |
| 15 to 19 Minutes | 568 | 23.6% |
| 20 to 24 Minutes | 364 | 15.1% |
| 25 to 29 Minutes | 105 | 4.4% |
| 30 to 34 Minutes | 64 | 2.7% |
| 35 to 39 Minutes | 0 | 0.0% |
| 40 to 44 Minutes | 84 | 3.5% |
| 45 to 59 Minutes | 105 | 4.4% |
| 60 to 89 Minutes | 25 | 1.0% |
| 90 or more Minutes | 19 | 0.8% |
Commute Time by Sex in Hollidaysburg borough
The most common commute times in Hollidaysburg borough are 15 to 19 minutes (431 commuters, 34.4%) for males and 5 to 9 minutes (294 commuters, 25.4%) for females.
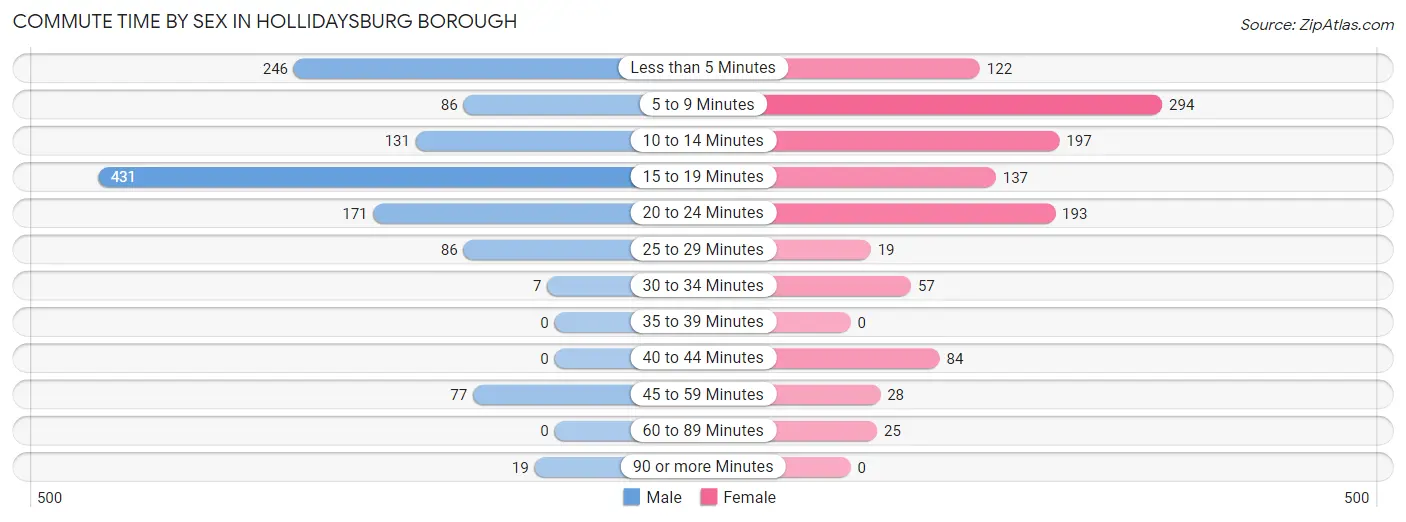
| Commute Time | Male | Female |
| Less than 5 Minutes | 246 (19.6%) | 122 (10.5%) |
| 5 to 9 Minutes | 86 (6.9%) | 294 (25.4%) |
| 10 to 14 Minutes | 131 (10.4%) | 197 (17.0%) |
| 15 to 19 Minutes | 431 (34.4%) | 137 (11.8%) |
| 20 to 24 Minutes | 171 (13.6%) | 193 (16.7%) |
| 25 to 29 Minutes | 86 (6.9%) | 19 (1.6%) |
| 30 to 34 Minutes | 7 (0.6%) | 57 (4.9%) |
| 35 to 39 Minutes | 0 (0.0%) | 0 (0.0%) |
| 40 to 44 Minutes | 0 (0.0%) | 84 (7.3%) |
| 45 to 59 Minutes | 77 (6.1%) | 28 (2.4%) |
| 60 to 89 Minutes | 0 (0.0%) | 25 (2.2%) |
| 90 or more Minutes | 19 (1.5%) | 0 (0.0%) |
Time of Departure to Work by Sex in Hollidaysburg borough
The most frequent times of departure to work in Hollidaysburg borough are 6:00 AM to 6:29 AM (283, 22.6%) for males and 7:30 AM to 7:59 AM (332, 28.7%) for females.
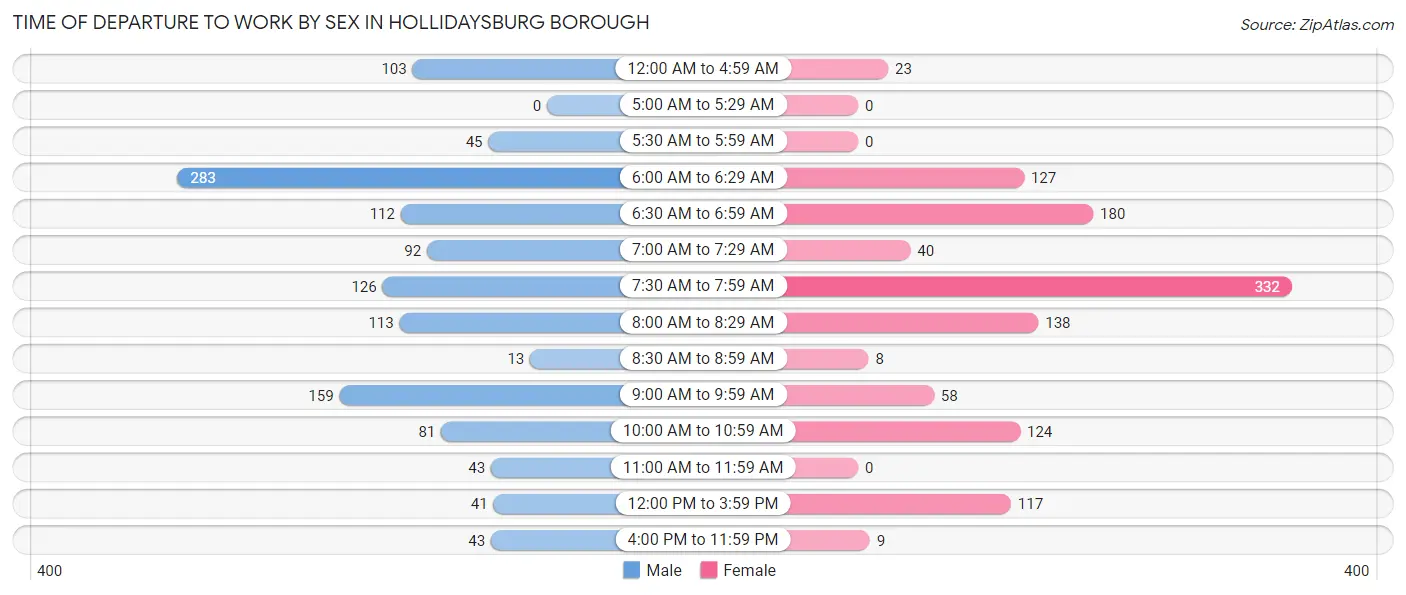
| Time of Departure | Male | Female |
| 12:00 AM to 4:59 AM | 103 (8.2%) | 23 (2.0%) |
| 5:00 AM to 5:29 AM | 0 (0.0%) | 0 (0.0%) |
| 5:30 AM to 5:59 AM | 45 (3.6%) | 0 (0.0%) |
| 6:00 AM to 6:29 AM | 283 (22.6%) | 127 (11.0%) |
| 6:30 AM to 6:59 AM | 112 (8.9%) | 180 (15.6%) |
| 7:00 AM to 7:29 AM | 92 (7.3%) | 40 (3.5%) |
| 7:30 AM to 7:59 AM | 126 (10.1%) | 332 (28.7%) |
| 8:00 AM to 8:29 AM | 113 (9.0%) | 138 (11.9%) |
| 8:30 AM to 8:59 AM | 13 (1.0%) | 8 (0.7%) |
| 9:00 AM to 9:59 AM | 159 (12.7%) | 58 (5.0%) |
| 10:00 AM to 10:59 AM | 81 (6.5%) | 124 (10.7%) |
| 11:00 AM to 11:59 AM | 43 (3.4%) | 0 (0.0%) |
| 12:00 PM to 3:59 PM | 41 (3.3%) | 117 (10.1%) |
| 4:00 PM to 11:59 PM | 43 (3.4%) | 9 (0.8%) |
| Total | 1,254 (100.0%) | 1,156 (100.0%) |
Housing Occupancy in Hollidaysburg borough
Occupancy by Ownership in Hollidaysburg borough
Of the total 2,639 dwellings in Hollidaysburg borough, owner-occupied units account for 1,799 (68.2%), while renter-occupied units make up 840 (31.8%).
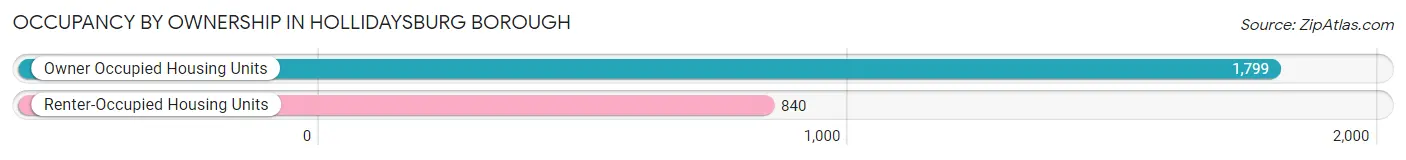
| Occupancy | # Housing Units | % Housing Units |
| Owner Occupied Housing Units | 1,799 | 68.2% |
| Renter-Occupied Housing Units | 840 | 31.8% |
| Total Occupied Housing Units | 2,639 | 100.0% |
Occupancy by Household Size in Hollidaysburg borough
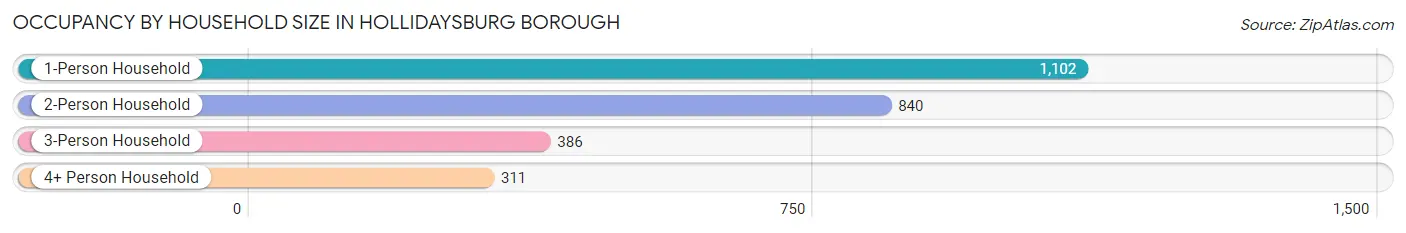
| Household Size | # Housing Units | % Housing Units |
| 1-Person Household | 1,102 | 41.8% |
| 2-Person Household | 840 | 31.8% |
| 3-Person Household | 386 | 14.6% |
| 4+ Person Household | 311 | 11.8% |
| Total Housing Units | 2,639 | 100.0% |
Occupancy by Ownership by Household Size in Hollidaysburg borough
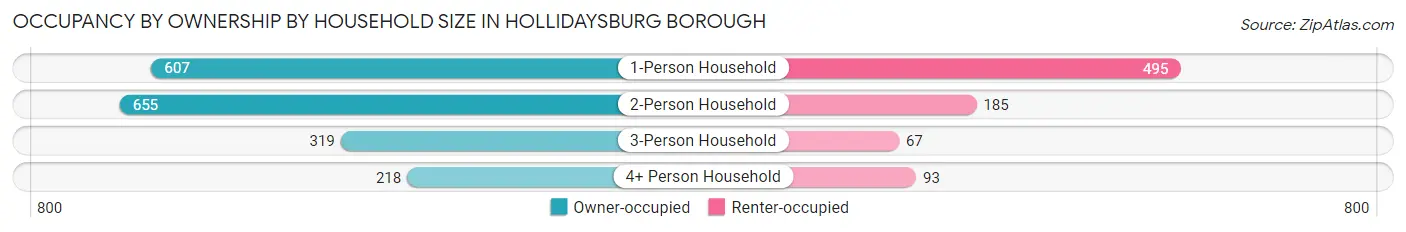
| Household Size | Owner-occupied | Renter-occupied |
| 1-Person Household | 607 (55.1%) | 495 (44.9%) |
| 2-Person Household | 655 (78.0%) | 185 (22.0%) |
| 3-Person Household | 319 (82.6%) | 67 (17.4%) |
| 4+ Person Household | 218 (70.1%) | 93 (29.9%) |
| Total Housing Units | 1,799 (68.2%) | 840 (31.8%) |
Occupancy by Educational Attainment in Hollidaysburg borough
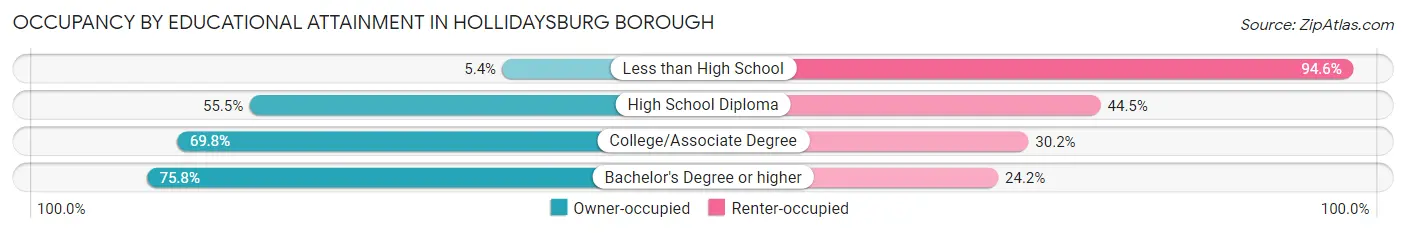
| Household Size | Owner-occupied | Renter-occupied |
| Less than High School | 6 (5.4%) | 106 (94.6%) |
| High School Diploma | 237 (55.5%) | 190 (44.5%) |
| College/Associate Degree | 421 (69.8%) | 182 (30.2%) |
| Bachelor's Degree or higher | 1,135 (75.8%) | 362 (24.2%) |
Occupancy by Age of Householder in Hollidaysburg borough
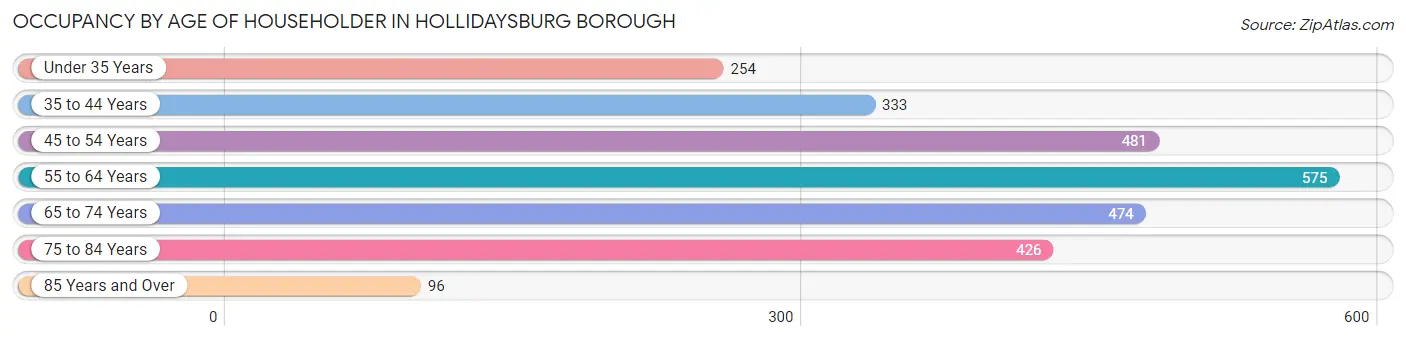
| Age Bracket | # Households | % Households |
| Under 35 Years | 254 | 9.6% |
| 35 to 44 Years | 333 | 12.6% |
| 45 to 54 Years | 481 | 18.2% |
| 55 to 64 Years | 575 | 21.8% |
| 65 to 74 Years | 474 | 18.0% |
| 75 to 84 Years | 426 | 16.1% |
| 85 Years and Over | 96 | 3.6% |
| Total | 2,639 | 100.0% |
Housing Finances in Hollidaysburg borough
Median Income by Occupancy in Hollidaysburg borough
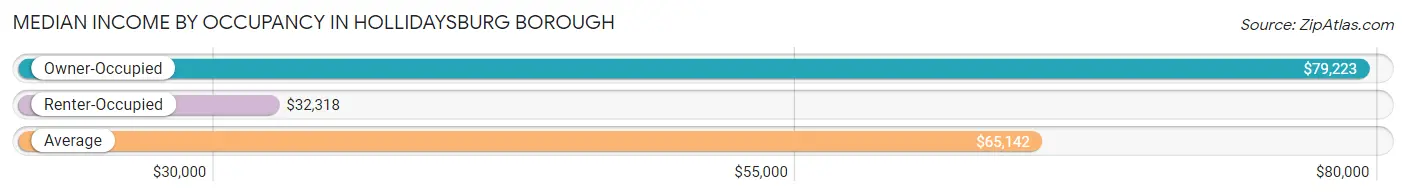
| Occupancy Type | # Households | Median Income |
| Owner-Occupied | 1,799 (68.2%) | $79,223 |
| Renter-Occupied | 840 (31.8%) | $32,318 |
| Average | 2,639 (100.0%) | $65,142 |
Occupancy by Householder Income Bracket in Hollidaysburg borough
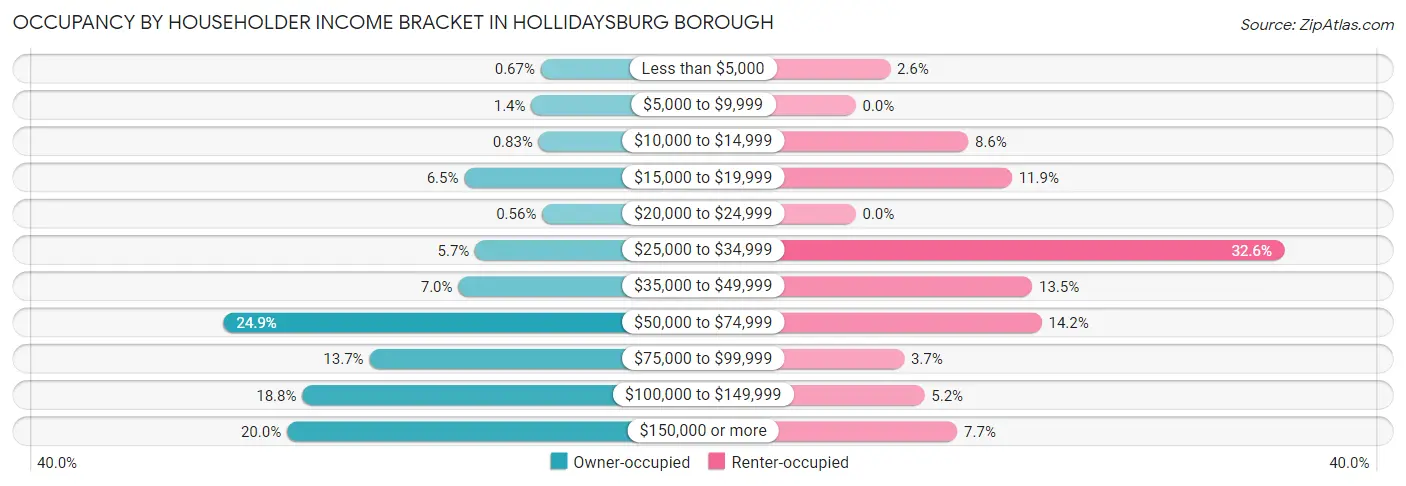
| Income Bracket | Owner-occupied | Renter-occupied |
| Less than $5,000 | 12 (0.7%) | 22 (2.6%) |
| $5,000 to $9,999 | 25 (1.4%) | 0 (0.0%) |
| $10,000 to $14,999 | 15 (0.8%) | 72 (8.6%) |
| $15,000 to $19,999 | 117 (6.5%) | 100 (11.9%) |
| $20,000 to $24,999 | 10 (0.6%) | 0 (0.0%) |
| $25,000 to $34,999 | 102 (5.7%) | 274 (32.6%) |
| $35,000 to $49,999 | 125 (7.0%) | 113 (13.5%) |
| $50,000 to $74,999 | 447 (24.8%) | 119 (14.2%) |
| $75,000 to $99,999 | 247 (13.7%) | 31 (3.7%) |
| $100,000 to $149,999 | 339 (18.8%) | 44 (5.2%) |
| $150,000 or more | 360 (20.0%) | 65 (7.7%) |
| Total | 1,799 (100.0%) | 840 (100.0%) |
Monthly Housing Cost Tiers in Hollidaysburg borough
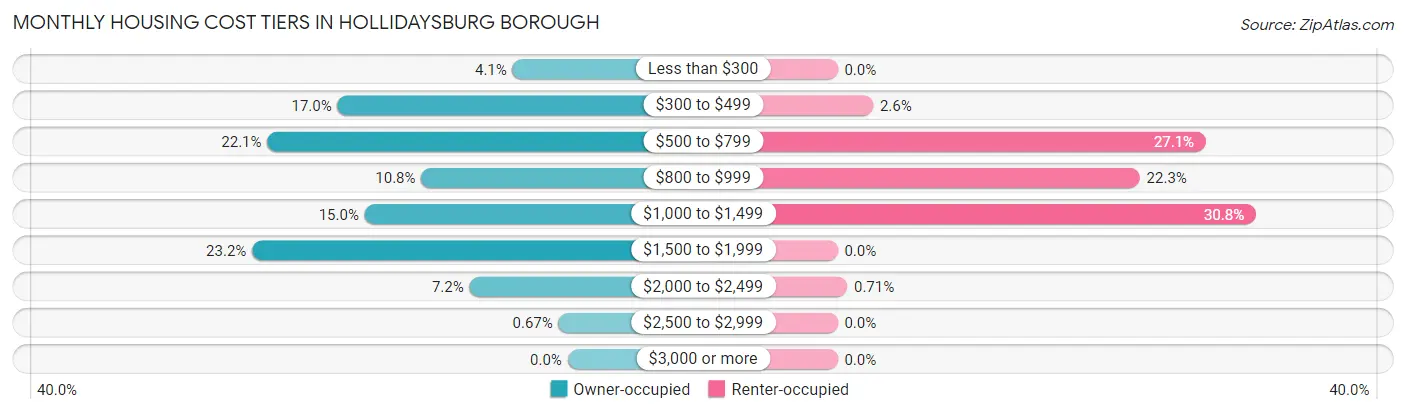
| Monthly Cost | Owner-occupied | Renter-occupied |
| Less than $300 | 73 (4.1%) | 0 (0.0%) |
| $300 to $499 | 305 (17.0%) | 22 (2.6%) |
| $500 to $799 | 398 (22.1%) | 228 (27.1%) |
| $800 to $999 | 194 (10.8%) | 187 (22.3%) |
| $1,000 to $1,499 | 269 (14.9%) | 259 (30.8%) |
| $1,500 to $1,999 | 418 (23.2%) | 0 (0.0%) |
| $2,000 to $2,499 | 130 (7.2%) | 6 (0.7%) |
| $2,500 to $2,999 | 12 (0.7%) | 0 (0.0%) |
| $3,000 or more | 0 (0.0%) | 0 (0.0%) |
| Total | 1,799 (100.0%) | 840 (100.0%) |
Physical Housing Characteristics in Hollidaysburg borough
Housing Structures in Hollidaysburg borough
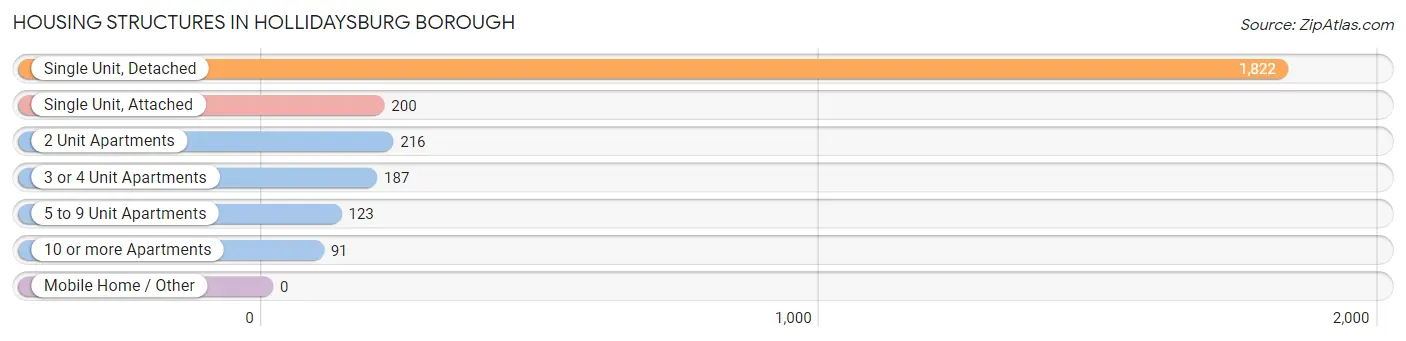
| Structure Type | # Housing Units | % Housing Units |
| Single Unit, Detached | 1,822 | 69.0% |
| Single Unit, Attached | 200 | 7.6% |
| 2 Unit Apartments | 216 | 8.2% |
| 3 or 4 Unit Apartments | 187 | 7.1% |
| 5 to 9 Unit Apartments | 123 | 4.7% |
| 10 or more Apartments | 91 | 3.5% |
| Mobile Home / Other | 0 | 0.0% |
| Total | 2,639 | 100.0% |
Housing Structures by Occupancy in Hollidaysburg borough
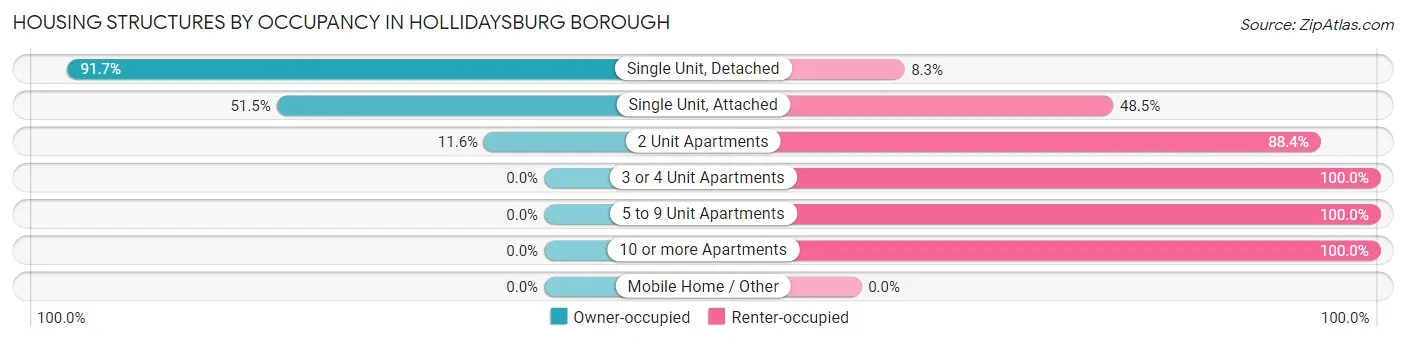
| Structure Type | Owner-occupied | Renter-occupied |
| Single Unit, Detached | 1,671 (91.7%) | 151 (8.3%) |
| Single Unit, Attached | 103 (51.5%) | 97 (48.5%) |
| 2 Unit Apartments | 25 (11.6%) | 191 (88.4%) |
| 3 or 4 Unit Apartments | 0 (0.0%) | 187 (100.0%) |
| 5 to 9 Unit Apartments | 0 (0.0%) | 123 (100.0%) |
| 10 or more Apartments | 0 (0.0%) | 91 (100.0%) |
| Mobile Home / Other | 0 (0.0%) | 0 (0.0%) |
| Total | 1,799 (68.2%) | 840 (31.8%) |
Housing Structures by Number of Rooms in Hollidaysburg borough
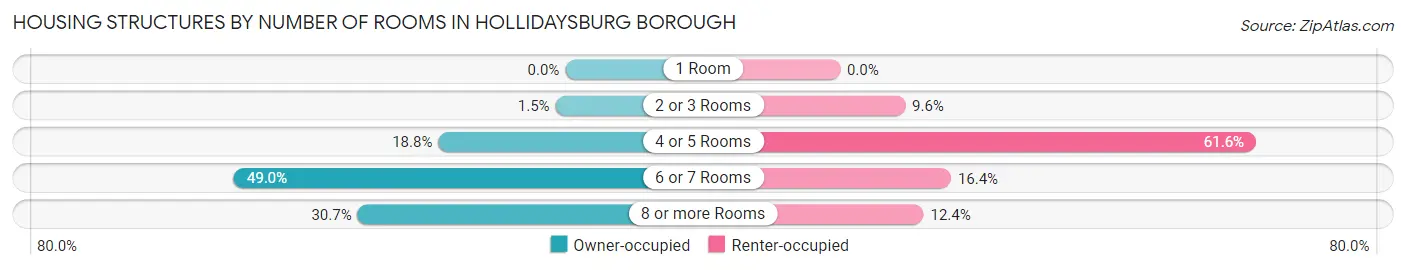
| Number of Rooms | Owner-occupied | Renter-occupied |
| 1 Room | 0 (0.0%) | 0 (0.0%) |
| 2 or 3 Rooms | 26 (1.5%) | 81 (9.6%) |
| 4 or 5 Rooms | 338 (18.8%) | 517 (61.6%) |
| 6 or 7 Rooms | 882 (49.0%) | 138 (16.4%) |
| 8 or more Rooms | 553 (30.7%) | 104 (12.4%) |
| Total | 1,799 (100.0%) | 840 (100.0%) |
Housing Structure by Heating Type in Hollidaysburg borough
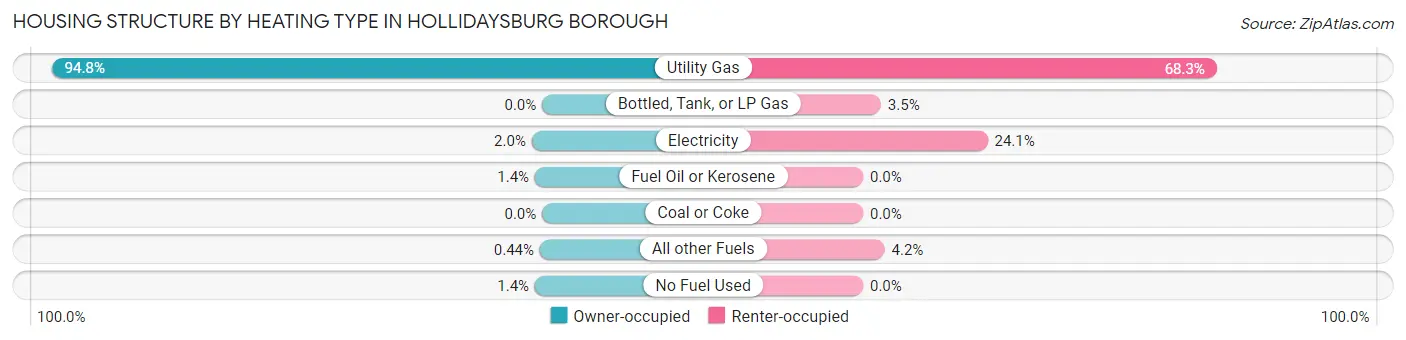
| Heating Type | Owner-occupied | Renter-occupied |
| Utility Gas | 1,705 (94.8%) | 574 (68.3%) |
| Bottled, Tank, or LP Gas | 0 (0.0%) | 29 (3.5%) |
| Electricity | 36 (2.0%) | 202 (24.0%) |
| Fuel Oil or Kerosene | 25 (1.4%) | 0 (0.0%) |
| Coal or Coke | 0 (0.0%) | 0 (0.0%) |
| All other Fuels | 8 (0.4%) | 35 (4.2%) |
| No Fuel Used | 25 (1.4%) | 0 (0.0%) |
| Total | 1,799 (100.0%) | 840 (100.0%) |
Household Vehicle Usage in Hollidaysburg borough
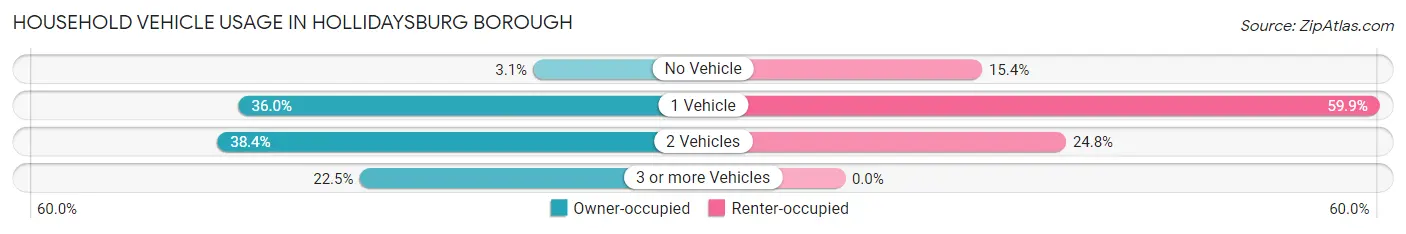
| Vehicles per Household | Owner-occupied | Renter-occupied |
| No Vehicle | 55 (3.1%) | 129 (15.4%) |
| 1 Vehicle | 648 (36.0%) | 503 (59.9%) |
| 2 Vehicles | 691 (38.4%) | 208 (24.8%) |
| 3 or more Vehicles | 405 (22.5%) | 0 (0.0%) |
| Total | 1,799 (100.0%) | 840 (100.0%) |
Real Estate & Mortgages in Hollidaysburg borough
Real Estate and Mortgage Overview in Hollidaysburg borough
| Characteristic | Without Mortgage | With Mortgage |
| Housing Units | 776 | 1,023 |
| Median Property Value | $164,100 | $190,500 |
| Median Household Income | $68,229 | $280 |
| Monthly Housing Costs | $504 | $0 |
| Real Estate Taxes | $2,326 | $0 |
Property Value by Mortgage Status in Hollidaysburg borough
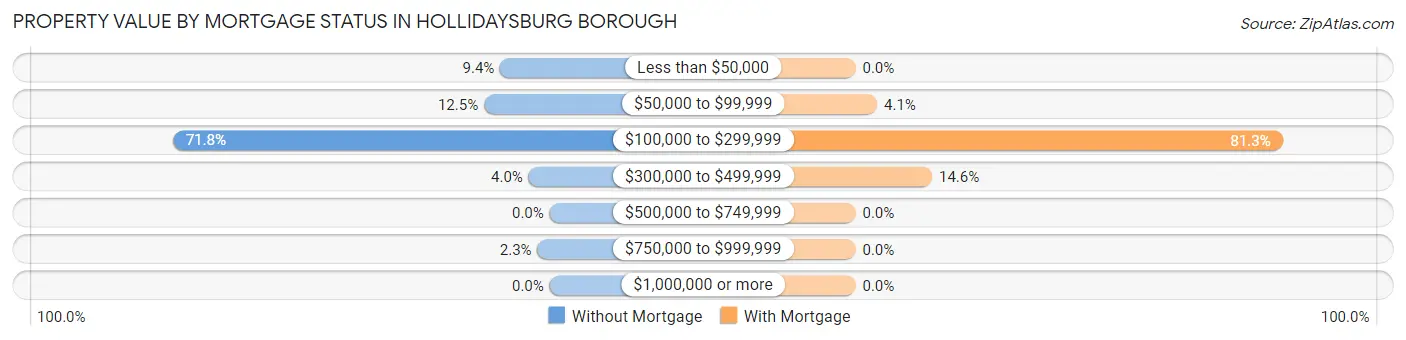
| Property Value | Without Mortgage | With Mortgage |
| Less than $50,000 | 73 (9.4%) | 0 (0.0%) |
| $50,000 to $99,999 | 97 (12.5%) | 42 (4.1%) |
| $100,000 to $299,999 | 557 (71.8%) | 832 (81.3%) |
| $300,000 to $499,999 | 31 (4.0%) | 149 (14.6%) |
| $500,000 to $749,999 | 0 (0.0%) | 0 (0.0%) |
| $750,000 to $999,999 | 18 (2.3%) | 0 (0.0%) |
| $1,000,000 or more | 0 (0.0%) | 0 (0.0%) |
| Total | 776 (100.0%) | 1,023 (100.0%) |
Household Income by Mortgage Status in Hollidaysburg borough
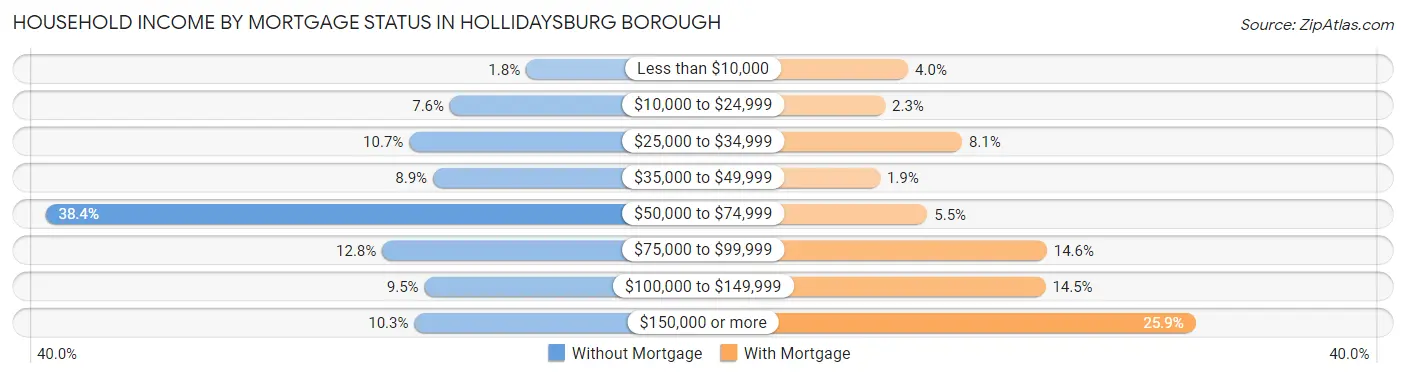
| Household Income | Without Mortgage | With Mortgage |
| Less than $10,000 | 14 (1.8%) | 41 (4.0%) |
| $10,000 to $24,999 | 59 (7.6%) | 23 (2.2%) |
| $25,000 to $34,999 | 83 (10.7%) | 83 (8.1%) |
| $35,000 to $49,999 | 69 (8.9%) | 19 (1.9%) |
| $50,000 to $74,999 | 298 (38.4%) | 56 (5.5%) |
| $75,000 to $99,999 | 99 (12.8%) | 149 (14.6%) |
| $100,000 to $149,999 | 74 (9.5%) | 148 (14.5%) |
| $150,000 or more | 80 (10.3%) | 265 (25.9%) |
| Total | 776 (100.0%) | 1,023 (100.0%) |
Property Value to Household Income Ratio in Hollidaysburg borough
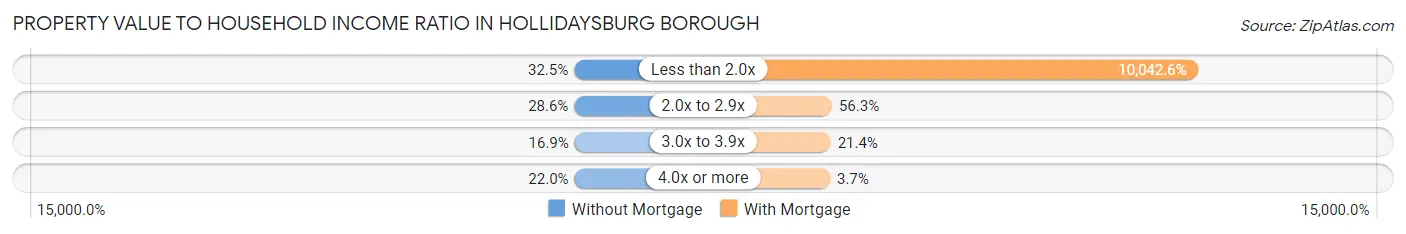
| Value-to-Income Ratio | Without Mortgage | With Mortgage |
| Less than 2.0x | 252 (32.5%) | 102,736 (10,042.6%) |
| 2.0x to 2.9x | 222 (28.6%) | 576 (56.3%) |
| 3.0x to 3.9x | 131 (16.9%) | 219 (21.4%) |
| 4.0x or more | 171 (22.0%) | 38 (3.7%) |
| Total | 776 (100.0%) | 1,023 (100.0%) |
Real Estate Taxes by Mortgage Status in Hollidaysburg borough
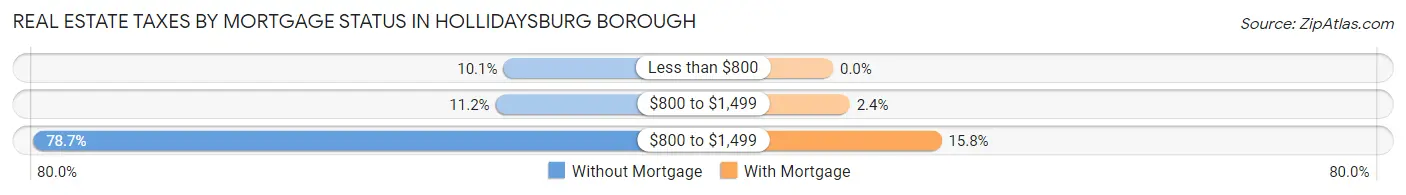
| Property Taxes | Without Mortgage | With Mortgage |
| Less than $800 | 78 (10.1%) | 0 (0.0%) |
| $800 to $1,499 | 87 (11.2%) | 25 (2.4%) |
| $800 to $1,499 | 611 (78.7%) | 162 (15.8%) |
| Total | 776 (100.0%) | 1,023 (100.0%) |
Health & Disability in Hollidaysburg borough
Health Insurance Coverage by Age in Hollidaysburg borough
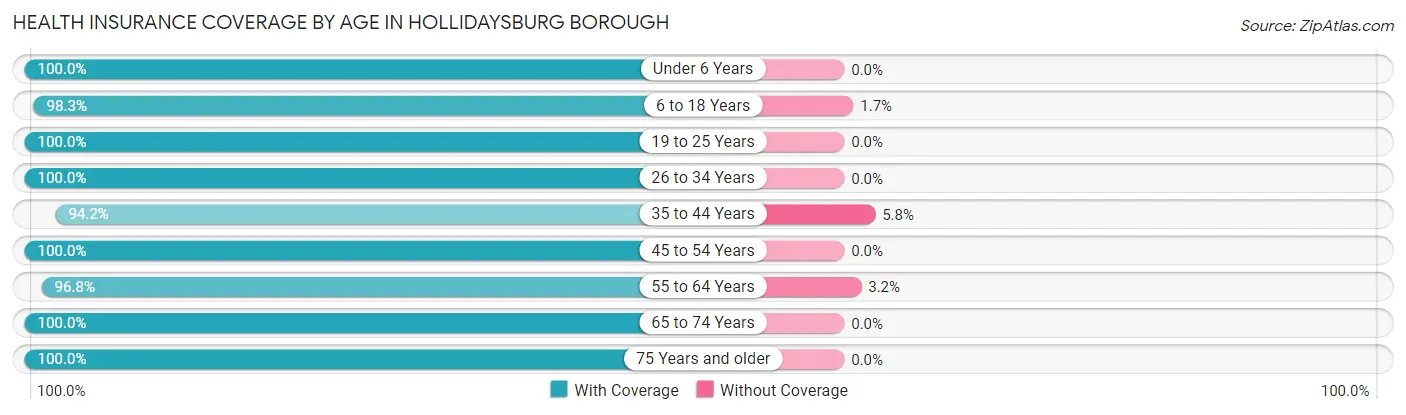
| Age Bracket | With Coverage | Without Coverage |
| Under 6 Years | 152 (100.0%) | 0 (0.0%) |
| 6 to 18 Years | 928 (98.3%) | 16 (1.7%) |
| 19 to 25 Years | 75 (100.0%) | 0 (0.0%) |
| 26 to 34 Years | 439 (100.0%) | 0 (0.0%) |
| 35 to 44 Years | 736 (94.2%) | 45 (5.8%) |
| 45 to 54 Years | 945 (100.0%) | 0 (0.0%) |
| 55 to 64 Years | 673 (96.8%) | 22 (3.2%) |
| 65 to 74 Years | 662 (100.0%) | 0 (0.0%) |
| 75 Years and older | 657 (100.0%) | 0 (0.0%) |
| Total | 5,267 (98.5%) | 83 (1.5%) |
Health Insurance Coverage by Citizenship Status in Hollidaysburg borough
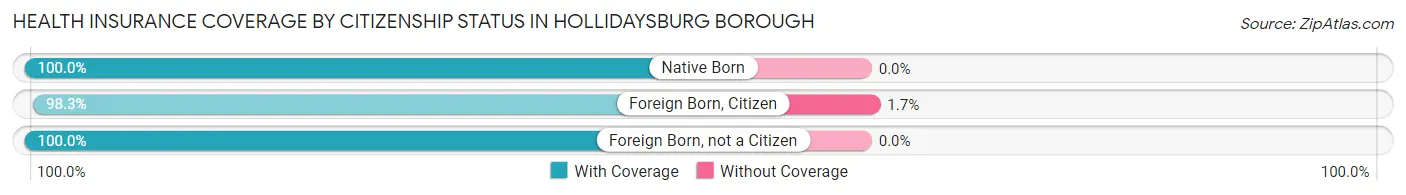
| Citizenship Status | With Coverage | Without Coverage |
| Native Born | 152 (100.0%) | 0 (0.0%) |
| Foreign Born, Citizen | 928 (98.3%) | 16 (1.7%) |
| Foreign Born, not a Citizen | 75 (100.0%) | 0 (0.0%) |
Health Insurance Coverage by Household Income in Hollidaysburg borough
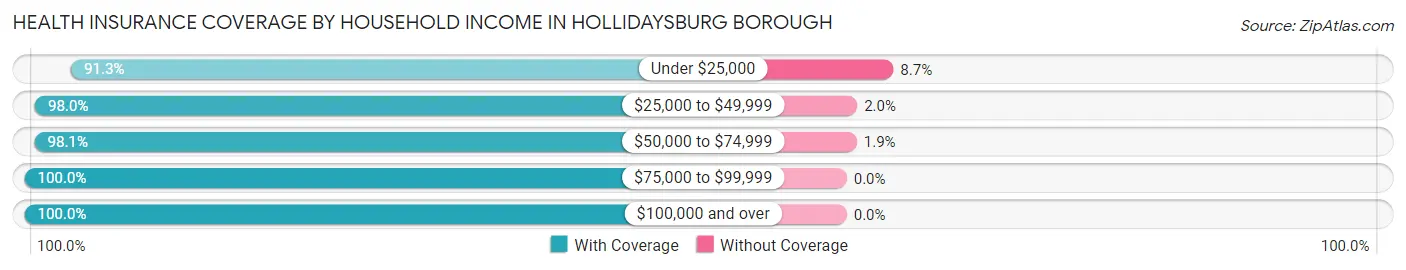
| Household Income | With Coverage | Without Coverage |
| Under $25,000 | 460 (91.3%) | 44 (8.7%) |
| $25,000 to $49,999 | 801 (98.0%) | 16 (2.0%) |
| $50,000 to $74,999 | 1,203 (98.1%) | 23 (1.9%) |
| $75,000 to $99,999 | 608 (100.0%) | 0 (0.0%) |
| $100,000 and over | 2,128 (100.0%) | 0 (0.0%) |
Public vs Private Health Insurance Coverage by Age in Hollidaysburg borough
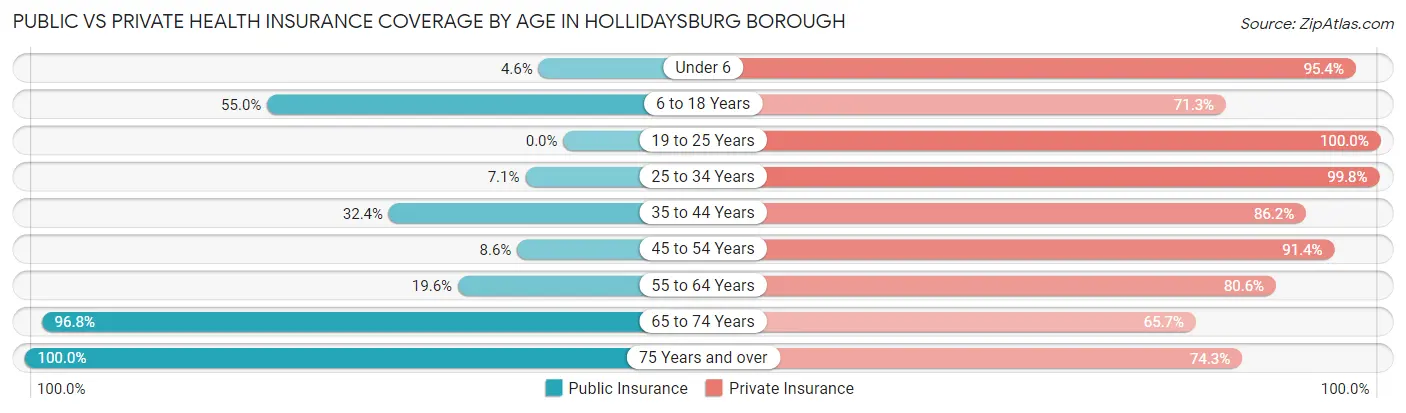
| Age Bracket | Public Insurance | Private Insurance |
| Under 6 | 7 (4.6%) | 145 (95.4%) |
| 6 to 18 Years | 519 (55.0%) | 673 (71.3%) |
| 19 to 25 Years | 0 (0.0%) | 75 (100.0%) |
| 25 to 34 Years | 31 (7.1%) | 438 (99.8%) |
| 35 to 44 Years | 253 (32.4%) | 673 (86.2%) |
| 45 to 54 Years | 81 (8.6%) | 864 (91.4%) |
| 55 to 64 Years | 136 (19.6%) | 560 (80.6%) |
| 65 to 74 Years | 641 (96.8%) | 435 (65.7%) |
| 75 Years and over | 657 (100.0%) | 488 (74.3%) |
| Total | 2,325 (43.5%) | 4,351 (81.3%) |
Disability Status by Sex by Age in Hollidaysburg borough
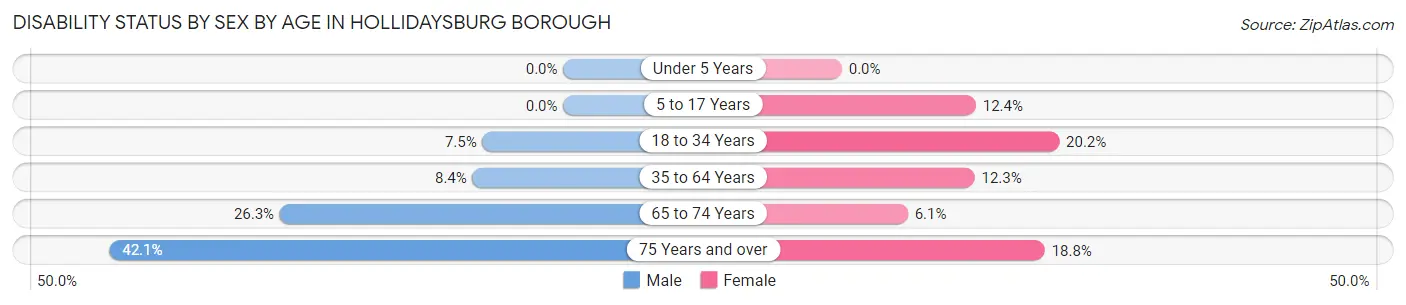
| Age Bracket | Male | Female |
| Under 5 Years | 0 (0.0%) | 0 (0.0%) |
| 5 to 17 Years | 0 (0.0%) | 53 (12.4%) |
| 18 to 34 Years | 30 (7.5%) | 47 (20.2%) |
| 35 to 64 Years | 89 (8.4%) | 168 (12.3%) |
| 65 to 74 Years | 71 (26.3%) | 24 (6.1%) |
| 75 Years and over | 118 (42.1%) | 71 (18.8%) |
Disability Class by Sex by Age in Hollidaysburg borough
Disability Class: Hearing Difficulty
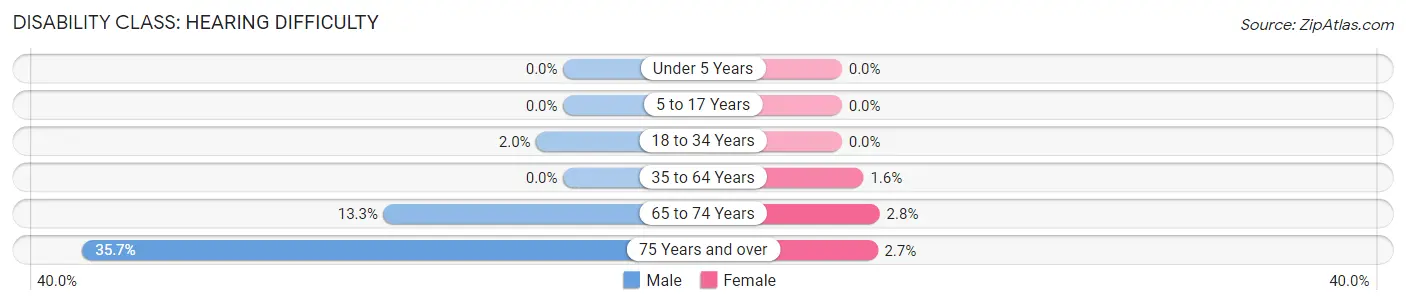
| Age Bracket | Male | Female |
| Under 5 Years | 0 (0.0%) | 0 (0.0%) |
| 5 to 17 Years | 0 (0.0%) | 0 (0.0%) |
| 18 to 34 Years | 8 (2.0%) | 0 (0.0%) |
| 35 to 64 Years | 0 (0.0%) | 22 (1.6%) |
| 65 to 74 Years | 36 (13.3%) | 11 (2.8%) |
| 75 Years and over | 100 (35.7%) | 10 (2.6%) |
Disability Class: Vision Difficulty
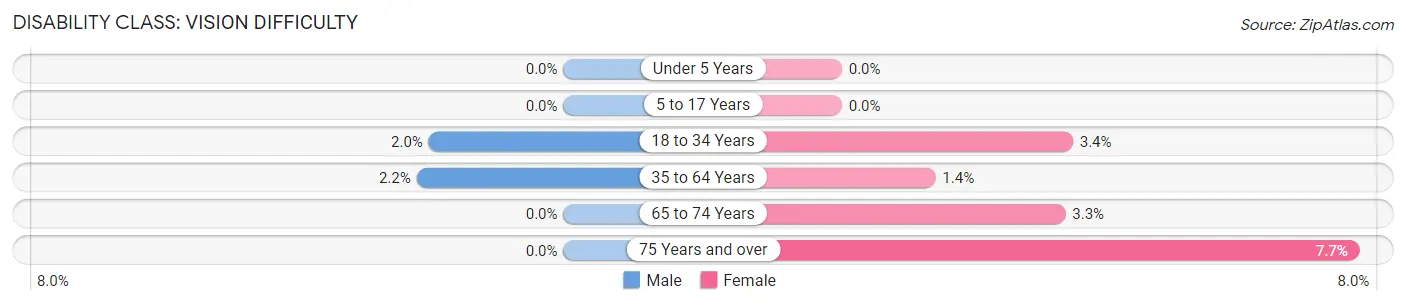
| Age Bracket | Male | Female |
| Under 5 Years | 0 (0.0%) | 0 (0.0%) |
| 5 to 17 Years | 0 (0.0%) | 0 (0.0%) |
| 18 to 34 Years | 8 (2.0%) | 8 (3.4%) |
| 35 to 64 Years | 23 (2.2%) | 19 (1.4%) |
| 65 to 74 Years | 0 (0.0%) | 13 (3.3%) |
| 75 Years and over | 0 (0.0%) | 29 (7.7%) |
Disability Class: Cognitive Difficulty
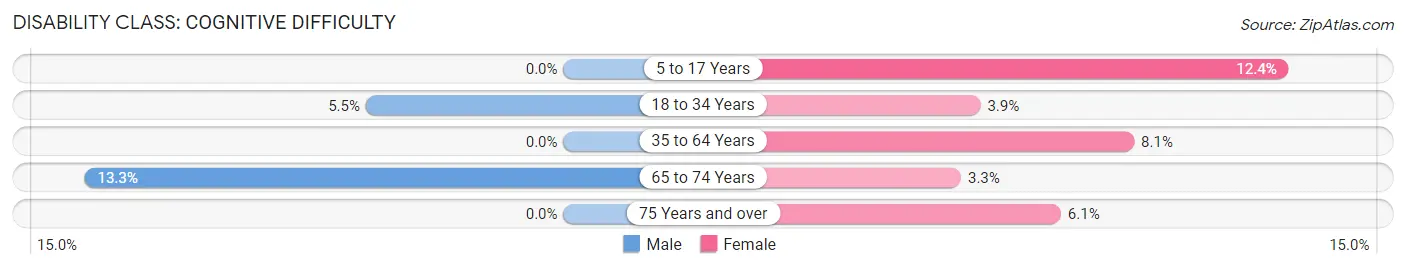
| Age Bracket | Male | Female |
| 5 to 17 Years | 0 (0.0%) | 53 (12.4%) |
| 18 to 34 Years | 22 (5.5%) | 9 (3.9%) |
| 35 to 64 Years | 0 (0.0%) | 111 (8.1%) |
| 65 to 74 Years | 36 (13.3%) | 13 (3.3%) |
| 75 Years and over | 0 (0.0%) | 23 (6.1%) |
Disability Class: Ambulatory Difficulty
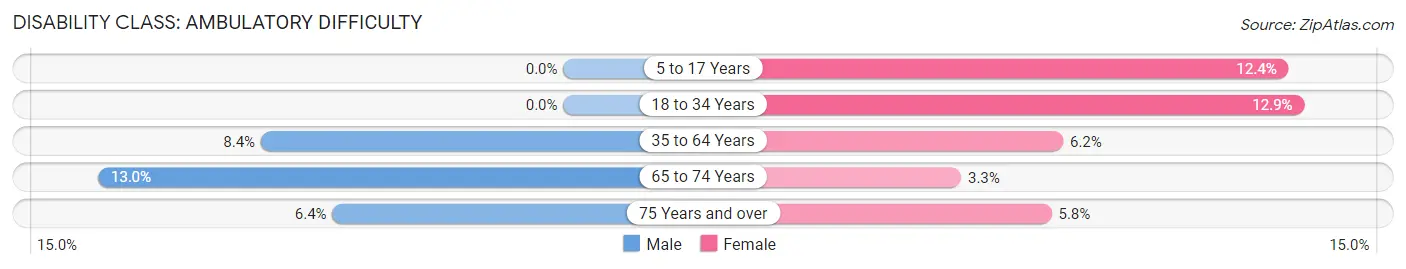
| Age Bracket | Male | Female |
| 5 to 17 Years | 0 (0.0%) | 53 (12.4%) |
| 18 to 34 Years | 0 (0.0%) | 30 (12.9%) |
| 35 to 64 Years | 89 (8.4%) | 84 (6.2%) |
| 65 to 74 Years | 35 (13.0%) | 13 (3.3%) |
| 75 Years and over | 18 (6.4%) | 22 (5.8%) |
Disability Class: Self-Care Difficulty
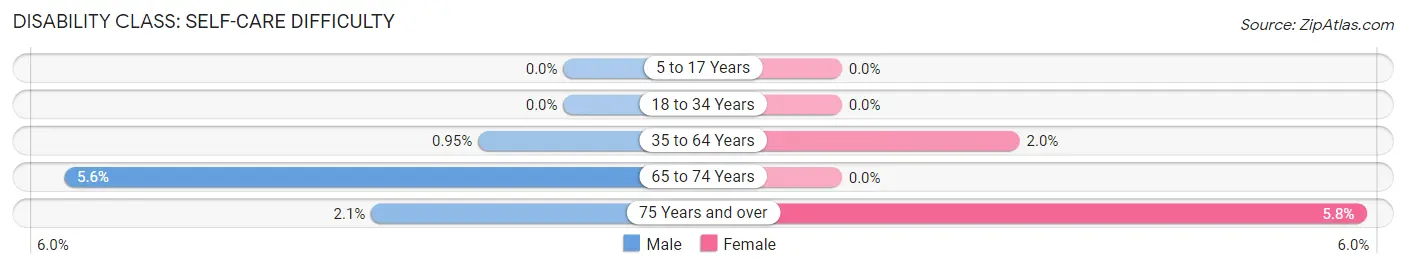
| Age Bracket | Male | Female |
| 5 to 17 Years | 0 (0.0%) | 0 (0.0%) |
| 18 to 34 Years | 0 (0.0%) | 0 (0.0%) |
| 35 to 64 Years | 10 (0.9%) | 27 (2.0%) |
| 65 to 74 Years | 15 (5.6%) | 0 (0.0%) |
| 75 Years and over | 6 (2.1%) | 22 (5.8%) |
Technology Access in Hollidaysburg borough
Computing Device Access in Hollidaysburg borough
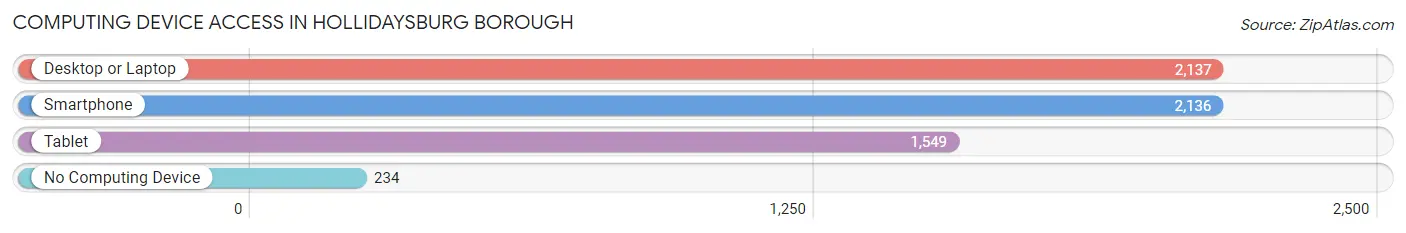
| Device Type | # Households | % Households |
| Desktop or Laptop | 2,137 | 81.0% |
| Smartphone | 2,136 | 80.9% |
| Tablet | 1,549 | 58.7% |
| No Computing Device | 234 | 8.9% |
| Total | 2,639 | 100.0% |
Internet Access in Hollidaysburg borough
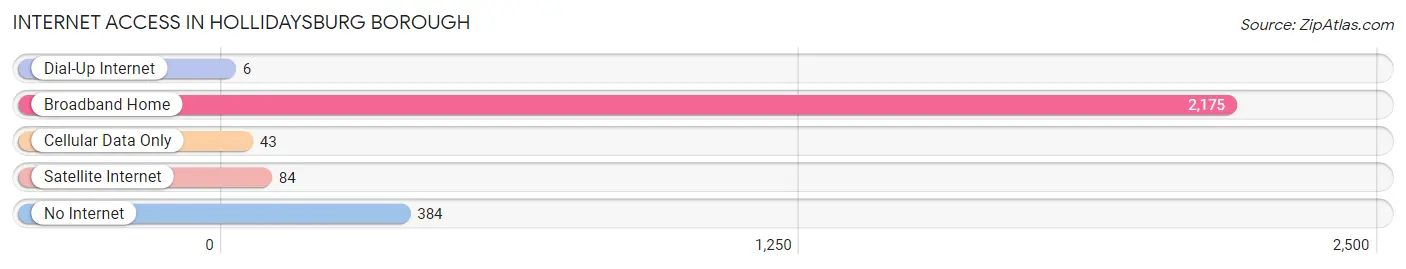
| Internet Type | # Households | % Households |
| Dial-Up Internet | 6 | 0.2% |
| Broadband Home | 2,175 | 82.4% |
| Cellular Data Only | 43 | 1.6% |
| Satellite Internet | 84 | 3.2% |
| No Internet | 384 | 14.5% |
| Total | 2,639 | 100.0% |
Hollidaysburg borough Summary
Hollidaysburg Borough is a borough located in Blair County, Pennsylvania, United States. The population was 4,086 at the 2010 census. It is part of the Altoona, PA Metropolitan Statistical Area.
History
Hollidaysburg was founded in 1833 by Colonel William Holliday, a Revolutionary War veteran. The town was laid out in a grid pattern, with the main street running east-west and the cross streets running north-south. The town was named after Colonel Holliday, who was a prominent figure in the area.
The town was incorporated as a borough in 1836. In the late 19th century, the town was a major center for the production of iron and steel. The Pennsylvania Railroad had a major presence in the town, and the town was home to several large factories.
Geography
Hollidaysburg is located at 40 27 17 North 78 20 45 West 40 454722 78 345833
According to the United States Census Bureau, the borough has a total area of 1.2 square miles (3.1 km2), all of it land.
Demographics
As of the census of 2000, there were 4,086 people, 1,717 households, and 1,093 families residing in the borough. The population density was 3,521.2 people per square mile (1,364.2/km2). There were 1,817 housing units at an average density of 1,541.2 per square mile (593.2/km2). The racial makeup of the borough was 97.90% White, 0.54% African American, 0.10% Native American, 0.44% Asian, 0.02% Pacific Islander, 0.22% from other races, and 0.79% from two or more races. Hispanic or Latino of any race were 0.59% of the population.
Economy
Hollidaysburg is home to several businesses, including a variety of retail stores, restaurants, and professional services. The town is also home to several manufacturing companies, including a steel mill and a paper mill. The town is also home to a number of small businesses, including a variety of antique stores, art galleries, and specialty shops.
The town is also home to a number of educational institutions, including a community college, a technical school, and a number of private schools. The town is also home to a number of churches, including a Catholic church, a Presbyterian church, and a Methodist church.
The town is served by the Hollidaysburg Area School District, which includes a number of elementary, middle, and high schools. The district also includes a number of private schools.
Conclusion
Hollidaysburg Borough is a small town located in Blair County, Pennsylvania. The town was founded in 1833 by Colonel William Holliday, and was incorporated as a borough in 1836. The town has a population of 4,086, and is part of the Altoona, PA Metropolitan Statistical Area. The town is home to a variety of businesses, including retail stores, restaurants, and manufacturing companies. The town is also home to a number of educational institutions, including a community college, a technical school, and a number of private schools. The town is served by the Hollidaysburg Area School District, which includes a number of elementary, middle, and high schools.
Common Questions
What is the Total Population of Hollidaysburg borough?
Total Population of Hollidaysburg borough is 5,630.
What is the Total Male Population of Hollidaysburg borough?
Total Male Population of Hollidaysburg borough is 2,691.
What is the Total Female Population of Hollidaysburg borough?
Total Female Population of Hollidaysburg borough is 2,939.
What is the Ratio of Males per 100 Females in Hollidaysburg borough?
There are 91.56 Males per 100 Females in Hollidaysburg borough.
What is the Ratio of Females per 100 Males in Hollidaysburg borough?
There are 109.22 Females per 100 Males in Hollidaysburg borough.
What is the Median Population Age in Hollidaysburg borough?
Median Population Age in Hollidaysburg borough is 48.6 Years.
What is the Average Family Size in Hollidaysburg borough
Average Family Size in Hollidaysburg borough is 2.8 People.
What is the Average Household Size in Hollidaysburg borough
Average Household Size in Hollidaysburg borough is 2.0 People.
What is Per Capita Income in Hollidaysburg borough?
Per Capita income in Hollidaysburg borough is $41,157.
What is the Median Family Income in Hollidaysburg borough?
Median Family Income in Hollidaysburg borough is $83,906.
What is the Median Household income in Hollidaysburg borough?
Median Household Income in Hollidaysburg borough is $65,142.
What is Income or Wage Gap in Hollidaysburg borough?
Income or Wage Gap in Hollidaysburg borough is 18.9%.
Women in Hollidaysburg borough earn 81.1 cents for every dollar earned by a man.
What is Inequality or Gini Index in Hollidaysburg borough?
Inequality or Gini Index in Hollidaysburg borough is 0.43.
How Large is the Labor Force in Hollidaysburg borough?
There are 2,677 People in the Labor Forcein in Hollidaysburg borough.
What is the Percentage of People in the Labor Force in Hollidaysburg borough?
55.6% of People are in the Labor Force in Hollidaysburg borough.
What is the Unemployment Rate in Hollidaysburg borough?
Unemployment Rate in Hollidaysburg borough is 2.7%.