Hastings borough, PA
Hastings borough Overview
1,051
TOTAL POPULATION
509
MALE POPULATION
542
FEMALE POPULATION
93.91
MALES / 100 FEMALES
106.48
FEMALES / 100 MALES
44.6
MEDIAN AGE
2.9
AVG FAMILY SIZE
2.1
AVG HOUSEHOLD SIZE
$31,027
PER CAPITA INCOME
$60,469
AVG FAMILY INCOME
$56,528
AVG HOUSEHOLD INCOME
31.4%
WAGE / INCOME GAP [ % ]
68.6¢/ $1
WAGE / INCOME GAP [ $ ]
0.37
INEQUALITY / GINI INDEX
535
LABOR FORCE [ PEOPLE ]
58.9%
PERCENT IN LABOR FORCE
2.6%
UNEMPLOYMENT RATE
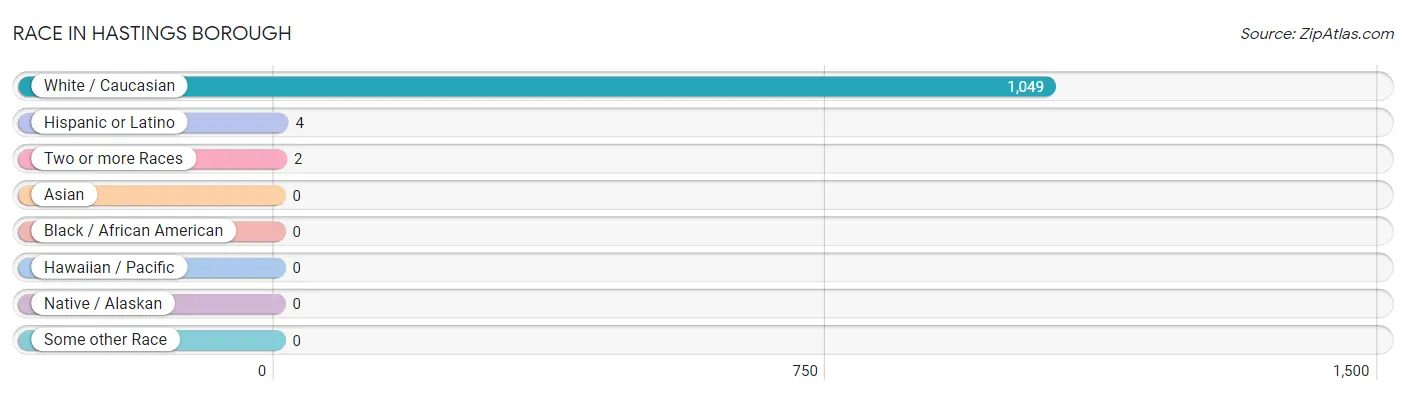
Race in Hastings borough
The most populous races in Hastings borough are White / Caucasian (1,049 | 99.8%), Hispanic or Latino (4 | 0.4%), and Two or more Races (2 | 0.2%).
| Race | # Population | % Population |
| Asian | 0 | 0.0% |
| Black / African American | 0 | 0.0% |
| Hawaiian / Pacific | 0 | 0.0% |
| Hispanic or Latino | 4 | 0.4% |
| Native / Alaskan | 0 | 0.0% |
| White / Caucasian | 1,049 | 99.8% |
| Two or more Races | 2 | 0.2% |
| Some other Race | 0 | 0.0% |
| Total | 1,051 | 100.0% |
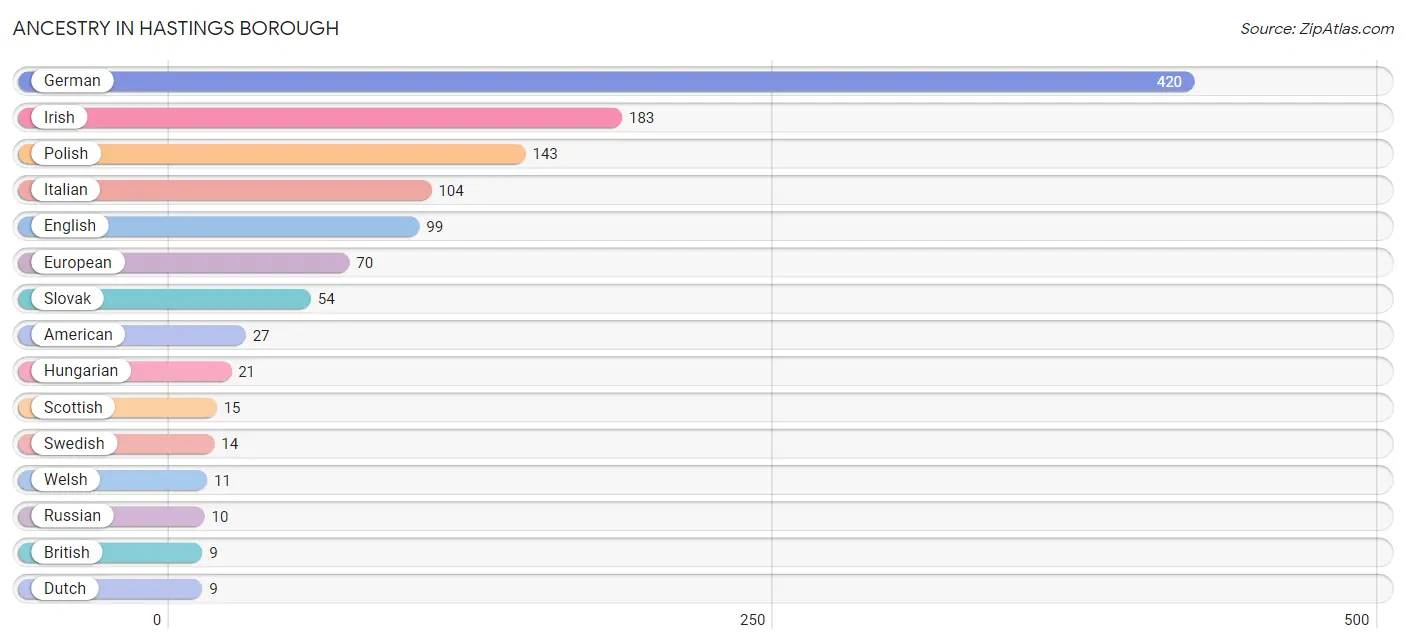
Ancestry in Hastings borough
The most populous ancestries reported in Hastings borough are German (420 | 40.0%), Irish (183 | 17.4%), Polish (143 | 13.6%), Italian (104 | 9.9%), and English (99 | 9.4%), together accounting for 90.3% of all Hastings borough residents.
| Ancestry | # Population | % Population |
| American | 27 | 2.6% |
| Austrian | 3 | 0.3% |
| British | 9 | 0.9% |
| Czechoslovakian | 3 | 0.3% |
| Dutch | 9 | 0.9% |
| Eastern European | 3 | 0.3% |
| English | 99 | 9.4% |
| European | 70 | 6.7% |
| French | 7 | 0.7% |
| French Canadian | 5 | 0.5% |
| German | 420 | 40.0% |
| Hungarian | 21 | 2.0% |
| Irish | 183 | 17.4% |
| Italian | 104 | 9.9% |
| Lithuanian | 8 | 0.8% |
| Mexican | 4 | 0.4% |
| Norwegian | 3 | 0.3% |
| Polish | 143 | 13.6% |
| Russian | 10 | 0.9% |
| Scotch-Irish | 6 | 0.6% |
| Scottish | 15 | 1.4% |
| Slavic | 8 | 0.8% |
| Slovak | 54 | 5.1% |
| Swedish | 14 | 1.3% |
| Swiss | 2 | 0.2% |
| Turkish | 7 | 0.7% |
| Ukrainian | 6 | 0.6% |
| Welsh | 11 | 1.1% | View All 28 Rows |
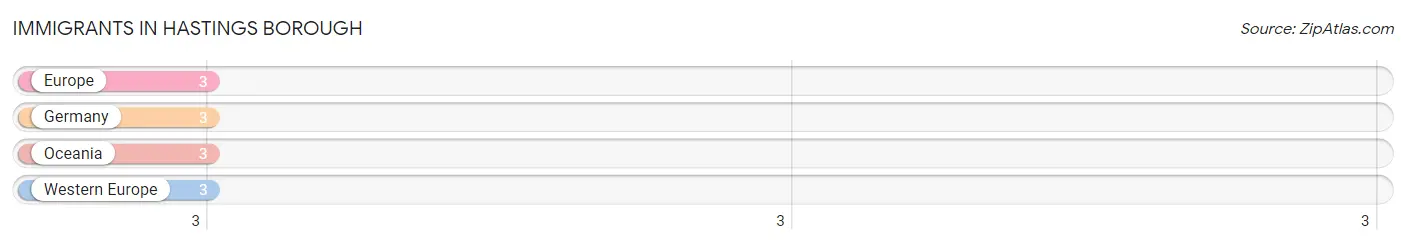
Immigrants in Hastings borough
The most numerous immigrant groups reported in Hastings borough came from Europe (3 | 0.3%), Germany (3 | 0.3%), Oceania (3 | 0.3%), and Western Europe (3 | 0.3%), together accounting for 1.2% of all Hastings borough residents.
| Immigration Origin | # Population | % Population |
| Europe | 3 | 0.3% |
| Germany | 3 | 0.3% |
| Oceania | 3 | 0.3% |
| Western Europe | 3 | 0.3% | View All 4 Rows |
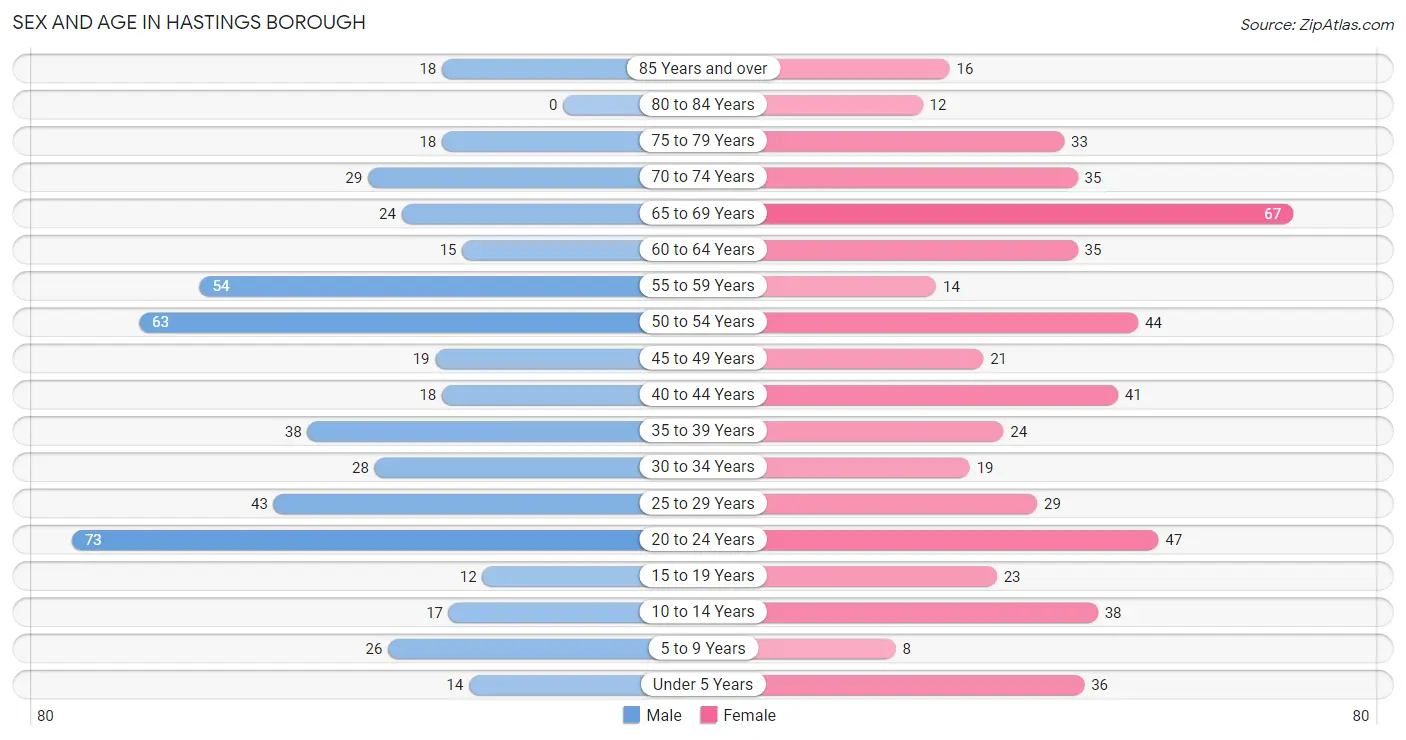
Sex and Age in Hastings borough
Sex and Age in Hastings borough
The most populous age groups in Hastings borough are 20 to 24 Years (73 | 14.3%) for men and 65 to 69 Years (67 | 12.4%) for women.
| Age Bracket | Male | Female |
| Under 5 Years | 14 (2.8%) | 36 (6.6%) |
| 5 to 9 Years | 26 (5.1%) | 8 (1.5%) |
| 10 to 14 Years | 17 (3.3%) | 38 (7.0%) |
| 15 to 19 Years | 12 (2.4%) | 23 (4.2%) |
| 20 to 24 Years | 73 (14.3%) | 47 (8.7%) |
| 25 to 29 Years | 43 (8.5%) | 29 (5.3%) |
| 30 to 34 Years | 28 (5.5%) | 19 (3.5%) |
| 35 to 39 Years | 38 (7.5%) | 24 (4.4%) |
| 40 to 44 Years | 18 (3.5%) | 41 (7.6%) |
| 45 to 49 Years | 19 (3.7%) | 21 (3.9%) |
| 50 to 54 Years | 63 (12.4%) | 44 (8.1%) |
| 55 to 59 Years | 54 (10.6%) | 14 (2.6%) |
| 60 to 64 Years | 15 (2.9%) | 35 (6.5%) |
| 65 to 69 Years | 24 (4.7%) | 67 (12.4%) |
| 70 to 74 Years | 29 (5.7%) | 35 (6.5%) |
| 75 to 79 Years | 18 (3.5%) | 33 (6.1%) |
| 80 to 84 Years | 0 (0.0%) | 12 (2.2%) |
| 85 Years and over | 18 (3.5%) | 16 (2.9%) |
| Total | 509 (100.0%) | 542 (100.0%) |
Families and Households in Hastings borough
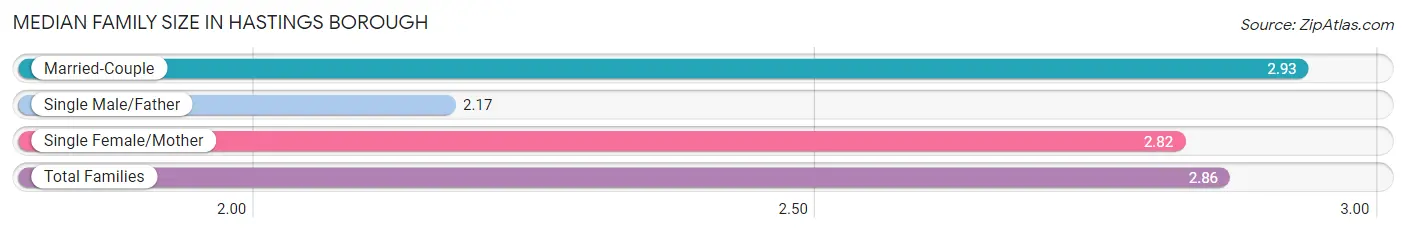
Median Family Size in Hastings borough
The median family size in Hastings borough is 2.86 persons per family, with married-couple families (204 | 73.7%) accounting for the largest median family size of 2.93 persons per family. On the other hand, single male/father families (18 | 6.5%) represent the smallest median family size with 2.17 persons per family.
| Family Type | # Families | Family Size |
| Married-Couple | 204 (73.7%) | 2.93 |
| Single Male/Father | 18 (6.5%) | 2.17 |
| Single Female/Mother | 55 (19.9%) | 2.82 |
| Total Families | 277 (100.0%) | 2.86 |
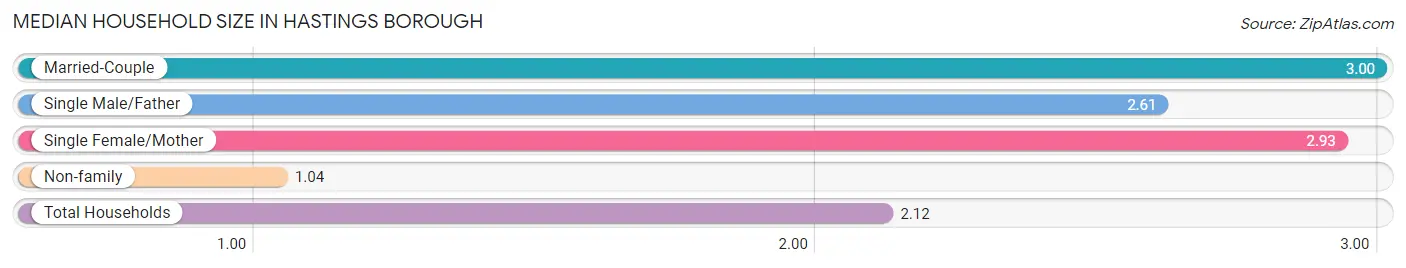
Median Household Size in Hastings borough
The median household size in Hastings borough is 2.12 persons per household, with married-couple households (204 | 41.2%) accounting for the largest median household size of 3 persons per household. non-family households (218 | 44.0%) represent the smallest median household size with 1.04 persons per household.
| Household Type | # Households | Household Size |
| Married-Couple | 204 (41.2%) | 3.00 |
| Single Male/Father | 18 (3.6%) | 2.61 |
| Single Female/Mother | 55 (11.1%) | 2.93 |
| Non-family | 218 (44.0%) | 1.04 |
| Total Households | 495 (100.0%) | 2.12 |
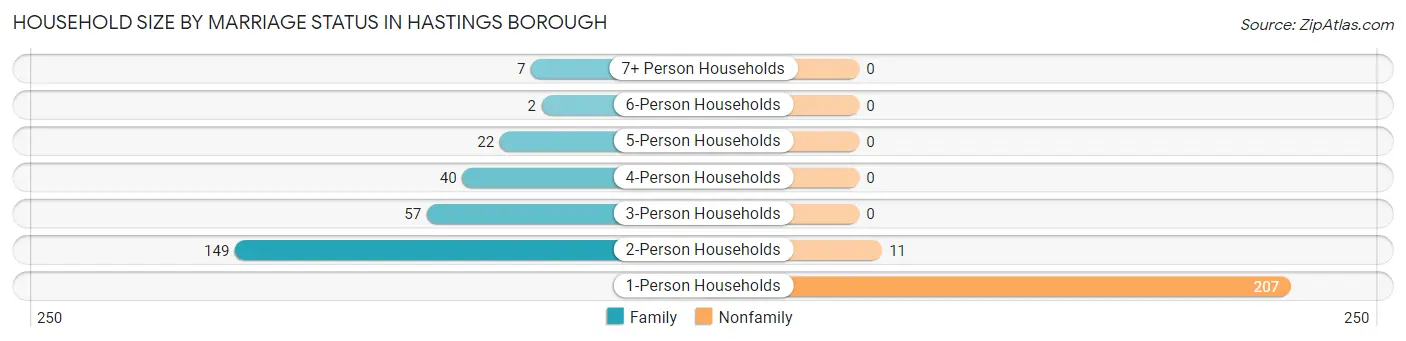
Household Size by Marriage Status in Hastings borough
Out of a total of 495 households in Hastings borough, 277 (56.0%) are family households, while 218 (44.0%) are nonfamily households. The most numerous type of family households are 2-person households, comprising 149, and the most common type of nonfamily households are 1-person households, comprising 207.
| Household Size | Family Households | Nonfamily Households |
| 1-Person Households | - | 207 (41.8%) |
| 2-Person Households | 149 (30.1%) | 11 (2.2%) |
| 3-Person Households | 57 (11.5%) | 0 (0.0%) |
| 4-Person Households | 40 (8.1%) | 0 (0.0%) |
| 5-Person Households | 22 (4.4%) | 0 (0.0%) |
| 6-Person Households | 2 (0.4%) | 0 (0.0%) |
| 7+ Person Households | 7 (1.4%) | 0 (0.0%) |
| Total | 277 (56.0%) | 218 (44.0%) |
Female Fertility in Hastings borough
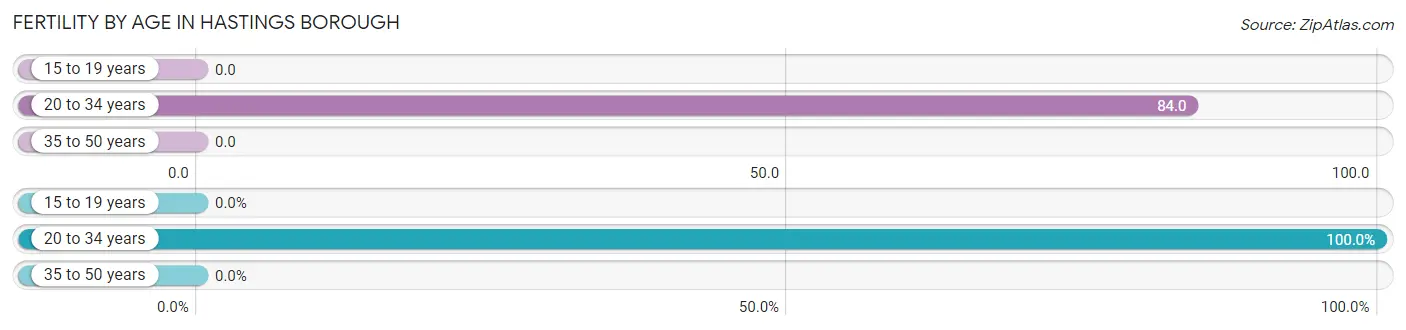
Fertility by Age in Hastings borough
Average fertility rate in Hastings borough is 36.0 births per 1,000 women. Women in the age bracket of 20 to 34 years have the highest fertility rate with 84.0 births per 1,000 women. Women in the age bracket of 20 to 34 years acount for 100.0% of all women with births.
| Age Bracket | Women with Births | Births / 1,000 Women |
| 15 to 19 years | 0 (0.0%) | 0.0 |
| 20 to 34 years | 8 (100.0%) | 84.0 |
| 35 to 50 years | 0 (0.0%) | 0.0 |
| Total | 8 (100.0%) | 36.0 |
Fertility by Age by Marriage Status in Hastings borough
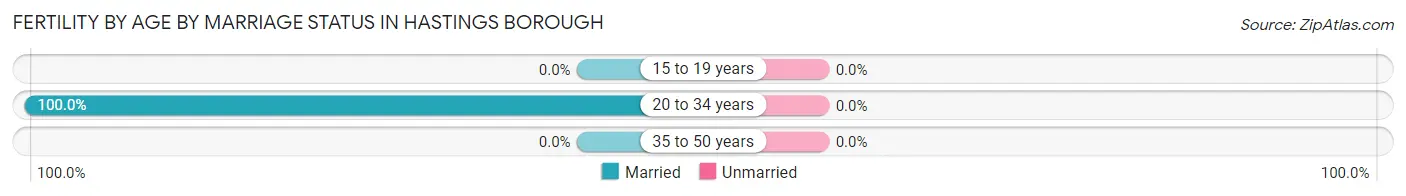
| Age Bracket | Married | Unmarried |
| 15 to 19 years | 0 (0.0%) | 0 (0.0%) |
| 20 to 34 years | 8 (100.0%) | 0 (0.0%) |
| 35 to 50 years | 0 (0.0%) | 0 (0.0%) |
| Total | 8 (100.0%) | 0 (0.0%) |
Fertility by Education in Hastings borough
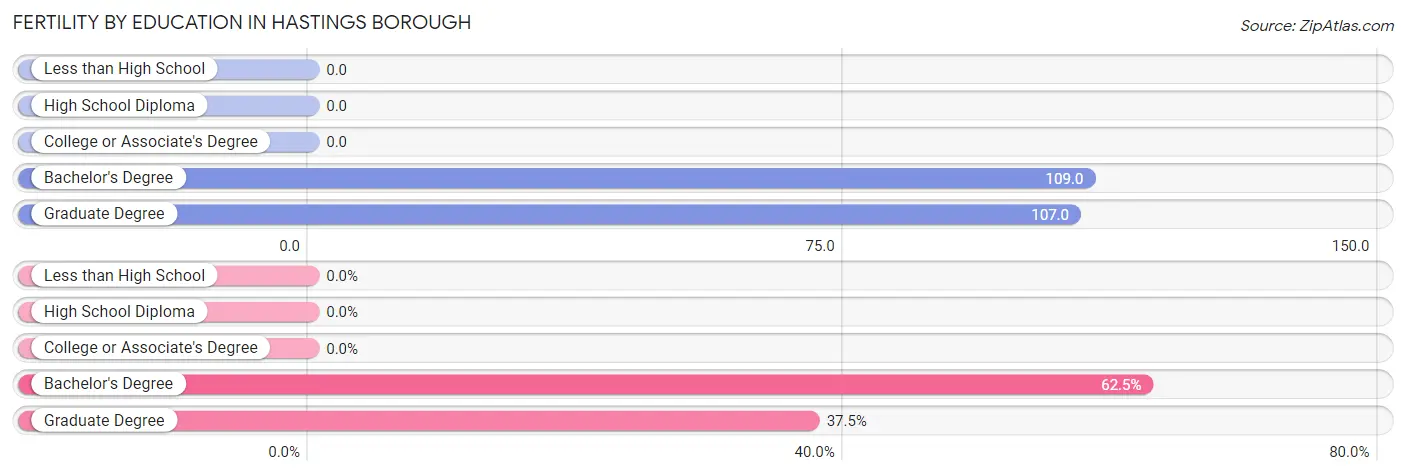
| Educational Attainment | Women with Births | Births / 1,000 Women |
| Less than High School | 0 (0.0%) | 0.0 |
| High School Diploma | 0 (0.0%) | 0.0 |
| College or Associate's Degree | 0 (0.0%) | 0.0 |
| Bachelor's Degree | 5 (62.5%) | 109.0 |
| Graduate Degree | 3 (37.5%) | 107.0 |
| Total | 8 (100.0%) | 36.0 |
Fertility by Education by Marriage Status in Hastings borough
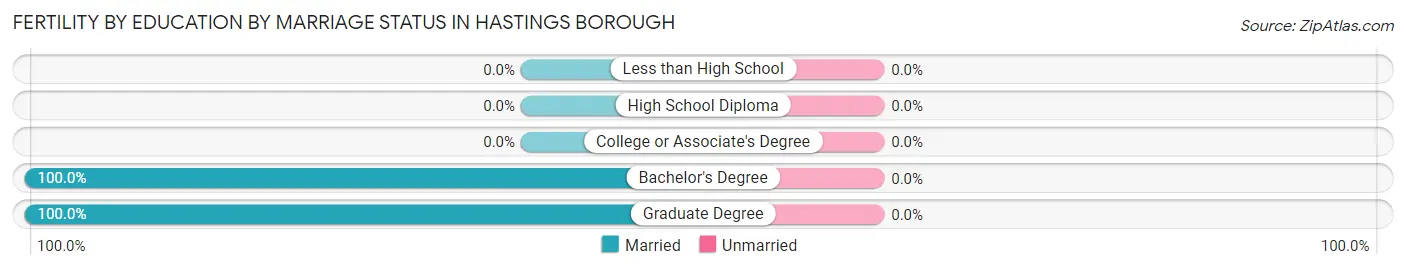
| Educational Attainment | Married | Unmarried |
| Less than High School | 0 (0.0%) | 0 (0.0%) |
| High School Diploma | 0 (0.0%) | 0 (0.0%) |
| College or Associate's Degree | 0 (0.0%) | 0 (0.0%) |
| Bachelor's Degree | 5 (100.0%) | 0 (0.0%) |
| Graduate Degree | 3 (100.0%) | 0 (0.0%) |
| Total | 8 (100.0%) | 0 (0.0%) |
Income in Hastings borough
Income Overview in Hastings borough
Per Capita Income in Hastings borough is $31,027, while median incomes of families and households are $60,469 and $56,528 respectively.
| Characteristic | Number | Measure |
| Per Capita Income | 1,051 | $31,027 |
| Median Family Income | 277 | $60,469 |
| Mean Family Income | 277 | $74,143 |
| Median Household Income | 495 | $56,528 |
| Mean Household Income | 495 | $63,847 |
| Income Deficit | 277 | $0 |
| Wage / Income Gap (%) | 1,051 | 31.39% |
| Wage / Income Gap ($) | 1,051 | 68.61¢ per $1 |
| Gini / Inequality Index | 1,051 | 0.37 |
Earnings by Sex in Hastings borough
Average Earnings in Hastings borough are $35,043, $41,298 for men and $28,333 for women, a difference of 31.4%.
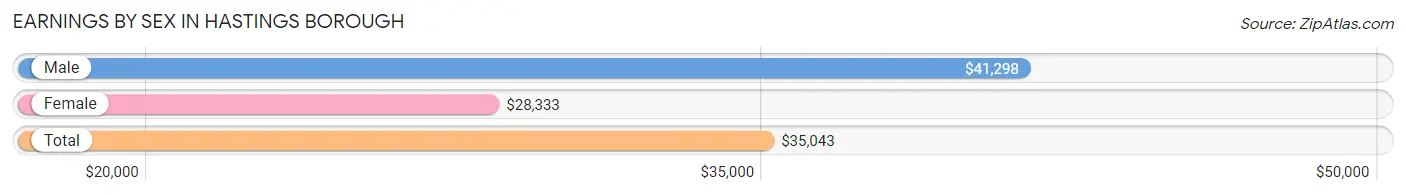
| Sex | Number | Average Earnings |
| Male | 329 (57.8%) | $41,298 |
| Female | 240 (42.2%) | $28,333 |
| Total | 569 (100.0%) | $35,043 |
Earnings by Sex by Income Bracket in Hastings borough
The most common earnings brackets in Hastings borough are $75,000 to $99,999 for men (68 | 20.7%) and $2,500 to $4,999 for women (25 | 10.4%).
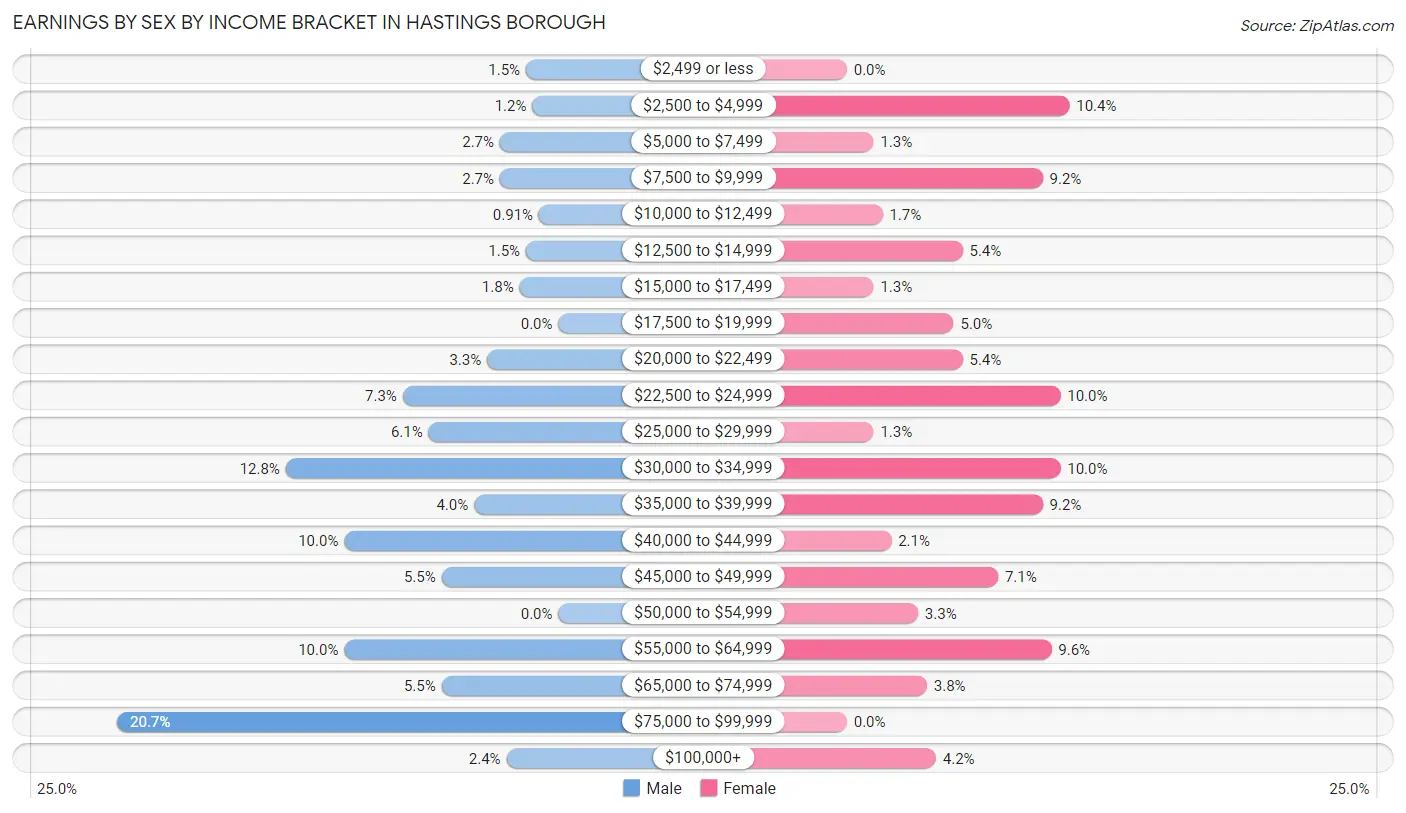
| Income | Male | Female |
| $2,499 or less | 5 (1.5%) | 0 (0.0%) |
| $2,500 to $4,999 | 4 (1.2%) | 25 (10.4%) |
| $5,000 to $7,499 | 9 (2.7%) | 3 (1.3%) |
| $7,500 to $9,999 | 9 (2.7%) | 22 (9.2%) |
| $10,000 to $12,499 | 3 (0.9%) | 4 (1.7%) |
| $12,500 to $14,999 | 5 (1.5%) | 13 (5.4%) |
| $15,000 to $17,499 | 6 (1.8%) | 3 (1.3%) |
| $17,500 to $19,999 | 0 (0.0%) | 12 (5.0%) |
| $20,000 to $22,499 | 11 (3.3%) | 13 (5.4%) |
| $22,500 to $24,999 | 24 (7.3%) | 24 (10.0%) |
| $25,000 to $29,999 | 20 (6.1%) | 3 (1.3%) |
| $30,000 to $34,999 | 42 (12.8%) | 24 (10.0%) |
| $35,000 to $39,999 | 13 (4.0%) | 22 (9.2%) |
| $40,000 to $44,999 | 33 (10.0%) | 5 (2.1%) |
| $45,000 to $49,999 | 18 (5.5%) | 17 (7.1%) |
| $50,000 to $54,999 | 0 (0.0%) | 8 (3.3%) |
| $55,000 to $64,999 | 33 (10.0%) | 23 (9.6%) |
| $65,000 to $74,999 | 18 (5.5%) | 9 (3.7%) |
| $75,000 to $99,999 | 68 (20.7%) | 0 (0.0%) |
| $100,000+ | 8 (2.4%) | 10 (4.2%) |
| Total | 329 (100.0%) | 240 (100.0%) |
Earnings by Sex by Educational Attainment in Hastings borough
Average earnings in Hastings borough are $45,625 for men and $31,364 for women, a difference of 31.3%. Men with an educational attainment of graduate degree enjoy the highest average annual earnings of $72,500, while those with less than high school education earn the least with $31,364. Women with an educational attainment of graduate degree earn the most with the average annual earnings of $57,500, while those with high school diploma education have the smallest earnings of $23,681.
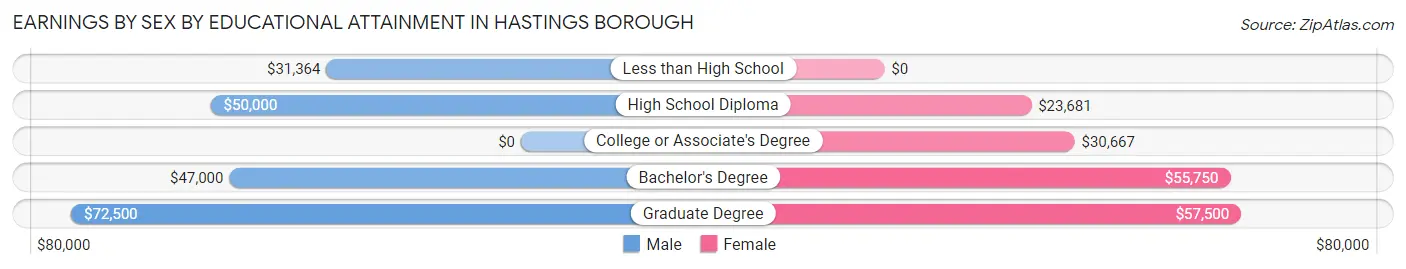
| Educational Attainment | Male Income | Female Income |
| Less than High School | $31,364 | $0 |
| High School Diploma | $50,000 | $23,681 |
| College or Associate's Degree | - | - |
| Bachelor's Degree | $47,000 | $55,750 |
| Graduate Degree | $72,500 | $57,500 |
| Total | $45,625 | $31,364 |
Family Income in Hastings borough
Family Income Brackets in Hastings borough
According to the Hastings borough family income data, there are 60 families falling into the $50,000 to $74,999 income range, which is the most common income bracket and makes up 21.7% of all families.
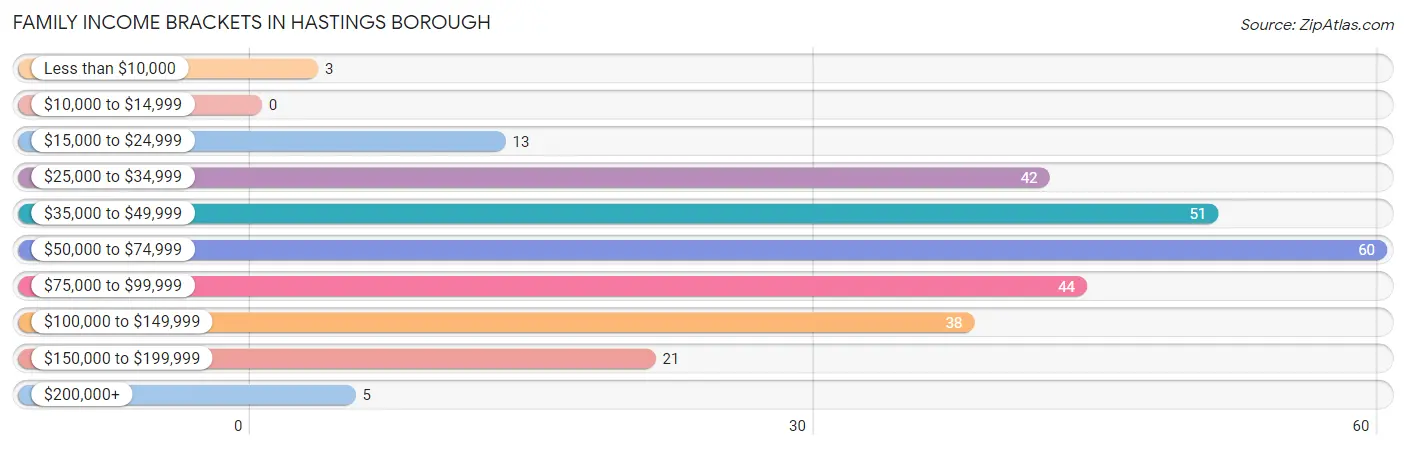
| Income Bracket | # Families | % Families |
| Less than $10,000 | 3 | 1.1% |
| $10,000 to $14,999 | 0 | 0.0% |
| $15,000 to $24,999 | 13 | 4.7% |
| $25,000 to $34,999 | 42 | 15.2% |
| $35,000 to $49,999 | 51 | 18.4% |
| $50,000 to $74,999 | 60 | 21.7% |
| $75,000 to $99,999 | 44 | 15.9% |
| $100,000 to $149,999 | 38 | 13.7% |
| $150,000 to $199,999 | 21 | 7.6% |
| $200,000+ | 5 | 1.8% |
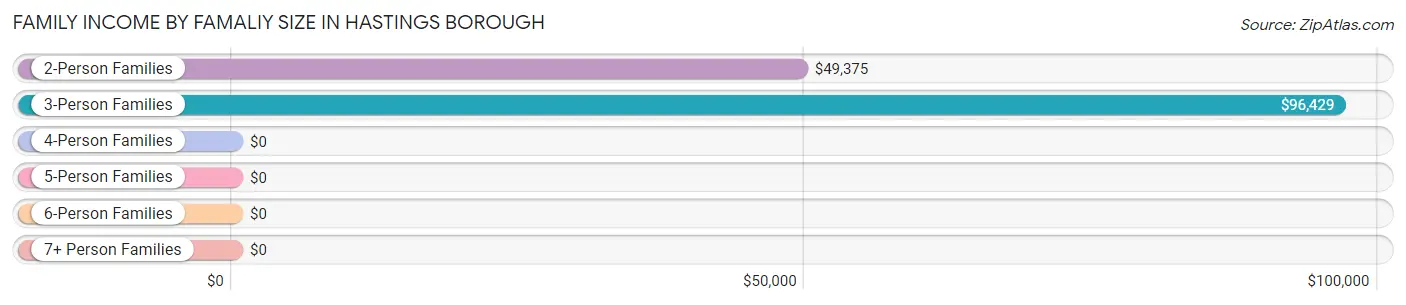
Family Income by Famaliy Size in Hastings borough
3-person families (54 | 19.5%) account for the highest median family income in Hastings borough with $96,429 per family, while 3-person families (54 | 19.5%) have the highest median income of $32,143 per family member.
| Income Bracket | # Families | Median Income |
| 2-Person Families | 155 (56.0%) | $49,375 |
| 3-Person Families | 54 (19.5%) | $96,429 |
| 4-Person Families | 52 (18.8%) | $0 |
| 5-Person Families | 7 (2.5%) | $0 |
| 6-Person Families | 2 (0.7%) | $0 |
| 7+ Person Families | 7 (2.5%) | $0 |
| Total | 277 (100.0%) | $60,469 |
Family Income by Number of Earners in Hastings borough
The median family income in Hastings borough is $60,469, with families comprising 3+ earners (54) having the highest median family income of $120,500, while families with 1 earner (72) have the lowest median family income of $32,321, accounting for 19.5% and 26.0% of families, respectively.
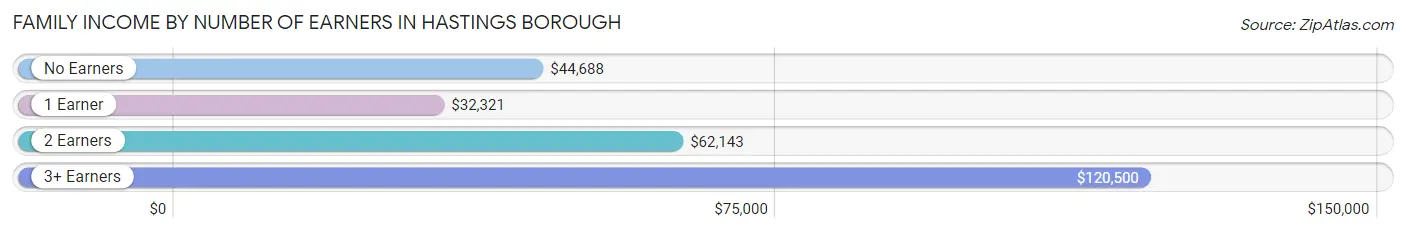
| Number of Earners | # Families | Median Income |
| No Earners | 53 (19.1%) | $44,688 |
| 1 Earner | 72 (26.0%) | $32,321 |
| 2 Earners | 98 (35.4%) | $62,143 |
| 3+ Earners | 54 (19.5%) | $120,500 |
| Total | 277 (100.0%) | $60,469 |
Household Income in Hastings borough
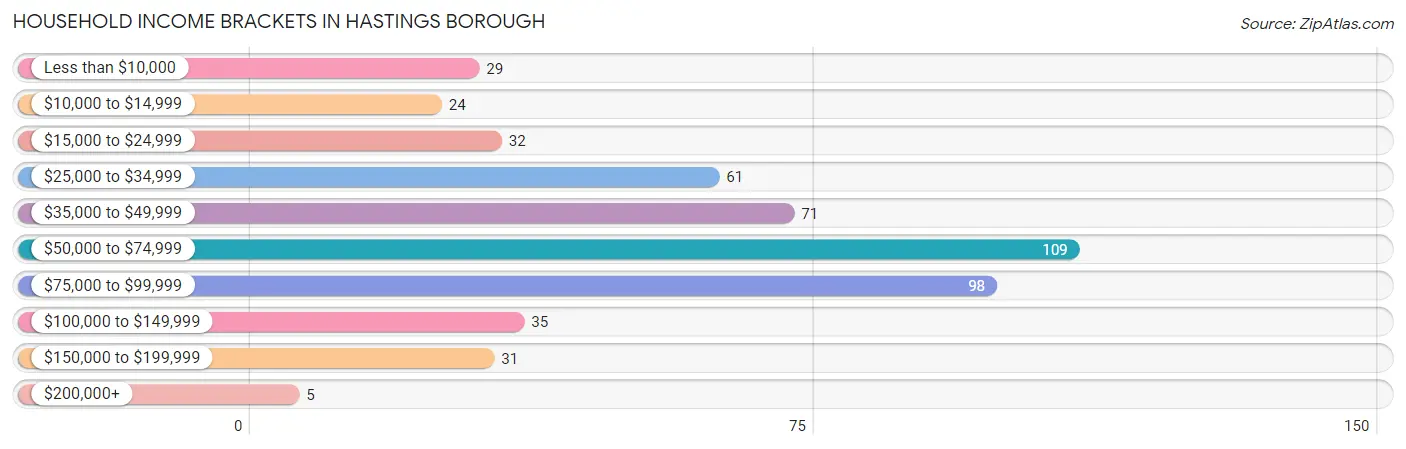
Household Income Brackets in Hastings borough
With 109 households falling in the category, the $50,000 to $74,999 income range is the most frequent in Hastings borough, accounting for 22.0% of all households. In contrast, only 5 households (1.0%) fall into the $200,000+ income bracket, making it the least populous group.
| Income Bracket | # Households | % Households |
| Less than $10,000 | 29 | 5.9% |
| $10,000 to $14,999 | 24 | 4.8% |
| $15,000 to $24,999 | 32 | 6.5% |
| $25,000 to $34,999 | 61 | 12.3% |
| $35,000 to $49,999 | 71 | 14.3% |
| $50,000 to $74,999 | 109 | 22.0% |
| $75,000 to $99,999 | 98 | 19.8% |
| $100,000 to $149,999 | 35 | 7.1% |
| $150,000 to $199,999 | 31 | 6.3% |
| $200,000+ | 5 | 1.0% |
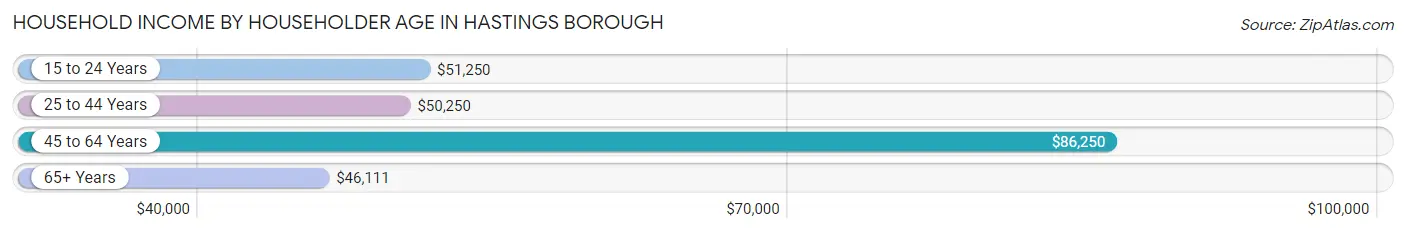
Household Income by Householder Age in Hastings borough
The median household income in Hastings borough is $56,528, with the highest median household income of $86,250 found in the 45 to 64 years age bracket for the primary householder. A total of 162 households (32.7%) fall into this category. Meanwhile, the 65+ years age bracket for the primary householder has the lowest median household income of $46,111, with 182 households (36.8%) in this group.
| Income Bracket | # Households | Median Income |
| 15 to 24 Years | 14 (2.8%) | $51,250 |
| 25 to 44 Years | 137 (27.7%) | $50,250 |
| 45 to 64 Years | 162 (32.7%) | $86,250 |
| 65+ Years | 182 (36.8%) | $46,111 |
| Total | 495 (100.0%) | $56,528 |
Poverty in Hastings borough
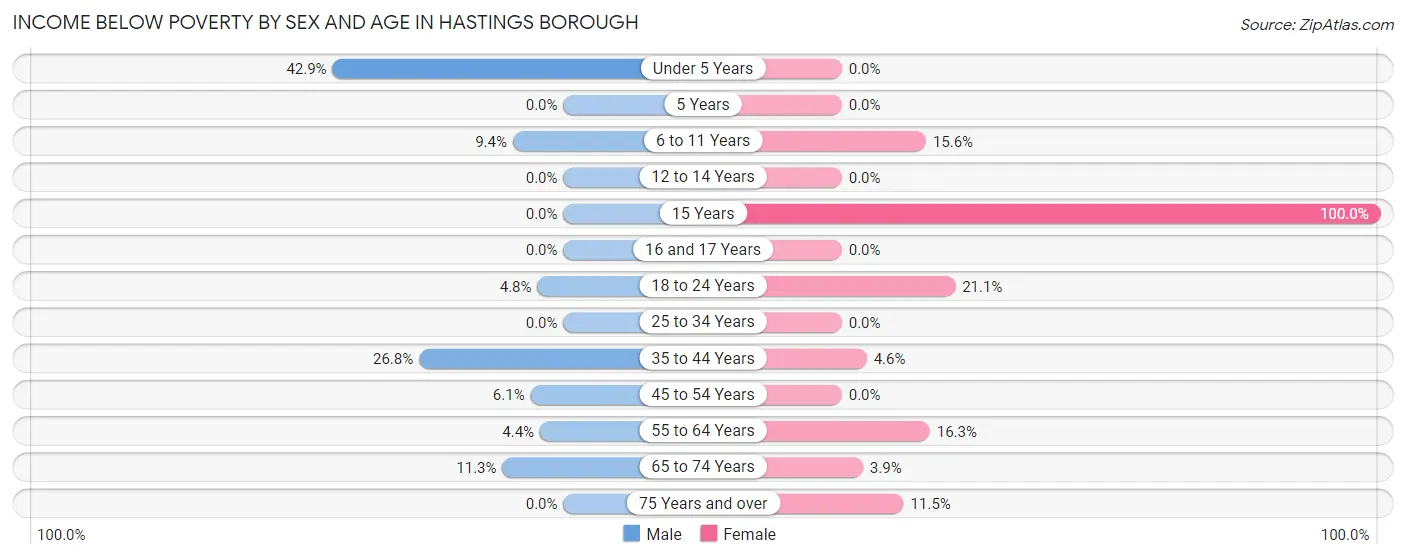
Income Below Poverty by Sex and Age in Hastings borough
With 8.3% poverty level for males and 7.7% for females among the residents of Hastings borough, under 5 year old males and 15 year old females are the most vulnerable to poverty, with 6 males (42.9%) and 3 females (100.0%) in their respective age groups living below the poverty level.
| Age Bracket | Male | Female |
| Under 5 Years | 6 (42.9%) | 0 (0.0%) |
| 5 Years | 0 (0.0%) | 0 (0.0%) |
| 6 to 11 Years | 3 (9.4%) | 5 (15.6%) |
| 12 to 14 Years | 0 (0.0%) | 0 (0.0%) |
| 15 Years | 0 (0.0%) | 3 (100.0%) |
| 16 and 17 Years | 0 (0.0%) | 0 (0.0%) |
| 18 to 24 Years | 4 (4.8%) | 12 (21.0%) |
| 25 to 34 Years | 0 (0.0%) | 0 (0.0%) |
| 35 to 44 Years | 15 (26.8%) | 3 (4.6%) |
| 45 to 54 Years | 5 (6.1%) | 0 (0.0%) |
| 55 to 64 Years | 3 (4.3%) | 8 (16.3%) |
| 65 to 74 Years | 6 (11.3%) | 4 (3.9%) |
| 75 Years and over | 0 (0.0%) | 7 (11.5%) |
| Total | 42 (8.3%) | 42 (7.7%) |
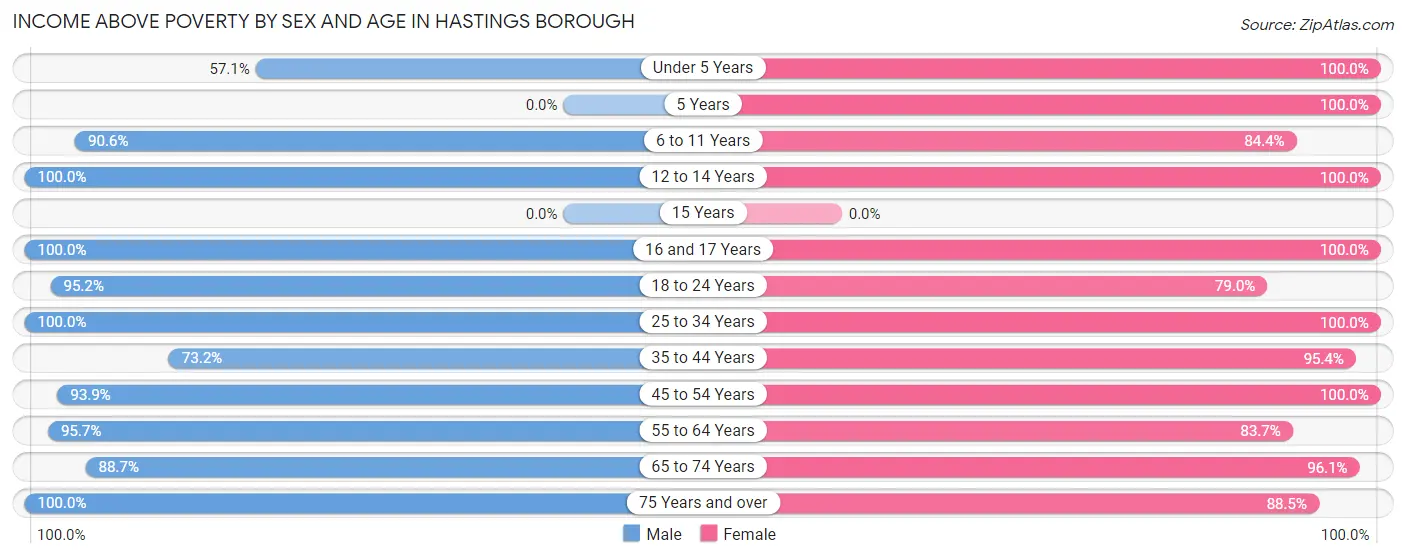
Income Above Poverty by Sex and Age in Hastings borough
According to the poverty statistics in Hastings borough, males aged 12 to 14 years and females aged under 5 years are the age groups that are most secure financially, with 100.0% of males and 100.0% of females in these age groups living above the poverty line.
| Age Bracket | Male | Female |
| Under 5 Years | 8 (57.1%) | 36 (100.0%) |
| 5 Years | 0 (0.0%) | 2 (100.0%) |
| 6 to 11 Years | 29 (90.6%) | 27 (84.4%) |
| 12 to 14 Years | 11 (100.0%) | 12 (100.0%) |
| 15 Years | 0 (0.0%) | 0 (0.0%) |
| 16 and 17 Years | 2 (100.0%) | 10 (100.0%) |
| 18 to 24 Years | 79 (95.2%) | 45 (78.9%) |
| 25 to 34 Years | 71 (100.0%) | 48 (100.0%) |
| 35 to 44 Years | 41 (73.2%) | 62 (95.4%) |
| 45 to 54 Years | 77 (93.9%) | 65 (100.0%) |
| 55 to 64 Years | 66 (95.7%) | 41 (83.7%) |
| 65 to 74 Years | 47 (88.7%) | 98 (96.1%) |
| 75 Years and over | 36 (100.0%) | 54 (88.5%) |
| Total | 467 (91.7%) | 500 (92.2%) |
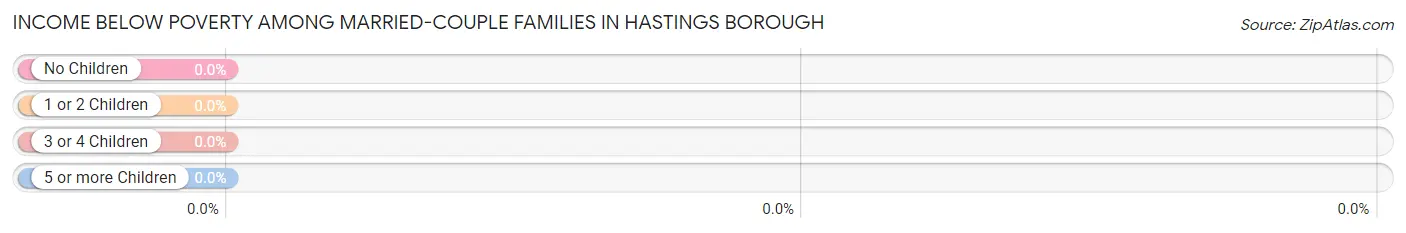
Income Below Poverty Among Married-Couple Families in Hastings borough
| Children | Above Poverty | Below Poverty |
| No Children | 153 (100.0%) | 0 (0.0%) |
| 1 or 2 Children | 39 (100.0%) | 0 (0.0%) |
| 3 or 4 Children | 12 (100.0%) | 0 (0.0%) |
| 5 or more Children | 0 (0.0%) | 0 (0.0%) |
| Total | 204 (100.0%) | 0 (0.0%) |
Income Below Poverty Among Single-Parent Households in Hastings borough
According to the poverty data in Hastings borough, 16.7% or 3 single-father households and 10.9% or 6 single-mother households are living below the poverty line. Among single-father households, those with 1 or 2 children have the highest poverty rate, with 3 households (100.0%) experiencing poverty. Likewise, among single-mother households, those with 3 or 4 children have the highest poverty rate, with 3 households (37.5%) falling below the poverty line.
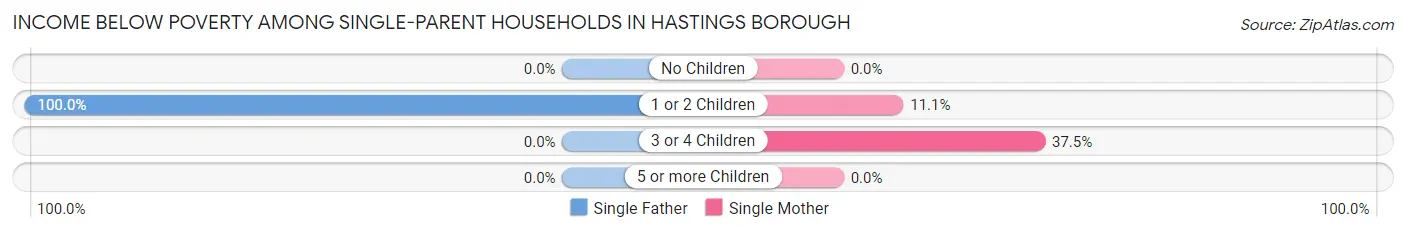
| Children | Single Father | Single Mother |
| No Children | 0 (0.0%) | 0 (0.0%) |
| 1 or 2 Children | 3 (100.0%) | 3 (11.1%) |
| 3 or 4 Children | 0 (0.0%) | 3 (37.5%) |
| 5 or more Children | 0 (0.0%) | 0 (0.0%) |
| Total | 3 (16.7%) | 6 (10.9%) |
Income Below Poverty Among Married-Couple vs Single-Parent Households in Hastings borough
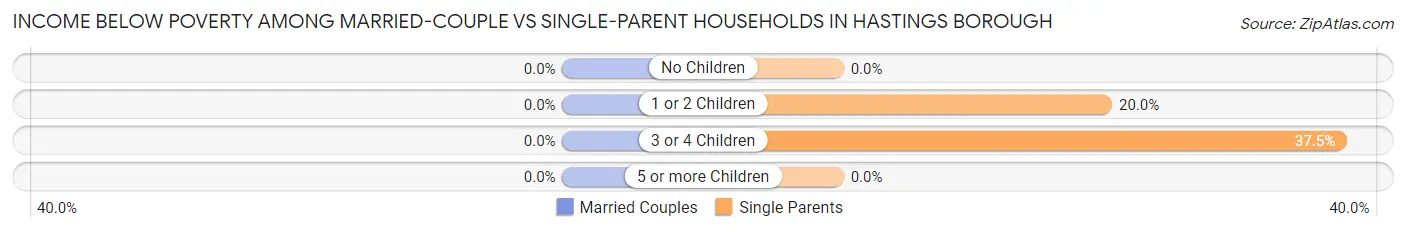
| Children | Married-Couple Families | Single-Parent Households |
| No Children | 0 (0.0%) | 0 (0.0%) |
| 1 or 2 Children | 0 (0.0%) | 6 (20.0%) |
| 3 or 4 Children | 0 (0.0%) | 3 (37.5%) |
| 5 or more Children | 0 (0.0%) | 0 (0.0%) |
| Total | 0 (0.0%) | 9 (12.3%) |
Employment Characteristics in Hastings borough
Employment by Class of Employer in Hastings borough
Among the 515 employed individuals in Hastings borough, private company employees (380 | 73.8%), not-for-profit organizations (49 | 9.5%), and local government employees (37 | 7.2%) make up the most common classes of employment.
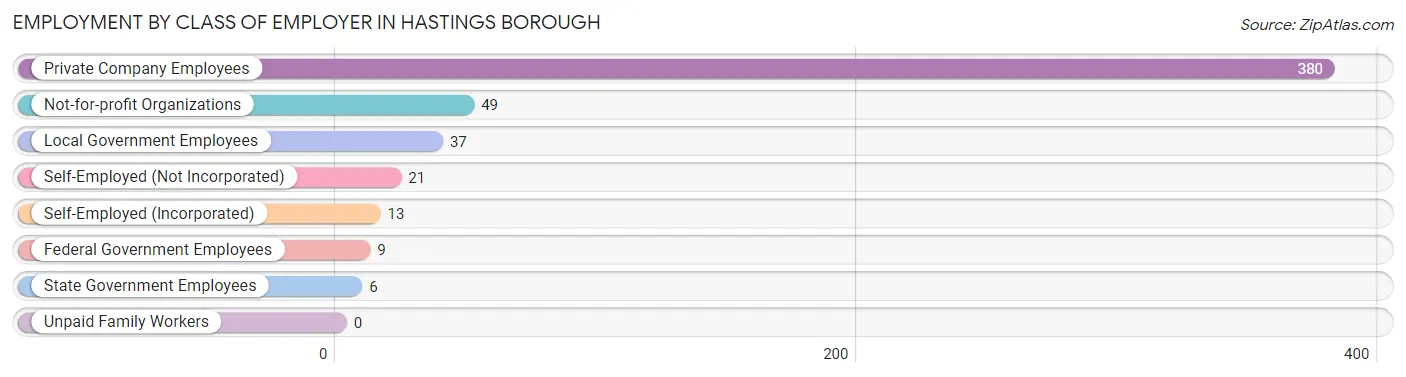
| Employer Class | # Employees | % Employees |
| Private Company Employees | 380 | 73.8% |
| Self-Employed (Incorporated) | 13 | 2.5% |
| Self-Employed (Not Incorporated) | 21 | 4.1% |
| Not-for-profit Organizations | 49 | 9.5% |
| Local Government Employees | 37 | 7.2% |
| State Government Employees | 6 | 1.2% |
| Federal Government Employees | 9 | 1.8% |
| Unpaid Family Workers | 0 | 0.0% |
| Total | 515 | 100.0% |
Employment Status by Age in Hastings borough
According to the labor force statistics for Hastings borough, out of the total population over 16 years of age (909), 58.9% or 535 individuals are in the labor force, with 2.6% or 14 of them unemployed. The age group with the highest labor force participation rate is 25 to 29 years, with 100.0% or 72 individuals in the labor force. Within the labor force, the 16 to 19 years age range has the highest percentage of unemployed individuals, with 32.0% or 8 of them being unemployed.
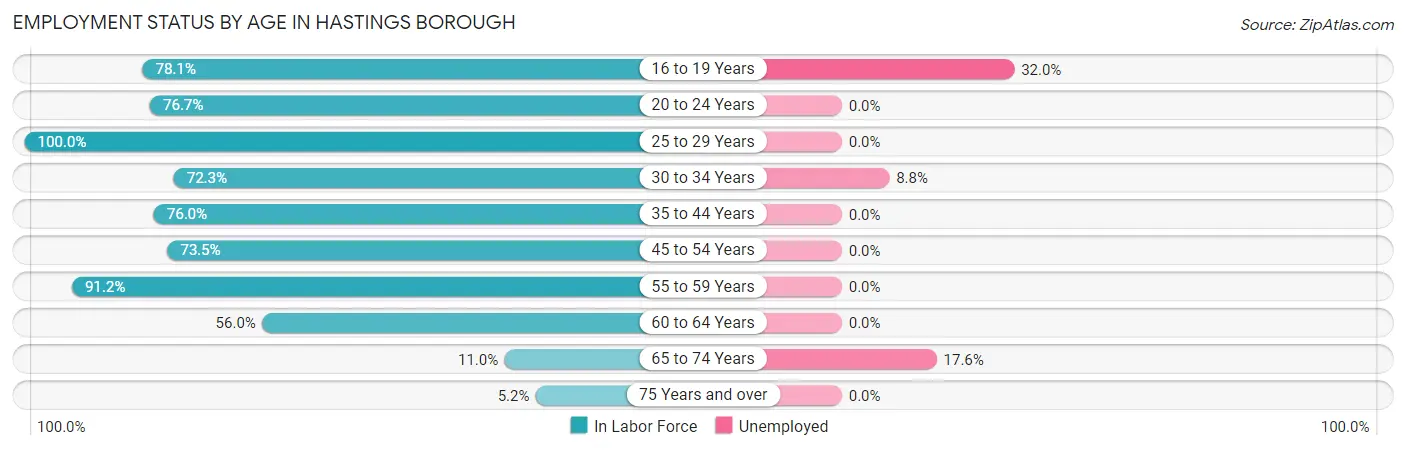
| Age Bracket | In Labor Force | Unemployed |
| 16 to 19 Years | 25 (78.1%) | 8 (32.0%) |
| 20 to 24 Years | 92 (76.7%) | 0 (0.0%) |
| 25 to 29 Years | 72 (100.0%) | 0 (0.0%) |
| 30 to 34 Years | 34 (72.3%) | 3 (8.8%) |
| 35 to 44 Years | 92 (76.0%) | 0 (0.0%) |
| 45 to 54 Years | 108 (73.5%) | 0 (0.0%) |
| 55 to 59 Years | 62 (91.2%) | 0 (0.0%) |
| 60 to 64 Years | 28 (56.0%) | 0 (0.0%) |
| 65 to 74 Years | 17 (11.0%) | 3 (17.6%) |
| 75 Years and over | 5 (5.2%) | 0 (0.0%) |
| Total | 535 (58.9%) | 14 (2.6%) |
Employment Status by Educational Attainment in Hastings borough
According to labor force statistics for Hastings borough, 78.4% of individuals (396) out of the total population between 25 and 64 years of age (505) are in the labor force, with 0.8% or 3 of them being unemployed. The group with the highest labor force participation rate are those with the educational attainment of bachelor's degree or higher, with 91.2% or 83 individuals in the labor force. Within the labor force, individuals with college / associate degree education have the highest percentage of unemployment, with 2.6% or 3 of them being unemployed.
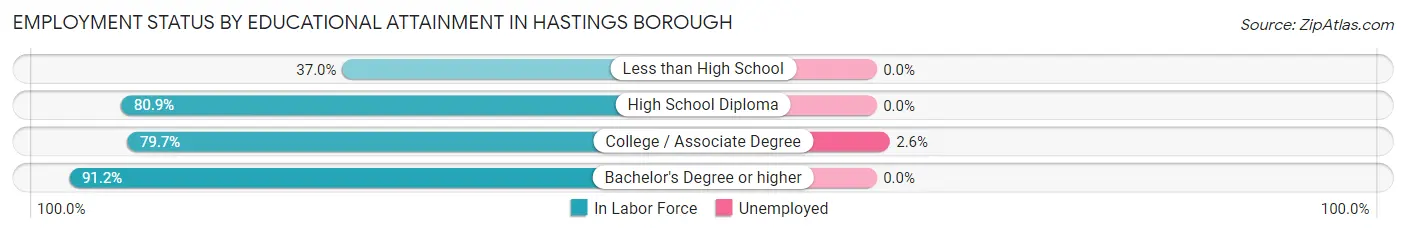
| Educational Attainment | In Labor Force | Unemployed |
| Less than High School | 17 (37.0%) | 0 (0.0%) |
| High School Diploma | 182 (80.9%) | 0 (0.0%) |
| College / Associate Degree | 114 (79.7%) | 4 (2.6%) |
| Bachelor's Degree or higher | 83 (91.2%) | 0 (0.0%) |
| Total | 396 (78.4%) | 4 (0.8%) |
Employment Occupations by Sex in Hastings borough
Management, Business, Science and Arts Occupations
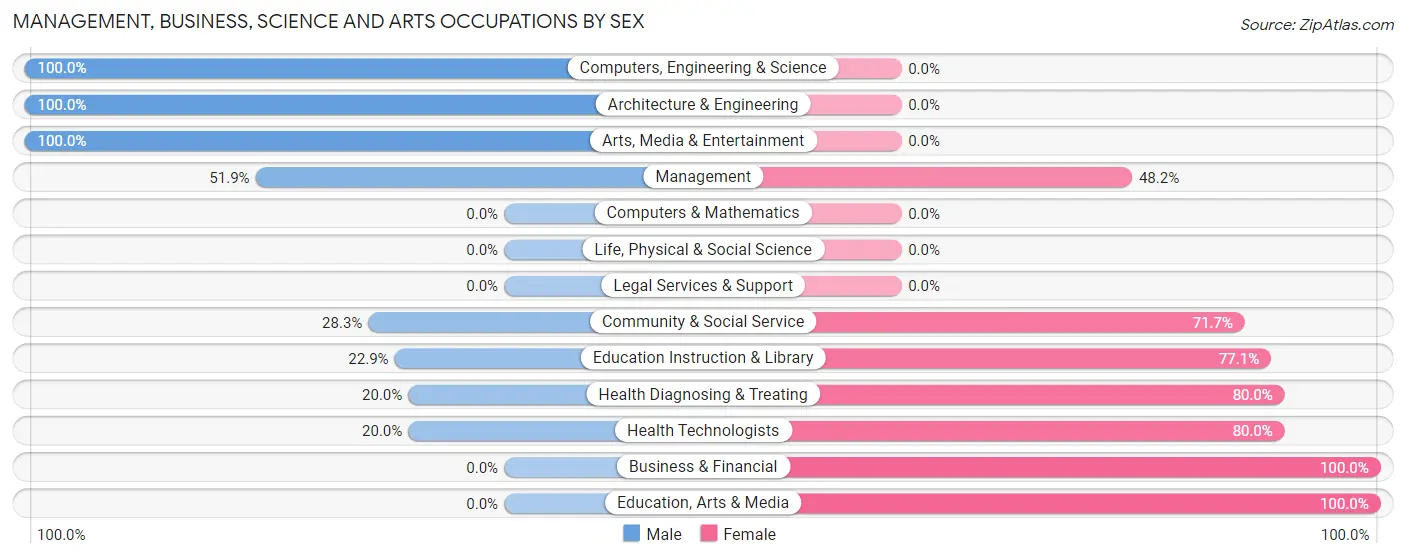
The most common Management, Business, Science and Arts occupations in Hastings borough are Community & Social Service (60 | 11.5%), Education Instruction & Library (35 | 6.7%), Management (27 | 5.2%), Health Diagnosing & Treating (25 | 4.8%), and Health Technologists (25 | 4.8%).
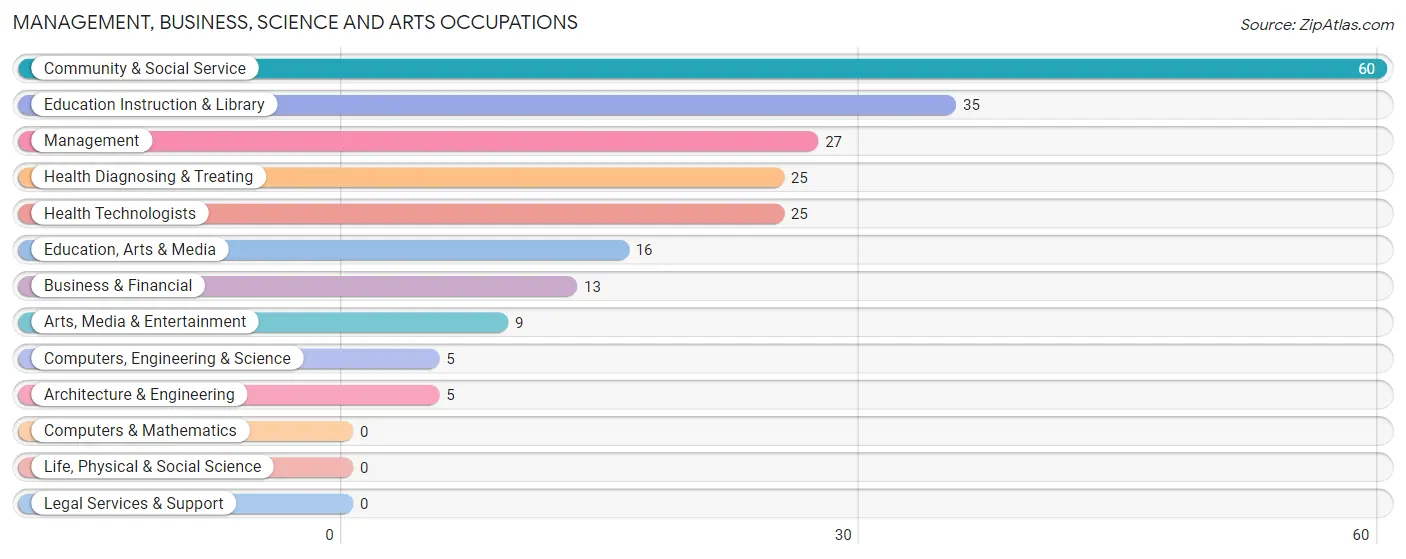
Management, Business, Science and Arts Occupations by Sex
Within the Management, Business, Science and Arts occupations in Hastings borough, the most male-oriented occupations are Computers, Engineering & Science (100.0%), Architecture & Engineering (100.0%), and Arts, Media & Entertainment (100.0%), while the most female-oriented occupations are Business & Financial (100.0%), Education, Arts & Media (100.0%), and Health Diagnosing & Treating (80.0%).
| Occupation | Male | Female |
| Management | 14 (51.8%) | 13 (48.1%) |
| Business & Financial | 0 (0.0%) | 13 (100.0%) |
| Computers, Engineering & Science | 5 (100.0%) | 0 (0.0%) |
| Computers & Mathematics | 0 (0.0%) | 0 (0.0%) |
| Architecture & Engineering | 5 (100.0%) | 0 (0.0%) |
| Life, Physical & Social Science | 0 (0.0%) | 0 (0.0%) |
| Community & Social Service | 17 (28.3%) | 43 (71.7%) |
| Education, Arts & Media | 0 (0.0%) | 16 (100.0%) |
| Legal Services & Support | 0 (0.0%) | 0 (0.0%) |
| Education Instruction & Library | 8 (22.9%) | 27 (77.1%) |
| Arts, Media & Entertainment | 9 (100.0%) | 0 (0.0%) |
| Health Diagnosing & Treating | 5 (20.0%) | 20 (80.0%) |
| Health Technologists | 5 (20.0%) | 20 (80.0%) |
| Total (Category) | 41 (31.5%) | 89 (68.5%) |
| Total (Overall) | 295 (56.6%) | 226 (43.4%) |
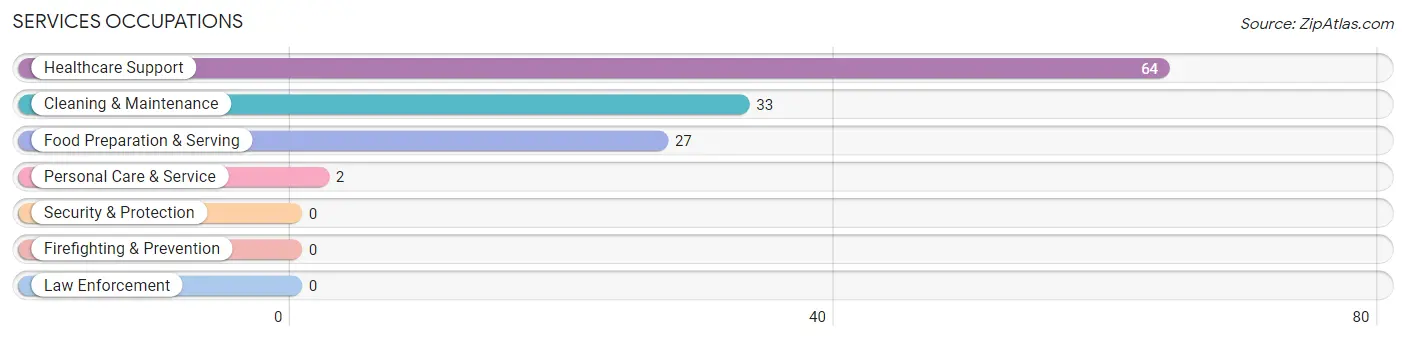
Services Occupations
The most common Services occupations in Hastings borough are Healthcare Support (64 | 12.3%), Cleaning & Maintenance (33 | 6.3%), Food Preparation & Serving (27 | 5.2%), and Personal Care & Service (2 | 0.4%).
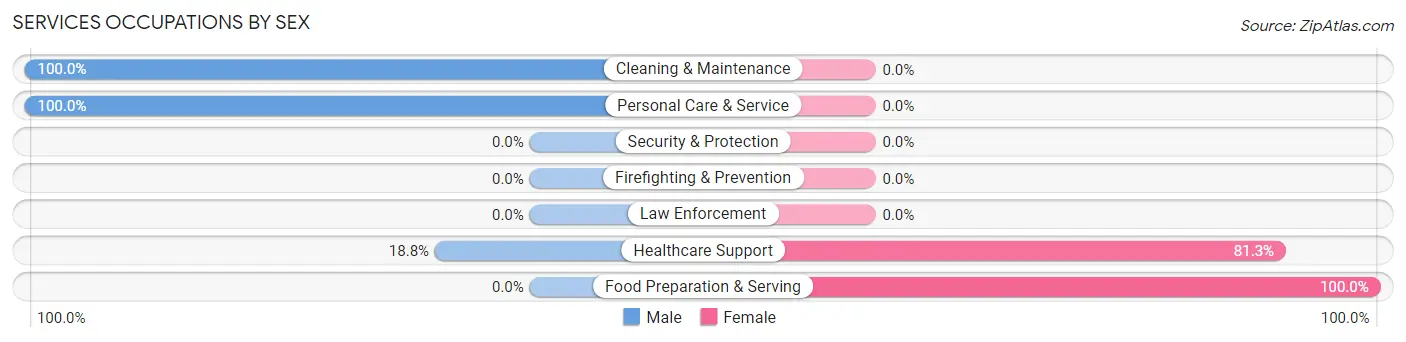
Services Occupations by Sex
Within the Services occupations in Hastings borough, the most male-oriented occupations are Cleaning & Maintenance (100.0%), Personal Care & Service (100.0%), and Healthcare Support (18.8%), while the most female-oriented occupations are Food Preparation & Serving (100.0%), and Healthcare Support (81.2%).
| Occupation | Male | Female |
| Healthcare Support | 12 (18.8%) | 52 (81.2%) |
| Security & Protection | 0 (0.0%) | 0 (0.0%) |
| Firefighting & Prevention | 0 (0.0%) | 0 (0.0%) |
| Law Enforcement | 0 (0.0%) | 0 (0.0%) |
| Food Preparation & Serving | 0 (0.0%) | 27 (100.0%) |
| Cleaning & Maintenance | 33 (100.0%) | 0 (0.0%) |
| Personal Care & Service | 2 (100.0%) | 0 (0.0%) |
| Total (Category) | 47 (37.3%) | 79 (62.7%) |
| Total (Overall) | 295 (56.6%) | 226 (43.4%) |
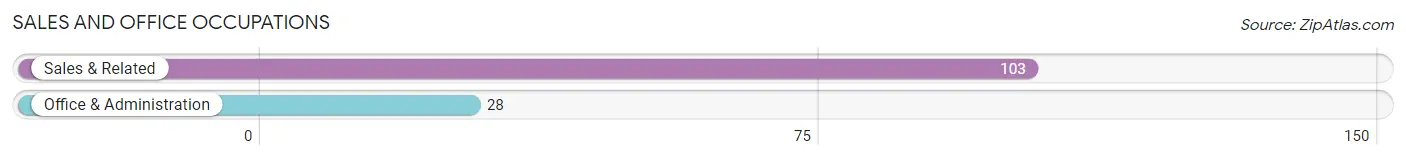
Sales and Office Occupations
The most common Sales and Office occupations in Hastings borough are Sales & Related (103 | 19.8%), and Office & Administration (28 | 5.4%).
Sales and Office Occupations by Sex
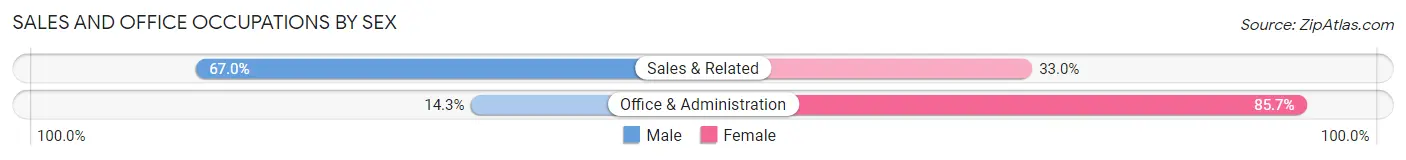
| Occupation | Male | Female |
| Sales & Related | 69 (67.0%) | 34 (33.0%) |
| Office & Administration | 4 (14.3%) | 24 (85.7%) |
| Total (Category) | 73 (55.7%) | 58 (44.3%) |
| Total (Overall) | 295 (56.6%) | 226 (43.4%) |
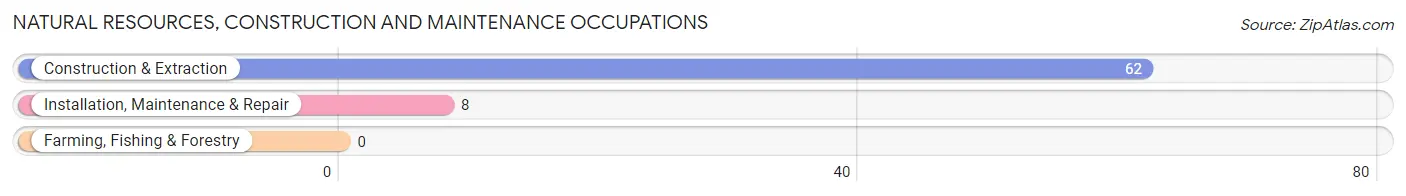
Natural Resources, Construction and Maintenance Occupations
The most common Natural Resources, Construction and Maintenance occupations in Hastings borough are Construction & Extraction (62 | 11.9%), and Installation, Maintenance & Repair (8 | 1.5%).
Natural Resources, Construction and Maintenance Occupations by Sex
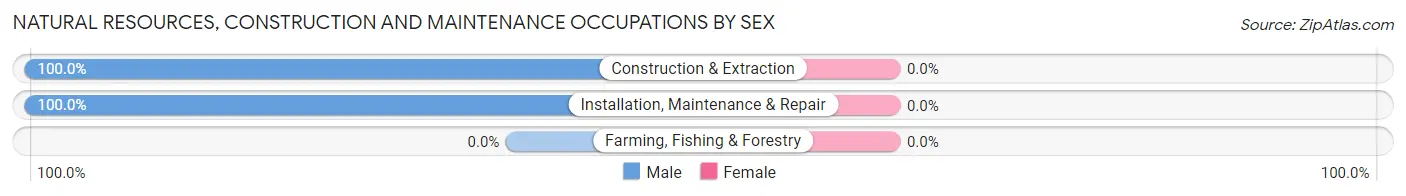
| Occupation | Male | Female |
| Farming, Fishing & Forestry | 0 (0.0%) | 0 (0.0%) |
| Construction & Extraction | 62 (100.0%) | 0 (0.0%) |
| Installation, Maintenance & Repair | 8 (100.0%) | 0 (0.0%) |
| Total (Category) | 70 (100.0%) | 0 (0.0%) |
| Total (Overall) | 295 (56.6%) | 226 (43.4%) |
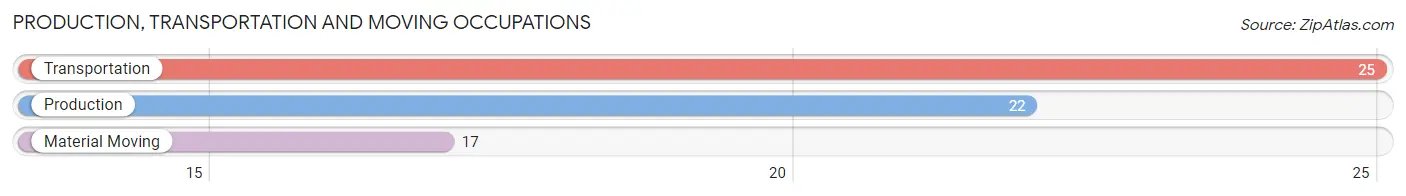
Production, Transportation and Moving Occupations
The most common Production, Transportation and Moving occupations in Hastings borough are Transportation (25 | 4.8%), Production (22 | 4.2%), and Material Moving (17 | 3.3%).
Production, Transportation and Moving Occupations by Sex
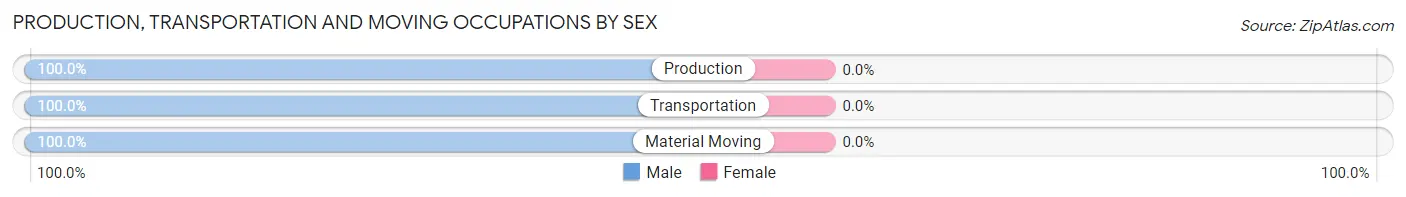
| Occupation | Male | Female |
| Production | 22 (100.0%) | 0 (0.0%) |
| Transportation | 25 (100.0%) | 0 (0.0%) |
| Material Moving | 17 (100.0%) | 0 (0.0%) |
| Total (Category) | 64 (100.0%) | 0 (0.0%) |
| Total (Overall) | 295 (56.6%) | 226 (43.4%) |
Employment Industries by Sex in Hastings borough
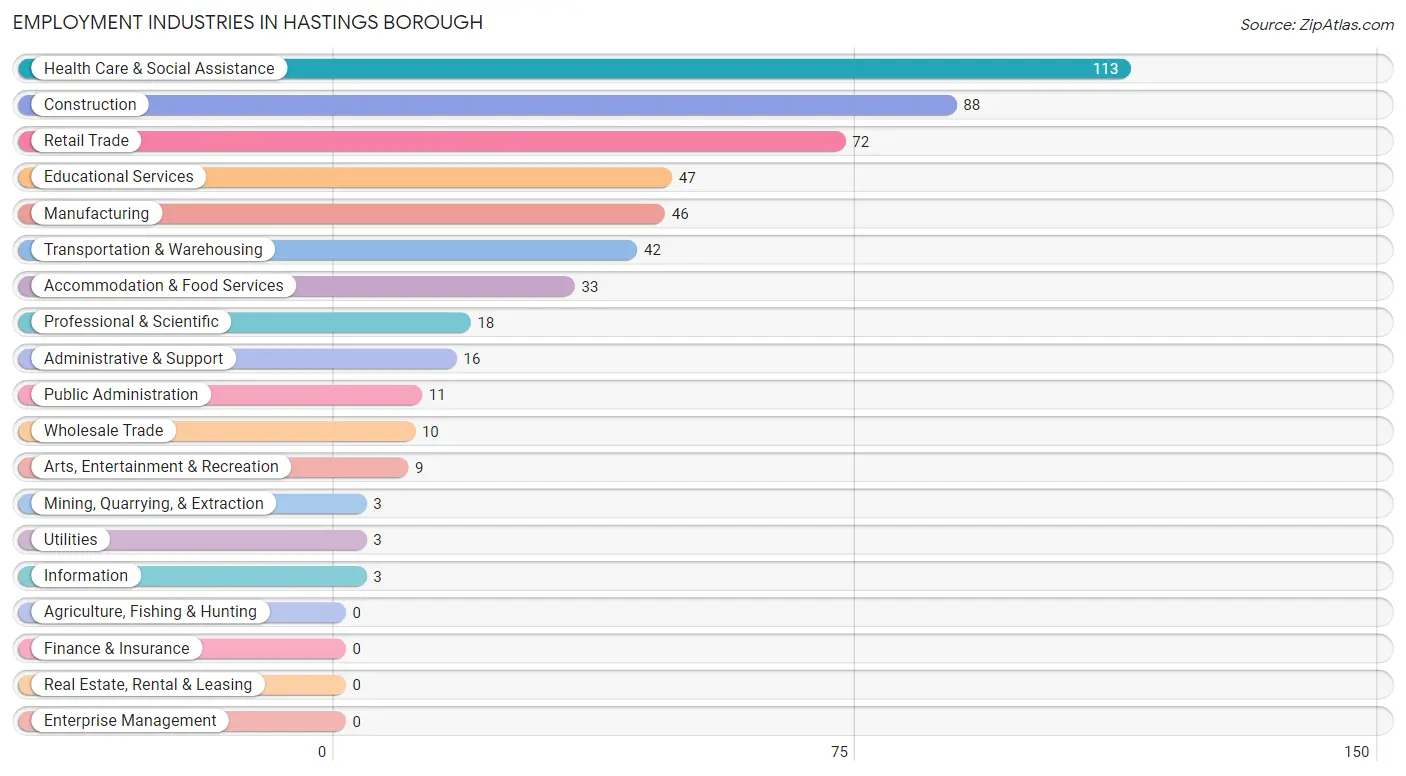
Employment Industries in Hastings borough
The major employment industries in Hastings borough include Health Care & Social Assistance (113 | 21.7%), Construction (88 | 16.9%), Retail Trade (72 | 13.8%), Educational Services (47 | 9.0%), and Manufacturing (46 | 8.8%).
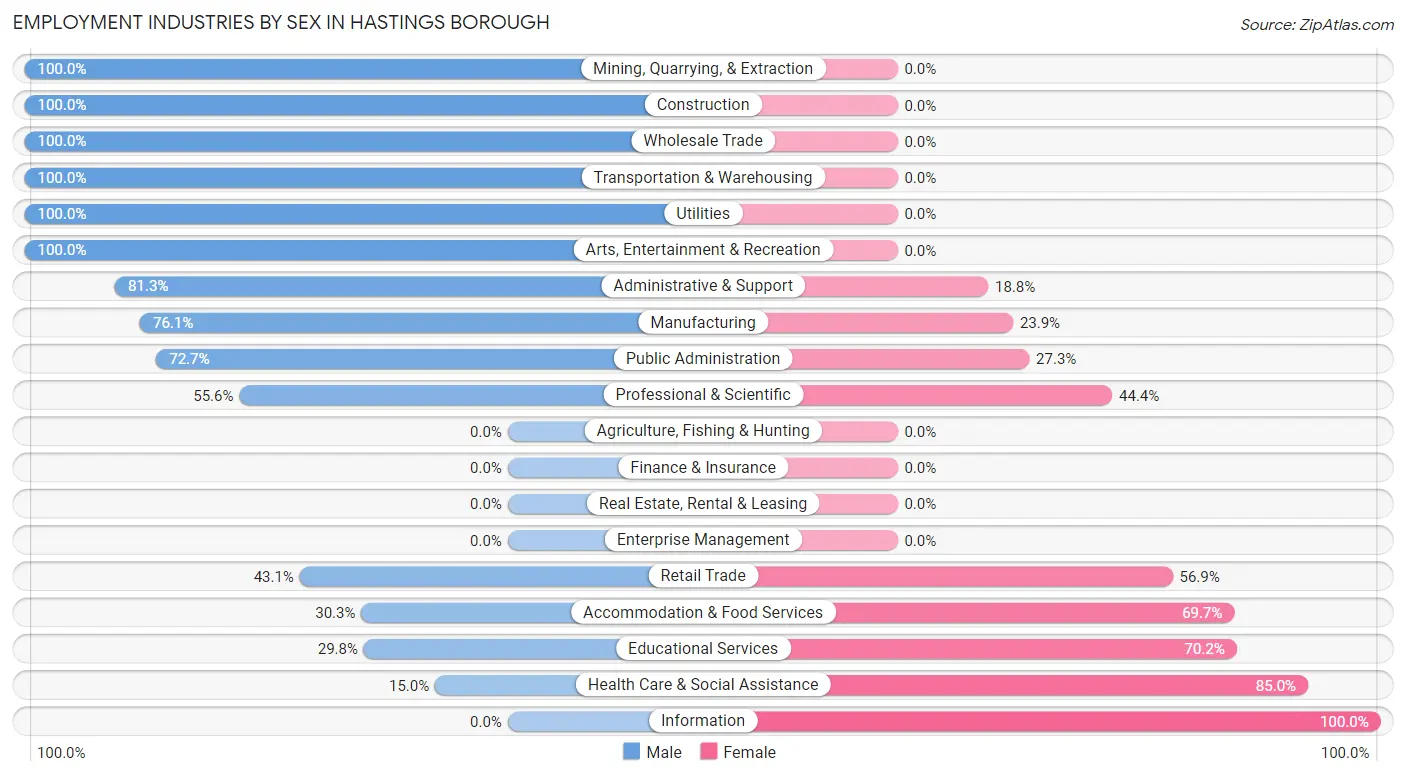
Employment Industries by Sex in Hastings borough
The Hastings borough industries that see more men than women are Mining, Quarrying, & Extraction (100.0%), Construction (100.0%), and Wholesale Trade (100.0%), whereas the industries that tend to have a higher number of women are Information (100.0%), Health Care & Social Assistance (85.0%), and Educational Services (70.2%).
| Industry | Male | Female |
| Agriculture, Fishing & Hunting | 0 (0.0%) | 0 (0.0%) |
| Mining, Quarrying, & Extraction | 3 (100.0%) | 0 (0.0%) |
| Construction | 88 (100.0%) | 0 (0.0%) |
| Manufacturing | 35 (76.1%) | 11 (23.9%) |
| Wholesale Trade | 10 (100.0%) | 0 (0.0%) |
| Retail Trade | 31 (43.1%) | 41 (56.9%) |
| Transportation & Warehousing | 42 (100.0%) | 0 (0.0%) |
| Utilities | 3 (100.0%) | 0 (0.0%) |
| Information | 0 (0.0%) | 3 (100.0%) |
| Finance & Insurance | 0 (0.0%) | 0 (0.0%) |
| Real Estate, Rental & Leasing | 0 (0.0%) | 0 (0.0%) |
| Professional & Scientific | 10 (55.6%) | 8 (44.4%) |
| Enterprise Management | 0 (0.0%) | 0 (0.0%) |
| Administrative & Support | 13 (81.2%) | 3 (18.8%) |
| Educational Services | 14 (29.8%) | 33 (70.2%) |
| Health Care & Social Assistance | 17 (15.0%) | 96 (85.0%) |
| Arts, Entertainment & Recreation | 9 (100.0%) | 0 (0.0%) |
| Accommodation & Food Services | 10 (30.3%) | 23 (69.7%) |
| Public Administration | 8 (72.7%) | 3 (27.3%) |
| Total | 295 (56.6%) | 226 (43.4%) |
Education in Hastings borough
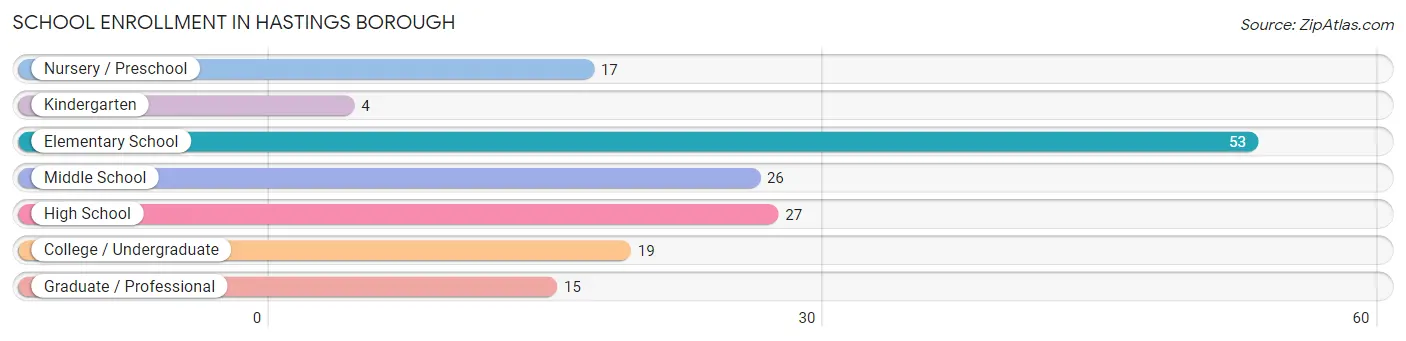
School Enrollment in Hastings borough
The most common levels of schooling among the 161 students in Hastings borough are elementary school (53 | 32.9%), high school (27 | 16.8%), and middle school (26 | 16.2%).
| School Level | # Students | % Students |
| Nursery / Preschool | 17 | 10.6% |
| Kindergarten | 4 | 2.5% |
| Elementary School | 53 | 32.9% |
| Middle School | 26 | 16.2% |
| High School | 27 | 16.8% |
| College / Undergraduate | 19 | 11.8% |
| Graduate / Professional | 15 | 9.3% |
| Total | 161 | 100.0% |
School Enrollment by Age by Funding Source in Hastings borough
Out of a total of 161 students who are enrolled in schools in Hastings borough, 44 (27.3%) attend a private institution, while the remaining 117 (72.7%) are enrolled in public schools. The age group of 20 to 24 year olds has the highest likelihood of being enrolled in private schools, with 12 (100.0% in the age bracket) enrolled. Conversely, the age group of 18 to 19 year olds has the lowest likelihood of being enrolled in a private school, with 8 (100.0% in the age bracket) attending a public institution.
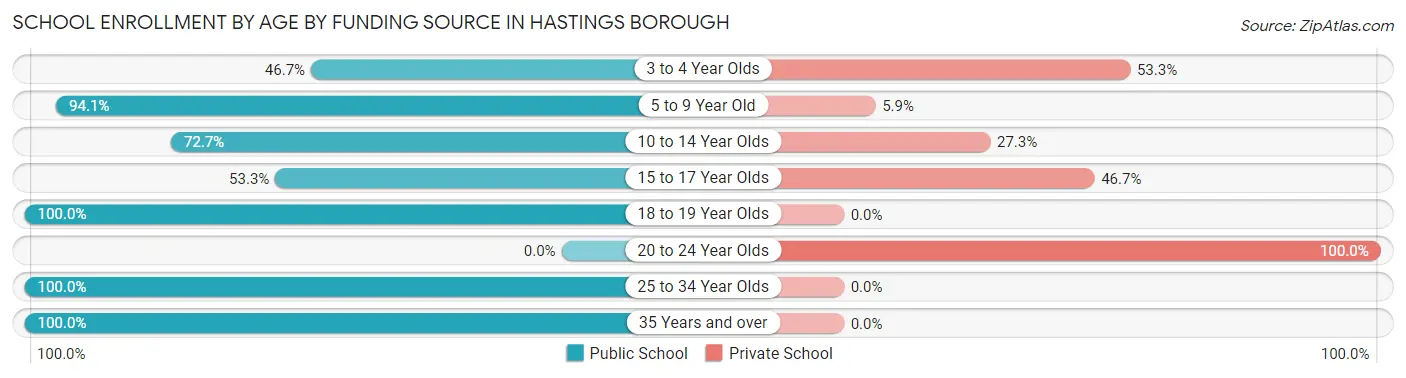
| Age Bracket | Public School | Private School |
| 3 to 4 Year Olds | 7 (46.7%) | 8 (53.3%) |
| 5 to 9 Year Old | 32 (94.1%) | 2 (5.9%) |
| 10 to 14 Year Olds | 40 (72.7%) | 15 (27.3%) |
| 15 to 17 Year Olds | 8 (53.3%) | 7 (46.7%) |
| 18 to 19 Year Olds | 8 (100.0%) | 0 (0.0%) |
| 20 to 24 Year Olds | 0 (0.0%) | 12 (100.0%) |
| 25 to 34 Year Olds | 6 (100.0%) | 0 (0.0%) |
| 35 Years and over | 16 (100.0%) | 0 (0.0%) |
| Total | 117 (72.7%) | 44 (27.3%) |
Educational Attainment by Field of Study in Hastings borough
Education (39 | 31.7%), business (26 | 21.1%), science & technology (18 | 14.6%), literature & languages (11 | 8.9%), and bio, nature & agricultural (9 | 7.3%) are the most common fields of study among 123 individuals in Hastings borough who have obtained a bachelor's degree or higher.
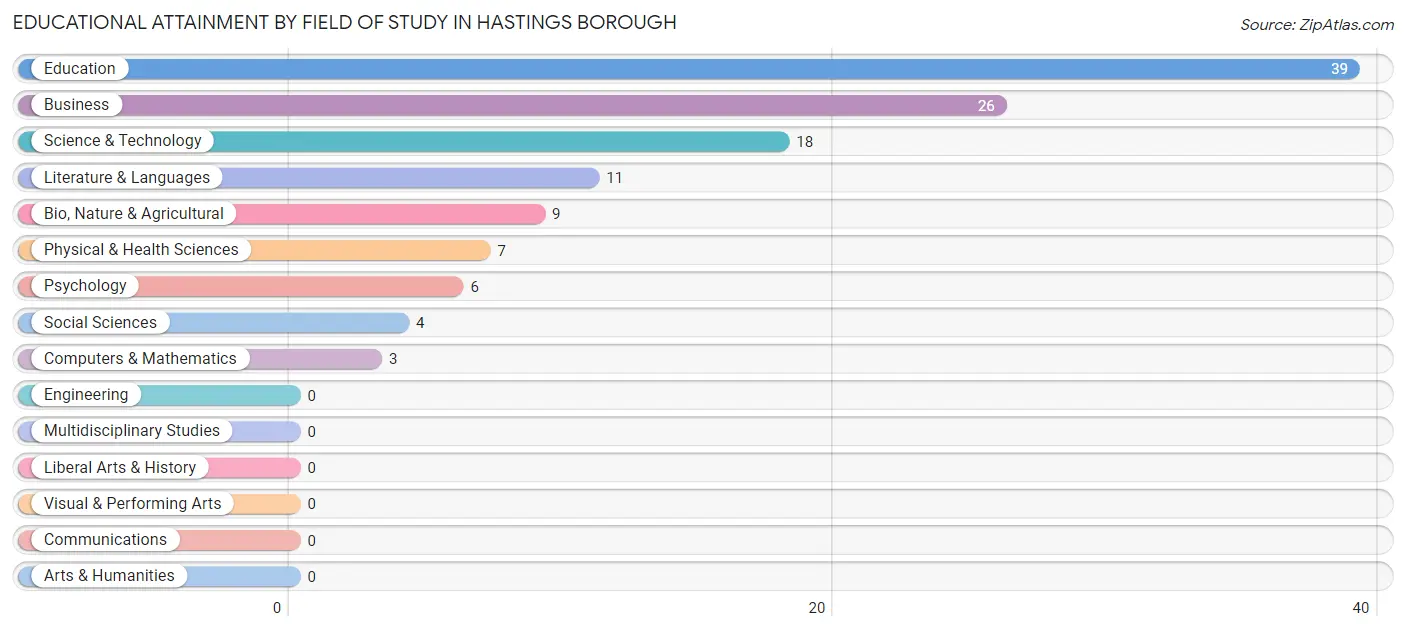
| Field of Study | # Graduates | % Graduates |
| Computers & Mathematics | 3 | 2.4% |
| Bio, Nature & Agricultural | 9 | 7.3% |
| Physical & Health Sciences | 7 | 5.7% |
| Psychology | 6 | 4.9% |
| Social Sciences | 4 | 3.3% |
| Engineering | 0 | 0.0% |
| Multidisciplinary Studies | 0 | 0.0% |
| Science & Technology | 18 | 14.6% |
| Business | 26 | 21.1% |
| Education | 39 | 31.7% |
| Literature & Languages | 11 | 8.9% |
| Liberal Arts & History | 0 | 0.0% |
| Visual & Performing Arts | 0 | 0.0% |
| Communications | 0 | 0.0% |
| Arts & Humanities | 0 | 0.0% |
| Total | 123 | 100.0% |
Transportation & Commute in Hastings borough
Vehicle Availability by Sex in Hastings borough
The most prevalent vehicle ownership categories in Hastings borough are males with 2 vehicles (106, accounting for 36.3%) and females with 2 vehicles (76, making up 47.5%).
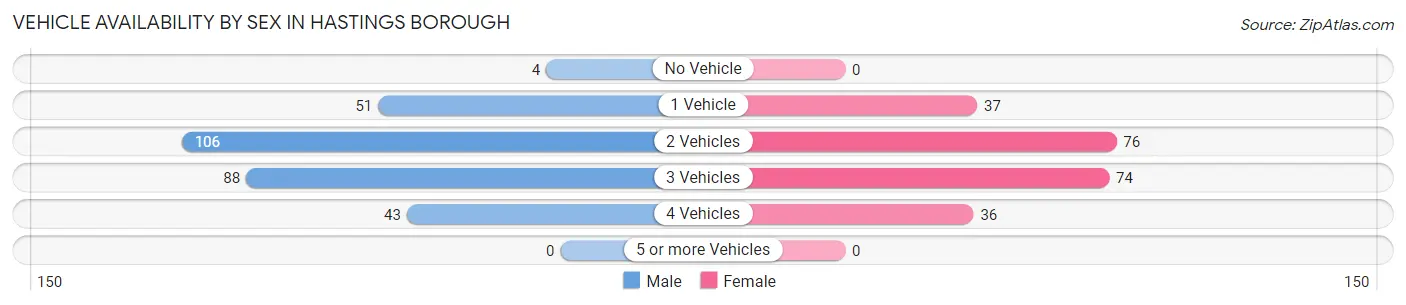
| Vehicles Available | Male | Female |
| No Vehicle | 4 (1.4%) | 0 (0.0%) |
| 1 Vehicle | 51 (17.5%) | 37 (16.6%) |
| 2 Vehicles | 106 (36.3%) | 76 (34.1%) |
| 3 Vehicles | 88 (30.1%) | 74 (33.2%) |
| 4 Vehicles | 43 (14.7%) | 36 (16.1%) |
| 5 or more Vehicles | 0 (0.0%) | 0 (0.0%) |
| Total | 292 (100.0%) | 223 (100.0%) |
Commute Time in Hastings borough
The most frequently occuring commute durations in Hastings borough are 10 to 14 minutes (97 commuters, 20.1%), 35 to 39 minutes (77 commuters, 16.0%), and 45 to 59 minutes (64 commuters, 13.3%).
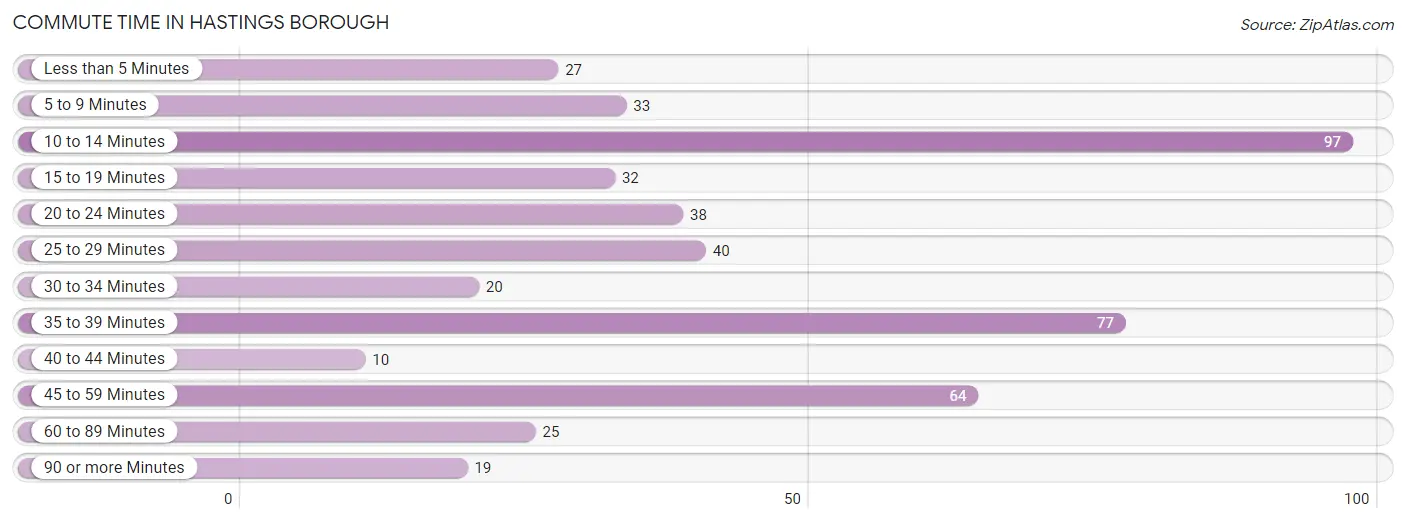
| Commute Time | # Commuters | % Commuters |
| Less than 5 Minutes | 27 | 5.6% |
| 5 to 9 Minutes | 33 | 6.9% |
| 10 to 14 Minutes | 97 | 20.1% |
| 15 to 19 Minutes | 32 | 6.6% |
| 20 to 24 Minutes | 38 | 7.9% |
| 25 to 29 Minutes | 40 | 8.3% |
| 30 to 34 Minutes | 20 | 4.2% |
| 35 to 39 Minutes | 77 | 16.0% |
| 40 to 44 Minutes | 10 | 2.1% |
| 45 to 59 Minutes | 64 | 13.3% |
| 60 to 89 Minutes | 25 | 5.2% |
| 90 or more Minutes | 19 | 3.9% |
Commute Time by Sex in Hastings borough
The most common commute times in Hastings borough are 35 to 39 minutes (69 commuters, 24.5%) for males and 10 to 14 minutes (55 commuters, 27.5%) for females.
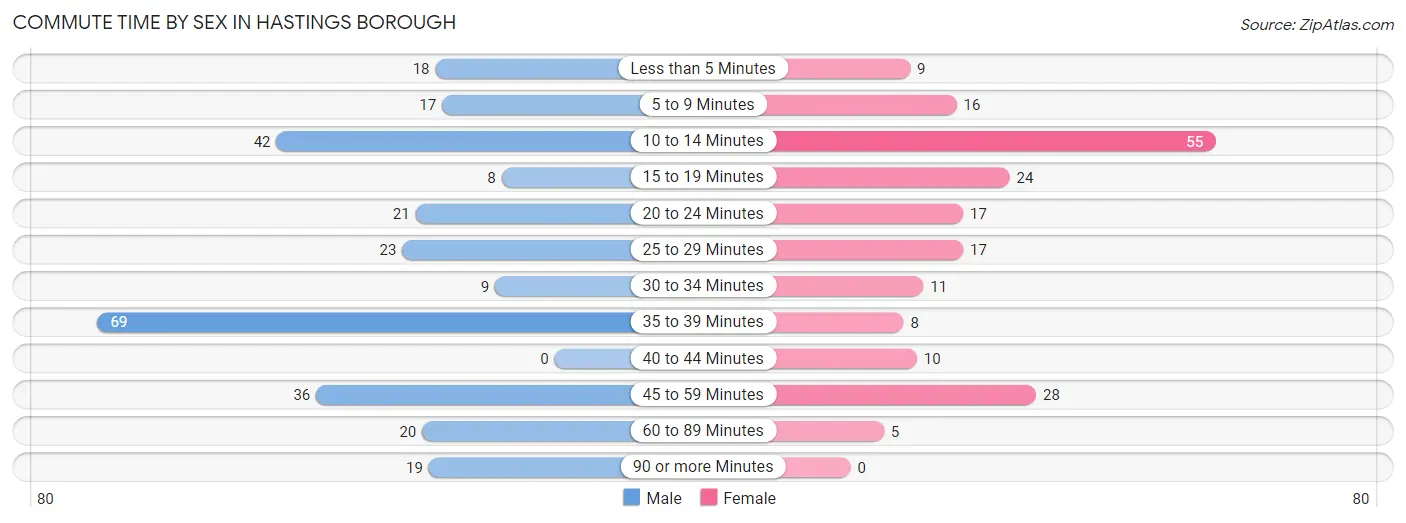
| Commute Time | Male | Female |
| Less than 5 Minutes | 18 (6.4%) | 9 (4.5%) |
| 5 to 9 Minutes | 17 (6.0%) | 16 (8.0%) |
| 10 to 14 Minutes | 42 (14.9%) | 55 (27.5%) |
| 15 to 19 Minutes | 8 (2.8%) | 24 (12.0%) |
| 20 to 24 Minutes | 21 (7.4%) | 17 (8.5%) |
| 25 to 29 Minutes | 23 (8.2%) | 17 (8.5%) |
| 30 to 34 Minutes | 9 (3.2%) | 11 (5.5%) |
| 35 to 39 Minutes | 69 (24.5%) | 8 (4.0%) |
| 40 to 44 Minutes | 0 (0.0%) | 10 (5.0%) |
| 45 to 59 Minutes | 36 (12.8%) | 28 (14.0%) |
| 60 to 89 Minutes | 20 (7.1%) | 5 (2.5%) |
| 90 or more Minutes | 19 (6.7%) | 0 (0.0%) |
Time of Departure to Work by Sex in Hastings borough
The most frequent times of departure to work in Hastings borough are 9:00 AM to 9:59 AM (78, 27.7%) for males and 7:00 AM to 7:29 AM (58, 29.0%) for females.
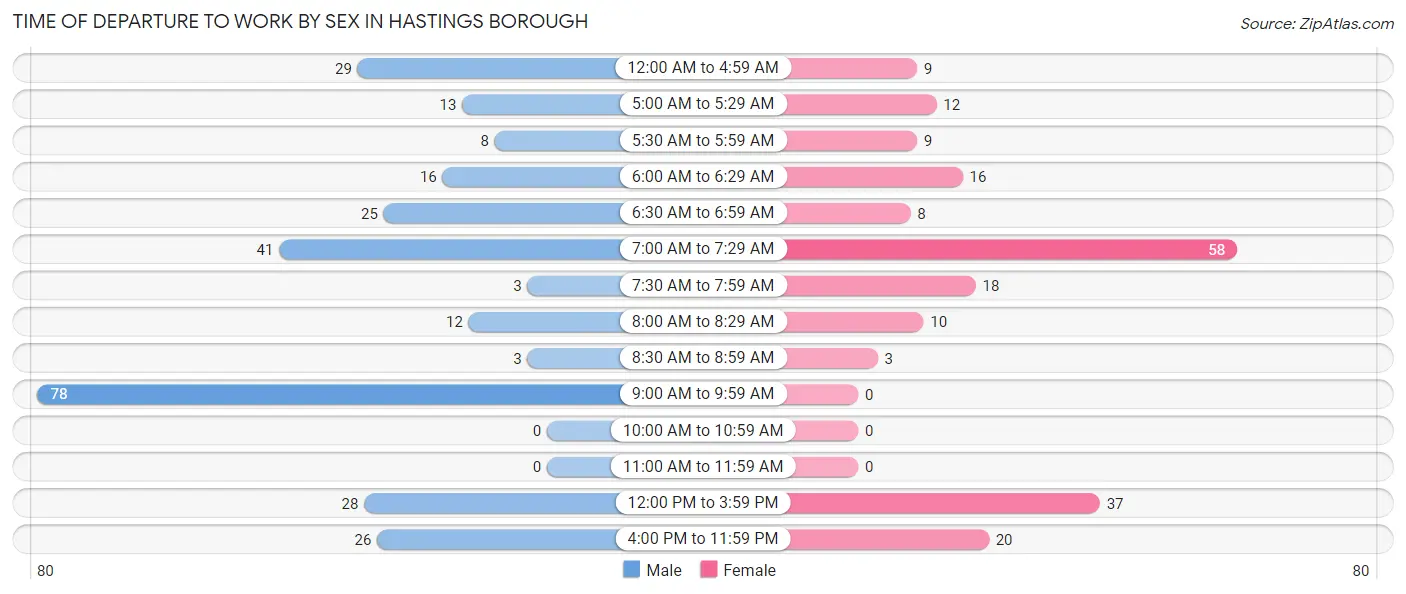
| Time of Departure | Male | Female |
| 12:00 AM to 4:59 AM | 29 (10.3%) | 9 (4.5%) |
| 5:00 AM to 5:29 AM | 13 (4.6%) | 12 (6.0%) |
| 5:30 AM to 5:59 AM | 8 (2.8%) | 9 (4.5%) |
| 6:00 AM to 6:29 AM | 16 (5.7%) | 16 (8.0%) |
| 6:30 AM to 6:59 AM | 25 (8.9%) | 8 (4.0%) |
| 7:00 AM to 7:29 AM | 41 (14.5%) | 58 (29.0%) |
| 7:30 AM to 7:59 AM | 3 (1.1%) | 18 (9.0%) |
| 8:00 AM to 8:29 AM | 12 (4.3%) | 10 (5.0%) |
| 8:30 AM to 8:59 AM | 3 (1.1%) | 3 (1.5%) |
| 9:00 AM to 9:59 AM | 78 (27.7%) | 0 (0.0%) |
| 10:00 AM to 10:59 AM | 0 (0.0%) | 0 (0.0%) |
| 11:00 AM to 11:59 AM | 0 (0.0%) | 0 (0.0%) |
| 12:00 PM to 3:59 PM | 28 (9.9%) | 37 (18.5%) |
| 4:00 PM to 11:59 PM | 26 (9.2%) | 20 (10.0%) |
| Total | 282 (100.0%) | 200 (100.0%) |
Housing Occupancy in Hastings borough
Occupancy by Ownership in Hastings borough
Of the total 495 dwellings in Hastings borough, owner-occupied units account for 419 (84.7%), while renter-occupied units make up 76 (15.3%).
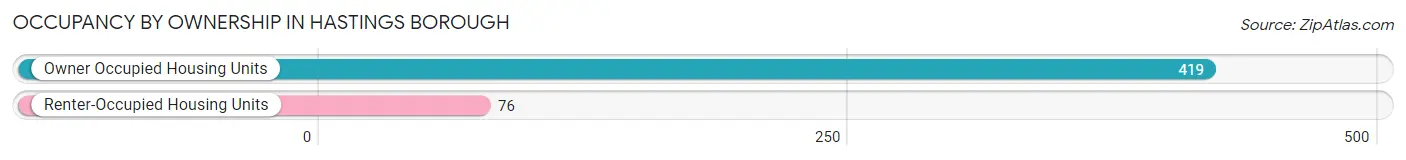
| Occupancy | # Housing Units | % Housing Units |
| Owner Occupied Housing Units | 419 | 84.7% |
| Renter-Occupied Housing Units | 76 | 15.3% |
| Total Occupied Housing Units | 495 | 100.0% |
Occupancy by Household Size in Hastings borough
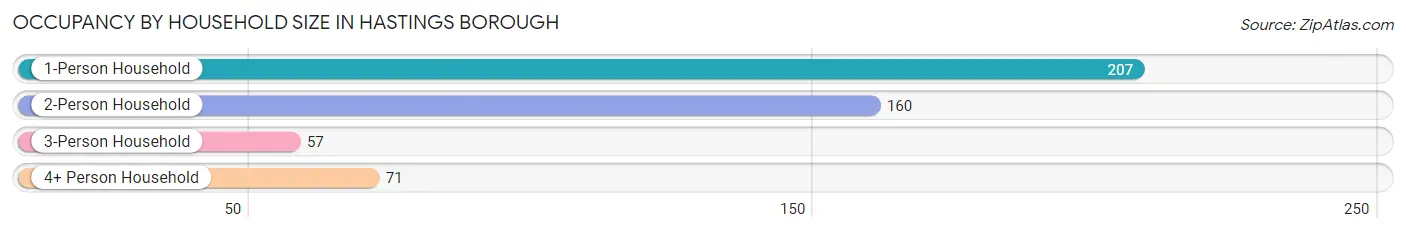
| Household Size | # Housing Units | % Housing Units |
| 1-Person Household | 207 | 41.8% |
| 2-Person Household | 160 | 32.3% |
| 3-Person Household | 57 | 11.5% |
| 4+ Person Household | 71 | 14.3% |
| Total Housing Units | 495 | 100.0% |
Occupancy by Ownership by Household Size in Hastings borough
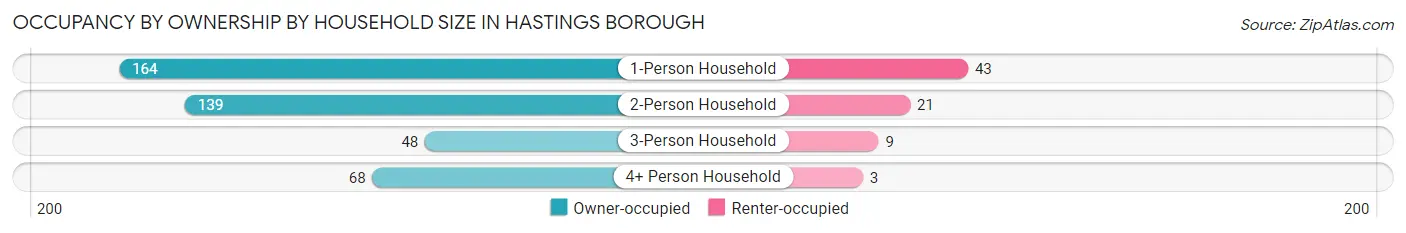
| Household Size | Owner-occupied | Renter-occupied |
| 1-Person Household | 164 (79.2%) | 43 (20.8%) |
| 2-Person Household | 139 (86.9%) | 21 (13.1%) |
| 3-Person Household | 48 (84.2%) | 9 (15.8%) |
| 4+ Person Household | 68 (95.8%) | 3 (4.2%) |
| Total Housing Units | 419 (84.7%) | 76 (15.3%) |
Occupancy by Educational Attainment in Hastings borough
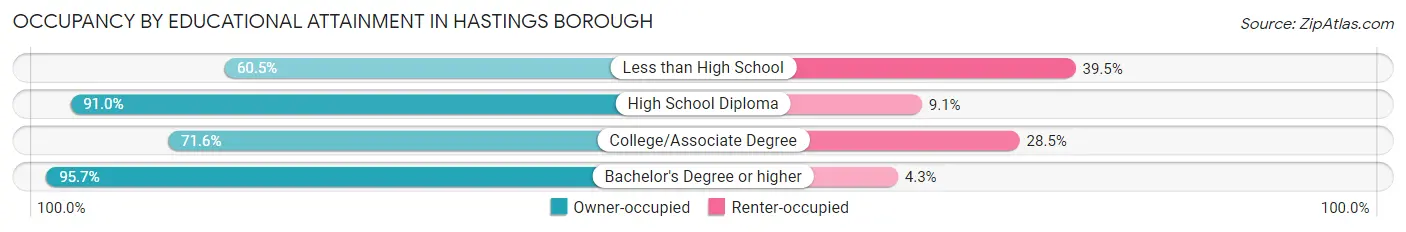
| Household Size | Owner-occupied | Renter-occupied |
| Less than High School | 26 (60.5%) | 17 (39.5%) |
| High School Diploma | 221 (90.9%) | 22 (9.0%) |
| College/Associate Degree | 83 (71.6%) | 33 (28.4%) |
| Bachelor's Degree or higher | 89 (95.7%) | 4 (4.3%) |
Occupancy by Age of Householder in Hastings borough
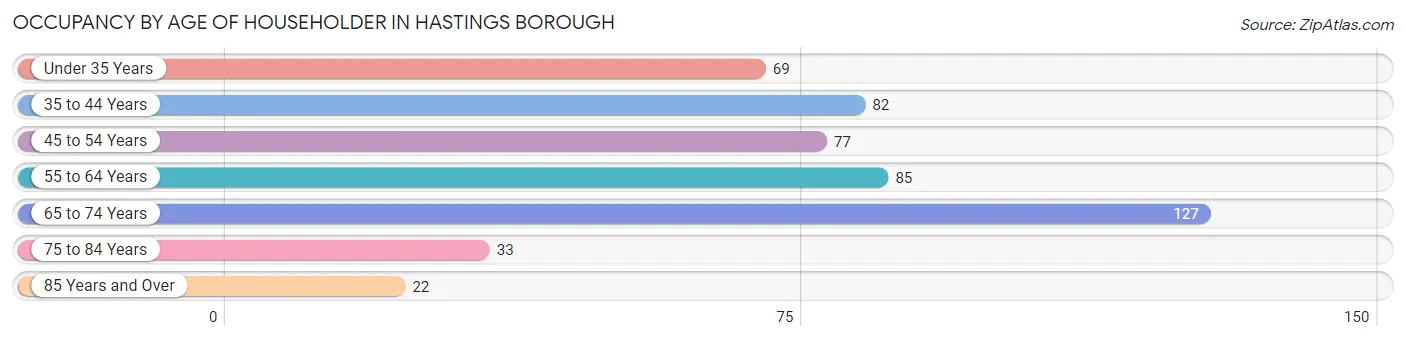
| Age Bracket | # Households | % Households |
| Under 35 Years | 69 | 13.9% |
| 35 to 44 Years | 82 | 16.6% |
| 45 to 54 Years | 77 | 15.6% |
| 55 to 64 Years | 85 | 17.2% |
| 65 to 74 Years | 127 | 25.7% |
| 75 to 84 Years | 33 | 6.7% |
| 85 Years and Over | 22 | 4.4% |
| Total | 495 | 100.0% |
Housing Finances in Hastings borough
Median Income by Occupancy in Hastings borough
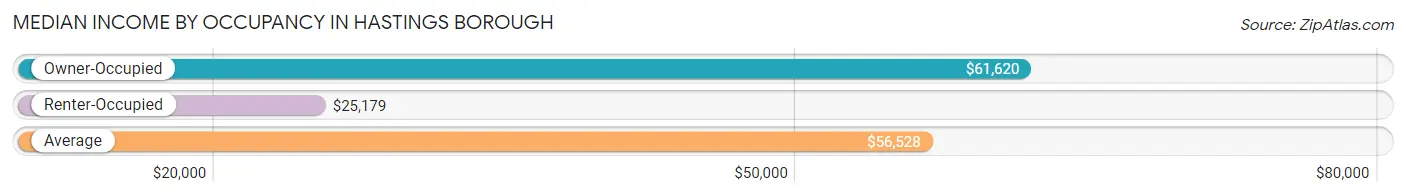
| Occupancy Type | # Households | Median Income |
| Owner-Occupied | 419 (84.7%) | $61,620 |
| Renter-Occupied | 76 (15.3%) | $25,179 |
| Average | 495 (100.0%) | $56,528 |
Occupancy by Householder Income Bracket in Hastings borough
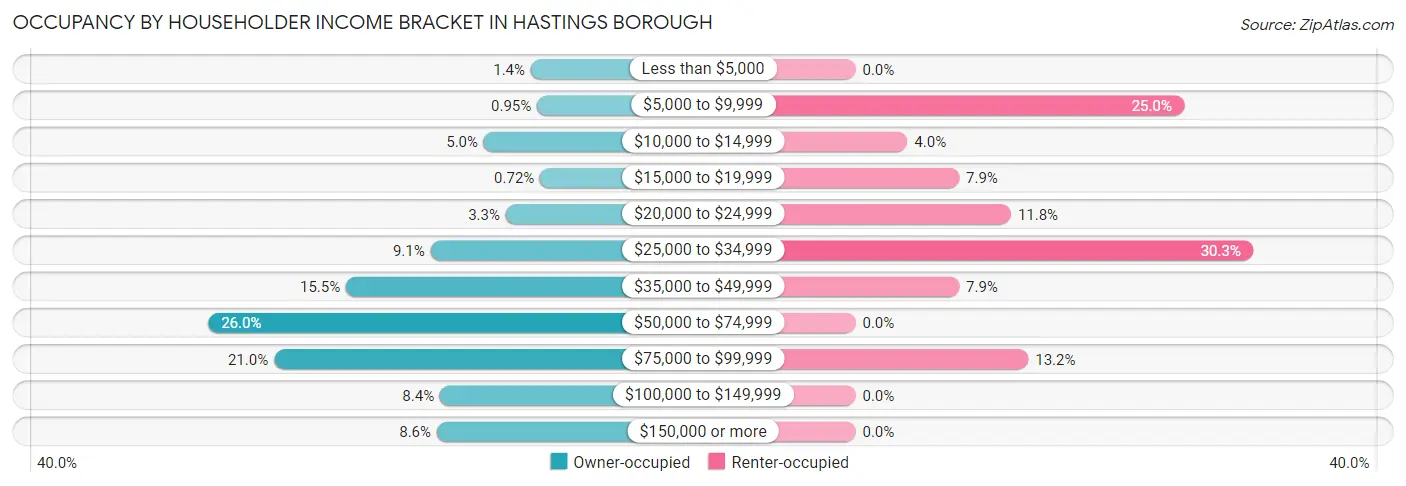
| Income Bracket | Owner-occupied | Renter-occupied |
| Less than $5,000 | 6 (1.4%) | 0 (0.0%) |
| $5,000 to $9,999 | 4 (0.9%) | 19 (25.0%) |
| $10,000 to $14,999 | 21 (5.0%) | 3 (4.0%) |
| $15,000 to $19,999 | 3 (0.7%) | 6 (7.9%) |
| $20,000 to $24,999 | 14 (3.3%) | 9 (11.8%) |
| $25,000 to $34,999 | 38 (9.1%) | 23 (30.3%) |
| $35,000 to $49,999 | 65 (15.5%) | 6 (7.9%) |
| $50,000 to $74,999 | 109 (26.0%) | 0 (0.0%) |
| $75,000 to $99,999 | 88 (21.0%) | 10 (13.2%) |
| $100,000 to $149,999 | 35 (8.4%) | 0 (0.0%) |
| $150,000 or more | 36 (8.6%) | 0 (0.0%) |
| Total | 419 (100.0%) | 76 (100.0%) |
Monthly Housing Cost Tiers in Hastings borough
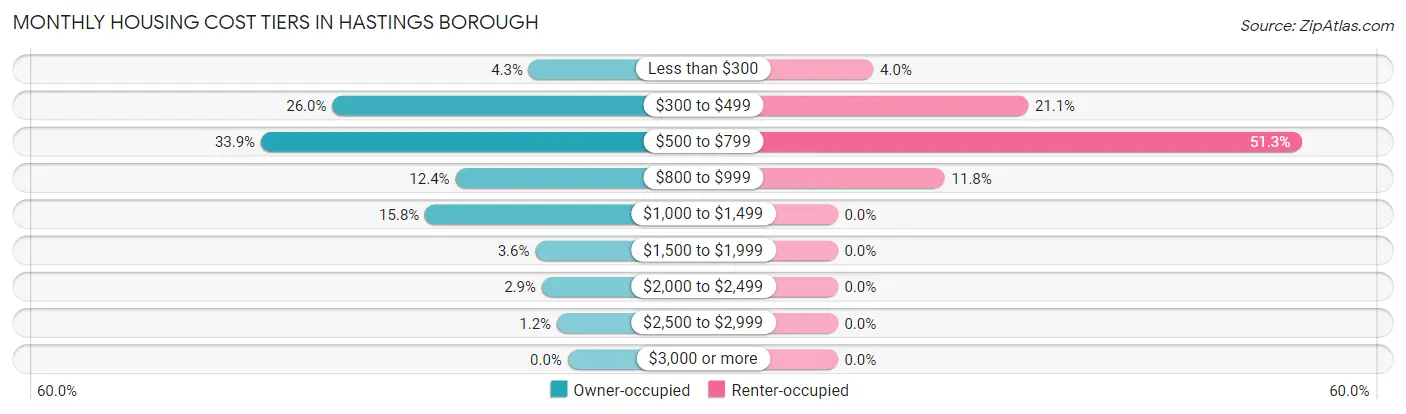
| Monthly Cost | Owner-occupied | Renter-occupied |
| Less than $300 | 18 (4.3%) | 3 (4.0%) |
| $300 to $499 | 109 (26.0%) | 16 (21.0%) |
| $500 to $799 | 142 (33.9%) | 39 (51.3%) |
| $800 to $999 | 52 (12.4%) | 9 (11.8%) |
| $1,000 to $1,499 | 66 (15.8%) | 0 (0.0%) |
| $1,500 to $1,999 | 15 (3.6%) | 0 (0.0%) |
| $2,000 to $2,499 | 12 (2.9%) | 0 (0.0%) |
| $2,500 to $2,999 | 5 (1.2%) | 0 (0.0%) |
| $3,000 or more | 0 (0.0%) | 0 (0.0%) |
| Total | 419 (100.0%) | 76 (100.0%) |
Physical Housing Characteristics in Hastings borough
Housing Structures in Hastings borough
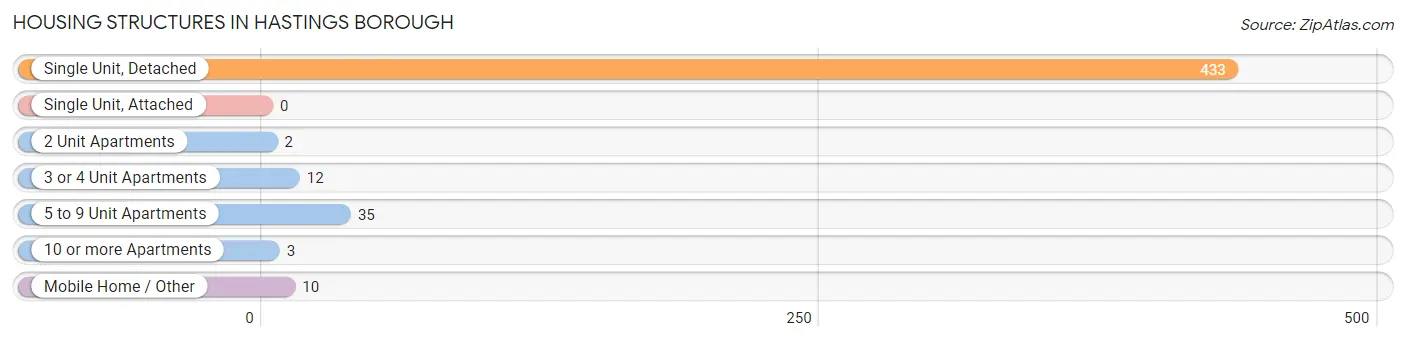
| Structure Type | # Housing Units | % Housing Units |
| Single Unit, Detached | 433 | 87.5% |
| Single Unit, Attached | 0 | 0.0% |
| 2 Unit Apartments | 2 | 0.4% |
| 3 or 4 Unit Apartments | 12 | 2.4% |
| 5 to 9 Unit Apartments | 35 | 7.1% |
| 10 or more Apartments | 3 | 0.6% |
| Mobile Home / Other | 10 | 2.0% |
| Total | 495 | 100.0% |
Housing Structures by Occupancy in Hastings borough
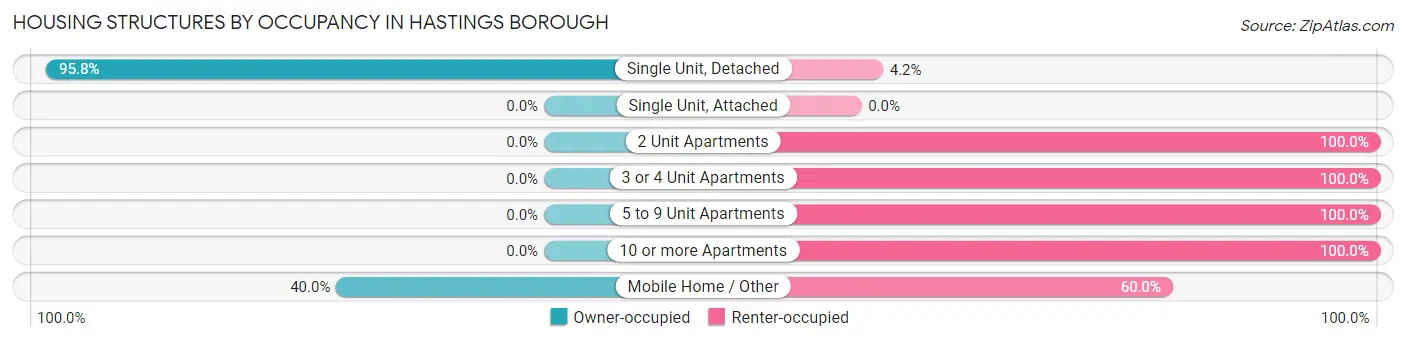
| Structure Type | Owner-occupied | Renter-occupied |
| Single Unit, Detached | 415 (95.8%) | 18 (4.2%) |
| Single Unit, Attached | 0 (0.0%) | 0 (0.0%) |
| 2 Unit Apartments | 0 (0.0%) | 2 (100.0%) |
| 3 or 4 Unit Apartments | 0 (0.0%) | 12 (100.0%) |
| 5 to 9 Unit Apartments | 0 (0.0%) | 35 (100.0%) |
| 10 or more Apartments | 0 (0.0%) | 3 (100.0%) |
| Mobile Home / Other | 4 (40.0%) | 6 (60.0%) |
| Total | 419 (84.7%) | 76 (15.3%) |
Housing Structures by Number of Rooms in Hastings borough
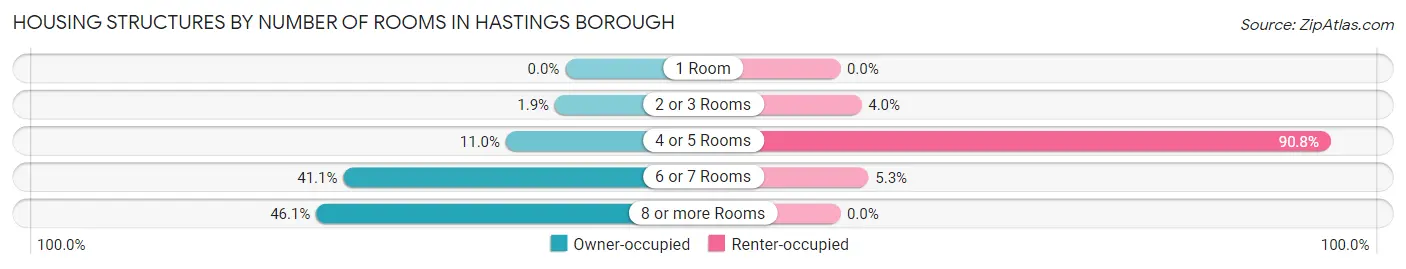
| Number of Rooms | Owner-occupied | Renter-occupied |
| 1 Room | 0 (0.0%) | 0 (0.0%) |
| 2 or 3 Rooms | 8 (1.9%) | 3 (4.0%) |
| 4 or 5 Rooms | 46 (11.0%) | 69 (90.8%) |
| 6 or 7 Rooms | 172 (41.0%) | 4 (5.3%) |
| 8 or more Rooms | 193 (46.1%) | 0 (0.0%) |
| Total | 419 (100.0%) | 76 (100.0%) |
Housing Structure by Heating Type in Hastings borough
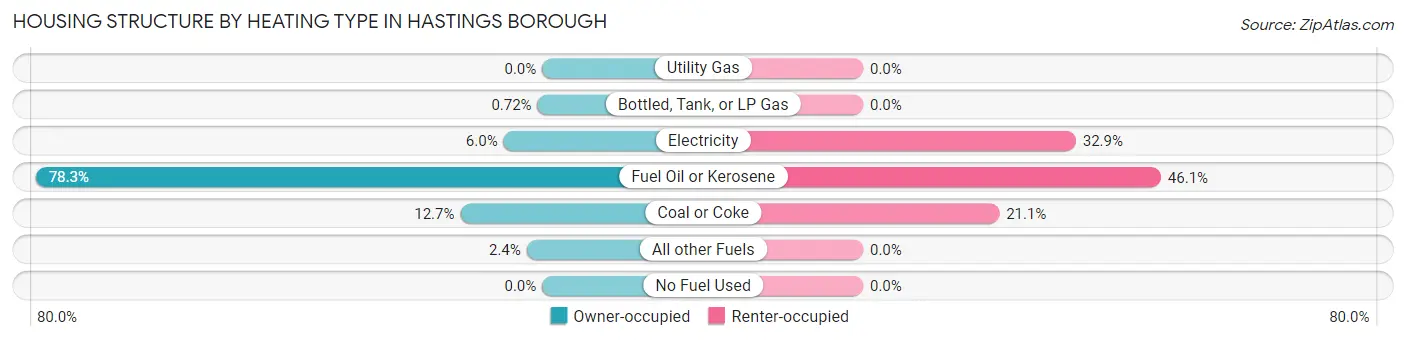
| Heating Type | Owner-occupied | Renter-occupied |
| Utility Gas | 0 (0.0%) | 0 (0.0%) |
| Bottled, Tank, or LP Gas | 3 (0.7%) | 0 (0.0%) |
| Electricity | 25 (6.0%) | 25 (32.9%) |
| Fuel Oil or Kerosene | 328 (78.3%) | 35 (46.1%) |
| Coal or Coke | 53 (12.7%) | 16 (21.0%) |
| All other Fuels | 10 (2.4%) | 0 (0.0%) |
| No Fuel Used | 0 (0.0%) | 0 (0.0%) |
| Total | 419 (100.0%) | 76 (100.0%) |
Household Vehicle Usage in Hastings borough
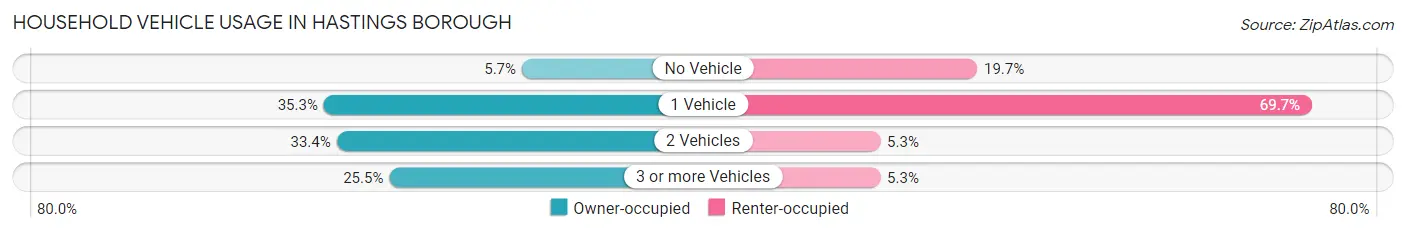
| Vehicles per Household | Owner-occupied | Renter-occupied |
| No Vehicle | 24 (5.7%) | 15 (19.7%) |
| 1 Vehicle | 148 (35.3%) | 53 (69.7%) |
| 2 Vehicles | 140 (33.4%) | 4 (5.3%) |
| 3 or more Vehicles | 107 (25.5%) | 4 (5.3%) |
| Total | 419 (100.0%) | 76 (100.0%) |
Real Estate & Mortgages in Hastings borough
Real Estate and Mortgage Overview in Hastings borough
| Characteristic | Without Mortgage | With Mortgage |
| Housing Units | 245 | 174 |
| Median Property Value | $93,300 | $99,400 |
| Median Household Income | $55,417 | $33 |
| Monthly Housing Costs | $498 | $0 |
| Real Estate Taxes | $1,758 | $3 |
Property Value by Mortgage Status in Hastings borough
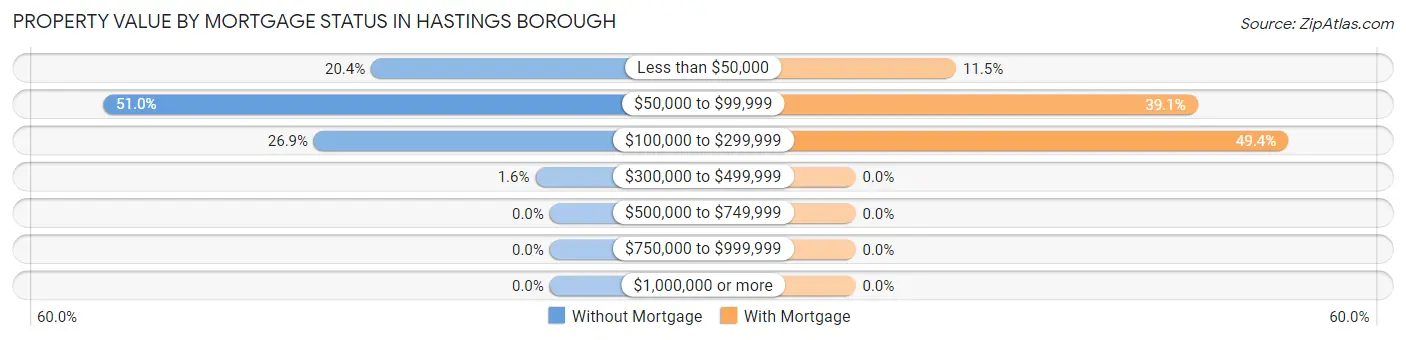
| Property Value | Without Mortgage | With Mortgage |
| Less than $50,000 | 50 (20.4%) | 20 (11.5%) |
| $50,000 to $99,999 | 125 (51.0%) | 68 (39.1%) |
| $100,000 to $299,999 | 66 (26.9%) | 86 (49.4%) |
| $300,000 to $499,999 | 4 (1.6%) | 0 (0.0%) |
| $500,000 to $749,999 | 0 (0.0%) | 0 (0.0%) |
| $750,000 to $999,999 | 0 (0.0%) | 0 (0.0%) |
| $1,000,000 or more | 0 (0.0%) | 0 (0.0%) |
| Total | 245 (100.0%) | 174 (100.0%) |
Household Income by Mortgage Status in Hastings borough
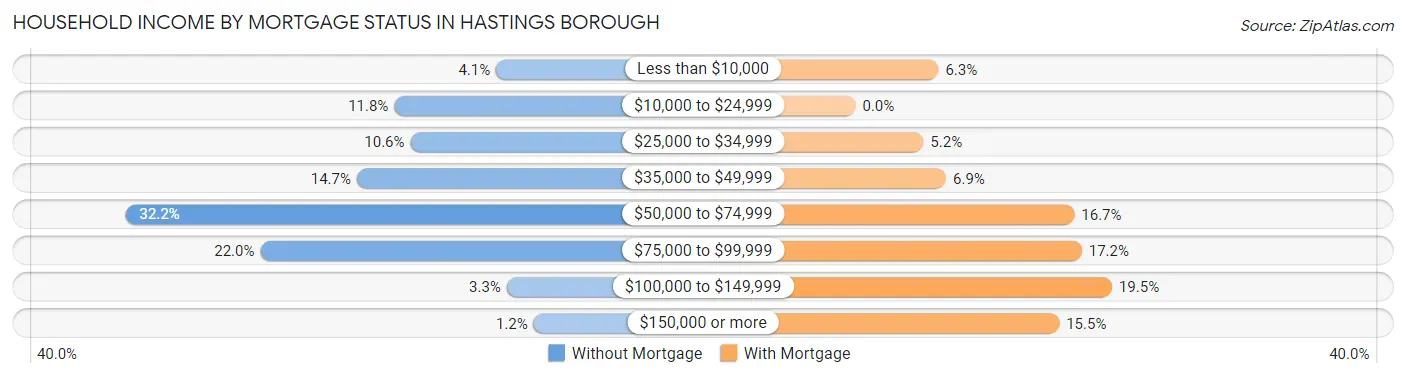
| Household Income | Without Mortgage | With Mortgage |
| Less than $10,000 | 10 (4.1%) | 11 (6.3%) |
| $10,000 to $24,999 | 29 (11.8%) | 0 (0.0%) |
| $25,000 to $34,999 | 26 (10.6%) | 9 (5.2%) |
| $35,000 to $49,999 | 36 (14.7%) | 12 (6.9%) |
| $50,000 to $74,999 | 79 (32.2%) | 29 (16.7%) |
| $75,000 to $99,999 | 54 (22.0%) | 30 (17.2%) |
| $100,000 to $149,999 | 8 (3.3%) | 34 (19.5%) |
| $150,000 or more | 3 (1.2%) | 27 (15.5%) |
| Total | 245 (100.0%) | 174 (100.0%) |
Property Value to Household Income Ratio in Hastings borough
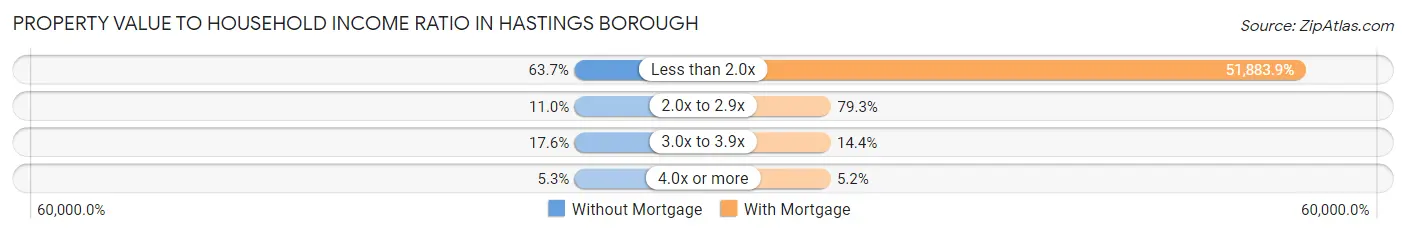
| Value-to-Income Ratio | Without Mortgage | With Mortgage |
| Less than 2.0x | 156 (63.7%) | 90,278 (51,883.9%) |
| 2.0x to 2.9x | 27 (11.0%) | 138 (79.3%) |
| 3.0x to 3.9x | 43 (17.5%) | 25 (14.4%) |
| 4.0x or more | 13 (5.3%) | 9 (5.2%) |
| Total | 245 (100.0%) | 174 (100.0%) |
Real Estate Taxes by Mortgage Status in Hastings borough
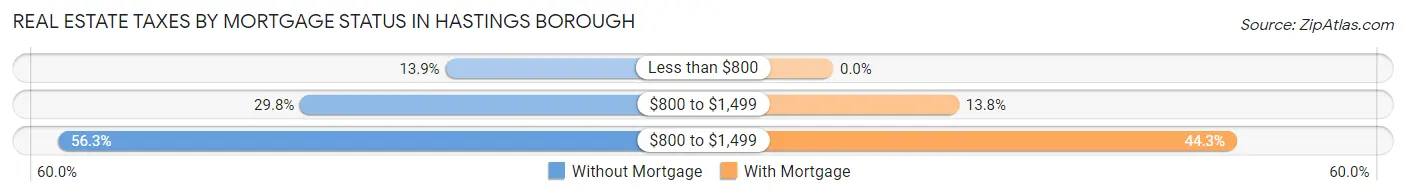
| Property Taxes | Without Mortgage | With Mortgage |
| Less than $800 | 34 (13.9%) | 0 (0.0%) |
| $800 to $1,499 | 73 (29.8%) | 24 (13.8%) |
| $800 to $1,499 | 138 (56.3%) | 77 (44.3%) |
| Total | 245 (100.0%) | 174 (100.0%) |
Health & Disability in Hastings borough
Health Insurance Coverage by Age in Hastings borough
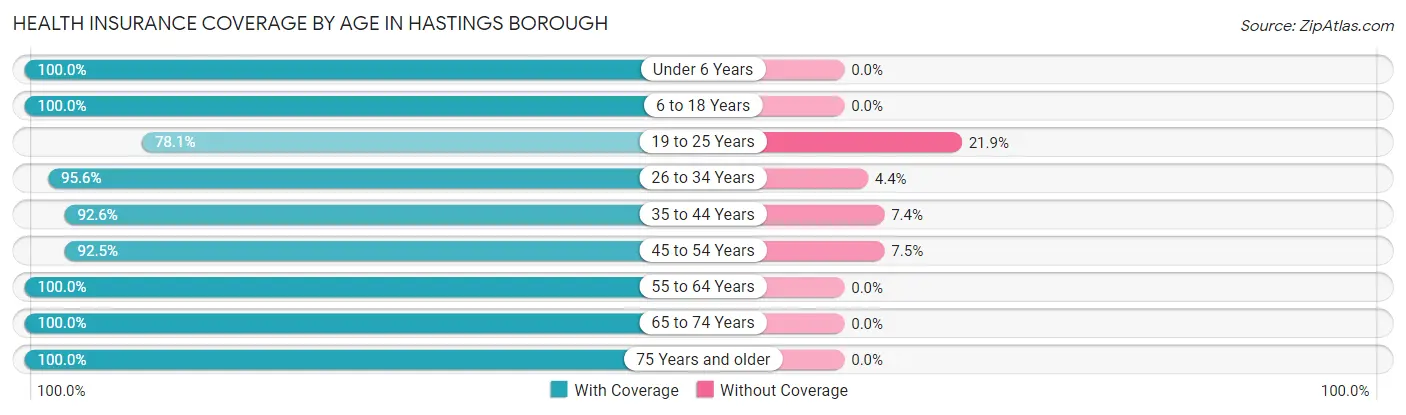
| Age Bracket | With Coverage | Without Coverage |
| Under 6 Years | 52 (100.0%) | 0 (0.0%) |
| 6 to 18 Years | 110 (100.0%) | 0 (0.0%) |
| 19 to 25 Years | 107 (78.1%) | 30 (21.9%) |
| 26 to 34 Years | 109 (95.6%) | 5 (4.4%) |
| 35 to 44 Years | 112 (92.6%) | 9 (7.4%) |
| 45 to 54 Years | 136 (92.5%) | 11 (7.5%) |
| 55 to 64 Years | 118 (100.0%) | 0 (0.0%) |
| 65 to 74 Years | 155 (100.0%) | 0 (0.0%) |
| 75 Years and older | 97 (100.0%) | 0 (0.0%) |
| Total | 996 (94.8%) | 55 (5.2%) |
Health Insurance Coverage by Citizenship Status in Hastings borough
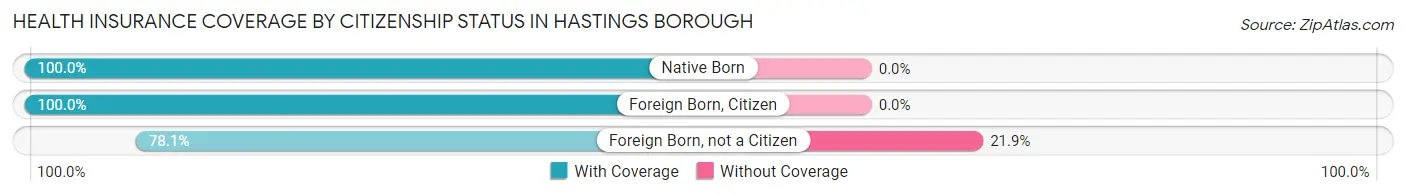
| Citizenship Status | With Coverage | Without Coverage |
| Native Born | 52 (100.0%) | 0 (0.0%) |
| Foreign Born, Citizen | 110 (100.0%) | 0 (0.0%) |
| Foreign Born, not a Citizen | 107 (78.1%) | 30 (21.9%) |
Health Insurance Coverage by Household Income in Hastings borough
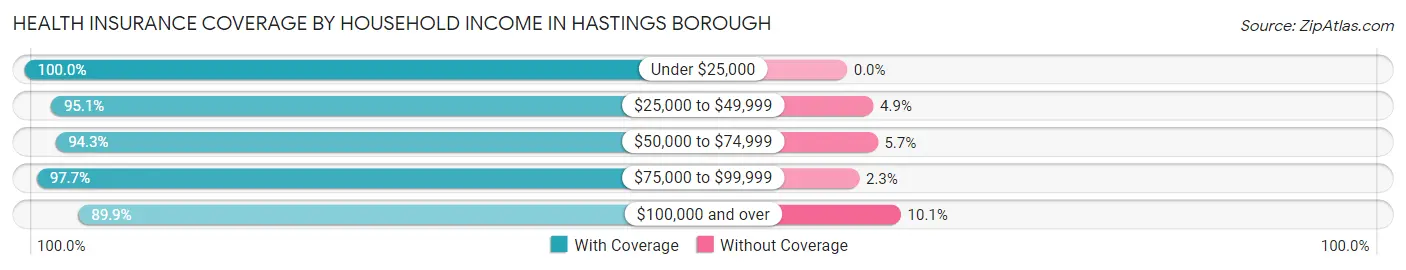
| Household Income | With Coverage | Without Coverage |
| Under $25,000 | 109 (100.0%) | 0 (0.0%) |
| $25,000 to $49,999 | 250 (95.1%) | 13 (4.9%) |
| $50,000 to $74,999 | 197 (94.3%) | 12 (5.7%) |
| $75,000 to $99,999 | 213 (97.7%) | 5 (2.3%) |
| $100,000 and over | 223 (89.9%) | 25 (10.1%) |
Public vs Private Health Insurance Coverage by Age in Hastings borough
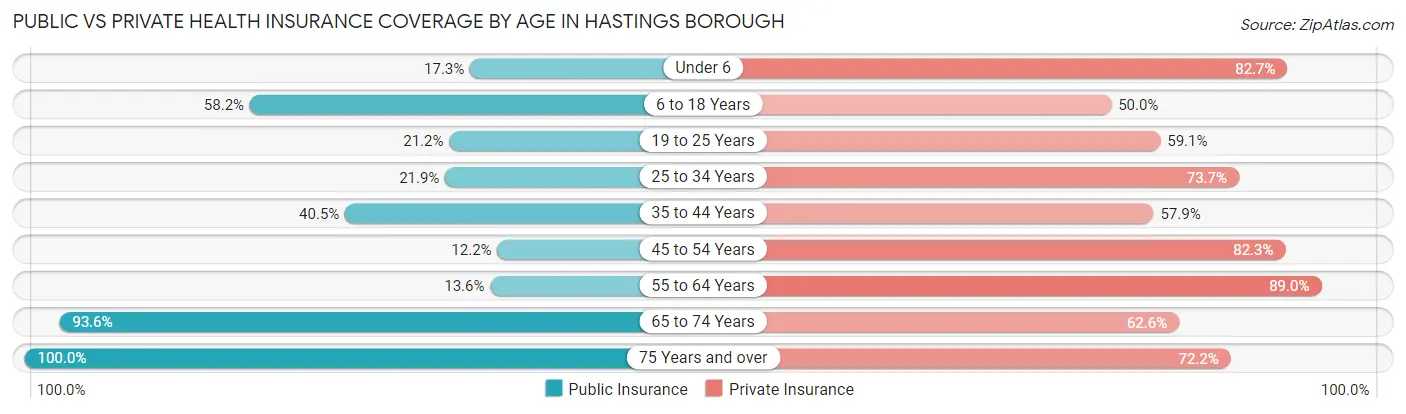
| Age Bracket | Public Insurance | Private Insurance |
| Under 6 | 9 (17.3%) | 43 (82.7%) |
| 6 to 18 Years | 64 (58.2%) | 55 (50.0%) |
| 19 to 25 Years | 29 (21.2%) | 81 (59.1%) |
| 25 to 34 Years | 25 (21.9%) | 84 (73.7%) |
| 35 to 44 Years | 49 (40.5%) | 70 (57.9%) |
| 45 to 54 Years | 18 (12.2%) | 121 (82.3%) |
| 55 to 64 Years | 16 (13.6%) | 105 (89.0%) |
| 65 to 74 Years | 145 (93.5%) | 97 (62.6%) |
| 75 Years and over | 97 (100.0%) | 70 (72.2%) |
| Total | 452 (43.0%) | 726 (69.1%) |
Disability Status by Sex by Age in Hastings borough
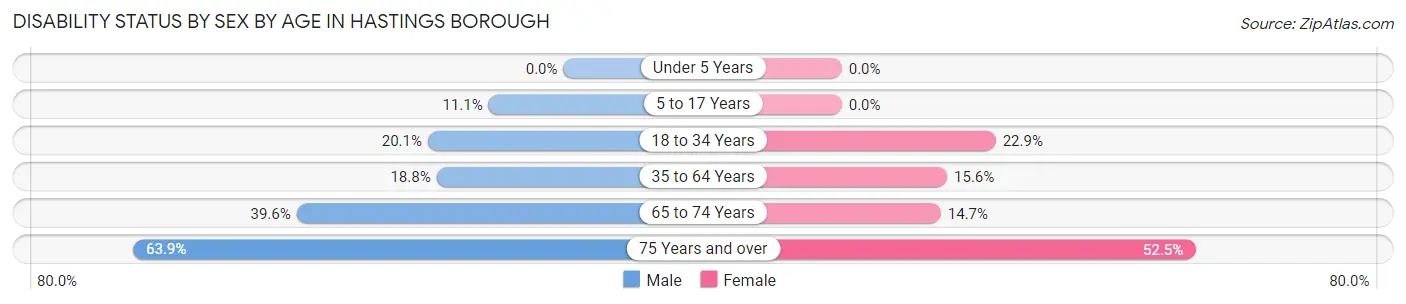
| Age Bracket | Male | Female |
| Under 5 Years | 0 (0.0%) | 0 (0.0%) |
| 5 to 17 Years | 5 (11.1%) | 0 (0.0%) |
| 18 to 34 Years | 31 (20.1%) | 24 (22.9%) |
| 35 to 64 Years | 39 (18.8%) | 28 (15.6%) |
| 65 to 74 Years | 21 (39.6%) | 15 (14.7%) |
| 75 Years and over | 23 (63.9%) | 32 (52.5%) |
Disability Class by Sex by Age in Hastings borough
Disability Class: Hearing Difficulty
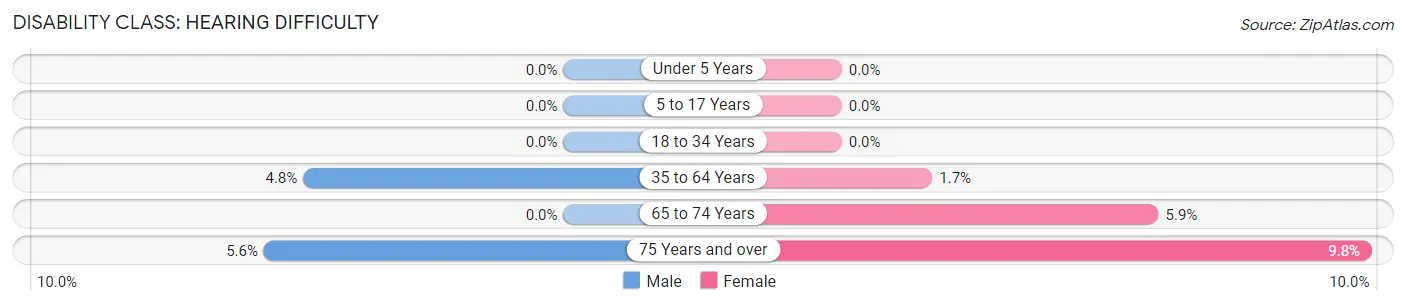
| Age Bracket | Male | Female |
| Under 5 Years | 0 (0.0%) | 0 (0.0%) |
| 5 to 17 Years | 0 (0.0%) | 0 (0.0%) |
| 18 to 34 Years | 0 (0.0%) | 0 (0.0%) |
| 35 to 64 Years | 10 (4.8%) | 3 (1.7%) |
| 65 to 74 Years | 0 (0.0%) | 6 (5.9%) |
| 75 Years and over | 2 (5.6%) | 6 (9.8%) |
Disability Class: Vision Difficulty
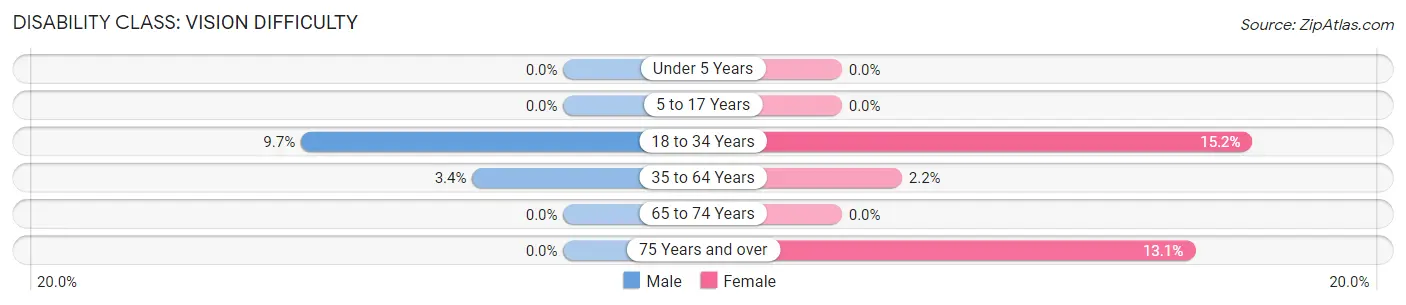
| Age Bracket | Male | Female |
| Under 5 Years | 0 (0.0%) | 0 (0.0%) |
| 5 to 17 Years | 0 (0.0%) | 0 (0.0%) |
| 18 to 34 Years | 15 (9.7%) | 16 (15.2%) |
| 35 to 64 Years | 7 (3.4%) | 4 (2.2%) |
| 65 to 74 Years | 0 (0.0%) | 0 (0.0%) |
| 75 Years and over | 0 (0.0%) | 8 (13.1%) |
Disability Class: Cognitive Difficulty
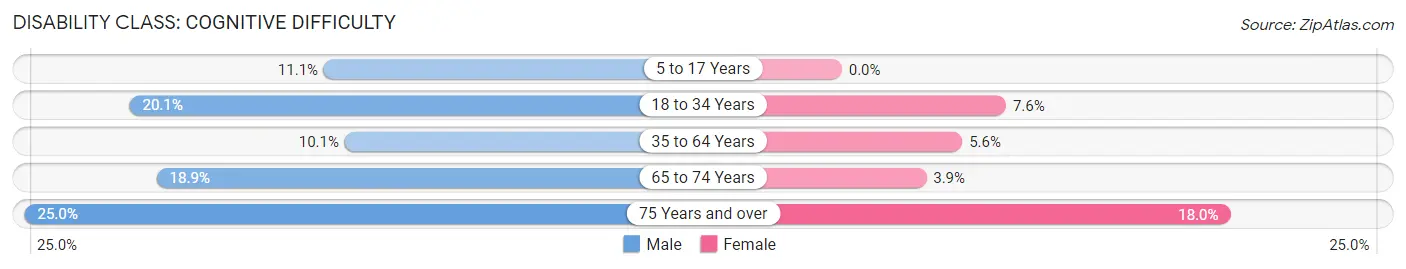
| Age Bracket | Male | Female |
| 5 to 17 Years | 5 (11.1%) | 0 (0.0%) |
| 18 to 34 Years | 31 (20.1%) | 8 (7.6%) |
| 35 to 64 Years | 21 (10.1%) | 10 (5.6%) |
| 65 to 74 Years | 10 (18.9%) | 4 (3.9%) |
| 75 Years and over | 9 (25.0%) | 11 (18.0%) |
Disability Class: Ambulatory Difficulty
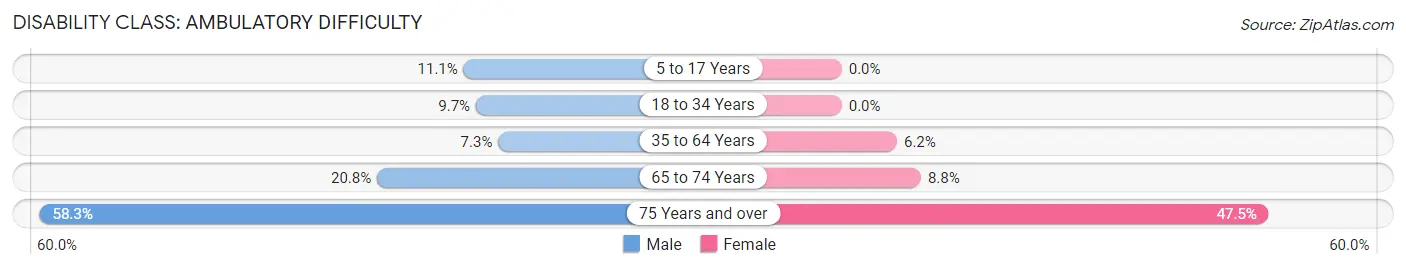
| Age Bracket | Male | Female |
| 5 to 17 Years | 5 (11.1%) | 0 (0.0%) |
| 18 to 34 Years | 15 (9.7%) | 0 (0.0%) |
| 35 to 64 Years | 15 (7.2%) | 11 (6.1%) |
| 65 to 74 Years | 11 (20.7%) | 9 (8.8%) |
| 75 Years and over | 21 (58.3%) | 29 (47.5%) |
Disability Class: Self-Care Difficulty
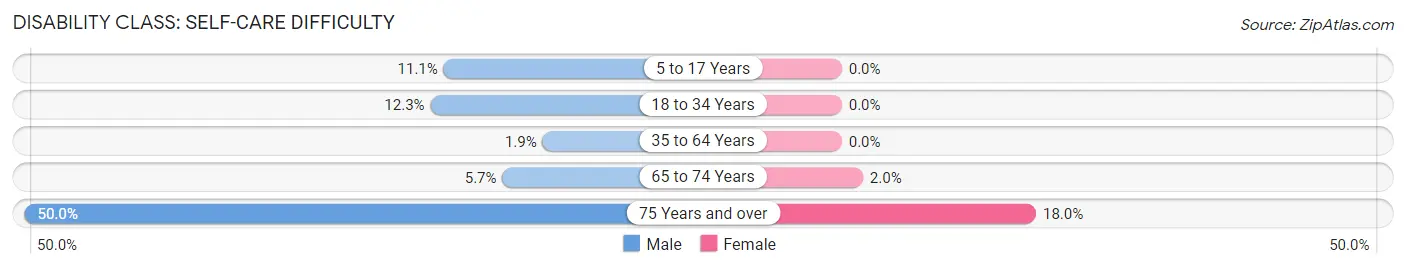
| Age Bracket | Male | Female |
| 5 to 17 Years | 5 (11.1%) | 0 (0.0%) |
| 18 to 34 Years | 19 (12.3%) | 0 (0.0%) |
| 35 to 64 Years | 4 (1.9%) | 0 (0.0%) |
| 65 to 74 Years | 3 (5.7%) | 2 (2.0%) |
| 75 Years and over | 18 (50.0%) | 11 (18.0%) |
Technology Access in Hastings borough
Computing Device Access in Hastings borough
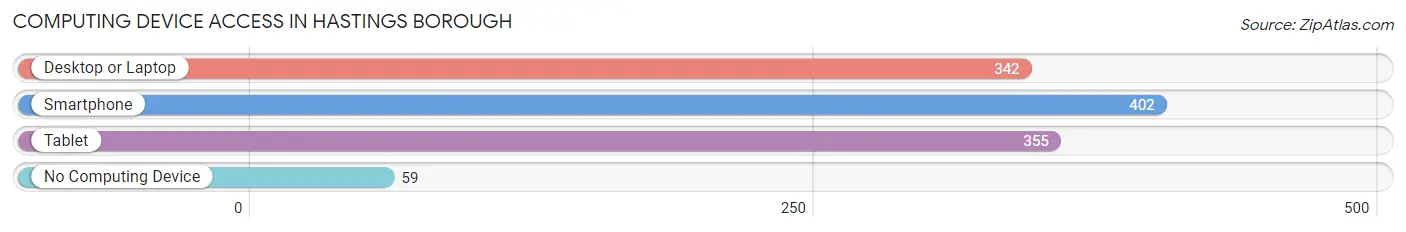
| Device Type | # Households | % Households |
| Desktop or Laptop | 342 | 69.1% |
| Smartphone | 402 | 81.2% |
| Tablet | 355 | 71.7% |
| No Computing Device | 59 | 11.9% |
| Total | 495 | 100.0% |
Internet Access in Hastings borough
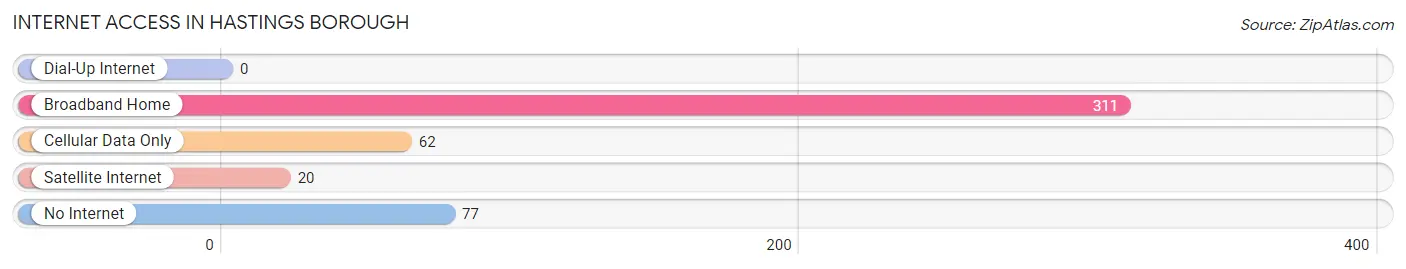
| Internet Type | # Households | % Households |
| Dial-Up Internet | 0 | 0.0% |
| Broadband Home | 311 | 62.8% |
| Cellular Data Only | 62 | 12.5% |
| Satellite Internet | 20 | 4.0% |
| No Internet | 77 | 15.6% |
| Total | 495 | 100.0% |
Hastings borough Summary
Hastings Borough is a borough located in the state of Pennsylvania in the United States. It is located in the southwestern corner of the state, in the Allegheny Mountains region. The borough is situated in the Allegheny Plateau, and is bordered by the towns of Westmoreland, Fayette, and Somerset counties. The population of Hastings Borough was 1,845 at the 2010 census.
History
Hastings Borough was founded in 1845 by a group of settlers from the nearby town of Westmoreland. The settlers were looking for a place to settle and build a new community. The town was named after the Hastings family, who had been living in the area since the early 1800s. The town was officially incorporated in 1848.
The town grew slowly but steadily over the years, and by the early 1900s, it had become a thriving community. The town was home to several businesses, including a sawmill, a grist mill, a tannery, and a general store. The town also had a post office, a bank, and a school.
In the early 1900s, the town began to experience a decline in population. This was due to the decline of the coal industry in the area, as well as the Great Depression. By the 1950s, the population had dropped to just over 1,000.
Geography
Hastings Borough is located in the southwestern corner of Pennsylvania, in the Allegheny Mountains region. The borough is situated in the Allegheny Plateau, and is bordered by the towns of Westmoreland, Fayette, and Somerset counties. The borough is located at an elevation of 1,845 feet above sea level.
The borough is located in a rural area, and is surrounded by rolling hills and forests. The borough is home to several small streams, including the Little Conemaugh River, which flows through the borough.
Economy
The economy of Hastings Borough is largely based on agriculture and tourism. The borough is home to several farms, which produce a variety of crops, including corn, soybeans, hay, and wheat. The borough is also home to several wineries, which produce a variety of wines.
The borough is also home to several small businesses, including restaurants, shops, and other services. The borough is also home to several bed and breakfasts, which attract tourists from all over the country.
Demographics
As of the 2010 census, the population of Hastings Borough was 1,845. The racial makeup of the borough was 97.3% White, 0.7% African American, 0.2% Native American, 0.2% Asian, 0.1% Pacific Islander, 0.3% from other races, and 1.3% from two or more races. Hispanic or Latino of any race were 1.2% of the population.
The median income for a household in the borough was $37,500, and the median income for a family was $45,000. The per capita income for the borough was $19,000. About 11.2% of families and 14.2% of the population were below the poverty line, including 18.2% of those under age 18 and 8.3% of those age 65 or over.
Common Questions
What is the Total Population of Hastings borough?
Total Population of Hastings borough is 1,051.
What is the Total Male Population of Hastings borough?
Total Male Population of Hastings borough is 509.
What is the Total Female Population of Hastings borough?
Total Female Population of Hastings borough is 542.
What is the Ratio of Males per 100 Females in Hastings borough?
There are 93.91 Males per 100 Females in Hastings borough.
What is the Ratio of Females per 100 Males in Hastings borough?
There are 106.48 Females per 100 Males in Hastings borough.
What is the Median Population Age in Hastings borough?
Median Population Age in Hastings borough is 44.6 Years.
What is the Average Family Size in Hastings borough
Average Family Size in Hastings borough is 2.9 People.
What is the Average Household Size in Hastings borough
Average Household Size in Hastings borough is 2.1 People.
What is Per Capita Income in Hastings borough?
Per Capita income in Hastings borough is $31,027.
What is the Median Family Income in Hastings borough?
Median Family Income in Hastings borough is $60,469.
What is the Median Household income in Hastings borough?
Median Household Income in Hastings borough is $56,528.
What is Income or Wage Gap in Hastings borough?
Income or Wage Gap in Hastings borough is 31.4%.
Women in Hastings borough earn 68.6 cents for every dollar earned by a man.
What is Inequality or Gini Index in Hastings borough?
Inequality or Gini Index in Hastings borough is 0.37.
How Large is the Labor Force in Hastings borough?
There are 535 People in the Labor Forcein in Hastings borough.
What is the Percentage of People in the Labor Force in Hastings borough?
58.9% of People are in the Labor Force in Hastings borough.
What is the Unemployment Rate in Hastings borough?
Unemployment Rate in Hastings borough is 2.6%.