Franklin borough, PA
Franklin borough Overview
310
TOTAL POPULATION
160
MALE POPULATION
150
FEMALE POPULATION
106.67
MALES / 100 FEMALES
93.75
FEMALES / 100 MALES
33.7
MEDIAN AGE
2.8
AVG FAMILY SIZE
2.0
AVG HOUSEHOLD SIZE
$22,217
PER CAPITA INCOME
$52,679
AVG FAMILY INCOME
$39,044
AVG HOUSEHOLD INCOME
16.7%
WAGE / INCOME GAP [ % ]
83.3¢/ $1
WAGE / INCOME GAP [ $ ]
0.37
INEQUALITY / GINI INDEX
157
LABOR FORCE [ PEOPLE ]
66.2%
PERCENT IN LABOR FORCE
3.2%
UNEMPLOYMENT RATE
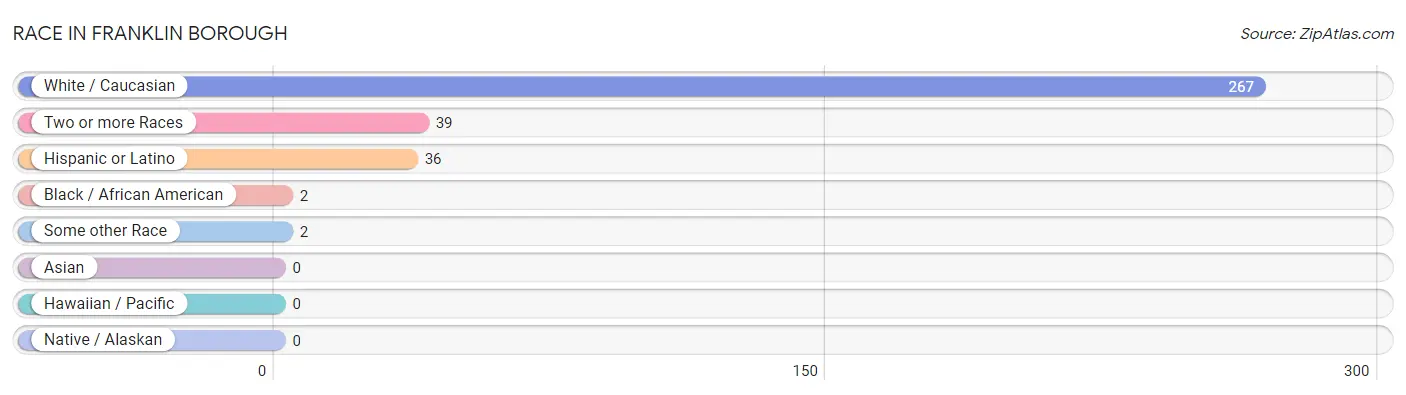
Race in Franklin borough
The most populous races in Franklin borough are White / Caucasian (267 | 86.1%), Two or more Races (39 | 12.6%), and Hispanic or Latino (36 | 11.6%).
| Race | # Population | % Population |
| Asian | 0 | 0.0% |
| Black / African American | 2 | 0.6% |
| Hawaiian / Pacific | 0 | 0.0% |
| Hispanic or Latino | 36 | 11.6% |
| Native / Alaskan | 0 | 0.0% |
| White / Caucasian | 267 | 86.1% |
| Two or more Races | 39 | 12.6% |
| Some other Race | 2 | 0.6% |
| Total | 310 | 100.0% |
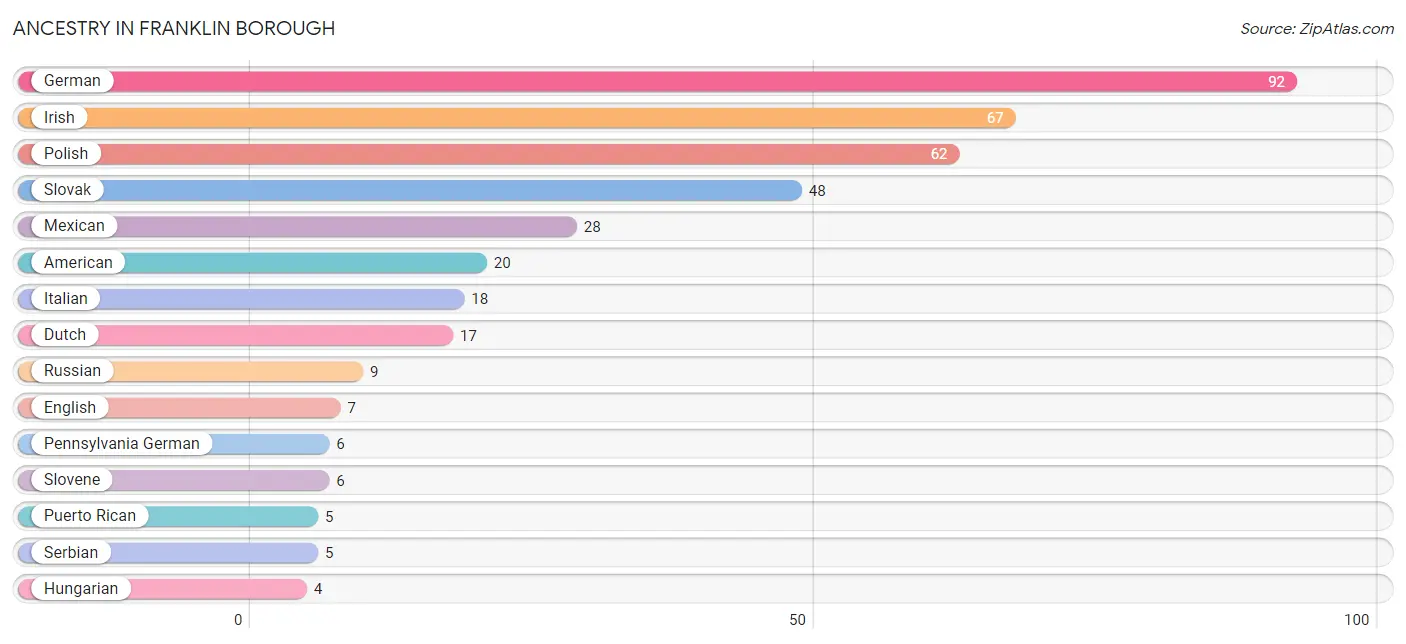
Ancestry in Franklin borough
The most populous ancestries reported in Franklin borough are German (92 | 29.7%), Irish (67 | 21.6%), Polish (62 | 20.0%), Slovak (48 | 15.5%), and Mexican (28 | 9.0%), together accounting for 95.8% of all Franklin borough residents.
| Ancestry | # Population | % Population |
| American | 20 | 6.5% |
| Croatian | 1 | 0.3% |
| Cuban | 1 | 0.3% |
| Dominican | 2 | 0.6% |
| Dutch | 17 | 5.5% |
| Eastern European | 2 | 0.6% |
| English | 7 | 2.3% |
| French | 1 | 0.3% |
| German | 92 | 29.7% |
| Hungarian | 4 | 1.3% |
| Irish | 67 | 21.6% |
| Italian | 18 | 5.8% |
| Mexican | 28 | 9.0% |
| Pennsylvania German | 6 | 1.9% |
| Polish | 62 | 20.0% |
| Puerto Rican | 5 | 1.6% |
| Russian | 9 | 2.9% |
| Scotch-Irish | 1 | 0.3% |
| Scottish | 4 | 1.3% |
| Serbian | 5 | 1.6% |
| Slavic | 1 | 0.3% |
| Slovak | 48 | 15.5% |
| Slovene | 6 | 1.9% |
| Welsh | 1 | 0.3% | View All 24 Rows |
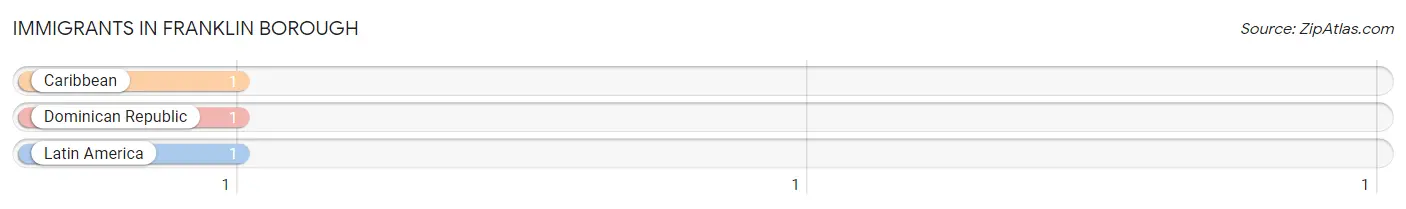
Immigrants in Franklin borough
The most numerous immigrant groups reported in Franklin borough came from Caribbean (1 | 0.3%), Dominican Republic (1 | 0.3%), and Latin America (1 | 0.3%), together accounting for 1.0% of all Franklin borough residents.
| Immigration Origin | # Population | % Population |
| Caribbean | 1 | 0.3% |
| Dominican Republic | 1 | 0.3% |
| Latin America | 1 | 0.3% | View All 3 Rows |
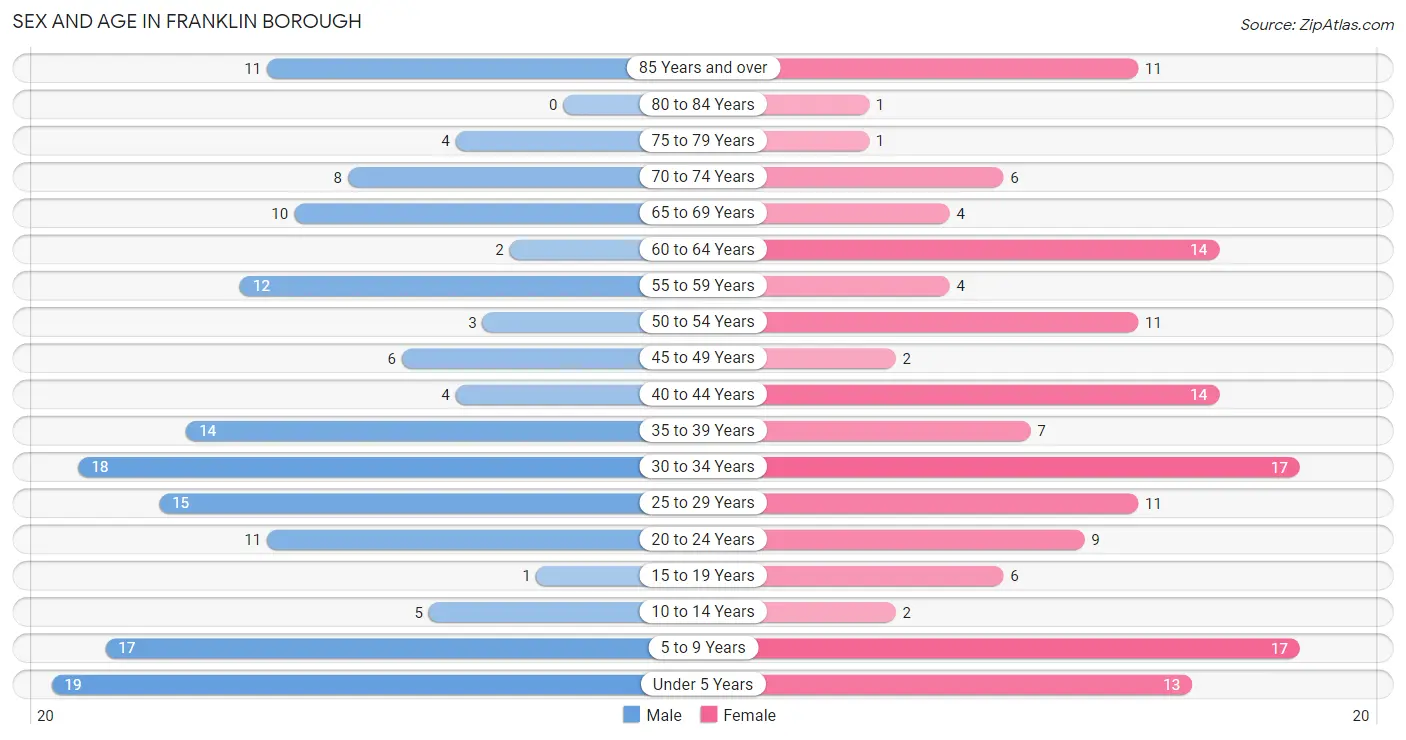
Sex and Age in Franklin borough
Sex and Age in Franklin borough
The most populous age groups in Franklin borough are Under 5 Years (19 | 11.9%) for men and 5 to 9 Years (17 | 11.3%) for women.
| Age Bracket | Male | Female |
| Under 5 Years | 19 (11.9%) | 13 (8.7%) |
| 5 to 9 Years | 17 (10.6%) | 17 (11.3%) |
| 10 to 14 Years | 5 (3.1%) | 2 (1.3%) |
| 15 to 19 Years | 1 (0.6%) | 6 (4.0%) |
| 20 to 24 Years | 11 (6.9%) | 9 (6.0%) |
| 25 to 29 Years | 15 (9.4%) | 11 (7.3%) |
| 30 to 34 Years | 18 (11.3%) | 17 (11.3%) |
| 35 to 39 Years | 14 (8.7%) | 7 (4.7%) |
| 40 to 44 Years | 4 (2.5%) | 14 (9.3%) |
| 45 to 49 Years | 6 (3.7%) | 2 (1.3%) |
| 50 to 54 Years | 3 (1.9%) | 11 (7.3%) |
| 55 to 59 Years | 12 (7.5%) | 4 (2.7%) |
| 60 to 64 Years | 2 (1.3%) | 14 (9.3%) |
| 65 to 69 Years | 10 (6.2%) | 4 (2.7%) |
| 70 to 74 Years | 8 (5.0%) | 6 (4.0%) |
| 75 to 79 Years | 4 (2.5%) | 1 (0.7%) |
| 80 to 84 Years | 0 (0.0%) | 1 (0.7%) |
| 85 Years and over | 11 (6.9%) | 11 (7.3%) |
| Total | 160 (100.0%) | 150 (100.0%) |
Families and Households in Franklin borough
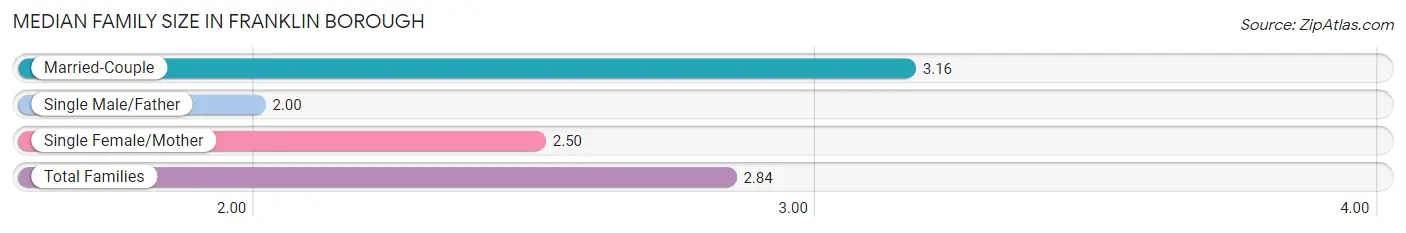
Median Family Size in Franklin borough
The median family size in Franklin borough is 2.84 persons per family, with married-couple families (43 | 53.7%) accounting for the largest median family size of 3.16 persons per family. On the other hand, single male/father families (3 | 3.7%) represent the smallest median family size with 2.00 persons per family.
| Family Type | # Families | Family Size |
| Married-Couple | 43 (53.7%) | 3.16 |
| Single Male/Father | 3 (3.7%) | 2.00 |
| Single Female/Mother | 34 (42.5%) | 2.50 |
| Total Families | 80 (100.0%) | 2.84 |
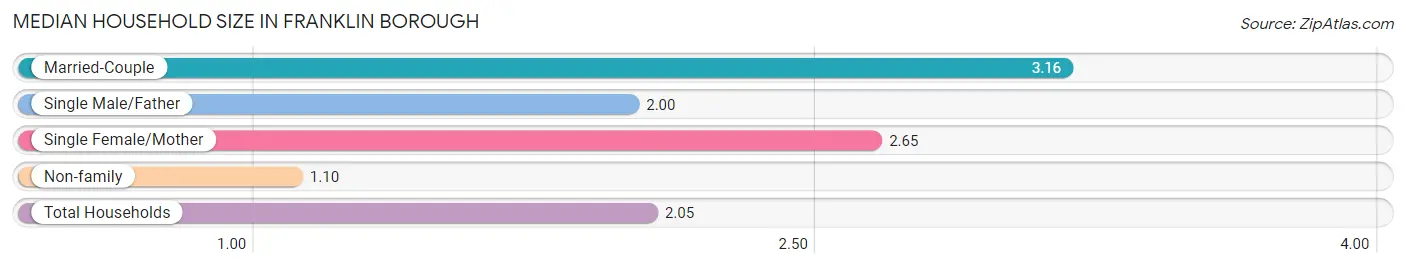
Median Household Size in Franklin borough
The median household size in Franklin borough is 2.05 persons per household, with married-couple households (43 | 28.5%) accounting for the largest median household size of 3.16 persons per household. non-family households (71 | 47.0%) represent the smallest median household size with 1.10 persons per household.
| Household Type | # Households | Household Size |
| Married-Couple | 43 (28.5%) | 3.16 |
| Single Male/Father | 3 (2.0%) | 2.00 |
| Single Female/Mother | 34 (22.5%) | 2.65 |
| Non-family | 71 (47.0%) | 1.10 |
| Total Households | 151 (100.0%) | 2.05 |
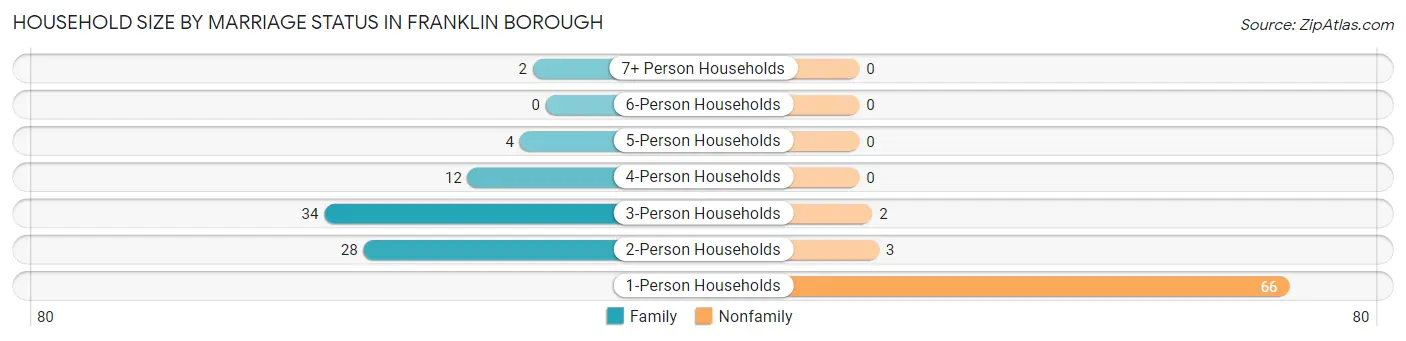
Household Size by Marriage Status in Franklin borough
Out of a total of 151 households in Franklin borough, 80 (53.0%) are family households, while 71 (47.0%) are nonfamily households. The most numerous type of family households are 3-person households, comprising 34, and the most common type of nonfamily households are 1-person households, comprising 66.
| Household Size | Family Households | Nonfamily Households |
| 1-Person Households | - | 66 (43.7%) |
| 2-Person Households | 28 (18.5%) | 3 (2.0%) |
| 3-Person Households | 34 (22.5%) | 2 (1.3%) |
| 4-Person Households | 12 (8.0%) | 0 (0.0%) |
| 5-Person Households | 4 (2.6%) | 0 (0.0%) |
| 6-Person Households | 0 (0.0%) | 0 (0.0%) |
| 7+ Person Households | 2 (1.3%) | 0 (0.0%) |
| Total | 80 (53.0%) | 71 (47.0%) |
Female Fertility in Franklin borough
Fertility by Age in Franklin borough
| Age Bracket | Women with Births | Births / 1,000 Women |
| 15 to 19 years | 0 (0.0%) | 0.0 |
| 20 to 34 years | 0 (0.0%) | 0.0 |
| 35 to 50 years | 0 (0.0%) | 0.0 |
| Total | 0 (0.0%) | 0.0 |
Fertility by Age by Marriage Status in Franklin borough
| Age Bracket | Married | Unmarried |
| 15 to 19 years | 0 (0.0%) | 0 (0.0%) |
| 20 to 34 years | 0 (0.0%) | 0 (0.0%) |
| 35 to 50 years | 0 (0.0%) | 0 (0.0%) |
| Total | 0 (0.0%) | 0 (0.0%) |
Fertility by Education in Franklin borough
| Educational Attainment | Women with Births | Births / 1,000 Women |
| Less than High School | 0 (0.0%) | 0.0 |
| High School Diploma | 0 (0.0%) | 0.0 |
| College or Associate's Degree | 0 (0.0%) | 0.0 |
| Bachelor's Degree | 0 (0.0%) | 0.0 |
| Graduate Degree | 0 (0.0%) | 0.0 |
| Total | 0 (0.0%) | 0.0 |
Fertility by Education by Marriage Status in Franklin borough
| Educational Attainment | Married | Unmarried |
| Less than High School | 0 (0.0%) | 0 (0.0%) |
| High School Diploma | 0 (0.0%) | 0 (0.0%) |
| College or Associate's Degree | 0 (0.0%) | 0 (0.0%) |
| Bachelor's Degree | 0 (0.0%) | 0 (0.0%) |
| Graduate Degree | 0 (0.0%) | 0 (0.0%) |
| Total | 0 (0.0%) | 0 (0.0%) |
Income in Franklin borough
Income Overview in Franklin borough
Per Capita Income in Franklin borough is $22,217, while median incomes of families and households are $52,679 and $39,044 respectively.
| Characteristic | Number | Measure |
| Per Capita Income | 310 | $22,217 |
| Median Family Income | 80 | $52,679 |
| Mean Family Income | 80 | $53,673 |
| Median Household Income | 151 | $39,044 |
| Mean Household Income | 151 | $46,477 |
| Income Deficit | 80 | $0 |
| Wage / Income Gap (%) | 310 | 16.67% |
| Wage / Income Gap ($) | 310 | 83.33¢ per $1 |
| Gini / Inequality Index | 310 | 0.37 |
Earnings by Sex in Franklin borough
Average Earnings in Franklin borough are $33,250, $37,500 for men and $31,250 for women, a difference of 16.7%.
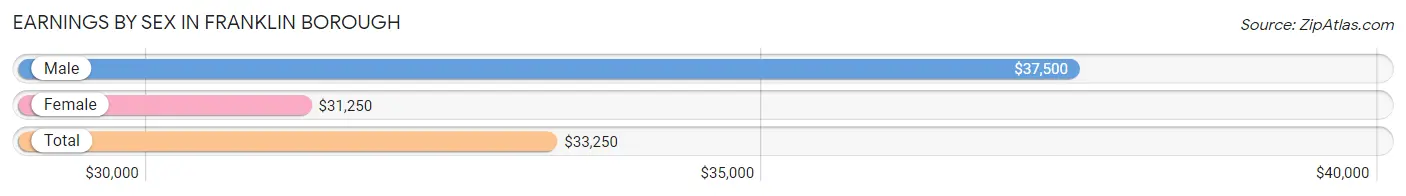
| Sex | Number | Average Earnings |
| Male | 86 (55.1%) | $37,500 |
| Female | 70 (44.9%) | $31,250 |
| Total | 156 (100.0%) | $33,250 |
Earnings by Sex by Income Bracket in Franklin borough
The most common earnings brackets in Franklin borough are $40,000 to $44,999 for men (23 | 26.7%) and $30,000 to $34,999 for women (14 | 20.0%).
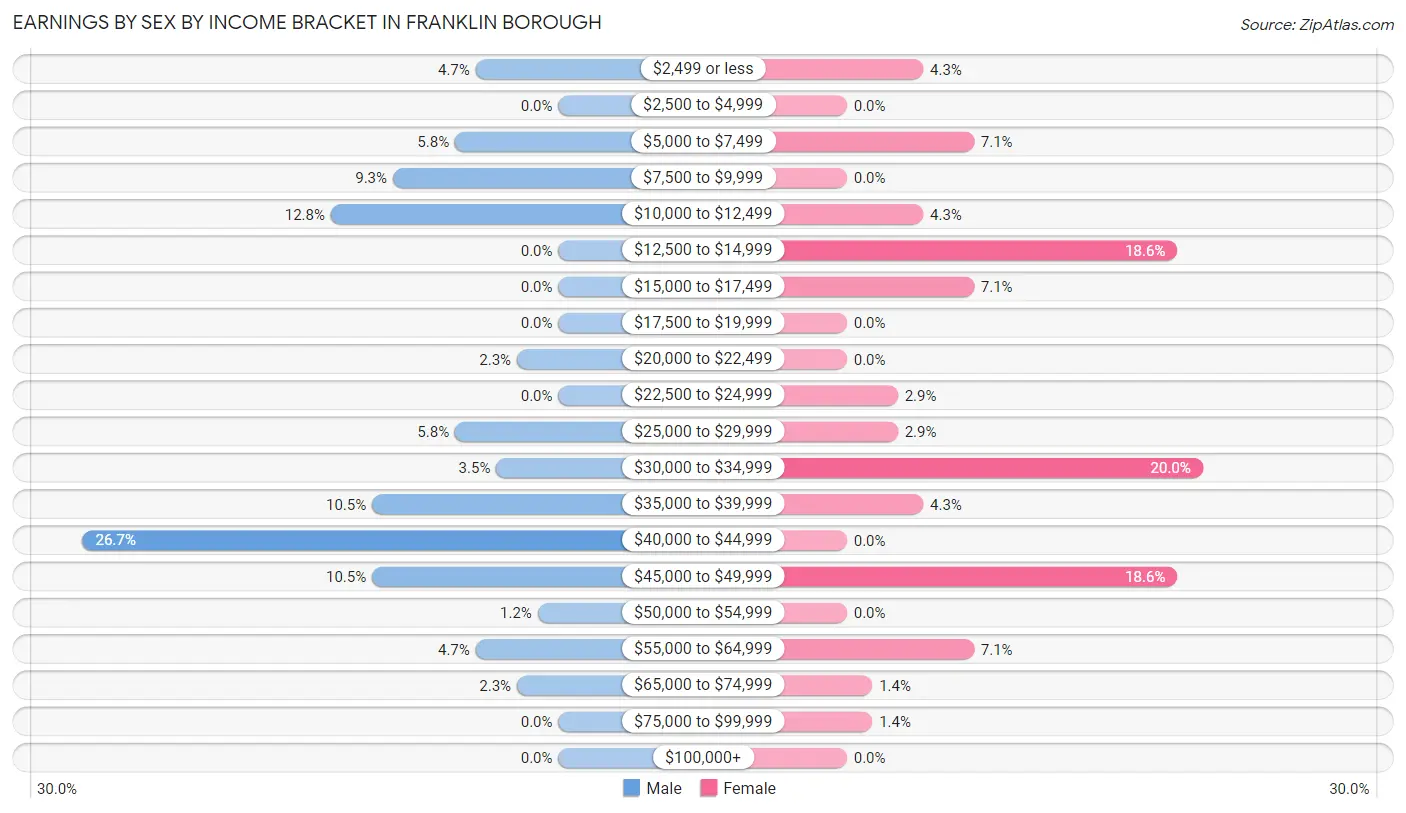
| Income | Male | Female |
| $2,499 or less | 4 (4.6%) | 3 (4.3%) |
| $2,500 to $4,999 | 0 (0.0%) | 0 (0.0%) |
| $5,000 to $7,499 | 5 (5.8%) | 5 (7.1%) |
| $7,500 to $9,999 | 8 (9.3%) | 0 (0.0%) |
| $10,000 to $12,499 | 11 (12.8%) | 3 (4.3%) |
| $12,500 to $14,999 | 0 (0.0%) | 13 (18.6%) |
| $15,000 to $17,499 | 0 (0.0%) | 5 (7.1%) |
| $17,500 to $19,999 | 0 (0.0%) | 0 (0.0%) |
| $20,000 to $22,499 | 2 (2.3%) | 0 (0.0%) |
| $22,500 to $24,999 | 0 (0.0%) | 2 (2.9%) |
| $25,000 to $29,999 | 5 (5.8%) | 2 (2.9%) |
| $30,000 to $34,999 | 3 (3.5%) | 14 (20.0%) |
| $35,000 to $39,999 | 9 (10.5%) | 3 (4.3%) |
| $40,000 to $44,999 | 23 (26.7%) | 0 (0.0%) |
| $45,000 to $49,999 | 9 (10.5%) | 13 (18.6%) |
| $50,000 to $54,999 | 1 (1.2%) | 0 (0.0%) |
| $55,000 to $64,999 | 4 (4.6%) | 5 (7.1%) |
| $65,000 to $74,999 | 2 (2.3%) | 1 (1.4%) |
| $75,000 to $99,999 | 0 (0.0%) | 1 (1.4%) |
| $100,000+ | 0 (0.0%) | 0 (0.0%) |
| Total | 86 (100.0%) | 70 (100.0%) |
Earnings by Sex by Educational Attainment in Franklin borough
Average earnings in Franklin borough are $40,208 for men and $32,188 for women, a difference of 20.0%. Men with an educational attainment of high school diploma enjoy the highest average annual earnings of $40,729, while those with college or associate's degree education earn the least with $38,438. Women with an educational attainment of bachelor's degree earn the most with the average annual earnings of $58,750, while those with high school diploma education have the smallest earnings of $32,813.
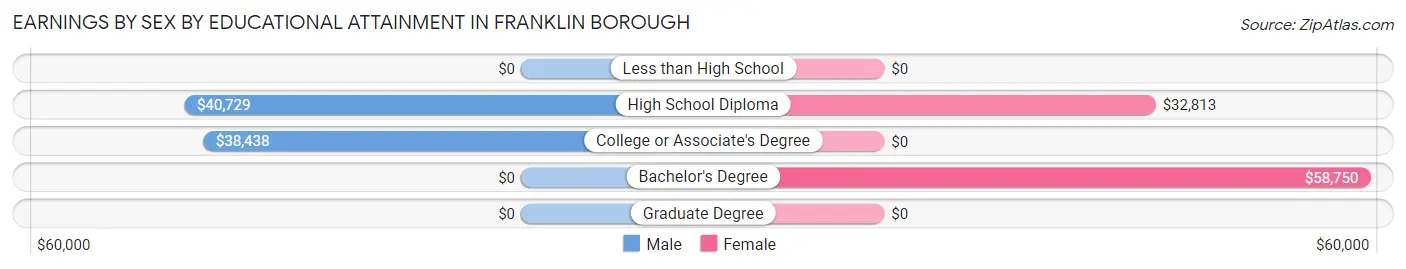
| Educational Attainment | Male Income | Female Income |
| Less than High School | - | - |
| High School Diploma | $40,729 | $32,813 |
| College or Associate's Degree | $38,438 | $0 |
| Bachelor's Degree | - | - |
| Graduate Degree | - | - |
| Total | $40,208 | $32,188 |
Family Income in Franklin borough
Family Income Brackets in Franklin borough
According to the Franklin borough family income data, there are 32 families falling into the $50,000 to $74,999 income range, which is the most common income bracket and makes up 40.0% of all families.
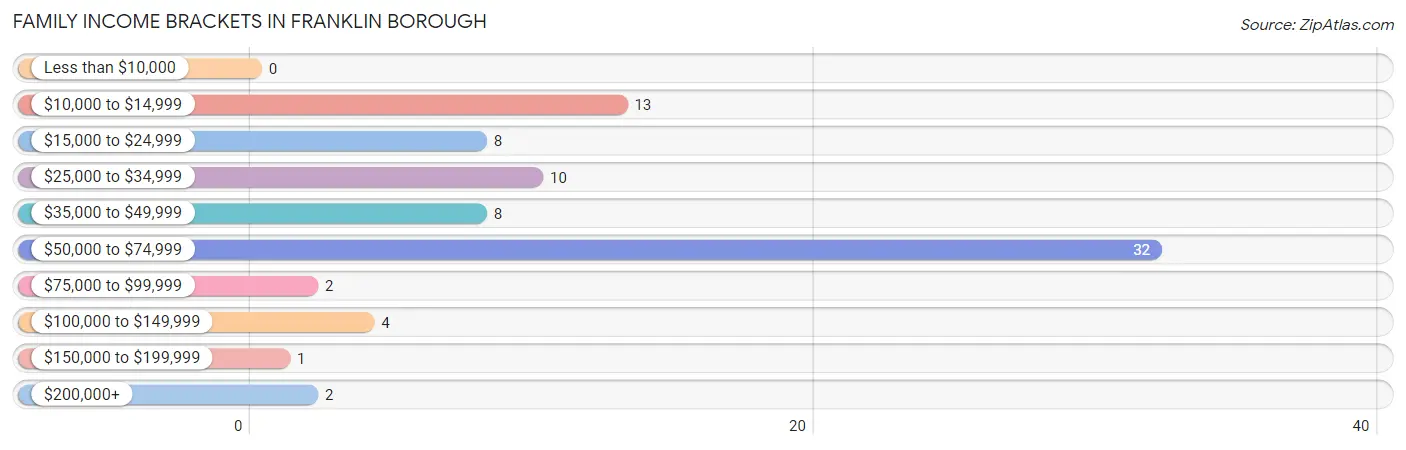
| Income Bracket | # Families | % Families |
| Less than $10,000 | 0 | 0.0% |
| $10,000 to $14,999 | 13 | 16.3% |
| $15,000 to $24,999 | 8 | 10.0% |
| $25,000 to $34,999 | 10 | 12.5% |
| $35,000 to $49,999 | 8 | 10.0% |
| $50,000 to $74,999 | 32 | 40.0% |
| $75,000 to $99,999 | 2 | 2.5% |
| $100,000 to $149,999 | 4 | 5.0% |
| $150,000 to $199,999 | 1 | 1.3% |
| $200,000+ | 2 | 2.5% |
Family Income by Famaliy Size in Franklin borough
3-person families (29 | 36.2%) account for the highest median family income in Franklin borough with $53,625 per family, while 2-person families (33 | 41.2%) have the highest median income of $20,625 per family member.
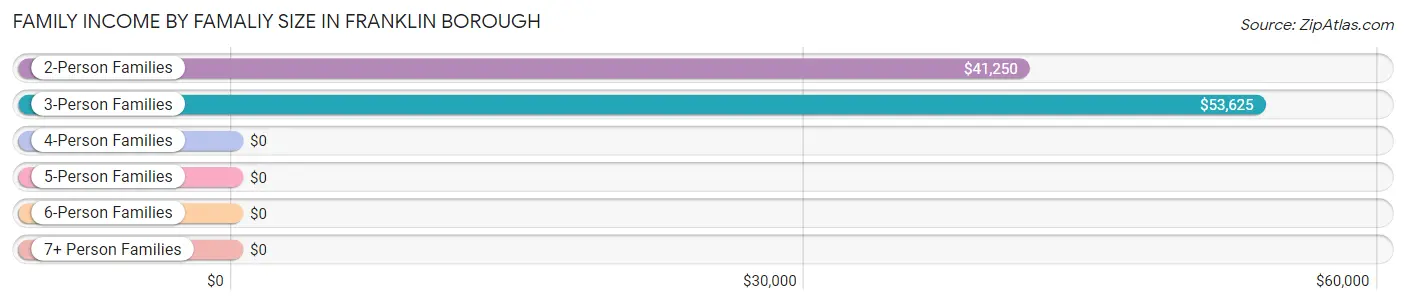
| Income Bracket | # Families | Median Income |
| 2-Person Families | 33 (41.2%) | $41,250 |
| 3-Person Families | 29 (36.2%) | $53,625 |
| 4-Person Families | 12 (15.0%) | $0 |
| 5-Person Families | 4 (5.0%) | $0 |
| 6-Person Families | 0 (0.0%) | $0 |
| 7+ Person Families | 2 (2.5%) | $0 |
| Total | 80 (100.0%) | $52,679 |
Family Income by Number of Earners in Franklin borough
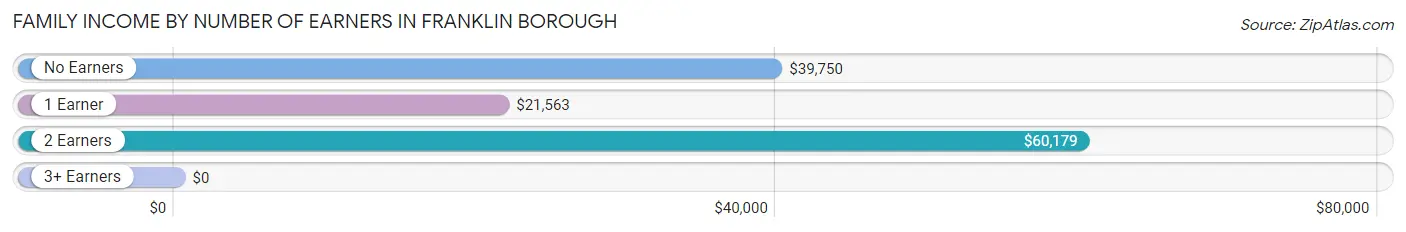
| Number of Earners | # Families | Median Income |
| No Earners | 11 (13.8%) | $39,750 |
| 1 Earner | 31 (38.8%) | $21,563 |
| 2 Earners | 35 (43.8%) | $60,179 |
| 3+ Earners | 3 (3.7%) | $0 |
| Total | 80 (100.0%) | $52,679 |
Household Income in Franklin borough
Household Income Brackets in Franklin borough
With 39 households falling in the category, the $50,000 to $74,999 income range is the most frequent in Franklin borough, accounting for 25.8% of all households. In contrast, only 1 households (0.7%) fall into the $150,000 to $199,999 income bracket, making it the least populous group.
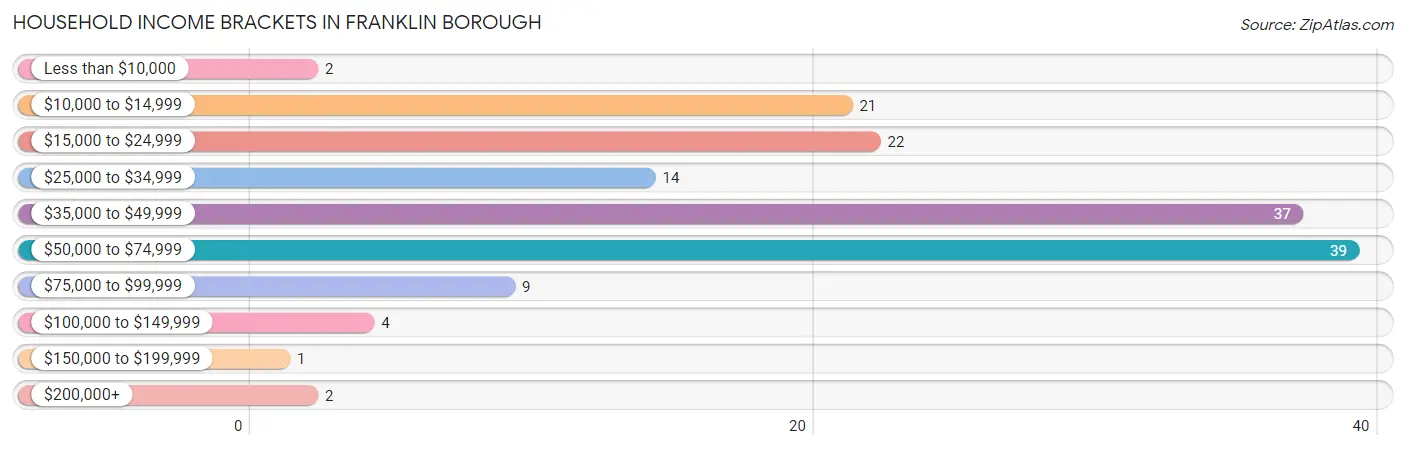
| Income Bracket | # Households | % Households |
| Less than $10,000 | 2 | 1.3% |
| $10,000 to $14,999 | 21 | 13.9% |
| $15,000 to $24,999 | 22 | 14.6% |
| $25,000 to $34,999 | 14 | 9.3% |
| $35,000 to $49,999 | 37 | 24.5% |
| $50,000 to $74,999 | 39 | 25.8% |
| $75,000 to $99,999 | 9 | 6.0% |
| $100,000 to $149,999 | 4 | 2.6% |
| $150,000 to $199,999 | 1 | 0.7% |
| $200,000+ | 2 | 1.3% |
Household Income by Householder Age in Franklin borough
The median household income in Franklin borough is $39,044, with the highest median household income of $43,875 found in the 25 to 44 years age bracket for the primary householder. A total of 65 households (43.0%) fall into this category. Meanwhile, the 15 to 24 years age bracket for the primary householder has the lowest median household income of $0, with 12 households (8.0%) in this group.
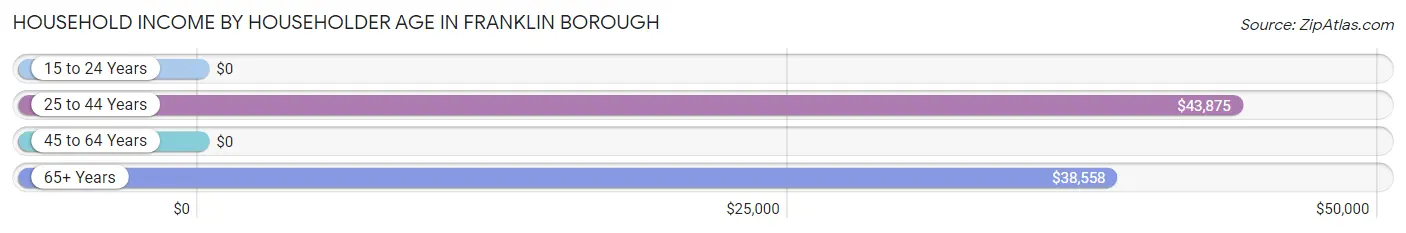
| Income Bracket | # Households | Median Income |
| 15 to 24 Years | 12 (8.0%) | $0 |
| 25 to 44 Years | 65 (43.0%) | $43,875 |
| 45 to 64 Years | 27 (17.9%) | $0 |
| 65+ Years | 47 (31.1%) | $38,558 |
| Total | 151 (100.0%) | $39,044 |
Poverty in Franklin borough
Income Below Poverty by Sex and Age in Franklin borough
With 32.3% poverty level for males and 19.3% for females among the residents of Franklin borough, 16 and 17 year old males and 18 to 24 year old females are the most vulnerable to poverty, with 1 males (100.0%) and 7 females (46.7%) in their respective age groups living below the poverty level.
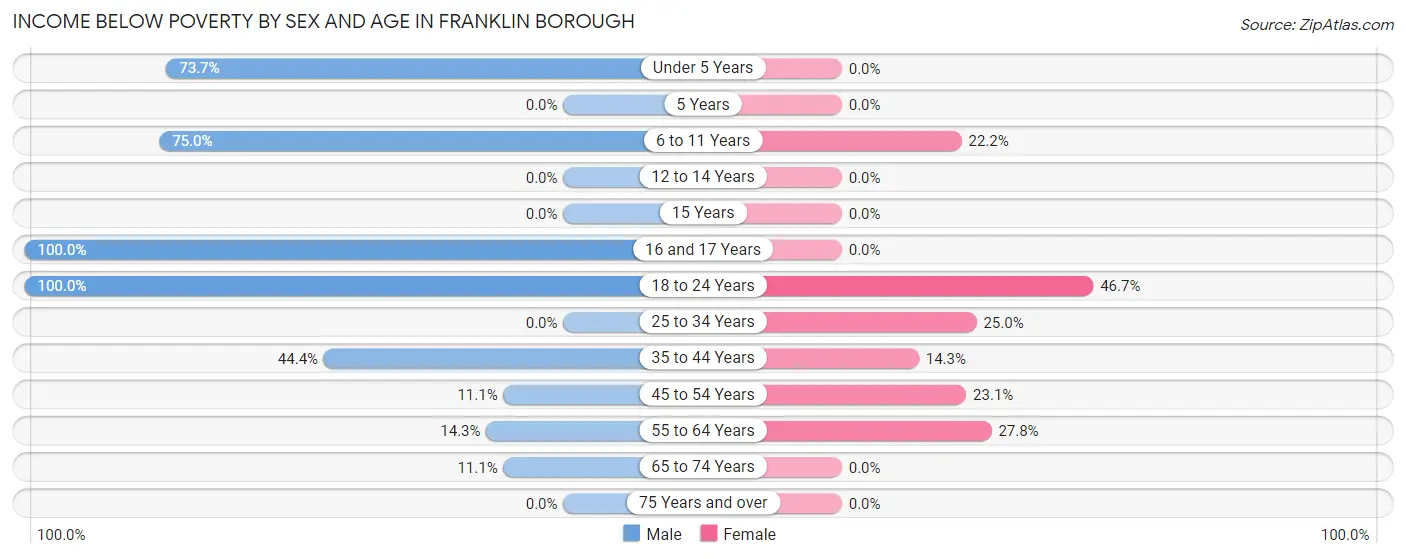
| Age Bracket | Male | Female |
| Under 5 Years | 14 (73.7%) | 0 (0.0%) |
| 5 Years | 0 (0.0%) | 0 (0.0%) |
| 6 to 11 Years | 12 (75.0%) | 4 (22.2%) |
| 12 to 14 Years | 0 (0.0%) | 0 (0.0%) |
| 15 Years | 0 (0.0%) | 0 (0.0%) |
| 16 and 17 Years | 1 (100.0%) | 0 (0.0%) |
| 18 to 24 Years | 11 (100.0%) | 7 (46.7%) |
| 25 to 34 Years | 0 (0.0%) | 7 (25.0%) |
| 35 to 44 Years | 8 (44.4%) | 3 (14.3%) |
| 45 to 54 Years | 1 (11.1%) | 3 (23.1%) |
| 55 to 64 Years | 2 (14.3%) | 5 (27.8%) |
| 65 to 74 Years | 2 (11.1%) | 0 (0.0%) |
| 75 Years and over | 0 (0.0%) | 0 (0.0%) |
| Total | 51 (32.3%) | 29 (19.3%) |
Income Above Poverty by Sex and Age in Franklin borough
According to the poverty statistics in Franklin borough, males aged 5 years and females aged under 5 years are the age groups that are most secure financially, with 100.0% of males and 100.0% of females in these age groups living above the poverty line.
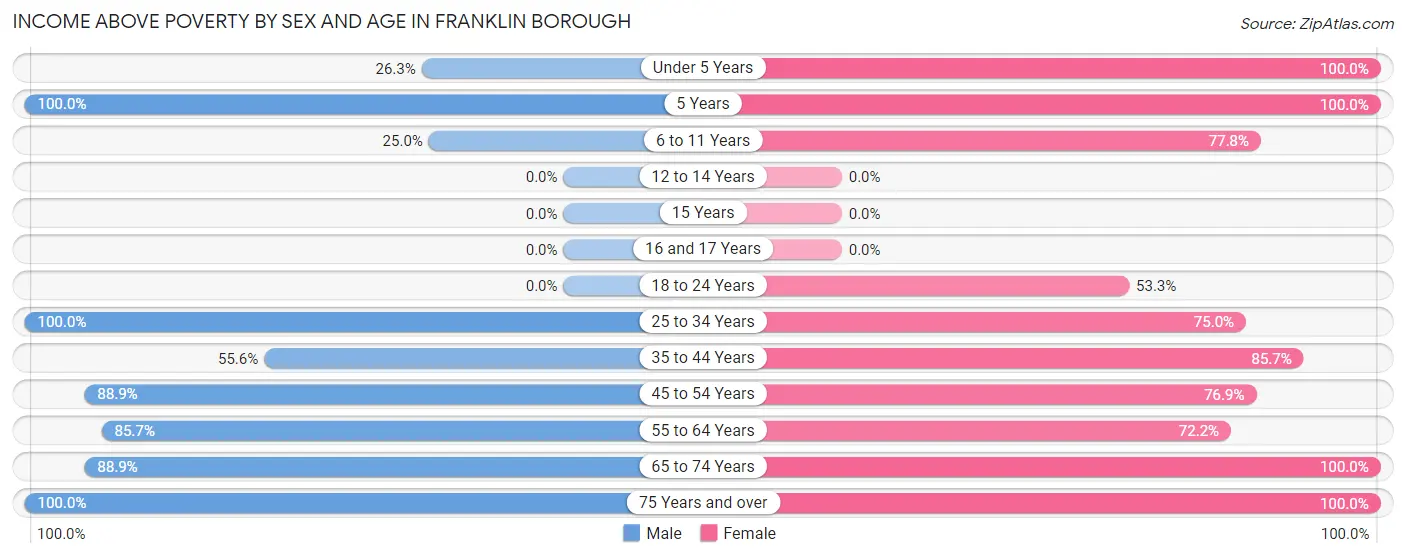
| Age Bracket | Male | Female |
| Under 5 Years | 5 (26.3%) | 13 (100.0%) |
| 5 Years | 4 (100.0%) | 1 (100.0%) |
| 6 to 11 Years | 4 (25.0%) | 14 (77.8%) |
| 12 to 14 Years | 0 (0.0%) | 0 (0.0%) |
| 15 Years | 0 (0.0%) | 0 (0.0%) |
| 16 and 17 Years | 0 (0.0%) | 0 (0.0%) |
| 18 to 24 Years | 0 (0.0%) | 8 (53.3%) |
| 25 to 34 Years | 33 (100.0%) | 21 (75.0%) |
| 35 to 44 Years | 10 (55.6%) | 18 (85.7%) |
| 45 to 54 Years | 8 (88.9%) | 10 (76.9%) |
| 55 to 64 Years | 12 (85.7%) | 13 (72.2%) |
| 65 to 74 Years | 16 (88.9%) | 10 (100.0%) |
| 75 Years and over | 15 (100.0%) | 13 (100.0%) |
| Total | 107 (67.7%) | 121 (80.7%) |
Income Below Poverty Among Married-Couple Families in Franklin borough
The poverty statistics for married-couple families in Franklin borough show that 30.2% or 13 of the total 43 families live below the poverty line. Families with 1 or 2 children have the highest poverty rate of 41.7%, comprising of 10 families. On the other hand, families with 3 or 4 children have the lowest poverty rate of 0.0%, which includes 0 families.
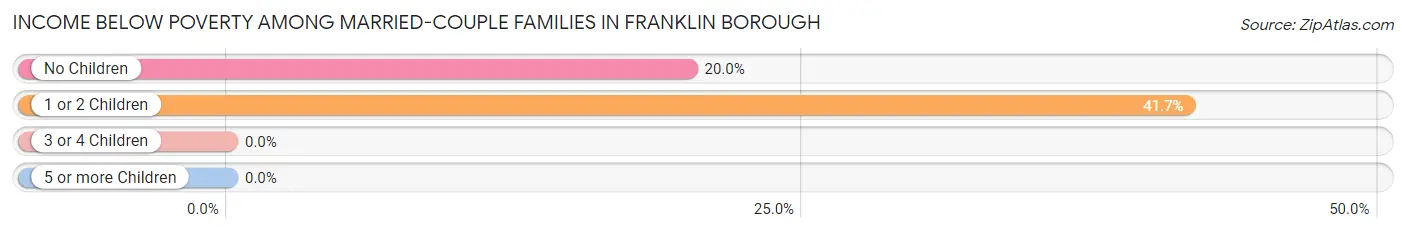
| Children | Above Poverty | Below Poverty |
| No Children | 12 (80.0%) | 3 (20.0%) |
| 1 or 2 Children | 14 (58.3%) | 10 (41.7%) |
| 3 or 4 Children | 4 (100.0%) | 0 (0.0%) |
| 5 or more Children | 0 (0.0%) | 0 (0.0%) |
| Total | 30 (69.8%) | 13 (30.2%) |
Income Below Poverty Among Single-Parent Households in Franklin borough
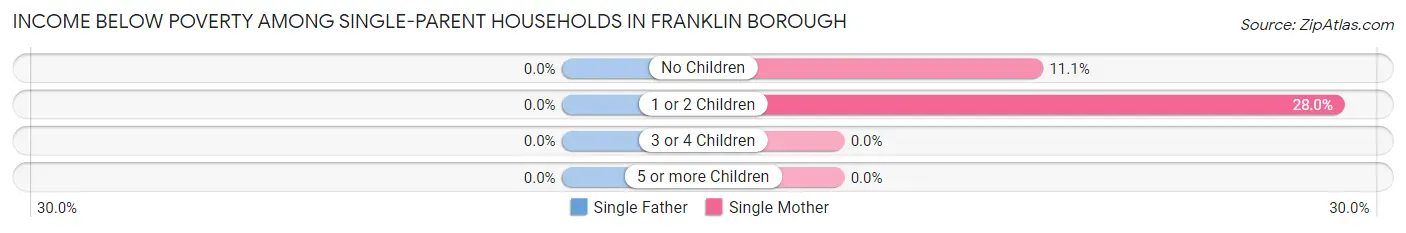
| Children | Single Father | Single Mother |
| No Children | 0 (0.0%) | 1 (11.1%) |
| 1 or 2 Children | 0 (0.0%) | 7 (28.0%) |
| 3 or 4 Children | 0 (0.0%) | 0 (0.0%) |
| 5 or more Children | 0 (0.0%) | 0 (0.0%) |
| Total | 0 (0.0%) | 8 (23.5%) |
Income Below Poverty Among Married-Couple vs Single-Parent Households in Franklin borough
The poverty data for Franklin borough shows that 13 of the married-couple family households (30.2%) and 8 of the single-parent households (21.6%) are living below the poverty level. Within the married-couple family households, those with 1 or 2 children have the highest poverty rate, with 10 households (41.7%) falling below the poverty line. Among the single-parent households, those with 1 or 2 children have the highest poverty rate, with 7 household (28.0%) living below poverty.
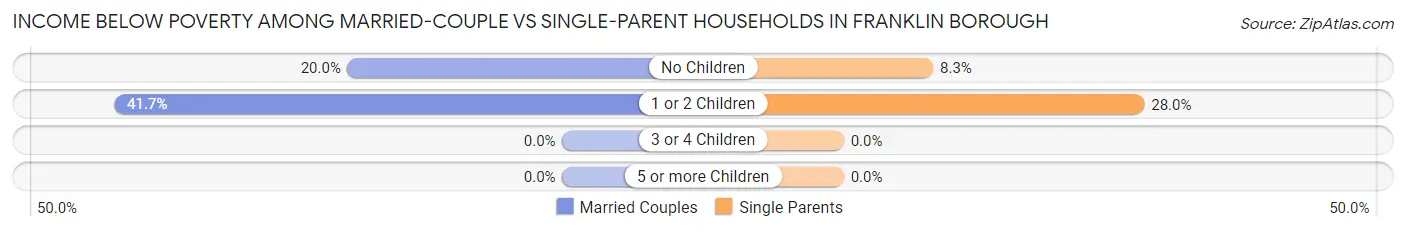
| Children | Married-Couple Families | Single-Parent Households |
| No Children | 3 (20.0%) | 1 (8.3%) |
| 1 or 2 Children | 10 (41.7%) | 7 (28.0%) |
| 3 or 4 Children | 0 (0.0%) | 0 (0.0%) |
| 5 or more Children | 0 (0.0%) | 0 (0.0%) |
| Total | 13 (30.2%) | 8 (21.6%) |
Employment Characteristics in Franklin borough
Employment by Class of Employer in Franklin borough
Among the 136 employed individuals in Franklin borough, private company employees (119 | 87.5%), self-employed (not incorporated) (9 | 6.6%), and not-for-profit organizations (4 | 2.9%) make up the most common classes of employment.
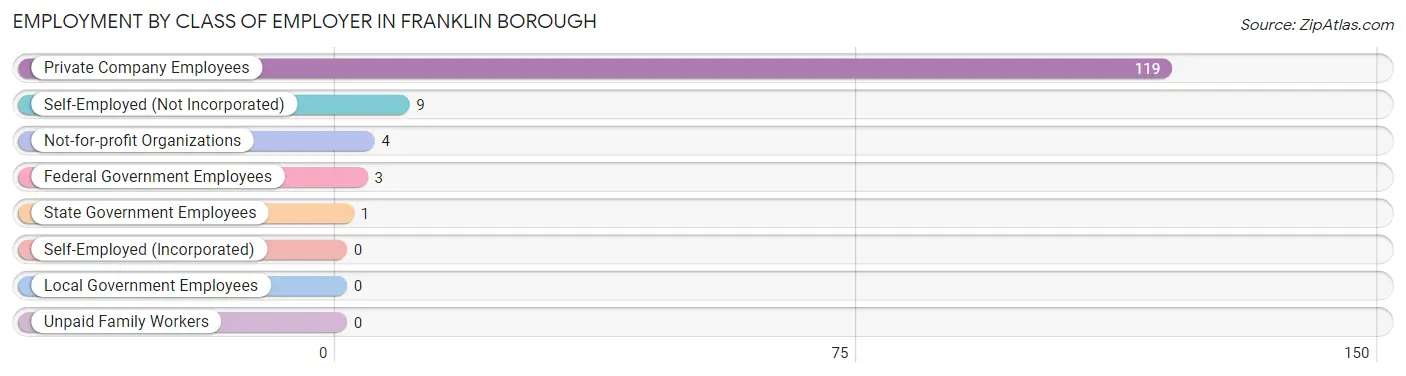
| Employer Class | # Employees | % Employees |
| Private Company Employees | 119 | 87.5% |
| Self-Employed (Incorporated) | 0 | 0.0% |
| Self-Employed (Not Incorporated) | 9 | 6.6% |
| Not-for-profit Organizations | 4 | 2.9% |
| Local Government Employees | 0 | 0.0% |
| State Government Employees | 1 | 0.7% |
| Federal Government Employees | 3 | 2.2% |
| Unpaid Family Workers | 0 | 0.0% |
| Total | 136 | 100.0% |
Employment Status by Age in Franklin borough
According to the labor force statistics for Franklin borough, out of the total population over 16 years of age (237), 66.2% or 157 individuals are in the labor force, with 3.2% or 5 of them unemployed. The age group with the highest labor force participation rate is 25 to 29 years, with 100.0% or 26 individuals in the labor force. Within the labor force, the 35 to 44 years age range has the highest percentage of unemployed individuals, with 10.3% or 4 of them being unemployed.
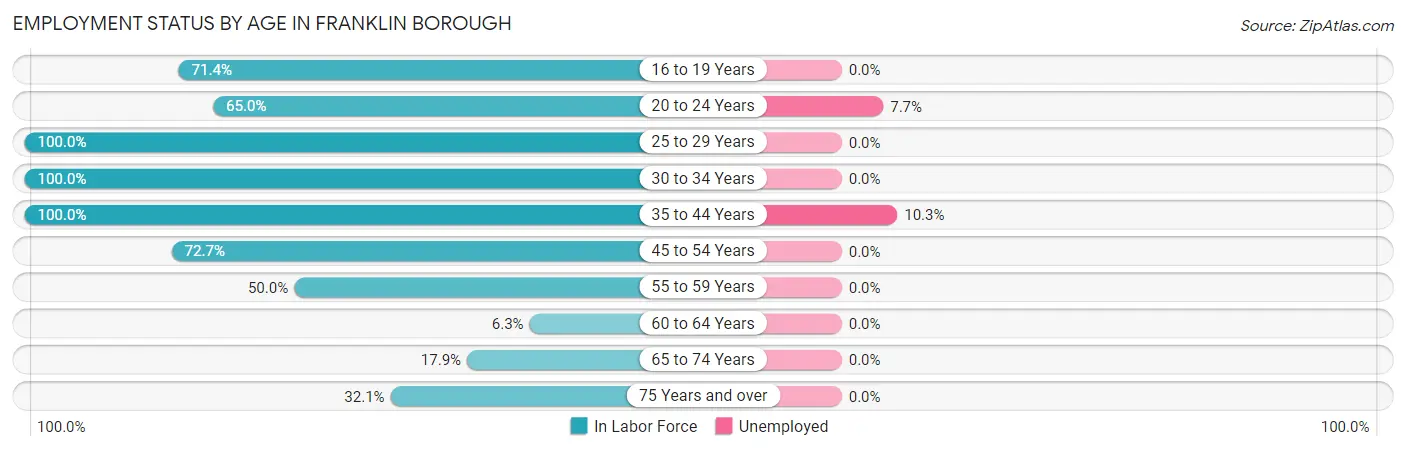
| Age Bracket | In Labor Force | Unemployed |
| 16 to 19 Years | 5 (71.4%) | 0 (0.0%) |
| 20 to 24 Years | 13 (65.0%) | 1 (7.7%) |
| 25 to 29 Years | 26 (100.0%) | 0 (0.0%) |
| 30 to 34 Years | 35 (100.0%) | 0 (0.0%) |
| 35 to 44 Years | 39 (100.0%) | 4 (10.3%) |
| 45 to 54 Years | 16 (72.7%) | 0 (0.0%) |
| 55 to 59 Years | 8 (50.0%) | 0 (0.0%) |
| 60 to 64 Years | 1 (6.3%) | 0 (0.0%) |
| 65 to 74 Years | 5 (17.9%) | 0 (0.0%) |
| 75 Years and over | 9 (32.1%) | 0 (0.0%) |
| Total | 157 (66.2%) | 5 (3.2%) |
Employment Status by Educational Attainment in Franklin borough
According to labor force statistics for Franklin borough, 81.2% of individuals (125) out of the total population between 25 and 64 years of age (154) are in the labor force, with 3.2% or 4 of them being unemployed. The group with the highest labor force participation rate are those with the educational attainment of bachelor's degree or higher, with 100.0% or 9 individuals in the labor force. Within the labor force, individuals with high school diploma education have the highest percentage of unemployment, with 6.6% or 4 of them being unemployed.
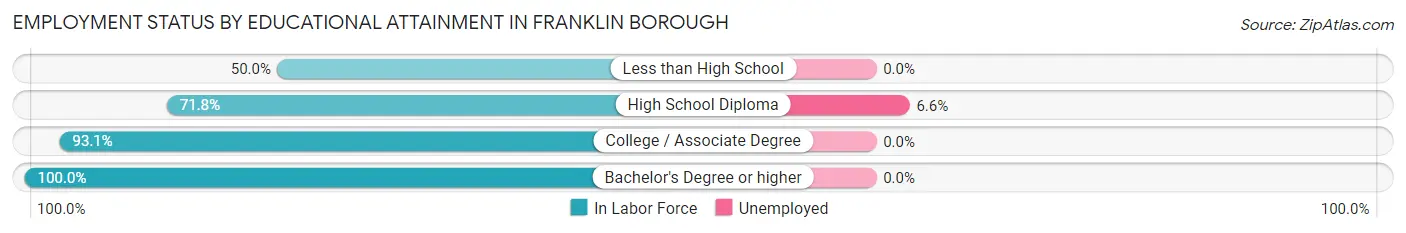
| Educational Attainment | In Labor Force | Unemployed |
| Less than High School | 1 (50.0%) | 0 (0.0%) |
| High School Diploma | 61 (71.8%) | 6 (6.6%) |
| College / Associate Degree | 54 (93.1%) | 0 (0.0%) |
| Bachelor's Degree or higher | 9 (100.0%) | 0 (0.0%) |
| Total | 125 (81.2%) | 5 (3.2%) |
Employment Occupations by Sex in Franklin borough
Management, Business, Science and Arts Occupations
The most common Management, Business, Science and Arts occupations in Franklin borough are Health Diagnosing & Treating (15 | 9.9%), Computers, Engineering & Science (7 | 4.6%), Computers & Mathematics (5 | 3.3%), Business & Financial (4 | 2.6%), and Life, Physical & Social Science (2 | 1.3%).
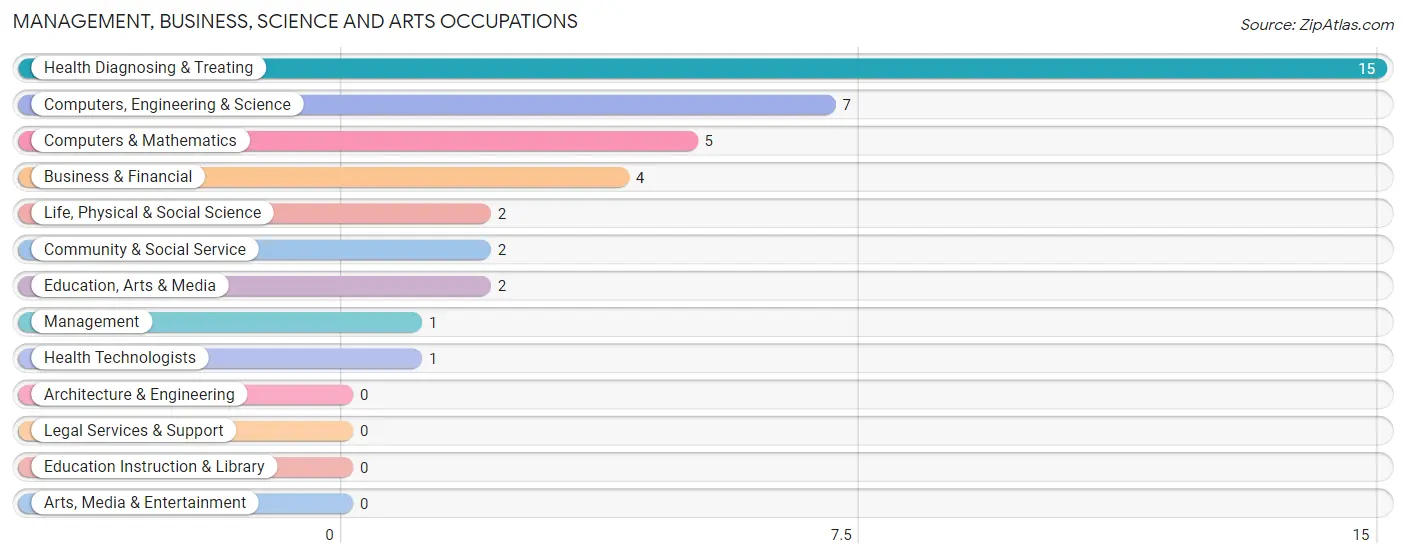
Management, Business, Science and Arts Occupations by Sex
Within the Management, Business, Science and Arts occupations in Franklin borough, the most male-oriented occupations are Management (100.0%), Computers, Engineering & Science (100.0%), and Computers & Mathematics (100.0%), while the most female-oriented occupations are Business & Financial (100.0%), Community & Social Service (100.0%), and Education, Arts & Media (100.0%).
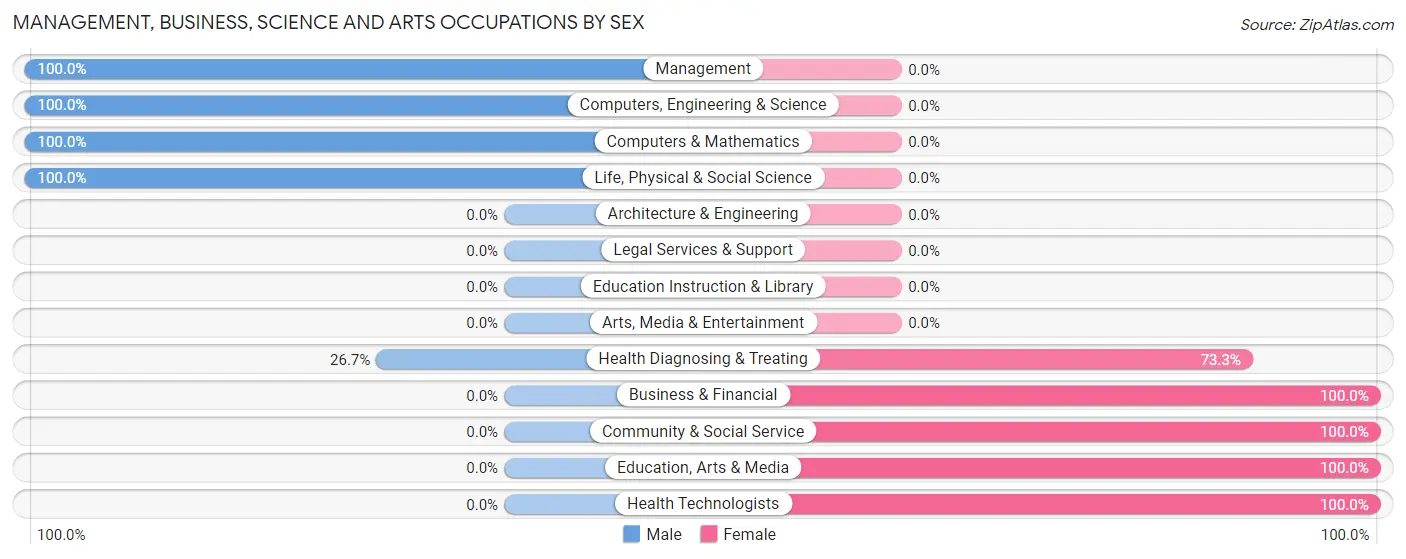
| Occupation | Male | Female |
| Management | 1 (100.0%) | 0 (0.0%) |
| Business & Financial | 0 (0.0%) | 4 (100.0%) |
| Computers, Engineering & Science | 7 (100.0%) | 0 (0.0%) |
| Computers & Mathematics | 5 (100.0%) | 0 (0.0%) |
| Architecture & Engineering | 0 (0.0%) | 0 (0.0%) |
| Life, Physical & Social Science | 2 (100.0%) | 0 (0.0%) |
| Community & Social Service | 0 (0.0%) | 2 (100.0%) |
| Education, Arts & Media | 0 (0.0%) | 2 (100.0%) |
| Legal Services & Support | 0 (0.0%) | 0 (0.0%) |
| Education Instruction & Library | 0 (0.0%) | 0 (0.0%) |
| Arts, Media & Entertainment | 0 (0.0%) | 0 (0.0%) |
| Health Diagnosing & Treating | 4 (26.7%) | 11 (73.3%) |
| Health Technologists | 0 (0.0%) | 1 (100.0%) |
| Total (Category) | 12 (41.4%) | 17 (58.6%) |
| Total (Overall) | 82 (53.9%) | 70 (46.1%) |
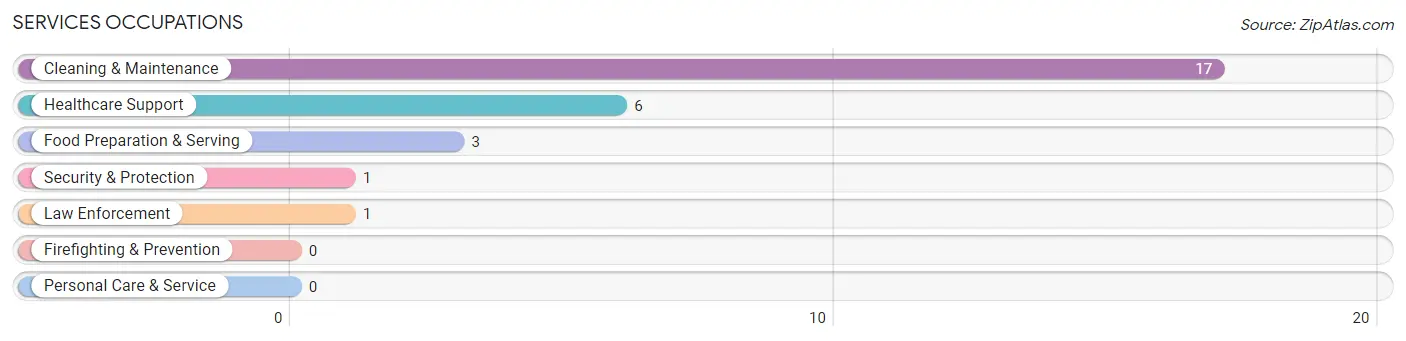
Services Occupations
The most common Services occupations in Franklin borough are Cleaning & Maintenance (17 | 11.2%), Healthcare Support (6 | 4.0%), Food Preparation & Serving (3 | 2.0%), Security & Protection (1 | 0.7%), and Law Enforcement (1 | 0.7%).
Services Occupations by Sex
Within the Services occupations in Franklin borough, the most male-oriented occupations are Security & Protection (100.0%), Law Enforcement (100.0%), and Cleaning & Maintenance (70.6%), while the most female-oriented occupations are Healthcare Support (100.0%), Food Preparation & Serving (100.0%), and Cleaning & Maintenance (29.4%).
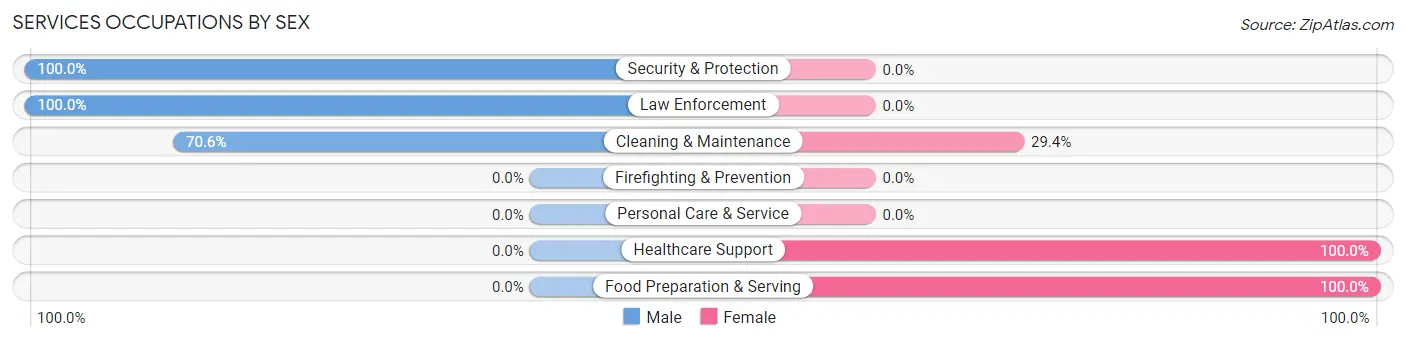
| Occupation | Male | Female |
| Healthcare Support | 0 (0.0%) | 6 (100.0%) |
| Security & Protection | 1 (100.0%) | 0 (0.0%) |
| Firefighting & Prevention | 0 (0.0%) | 0 (0.0%) |
| Law Enforcement | 1 (100.0%) | 0 (0.0%) |
| Food Preparation & Serving | 0 (0.0%) | 3 (100.0%) |
| Cleaning & Maintenance | 12 (70.6%) | 5 (29.4%) |
| Personal Care & Service | 0 (0.0%) | 0 (0.0%) |
| Total (Category) | 13 (48.1%) | 14 (51.8%) |
| Total (Overall) | 82 (53.9%) | 70 (46.1%) |
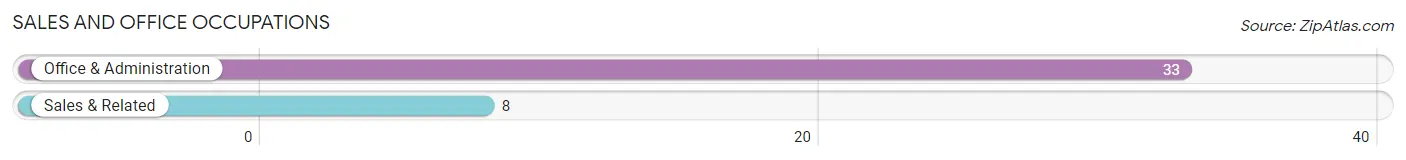
Sales and Office Occupations
The most common Sales and Office occupations in Franklin borough are Office & Administration (33 | 21.7%), and Sales & Related (8 | 5.3%).
Sales and Office Occupations by Sex
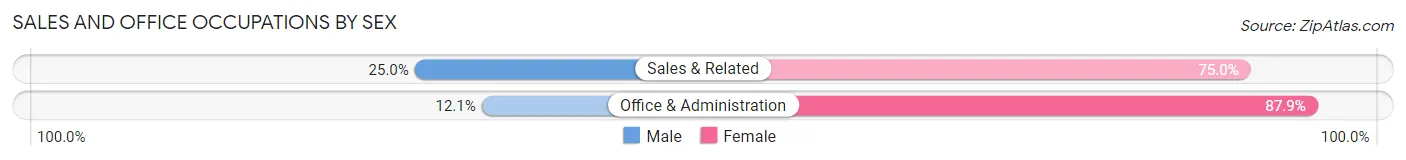
| Occupation | Male | Female |
| Sales & Related | 2 (25.0%) | 6 (75.0%) |
| Office & Administration | 4 (12.1%) | 29 (87.9%) |
| Total (Category) | 6 (14.6%) | 35 (85.4%) |
| Total (Overall) | 82 (53.9%) | 70 (46.1%) |
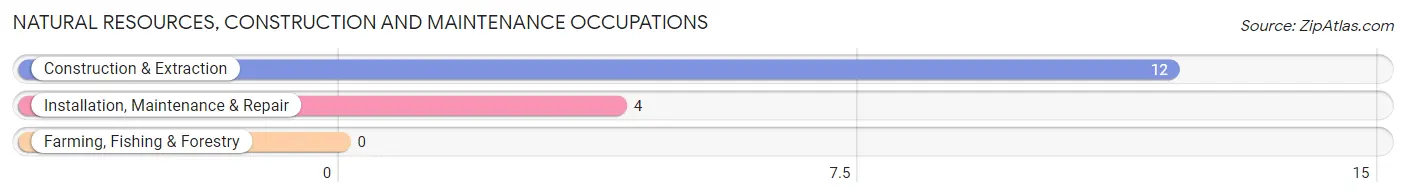
Natural Resources, Construction and Maintenance Occupations
The most common Natural Resources, Construction and Maintenance occupations in Franklin borough are Construction & Extraction (12 | 7.9%), and Installation, Maintenance & Repair (4 | 2.6%).
Natural Resources, Construction and Maintenance Occupations by Sex
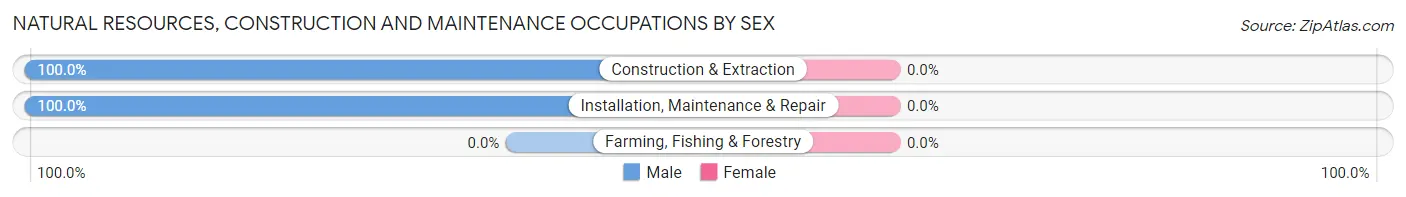
| Occupation | Male | Female |
| Farming, Fishing & Forestry | 0 (0.0%) | 0 (0.0%) |
| Construction & Extraction | 12 (100.0%) | 0 (0.0%) |
| Installation, Maintenance & Repair | 4 (100.0%) | 0 (0.0%) |
| Total (Category) | 16 (100.0%) | 0 (0.0%) |
| Total (Overall) | 82 (53.9%) | 70 (46.1%) |
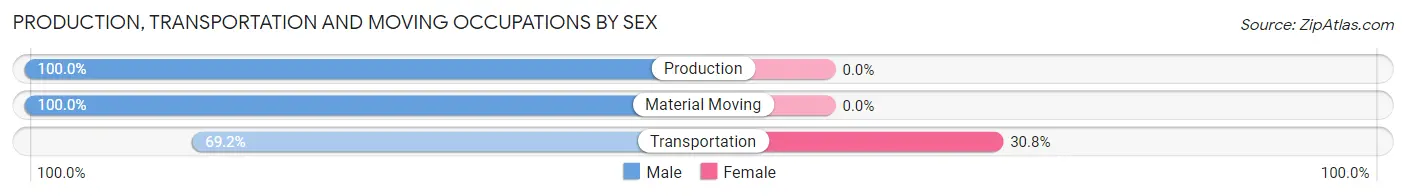
Production, Transportation and Moving Occupations
The most common Production, Transportation and Moving occupations in Franklin borough are Production (20 | 13.2%), Transportation (13 | 8.6%), and Material Moving (6 | 4.0%).
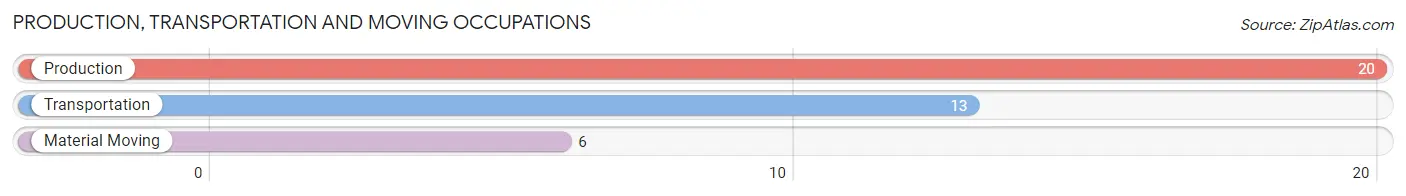
Production, Transportation and Moving Occupations by Sex
| Occupation | Male | Female |
| Production | 20 (100.0%) | 0 (0.0%) |
| Transportation | 9 (69.2%) | 4 (30.8%) |
| Material Moving | 6 (100.0%) | 0 (0.0%) |
| Total (Category) | 35 (89.7%) | 4 (10.3%) |
| Total (Overall) | 82 (53.9%) | 70 (46.1%) |
Employment Industries by Sex in Franklin borough
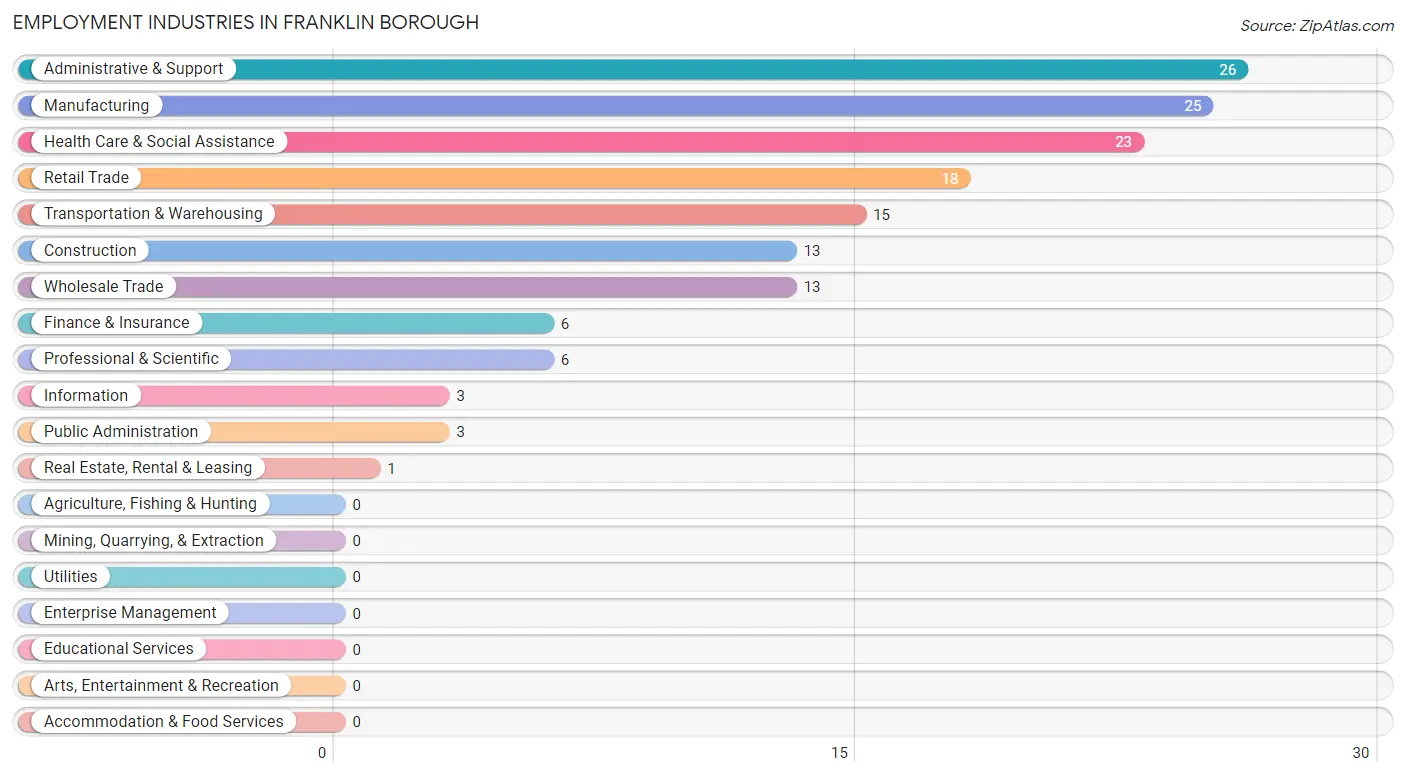
Employment Industries in Franklin borough
The major employment industries in Franklin borough include Administrative & Support (26 | 17.1%), Manufacturing (25 | 16.5%), Health Care & Social Assistance (23 | 15.1%), Retail Trade (18 | 11.8%), and Transportation & Warehousing (15 | 9.9%).
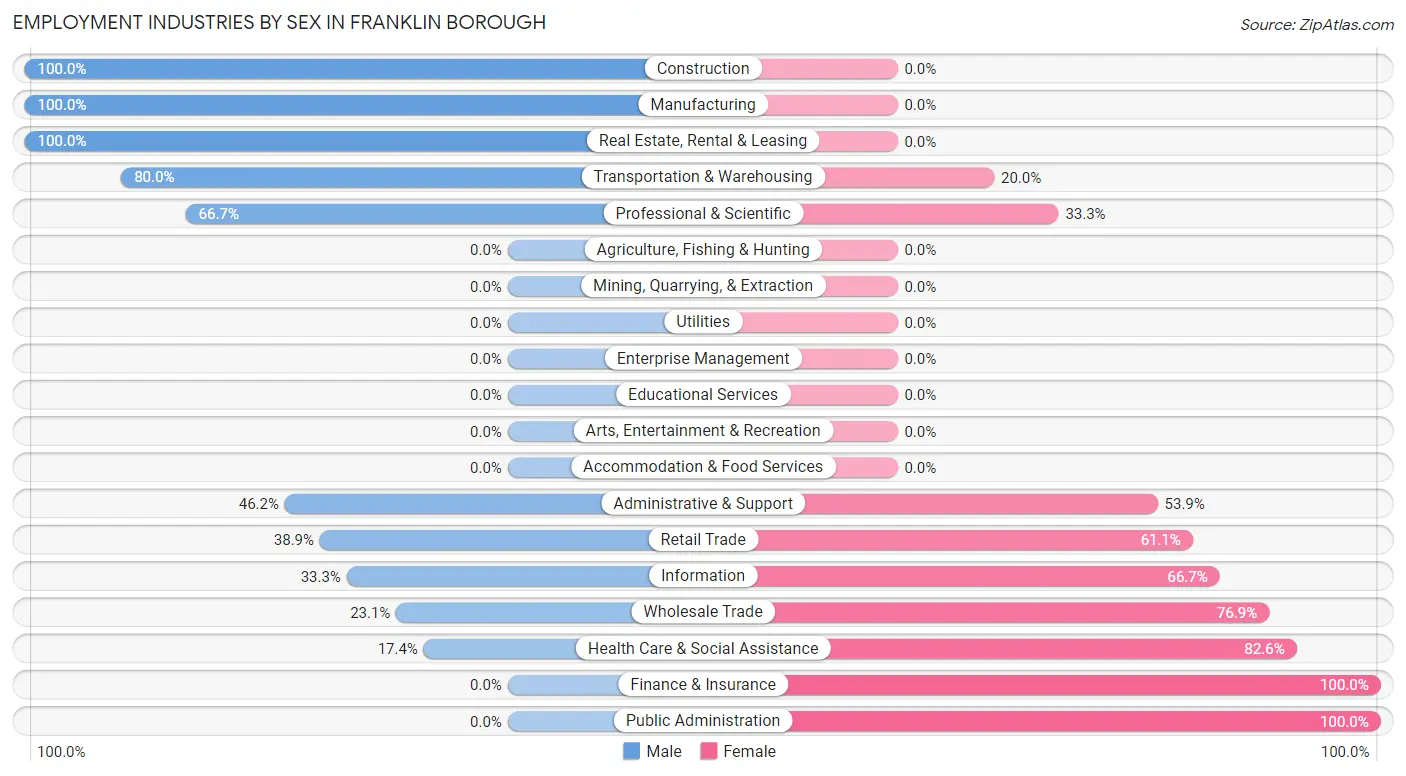
Employment Industries by Sex in Franklin borough
The Franklin borough industries that see more men than women are Construction (100.0%), Manufacturing (100.0%), and Real Estate, Rental & Leasing (100.0%), whereas the industries that tend to have a higher number of women are Finance & Insurance (100.0%), Public Administration (100.0%), and Health Care & Social Assistance (82.6%).
| Industry | Male | Female |
| Agriculture, Fishing & Hunting | 0 (0.0%) | 0 (0.0%) |
| Mining, Quarrying, & Extraction | 0 (0.0%) | 0 (0.0%) |
| Construction | 13 (100.0%) | 0 (0.0%) |
| Manufacturing | 25 (100.0%) | 0 (0.0%) |
| Wholesale Trade | 3 (23.1%) | 10 (76.9%) |
| Retail Trade | 7 (38.9%) | 11 (61.1%) |
| Transportation & Warehousing | 12 (80.0%) | 3 (20.0%) |
| Utilities | 0 (0.0%) | 0 (0.0%) |
| Information | 1 (33.3%) | 2 (66.7%) |
| Finance & Insurance | 0 (0.0%) | 6 (100.0%) |
| Real Estate, Rental & Leasing | 1 (100.0%) | 0 (0.0%) |
| Professional & Scientific | 4 (66.7%) | 2 (33.3%) |
| Enterprise Management | 0 (0.0%) | 0 (0.0%) |
| Administrative & Support | 12 (46.2%) | 14 (53.8%) |
| Educational Services | 0 (0.0%) | 0 (0.0%) |
| Health Care & Social Assistance | 4 (17.4%) | 19 (82.6%) |
| Arts, Entertainment & Recreation | 0 (0.0%) | 0 (0.0%) |
| Accommodation & Food Services | 0 (0.0%) | 0 (0.0%) |
| Public Administration | 0 (0.0%) | 3 (100.0%) |
| Total | 82 (53.9%) | 70 (46.1%) |
Education in Franklin borough
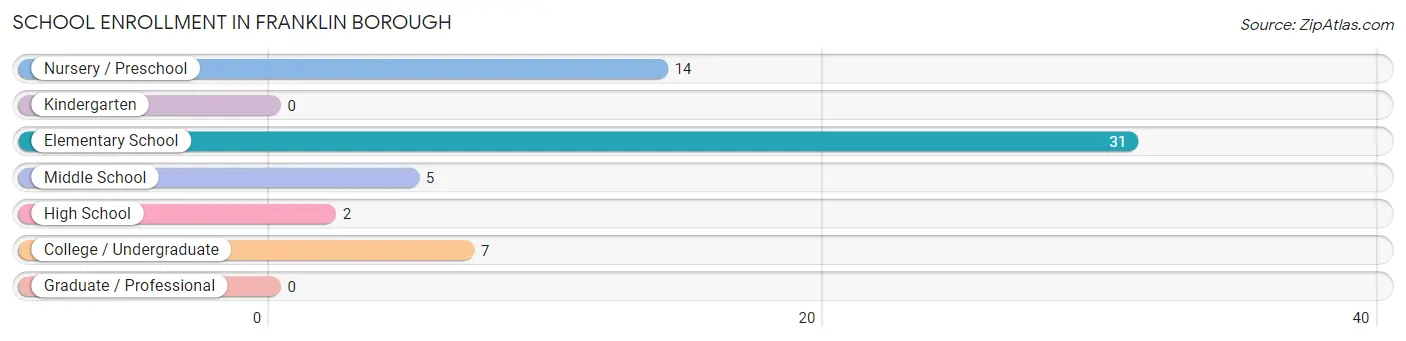
School Enrollment in Franklin borough
The most common levels of schooling among the 59 students in Franklin borough are elementary school (31 | 52.5%), nursery / preschool (14 | 23.7%), and college / undergraduate (7 | 11.9%).
| School Level | # Students | % Students |
| Nursery / Preschool | 14 | 23.7% |
| Kindergarten | 0 | 0.0% |
| Elementary School | 31 | 52.5% |
| Middle School | 5 | 8.5% |
| High School | 2 | 3.4% |
| College / Undergraduate | 7 | 11.9% |
| Graduate / Professional | 0 | 0.0% |
| Total | 59 | 100.0% |
School Enrollment by Age by Funding Source in Franklin borough
Out of a total of 59 students who are enrolled in schools in Franklin borough, 18 (30.5%) attend a private institution, while the remaining 41 (69.5%) are enrolled in public schools. The age group of 3 to 4 year olds has the highest likelihood of being enrolled in private schools, with 14 (100.0% in the age bracket) enrolled. Conversely, the age group of 10 to 14 year olds has the lowest likelihood of being enrolled in a private school, with 7 (100.0% in the age bracket) attending a public institution.
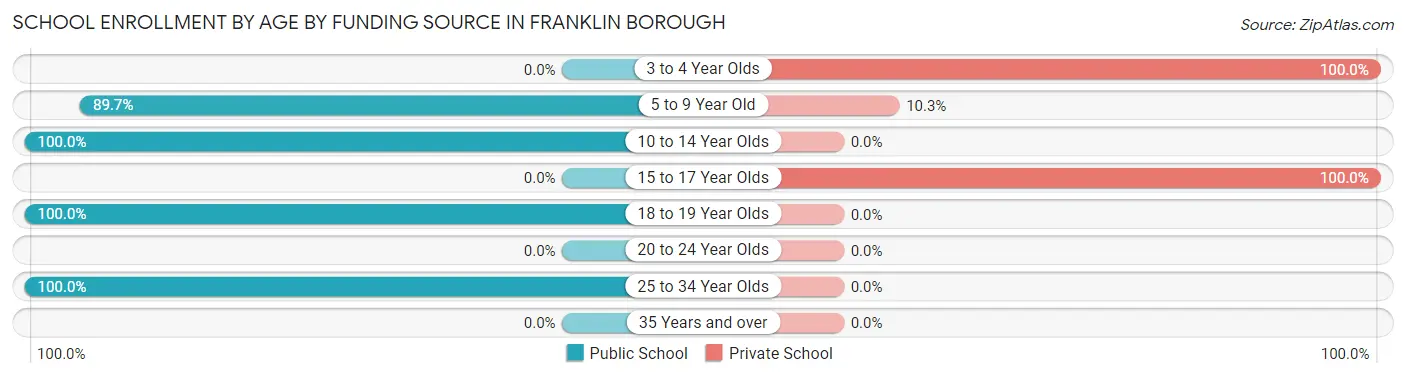
| Age Bracket | Public School | Private School |
| 3 to 4 Year Olds | 0 (0.0%) | 14 (100.0%) |
| 5 to 9 Year Old | 26 (89.7%) | 3 (10.3%) |
| 10 to 14 Year Olds | 7 (100.0%) | 0 (0.0%) |
| 15 to 17 Year Olds | 0 (0.0%) | 1 (100.0%) |
| 18 to 19 Year Olds | 6 (100.0%) | 0 (0.0%) |
| 20 to 24 Year Olds | 0 (0.0%) | 0 (0.0%) |
| 25 to 34 Year Olds | 2 (100.0%) | 0 (0.0%) |
| 35 Years and over | 0 (0.0%) | 0 (0.0%) |
| Total | 41 (69.5%) | 18 (30.5%) |
Educational Attainment by Field of Study in Franklin borough
Business (6 | 50.0%), bio, nature & agricultural (2 | 16.7%), psychology (2 | 16.7%), and education (2 | 16.7%) are the most common fields of study among 12 individuals in Franklin borough who have obtained a bachelor's degree or higher.
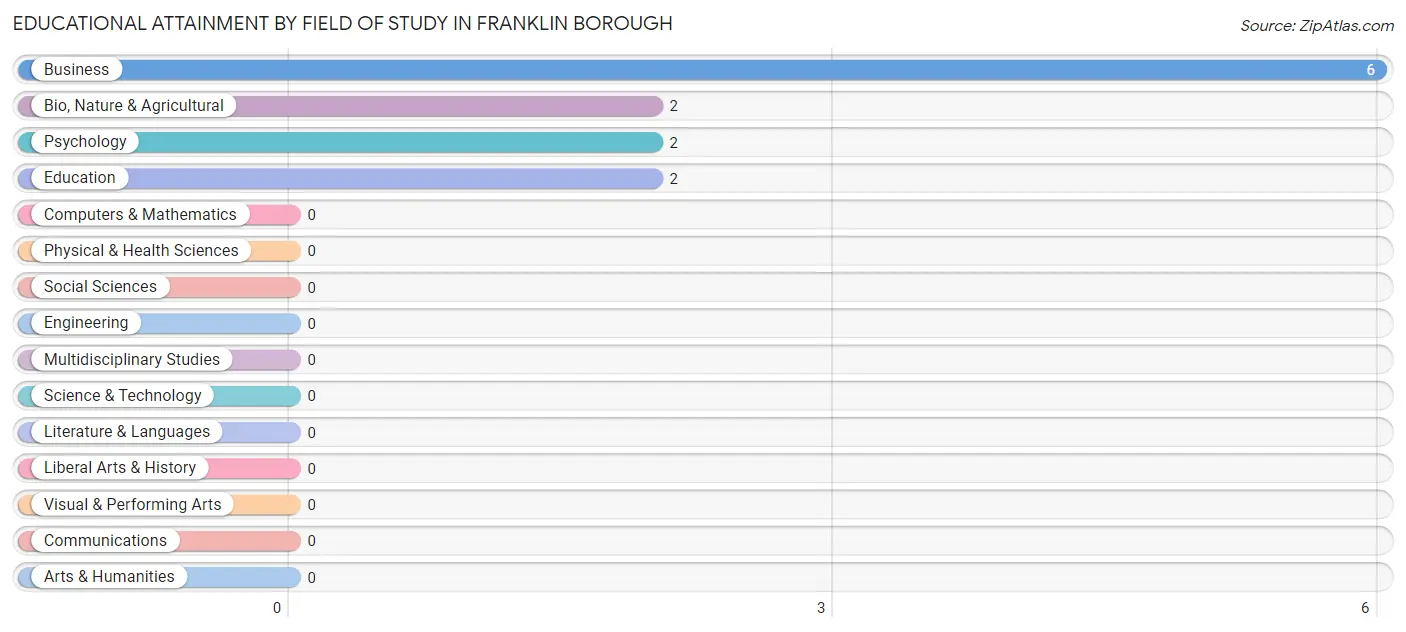
| Field of Study | # Graduates | % Graduates |
| Computers & Mathematics | 0 | 0.0% |
| Bio, Nature & Agricultural | 2 | 16.7% |
| Physical & Health Sciences | 0 | 0.0% |
| Psychology | 2 | 16.7% |
| Social Sciences | 0 | 0.0% |
| Engineering | 0 | 0.0% |
| Multidisciplinary Studies | 0 | 0.0% |
| Science & Technology | 0 | 0.0% |
| Business | 6 | 50.0% |
| Education | 2 | 16.7% |
| Literature & Languages | 0 | 0.0% |
| Liberal Arts & History | 0 | 0.0% |
| Visual & Performing Arts | 0 | 0.0% |
| Communications | 0 | 0.0% |
| Arts & Humanities | 0 | 0.0% |
| Total | 12 | 100.0% |
Transportation & Commute in Franklin borough
Vehicle Availability by Sex in Franklin borough
The most prevalent vehicle ownership categories in Franklin borough are males with 2 vehicles (43, accounting for 58.9%) and females with 2 vehicles (30, making up 68.2%).
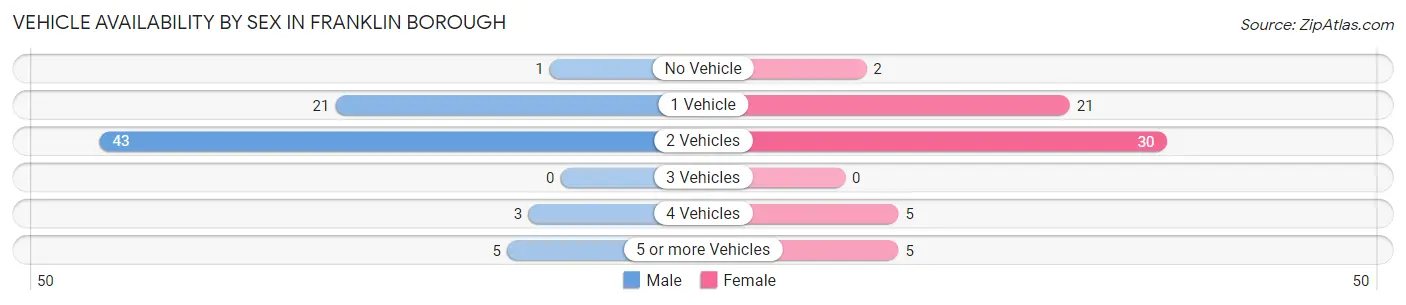
| Vehicles Available | Male | Female |
| No Vehicle | 1 (1.4%) | 2 (3.2%) |
| 1 Vehicle | 21 (28.8%) | 21 (33.3%) |
| 2 Vehicles | 43 (58.9%) | 30 (47.6%) |
| 3 Vehicles | 0 (0.0%) | 0 (0.0%) |
| 4 Vehicles | 3 (4.1%) | 5 (7.9%) |
| 5 or more Vehicles | 5 (6.9%) | 5 (7.9%) |
| Total | 73 (100.0%) | 63 (100.0%) |
Commute Time in Franklin borough
The most frequently occuring commute durations in Franklin borough are 10 to 14 minutes (34 commuters, 27.0%), 15 to 19 minutes (31 commuters, 24.6%), and 5 to 9 minutes (24 commuters, 19.1%).
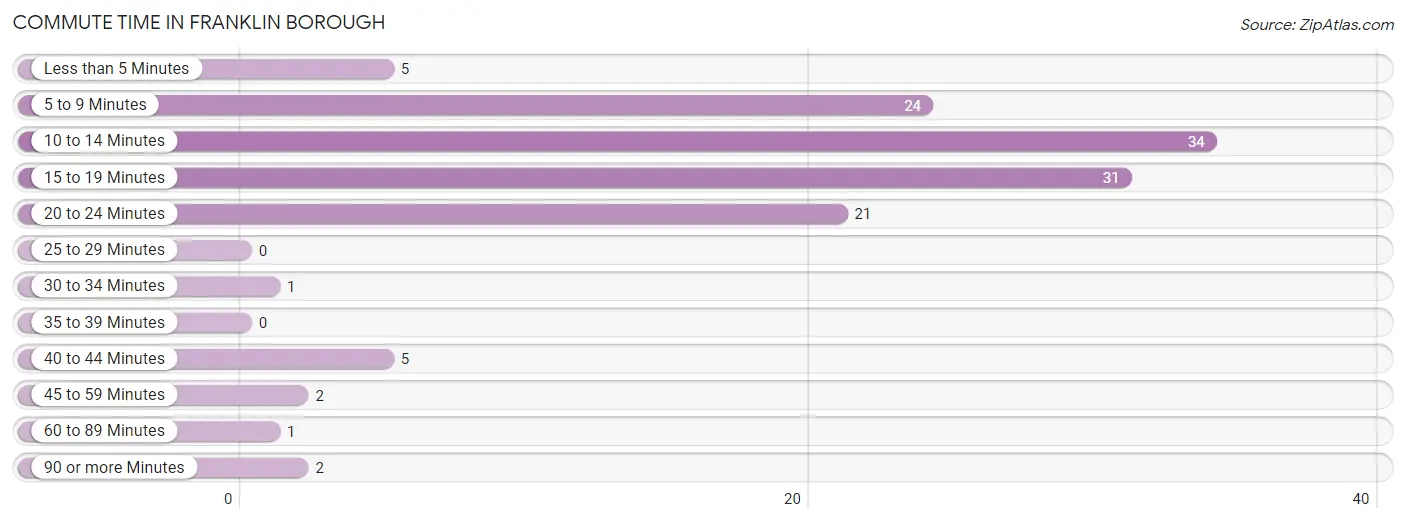
| Commute Time | # Commuters | % Commuters |
| Less than 5 Minutes | 5 | 4.0% |
| 5 to 9 Minutes | 24 | 19.1% |
| 10 to 14 Minutes | 34 | 27.0% |
| 15 to 19 Minutes | 31 | 24.6% |
| 20 to 24 Minutes | 21 | 16.7% |
| 25 to 29 Minutes | 0 | 0.0% |
| 30 to 34 Minutes | 1 | 0.8% |
| 35 to 39 Minutes | 0 | 0.0% |
| 40 to 44 Minutes | 5 | 4.0% |
| 45 to 59 Minutes | 2 | 1.6% |
| 60 to 89 Minutes | 1 | 0.8% |
| 90 or more Minutes | 2 | 1.6% |
Commute Time by Sex in Franklin borough
The most common commute times in Franklin borough are 15 to 19 minutes (25 commuters, 39.1%) for males and 10 to 14 minutes (24 commuters, 38.7%) for females.
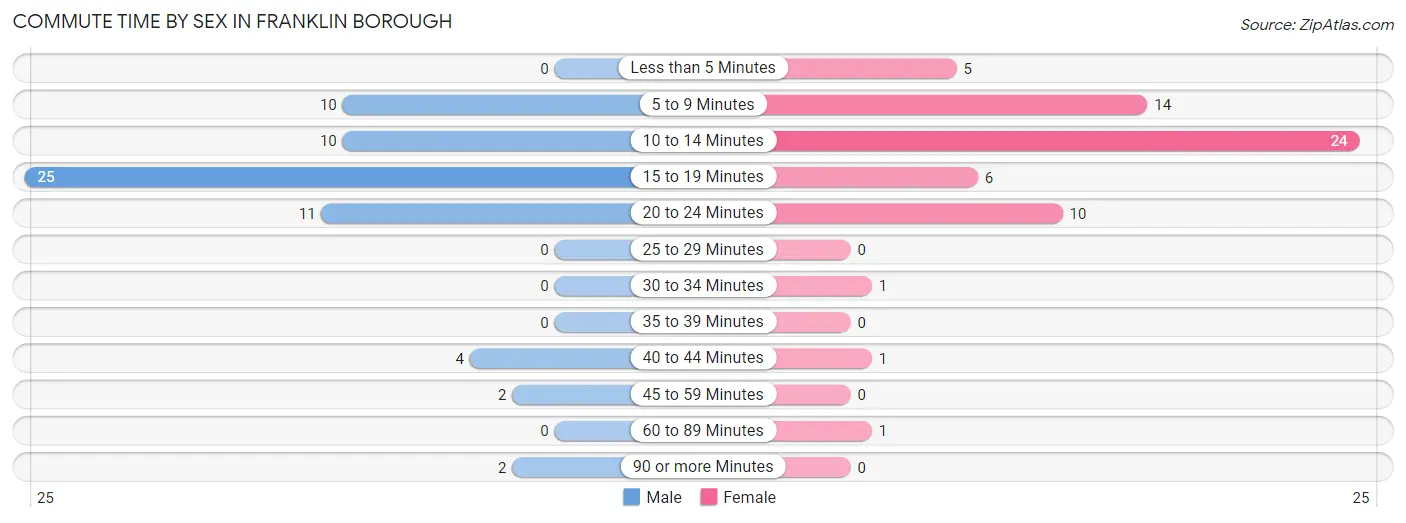
| Commute Time | Male | Female |
| Less than 5 Minutes | 0 (0.0%) | 5 (8.1%) |
| 5 to 9 Minutes | 10 (15.6%) | 14 (22.6%) |
| 10 to 14 Minutes | 10 (15.6%) | 24 (38.7%) |
| 15 to 19 Minutes | 25 (39.1%) | 6 (9.7%) |
| 20 to 24 Minutes | 11 (17.2%) | 10 (16.1%) |
| 25 to 29 Minutes | 0 (0.0%) | 0 (0.0%) |
| 30 to 34 Minutes | 0 (0.0%) | 1 (1.6%) |
| 35 to 39 Minutes | 0 (0.0%) | 0 (0.0%) |
| 40 to 44 Minutes | 4 (6.2%) | 1 (1.6%) |
| 45 to 59 Minutes | 2 (3.1%) | 0 (0.0%) |
| 60 to 89 Minutes | 0 (0.0%) | 1 (1.6%) |
| 90 or more Minutes | 2 (3.1%) | 0 (0.0%) |
Time of Departure to Work by Sex in Franklin borough
The most frequent times of departure to work in Franklin borough are 6:30 AM to 6:59 AM (15, 23.4%) for males and 7:00 AM to 7:29 AM (20, 32.3%) for females.
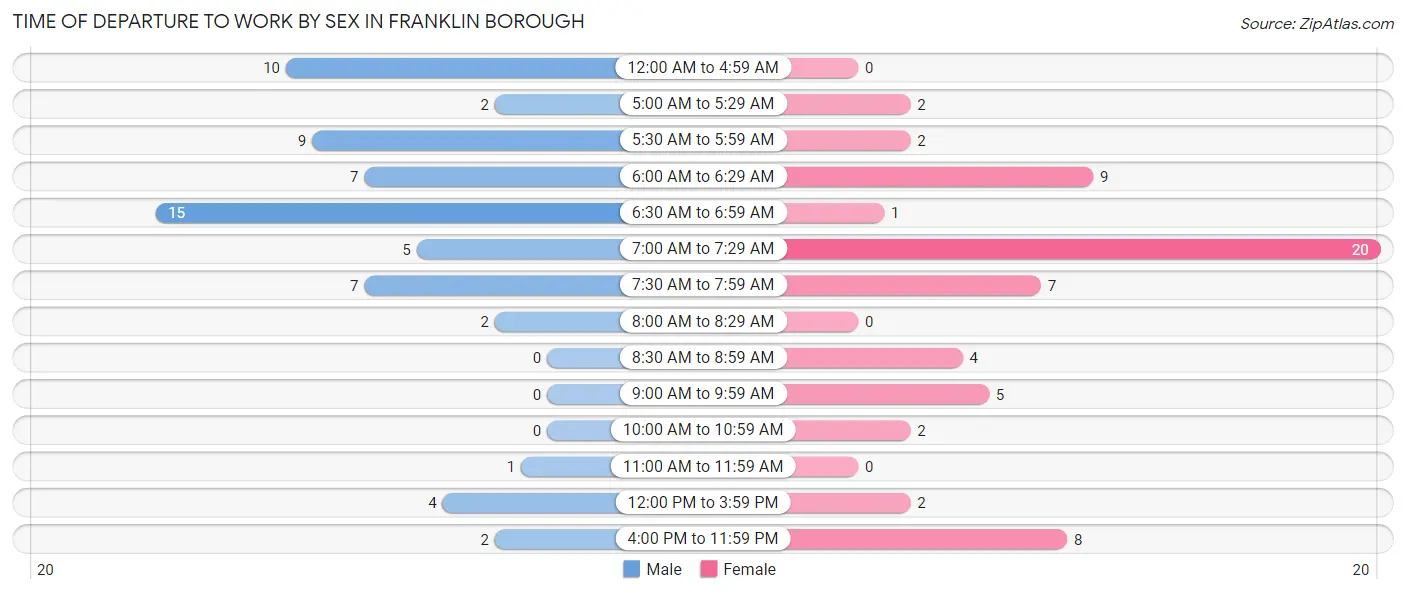
| Time of Departure | Male | Female |
| 12:00 AM to 4:59 AM | 10 (15.6%) | 0 (0.0%) |
| 5:00 AM to 5:29 AM | 2 (3.1%) | 2 (3.2%) |
| 5:30 AM to 5:59 AM | 9 (14.1%) | 2 (3.2%) |
| 6:00 AM to 6:29 AM | 7 (10.9%) | 9 (14.5%) |
| 6:30 AM to 6:59 AM | 15 (23.4%) | 1 (1.6%) |
| 7:00 AM to 7:29 AM | 5 (7.8%) | 20 (32.3%) |
| 7:30 AM to 7:59 AM | 7 (10.9%) | 7 (11.3%) |
| 8:00 AM to 8:29 AM | 2 (3.1%) | 0 (0.0%) |
| 8:30 AM to 8:59 AM | 0 (0.0%) | 4 (6.5%) |
| 9:00 AM to 9:59 AM | 0 (0.0%) | 5 (8.1%) |
| 10:00 AM to 10:59 AM | 0 (0.0%) | 2 (3.2%) |
| 11:00 AM to 11:59 AM | 1 (1.6%) | 0 (0.0%) |
| 12:00 PM to 3:59 PM | 4 (6.2%) | 2 (3.2%) |
| 4:00 PM to 11:59 PM | 2 (3.1%) | 8 (12.9%) |
| Total | 64 (100.0%) | 62 (100.0%) |
Housing Occupancy in Franklin borough
Occupancy by Ownership in Franklin borough
Of the total 151 dwellings in Franklin borough, owner-occupied units account for 118 (78.1%), while renter-occupied units make up 33 (21.8%).
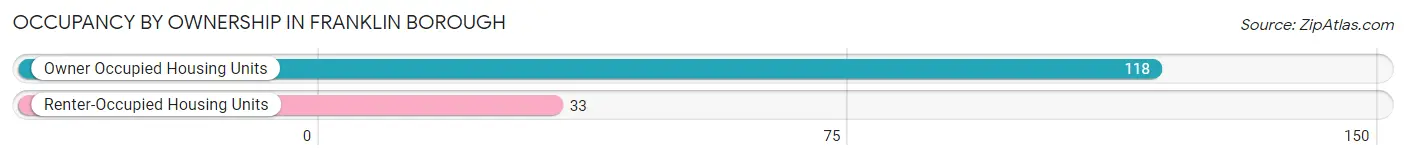
| Occupancy | # Housing Units | % Housing Units |
| Owner Occupied Housing Units | 118 | 78.1% |
| Renter-Occupied Housing Units | 33 | 21.8% |
| Total Occupied Housing Units | 151 | 100.0% |
Occupancy by Household Size in Franklin borough
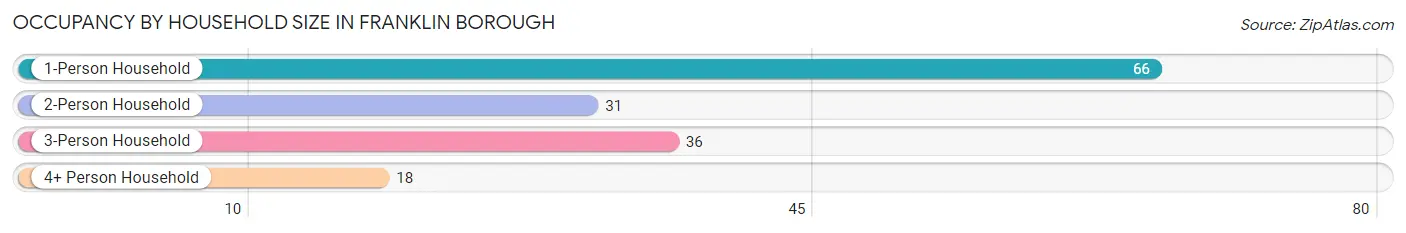
| Household Size | # Housing Units | % Housing Units |
| 1-Person Household | 66 | 43.7% |
| 2-Person Household | 31 | 20.5% |
| 3-Person Household | 36 | 23.8% |
| 4+ Person Household | 18 | 11.9% |
| Total Housing Units | 151 | 100.0% |
Occupancy by Ownership by Household Size in Franklin borough
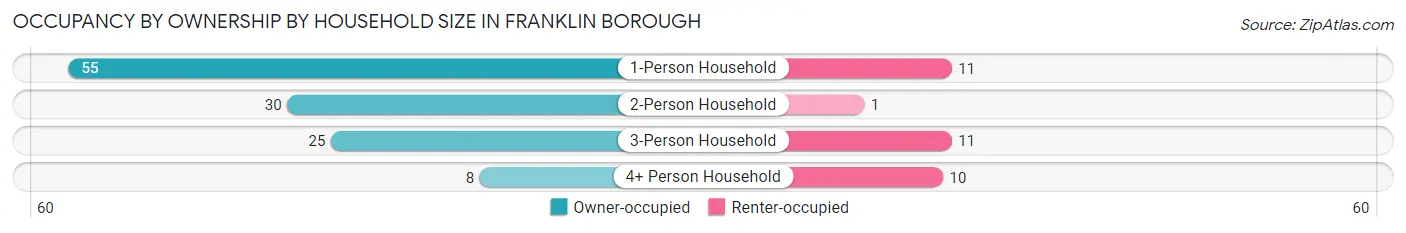
| Household Size | Owner-occupied | Renter-occupied |
| 1-Person Household | 55 (83.3%) | 11 (16.7%) |
| 2-Person Household | 30 (96.8%) | 1 (3.2%) |
| 3-Person Household | 25 (69.4%) | 11 (30.6%) |
| 4+ Person Household | 8 (44.4%) | 10 (55.6%) |
| Total Housing Units | 118 (78.1%) | 33 (21.8%) |
Occupancy by Educational Attainment in Franklin borough
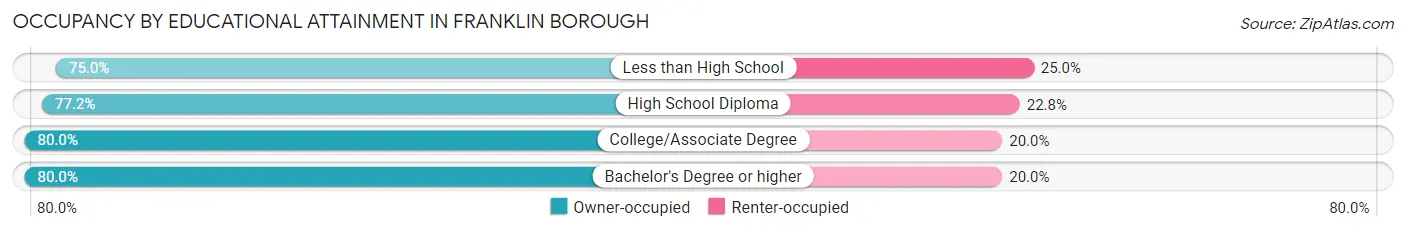
| Household Size | Owner-occupied | Renter-occupied |
| Less than High School | 9 (75.0%) | 3 (25.0%) |
| High School Diploma | 61 (77.2%) | 18 (22.8%) |
| College/Associate Degree | 44 (80.0%) | 11 (20.0%) |
| Bachelor's Degree or higher | 4 (80.0%) | 1 (20.0%) |
Occupancy by Age of Householder in Franklin borough
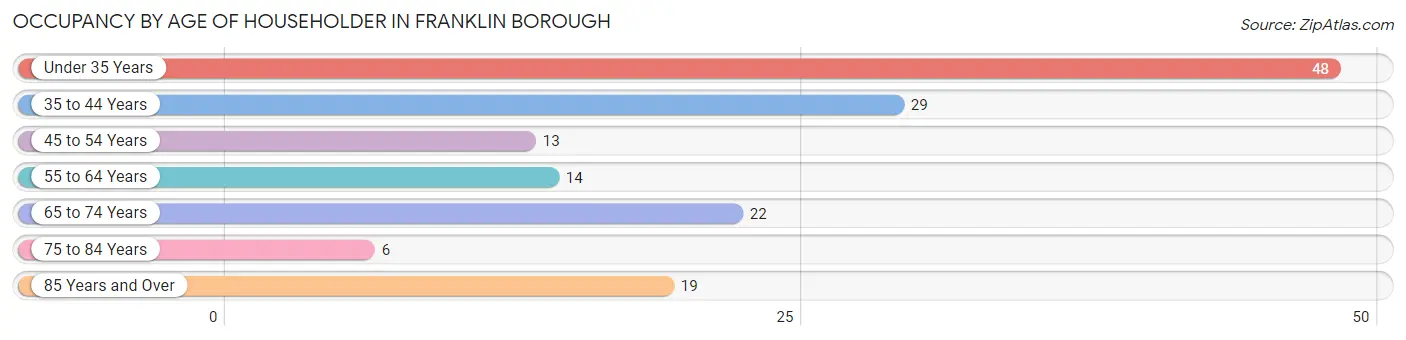
| Age Bracket | # Households | % Households |
| Under 35 Years | 48 | 31.8% |
| 35 to 44 Years | 29 | 19.2% |
| 45 to 54 Years | 13 | 8.6% |
| 55 to 64 Years | 14 | 9.3% |
| 65 to 74 Years | 22 | 14.6% |
| 75 to 84 Years | 6 | 4.0% |
| 85 Years and Over | 19 | 12.6% |
| Total | 151 | 100.0% |
Housing Finances in Franklin borough
Median Income by Occupancy in Franklin borough
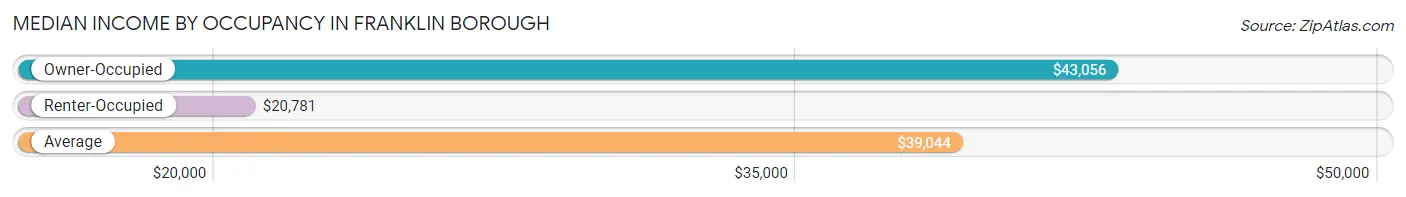
| Occupancy Type | # Households | Median Income |
| Owner-Occupied | 118 (78.1%) | $43,056 |
| Renter-Occupied | 33 (21.8%) | $20,781 |
| Average | 151 (100.0%) | $39,044 |
Occupancy by Householder Income Bracket in Franklin borough
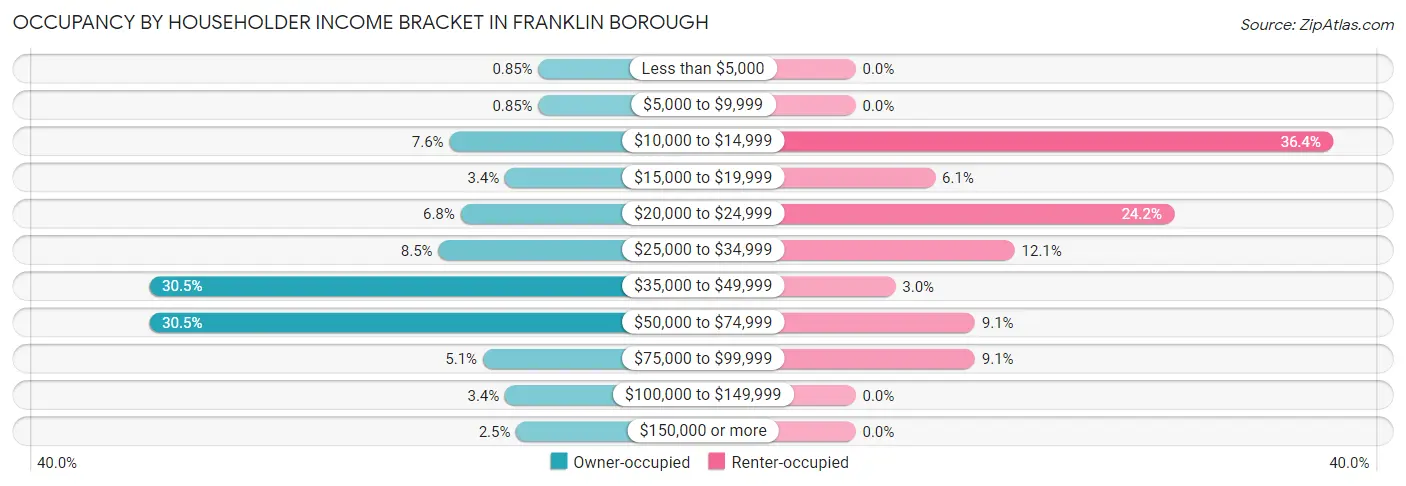
| Income Bracket | Owner-occupied | Renter-occupied |
| Less than $5,000 | 1 (0.9%) | 0 (0.0%) |
| $5,000 to $9,999 | 1 (0.9%) | 0 (0.0%) |
| $10,000 to $14,999 | 9 (7.6%) | 12 (36.4%) |
| $15,000 to $19,999 | 4 (3.4%) | 2 (6.1%) |
| $20,000 to $24,999 | 8 (6.8%) | 8 (24.2%) |
| $25,000 to $34,999 | 10 (8.5%) | 4 (12.1%) |
| $35,000 to $49,999 | 36 (30.5%) | 1 (3.0%) |
| $50,000 to $74,999 | 36 (30.5%) | 3 (9.1%) |
| $75,000 to $99,999 | 6 (5.1%) | 3 (9.1%) |
| $100,000 to $149,999 | 4 (3.4%) | 0 (0.0%) |
| $150,000 or more | 3 (2.5%) | 0 (0.0%) |
| Total | 118 (100.0%) | 33 (100.0%) |
Monthly Housing Cost Tiers in Franklin borough
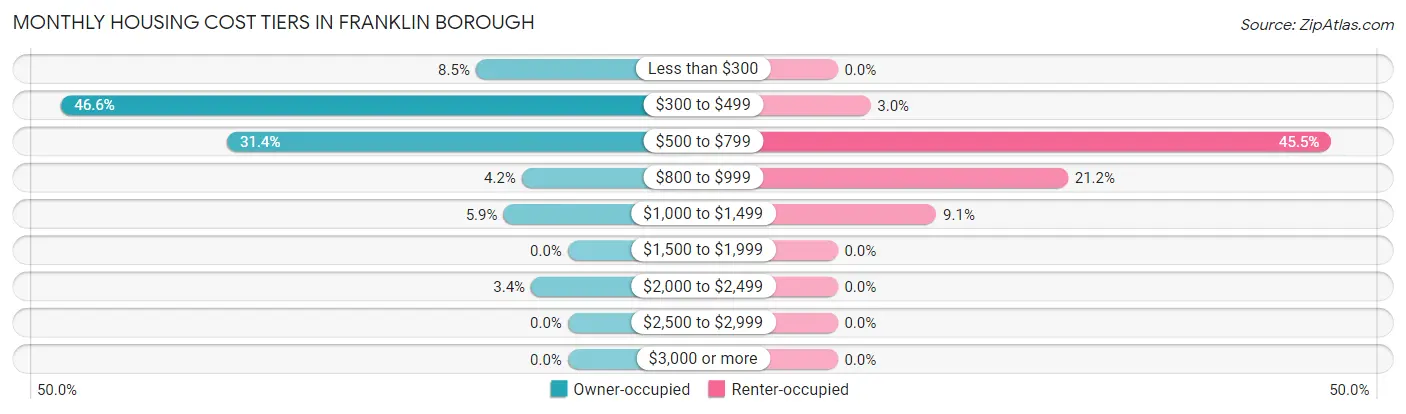
| Monthly Cost | Owner-occupied | Renter-occupied |
| Less than $300 | 10 (8.5%) | 0 (0.0%) |
| $300 to $499 | 55 (46.6%) | 1 (3.0%) |
| $500 to $799 | 37 (31.4%) | 15 (45.5%) |
| $800 to $999 | 5 (4.2%) | 7 (21.2%) |
| $1,000 to $1,499 | 7 (5.9%) | 3 (9.1%) |
| $1,500 to $1,999 | 0 (0.0%) | 0 (0.0%) |
| $2,000 to $2,499 | 4 (3.4%) | 0 (0.0%) |
| $2,500 to $2,999 | 0 (0.0%) | 0 (0.0%) |
| $3,000 or more | 0 (0.0%) | 0 (0.0%) |
| Total | 118 (100.0%) | 33 (100.0%) |
Physical Housing Characteristics in Franklin borough
Housing Structures in Franklin borough
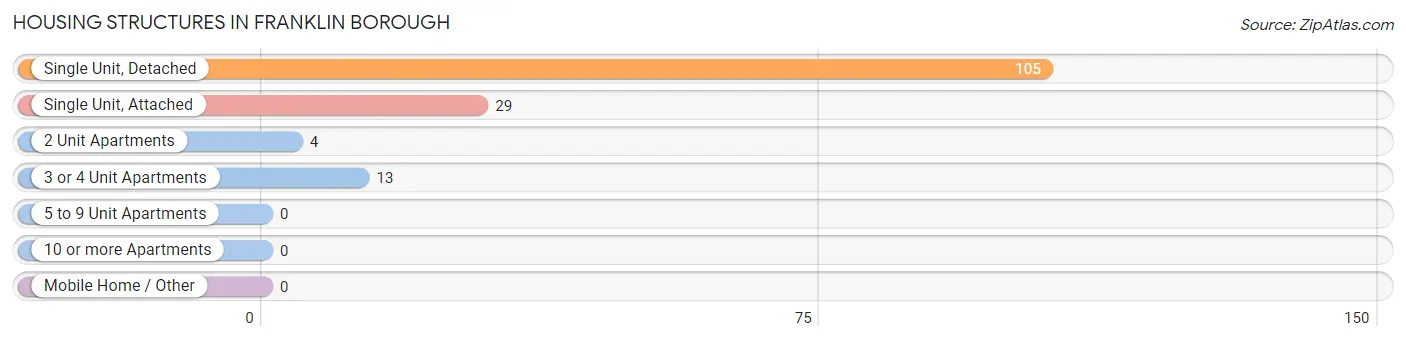
| Structure Type | # Housing Units | % Housing Units |
| Single Unit, Detached | 105 | 69.5% |
| Single Unit, Attached | 29 | 19.2% |
| 2 Unit Apartments | 4 | 2.6% |
| 3 or 4 Unit Apartments | 13 | 8.6% |
| 5 to 9 Unit Apartments | 0 | 0.0% |
| 10 or more Apartments | 0 | 0.0% |
| Mobile Home / Other | 0 | 0.0% |
| Total | 151 | 100.0% |
Housing Structures by Occupancy in Franklin borough
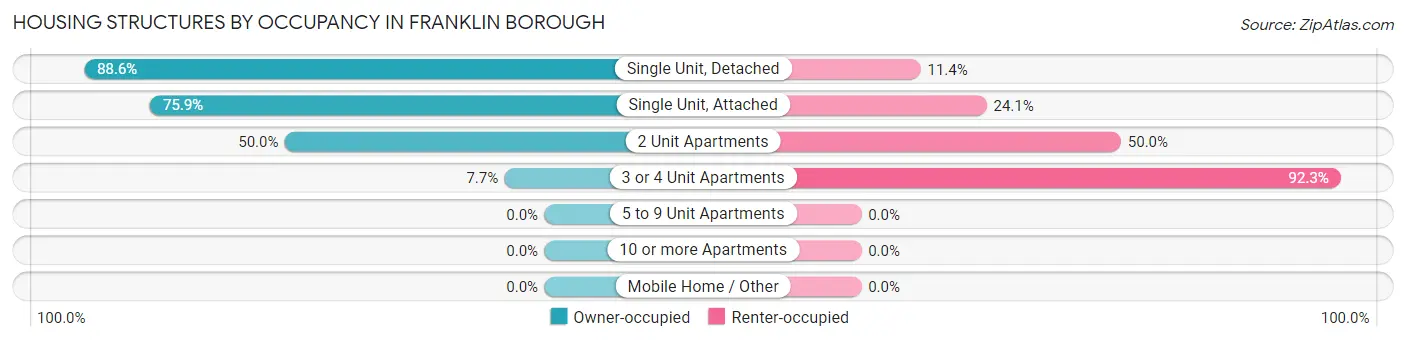
| Structure Type | Owner-occupied | Renter-occupied |
| Single Unit, Detached | 93 (88.6%) | 12 (11.4%) |
| Single Unit, Attached | 22 (75.9%) | 7 (24.1%) |
| 2 Unit Apartments | 2 (50.0%) | 2 (50.0%) |
| 3 or 4 Unit Apartments | 1 (7.7%) | 12 (92.3%) |
| 5 to 9 Unit Apartments | 0 (0.0%) | 0 (0.0%) |
| 10 or more Apartments | 0 (0.0%) | 0 (0.0%) |
| Mobile Home / Other | 0 (0.0%) | 0 (0.0%) |
| Total | 118 (78.1%) | 33 (21.8%) |
Housing Structures by Number of Rooms in Franklin borough
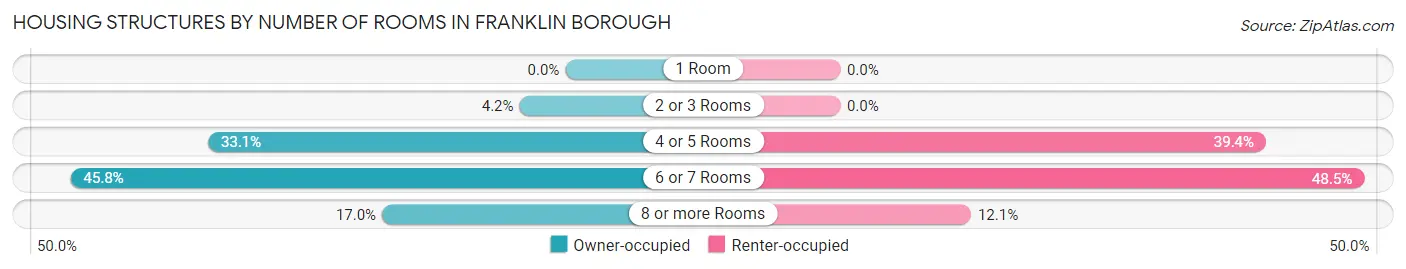
| Number of Rooms | Owner-occupied | Renter-occupied |
| 1 Room | 0 (0.0%) | 0 (0.0%) |
| 2 or 3 Rooms | 5 (4.2%) | 0 (0.0%) |
| 4 or 5 Rooms | 39 (33.1%) | 13 (39.4%) |
| 6 or 7 Rooms | 54 (45.8%) | 16 (48.5%) |
| 8 or more Rooms | 20 (17.0%) | 4 (12.1%) |
| Total | 118 (100.0%) | 33 (100.0%) |
Housing Structure by Heating Type in Franklin borough
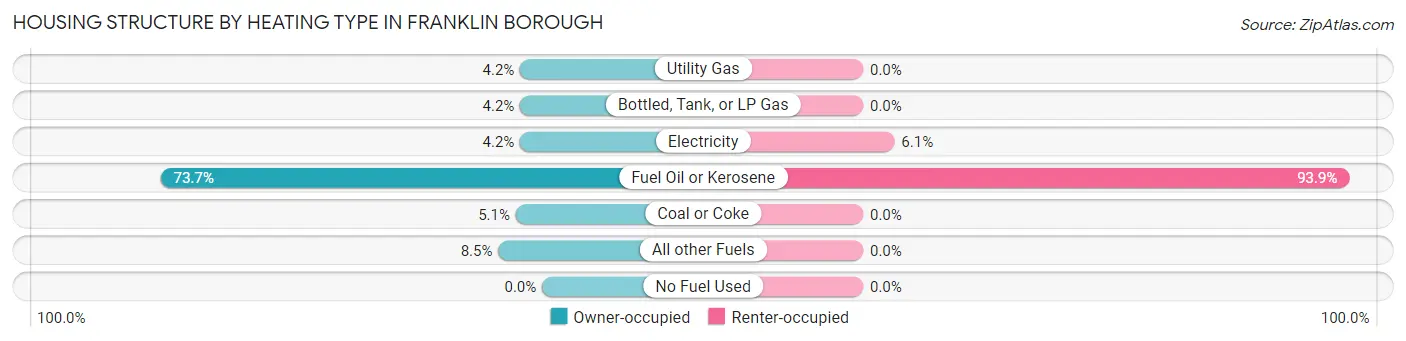
| Heating Type | Owner-occupied | Renter-occupied |
| Utility Gas | 5 (4.2%) | 0 (0.0%) |
| Bottled, Tank, or LP Gas | 5 (4.2%) | 0 (0.0%) |
| Electricity | 5 (4.2%) | 2 (6.1%) |
| Fuel Oil or Kerosene | 87 (73.7%) | 31 (93.9%) |
| Coal or Coke | 6 (5.1%) | 0 (0.0%) |
| All other Fuels | 10 (8.5%) | 0 (0.0%) |
| No Fuel Used | 0 (0.0%) | 0 (0.0%) |
| Total | 118 (100.0%) | 33 (100.0%) |
Household Vehicle Usage in Franklin borough
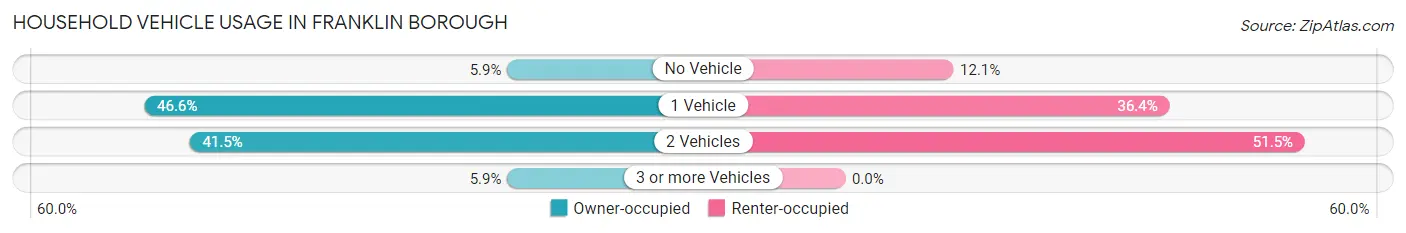
| Vehicles per Household | Owner-occupied | Renter-occupied |
| No Vehicle | 7 (5.9%) | 4 (12.1%) |
| 1 Vehicle | 55 (46.6%) | 12 (36.4%) |
| 2 Vehicles | 49 (41.5%) | 17 (51.5%) |
| 3 or more Vehicles | 7 (5.9%) | 0 (0.0%) |
| Total | 118 (100.0%) | 33 (100.0%) |
Real Estate & Mortgages in Franklin borough
Real Estate and Mortgage Overview in Franklin borough
| Characteristic | Without Mortgage | With Mortgage |
| Housing Units | 63 | 55 |
| Median Property Value | $25,800 | $50,700 |
| Median Household Income | $38,750 | $2 |
| Monthly Housing Costs | $369 | $0 |
| Real Estate Taxes | $629 | $0 |
Property Value by Mortgage Status in Franklin borough
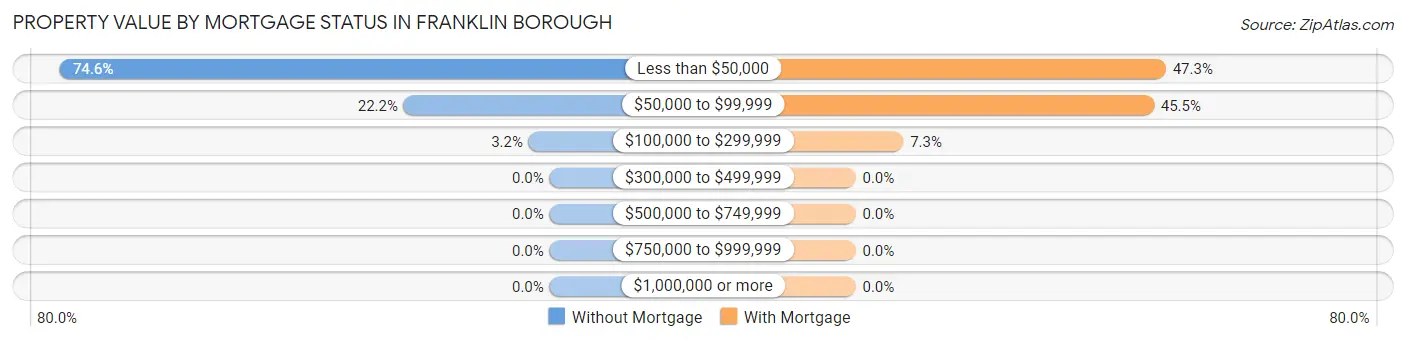
| Property Value | Without Mortgage | With Mortgage |
| Less than $50,000 | 47 (74.6%) | 26 (47.3%) |
| $50,000 to $99,999 | 14 (22.2%) | 25 (45.5%) |
| $100,000 to $299,999 | 2 (3.2%) | 4 (7.3%) |
| $300,000 to $499,999 | 0 (0.0%) | 0 (0.0%) |
| $500,000 to $749,999 | 0 (0.0%) | 0 (0.0%) |
| $750,000 to $999,999 | 0 (0.0%) | 0 (0.0%) |
| $1,000,000 or more | 0 (0.0%) | 0 (0.0%) |
| Total | 63 (100.0%) | 55 (100.0%) |
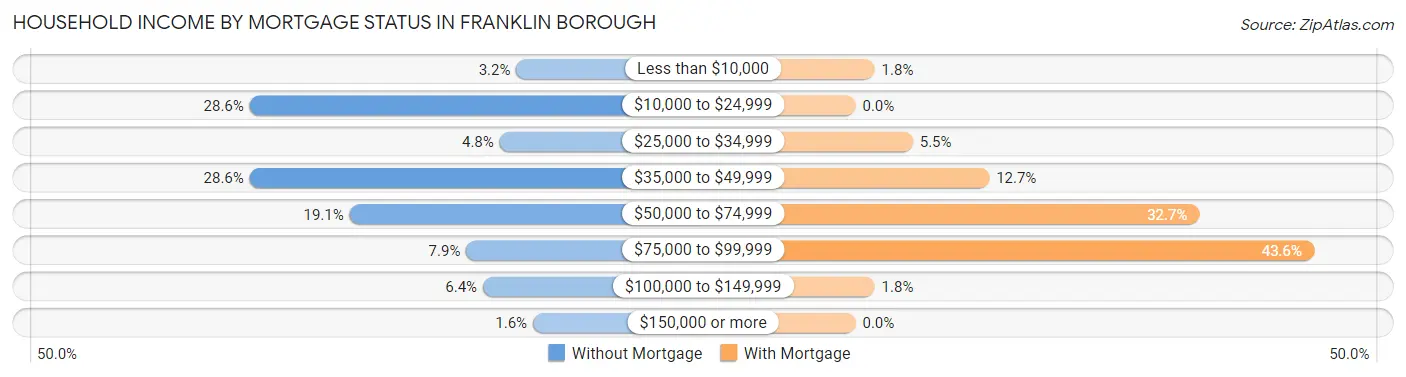
Household Income by Mortgage Status in Franklin borough
| Household Income | Without Mortgage | With Mortgage |
| Less than $10,000 | 2 (3.2%) | 1 (1.8%) |
| $10,000 to $24,999 | 18 (28.6%) | 0 (0.0%) |
| $25,000 to $34,999 | 3 (4.8%) | 3 (5.4%) |
| $35,000 to $49,999 | 18 (28.6%) | 7 (12.7%) |
| $50,000 to $74,999 | 12 (19.1%) | 18 (32.7%) |
| $75,000 to $99,999 | 5 (7.9%) | 24 (43.6%) |
| $100,000 to $149,999 | 4 (6.4%) | 1 (1.8%) |
| $150,000 or more | 1 (1.6%) | 0 (0.0%) |
| Total | 63 (100.0%) | 55 (100.0%) |
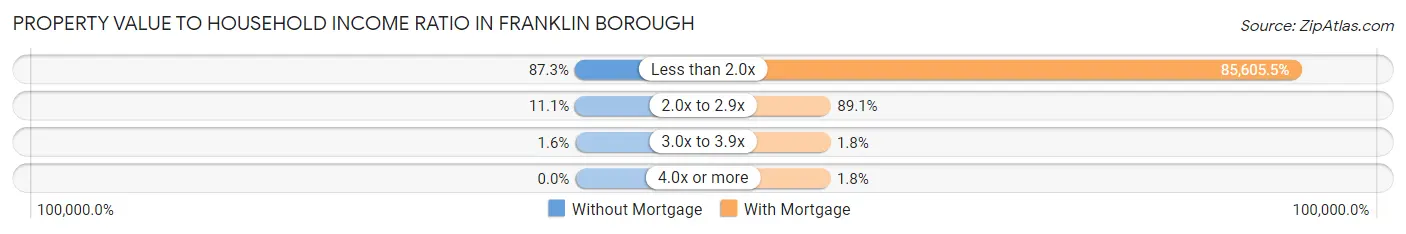
Property Value to Household Income Ratio in Franklin borough
| Value-to-Income Ratio | Without Mortgage | With Mortgage |
| Less than 2.0x | 55 (87.3%) | 47,083 (85,605.4%) |
| 2.0x to 2.9x | 7 (11.1%) | 49 (89.1%) |
| 3.0x to 3.9x | 1 (1.6%) | 1 (1.8%) |
| 4.0x or more | 0 (0.0%) | 1 (1.8%) |
| Total | 63 (100.0%) | 55 (100.0%) |
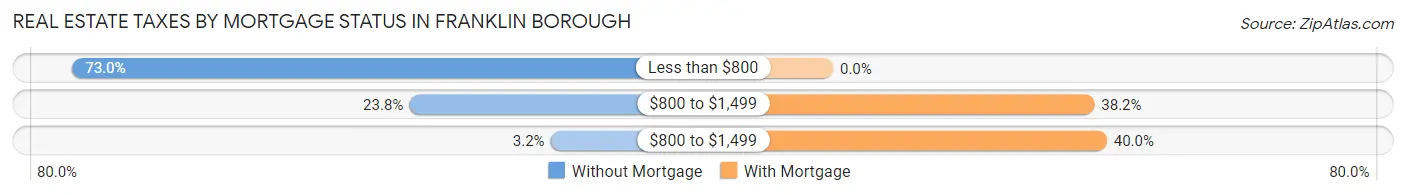
Real Estate Taxes by Mortgage Status in Franklin borough
| Property Taxes | Without Mortgage | With Mortgage |
| Less than $800 | 46 (73.0%) | 0 (0.0%) |
| $800 to $1,499 | 15 (23.8%) | 21 (38.2%) |
| $800 to $1,499 | 2 (3.2%) | 22 (40.0%) |
| Total | 63 (100.0%) | 55 (100.0%) |
Health & Disability in Franklin borough
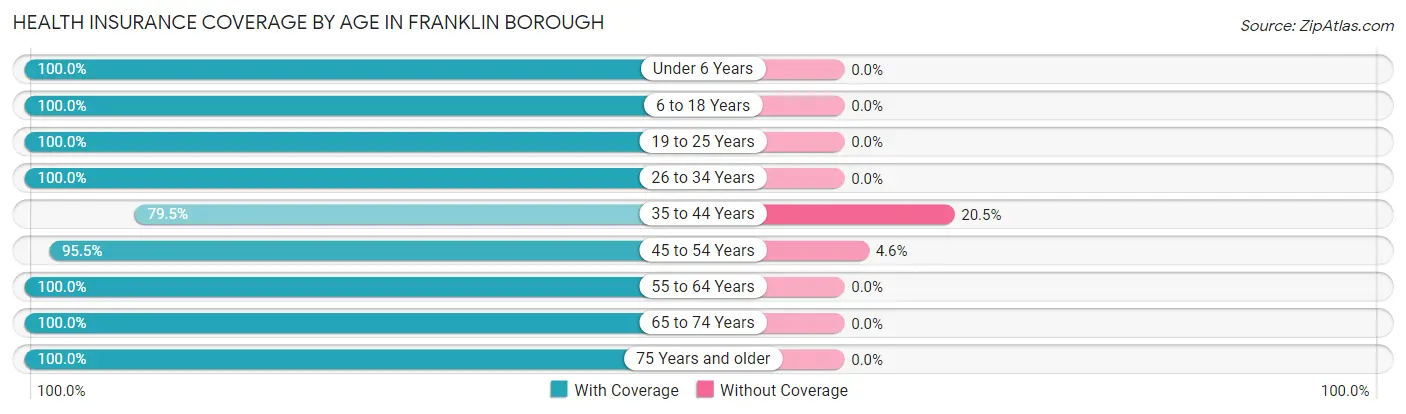
Health Insurance Coverage by Age in Franklin borough
| Age Bracket | With Coverage | Without Coverage |
| Under 6 Years | 37 (100.0%) | 0 (0.0%) |
| 6 to 18 Years | 38 (100.0%) | 0 (0.0%) |
| 19 to 25 Years | 27 (100.0%) | 0 (0.0%) |
| 26 to 34 Years | 59 (100.0%) | 0 (0.0%) |
| 35 to 44 Years | 31 (79.5%) | 8 (20.5%) |
| 45 to 54 Years | 21 (95.5%) | 1 (4.5%) |
| 55 to 64 Years | 32 (100.0%) | 0 (0.0%) |
| 65 to 74 Years | 28 (100.0%) | 0 (0.0%) |
| 75 Years and older | 28 (100.0%) | 0 (0.0%) |
| Total | 301 (97.1%) | 9 (2.9%) |
Health Insurance Coverage by Citizenship Status in Franklin borough
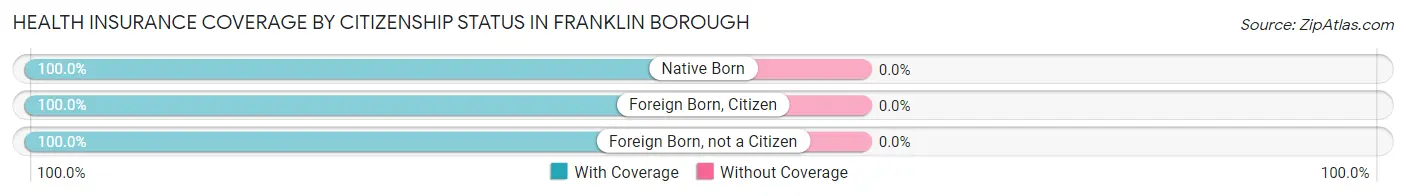
| Citizenship Status | With Coverage | Without Coverage |
| Native Born | 37 (100.0%) | 0 (0.0%) |
| Foreign Born, Citizen | 38 (100.0%) | 0 (0.0%) |
| Foreign Born, not a Citizen | 27 (100.0%) | 0 (0.0%) |
Health Insurance Coverage by Household Income in Franklin borough
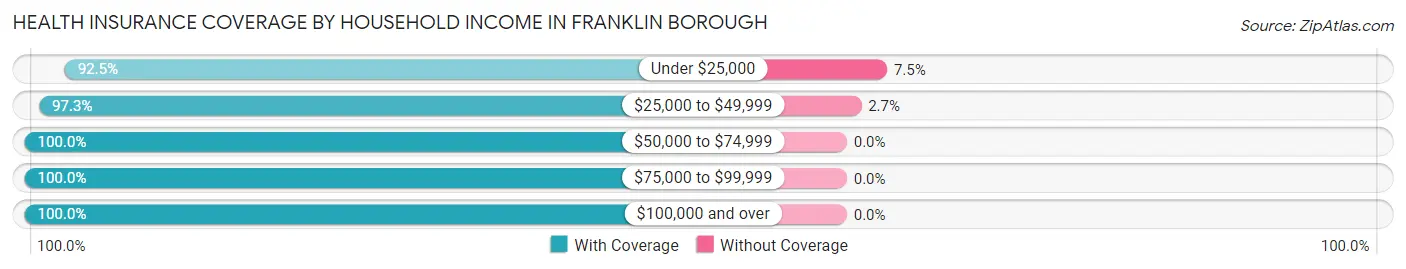
| Household Income | With Coverage | Without Coverage |
| Under $25,000 | 86 (92.5%) | 7 (7.5%) |
| $25,000 to $49,999 | 72 (97.3%) | 2 (2.7%) |
| $50,000 to $74,999 | 104 (100.0%) | 0 (0.0%) |
| $75,000 to $99,999 | 16 (100.0%) | 0 (0.0%) |
| $100,000 and over | 23 (100.0%) | 0 (0.0%) |
Public vs Private Health Insurance Coverage by Age in Franklin borough
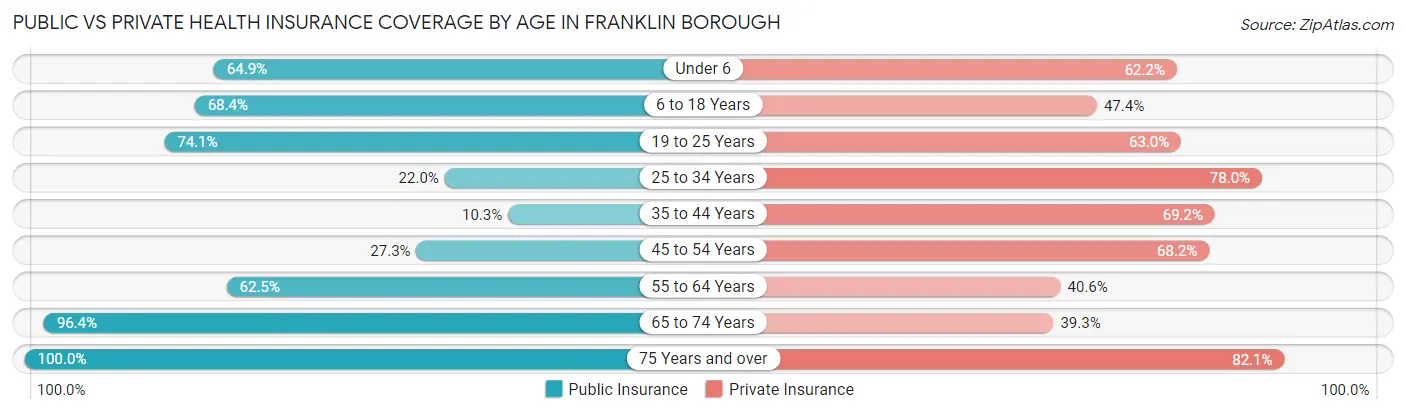
| Age Bracket | Public Insurance | Private Insurance |
| Under 6 | 24 (64.9%) | 23 (62.2%) |
| 6 to 18 Years | 26 (68.4%) | 18 (47.4%) |
| 19 to 25 Years | 20 (74.1%) | 17 (63.0%) |
| 25 to 34 Years | 13 (22.0%) | 46 (78.0%) |
| 35 to 44 Years | 4 (10.3%) | 27 (69.2%) |
| 45 to 54 Years | 6 (27.3%) | 15 (68.2%) |
| 55 to 64 Years | 20 (62.5%) | 13 (40.6%) |
| 65 to 74 Years | 27 (96.4%) | 11 (39.3%) |
| 75 Years and over | 28 (100.0%) | 23 (82.1%) |
| Total | 168 (54.2%) | 193 (62.3%) |
Disability Status by Sex by Age in Franklin borough
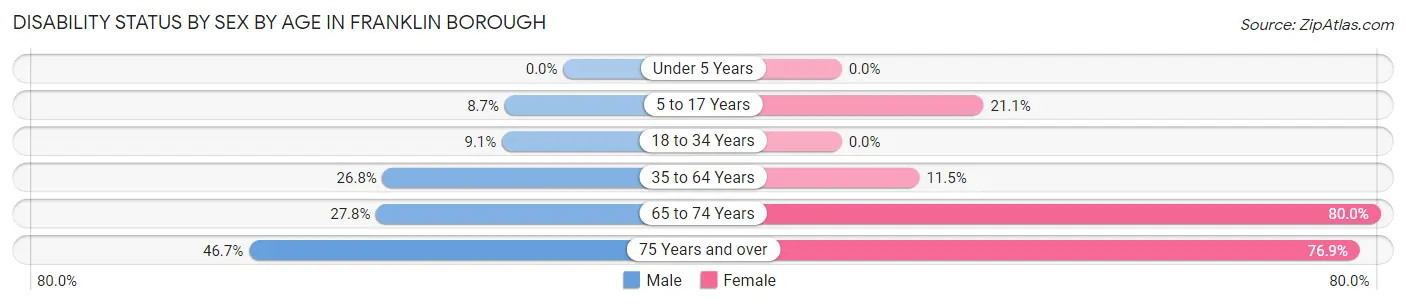
| Age Bracket | Male | Female |
| Under 5 Years | 0 (0.0%) | 0 (0.0%) |
| 5 to 17 Years | 2 (8.7%) | 4 (21.0%) |
| 18 to 34 Years | 4 (9.1%) | 0 (0.0%) |
| 35 to 64 Years | 11 (26.8%) | 6 (11.5%) |
| 65 to 74 Years | 5 (27.8%) | 8 (80.0%) |
| 75 Years and over | 7 (46.7%) | 10 (76.9%) |
Disability Class by Sex by Age in Franklin borough
Disability Class: Hearing Difficulty
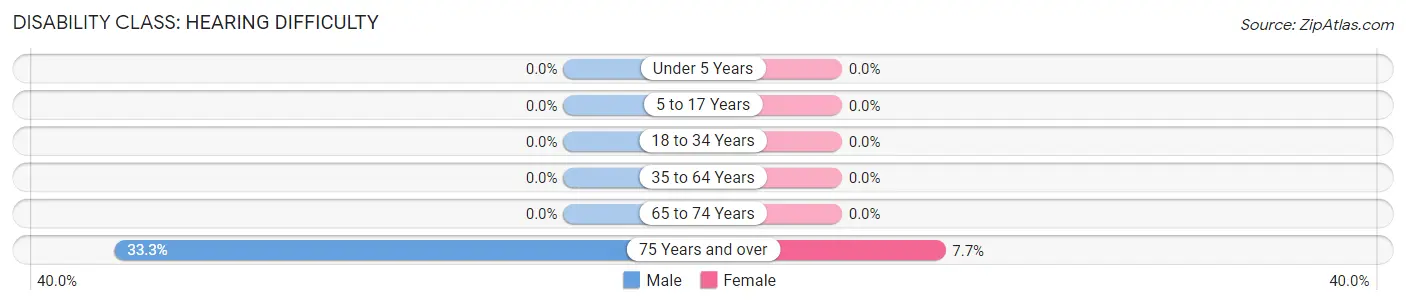
| Age Bracket | Male | Female |
| Under 5 Years | 0 (0.0%) | 0 (0.0%) |
| 5 to 17 Years | 0 (0.0%) | 0 (0.0%) |
| 18 to 34 Years | 0 (0.0%) | 0 (0.0%) |
| 35 to 64 Years | 0 (0.0%) | 0 (0.0%) |
| 65 to 74 Years | 0 (0.0%) | 0 (0.0%) |
| 75 Years and over | 5 (33.3%) | 1 (7.7%) |
Disability Class: Vision Difficulty
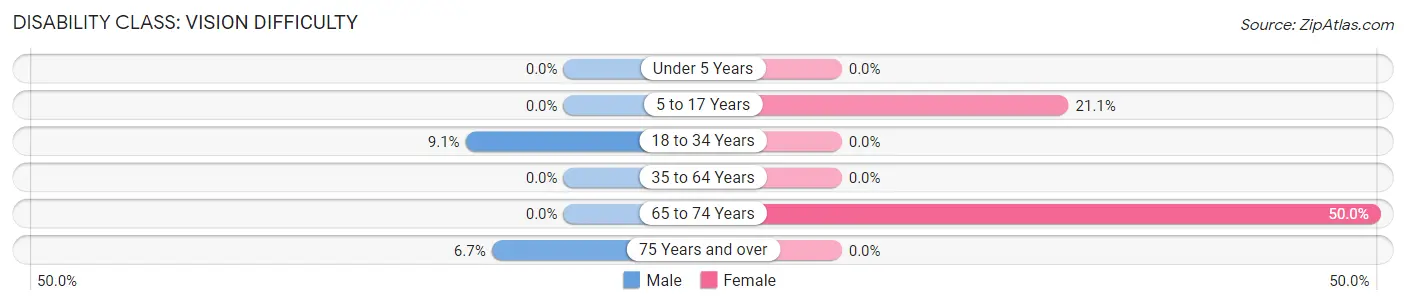
| Age Bracket | Male | Female |
| Under 5 Years | 0 (0.0%) | 0 (0.0%) |
| 5 to 17 Years | 0 (0.0%) | 4 (21.0%) |
| 18 to 34 Years | 4 (9.1%) | 0 (0.0%) |
| 35 to 64 Years | 0 (0.0%) | 0 (0.0%) |
| 65 to 74 Years | 0 (0.0%) | 5 (50.0%) |
| 75 Years and over | 1 (6.7%) | 0 (0.0%) |
Disability Class: Cognitive Difficulty
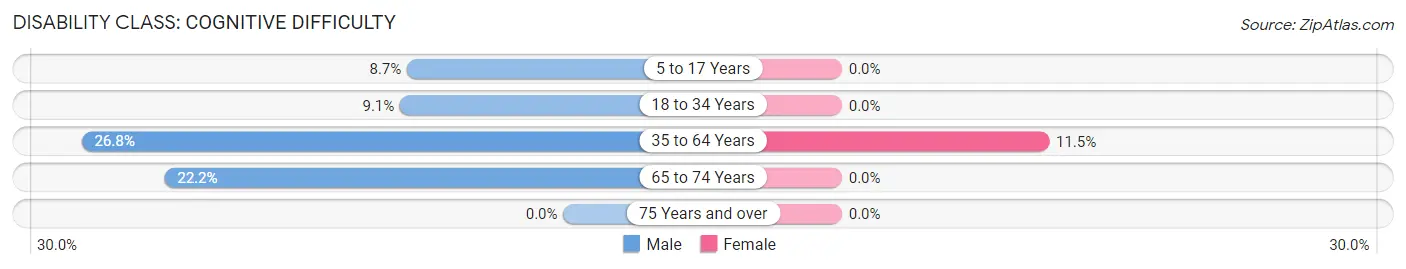
| Age Bracket | Male | Female |
| 5 to 17 Years | 2 (8.7%) | 0 (0.0%) |
| 18 to 34 Years | 4 (9.1%) | 0 (0.0%) |
| 35 to 64 Years | 11 (26.8%) | 6 (11.5%) |
| 65 to 74 Years | 4 (22.2%) | 0 (0.0%) |
| 75 Years and over | 0 (0.0%) | 0 (0.0%) |
Disability Class: Ambulatory Difficulty
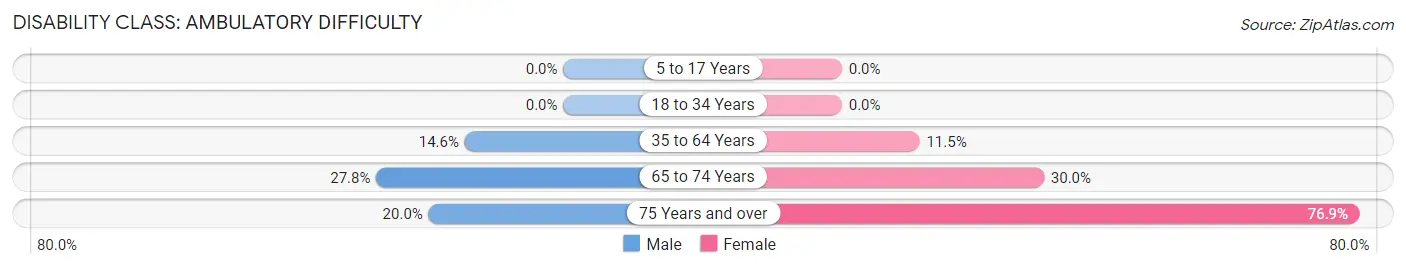
| Age Bracket | Male | Female |
| 5 to 17 Years | 0 (0.0%) | 0 (0.0%) |
| 18 to 34 Years | 0 (0.0%) | 0 (0.0%) |
| 35 to 64 Years | 6 (14.6%) | 6 (11.5%) |
| 65 to 74 Years | 5 (27.8%) | 3 (30.0%) |
| 75 Years and over | 3 (20.0%) | 10 (76.9%) |
Disability Class: Self-Care Difficulty
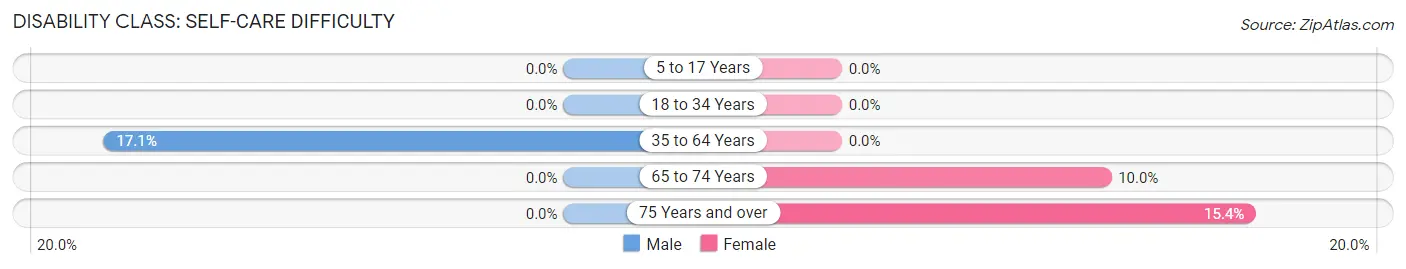
| Age Bracket | Male | Female |
| 5 to 17 Years | 0 (0.0%) | 0 (0.0%) |
| 18 to 34 Years | 0 (0.0%) | 0 (0.0%) |
| 35 to 64 Years | 7 (17.1%) | 0 (0.0%) |
| 65 to 74 Years | 0 (0.0%) | 1 (10.0%) |
| 75 Years and over | 0 (0.0%) | 2 (15.4%) |
Technology Access in Franklin borough
Computing Device Access in Franklin borough
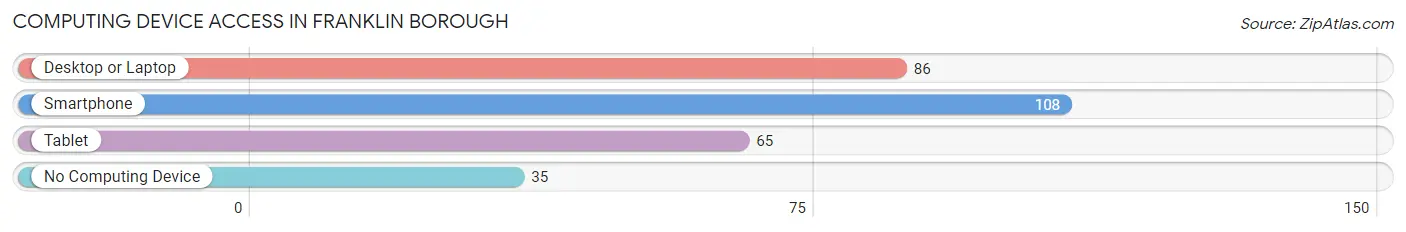
| Device Type | # Households | % Households |
| Desktop or Laptop | 86 | 57.0% |
| Smartphone | 108 | 71.5% |
| Tablet | 65 | 43.0% |
| No Computing Device | 35 | 23.2% |
| Total | 151 | 100.0% |
Internet Access in Franklin borough
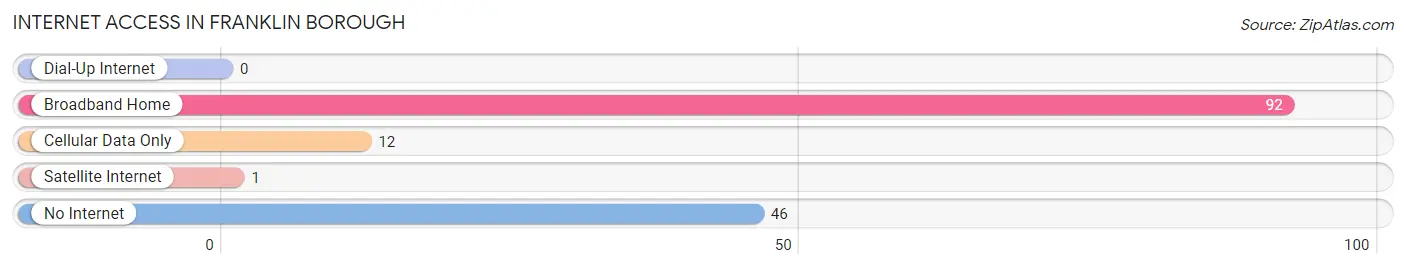
| Internet Type | # Households | % Households |
| Dial-Up Internet | 0 | 0.0% |
| Broadband Home | 92 | 60.9% |
| Cellular Data Only | 12 | 8.0% |
| Satellite Internet | 1 | 0.7% |
| No Internet | 46 | 30.5% |
| Total | 151 | 100.0% |
Franklin borough Summary
Franklin Borough is a borough located in Venango County, Pennsylvania, United States. The population was 1,845 at the 2010 census. It is part of the Oil City, PA Micropolitan Statistical Area.
History
Franklin Borough was founded in 1832 by William Franklin, a local landowner. The borough was named after him. The first settlers in the area were mostly farmers and loggers. The first post office was established in 1837.
In 1845, the first school was built in the borough. The first church was built in 1848. The first newspaper, the Franklin Gazette, was established in 1851.
The borough was incorporated in 1854. In 1859, the first bank was established. The first fire company was organized in 1867.
In 1871, the first railroad was built in the borough. This allowed for the development of the oil industry in the area. The first oil well was drilled in 1872.
The borough was home to several oil refineries and related industries. The oil industry was the main source of employment for the borough until the mid-20th century.
Geography
Franklin Borough is located at 41 25 25 North 79 50 45 West 41 423 79 846
According to the United States Census Bureau, the borough has a total area of 0.7 square miles (1.8 km2), all of it land.
Demographics
As of the census of 2000, there were 1,945 people, 817 households, and 517 families residing in the borough. The population density was 2,817.3 people per square mile (1,092.2/km2). There were 890 housing units at an average density of 1,287.3 per square mile (497.2/km2). The racial makeup of the borough was 97.44% White, 0.82% African American, 0.31% Native American, 0.36% Asian, 0.05% Pacific Islander, 0.31% from other races, and 0.61% from two or more races. Hispanic or Latino of any race were 0.77% of the population.
Economy
The economy of Franklin Borough is largely based on the oil industry. The borough is home to several oil refineries and related industries. The oil industry is the main source of employment for the borough.
The borough also has a number of small businesses, including restaurants, retail stores, and service providers. The borough is also home to a number of small manufacturing companies.
The borough is served by the Franklin Area School District. The district operates two elementary schools, one middle school, and one high school.
Conclusion
Franklin Borough is a small borough located in Venango County, Pennsylvania. The borough was founded in 1832 and was named after William Franklin, a local landowner. The borough was incorporated in 1854 and has a population of 1,845 as of the 2010 census. The economy of the borough is largely based on the oil industry, with several oil refineries and related industries located in the borough. The borough is also home to a number of small businesses, including restaurants, retail stores, and service providers. The borough is served by the Franklin Area School District, which operates two elementary schools, one middle school, and one high school.
Common Questions
What is the Total Population of Franklin borough?
Total Population of Franklin borough is 310.
What is the Total Male Population of Franklin borough?
Total Male Population of Franklin borough is 160.
What is the Total Female Population of Franklin borough?
Total Female Population of Franklin borough is 150.
What is the Ratio of Males per 100 Females in Franklin borough?
There are 106.67 Males per 100 Females in Franklin borough.
What is the Ratio of Females per 100 Males in Franklin borough?
There are 93.75 Females per 100 Males in Franklin borough.
What is the Median Population Age in Franklin borough?
Median Population Age in Franklin borough is 33.7 Years.
What is the Average Family Size in Franklin borough
Average Family Size in Franklin borough is 2.8 People.
What is the Average Household Size in Franklin borough
Average Household Size in Franklin borough is 2.0 People.
What is Per Capita Income in Franklin borough?
Per Capita income in Franklin borough is $22,217.
What is the Median Family Income in Franklin borough?
Median Family Income in Franklin borough is $52,679.
What is the Median Household income in Franklin borough?
Median Household Income in Franklin borough is $39,044.
What is Income or Wage Gap in Franklin borough?
Income or Wage Gap in Franklin borough is 16.7%.
Women in Franklin borough earn 83.3 cents for every dollar earned by a man.
What is Inequality or Gini Index in Franklin borough?
Inequality or Gini Index in Franklin borough is 0.37.
How Large is the Labor Force in Franklin borough?
There are 157 People in the Labor Forcein in Franklin borough.
What is the Percentage of People in the Labor Force in Franklin borough?
66.2% of People are in the Labor Force in Franklin borough.
What is the Unemployment Rate in Franklin borough?
Unemployment Rate in Franklin borough is 3.2%.