Forest City borough, PA
Forest City borough Overview
1,612
TOTAL POPULATION
723
MALE POPULATION
889
FEMALE POPULATION
81.33
MALES / 100 FEMALES
122.96
FEMALES / 100 MALES
50.7
MEDIAN AGE
2.8
AVG FAMILY SIZE
2.1
AVG HOUSEHOLD SIZE
$33,426
PER CAPITA INCOME
$51,375
AVG FAMILY INCOME
$55,694
AVG HOUSEHOLD INCOME
18.1%
WAGE / INCOME GAP [ % ]
81.9¢/ $1
WAGE / INCOME GAP [ $ ]
0.46
INEQUALITY / GINI INDEX
702
LABOR FORCE [ PEOPLE ]
51.7%
PERCENT IN LABOR FORCE
8.5%
UNEMPLOYMENT RATE
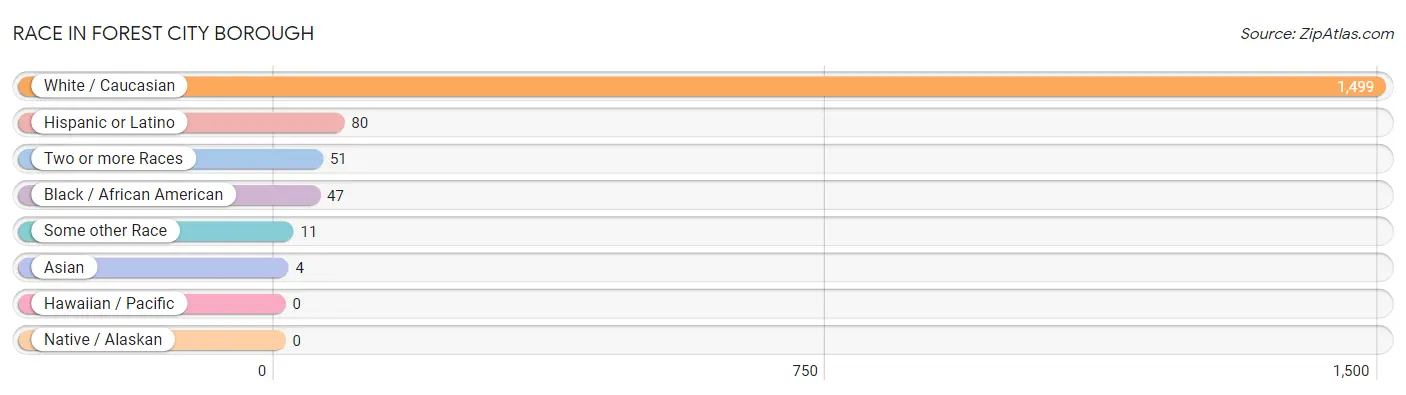
Race in Forest City borough
The most populous races in Forest City borough are White / Caucasian (1,499 | 93.0%), Hispanic or Latino (80 | 5.0%), and Two or more Races (51 | 3.2%).
| Race | # Population | % Population |
| Asian | 4 | 0.3% |
| Black / African American | 47 | 2.9% |
| Hawaiian / Pacific | 0 | 0.0% |
| Hispanic or Latino | 80 | 5.0% |
| Native / Alaskan | 0 | 0.0% |
| White / Caucasian | 1,499 | 93.0% |
| Two or more Races | 51 | 3.2% |
| Some other Race | 11 | 0.7% |
| Total | 1,612 | 100.0% |
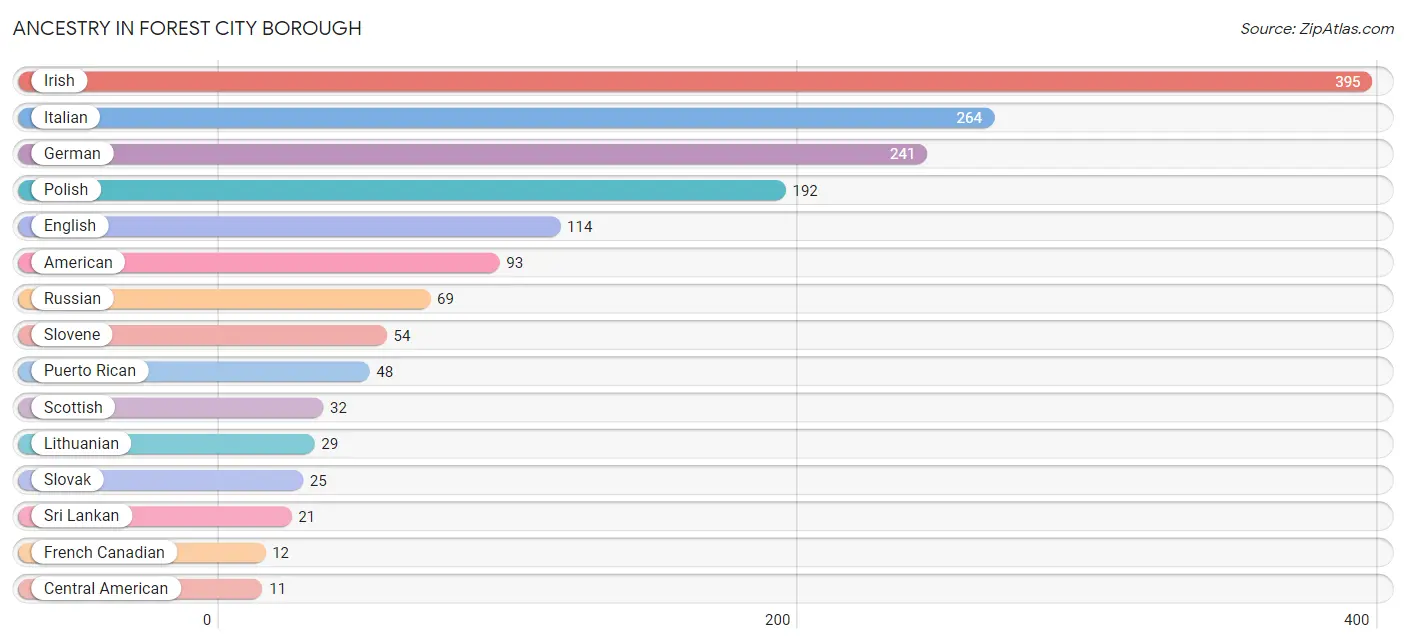
Ancestry in Forest City borough
The most populous ancestries reported in Forest City borough are Irish (395 | 24.5%), Italian (264 | 16.4%), German (241 | 14.9%), Polish (192 | 11.9%), and English (114 | 7.1%), together accounting for 74.8% of all Forest City borough residents.
| Ancestry | # Population | % Population |
| American | 93 | 5.8% |
| Austrian | 6 | 0.4% |
| Central American | 11 | 0.7% |
| Cherokee | 11 | 0.7% |
| Cheyenne | 5 | 0.3% |
| Eastern European | 4 | 0.3% |
| English | 114 | 7.1% |
| European | 2 | 0.1% |
| Finnish | 9 | 0.6% |
| French | 6 | 0.4% |
| French Canadian | 12 | 0.7% |
| German | 241 | 14.9% |
| Greek | 4 | 0.3% |
| Honduran | 11 | 0.7% |
| Hungarian | 4 | 0.3% |
| Irish | 395 | 24.5% |
| Italian | 264 | 16.4% |
| Lithuanian | 29 | 1.8% |
| Polish | 192 | 11.9% |
| Puerto Rican | 48 | 3.0% |
| Romanian | 2 | 0.1% |
| Russian | 69 | 4.3% |
| Scottish | 32 | 2.0% |
| Slovak | 25 | 1.5% |
| Slovene | 54 | 3.4% |
| Sri Lankan | 21 | 1.3% |
| Swedish | 4 | 0.3% |
| Swiss | 9 | 0.6% |
| Ukrainian | 10 | 0.6% |
| Welsh | 8 | 0.5% | View All 30 Rows |
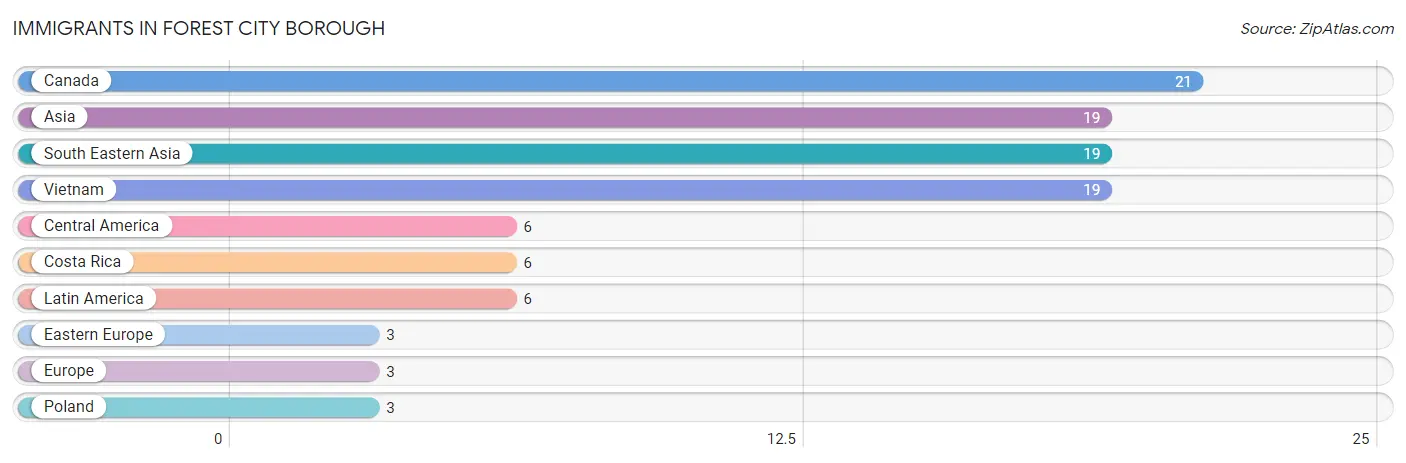
Immigrants in Forest City borough
The most numerous immigrant groups reported in Forest City borough came from Canada (21 | 1.3%), Asia (19 | 1.2%), South Eastern Asia (19 | 1.2%), Vietnam (19 | 1.2%), and Central America (6 | 0.4%), together accounting for 5.2% of all Forest City borough residents.
| Immigration Origin | # Population | % Population |
| Asia | 19 | 1.2% |
| Canada | 21 | 1.3% |
| Central America | 6 | 0.4% |
| Costa Rica | 6 | 0.4% |
| Eastern Europe | 3 | 0.2% |
| Europe | 3 | 0.2% |
| Latin America | 6 | 0.4% |
| Poland | 3 | 0.2% |
| South Eastern Asia | 19 | 1.2% |
| Vietnam | 19 | 1.2% | View All 10 Rows |
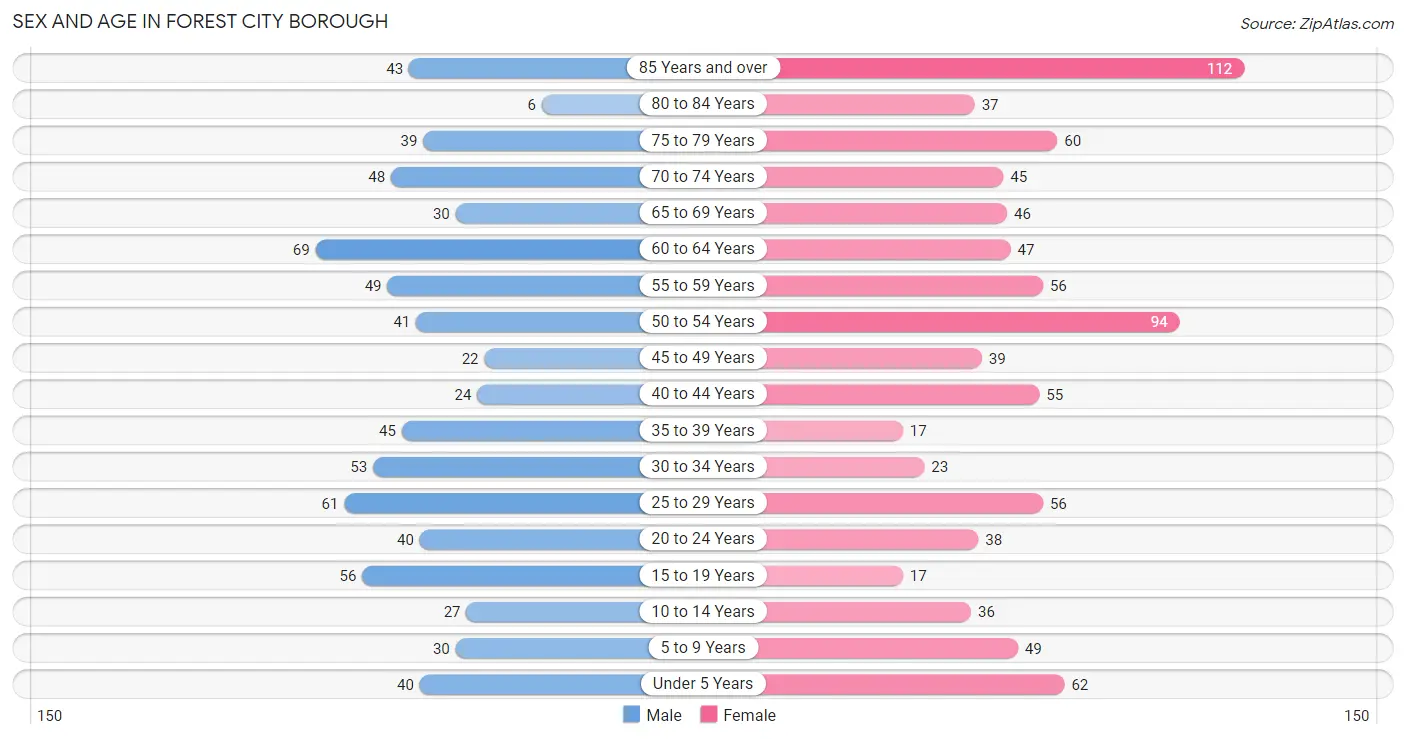
Sex and Age in Forest City borough
Sex and Age in Forest City borough
The most populous age groups in Forest City borough are 60 to 64 Years (69 | 9.5%) for men and 85 Years and over (112 | 12.6%) for women.
| Age Bracket | Male | Female |
| Under 5 Years | 40 (5.5%) | 62 (7.0%) |
| 5 to 9 Years | 30 (4.2%) | 49 (5.5%) |
| 10 to 14 Years | 27 (3.7%) | 36 (4.1%) |
| 15 to 19 Years | 56 (7.7%) | 17 (1.9%) |
| 20 to 24 Years | 40 (5.5%) | 38 (4.3%) |
| 25 to 29 Years | 61 (8.4%) | 56 (6.3%) |
| 30 to 34 Years | 53 (7.3%) | 23 (2.6%) |
| 35 to 39 Years | 45 (6.2%) | 17 (1.9%) |
| 40 to 44 Years | 24 (3.3%) | 55 (6.2%) |
| 45 to 49 Years | 22 (3.0%) | 39 (4.4%) |
| 50 to 54 Years | 41 (5.7%) | 94 (10.6%) |
| 55 to 59 Years | 49 (6.8%) | 56 (6.3%) |
| 60 to 64 Years | 69 (9.5%) | 47 (5.3%) |
| 65 to 69 Years | 30 (4.2%) | 46 (5.2%) |
| 70 to 74 Years | 48 (6.6%) | 45 (5.1%) |
| 75 to 79 Years | 39 (5.4%) | 60 (6.8%) |
| 80 to 84 Years | 6 (0.8%) | 37 (4.2%) |
| 85 Years and over | 43 (5.9%) | 112 (12.6%) |
| Total | 723 (100.0%) | 889 (100.0%) |
Families and Households in Forest City borough
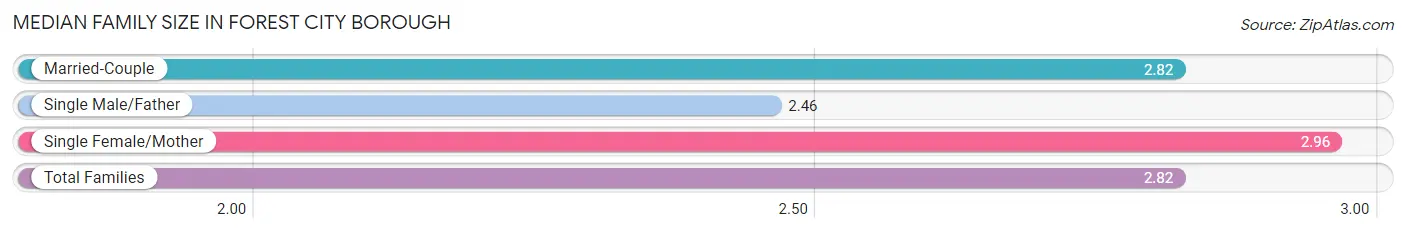
Median Family Size in Forest City borough
The median family size in Forest City borough is 2.82 persons per family, with single female/mother families (134 | 35.2%) accounting for the largest median family size of 2.96 persons per family. On the other hand, single male/father families (57 | 15.0%) represent the smallest median family size with 2.46 persons per family.
| Family Type | # Families | Family Size |
| Married-Couple | 190 (49.9%) | 2.82 |
| Single Male/Father | 57 (15.0%) | 2.46 |
| Single Female/Mother | 134 (35.2%) | 2.96 |
| Total Families | 381 (100.0%) | 2.82 |
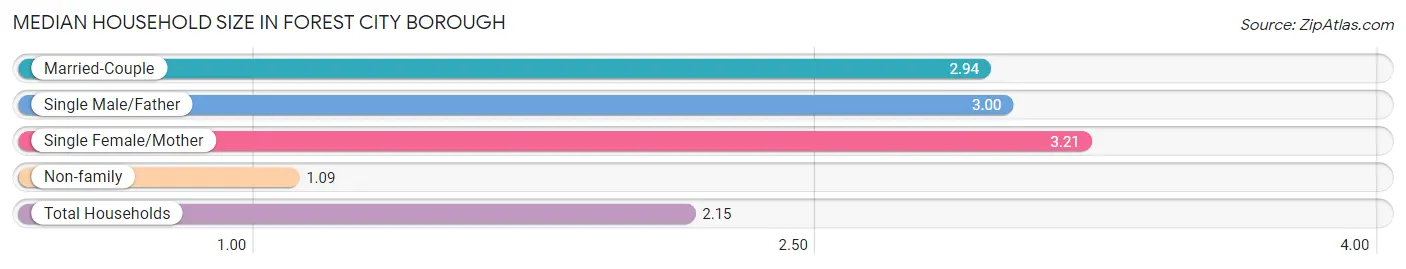
Median Household Size in Forest City borough
The median household size in Forest City borough is 2.15 persons per household, with single female/mother households (134 | 19.1%) accounting for the largest median household size of 3.21 persons per household. non-family households (322 | 45.8%) represent the smallest median household size with 1.09 persons per household.
| Household Type | # Households | Household Size |
| Married-Couple | 190 (27.0%) | 2.94 |
| Single Male/Father | 57 (8.1%) | 3.00 |
| Single Female/Mother | 134 (19.1%) | 3.21 |
| Non-family | 322 (45.8%) | 1.09 |
| Total Households | 703 (100.0%) | 2.15 |
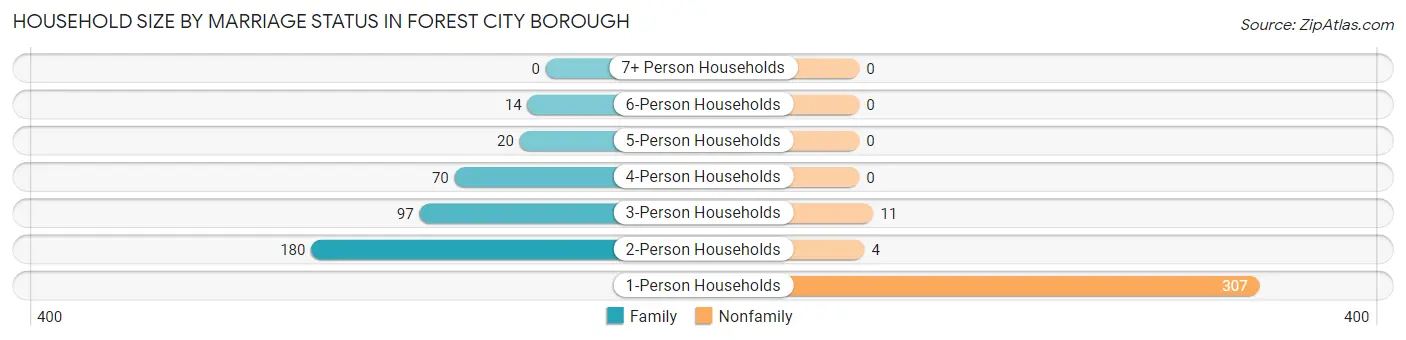
Household Size by Marriage Status in Forest City borough
Out of a total of 703 households in Forest City borough, 381 (54.2%) are family households, while 322 (45.8%) are nonfamily households. The most numerous type of family households are 2-person households, comprising 180, and the most common type of nonfamily households are 1-person households, comprising 307.
| Household Size | Family Households | Nonfamily Households |
| 1-Person Households | - | 307 (43.7%) |
| 2-Person Households | 180 (25.6%) | 4 (0.6%) |
| 3-Person Households | 97 (13.8%) | 11 (1.6%) |
| 4-Person Households | 70 (10.0%) | 0 (0.0%) |
| 5-Person Households | 20 (2.8%) | 0 (0.0%) |
| 6-Person Households | 14 (2.0%) | 0 (0.0%) |
| 7+ Person Households | 0 (0.0%) | 0 (0.0%) |
| Total | 381 (54.2%) | 322 (45.8%) |
Female Fertility in Forest City borough
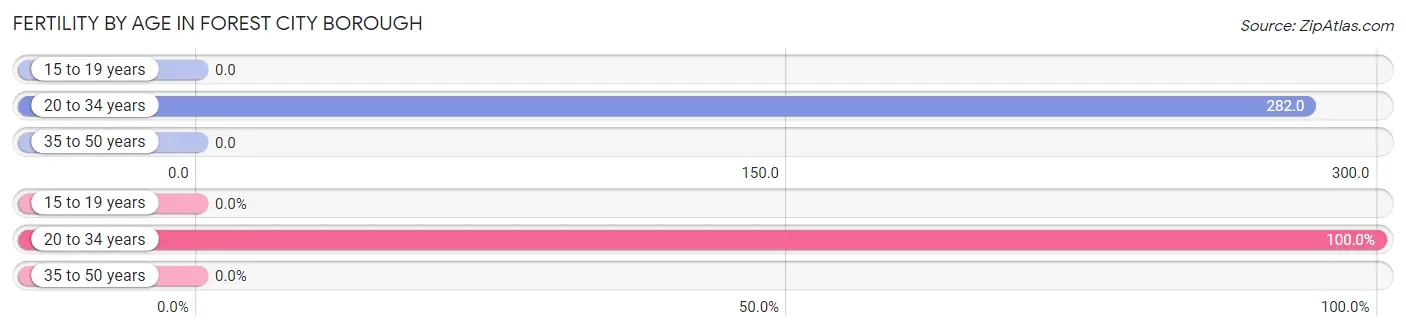
Fertility by Age in Forest City borough
Average fertility rate in Forest City borough is 130.0 births per 1,000 women. Women in the age bracket of 20 to 34 years have the highest fertility rate with 282.0 births per 1,000 women. Women in the age bracket of 20 to 34 years acount for 100.0% of all women with births.
| Age Bracket | Women with Births | Births / 1,000 Women |
| 15 to 19 years | 0 (0.0%) | 0.0 |
| 20 to 34 years | 33 (100.0%) | 282.0 |
| 35 to 50 years | 0 (0.0%) | 0.0 |
| Total | 33 (100.0%) | 130.0 |
Fertility by Age by Marriage Status in Forest City borough
24.2% of women with births (33) in Forest City borough are married. The highest percentage of unmarried women with births falls into 20 to 34 years age bracket with 75.8% of them unmarried at the time of birth, while the lowest percentage of unmarried women with births belong to 20 to 34 years age bracket with 75.8% of them unmarried.
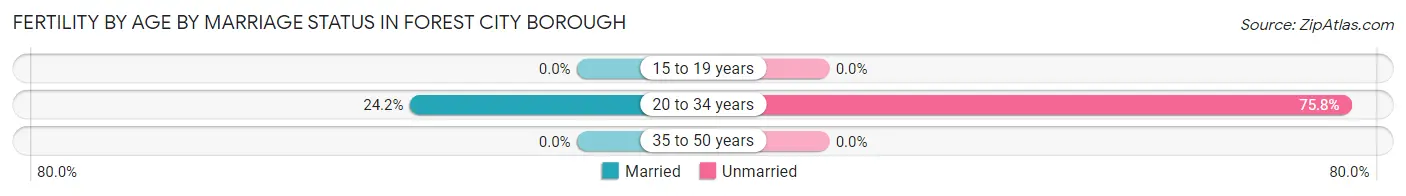
| Age Bracket | Married | Unmarried |
| 15 to 19 years | 0 (0.0%) | 0 (0.0%) |
| 20 to 34 years | 8 (24.2%) | 25 (75.8%) |
| 35 to 50 years | 0 (0.0%) | 0 (0.0%) |
| Total | 8 (24.2%) | 25 (75.8%) |
Fertility by Education in Forest City borough
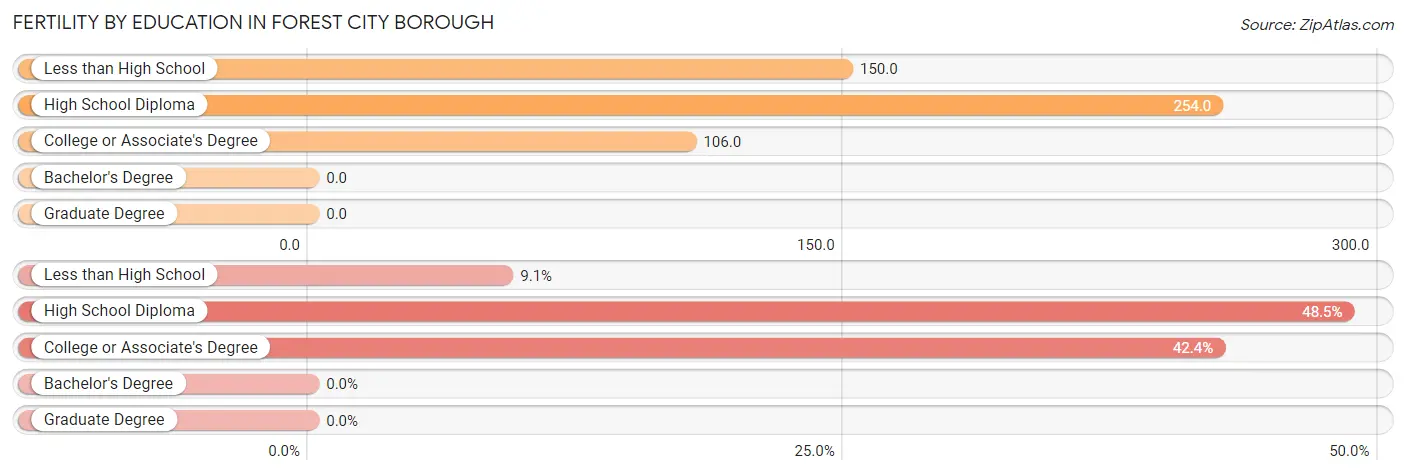
| Educational Attainment | Women with Births | Births / 1,000 Women |
| Less than High School | 3 (9.1%) | 150.0 |
| High School Diploma | 16 (48.5%) | 254.0 |
| College or Associate's Degree | 14 (42.4%) | 106.0 |
| Bachelor's Degree | 0 (0.0%) | 0.0 |
| Graduate Degree | 0 (0.0%) | 0.0 |
| Total | 33 (100.0%) | 130.0 |
Fertility by Education by Marriage Status in Forest City borough
75.8% of women with births in Forest City borough are unmarried. Women with the educational attainment of less than high school are most likely to be married with 100.0% of them married at childbirth, while women with the educational attainment of college or associate's degree are least likely to be married with 100.0% of them unmarried at childbirth.
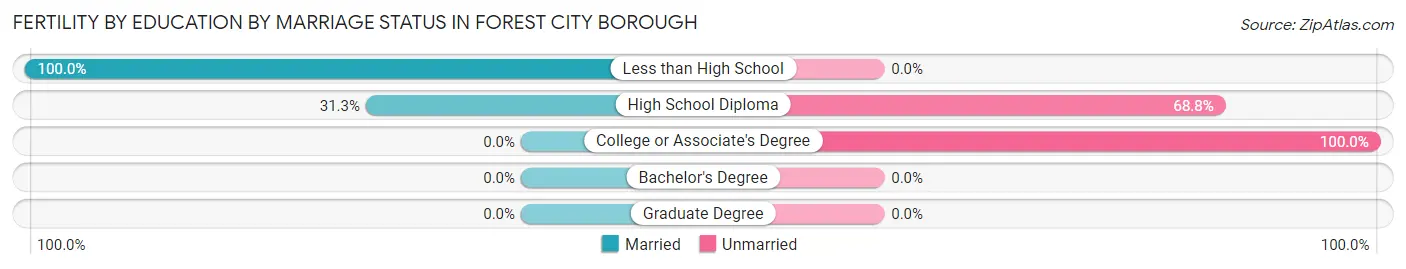
| Educational Attainment | Married | Unmarried |
| Less than High School | 3 (100.0%) | 0 (0.0%) |
| High School Diploma | 5 (31.2%) | 11 (68.8%) |
| College or Associate's Degree | 0 (0.0%) | 14 (100.0%) |
| Bachelor's Degree | 0 (0.0%) | 0 (0.0%) |
| Graduate Degree | 0 (0.0%) | 0 (0.0%) |
| Total | 8 (24.2%) | 25 (75.8%) |
Income in Forest City borough
Income Overview in Forest City borough
Per Capita Income in Forest City borough is $33,426, while median incomes of families and households are $51,375 and $55,694 respectively.
| Characteristic | Number | Measure |
| Per Capita Income | 1,612 | $33,426 |
| Median Family Income | 381 | $51,375 |
| Mean Family Income | 381 | $80,214 |
| Median Household Income | 703 | $55,694 |
| Mean Household Income | 703 | $72,863 |
| Income Deficit | 381 | $0 |
| Wage / Income Gap (%) | 1,612 | 18.10% |
| Wage / Income Gap ($) | 1,612 | 81.90¢ per $1 |
| Gini / Inequality Index | 1,612 | 0.46 |
Earnings by Sex in Forest City borough
Average Earnings in Forest City borough are $40,109, $41,680 for men and $34,135 for women, a difference of 18.1%.
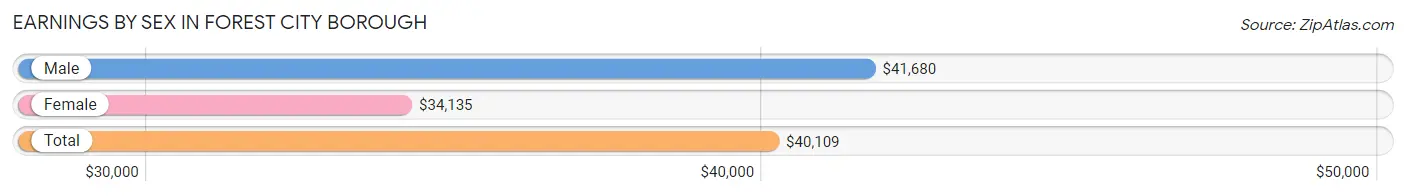
| Sex | Number | Average Earnings |
| Male | 397 (56.4%) | $41,680 |
| Female | 307 (43.6%) | $34,135 |
| Total | 704 (100.0%) | $40,109 |
Earnings by Sex by Income Bracket in Forest City borough
The most common earnings brackets in Forest City borough are $100,000+ for men (55 | 13.9%) and $30,000 to $34,999 for women (37 | 12.0%).
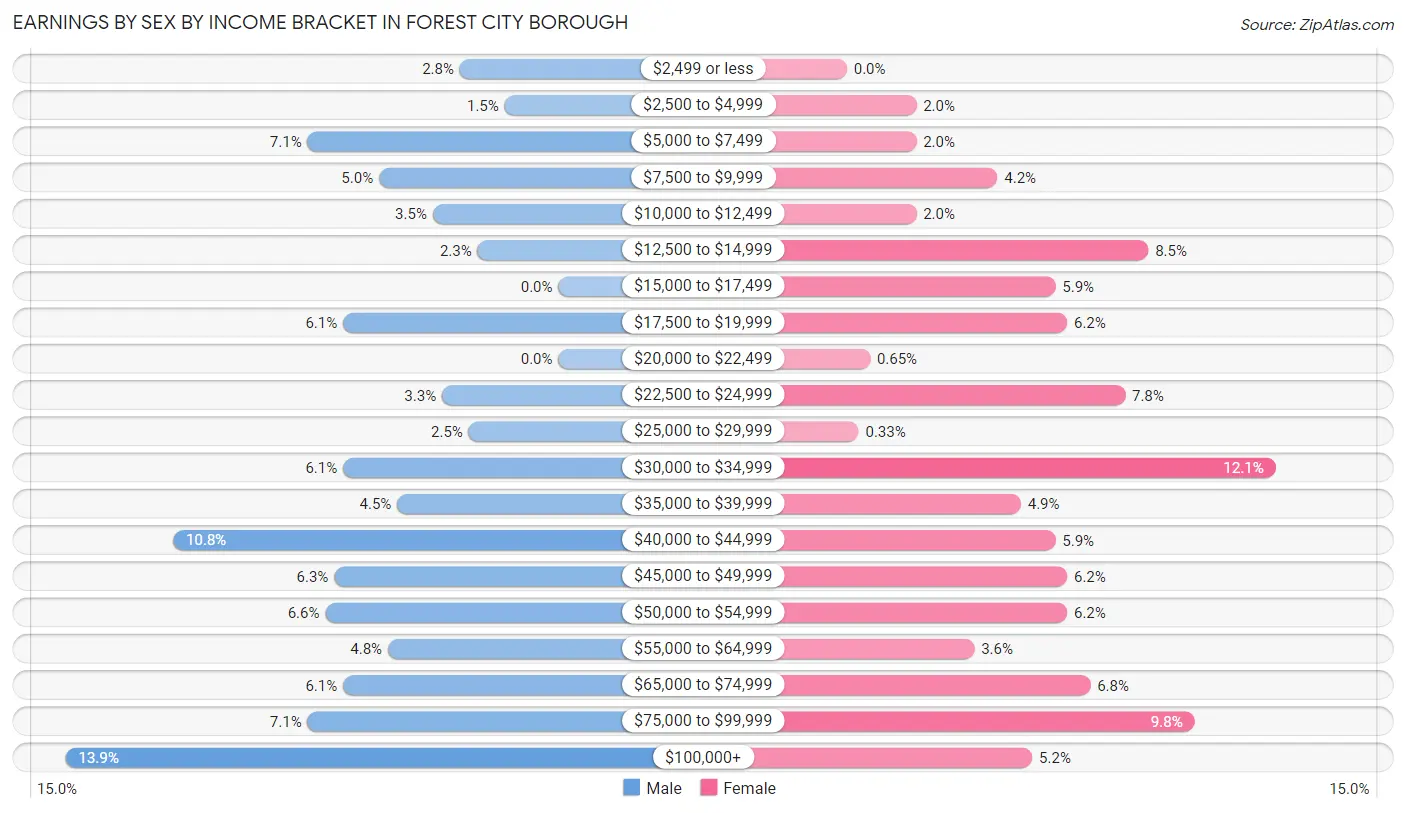
| Income | Male | Female |
| $2,499 or less | 11 (2.8%) | 0 (0.0%) |
| $2,500 to $4,999 | 6 (1.5%) | 6 (1.9%) |
| $5,000 to $7,499 | 28 (7.0%) | 6 (1.9%) |
| $7,500 to $9,999 | 20 (5.0%) | 13 (4.2%) |
| $10,000 to $12,499 | 14 (3.5%) | 6 (1.9%) |
| $12,500 to $14,999 | 9 (2.3%) | 26 (8.5%) |
| $15,000 to $17,499 | 0 (0.0%) | 18 (5.9%) |
| $17,500 to $19,999 | 24 (6.0%) | 19 (6.2%) |
| $20,000 to $22,499 | 0 (0.0%) | 2 (0.6%) |
| $22,500 to $24,999 | 13 (3.3%) | 24 (7.8%) |
| $25,000 to $29,999 | 10 (2.5%) | 1 (0.3%) |
| $30,000 to $34,999 | 24 (6.0%) | 37 (12.0%) |
| $35,000 to $39,999 | 18 (4.5%) | 15 (4.9%) |
| $40,000 to $44,999 | 43 (10.8%) | 18 (5.9%) |
| $45,000 to $49,999 | 25 (6.3%) | 19 (6.2%) |
| $50,000 to $54,999 | 26 (6.6%) | 19 (6.2%) |
| $55,000 to $64,999 | 19 (4.8%) | 11 (3.6%) |
| $65,000 to $74,999 | 24 (6.0%) | 21 (6.8%) |
| $75,000 to $99,999 | 28 (7.0%) | 30 (9.8%) |
| $100,000+ | 55 (13.9%) | 16 (5.2%) |
| Total | 397 (100.0%) | 307 (100.0%) |
Earnings by Sex by Educational Attainment in Forest City borough
Average earnings in Forest City borough are $46,053 for men and $36,833 for women, a difference of 20.0%. Men with an educational attainment of high school diploma enjoy the highest average annual earnings of $62,614, while those with bachelor's degree education earn the least with $43,438. Women with an educational attainment of bachelor's degree earn the most with the average annual earnings of $58,125, while those with high school diploma education have the smallest earnings of $32,125.
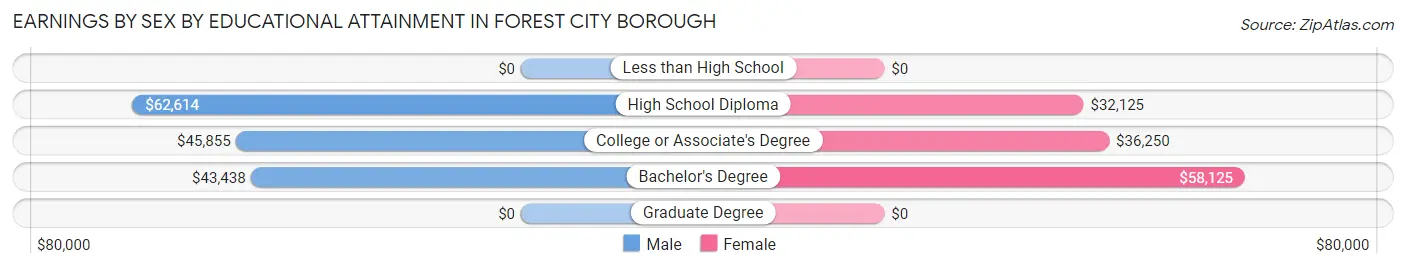
| Educational Attainment | Male Income | Female Income |
| Less than High School | - | - |
| High School Diploma | $62,614 | $32,125 |
| College or Associate's Degree | $45,855 | $36,250 |
| Bachelor's Degree | $43,438 | $58,125 |
| Graduate Degree | - | - |
| Total | $46,053 | $36,833 |
Family Income in Forest City borough
Family Income Brackets in Forest City borough
According to the Forest City borough family income data, there are 78 families falling into the $35,000 to $49,999 income range, which is the most common income bracket and makes up 20.5% of all families. Conversely, the $10,000 to $14,999 income bracket is the least frequent group with only 11 families (2.9%) belonging to this category.
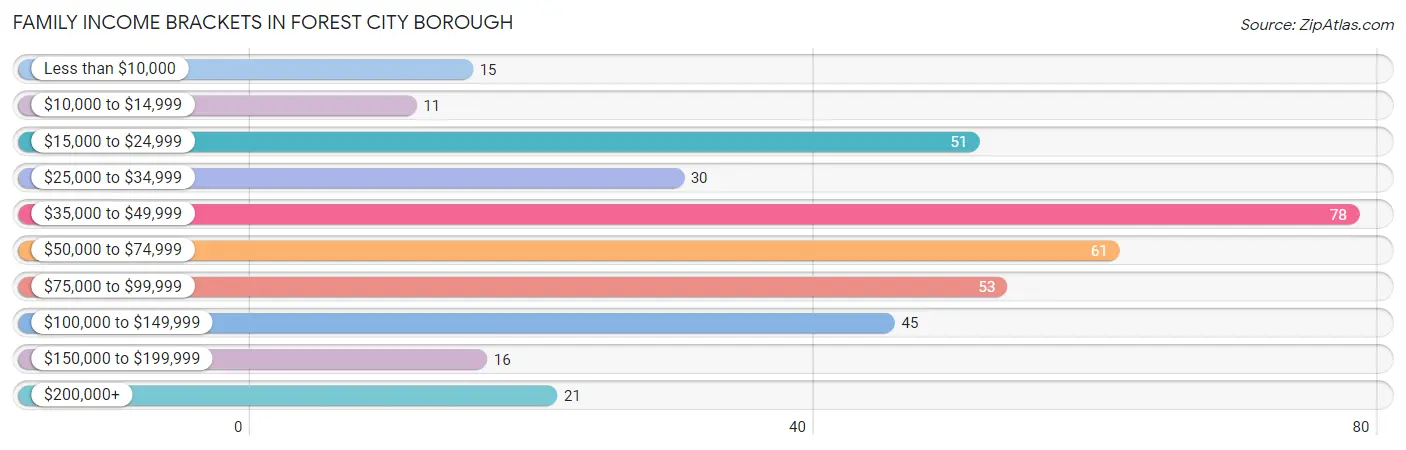
| Income Bracket | # Families | % Families |
| Less than $10,000 | 15 | 3.9% |
| $10,000 to $14,999 | 11 | 2.9% |
| $15,000 to $24,999 | 51 | 13.4% |
| $25,000 to $34,999 | 30 | 7.9% |
| $35,000 to $49,999 | 78 | 20.5% |
| $50,000 to $74,999 | 61 | 16.0% |
| $75,000 to $99,999 | 53 | 13.9% |
| $100,000 to $149,999 | 45 | 11.8% |
| $150,000 to $199,999 | 16 | 4.2% |
| $200,000+ | 21 | 5.5% |
Family Income by Famaliy Size in Forest City borough
3-person families (111 | 29.1%) account for the highest median family income in Forest City borough with $51,406 per family, while 2-person families (210 | 55.1%) have the highest median income of $24,166 per family member.
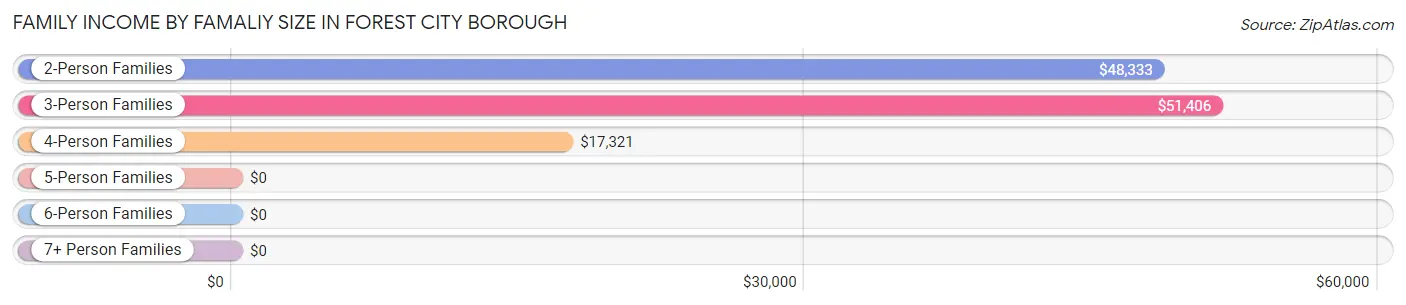
| Income Bracket | # Families | Median Income |
| 2-Person Families | 210 (55.1%) | $48,333 |
| 3-Person Families | 111 (29.1%) | $51,406 |
| 4-Person Families | 26 (6.8%) | $17,321 |
| 5-Person Families | 22 (5.8%) | $0 |
| 6-Person Families | 12 (3.2%) | $0 |
| 7+ Person Families | 0 (0.0%) | $0 |
| Total | 381 (100.0%) | $51,375 |
Family Income by Number of Earners in Forest City borough
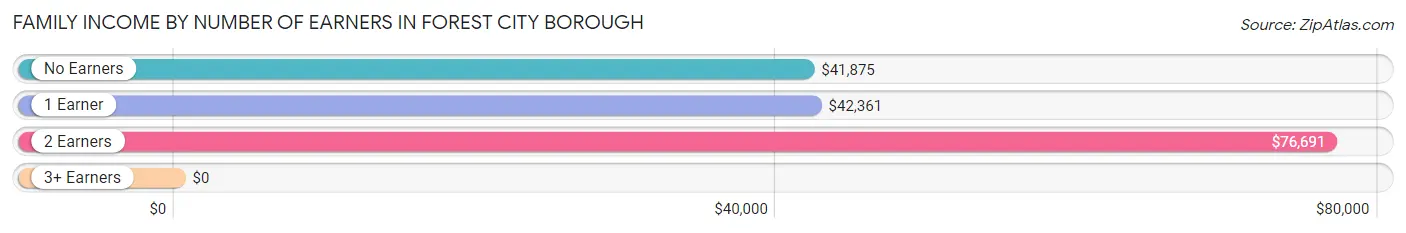
| Number of Earners | # Families | Median Income |
| No Earners | 71 (18.6%) | $41,875 |
| 1 Earner | 169 (44.4%) | $42,361 |
| 2 Earners | 133 (34.9%) | $76,691 |
| 3+ Earners | 8 (2.1%) | $0 |
| Total | 381 (100.0%) | $51,375 |
Household Income in Forest City borough
Household Income Brackets in Forest City borough
With 155 households falling in the category, the $50,000 to $74,999 income range is the most frequent in Forest City borough, accounting for 22.1% of all households. In contrast, only 22 households (3.1%) fall into the $150,000 to $199,999 income bracket, making it the least populous group.
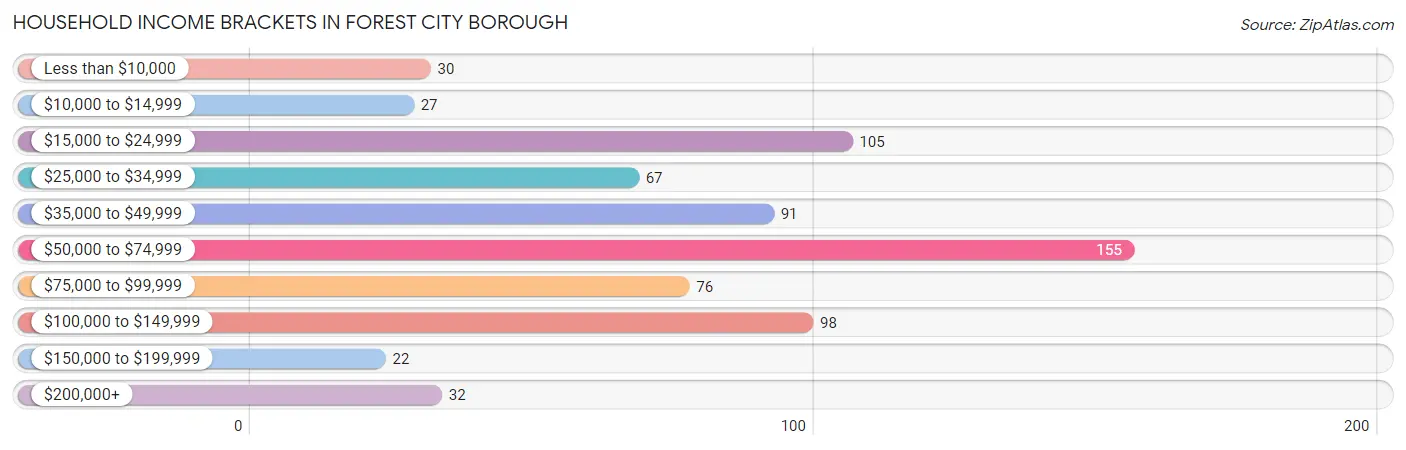
| Income Bracket | # Households | % Households |
| Less than $10,000 | 30 | 4.3% |
| $10,000 to $14,999 | 27 | 3.8% |
| $15,000 to $24,999 | 105 | 14.9% |
| $25,000 to $34,999 | 67 | 9.5% |
| $35,000 to $49,999 | 91 | 12.9% |
| $50,000 to $74,999 | 155 | 22.0% |
| $75,000 to $99,999 | 76 | 10.8% |
| $100,000 to $149,999 | 98 | 13.9% |
| $150,000 to $199,999 | 22 | 3.1% |
| $200,000+ | 32 | 4.6% |
Household Income by Householder Age in Forest City borough
The median household income in Forest City borough is $55,694, with the highest median household income of $75,147 found in the 45 to 64 years age bracket for the primary householder. A total of 240 households (34.1%) fall into this category. Meanwhile, the 15 to 24 years age bracket for the primary householder has the lowest median household income of $0, with 6 households (0.9%) in this group.
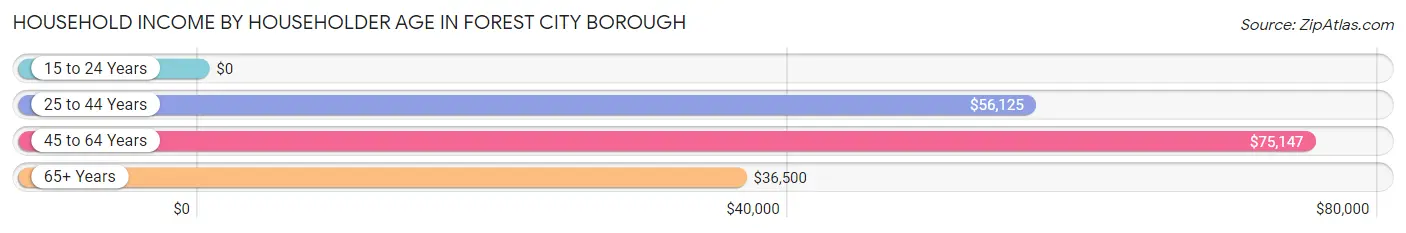
| Income Bracket | # Households | Median Income |
| 15 to 24 Years | 6 (0.9%) | $0 |
| 25 to 44 Years | 179 (25.5%) | $56,125 |
| 45 to 64 Years | 240 (34.1%) | $75,147 |
| 65+ Years | 278 (39.5%) | $36,500 |
| Total | 703 (100.0%) | $55,694 |
Poverty in Forest City borough
Income Below Poverty by Sex and Age in Forest City borough
With 15.7% poverty level for males and 19.1% for females among the residents of Forest City borough, 12 to 14 year old males and 35 to 44 year old females are the most vulnerable to poverty, with 22 males (100.0%) and 26 females (36.1%) in their respective age groups living below the poverty level.
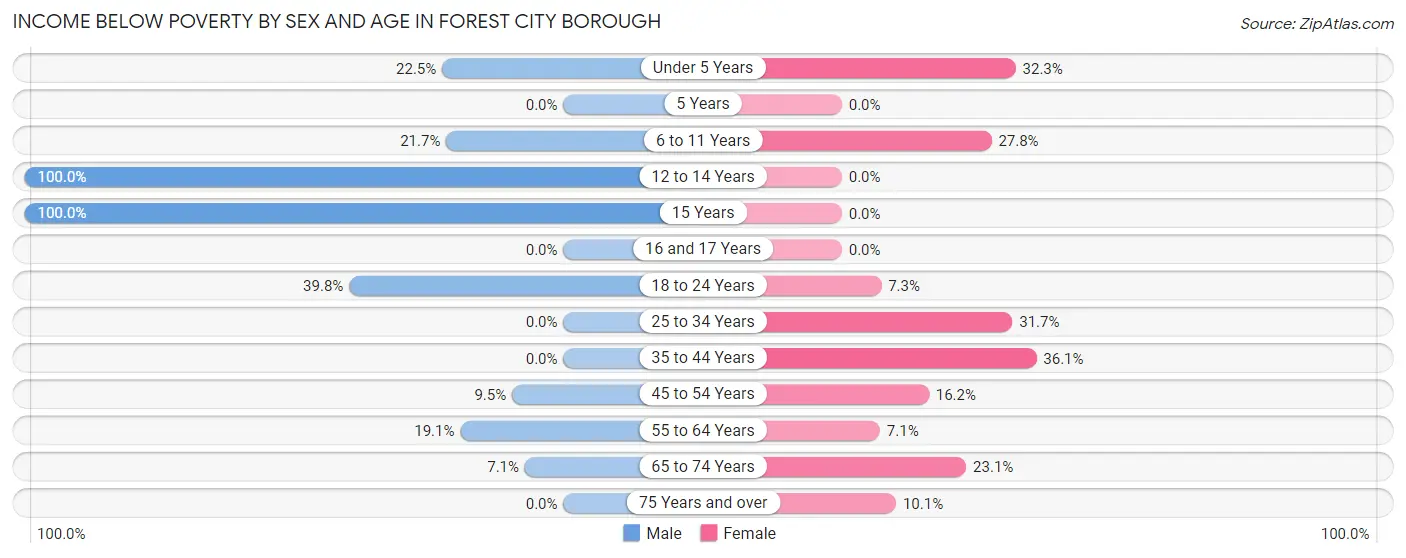
| Age Bracket | Male | Female |
| Under 5 Years | 9 (22.5%) | 20 (32.3%) |
| 5 Years | 0 (0.0%) | 0 (0.0%) |
| 6 to 11 Years | 5 (21.7%) | 20 (27.8%) |
| 12 to 14 Years | 22 (100.0%) | 0 (0.0%) |
| 15 Years | 5 (100.0%) | 0 (0.0%) |
| 16 and 17 Years | 0 (0.0%) | 0 (0.0%) |
| 18 to 24 Years | 33 (39.8%) | 3 (7.3%) |
| 25 to 34 Years | 0 (0.0%) | 25 (31.7%) |
| 35 to 44 Years | 0 (0.0%) | 26 (36.1%) |
| 45 to 54 Years | 6 (9.5%) | 21 (16.2%) |
| 55 to 64 Years | 22 (19.1%) | 7 (7.1%) |
| 65 to 74 Years | 4 (7.1%) | 21 (23.1%) |
| 75 Years and over | 0 (0.0%) | 16 (10.1%) |
| Total | 106 (15.7%) | 159 (19.1%) |
Income Above Poverty by Sex and Age in Forest City borough
According to the poverty statistics in Forest City borough, males aged 5 years and females aged 12 to 14 years are the age groups that are most secure financially, with 100.0% of males and 100.0% of females in these age groups living above the poverty line.
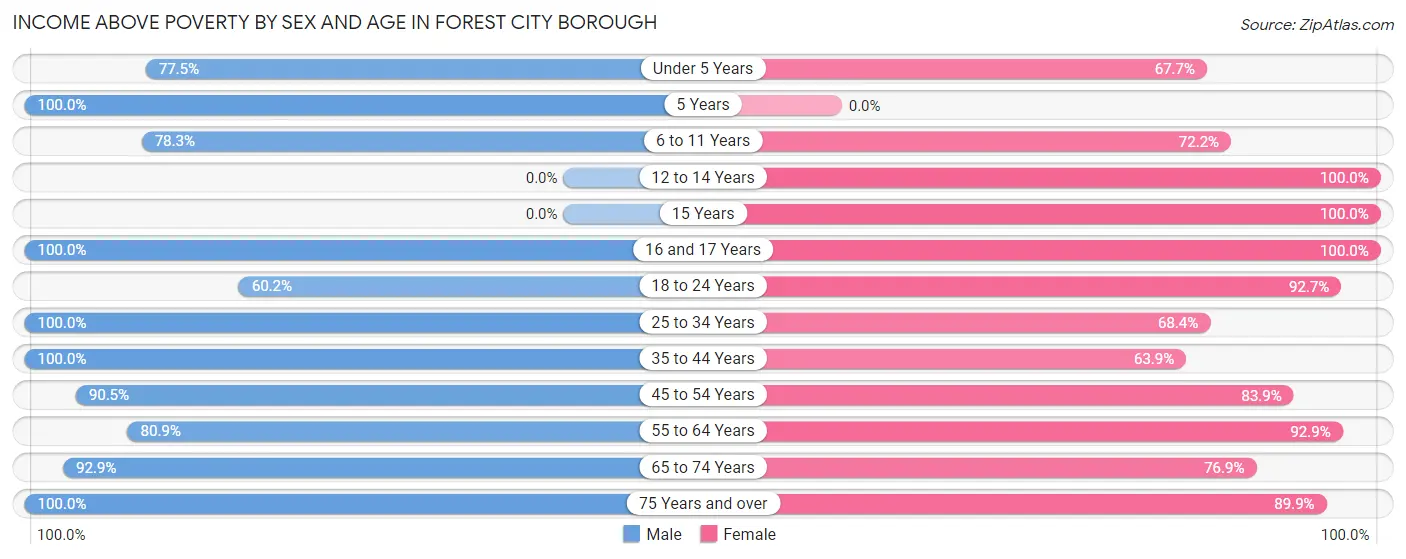
| Age Bracket | Male | Female |
| Under 5 Years | 31 (77.5%) | 42 (67.7%) |
| 5 Years | 7 (100.0%) | 0 (0.0%) |
| 6 to 11 Years | 18 (78.3%) | 52 (72.2%) |
| 12 to 14 Years | 0 (0.0%) | 13 (100.0%) |
| 15 Years | 0 (0.0%) | 5 (100.0%) |
| 16 and 17 Years | 8 (100.0%) | 9 (100.0%) |
| 18 to 24 Years | 50 (60.2%) | 38 (92.7%) |
| 25 to 34 Years | 114 (100.0%) | 54 (68.3%) |
| 35 to 44 Years | 69 (100.0%) | 46 (63.9%) |
| 45 to 54 Years | 57 (90.5%) | 109 (83.9%) |
| 55 to 64 Years | 93 (80.9%) | 92 (92.9%) |
| 65 to 74 Years | 52 (92.9%) | 70 (76.9%) |
| 75 Years and over | 70 (100.0%) | 143 (89.9%) |
| Total | 569 (84.3%) | 673 (80.9%) |
Income Below Poverty Among Married-Couple Families in Forest City borough
The poverty statistics for married-couple families in Forest City borough show that 8.9% or 17 of the total 190 families live below the poverty line. Families with no children have the highest poverty rate of 11.3%, comprising of 17 families. On the other hand, families with 1 or 2 children have the lowest poverty rate of 0.0%, which includes 0 families.
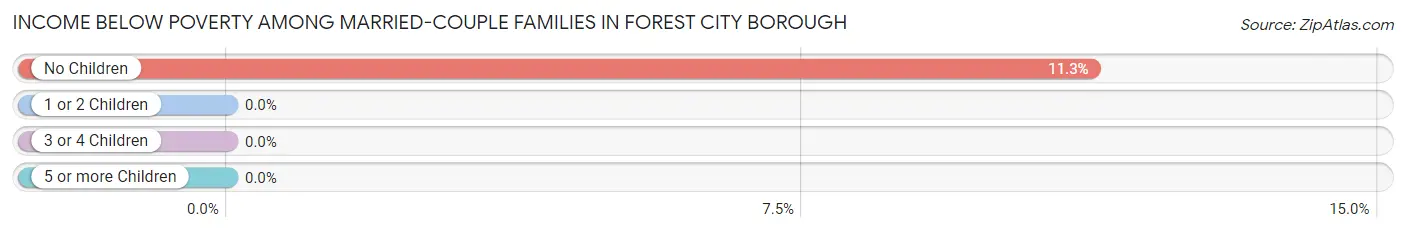
| Children | Above Poverty | Below Poverty |
| No Children | 134 (88.7%) | 17 (11.3%) |
| 1 or 2 Children | 29 (100.0%) | 0 (0.0%) |
| 3 or 4 Children | 10 (100.0%) | 0 (0.0%) |
| 5 or more Children | 0 (0.0%) | 0 (0.0%) |
| Total | 173 (91.0%) | 17 (8.9%) |
Income Below Poverty Among Single-Parent Households in Forest City borough
According to the poverty data in Forest City borough, 15.8% or 9 single-father households and 32.8% or 44 single-mother households are living below the poverty line. Among single-father households, those with 1 or 2 children have the highest poverty rate, with 9 households (39.1%) experiencing poverty. Likewise, among single-mother households, those with 3 or 4 children have the highest poverty rate, with 8 households (53.3%) falling below the poverty line.
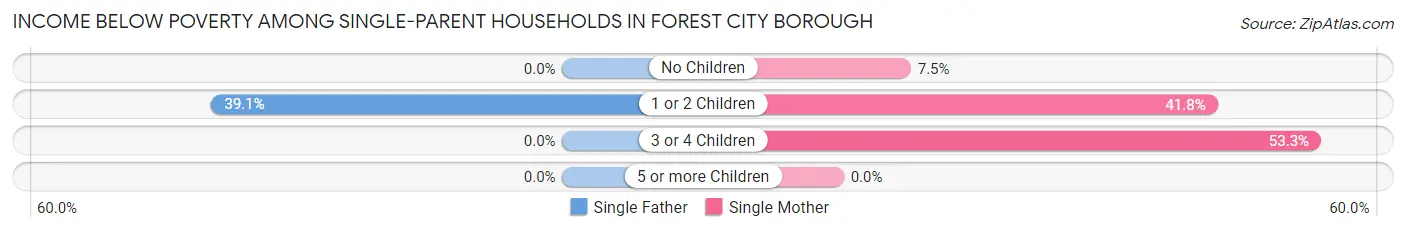
| Children | Single Father | Single Mother |
| No Children | 0 (0.0%) | 3 (7.5%) |
| 1 or 2 Children | 9 (39.1%) | 33 (41.8%) |
| 3 or 4 Children | 0 (0.0%) | 8 (53.3%) |
| 5 or more Children | 0 (0.0%) | 0 (0.0%) |
| Total | 9 (15.8%) | 44 (32.8%) |
Income Below Poverty Among Married-Couple vs Single-Parent Households in Forest City borough
The poverty data for Forest City borough shows that 17 of the married-couple family households (8.9%) and 53 of the single-parent households (27.8%) are living below the poverty level. Within the married-couple family households, those with no children have the highest poverty rate, with 17 households (11.3%) falling below the poverty line. Among the single-parent households, those with 3 or 4 children have the highest poverty rate, with 8 household (53.3%) living below poverty.
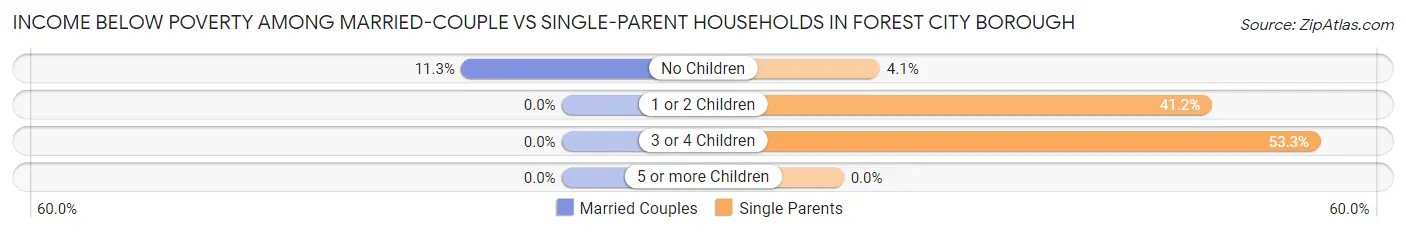
| Children | Married-Couple Families | Single-Parent Households |
| No Children | 17 (11.3%) | 3 (4.1%) |
| 1 or 2 Children | 0 (0.0%) | 42 (41.2%) |
| 3 or 4 Children | 0 (0.0%) | 8 (53.3%) |
| 5 or more Children | 0 (0.0%) | 0 (0.0%) |
| Total | 17 (8.9%) | 53 (27.8%) |
Employment Characteristics in Forest City borough
Employment by Class of Employer in Forest City borough
Among the 630 employed individuals in Forest City borough, private company employees (491 | 77.9%), not-for-profit organizations (37 | 5.9%), and self-employed (not incorporated) (26 | 4.1%) make up the most common classes of employment.
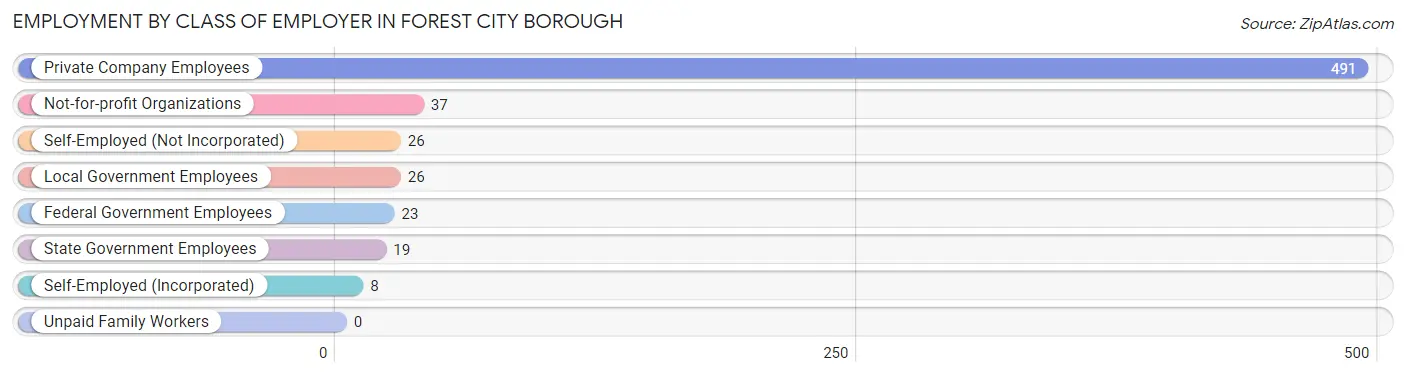
| Employer Class | # Employees | % Employees |
| Private Company Employees | 491 | 77.9% |
| Self-Employed (Incorporated) | 8 | 1.3% |
| Self-Employed (Not Incorporated) | 26 | 4.1% |
| Not-for-profit Organizations | 37 | 5.9% |
| Local Government Employees | 26 | 4.1% |
| State Government Employees | 19 | 3.0% |
| Federal Government Employees | 23 | 3.6% |
| Unpaid Family Workers | 0 | 0.0% |
| Total | 630 | 100.0% |
Employment Status by Age in Forest City borough
According to the labor force statistics for Forest City borough, out of the total population over 16 years of age (1,358), 51.7% or 702 individuals are in the labor force, with 8.5% or 60 of them unemployed. The age group with the highest labor force participation rate is 25 to 29 years, with 94.0% or 110 individuals in the labor force. Within the labor force, the 20 to 24 years age range has the highest percentage of unemployed individuals, with 42.1% or 24 of them being unemployed.
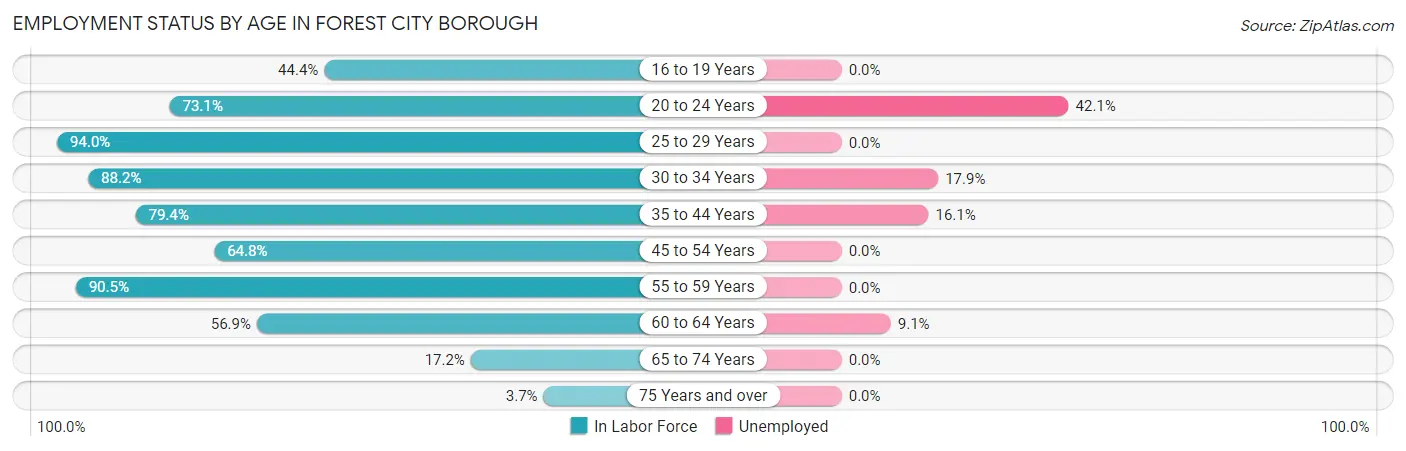
| Age Bracket | In Labor Force | Unemployed |
| 16 to 19 Years | 28 (44.4%) | 0 (0.0%) |
| 20 to 24 Years | 57 (73.1%) | 24 (42.1%) |
| 25 to 29 Years | 110 (94.0%) | 0 (0.0%) |
| 30 to 34 Years | 67 (88.2%) | 12 (17.9%) |
| 35 to 44 Years | 112 (79.4%) | 18 (16.1%) |
| 45 to 54 Years | 127 (64.8%) | 0 (0.0%) |
| 55 to 59 Years | 95 (90.5%) | 0 (0.0%) |
| 60 to 64 Years | 66 (56.9%) | 6 (9.1%) |
| 65 to 74 Years | 29 (17.2%) | 0 (0.0%) |
| 75 Years and over | 11 (3.7%) | 0 (0.0%) |
| Total | 702 (51.7%) | 60 (8.5%) |
Employment Status by Educational Attainment in Forest City borough
According to labor force statistics for Forest City borough, 76.8% of individuals (577) out of the total population between 25 and 64 years of age (751) are in the labor force, with 6.2% or 36 of them being unemployed. The group with the highest labor force participation rate are those with the educational attainment of bachelor's degree or higher, with 100.0% or 88 individuals in the labor force. Within the labor force, individuals with college / associate degree education have the highest percentage of unemployment, with 9.6% or 23 of them being unemployed.
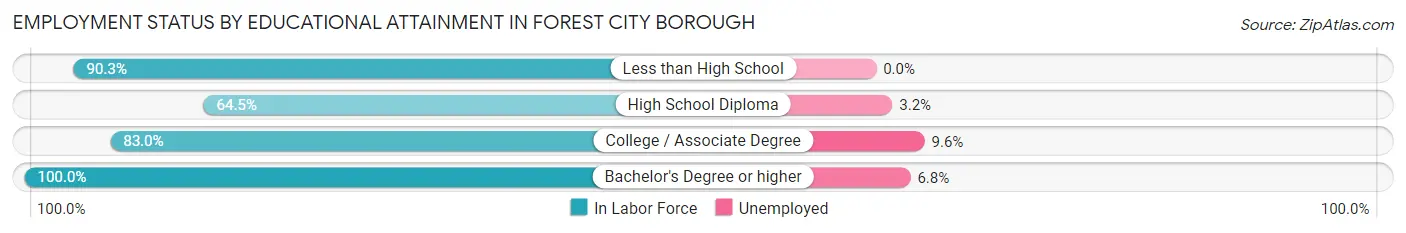
| Educational Attainment | In Labor Force | Unemployed |
| Less than High School | 28 (90.3%) | 0 (0.0%) |
| High School Diploma | 222 (64.5%) | 11 (3.2%) |
| College / Associate Degree | 239 (83.0%) | 28 (9.6%) |
| Bachelor's Degree or higher | 88 (100.0%) | 6 (6.8%) |
| Total | 577 (76.8%) | 47 (6.2%) |
Employment Occupations by Sex in Forest City borough
Management, Business, Science and Arts Occupations
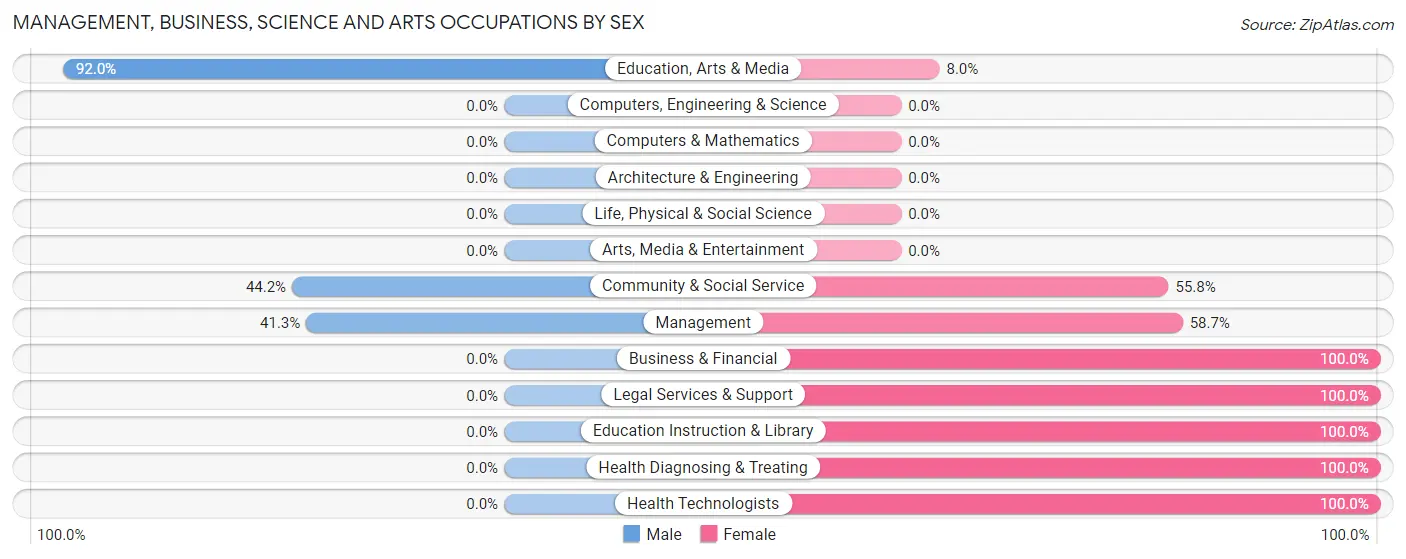
The most common Management, Business, Science and Arts occupations in Forest City borough are Management (63 | 9.8%), Health Diagnosing & Treating (60 | 9.3%), Community & Social Service (52 | 8.1%), Health Technologists (50 | 7.8%), and Education, Arts & Media (25 | 3.9%).
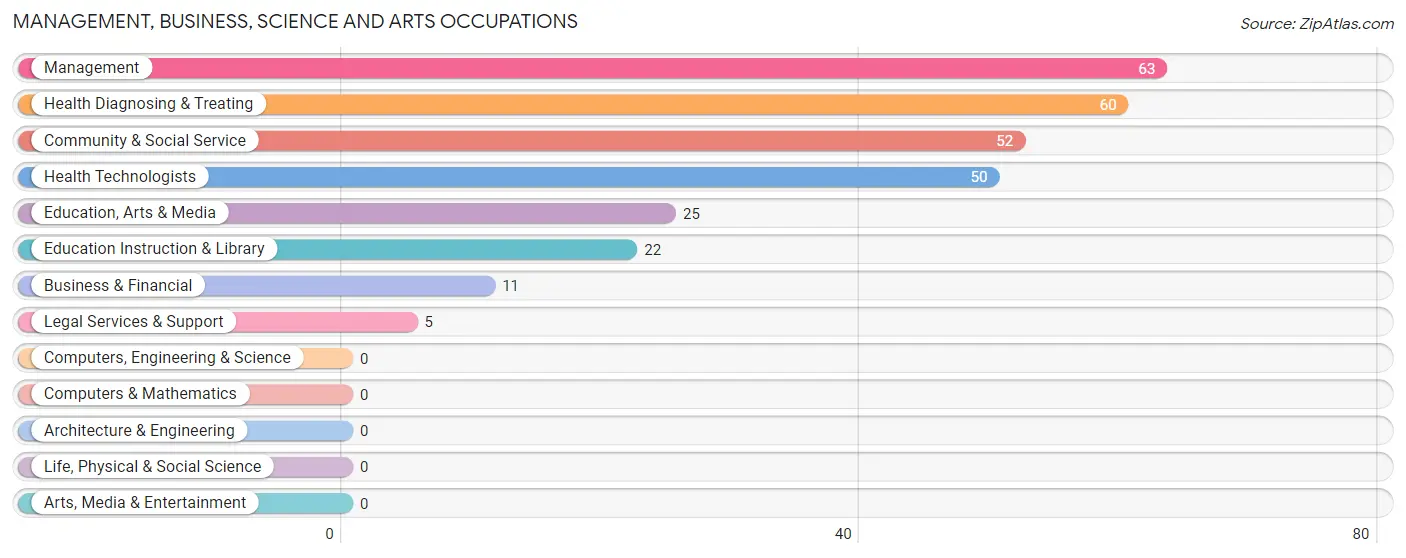
Management, Business, Science and Arts Occupations by Sex
Within the Management, Business, Science and Arts occupations in Forest City borough, the most male-oriented occupations are Education, Arts & Media (92.0%), Community & Social Service (44.2%), and Management (41.3%), while the most female-oriented occupations are Business & Financial (100.0%), Legal Services & Support (100.0%), and Education Instruction & Library (100.0%).
| Occupation | Male | Female |
| Management | 26 (41.3%) | 37 (58.7%) |
| Business & Financial | 0 (0.0%) | 11 (100.0%) |
| Computers, Engineering & Science | 0 (0.0%) | 0 (0.0%) |
| Computers & Mathematics | 0 (0.0%) | 0 (0.0%) |
| Architecture & Engineering | 0 (0.0%) | 0 (0.0%) |
| Life, Physical & Social Science | 0 (0.0%) | 0 (0.0%) |
| Community & Social Service | 23 (44.2%) | 29 (55.8%) |
| Education, Arts & Media | 23 (92.0%) | 2 (8.0%) |
| Legal Services & Support | 0 (0.0%) | 5 (100.0%) |
| Education Instruction & Library | 0 (0.0%) | 22 (100.0%) |
| Arts, Media & Entertainment | 0 (0.0%) | 0 (0.0%) |
| Health Diagnosing & Treating | 0 (0.0%) | 60 (100.0%) |
| Health Technologists | 0 (0.0%) | 50 (100.0%) |
| Total (Category) | 49 (26.3%) | 137 (73.7%) |
| Total (Overall) | 367 (57.2%) | 275 (42.8%) |
Services Occupations
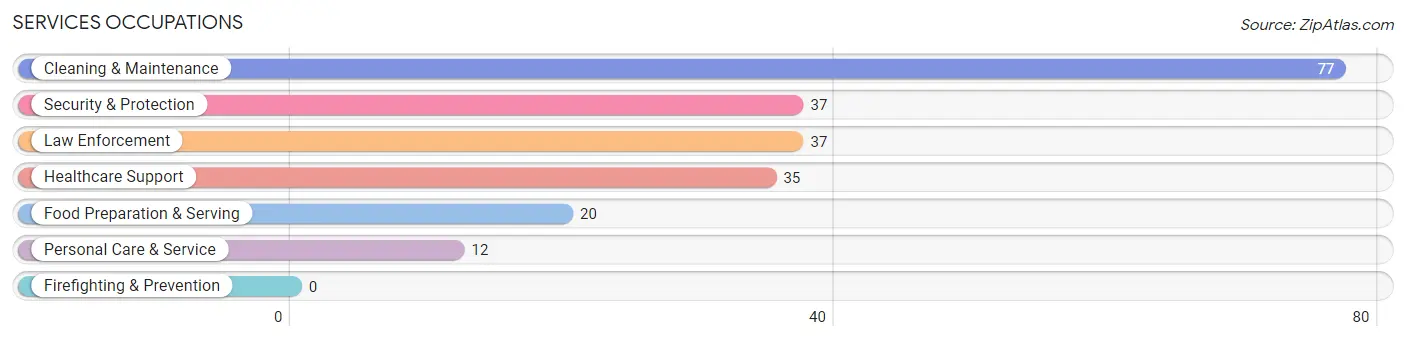
The most common Services occupations in Forest City borough are Cleaning & Maintenance (77 | 12.0%), Security & Protection (37 | 5.8%), Law Enforcement (37 | 5.8%), Healthcare Support (35 | 5.4%), and Food Preparation & Serving (20 | 3.1%).
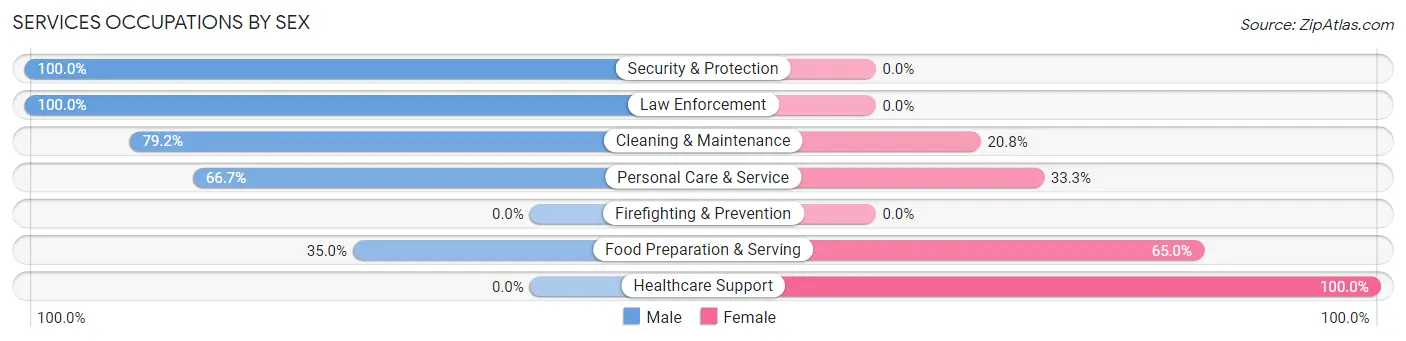
Services Occupations by Sex
Within the Services occupations in Forest City borough, the most male-oriented occupations are Security & Protection (100.0%), Law Enforcement (100.0%), and Cleaning & Maintenance (79.2%), while the most female-oriented occupations are Healthcare Support (100.0%), Food Preparation & Serving (65.0%), and Personal Care & Service (33.3%).
| Occupation | Male | Female |
| Healthcare Support | 0 (0.0%) | 35 (100.0%) |
| Security & Protection | 37 (100.0%) | 0 (0.0%) |
| Firefighting & Prevention | 0 (0.0%) | 0 (0.0%) |
| Law Enforcement | 37 (100.0%) | 0 (0.0%) |
| Food Preparation & Serving | 7 (35.0%) | 13 (65.0%) |
| Cleaning & Maintenance | 61 (79.2%) | 16 (20.8%) |
| Personal Care & Service | 8 (66.7%) | 4 (33.3%) |
| Total (Category) | 113 (62.4%) | 68 (37.6%) |
| Total (Overall) | 367 (57.2%) | 275 (42.8%) |
Sales and Office Occupations
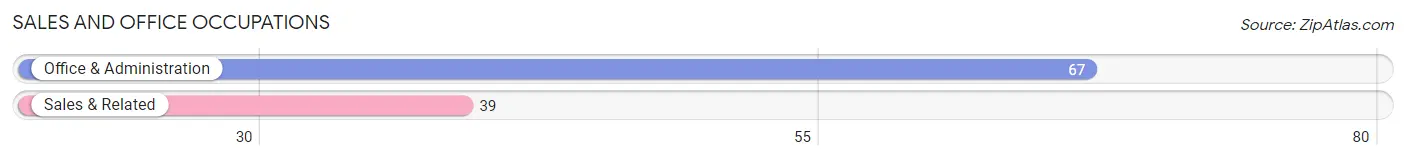
The most common Sales and Office occupations in Forest City borough are Office & Administration (67 | 10.4%), and Sales & Related (39 | 6.1%).
Sales and Office Occupations by Sex
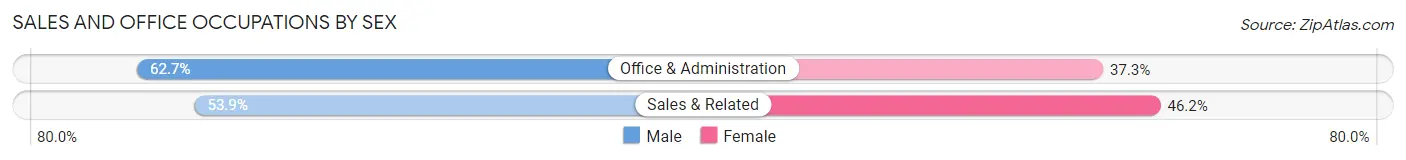
| Occupation | Male | Female |
| Sales & Related | 21 (53.8%) | 18 (46.2%) |
| Office & Administration | 42 (62.7%) | 25 (37.3%) |
| Total (Category) | 63 (59.4%) | 43 (40.6%) |
| Total (Overall) | 367 (57.2%) | 275 (42.8%) |
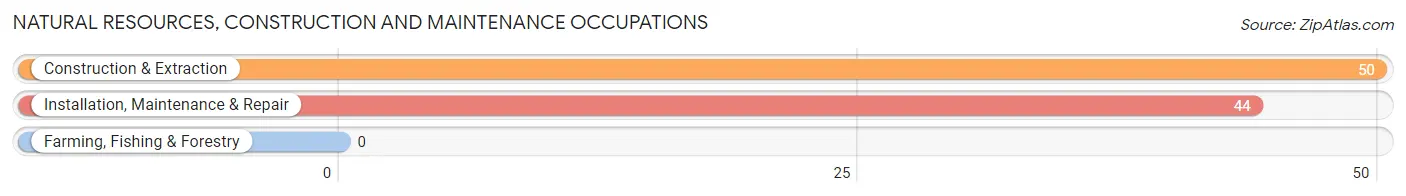
Natural Resources, Construction and Maintenance Occupations
The most common Natural Resources, Construction and Maintenance occupations in Forest City borough are Construction & Extraction (50 | 7.8%), and Installation, Maintenance & Repair (44 | 6.9%).
Natural Resources, Construction and Maintenance Occupations by Sex
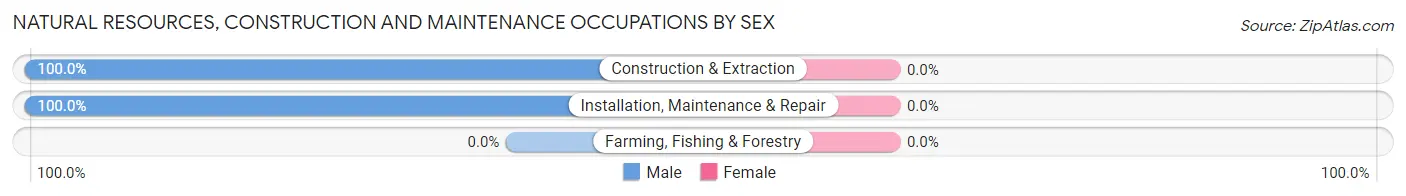
| Occupation | Male | Female |
| Farming, Fishing & Forestry | 0 (0.0%) | 0 (0.0%) |
| Construction & Extraction | 50 (100.0%) | 0 (0.0%) |
| Installation, Maintenance & Repair | 44 (100.0%) | 0 (0.0%) |
| Total (Category) | 94 (100.0%) | 0 (0.0%) |
| Total (Overall) | 367 (57.2%) | 275 (42.8%) |
Production, Transportation and Moving Occupations
The most common Production, Transportation and Moving occupations in Forest City borough are Production (60 | 9.3%), Transportation (12 | 1.9%), and Material Moving (3 | 0.5%).
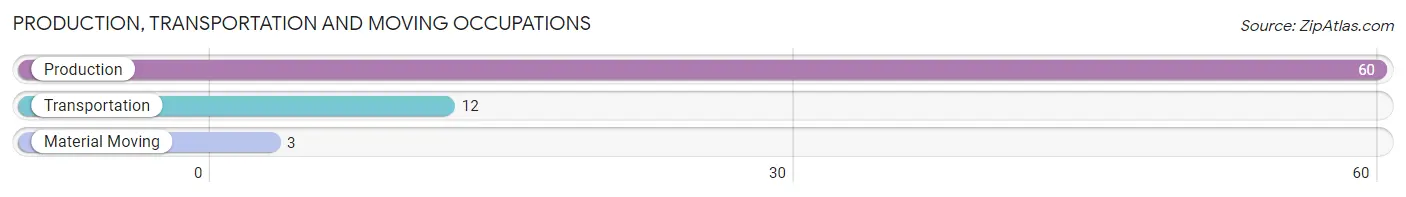
Production, Transportation and Moving Occupations by Sex
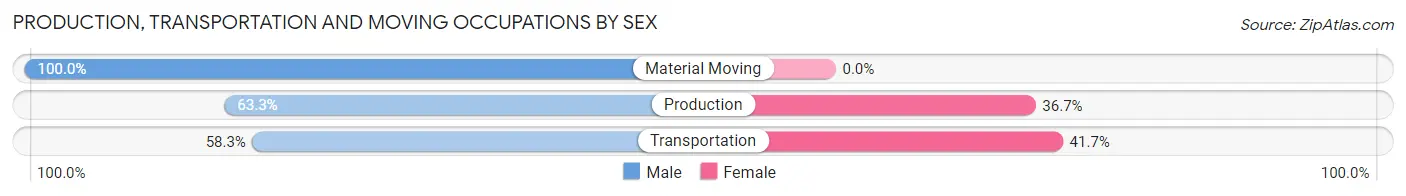
| Occupation | Male | Female |
| Production | 38 (63.3%) | 22 (36.7%) |
| Transportation | 7 (58.3%) | 5 (41.7%) |
| Material Moving | 3 (100.0%) | 0 (0.0%) |
| Total (Category) | 48 (64.0%) | 27 (36.0%) |
| Total (Overall) | 367 (57.2%) | 275 (42.8%) |
Employment Industries by Sex in Forest City borough
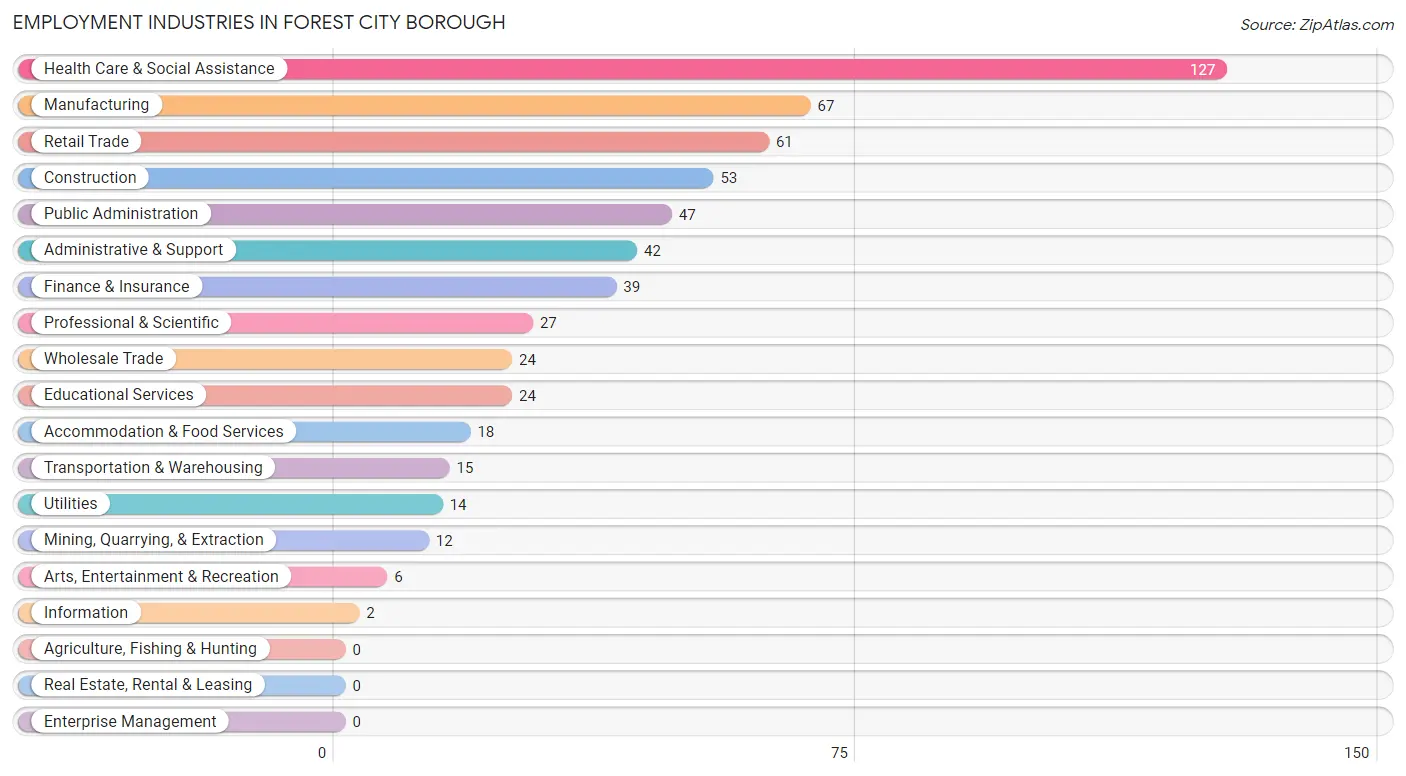
Employment Industries in Forest City borough
The major employment industries in Forest City borough include Health Care & Social Assistance (127 | 19.8%), Manufacturing (67 | 10.4%), Retail Trade (61 | 9.5%), Construction (53 | 8.3%), and Public Administration (47 | 7.3%).
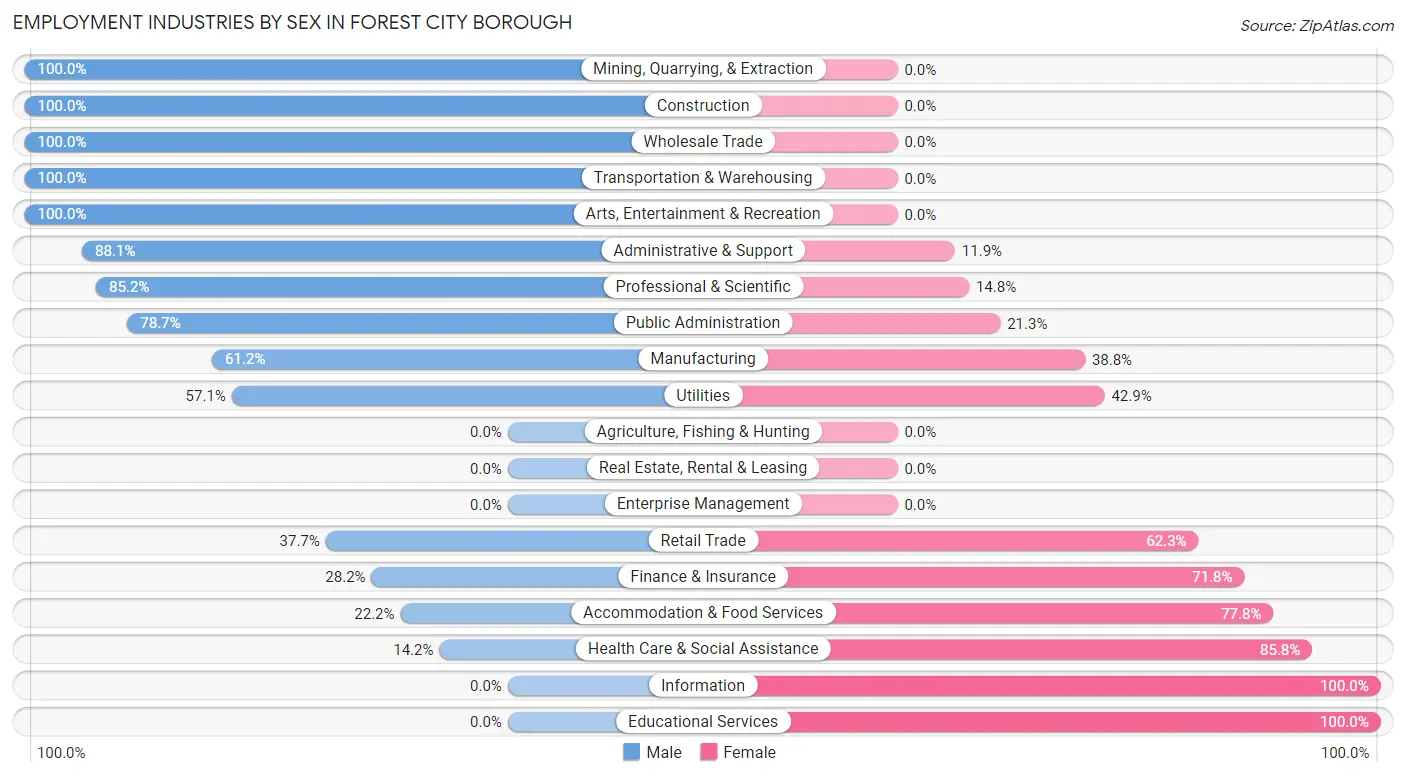
Employment Industries by Sex in Forest City borough
The Forest City borough industries that see more men than women are Mining, Quarrying, & Extraction (100.0%), Construction (100.0%), and Wholesale Trade (100.0%), whereas the industries that tend to have a higher number of women are Information (100.0%), Educational Services (100.0%), and Health Care & Social Assistance (85.8%).
| Industry | Male | Female |
| Agriculture, Fishing & Hunting | 0 (0.0%) | 0 (0.0%) |
| Mining, Quarrying, & Extraction | 12 (100.0%) | 0 (0.0%) |
| Construction | 53 (100.0%) | 0 (0.0%) |
| Manufacturing | 41 (61.2%) | 26 (38.8%) |
| Wholesale Trade | 24 (100.0%) | 0 (0.0%) |
| Retail Trade | 23 (37.7%) | 38 (62.3%) |
| Transportation & Warehousing | 15 (100.0%) | 0 (0.0%) |
| Utilities | 8 (57.1%) | 6 (42.9%) |
| Information | 0 (0.0%) | 2 (100.0%) |
| Finance & Insurance | 11 (28.2%) | 28 (71.8%) |
| Real Estate, Rental & Leasing | 0 (0.0%) | 0 (0.0%) |
| Professional & Scientific | 23 (85.2%) | 4 (14.8%) |
| Enterprise Management | 0 (0.0%) | 0 (0.0%) |
| Administrative & Support | 37 (88.1%) | 5 (11.9%) |
| Educational Services | 0 (0.0%) | 24 (100.0%) |
| Health Care & Social Assistance | 18 (14.2%) | 109 (85.8%) |
| Arts, Entertainment & Recreation | 6 (100.0%) | 0 (0.0%) |
| Accommodation & Food Services | 4 (22.2%) | 14 (77.8%) |
| Public Administration | 37 (78.7%) | 10 (21.3%) |
| Total | 367 (57.2%) | 275 (42.8%) |
Education in Forest City borough
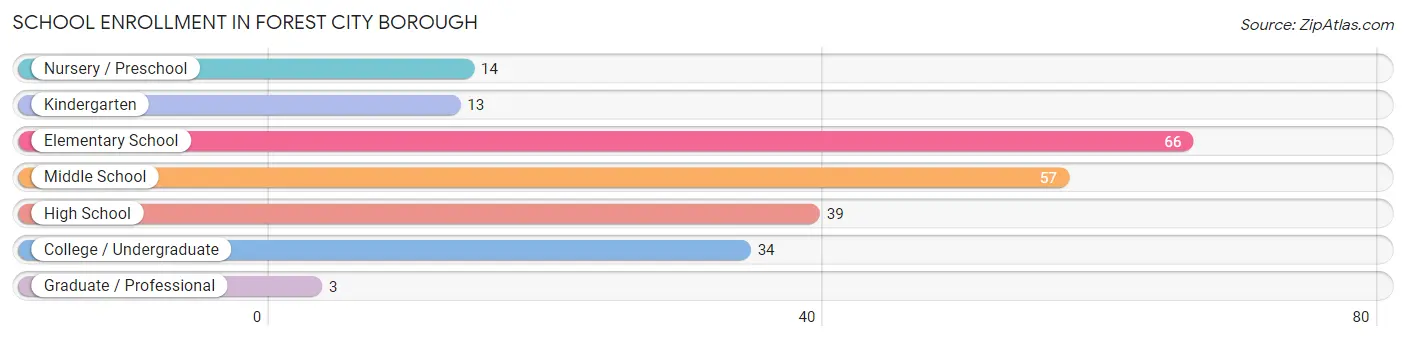
School Enrollment in Forest City borough
The most common levels of schooling among the 226 students in Forest City borough are elementary school (66 | 29.2%), middle school (57 | 25.2%), and high school (39 | 17.3%).
| School Level | # Students | % Students |
| Nursery / Preschool | 14 | 6.2% |
| Kindergarten | 13 | 5.8% |
| Elementary School | 66 | 29.2% |
| Middle School | 57 | 25.2% |
| High School | 39 | 17.3% |
| College / Undergraduate | 34 | 15.0% |
| Graduate / Professional | 3 | 1.3% |
| Total | 226 | 100.0% |
School Enrollment by Age by Funding Source in Forest City borough
Out of a total of 226 students who are enrolled in schools in Forest City borough, 18 (8.0%) attend a private institution, while the remaining 208 (92.0%) are enrolled in public schools. The age group of 35 years and over has the highest likelihood of being enrolled in private schools, with 11 (44.0% in the age bracket) enrolled. Conversely, the age group of 3 to 4 year olds has the lowest likelihood of being enrolled in a private school, with 14 (100.0% in the age bracket) attending a public institution.
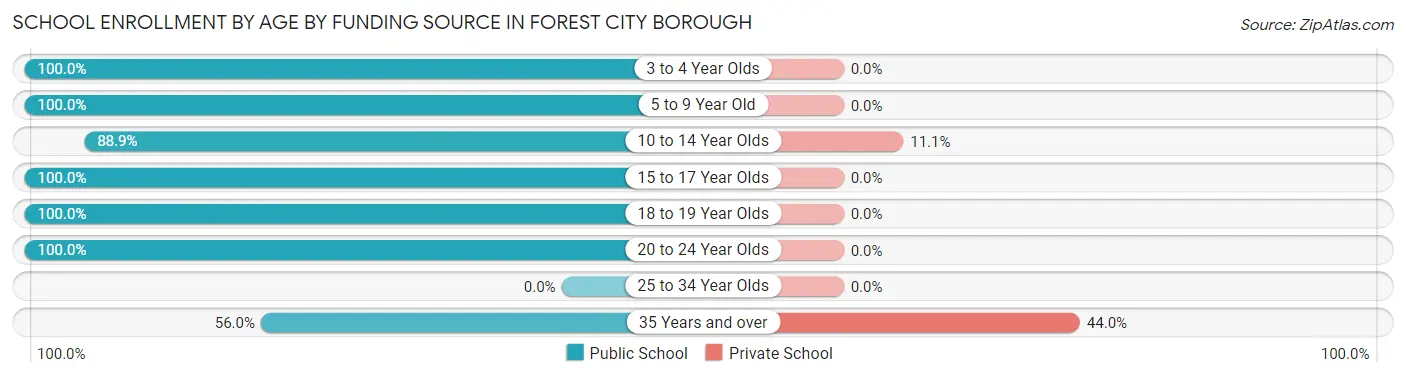
| Age Bracket | Public School | Private School |
| 3 to 4 Year Olds | 14 (100.0%) | 0 (0.0%) |
| 5 to 9 Year Old | 79 (100.0%) | 0 (0.0%) |
| 10 to 14 Year Olds | 56 (88.9%) | 7 (11.1%) |
| 15 to 17 Year Olds | 24 (100.0%) | 0 (0.0%) |
| 18 to 19 Year Olds | 16 (100.0%) | 0 (0.0%) |
| 20 to 24 Year Olds | 5 (100.0%) | 0 (0.0%) |
| 25 to 34 Year Olds | 0 (0.0%) | 0 (0.0%) |
| 35 Years and over | 14 (56.0%) | 11 (44.0%) |
| Total | 208 (92.0%) | 18 (8.0%) |
Educational Attainment by Field of Study in Forest City borough
Business (42 | 25.6%), education (34 | 20.7%), science & technology (20 | 12.2%), social sciences (17 | 10.4%), and computers & mathematics (14 | 8.5%) are the most common fields of study among 164 individuals in Forest City borough who have obtained a bachelor's degree or higher.
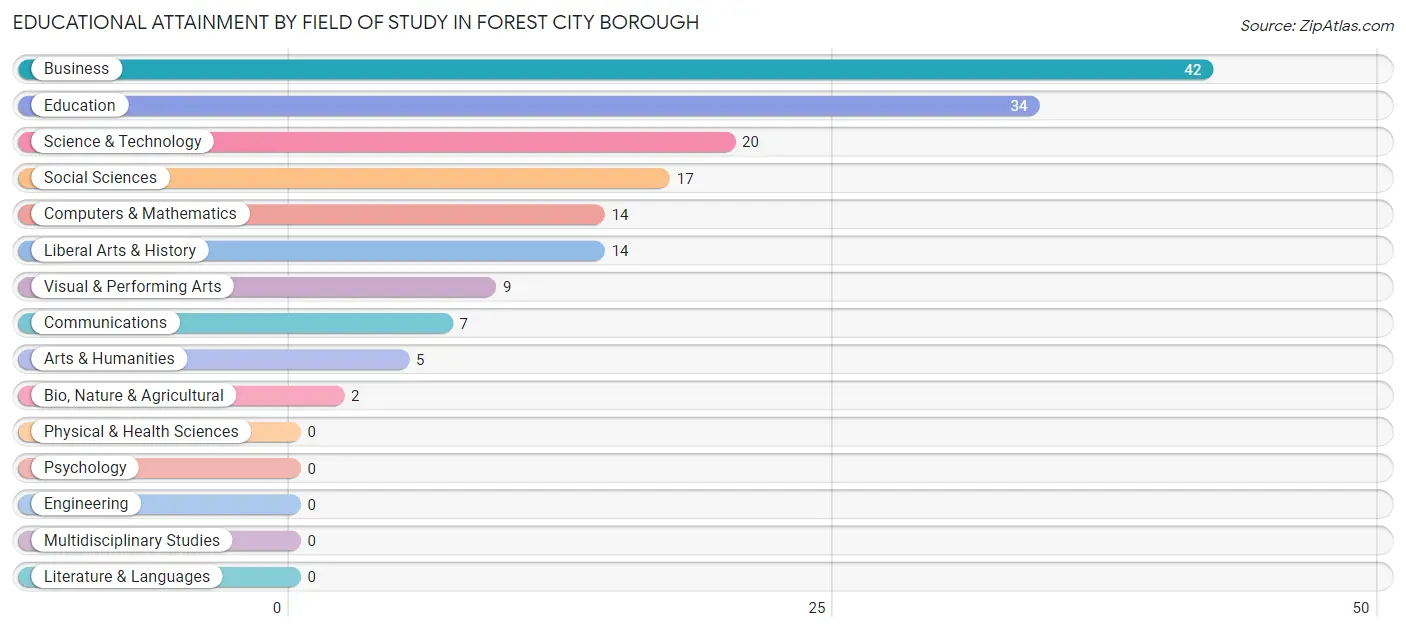
| Field of Study | # Graduates | % Graduates |
| Computers & Mathematics | 14 | 8.5% |
| Bio, Nature & Agricultural | 2 | 1.2% |
| Physical & Health Sciences | 0 | 0.0% |
| Psychology | 0 | 0.0% |
| Social Sciences | 17 | 10.4% |
| Engineering | 0 | 0.0% |
| Multidisciplinary Studies | 0 | 0.0% |
| Science & Technology | 20 | 12.2% |
| Business | 42 | 25.6% |
| Education | 34 | 20.7% |
| Literature & Languages | 0 | 0.0% |
| Liberal Arts & History | 14 | 8.5% |
| Visual & Performing Arts | 9 | 5.5% |
| Communications | 7 | 4.3% |
| Arts & Humanities | 5 | 3.0% |
| Total | 164 | 100.0% |
Transportation & Commute in Forest City borough
Vehicle Availability by Sex in Forest City borough
The most prevalent vehicle ownership categories in Forest City borough are males with 2 vehicles (170, accounting for 47.6%) and females with 2 vehicles (85, making up 62.3%).
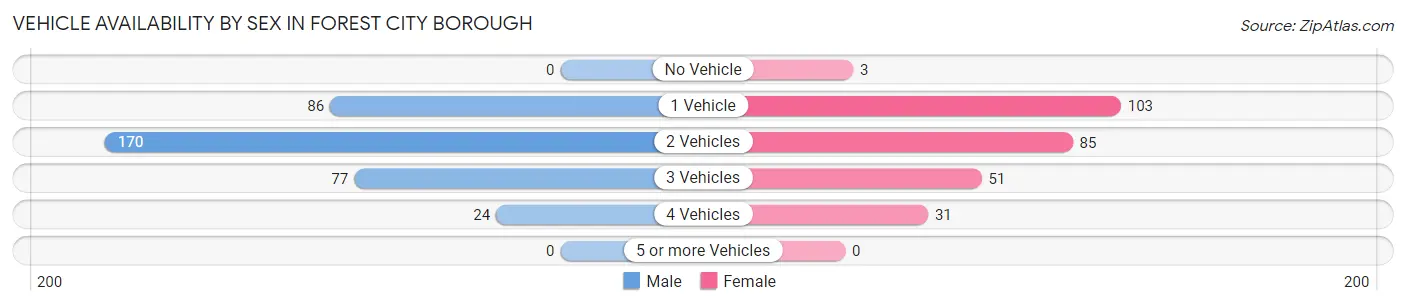
| Vehicles Available | Male | Female |
| No Vehicle | 0 (0.0%) | 3 (1.1%) |
| 1 Vehicle | 86 (24.1%) | 103 (37.7%) |
| 2 Vehicles | 170 (47.6%) | 85 (31.1%) |
| 3 Vehicles | 77 (21.6%) | 51 (18.7%) |
| 4 Vehicles | 24 (6.7%) | 31 (11.4%) |
| 5 or more Vehicles | 0 (0.0%) | 0 (0.0%) |
| Total | 357 (100.0%) | 273 (100.0%) |
Commute Time in Forest City borough
The most frequently occuring commute durations in Forest City borough are 5 to 9 minutes (79 commuters, 14.8%), less than 5 minutes (67 commuters, 12.5%), and 30 to 34 minutes (64 commuters, 12.0%).
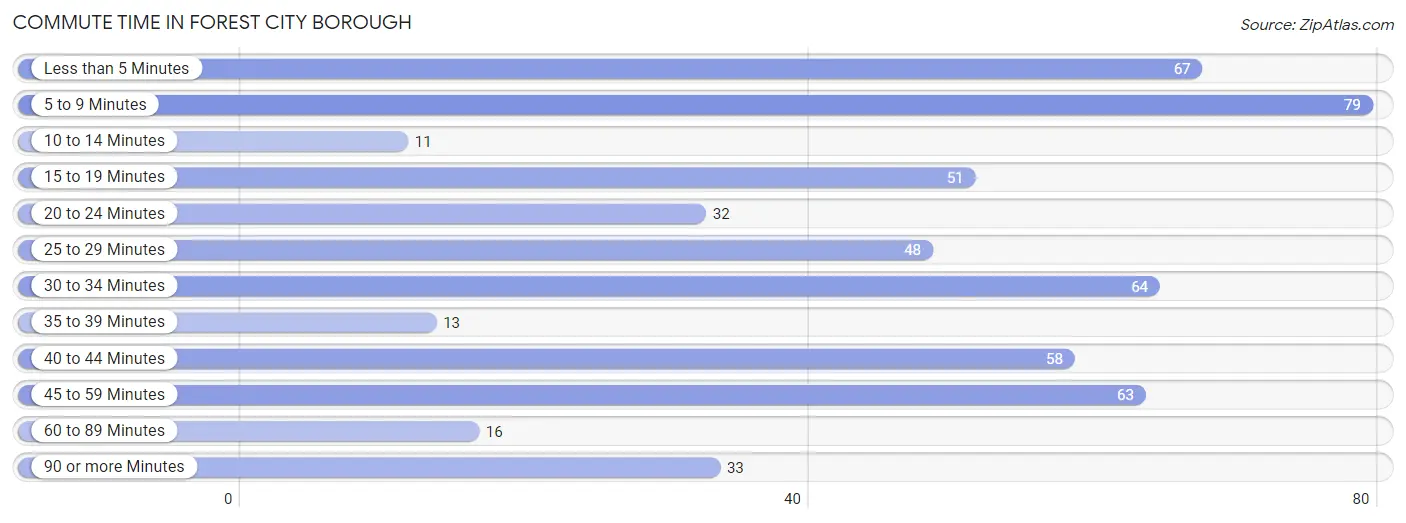
| Commute Time | # Commuters | % Commuters |
| Less than 5 Minutes | 67 | 12.5% |
| 5 to 9 Minutes | 79 | 14.8% |
| 10 to 14 Minutes | 11 | 2.1% |
| 15 to 19 Minutes | 51 | 9.5% |
| 20 to 24 Minutes | 32 | 6.0% |
| 25 to 29 Minutes | 48 | 9.0% |
| 30 to 34 Minutes | 64 | 12.0% |
| 35 to 39 Minutes | 13 | 2.4% |
| 40 to 44 Minutes | 58 | 10.8% |
| 45 to 59 Minutes | 63 | 11.8% |
| 60 to 89 Minutes | 16 | 3.0% |
| 90 or more Minutes | 33 | 6.2% |
Commute Time by Sex in Forest City borough
The most common commute times in Forest City borough are 45 to 59 minutes (53 commuters, 18.5%) for males and less than 5 minutes (50 commuters, 20.2%) for females.
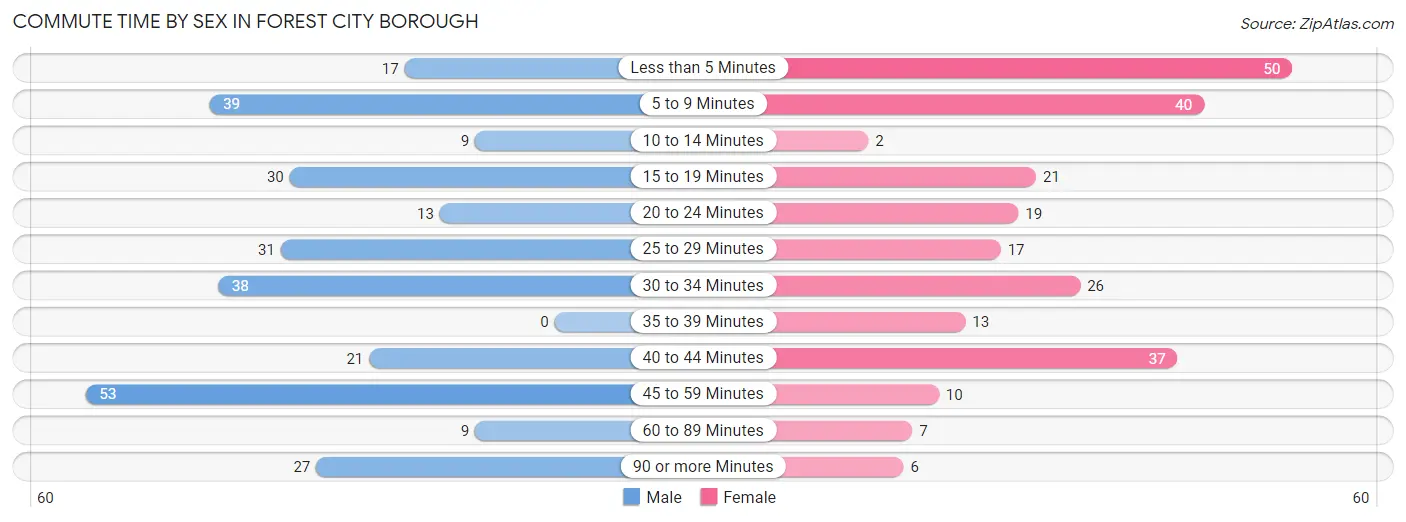
| Commute Time | Male | Female |
| Less than 5 Minutes | 17 (5.9%) | 50 (20.2%) |
| 5 to 9 Minutes | 39 (13.6%) | 40 (16.1%) |
| 10 to 14 Minutes | 9 (3.1%) | 2 (0.8%) |
| 15 to 19 Minutes | 30 (10.4%) | 21 (8.5%) |
| 20 to 24 Minutes | 13 (4.5%) | 19 (7.7%) |
| 25 to 29 Minutes | 31 (10.8%) | 17 (6.9%) |
| 30 to 34 Minutes | 38 (13.2%) | 26 (10.5%) |
| 35 to 39 Minutes | 0 (0.0%) | 13 (5.2%) |
| 40 to 44 Minutes | 21 (7.3%) | 37 (14.9%) |
| 45 to 59 Minutes | 53 (18.5%) | 10 (4.0%) |
| 60 to 89 Minutes | 9 (3.1%) | 7 (2.8%) |
| 90 or more Minutes | 27 (9.4%) | 6 (2.4%) |
Time of Departure to Work by Sex in Forest City borough
The most frequent times of departure to work in Forest City borough are 7:00 AM to 7:29 AM (56, 19.5%) for males and 6:00 AM to 6:29 AM (56, 22.6%) for females.
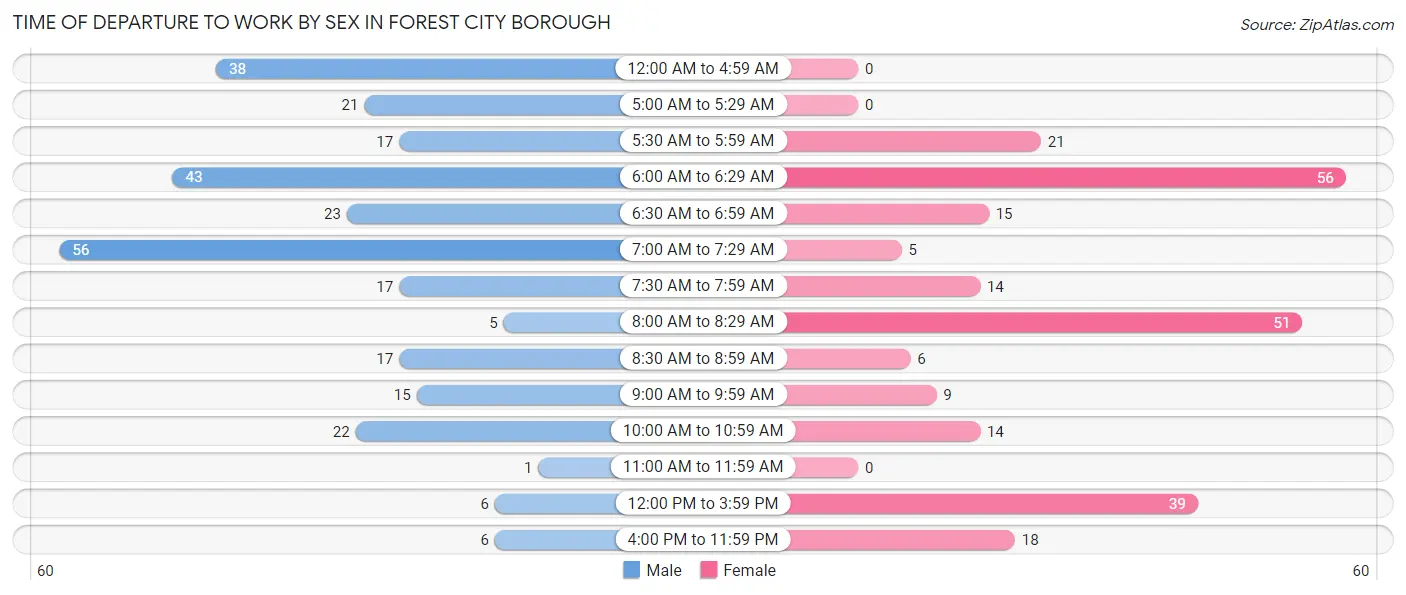
| Time of Departure | Male | Female |
| 12:00 AM to 4:59 AM | 38 (13.2%) | 0 (0.0%) |
| 5:00 AM to 5:29 AM | 21 (7.3%) | 0 (0.0%) |
| 5:30 AM to 5:59 AM | 17 (5.9%) | 21 (8.5%) |
| 6:00 AM to 6:29 AM | 43 (15.0%) | 56 (22.6%) |
| 6:30 AM to 6:59 AM | 23 (8.0%) | 15 (6.0%) |
| 7:00 AM to 7:29 AM | 56 (19.5%) | 5 (2.0%) |
| 7:30 AM to 7:59 AM | 17 (5.9%) | 14 (5.7%) |
| 8:00 AM to 8:29 AM | 5 (1.7%) | 51 (20.6%) |
| 8:30 AM to 8:59 AM | 17 (5.9%) | 6 (2.4%) |
| 9:00 AM to 9:59 AM | 15 (5.2%) | 9 (3.6%) |
| 10:00 AM to 10:59 AM | 22 (7.7%) | 14 (5.7%) |
| 11:00 AM to 11:59 AM | 1 (0.4%) | 0 (0.0%) |
| 12:00 PM to 3:59 PM | 6 (2.1%) | 39 (15.7%) |
| 4:00 PM to 11:59 PM | 6 (2.1%) | 18 (7.3%) |
| Total | 287 (100.0%) | 248 (100.0%) |
Housing Occupancy in Forest City borough
Occupancy by Ownership in Forest City borough
Of the total 703 dwellings in Forest City borough, owner-occupied units account for 435 (61.9%), while renter-occupied units make up 268 (38.1%).
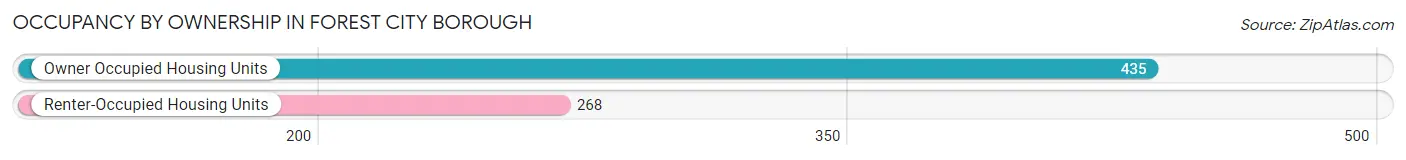
| Occupancy | # Housing Units | % Housing Units |
| Owner Occupied Housing Units | 435 | 61.9% |
| Renter-Occupied Housing Units | 268 | 38.1% |
| Total Occupied Housing Units | 703 | 100.0% |
Occupancy by Household Size in Forest City borough
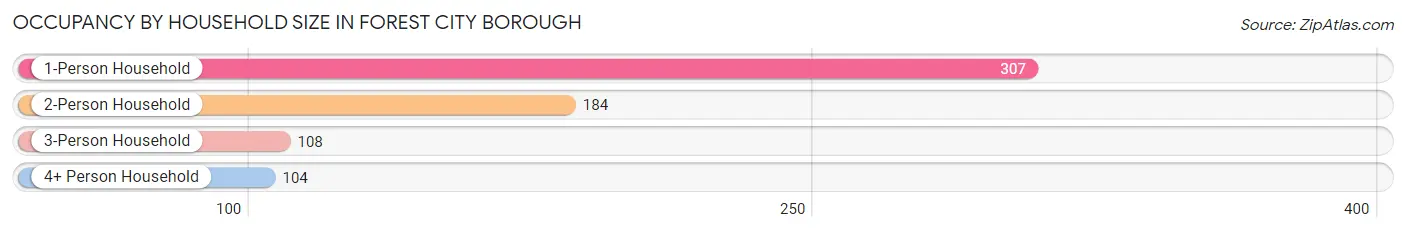
| Household Size | # Housing Units | % Housing Units |
| 1-Person Household | 307 | 43.7% |
| 2-Person Household | 184 | 26.2% |
| 3-Person Household | 108 | 15.4% |
| 4+ Person Household | 104 | 14.8% |
| Total Housing Units | 703 | 100.0% |
Occupancy by Ownership by Household Size in Forest City borough
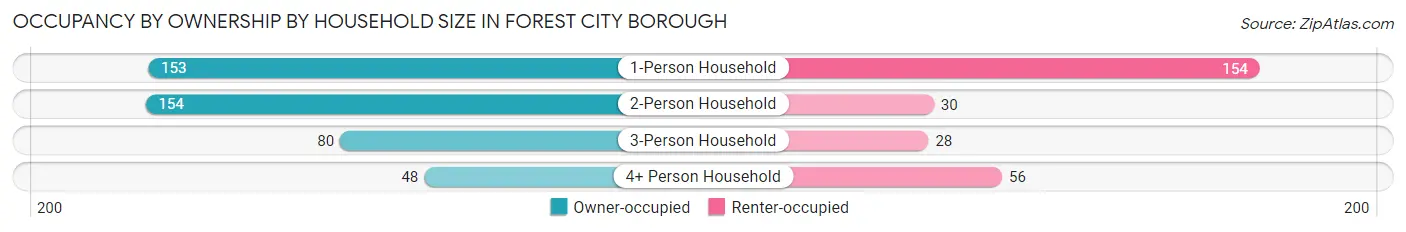
| Household Size | Owner-occupied | Renter-occupied |
| 1-Person Household | 153 (49.8%) | 154 (50.2%) |
| 2-Person Household | 154 (83.7%) | 30 (16.3%) |
| 3-Person Household | 80 (74.1%) | 28 (25.9%) |
| 4+ Person Household | 48 (46.2%) | 56 (53.8%) |
| Total Housing Units | 435 (61.9%) | 268 (38.1%) |
Occupancy by Educational Attainment in Forest City borough
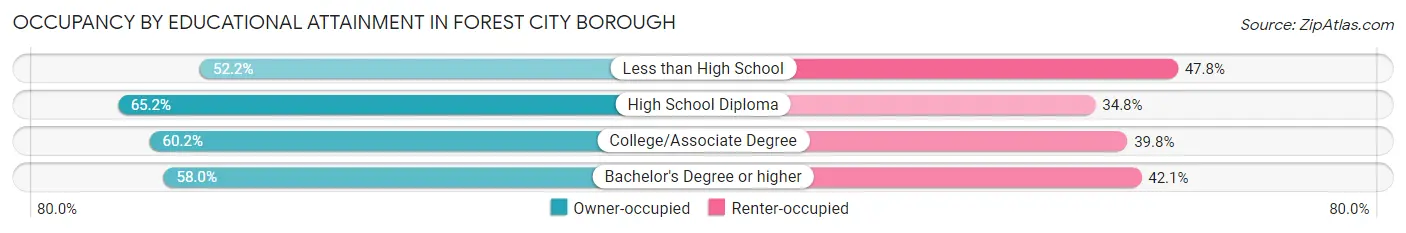
| Household Size | Owner-occupied | Renter-occupied |
| Less than High School | 24 (52.2%) | 22 (47.8%) |
| High School Diploma | 227 (65.2%) | 121 (34.8%) |
| College/Associate Degree | 133 (60.2%) | 88 (39.8%) |
| Bachelor's Degree or higher | 51 (58.0%) | 37 (42.0%) |
Occupancy by Age of Householder in Forest City borough
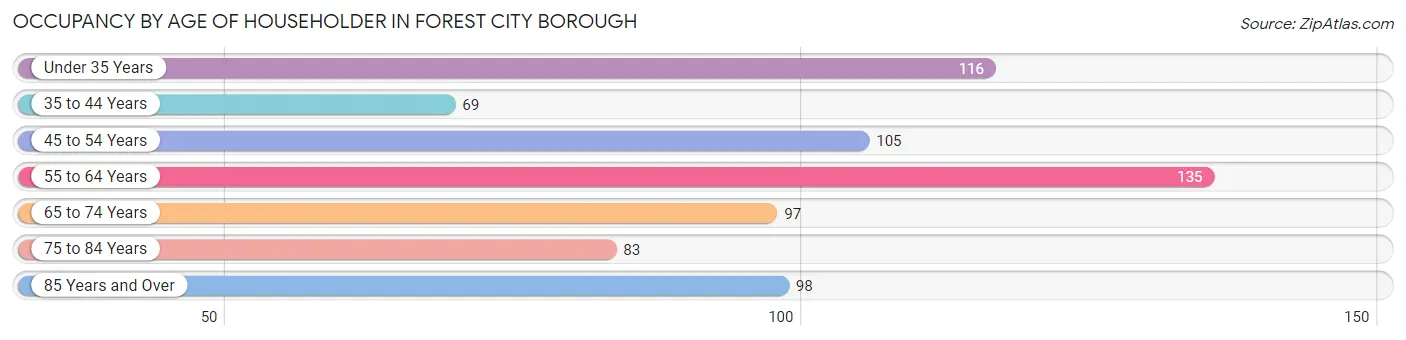
| Age Bracket | # Households | % Households |
| Under 35 Years | 116 | 16.5% |
| 35 to 44 Years | 69 | 9.8% |
| 45 to 54 Years | 105 | 14.9% |
| 55 to 64 Years | 135 | 19.2% |
| 65 to 74 Years | 97 | 13.8% |
| 75 to 84 Years | 83 | 11.8% |
| 85 Years and Over | 98 | 13.9% |
| Total | 703 | 100.0% |
Housing Finances in Forest City borough
Median Income by Occupancy in Forest City borough
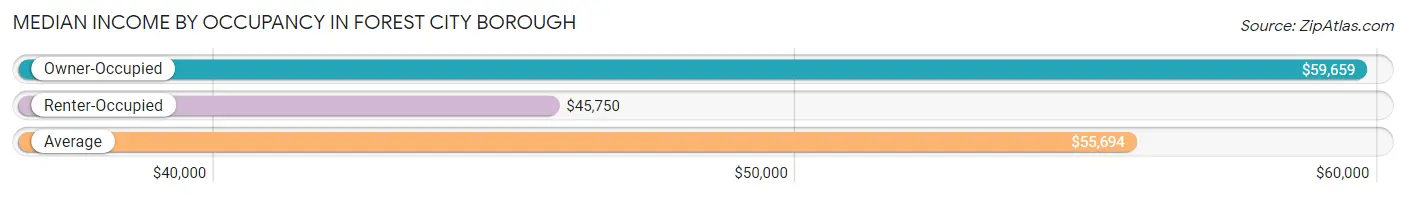
| Occupancy Type | # Households | Median Income |
| Owner-Occupied | 435 (61.9%) | $59,659 |
| Renter-Occupied | 268 (38.1%) | $45,750 |
| Average | 703 (100.0%) | $55,694 |
Occupancy by Householder Income Bracket in Forest City borough
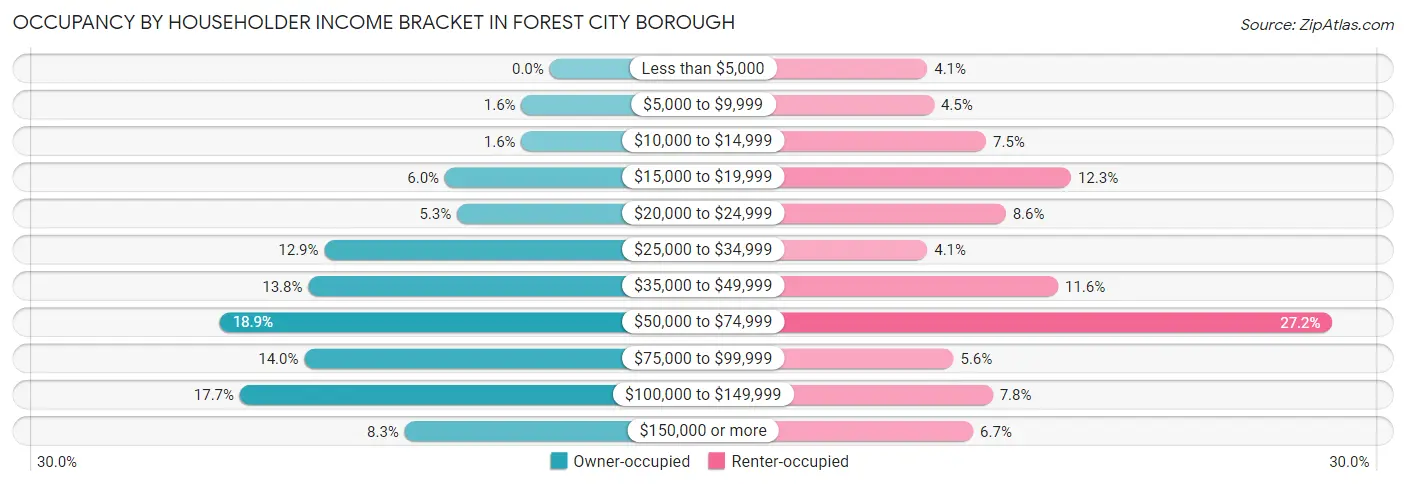
| Income Bracket | Owner-occupied | Renter-occupied |
| Less than $5,000 | 0 (0.0%) | 11 (4.1%) |
| $5,000 to $9,999 | 7 (1.6%) | 12 (4.5%) |
| $10,000 to $14,999 | 7 (1.6%) | 20 (7.5%) |
| $15,000 to $19,999 | 26 (6.0%) | 33 (12.3%) |
| $20,000 to $24,999 | 23 (5.3%) | 23 (8.6%) |
| $25,000 to $34,999 | 56 (12.9%) | 11 (4.1%) |
| $35,000 to $49,999 | 60 (13.8%) | 31 (11.6%) |
| $50,000 to $74,999 | 82 (18.9%) | 73 (27.2%) |
| $75,000 to $99,999 | 61 (14.0%) | 15 (5.6%) |
| $100,000 to $149,999 | 77 (17.7%) | 21 (7.8%) |
| $150,000 or more | 36 (8.3%) | 18 (6.7%) |
| Total | 435 (100.0%) | 268 (100.0%) |
Monthly Housing Cost Tiers in Forest City borough
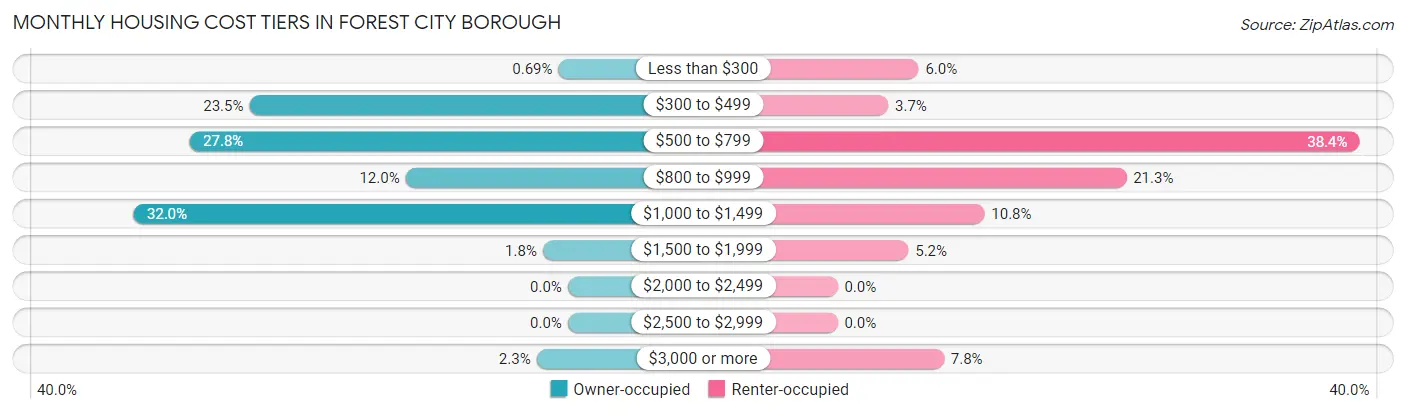
| Monthly Cost | Owner-occupied | Renter-occupied |
| Less than $300 | 3 (0.7%) | 16 (6.0%) |
| $300 to $499 | 102 (23.4%) | 10 (3.7%) |
| $500 to $799 | 121 (27.8%) | 103 (38.4%) |
| $800 to $999 | 52 (11.9%) | 57 (21.3%) |
| $1,000 to $1,499 | 139 (32.0%) | 29 (10.8%) |
| $1,500 to $1,999 | 8 (1.8%) | 14 (5.2%) |
| $2,000 to $2,499 | 0 (0.0%) | 0 (0.0%) |
| $2,500 to $2,999 | 0 (0.0%) | 0 (0.0%) |
| $3,000 or more | 10 (2.3%) | 21 (7.8%) |
| Total | 435 (100.0%) | 268 (100.0%) |
Physical Housing Characteristics in Forest City borough
Housing Structures in Forest City borough
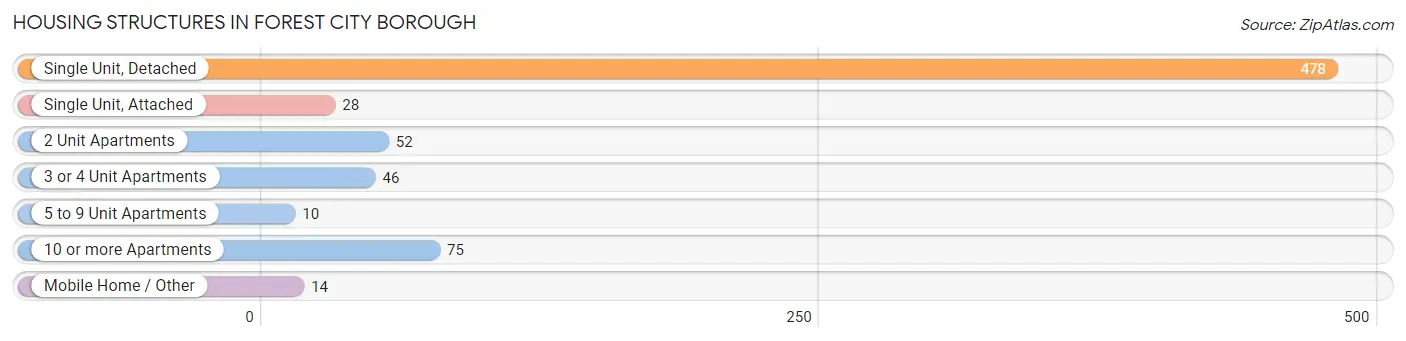
| Structure Type | # Housing Units | % Housing Units |
| Single Unit, Detached | 478 | 68.0% |
| Single Unit, Attached | 28 | 4.0% |
| 2 Unit Apartments | 52 | 7.4% |
| 3 or 4 Unit Apartments | 46 | 6.5% |
| 5 to 9 Unit Apartments | 10 | 1.4% |
| 10 or more Apartments | 75 | 10.7% |
| Mobile Home / Other | 14 | 2.0% |
| Total | 703 | 100.0% |
Housing Structures by Occupancy in Forest City borough
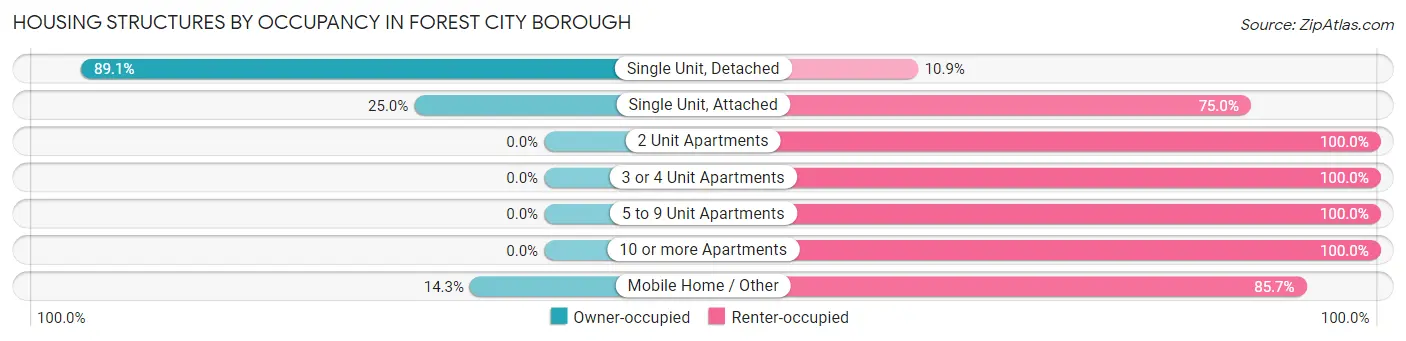
| Structure Type | Owner-occupied | Renter-occupied |
| Single Unit, Detached | 426 (89.1%) | 52 (10.9%) |
| Single Unit, Attached | 7 (25.0%) | 21 (75.0%) |
| 2 Unit Apartments | 0 (0.0%) | 52 (100.0%) |
| 3 or 4 Unit Apartments | 0 (0.0%) | 46 (100.0%) |
| 5 to 9 Unit Apartments | 0 (0.0%) | 10 (100.0%) |
| 10 or more Apartments | 0 (0.0%) | 75 (100.0%) |
| Mobile Home / Other | 2 (14.3%) | 12 (85.7%) |
| Total | 435 (61.9%) | 268 (38.1%) |
Housing Structures by Number of Rooms in Forest City borough
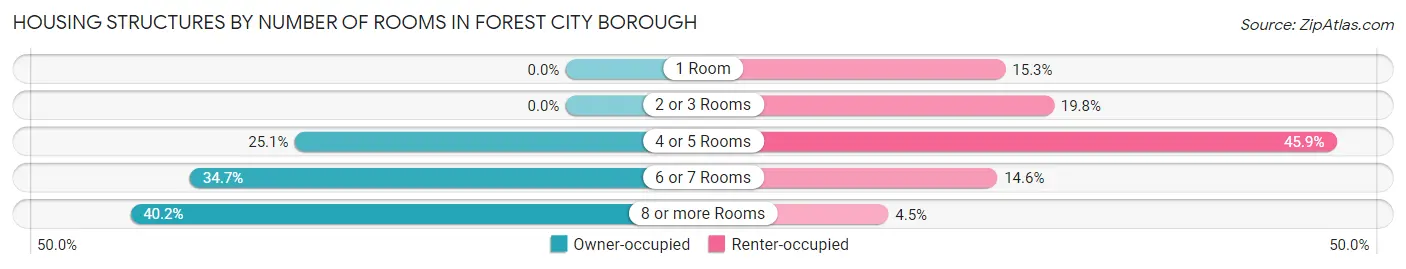
| Number of Rooms | Owner-occupied | Renter-occupied |
| 1 Room | 0 (0.0%) | 41 (15.3%) |
| 2 or 3 Rooms | 0 (0.0%) | 53 (19.8%) |
| 4 or 5 Rooms | 109 (25.1%) | 123 (45.9%) |
| 6 or 7 Rooms | 151 (34.7%) | 39 (14.5%) |
| 8 or more Rooms | 175 (40.2%) | 12 (4.5%) |
| Total | 435 (100.0%) | 268 (100.0%) |
Housing Structure by Heating Type in Forest City borough
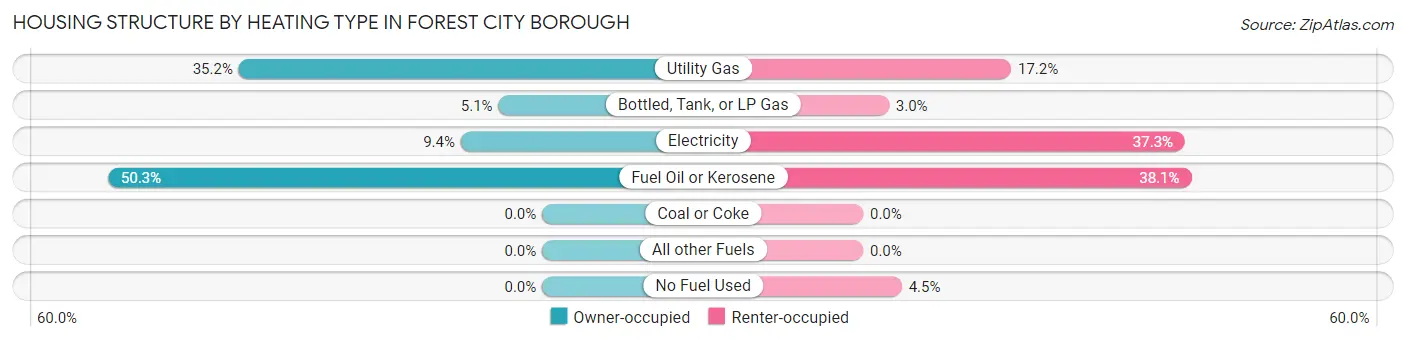
| Heating Type | Owner-occupied | Renter-occupied |
| Utility Gas | 153 (35.2%) | 46 (17.2%) |
| Bottled, Tank, or LP Gas | 22 (5.1%) | 8 (3.0%) |
| Electricity | 41 (9.4%) | 100 (37.3%) |
| Fuel Oil or Kerosene | 219 (50.3%) | 102 (38.1%) |
| Coal or Coke | 0 (0.0%) | 0 (0.0%) |
| All other Fuels | 0 (0.0%) | 0 (0.0%) |
| No Fuel Used | 0 (0.0%) | 12 (4.5%) |
| Total | 435 (100.0%) | 268 (100.0%) |
Household Vehicle Usage in Forest City borough
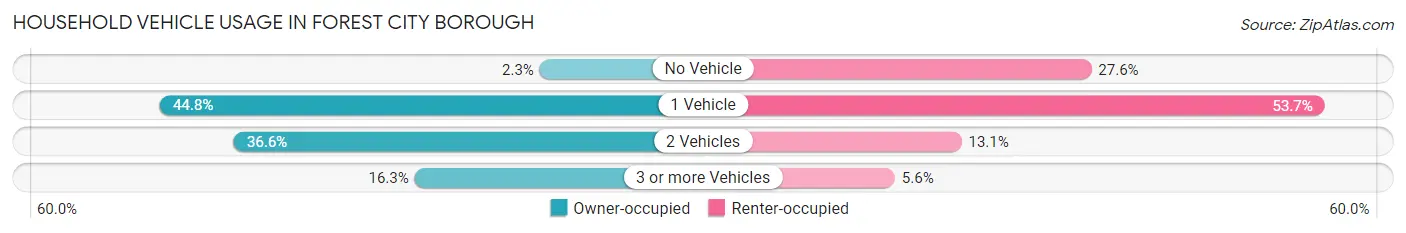
| Vehicles per Household | Owner-occupied | Renter-occupied |
| No Vehicle | 10 (2.3%) | 74 (27.6%) |
| 1 Vehicle | 195 (44.8%) | 144 (53.7%) |
| 2 Vehicles | 159 (36.5%) | 35 (13.1%) |
| 3 or more Vehicles | 71 (16.3%) | 15 (5.6%) |
| Total | 435 (100.0%) | 268 (100.0%) |
Real Estate & Mortgages in Forest City borough
Real Estate and Mortgage Overview in Forest City borough
| Characteristic | Without Mortgage | With Mortgage |
| Housing Units | 243 | 192 |
| Median Property Value | $128,000 | $130,000 |
| Median Household Income | $45,592 | $20 |
| Monthly Housing Costs | $580 | $0 |
| Real Estate Taxes | $1,554 | $9 |
Property Value by Mortgage Status in Forest City borough
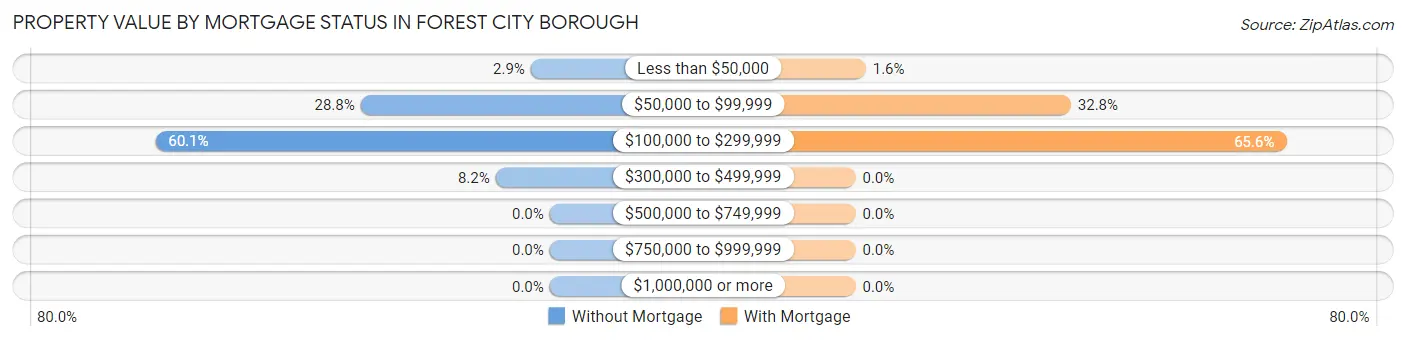
| Property Value | Without Mortgage | With Mortgage |
| Less than $50,000 | 7 (2.9%) | 3 (1.6%) |
| $50,000 to $99,999 | 70 (28.8%) | 63 (32.8%) |
| $100,000 to $299,999 | 146 (60.1%) | 126 (65.6%) |
| $300,000 to $499,999 | 20 (8.2%) | 0 (0.0%) |
| $500,000 to $749,999 | 0 (0.0%) | 0 (0.0%) |
| $750,000 to $999,999 | 0 (0.0%) | 0 (0.0%) |
| $1,000,000 or more | 0 (0.0%) | 0 (0.0%) |
| Total | 243 (100.0%) | 192 (100.0%) |
Household Income by Mortgage Status in Forest City borough
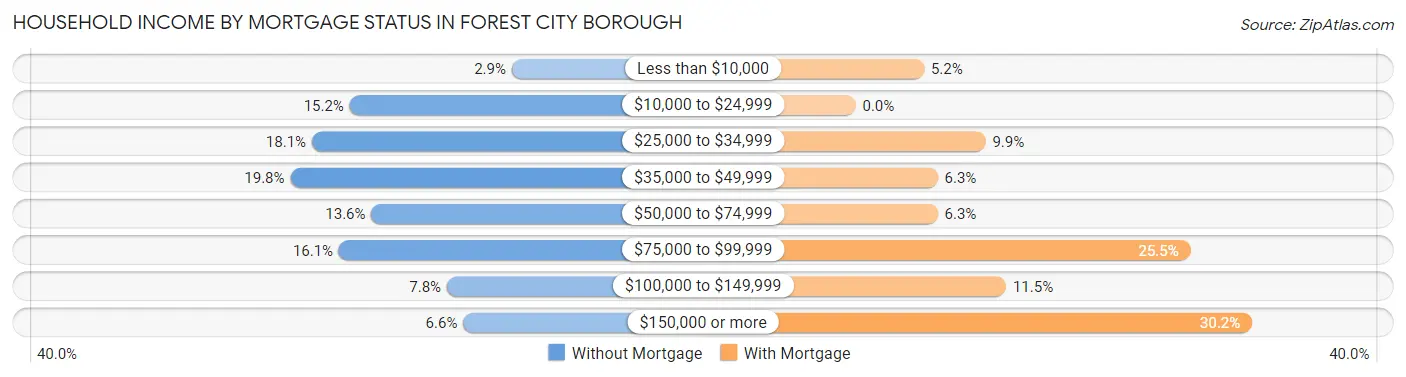
| Household Income | Without Mortgage | With Mortgage |
| Less than $10,000 | 7 (2.9%) | 10 (5.2%) |
| $10,000 to $24,999 | 37 (15.2%) | 0 (0.0%) |
| $25,000 to $34,999 | 44 (18.1%) | 19 (9.9%) |
| $35,000 to $49,999 | 48 (19.8%) | 12 (6.2%) |
| $50,000 to $74,999 | 33 (13.6%) | 12 (6.2%) |
| $75,000 to $99,999 | 39 (16.1%) | 49 (25.5%) |
| $100,000 to $149,999 | 19 (7.8%) | 22 (11.5%) |
| $150,000 or more | 16 (6.6%) | 58 (30.2%) |
| Total | 243 (100.0%) | 192 (100.0%) |
Property Value to Household Income Ratio in Forest City borough
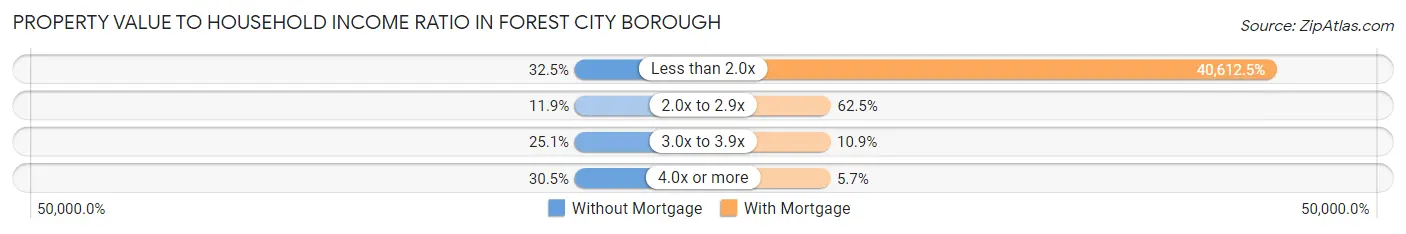
| Value-to-Income Ratio | Without Mortgage | With Mortgage |
| Less than 2.0x | 79 (32.5%) | 77,976 (40,612.5%) |
| 2.0x to 2.9x | 29 (11.9%) | 120 (62.5%) |
| 3.0x to 3.9x | 61 (25.1%) | 21 (10.9%) |
| 4.0x or more | 74 (30.4%) | 11 (5.7%) |
| Total | 243 (100.0%) | 192 (100.0%) |
Real Estate Taxes by Mortgage Status in Forest City borough
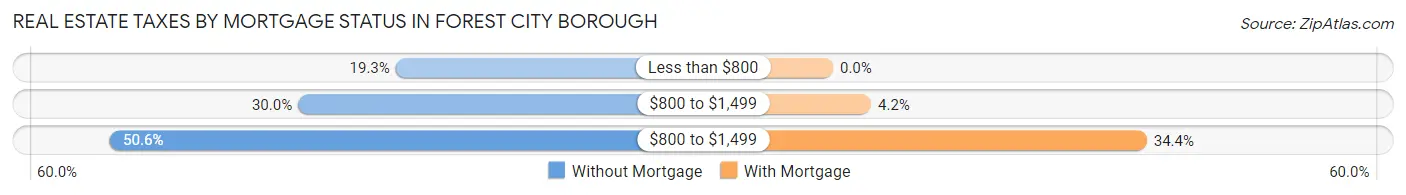
| Property Taxes | Without Mortgage | With Mortgage |
| Less than $800 | 47 (19.3%) | 0 (0.0%) |
| $800 to $1,499 | 73 (30.0%) | 8 (4.2%) |
| $800 to $1,499 | 123 (50.6%) | 66 (34.4%) |
| Total | 243 (100.0%) | 192 (100.0%) |
Health & Disability in Forest City borough
Health Insurance Coverage by Age in Forest City borough
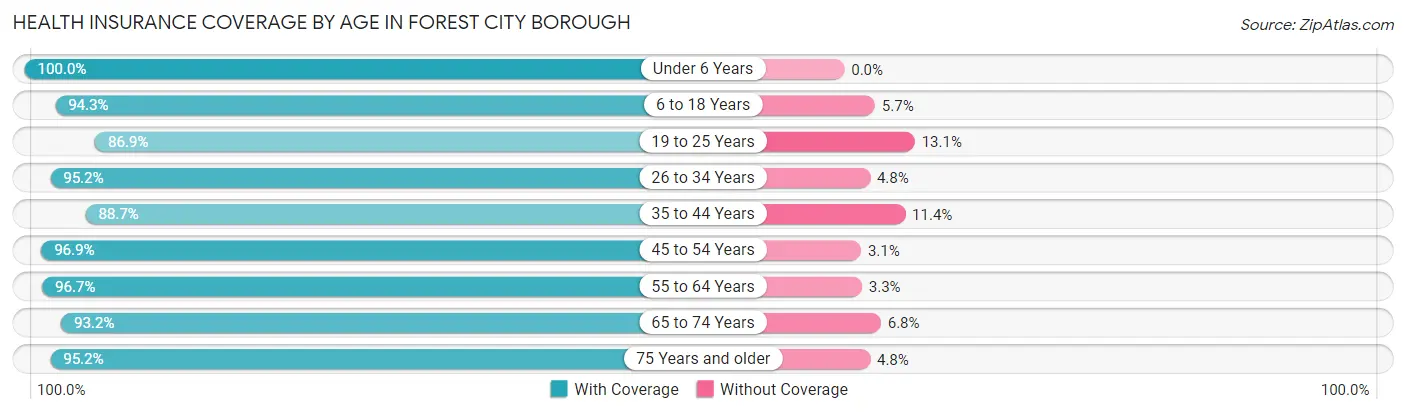
| Age Bracket | With Coverage | Without Coverage |
| Under 6 Years | 109 (100.0%) | 0 (0.0%) |
| 6 to 18 Years | 165 (94.3%) | 10 (5.7%) |
| 19 to 25 Years | 119 (86.9%) | 18 (13.1%) |
| 26 to 34 Years | 159 (95.2%) | 8 (4.8%) |
| 35 to 44 Years | 125 (88.6%) | 16 (11.4%) |
| 45 to 54 Years | 187 (96.9%) | 6 (3.1%) |
| 55 to 64 Years | 207 (96.7%) | 7 (3.3%) |
| 65 to 74 Years | 137 (93.2%) | 10 (6.8%) |
| 75 Years and older | 218 (95.2%) | 11 (4.8%) |
| Total | 1,426 (94.3%) | 86 (5.7%) |
Health Insurance Coverage by Citizenship Status in Forest City borough
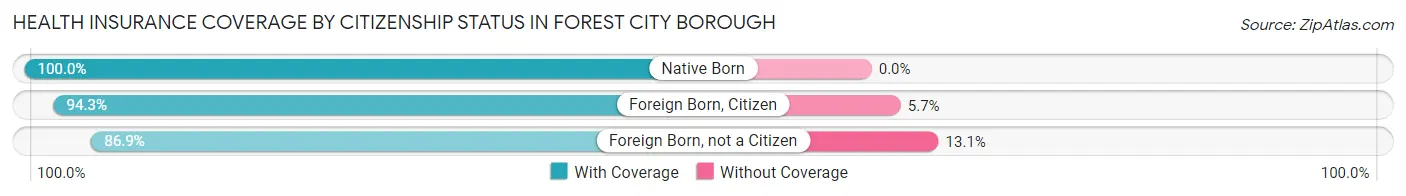
| Citizenship Status | With Coverage | Without Coverage |
| Native Born | 109 (100.0%) | 0 (0.0%) |
| Foreign Born, Citizen | 165 (94.3%) | 10 (5.7%) |
| Foreign Born, not a Citizen | 119 (86.9%) | 18 (13.1%) |
Health Insurance Coverage by Household Income in Forest City borough
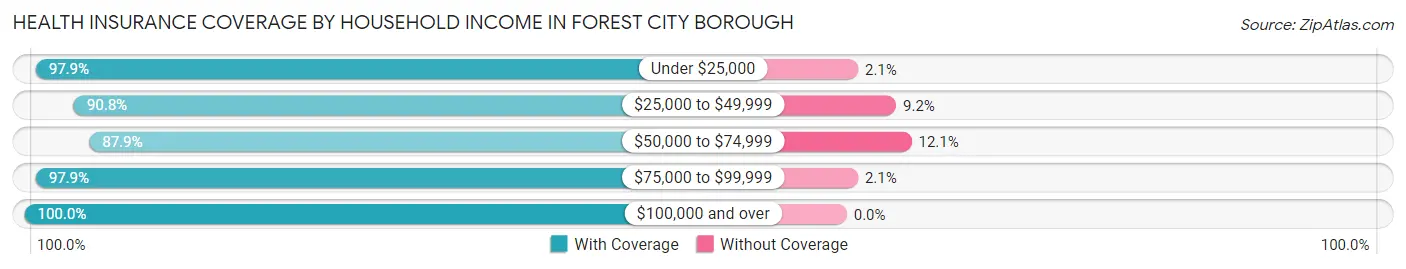
| Household Income | With Coverage | Without Coverage |
| Under $25,000 | 279 (97.9%) | 6 (2.1%) |
| $25,000 to $49,999 | 275 (90.8%) | 28 (9.2%) |
| $50,000 to $74,999 | 355 (87.9%) | 49 (12.1%) |
| $75,000 to $99,999 | 140 (97.9%) | 3 (2.1%) |
| $100,000 and over | 377 (100.0%) | 0 (0.0%) |
Public vs Private Health Insurance Coverage by Age in Forest City borough
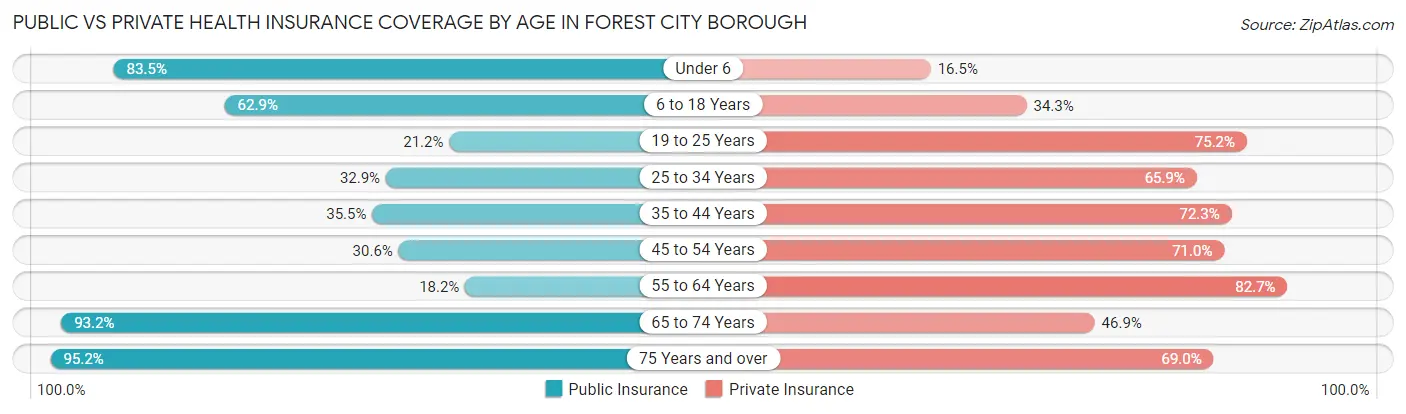
| Age Bracket | Public Insurance | Private Insurance |
| Under 6 | 91 (83.5%) | 18 (16.5%) |
| 6 to 18 Years | 110 (62.9%) | 60 (34.3%) |
| 19 to 25 Years | 29 (21.2%) | 103 (75.2%) |
| 25 to 34 Years | 55 (32.9%) | 110 (65.9%) |
| 35 to 44 Years | 50 (35.5%) | 102 (72.3%) |
| 45 to 54 Years | 59 (30.6%) | 137 (71.0%) |
| 55 to 64 Years | 39 (18.2%) | 177 (82.7%) |
| 65 to 74 Years | 137 (93.2%) | 69 (46.9%) |
| 75 Years and over | 218 (95.2%) | 158 (69.0%) |
| Total | 788 (52.1%) | 934 (61.8%) |
Disability Status by Sex by Age in Forest City borough
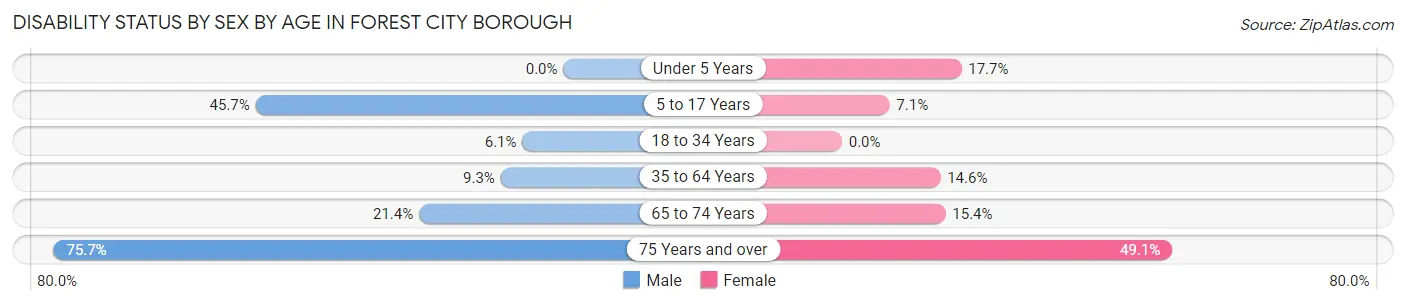
| Age Bracket | Male | Female |
| Under 5 Years | 0 (0.0%) | 11 (17.7%) |
| 5 to 17 Years | 32 (45.7%) | 7 (7.1%) |
| 18 to 34 Years | 12 (6.1%) | 0 (0.0%) |
| 35 to 64 Years | 23 (9.3%) | 44 (14.6%) |
| 65 to 74 Years | 12 (21.4%) | 14 (15.4%) |
| 75 Years and over | 53 (75.7%) | 78 (49.1%) |
Disability Class by Sex by Age in Forest City borough
Disability Class: Hearing Difficulty
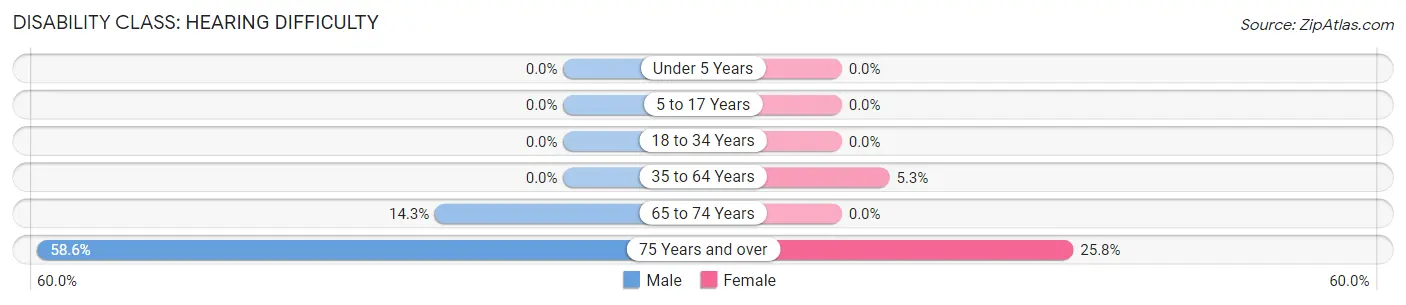
| Age Bracket | Male | Female |
| Under 5 Years | 0 (0.0%) | 0 (0.0%) |
| 5 to 17 Years | 0 (0.0%) | 0 (0.0%) |
| 18 to 34 Years | 0 (0.0%) | 0 (0.0%) |
| 35 to 64 Years | 0 (0.0%) | 16 (5.3%) |
| 65 to 74 Years | 8 (14.3%) | 0 (0.0%) |
| 75 Years and over | 41 (58.6%) | 41 (25.8%) |
Disability Class: Vision Difficulty
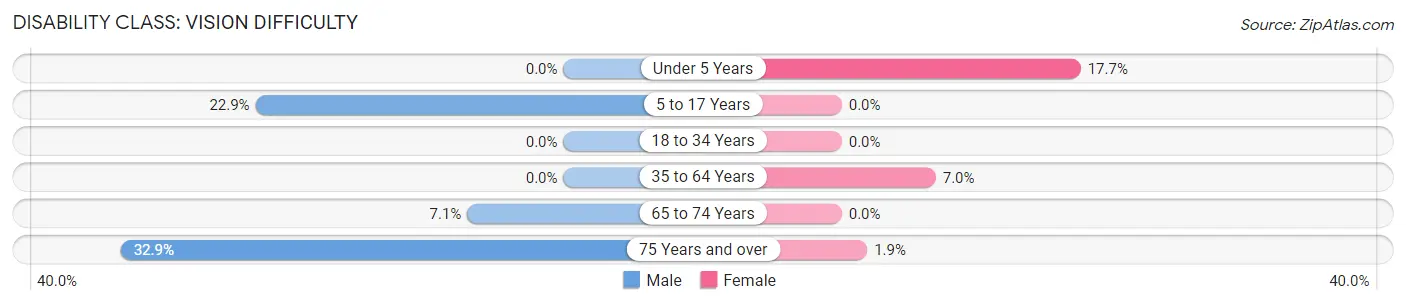
| Age Bracket | Male | Female |
| Under 5 Years | 0 (0.0%) | 11 (17.7%) |
| 5 to 17 Years | 16 (22.9%) | 0 (0.0%) |
| 18 to 34 Years | 0 (0.0%) | 0 (0.0%) |
| 35 to 64 Years | 0 (0.0%) | 21 (7.0%) |
| 65 to 74 Years | 4 (7.1%) | 0 (0.0%) |
| 75 Years and over | 23 (32.9%) | 3 (1.9%) |
Disability Class: Cognitive Difficulty
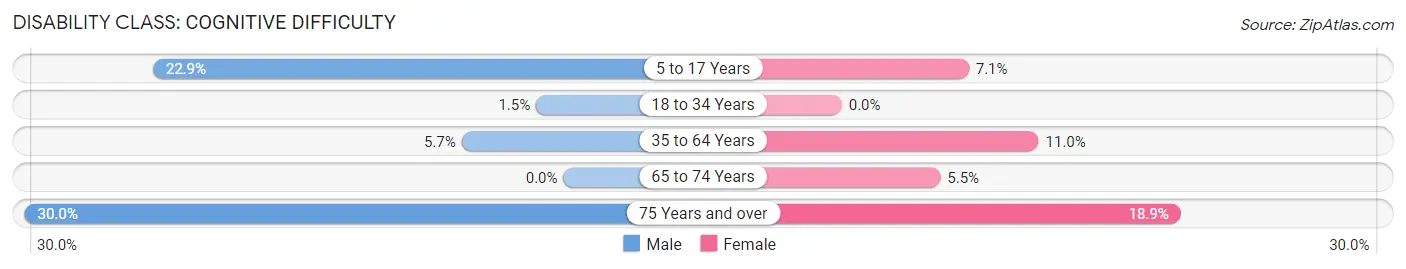
| Age Bracket | Male | Female |
| 5 to 17 Years | 16 (22.9%) | 7 (7.1%) |
| 18 to 34 Years | 3 (1.5%) | 0 (0.0%) |
| 35 to 64 Years | 14 (5.7%) | 33 (11.0%) |
| 65 to 74 Years | 0 (0.0%) | 5 (5.5%) |
| 75 Years and over | 21 (30.0%) | 30 (18.9%) |
Disability Class: Ambulatory Difficulty
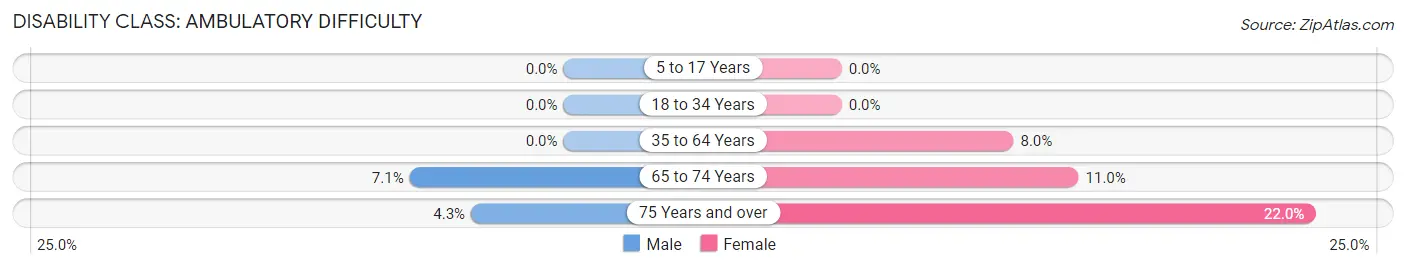
| Age Bracket | Male | Female |
| 5 to 17 Years | 0 (0.0%) | 0 (0.0%) |
| 18 to 34 Years | 0 (0.0%) | 0 (0.0%) |
| 35 to 64 Years | 0 (0.0%) | 24 (8.0%) |
| 65 to 74 Years | 4 (7.1%) | 10 (11.0%) |
| 75 Years and over | 3 (4.3%) | 35 (22.0%) |
Disability Class: Self-Care Difficulty
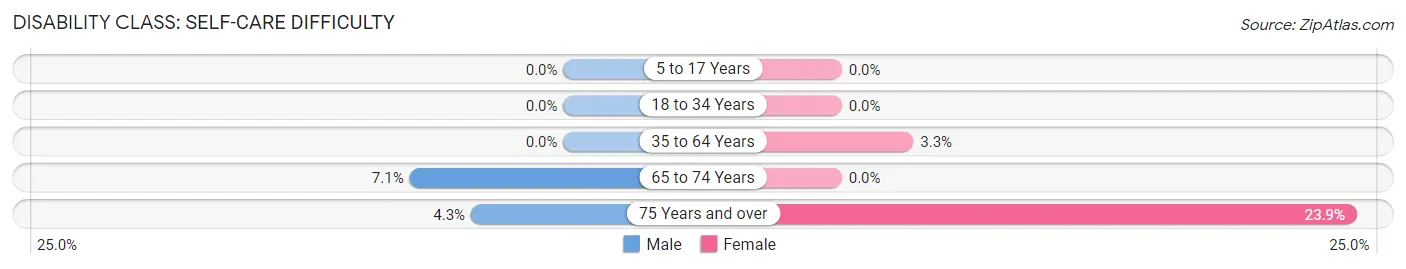
| Age Bracket | Male | Female |
| 5 to 17 Years | 0 (0.0%) | 0 (0.0%) |
| 18 to 34 Years | 0 (0.0%) | 0 (0.0%) |
| 35 to 64 Years | 0 (0.0%) | 10 (3.3%) |
| 65 to 74 Years | 4 (7.1%) | 0 (0.0%) |
| 75 Years and over | 3 (4.3%) | 38 (23.9%) |
Technology Access in Forest City borough
Computing Device Access in Forest City borough
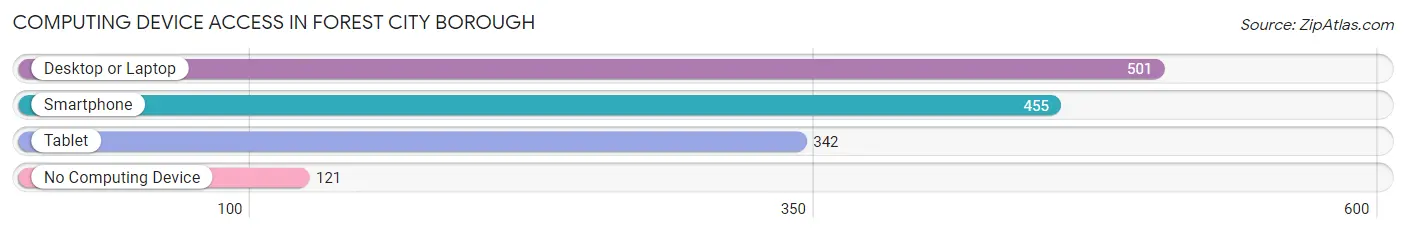
| Device Type | # Households | % Households |
| Desktop or Laptop | 501 | 71.3% |
| Smartphone | 455 | 64.7% |
| Tablet | 342 | 48.6% |
| No Computing Device | 121 | 17.2% |
| Total | 703 | 100.0% |
Internet Access in Forest City borough
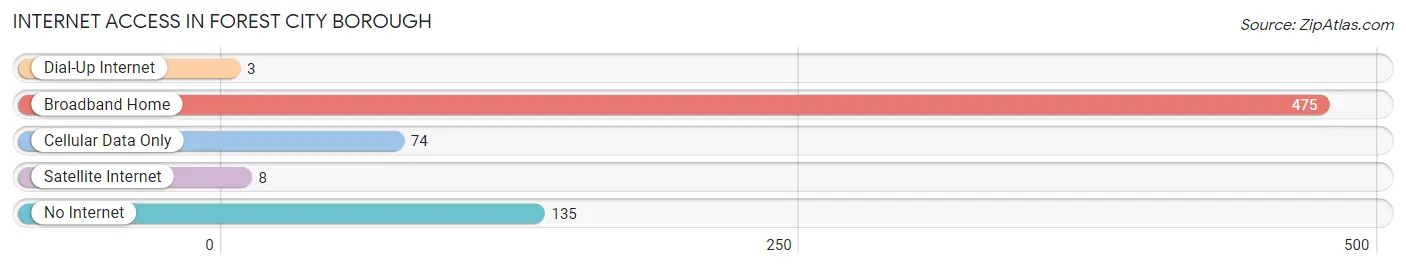
| Internet Type | # Households | % Households |
| Dial-Up Internet | 3 | 0.4% |
| Broadband Home | 475 | 67.6% |
| Cellular Data Only | 74 | 10.5% |
| Satellite Internet | 8 | 1.1% |
| No Internet | 135 | 19.2% |
| Total | 703 | 100.0% |
Forest City borough Summary
Introduction
Forest City Borough is a small borough located in Susquehanna County, Pennsylvania. It is situated in the Endless Mountains region of the state and is part of the Scranton–Wilkes-Barre–Hazleton Metropolitan Statistical Area. The borough has a population of 1,845 as of the 2010 census.
History
The area that is now Forest City Borough was first settled in the early 1800s by a group of settlers from Connecticut. The town was originally known as “Connecticut Settlement” and was later renamed “Forest City” in 1851. The name was chosen to reflect the abundance of trees in the area.
The borough was officially incorporated in 1868 and was the first borough in Susquehanna County. The first mayor of Forest City was William H. Smith.
In the late 1800s, the borough was a popular tourist destination due to its proximity to the Lackawanna River and the nearby Elk Mountain Ski Resort. The resort was a popular destination for skiers and snowboarders from all over the region.
In the early 1900s, the borough was home to several coal mines and the Forest City Colliery Company. The company was the largest employer in the area and provided jobs for many of the borough’s residents.
Geography
Forest City Borough is located in the Endless Mountains region of Pennsylvania. It is situated in the northern part of Susquehanna County and is bordered by Clifford Township to the north, Lenox Township to the east, Harmony Township to the south, and Clifford Township to the west.
The borough is located at an elevation of 1,845 feet above sea level and has a total area of 1.2 square miles. The borough is located in the Susquehanna River watershed and is home to several creeks, including the Lackawanna River, which flows through the borough.
Economy
The economy of Forest City Borough is largely based on tourism and agriculture. The borough is home to several tourist attractions, including the Elk Mountain Ski Resort, which is a popular destination for skiers and snowboarders from all over the region.
The borough is also home to several farms, which produce a variety of crops, including corn, soybeans, hay, and wheat. The borough is also home to several small businesses, including restaurants, retail stores, and service providers.
Demographics
As of the 2010 census, the population of Forest City Borough was 1,845. The racial makeup of the borough was 97.3% White, 0.7% African American, 0.2% Native American, 0.2% Asian, 0.2% from other races, and 1.4% from two or more races. Hispanic or Latino of any race were 1.2% of the population.
The median household income in the borough was $41,250 and the median family income was $48,750. The per capita income for the borough was $20,945. About 11.2% of families and 13.2% of the population were below the poverty line, including 17.2% of those under age 18 and 8.2% of those age 65 or over.
Conclusion
Forest City Borough is a small borough located in Susquehanna County, Pennsylvania. It is situated in the Endless Mountains region of the state and is part of the Scranton–Wilkes-Barre–Hazleton Metropolitan Statistical Area. The borough has a population of 1,845 as of the 2010 census. The economy of the borough is largely based on tourism and agriculture, and the borough is home to several tourist attractions, including the Elk Mountain Ski Resort. The racial makeup of the borough is 97.3% White, 0.7% African American, 0.2% Native American, 0.2% Asian, 0.2% from other races, and 1.4% from two or more races. The median household income in the borough was $41,250 and the median family income was $48,750.
Common Questions
What is the Total Population of Forest City borough?
Total Population of Forest City borough is 1,612.
What is the Total Male Population of Forest City borough?
Total Male Population of Forest City borough is 723.
What is the Total Female Population of Forest City borough?
Total Female Population of Forest City borough is 889.
What is the Ratio of Males per 100 Females in Forest City borough?
There are 81.33 Males per 100 Females in Forest City borough.
What is the Ratio of Females per 100 Males in Forest City borough?
There are 122.96 Females per 100 Males in Forest City borough.
What is the Median Population Age in Forest City borough?
Median Population Age in Forest City borough is 50.7 Years.
What is the Average Family Size in Forest City borough
Average Family Size in Forest City borough is 2.8 People.
What is the Average Household Size in Forest City borough
Average Household Size in Forest City borough is 2.1 People.
What is Per Capita Income in Forest City borough?
Per Capita income in Forest City borough is $33,426.
What is the Median Family Income in Forest City borough?
Median Family Income in Forest City borough is $51,375.
What is the Median Household income in Forest City borough?
Median Household Income in Forest City borough is $55,694.
What is Income or Wage Gap in Forest City borough?
Income or Wage Gap in Forest City borough is 18.1%.
Women in Forest City borough earn 81.9 cents for every dollar earned by a man.
What is Inequality or Gini Index in Forest City borough?
Inequality or Gini Index in Forest City borough is 0.46.
How Large is the Labor Force in Forest City borough?
There are 702 People in the Labor Forcein in Forest City borough.
What is the Percentage of People in the Labor Force in Forest City borough?
51.7% of People are in the Labor Force in Forest City borough.
What is the Unemployment Rate in Forest City borough?
Unemployment Rate in Forest City borough is 8.5%.