Fairview Ferndale, PA
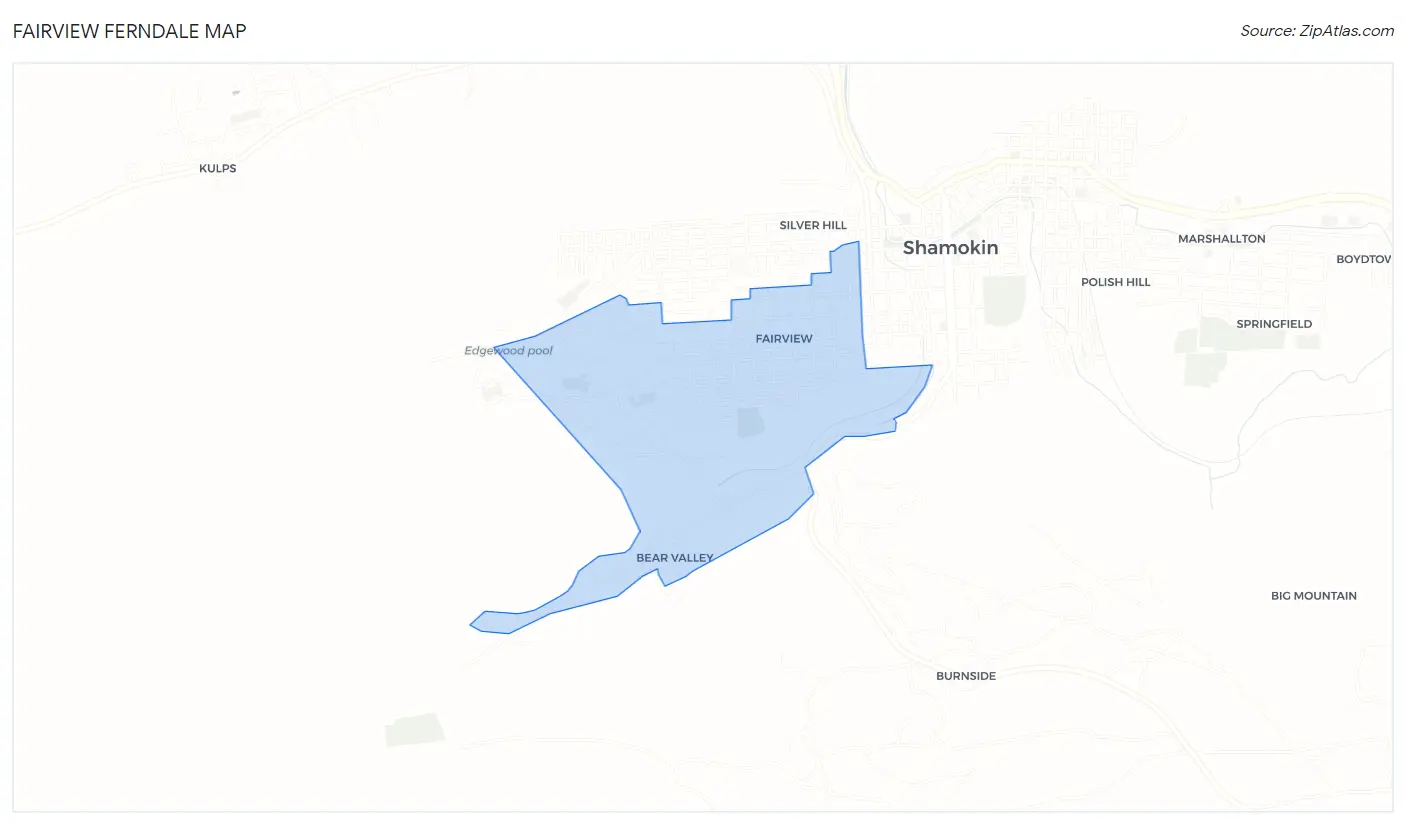
Fairview Ferndale Map
Fairview Ferndale Overview
1,837
TOTAL POPULATION
906
MALE POPULATION
931
FEMALE POPULATION
97.31
MALES / 100 FEMALES
102.76
FEMALES / 100 MALES
54.5
MEDIAN AGE
2.8
AVG FAMILY SIZE
1.7
AVG HOUSEHOLD SIZE
$32,313
PER CAPITA INCOME
$72,386
AVG FAMILY INCOME
$37,163
AVG HOUSEHOLD INCOME
32.4%
WAGE / INCOME GAP [ % ]
67.6¢/ $1
WAGE / INCOME GAP [ $ ]
0.44
INEQUALITY / GINI INDEX
883
LABOR FORCE [ PEOPLE ]
54.8%
PERCENT IN LABOR FORCE
5.7%
UNEMPLOYMENT RATE
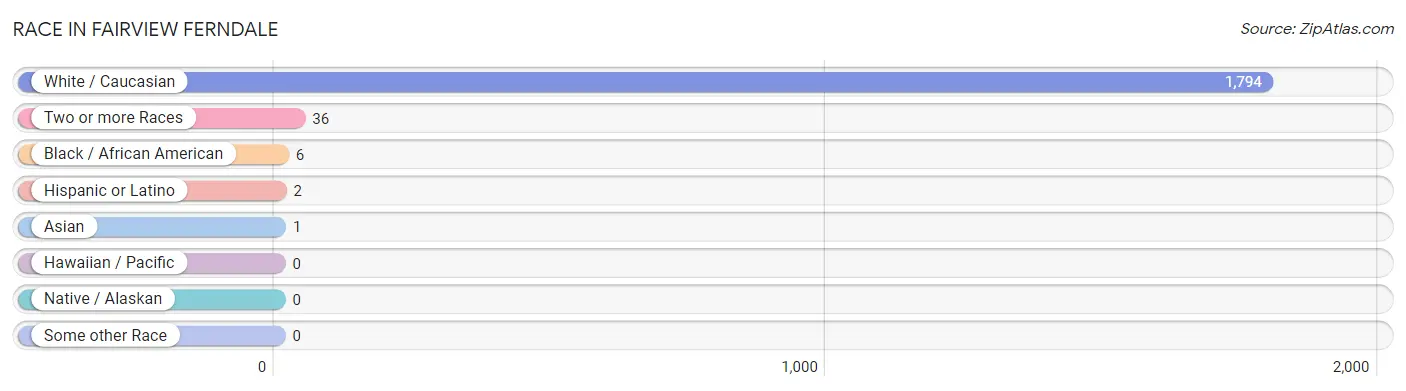
Race in Fairview Ferndale
The most populous races in Fairview Ferndale are White / Caucasian (1,794 | 97.7%), Two or more Races (36 | 2.0%), and Black / African American (6 | 0.3%).
| Race | # Population | % Population |
| Asian | 1 | 0.1% |
| Black / African American | 6 | 0.3% |
| Hawaiian / Pacific | 0 | 0.0% |
| Hispanic or Latino | 2 | 0.1% |
| Native / Alaskan | 0 | 0.0% |
| White / Caucasian | 1,794 | 97.7% |
| Two or more Races | 36 | 2.0% |
| Some other Race | 0 | 0.0% |
| Total | 1,837 | 100.0% |
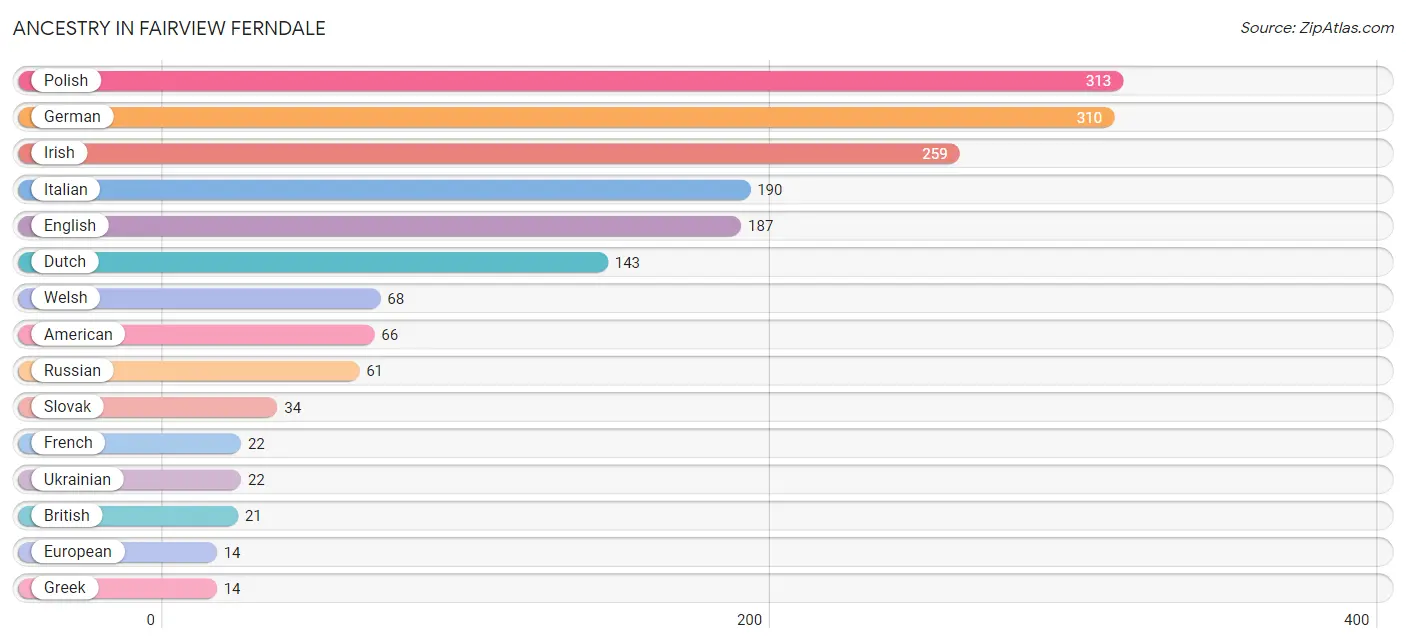
Ancestry in Fairview Ferndale
The most populous ancestries reported in Fairview Ferndale are Polish (313 | 17.0%), German (310 | 16.9%), Irish (259 | 14.1%), Italian (190 | 10.3%), and English (187 | 10.2%), together accounting for 68.5% of all Fairview Ferndale residents.
| Ancestry | # Population | % Population |
| American | 66 | 3.6% |
| Austrian | 4 | 0.2% |
| British | 21 | 1.1% |
| Czech | 8 | 0.4% |
| Dutch | 143 | 7.8% |
| English | 187 | 10.2% |
| European | 14 | 0.8% |
| French | 22 | 1.2% |
| German | 310 | 16.9% |
| Greek | 14 | 0.8% |
| Indian (Asian) | 1 | 0.1% |
| Irish | 259 | 14.1% |
| Italian | 190 | 10.3% |
| Norwegian | 5 | 0.3% |
| Pennsylvania German | 14 | 0.8% |
| Polish | 313 | 17.0% |
| Portuguese | 11 | 0.6% |
| Russian | 61 | 3.3% |
| Scotch-Irish | 6 | 0.3% |
| Serbian | 4 | 0.2% |
| Slovak | 34 | 1.8% |
| Spanish | 2 | 0.1% |
| Swedish | 4 | 0.2% |
| Ukrainian | 22 | 1.2% |
| Welsh | 68 | 3.7% |
| Yugoslavian | 6 | 0.3% | View All 26 Rows |
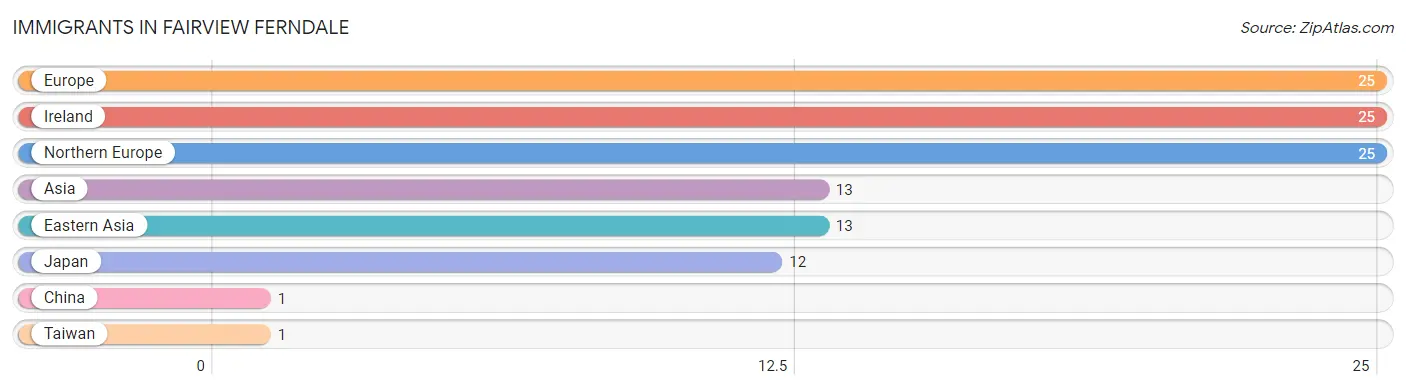
Immigrants in Fairview Ferndale
The most numerous immigrant groups reported in Fairview Ferndale came from Europe (25 | 1.4%), Ireland (25 | 1.4%), Northern Europe (25 | 1.4%), Asia (13 | 0.7%), and Eastern Asia (13 | 0.7%), together accounting for 5.5% of all Fairview Ferndale residents.
| Immigration Origin | # Population | % Population |
| Asia | 13 | 0.7% |
| China | 1 | 0.1% |
| Eastern Asia | 13 | 0.7% |
| Europe | 25 | 1.4% |
| Ireland | 25 | 1.4% |
| Japan | 12 | 0.6% |
| Northern Europe | 25 | 1.4% |
| Taiwan | 1 | 0.1% | View All 8 Rows |
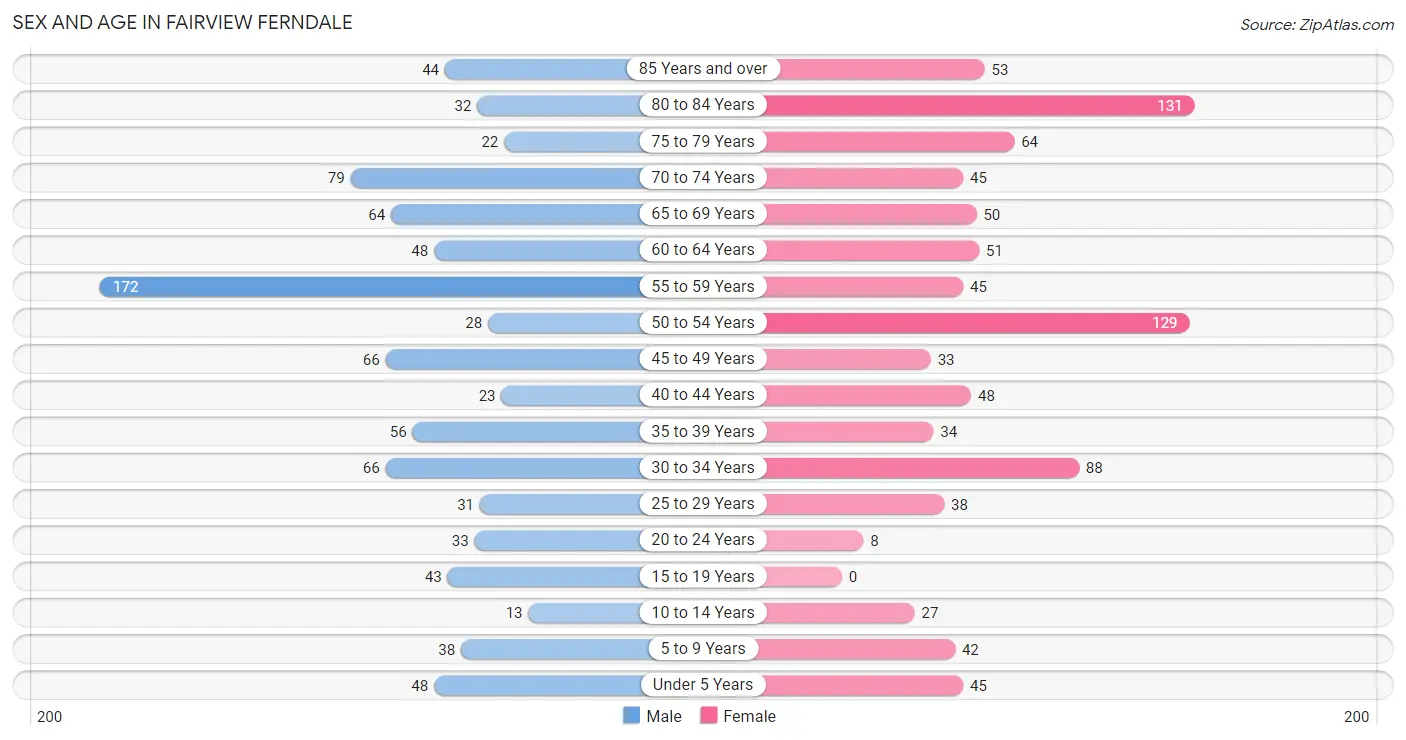
Sex and Age in Fairview Ferndale
Sex and Age in Fairview Ferndale
The most populous age groups in Fairview Ferndale are 55 to 59 Years (172 | 19.0%) for men and 80 to 84 Years (131 | 14.1%) for women.
| Age Bracket | Male | Female |
| Under 5 Years | 48 (5.3%) | 45 (4.8%) |
| 5 to 9 Years | 38 (4.2%) | 42 (4.5%) |
| 10 to 14 Years | 13 (1.4%) | 27 (2.9%) |
| 15 to 19 Years | 43 (4.8%) | 0 (0.0%) |
| 20 to 24 Years | 33 (3.6%) | 8 (0.9%) |
| 25 to 29 Years | 31 (3.4%) | 38 (4.1%) |
| 30 to 34 Years | 66 (7.3%) | 88 (9.5%) |
| 35 to 39 Years | 56 (6.2%) | 34 (3.6%) |
| 40 to 44 Years | 23 (2.5%) | 48 (5.2%) |
| 45 to 49 Years | 66 (7.3%) | 33 (3.5%) |
| 50 to 54 Years | 28 (3.1%) | 129 (13.9%) |
| 55 to 59 Years | 172 (19.0%) | 45 (4.8%) |
| 60 to 64 Years | 48 (5.3%) | 51 (5.5%) |
| 65 to 69 Years | 64 (7.1%) | 50 (5.4%) |
| 70 to 74 Years | 79 (8.7%) | 45 (4.8%) |
| 75 to 79 Years | 22 (2.4%) | 64 (6.9%) |
| 80 to 84 Years | 32 (3.5%) | 131 (14.1%) |
| 85 Years and over | 44 (4.9%) | 53 (5.7%) |
| Total | 906 (100.0%) | 931 (100.0%) |
Families and Households in Fairview Ferndale
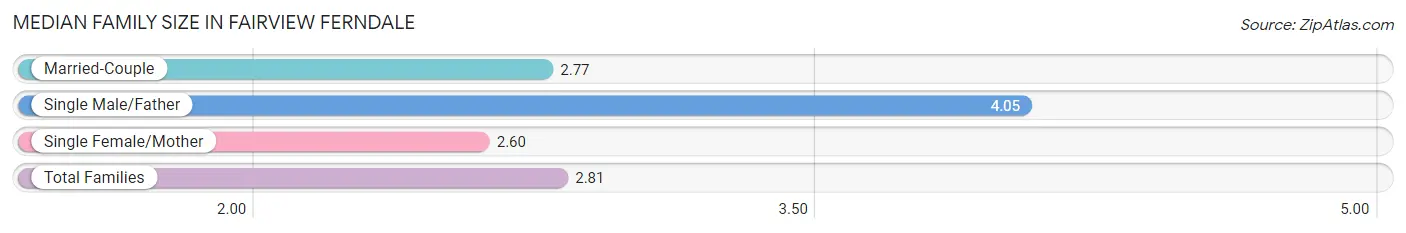
Median Family Size in Fairview Ferndale
The median family size in Fairview Ferndale is 2.81 persons per family, with single male/father families (21 | 5.7%) accounting for the largest median family size of 4.05 persons per family. On the other hand, single female/mother families (87 | 23.5%) represent the smallest median family size with 2.60 persons per family.
| Family Type | # Families | Family Size |
| Married-Couple | 262 (70.8%) | 2.77 |
| Single Male/Father | 21 (5.7%) | 4.05 |
| Single Female/Mother | 87 (23.5%) | 2.60 |
| Total Families | 370 (100.0%) | 2.81 |
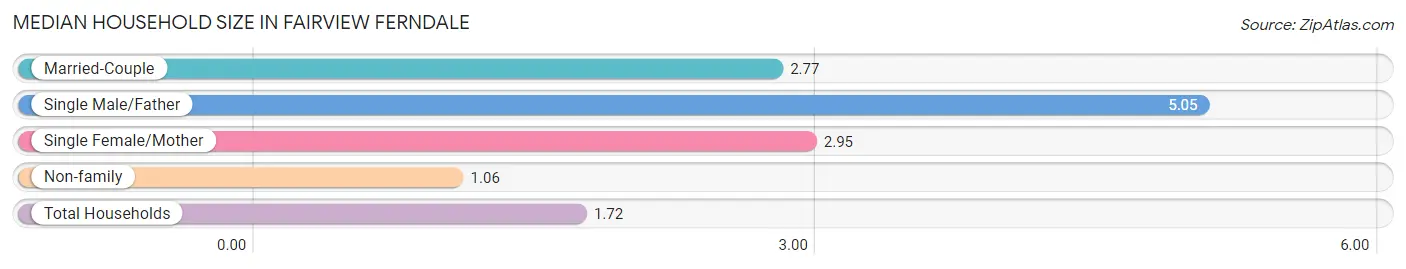
Median Household Size in Fairview Ferndale
The median household size in Fairview Ferndale is 1.72 persons per household, with single male/father households (21 | 2.0%) accounting for the largest median household size of 5.05 persons per household. non-family households (695 | 65.3%) represent the smallest median household size with 1.06 persons per household.
| Household Type | # Households | Household Size |
| Married-Couple | 262 (24.6%) | 2.77 |
| Single Male/Father | 21 (2.0%) | 5.05 |
| Single Female/Mother | 87 (8.2%) | 2.95 |
| Non-family | 695 (65.3%) | 1.06 |
| Total Households | 1,065 (100.0%) | 1.72 |
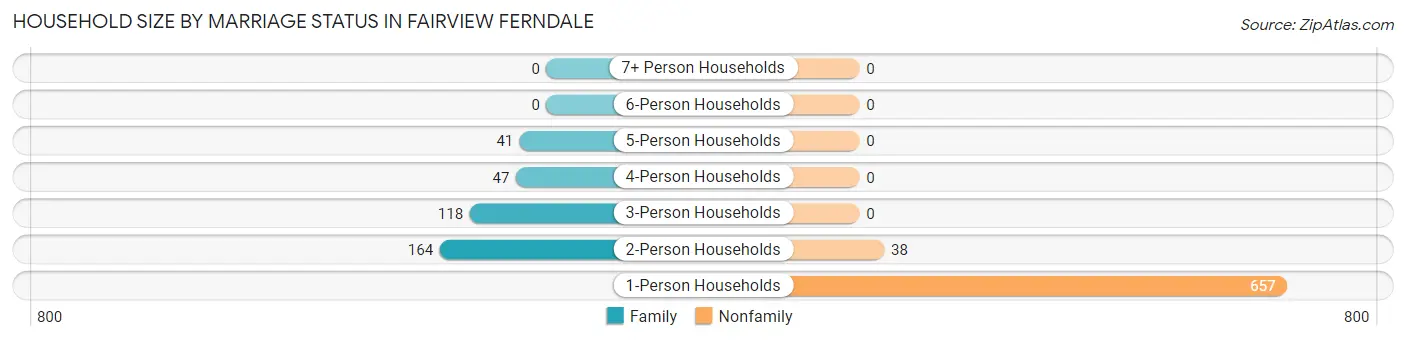
Household Size by Marriage Status in Fairview Ferndale
Out of a total of 1,065 households in Fairview Ferndale, 370 (34.7%) are family households, while 695 (65.3%) are nonfamily households. The most numerous type of family households are 2-person households, comprising 164, and the most common type of nonfamily households are 1-person households, comprising 657.
| Household Size | Family Households | Nonfamily Households |
| 1-Person Households | - | 657 (61.7%) |
| 2-Person Households | 164 (15.4%) | 38 (3.6%) |
| 3-Person Households | 118 (11.1%) | 0 (0.0%) |
| 4-Person Households | 47 (4.4%) | 0 (0.0%) |
| 5-Person Households | 41 (3.8%) | 0 (0.0%) |
| 6-Person Households | 0 (0.0%) | 0 (0.0%) |
| 7+ Person Households | 0 (0.0%) | 0 (0.0%) |
| Total | 370 (34.7%) | 695 (65.3%) |
Female Fertility in Fairview Ferndale
Fertility by Age in Fairview Ferndale
Average fertility rate in Fairview Ferndale is 60.0 births per 1,000 women. Women in the age bracket of 20 to 34 years have the highest fertility rate with 119.0 births per 1,000 women. Women in the age bracket of 20 to 34 years acount for 100.0% of all women with births.
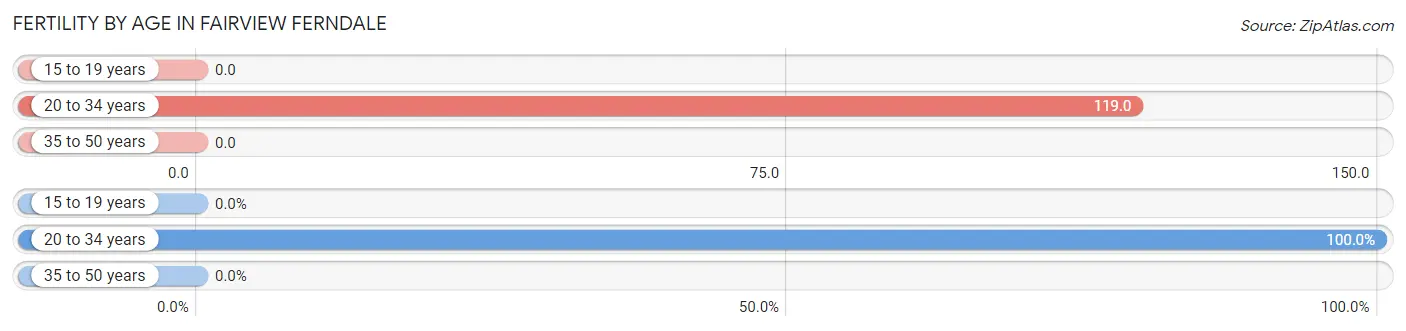
| Age Bracket | Women with Births | Births / 1,000 Women |
| 15 to 19 years | 0 (0.0%) | 0.0 |
| 20 to 34 years | 16 (100.0%) | 119.0 |
| 35 to 50 years | 0 (0.0%) | 0.0 |
| Total | 16 (100.0%) | 60.0 |
Fertility by Age by Marriage Status in Fairview Ferndale
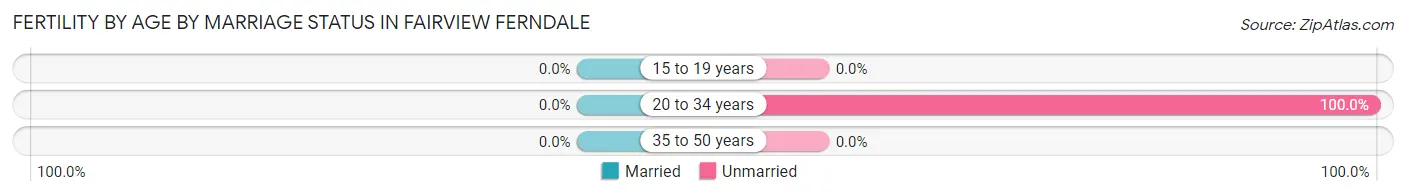
| Age Bracket | Married | Unmarried |
| 15 to 19 years | 0 (0.0%) | 0 (0.0%) |
| 20 to 34 years | 0 (0.0%) | 16 (100.0%) |
| 35 to 50 years | 0 (0.0%) | 0 (0.0%) |
| Total | 0 (0.0%) | 16 (100.0%) |
Fertility by Education in Fairview Ferndale
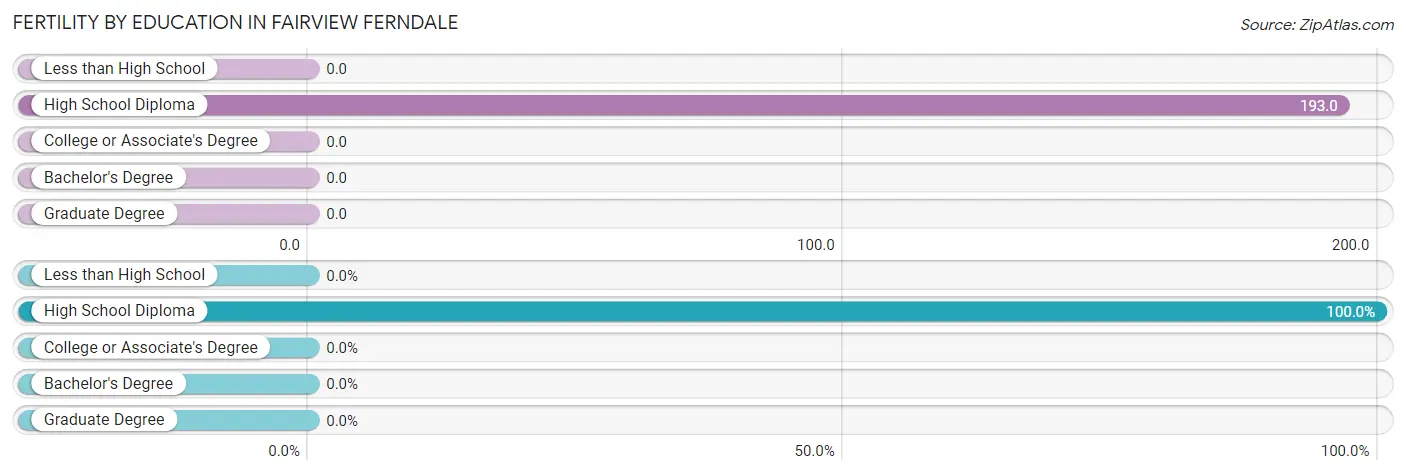
| Educational Attainment | Women with Births | Births / 1,000 Women |
| Less than High School | 0 (0.0%) | 0.0 |
| High School Diploma | 16 (100.0%) | 193.0 |
| College or Associate's Degree | 0 (0.0%) | 0.0 |
| Bachelor's Degree | 0 (0.0%) | 0.0 |
| Graduate Degree | 0 (0.0%) | 0.0 |
| Total | 16 (100.0%) | 60.0 |
Fertility by Education by Marriage Status in Fairview Ferndale
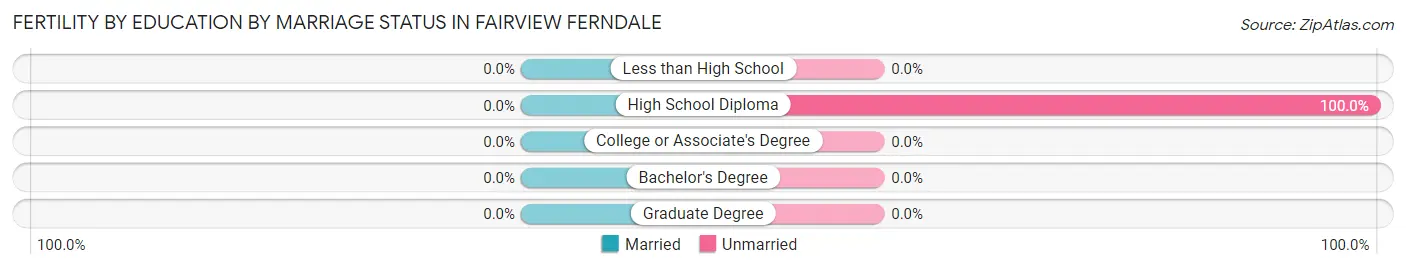
| Educational Attainment | Married | Unmarried |
| Less than High School | 0 (0.0%) | 0 (0.0%) |
| High School Diploma | 0 (0.0%) | 16 (100.0%) |
| College or Associate's Degree | 0 (0.0%) | 0 (0.0%) |
| Bachelor's Degree | 0 (0.0%) | 0 (0.0%) |
| Graduate Degree | 0 (0.0%) | 0 (0.0%) |
| Total | 0 (0.0%) | 16 (100.0%) |
Income in Fairview Ferndale
Income Overview in Fairview Ferndale
Per Capita Income in Fairview Ferndale is $32,313, while median incomes of families and households are $72,386 and $37,163 respectively.
| Characteristic | Number | Measure |
| Per Capita Income | 1,837 | $32,313 |
| Median Family Income | 370 | $72,386 |
| Mean Family Income | 370 | $81,055 |
| Median Household Income | 1,065 | $37,163 |
| Mean Household Income | 1,065 | $54,787 |
| Income Deficit | 370 | $0 |
| Wage / Income Gap (%) | 1,837 | 32.38% |
| Wage / Income Gap ($) | 1,837 | 67.62¢ per $1 |
| Gini / Inequality Index | 1,837 | 0.44 |
Earnings by Sex in Fairview Ferndale
Average Earnings in Fairview Ferndale are $42,400, $48,676 for men and $32,917 for women, a difference of 32.4%.
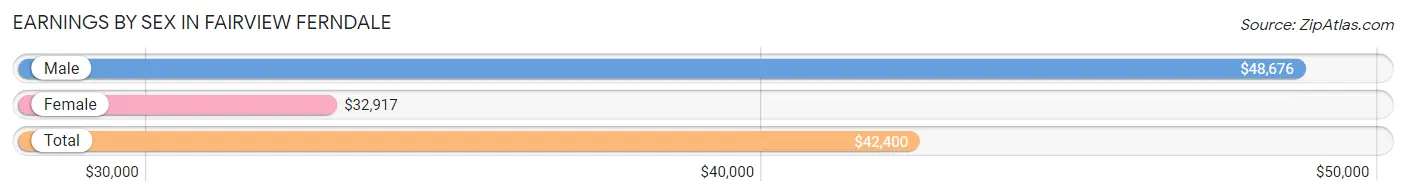
| Sex | Number | Average Earnings |
| Male | 442 (50.3%) | $48,676 |
| Female | 436 (49.7%) | $32,917 |
| Total | 878 (100.0%) | $42,400 |
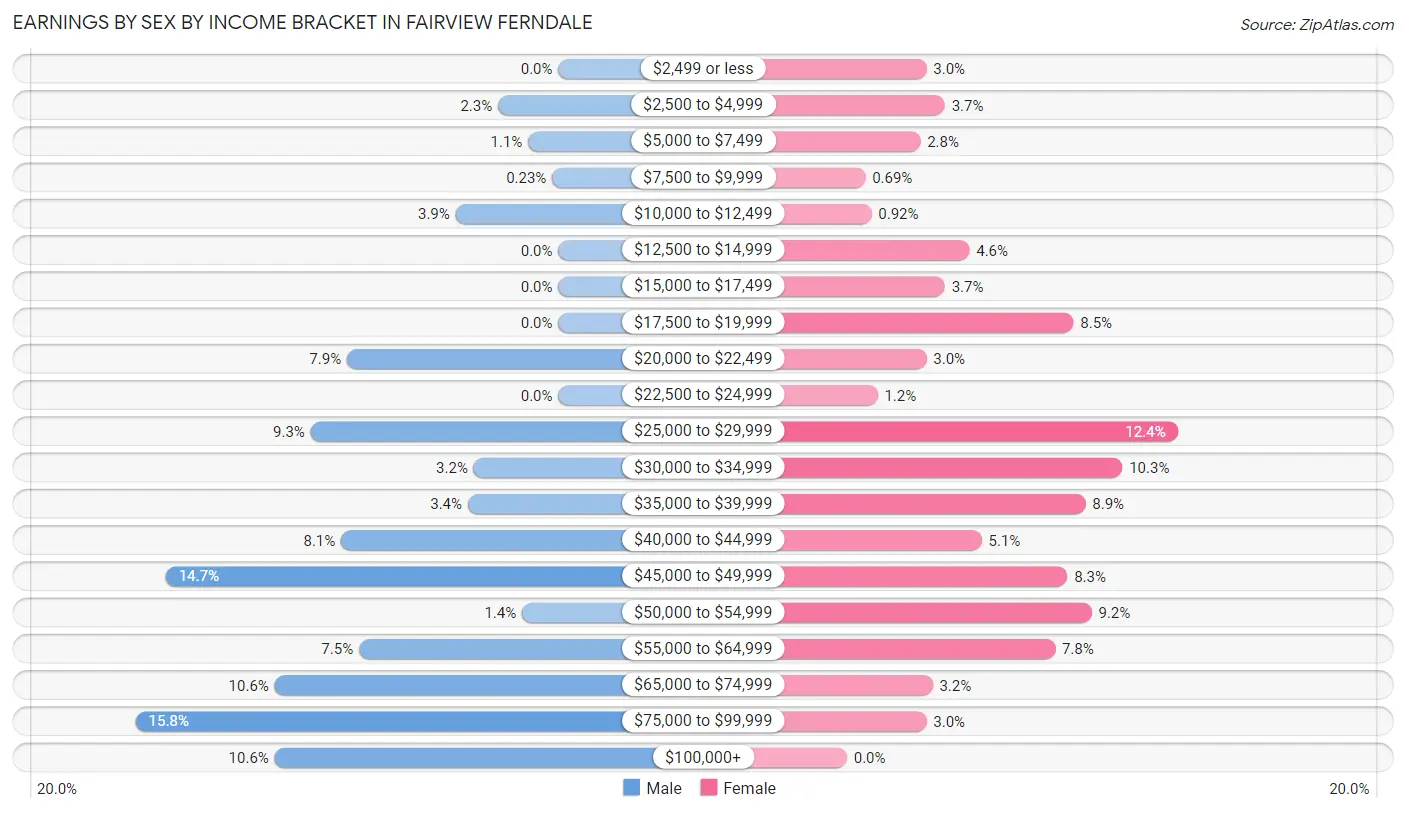
Earnings by Sex by Income Bracket in Fairview Ferndale
The most common earnings brackets in Fairview Ferndale are $75,000 to $99,999 for men (70 | 15.8%) and $25,000 to $29,999 for women (54 | 12.4%).
| Income | Male | Female |
| $2,499 or less | 0 (0.0%) | 13 (3.0%) |
| $2,500 to $4,999 | 10 (2.3%) | 16 (3.7%) |
| $5,000 to $7,499 | 5 (1.1%) | 12 (2.8%) |
| $7,500 to $9,999 | 1 (0.2%) | 3 (0.7%) |
| $10,000 to $12,499 | 17 (3.8%) | 4 (0.9%) |
| $12,500 to $14,999 | 0 (0.0%) | 20 (4.6%) |
| $15,000 to $17,499 | 0 (0.0%) | 16 (3.7%) |
| $17,500 to $19,999 | 0 (0.0%) | 37 (8.5%) |
| $20,000 to $22,499 | 35 (7.9%) | 13 (3.0%) |
| $22,500 to $24,999 | 0 (0.0%) | 5 (1.1%) |
| $25,000 to $29,999 | 41 (9.3%) | 54 (12.4%) |
| $30,000 to $34,999 | 14 (3.2%) | 45 (10.3%) |
| $35,000 to $39,999 | 15 (3.4%) | 39 (8.9%) |
| $40,000 to $44,999 | 36 (8.1%) | 22 (5.1%) |
| $45,000 to $49,999 | 65 (14.7%) | 36 (8.3%) |
| $50,000 to $54,999 | 6 (1.4%) | 40 (9.2%) |
| $55,000 to $64,999 | 33 (7.5%) | 34 (7.8%) |
| $65,000 to $74,999 | 47 (10.6%) | 14 (3.2%) |
| $75,000 to $99,999 | 70 (15.8%) | 13 (3.0%) |
| $100,000+ | 47 (10.6%) | 0 (0.0%) |
| Total | 442 (100.0%) | 436 (100.0%) |
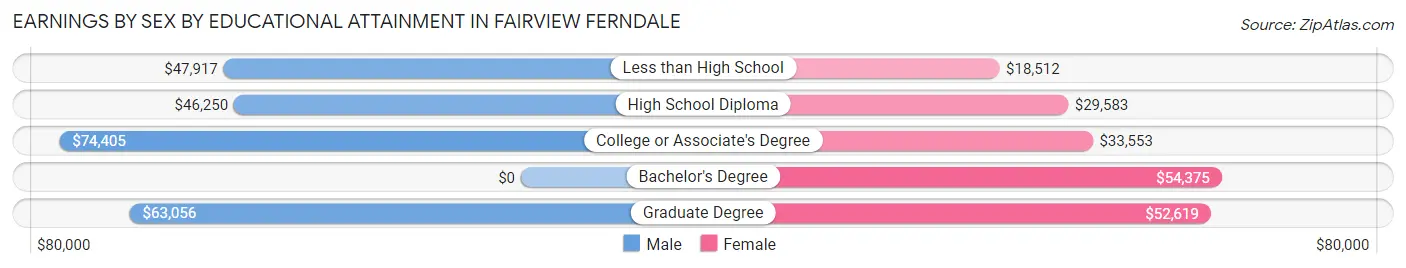
Earnings by Sex by Educational Attainment in Fairview Ferndale
Average earnings in Fairview Ferndale are $54,167 for men and $33,021 for women, a difference of 39.0%. Men with an educational attainment of college or associate's degree enjoy the highest average annual earnings of $74,405, while those with high school diploma education earn the least with $46,250. Women with an educational attainment of bachelor's degree earn the most with the average annual earnings of $54,375, while those with less than high school education have the smallest earnings of $18,512.
| Educational Attainment | Male Income | Female Income |
| Less than High School | $47,917 | $18,512 |
| High School Diploma | $46,250 | $29,583 |
| College or Associate's Degree | $74,405 | $33,553 |
| Bachelor's Degree | - | - |
| Graduate Degree | $63,056 | $52,619 |
| Total | $54,167 | $33,021 |
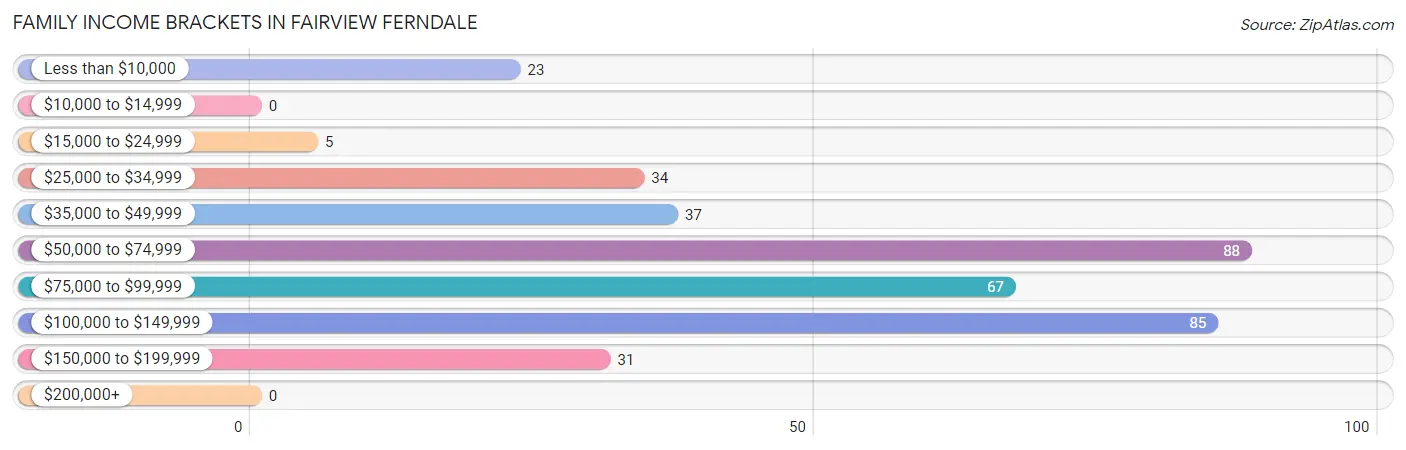
Family Income in Fairview Ferndale
Family Income Brackets in Fairview Ferndale
According to the Fairview Ferndale family income data, there are 88 families falling into the $50,000 to $74,999 income range, which is the most common income bracket and makes up 23.8% of all families.
| Income Bracket | # Families | % Families |
| Less than $10,000 | 23 | 6.2% |
| $10,000 to $14,999 | 0 | 0.0% |
| $15,000 to $24,999 | 5 | 1.4% |
| $25,000 to $34,999 | 34 | 9.2% |
| $35,000 to $49,999 | 37 | 10.0% |
| $50,000 to $74,999 | 88 | 23.8% |
| $75,000 to $99,999 | 67 | 18.1% |
| $100,000 to $149,999 | 85 | 23.0% |
| $150,000 to $199,999 | 31 | 8.4% |
| $200,000+ | 0 | 0.0% |
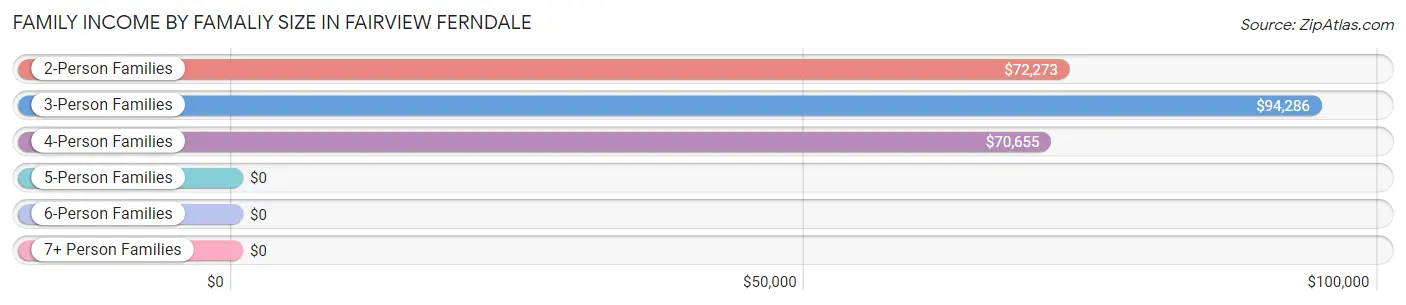
Family Income by Famaliy Size in Fairview Ferndale
3-person families (136 | 36.8%) account for the highest median family income in Fairview Ferndale with $94,286 per family, while 2-person families (166 | 44.9%) have the highest median income of $36,136 per family member.
| Income Bracket | # Families | Median Income |
| 2-Person Families | 166 (44.9%) | $72,273 |
| 3-Person Families | 136 (36.8%) | $94,286 |
| 4-Person Families | 59 (16.0%) | $70,655 |
| 5-Person Families | 9 (2.4%) | $0 |
| 6-Person Families | 0 (0.0%) | $0 |
| 7+ Person Families | 0 (0.0%) | $0 |
| Total | 370 (100.0%) | $72,386 |
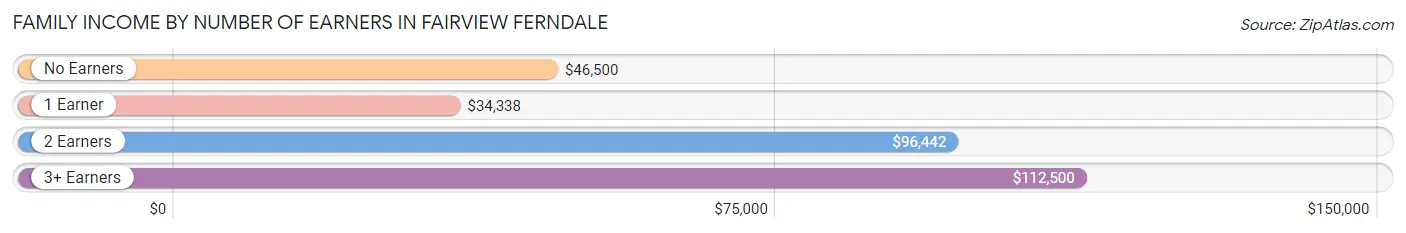
Family Income by Number of Earners in Fairview Ferndale
The median family income in Fairview Ferndale is $72,386, with families comprising 3+ earners (30) having the highest median family income of $112,500, while families with 1 earner (63) have the lowest median family income of $34,338, accounting for 8.1% and 17.0% of families, respectively.
| Number of Earners | # Families | Median Income |
| No Earners | 78 (21.1%) | $46,500 |
| 1 Earner | 63 (17.0%) | $34,338 |
| 2 Earners | 199 (53.8%) | $96,442 |
| 3+ Earners | 30 (8.1%) | $112,500 |
| Total | 370 (100.0%) | $72,386 |
Household Income in Fairview Ferndale
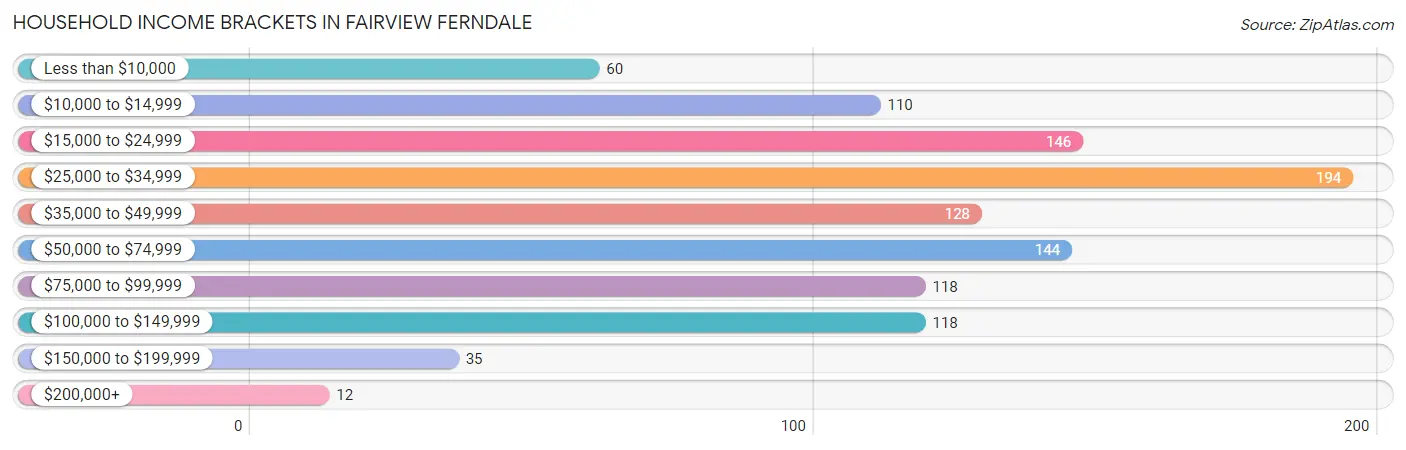
Household Income Brackets in Fairview Ferndale
With 194 households falling in the category, the $25,000 to $34,999 income range is the most frequent in Fairview Ferndale, accounting for 18.2% of all households. In contrast, only 12 households (1.1%) fall into the $200,000+ income bracket, making it the least populous group.
| Income Bracket | # Households | % Households |
| Less than $10,000 | 60 | 5.6% |
| $10,000 to $14,999 | 110 | 10.3% |
| $15,000 to $24,999 | 146 | 13.7% |
| $25,000 to $34,999 | 194 | 18.2% |
| $35,000 to $49,999 | 128 | 12.0% |
| $50,000 to $74,999 | 144 | 13.5% |
| $75,000 to $99,999 | 118 | 11.1% |
| $100,000 to $149,999 | 118 | 11.1% |
| $150,000 to $199,999 | 35 | 3.3% |
| $200,000+ | 12 | 1.1% |
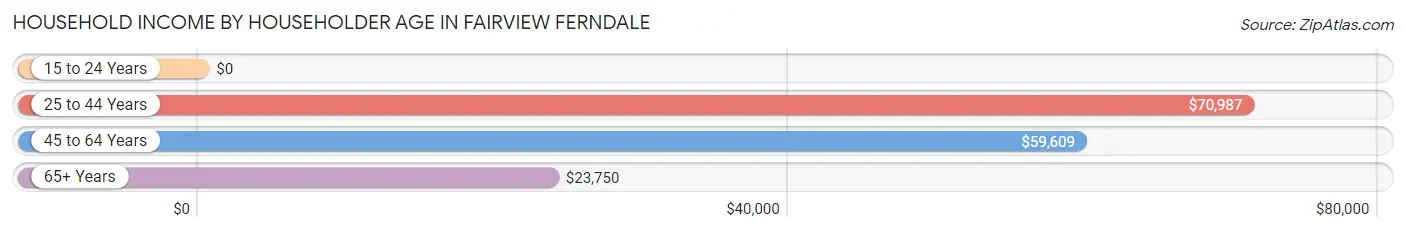
Household Income by Householder Age in Fairview Ferndale
The median household income in Fairview Ferndale is $37,163, with the highest median household income of $70,987 found in the 25 to 44 years age bracket for the primary householder. A total of 195 households (18.3%) fall into this category.
| Income Bracket | # Households | Median Income |
| 15 to 24 Years | 0 (0.0%) | $0 |
| 25 to 44 Years | 195 (18.3%) | $70,987 |
| 45 to 64 Years | 352 (33.1%) | $59,609 |
| 65+ Years | 518 (48.6%) | $23,750 |
| Total | 1,065 (100.0%) | $37,163 |
Poverty in Fairview Ferndale
Income Below Poverty by Sex and Age in Fairview Ferndale
With 8.2% poverty level for males and 16.5% for females among the residents of Fairview Ferndale, 75 year old and over males and 5 year old females are the most vulnerable to poverty, with 35 males (35.7%) and 12 females (100.0%) in their respective age groups living below the poverty level.
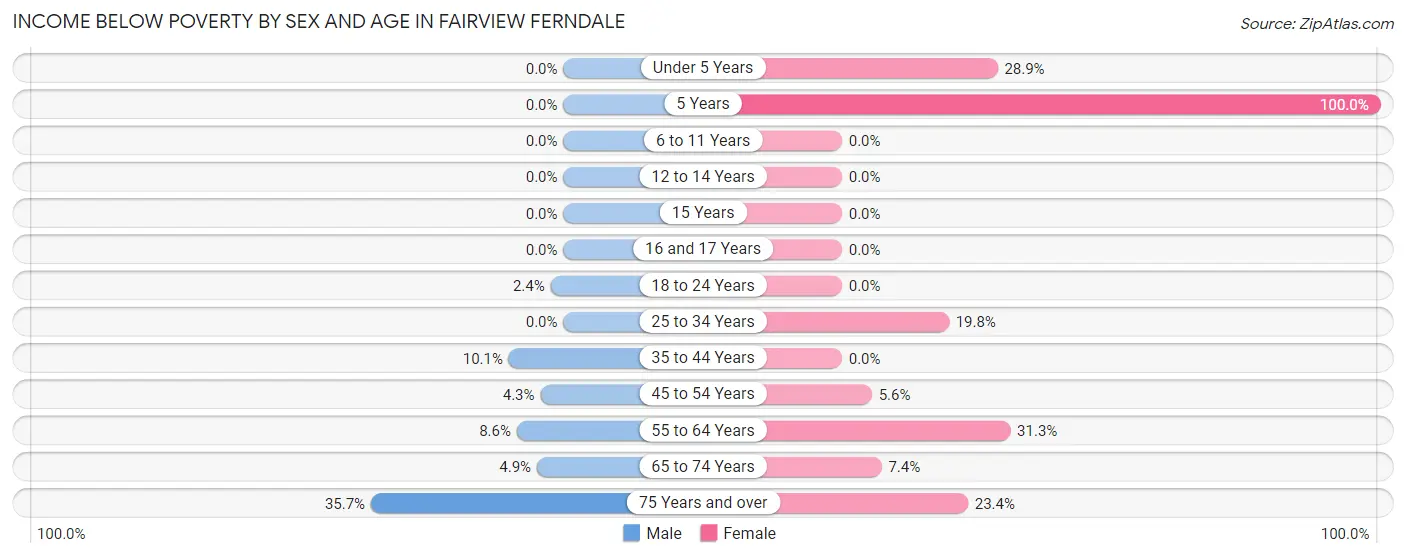
| Age Bracket | Male | Female |
| Under 5 Years | 0 (0.0%) | 13 (28.9%) |
| 5 Years | 0 (0.0%) | 12 (100.0%) |
| 6 to 11 Years | 0 (0.0%) | 0 (0.0%) |
| 12 to 14 Years | 0 (0.0%) | 0 (0.0%) |
| 15 Years | 0 (0.0%) | 0 (0.0%) |
| 16 and 17 Years | 0 (0.0%) | 0 (0.0%) |
| 18 to 24 Years | 1 (2.4%) | 0 (0.0%) |
| 25 to 34 Years | 0 (0.0%) | 25 (19.8%) |
| 35 to 44 Years | 8 (10.1%) | 0 (0.0%) |
| 45 to 54 Years | 4 (4.3%) | 9 (5.6%) |
| 55 to 64 Years | 19 (8.6%) | 30 (31.2%) |
| 65 to 74 Years | 7 (4.9%) | 7 (7.4%) |
| 75 Years and over | 35 (35.7%) | 58 (23.4%) |
| Total | 74 (8.2%) | 154 (16.5%) |
Income Above Poverty by Sex and Age in Fairview Ferndale
According to the poverty statistics in Fairview Ferndale, males aged under 5 years and females aged 6 to 11 years are the age groups that are most secure financially, with 100.0% of males and 100.0% of females in these age groups living above the poverty line.
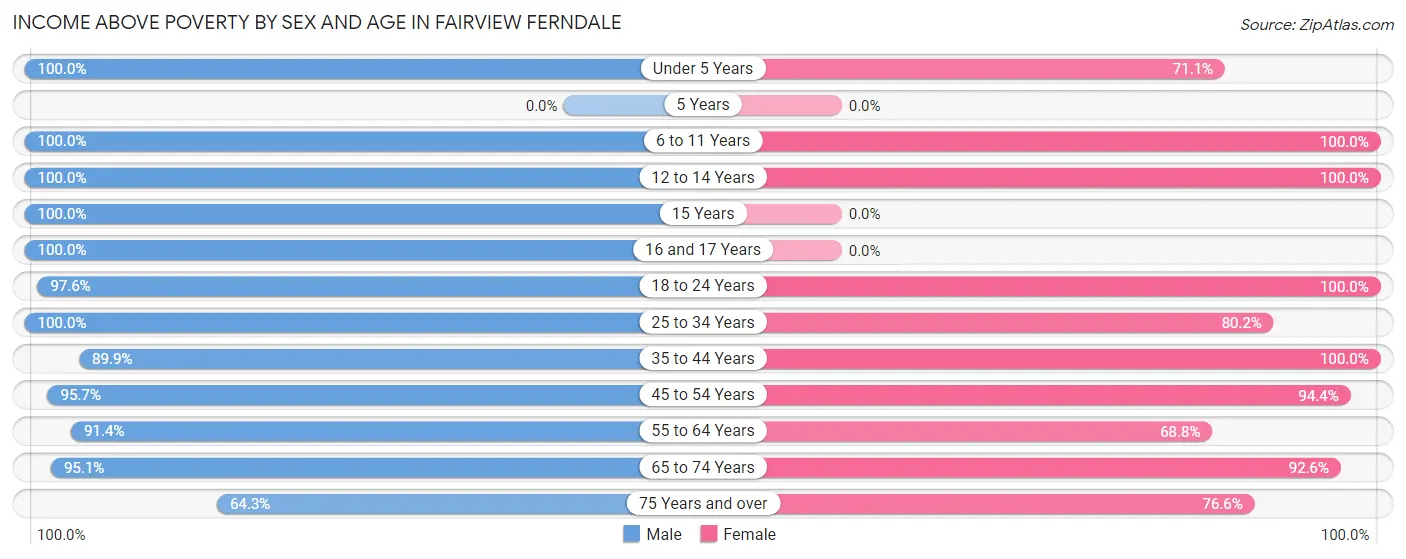
| Age Bracket | Male | Female |
| Under 5 Years | 48 (100.0%) | 32 (71.1%) |
| 5 Years | 0 (0.0%) | 0 (0.0%) |
| 6 to 11 Years | 38 (100.0%) | 37 (100.0%) |
| 12 to 14 Years | 13 (100.0%) | 20 (100.0%) |
| 15 Years | 12 (100.0%) | 0 (0.0%) |
| 16 and 17 Years | 22 (100.0%) | 0 (0.0%) |
| 18 to 24 Years | 41 (97.6%) | 8 (100.0%) |
| 25 to 34 Years | 97 (100.0%) | 101 (80.2%) |
| 35 to 44 Years | 71 (89.9%) | 82 (100.0%) |
| 45 to 54 Years | 90 (95.7%) | 153 (94.4%) |
| 55 to 64 Years | 201 (91.4%) | 66 (68.8%) |
| 65 to 74 Years | 136 (95.1%) | 88 (92.6%) |
| 75 Years and over | 63 (64.3%) | 190 (76.6%) |
| Total | 832 (91.8%) | 777 (83.5%) |
Income Below Poverty Among Married-Couple Families in Fairview Ferndale
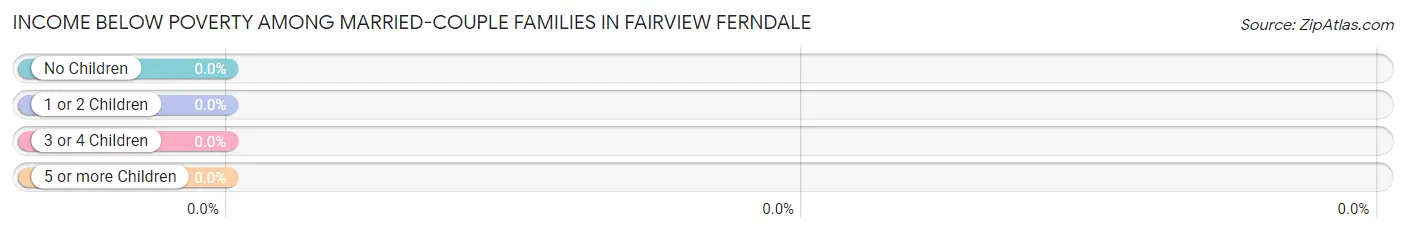
| Children | Above Poverty | Below Poverty |
| No Children | 171 (100.0%) | 0 (0.0%) |
| 1 or 2 Children | 82 (100.0%) | 0 (0.0%) |
| 3 or 4 Children | 9 (100.0%) | 0 (0.0%) |
| 5 or more Children | 0 (0.0%) | 0 (0.0%) |
| Total | 262 (100.0%) | 0 (0.0%) |
Income Below Poverty Among Single-Parent Households in Fairview Ferndale
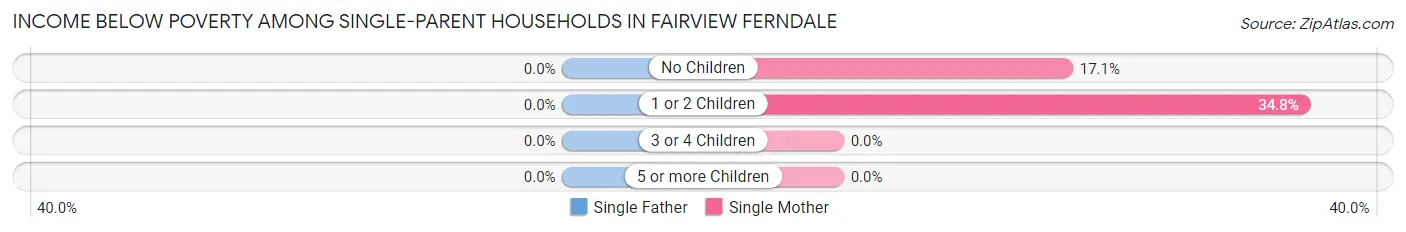
| Children | Single Father | Single Mother |
| No Children | 0 (0.0%) | 7 (17.1%) |
| 1 or 2 Children | 0 (0.0%) | 16 (34.8%) |
| 3 or 4 Children | 0 (0.0%) | 0 (0.0%) |
| 5 or more Children | 0 (0.0%) | 0 (0.0%) |
| Total | 0 (0.0%) | 23 (26.4%) |
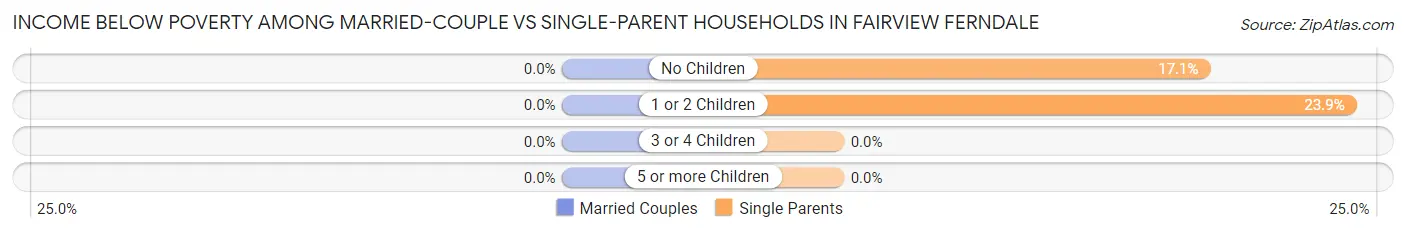
Income Below Poverty Among Married-Couple vs Single-Parent Households in Fairview Ferndale
| Children | Married-Couple Families | Single-Parent Households |
| No Children | 0 (0.0%) | 7 (17.1%) |
| 1 or 2 Children | 0 (0.0%) | 16 (23.9%) |
| 3 or 4 Children | 0 (0.0%) | 0 (0.0%) |
| 5 or more Children | 0 (0.0%) | 0 (0.0%) |
| Total | 0 (0.0%) | 23 (21.3%) |
Employment Characteristics in Fairview Ferndale
Employment by Class of Employer in Fairview Ferndale
Among the 816 employed individuals in Fairview Ferndale, private company employees (577 | 70.7%), not-for-profit organizations (87 | 10.7%), and local government employees (69 | 8.5%) make up the most common classes of employment.
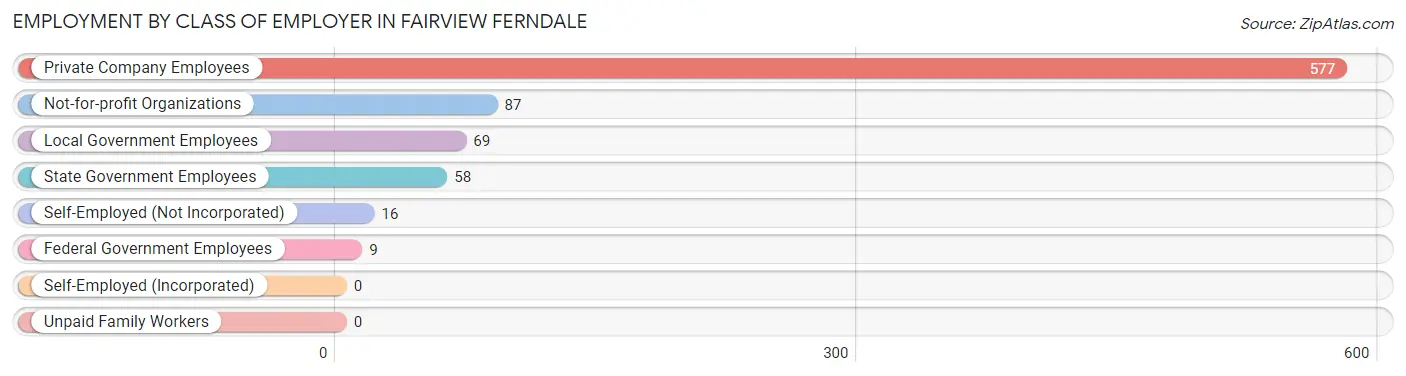
| Employer Class | # Employees | % Employees |
| Private Company Employees | 577 | 70.7% |
| Self-Employed (Incorporated) | 0 | 0.0% |
| Self-Employed (Not Incorporated) | 16 | 2.0% |
| Not-for-profit Organizations | 87 | 10.7% |
| Local Government Employees | 69 | 8.5% |
| State Government Employees | 58 | 7.1% |
| Federal Government Employees | 9 | 1.1% |
| Unpaid Family Workers | 0 | 0.0% |
| Total | 816 | 100.0% |
Employment Status by Age in Fairview Ferndale
According to the labor force statistics for Fairview Ferndale, out of the total population over 16 years of age (1,612), 54.8% or 883 individuals are in the labor force, with 5.7% or 50 of them unemployed. The age group with the highest labor force participation rate is 20 to 24 years, with 100.0% or 41 individuals in the labor force. Within the labor force, the 65 to 74 years age range has the highest percentage of unemployed individuals, with 14.5% or 9 of them being unemployed.
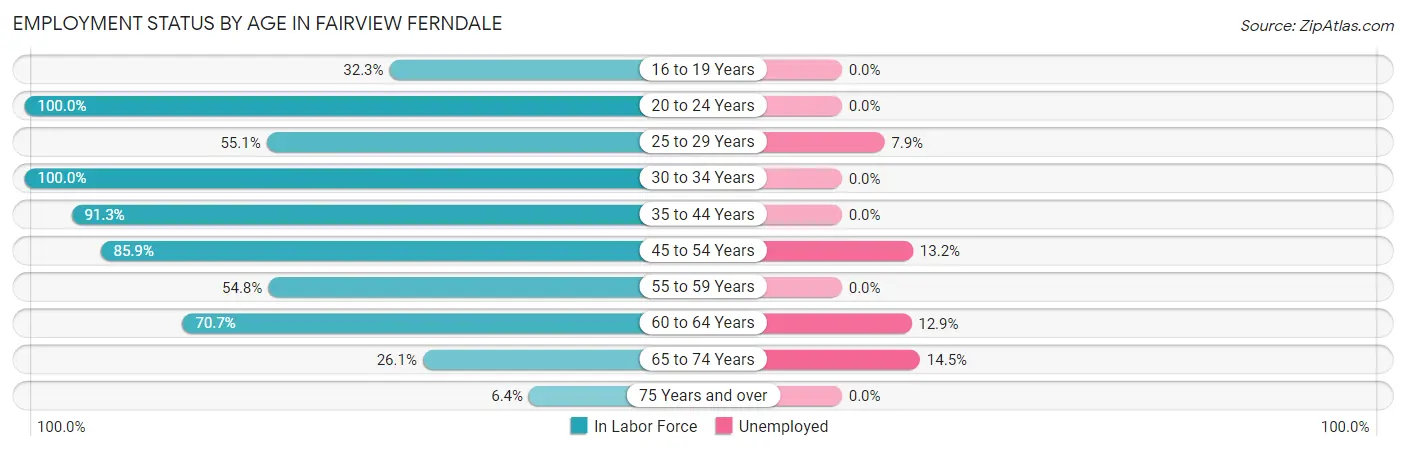
| Age Bracket | In Labor Force | Unemployed |
| 16 to 19 Years | 10 (32.3%) | 0 (0.0%) |
| 20 to 24 Years | 41 (100.0%) | 0 (0.0%) |
| 25 to 29 Years | 38 (55.1%) | 3 (7.9%) |
| 30 to 34 Years | 154 (100.0%) | 0 (0.0%) |
| 35 to 44 Years | 147 (91.3%) | 0 (0.0%) |
| 45 to 54 Years | 220 (85.9%) | 29 (13.2%) |
| 55 to 59 Years | 119 (54.8%) | 0 (0.0%) |
| 60 to 64 Years | 70 (70.7%) | 9 (12.9%) |
| 65 to 74 Years | 62 (26.1%) | 9 (14.5%) |
| 75 Years and over | 22 (6.4%) | 0 (0.0%) |
| Total | 883 (54.8%) | 50 (5.7%) |
Employment Status by Educational Attainment in Fairview Ferndale
According to labor force statistics for Fairview Ferndale, 78.2% of individuals (748) out of the total population between 25 and 64 years of age (956) are in the labor force, with 5.5% or 41 of them being unemployed. The group with the highest labor force participation rate are those with the educational attainment of bachelor's degree or higher, with 96.0% or 143 individuals in the labor force. Within the labor force, individuals with high school diploma education have the highest percentage of unemployment, with 12.6% or 38 of them being unemployed.
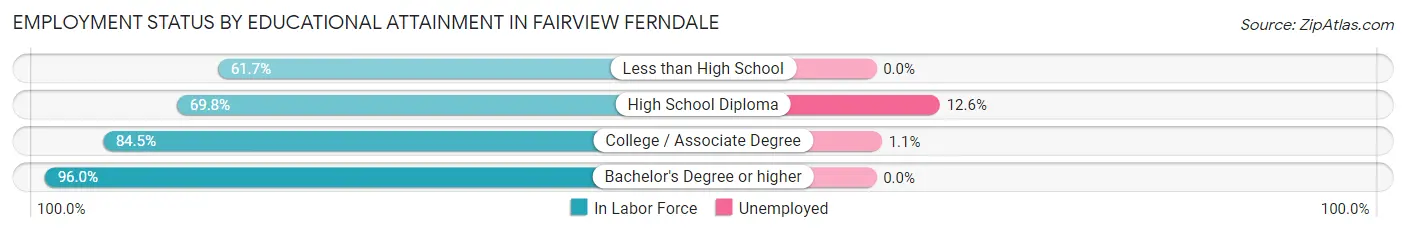
| Educational Attainment | In Labor Force | Unemployed |
| Less than High School | 37 (61.7%) | 0 (0.0%) |
| High School Diploma | 301 (69.8%) | 54 (12.6%) |
| College / Associate Degree | 267 (84.5%) | 3 (1.1%) |
| Bachelor's Degree or higher | 143 (96.0%) | 0 (0.0%) |
| Total | 748 (78.2%) | 53 (5.5%) |
Employment Occupations by Sex in Fairview Ferndale
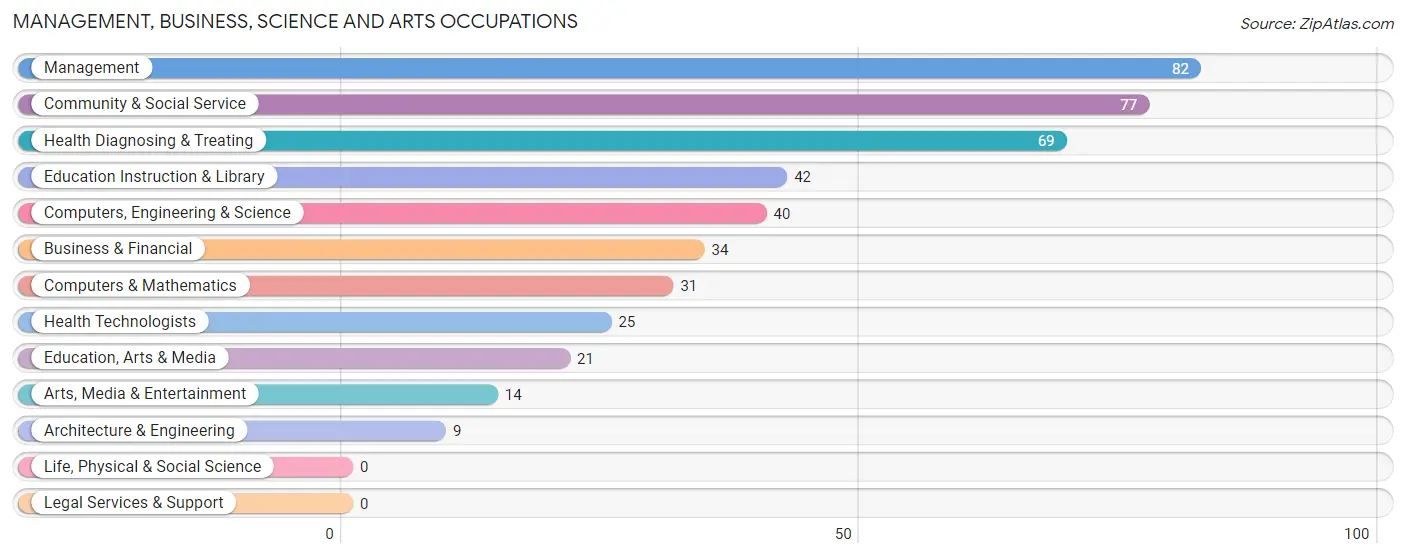
Management, Business, Science and Arts Occupations
The most common Management, Business, Science and Arts occupations in Fairview Ferndale are Management (82 | 9.8%), Community & Social Service (77 | 9.2%), Health Diagnosing & Treating (69 | 8.3%), Education Instruction & Library (42 | 5.0%), and Computers, Engineering & Science (40 | 4.8%).
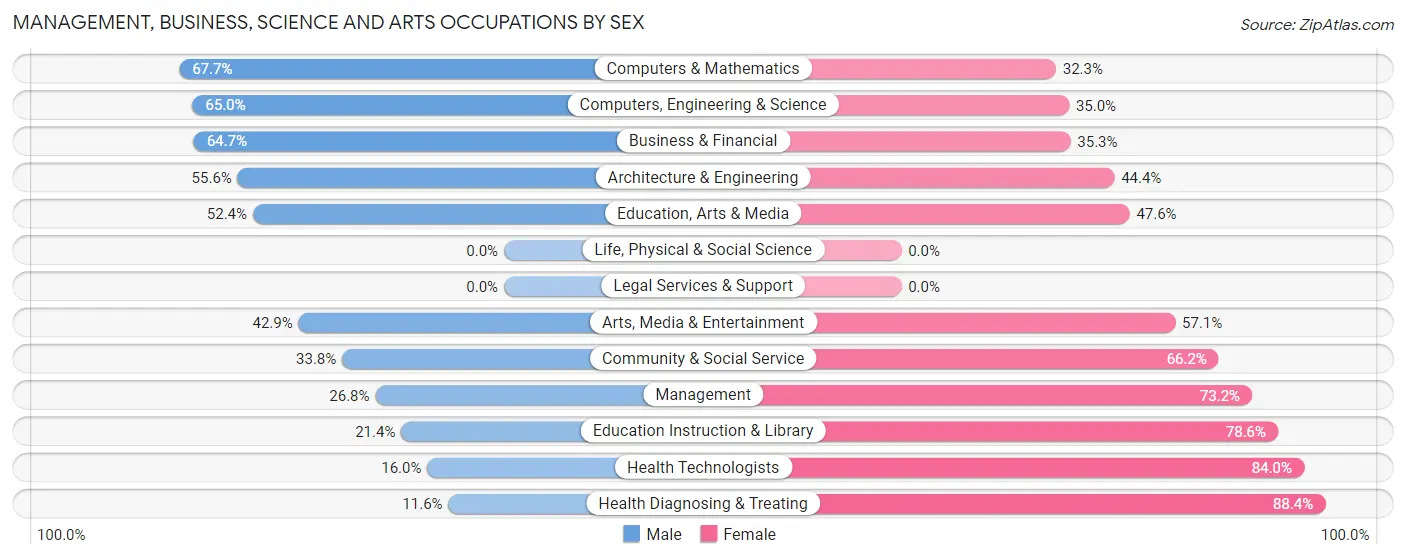
Management, Business, Science and Arts Occupations by Sex
Within the Management, Business, Science and Arts occupations in Fairview Ferndale, the most male-oriented occupations are Computers & Mathematics (67.7%), Computers, Engineering & Science (65.0%), and Business & Financial (64.7%), while the most female-oriented occupations are Health Diagnosing & Treating (88.4%), Health Technologists (84.0%), and Education Instruction & Library (78.6%).
| Occupation | Male | Female |
| Management | 22 (26.8%) | 60 (73.2%) |
| Business & Financial | 22 (64.7%) | 12 (35.3%) |
| Computers, Engineering & Science | 26 (65.0%) | 14 (35.0%) |
| Computers & Mathematics | 21 (67.7%) | 10 (32.3%) |
| Architecture & Engineering | 5 (55.6%) | 4 (44.4%) |
| Life, Physical & Social Science | 0 (0.0%) | 0 (0.0%) |
| Community & Social Service | 26 (33.8%) | 51 (66.2%) |
| Education, Arts & Media | 11 (52.4%) | 10 (47.6%) |
| Legal Services & Support | 0 (0.0%) | 0 (0.0%) |
| Education Instruction & Library | 9 (21.4%) | 33 (78.6%) |
| Arts, Media & Entertainment | 6 (42.9%) | 8 (57.1%) |
| Health Diagnosing & Treating | 8 (11.6%) | 61 (88.4%) |
| Health Technologists | 4 (16.0%) | 21 (84.0%) |
| Total (Category) | 104 (34.4%) | 198 (65.6%) |
| Total (Overall) | 416 (49.9%) | 417 (50.1%) |
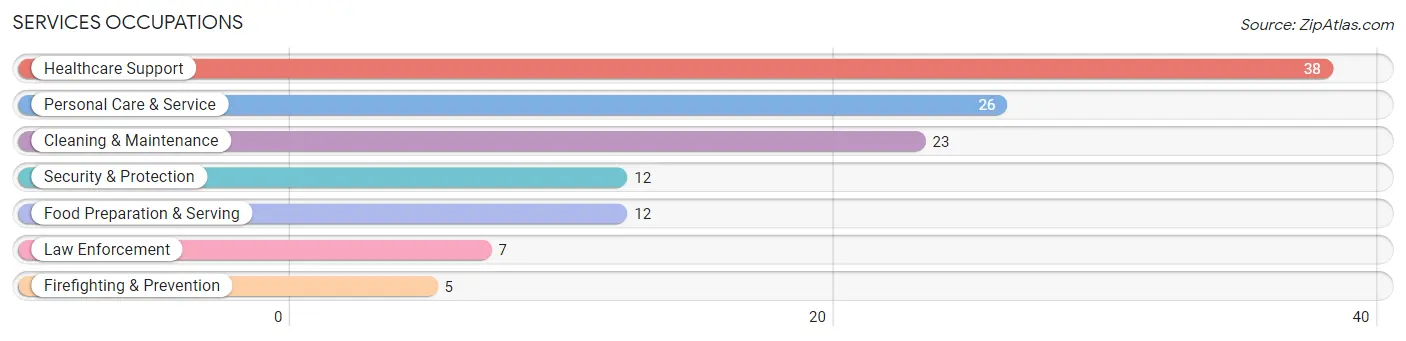
Services Occupations
The most common Services occupations in Fairview Ferndale are Healthcare Support (38 | 4.6%), Personal Care & Service (26 | 3.1%), Cleaning & Maintenance (23 | 2.8%), Security & Protection (12 | 1.4%), and Food Preparation & Serving (12 | 1.4%).
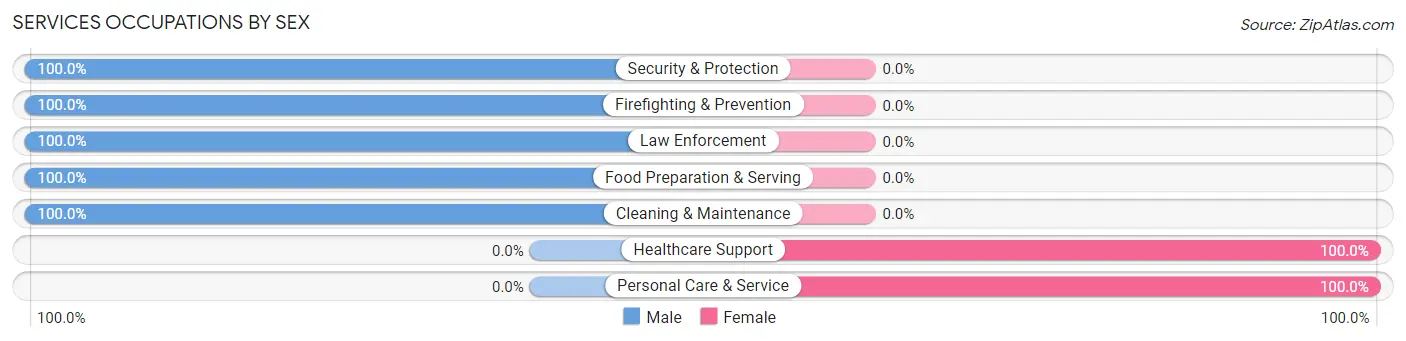
Services Occupations by Sex
Within the Services occupations in Fairview Ferndale, the most male-oriented occupations are Security & Protection (100.0%), Firefighting & Prevention (100.0%), and Law Enforcement (100.0%), while the most female-oriented occupations are Healthcare Support (100.0%), and Personal Care & Service (100.0%).
| Occupation | Male | Female |
| Healthcare Support | 0 (0.0%) | 38 (100.0%) |
| Security & Protection | 12 (100.0%) | 0 (0.0%) |
| Firefighting & Prevention | 5 (100.0%) | 0 (0.0%) |
| Law Enforcement | 7 (100.0%) | 0 (0.0%) |
| Food Preparation & Serving | 12 (100.0%) | 0 (0.0%) |
| Cleaning & Maintenance | 23 (100.0%) | 0 (0.0%) |
| Personal Care & Service | 0 (0.0%) | 26 (100.0%) |
| Total (Category) | 47 (42.3%) | 64 (57.7%) |
| Total (Overall) | 416 (49.9%) | 417 (50.1%) |
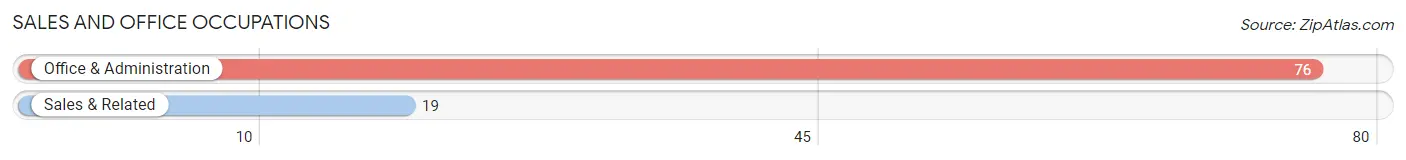
Sales and Office Occupations
The most common Sales and Office occupations in Fairview Ferndale are Office & Administration (76 | 9.1%), and Sales & Related (19 | 2.3%).
Sales and Office Occupations by Sex
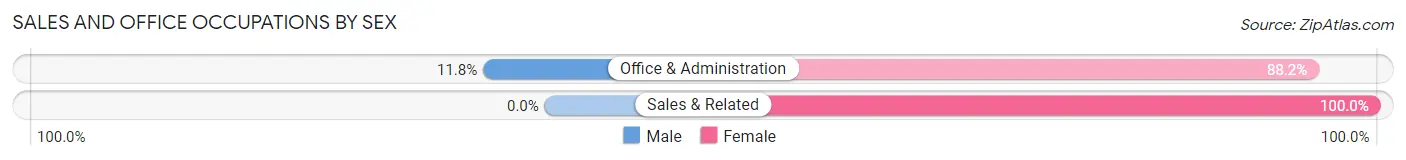
| Occupation | Male | Female |
| Sales & Related | 0 (0.0%) | 19 (100.0%) |
| Office & Administration | 9 (11.8%) | 67 (88.2%) |
| Total (Category) | 9 (9.5%) | 86 (90.5%) |
| Total (Overall) | 416 (49.9%) | 417 (50.1%) |
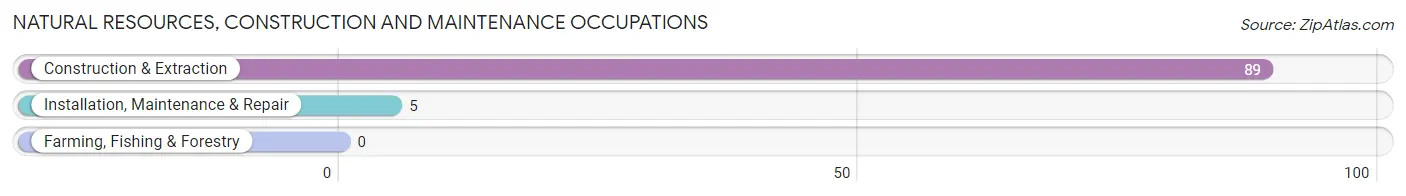
Natural Resources, Construction and Maintenance Occupations
The most common Natural Resources, Construction and Maintenance occupations in Fairview Ferndale are Construction & Extraction (89 | 10.7%), and Installation, Maintenance & Repair (5 | 0.6%).
Natural Resources, Construction and Maintenance Occupations by Sex
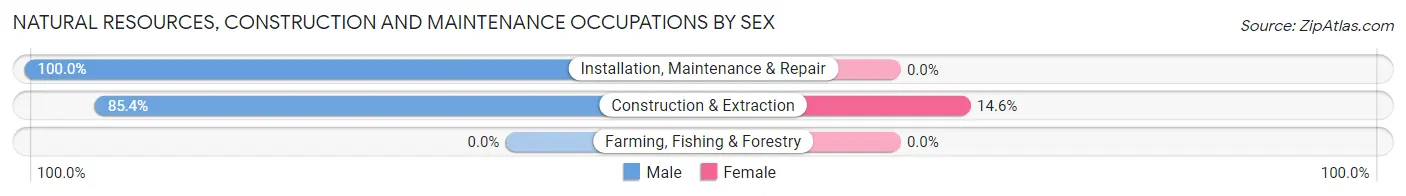
| Occupation | Male | Female |
| Farming, Fishing & Forestry | 0 (0.0%) | 0 (0.0%) |
| Construction & Extraction | 76 (85.4%) | 13 (14.6%) |
| Installation, Maintenance & Repair | 5 (100.0%) | 0 (0.0%) |
| Total (Category) | 81 (86.2%) | 13 (13.8%) |
| Total (Overall) | 416 (49.9%) | 417 (50.1%) |
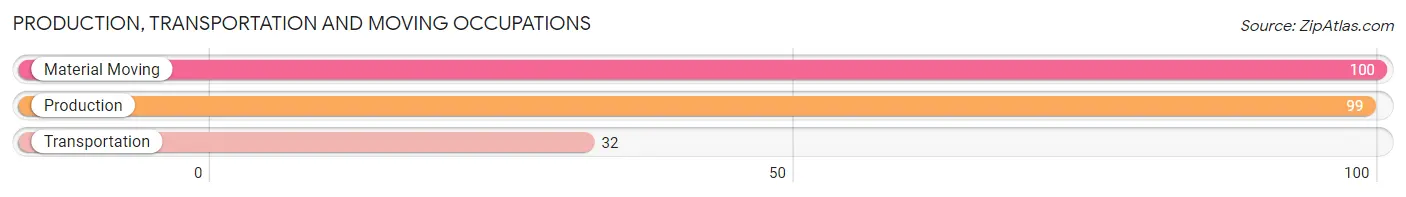
Production, Transportation and Moving Occupations
The most common Production, Transportation and Moving occupations in Fairview Ferndale are Material Moving (100 | 12.0%), Production (99 | 11.9%), and Transportation (32 | 3.8%).
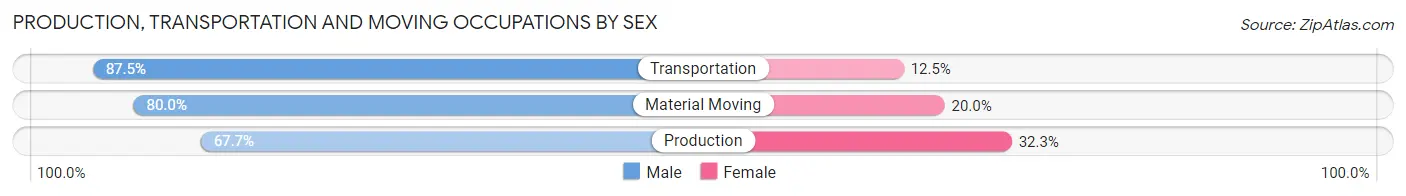
Production, Transportation and Moving Occupations by Sex
| Occupation | Male | Female |
| Production | 67 (67.7%) | 32 (32.3%) |
| Transportation | 28 (87.5%) | 4 (12.5%) |
| Material Moving | 80 (80.0%) | 20 (20.0%) |
| Total (Category) | 175 (75.8%) | 56 (24.2%) |
| Total (Overall) | 416 (49.9%) | 417 (50.1%) |
Employment Industries by Sex in Fairview Ferndale
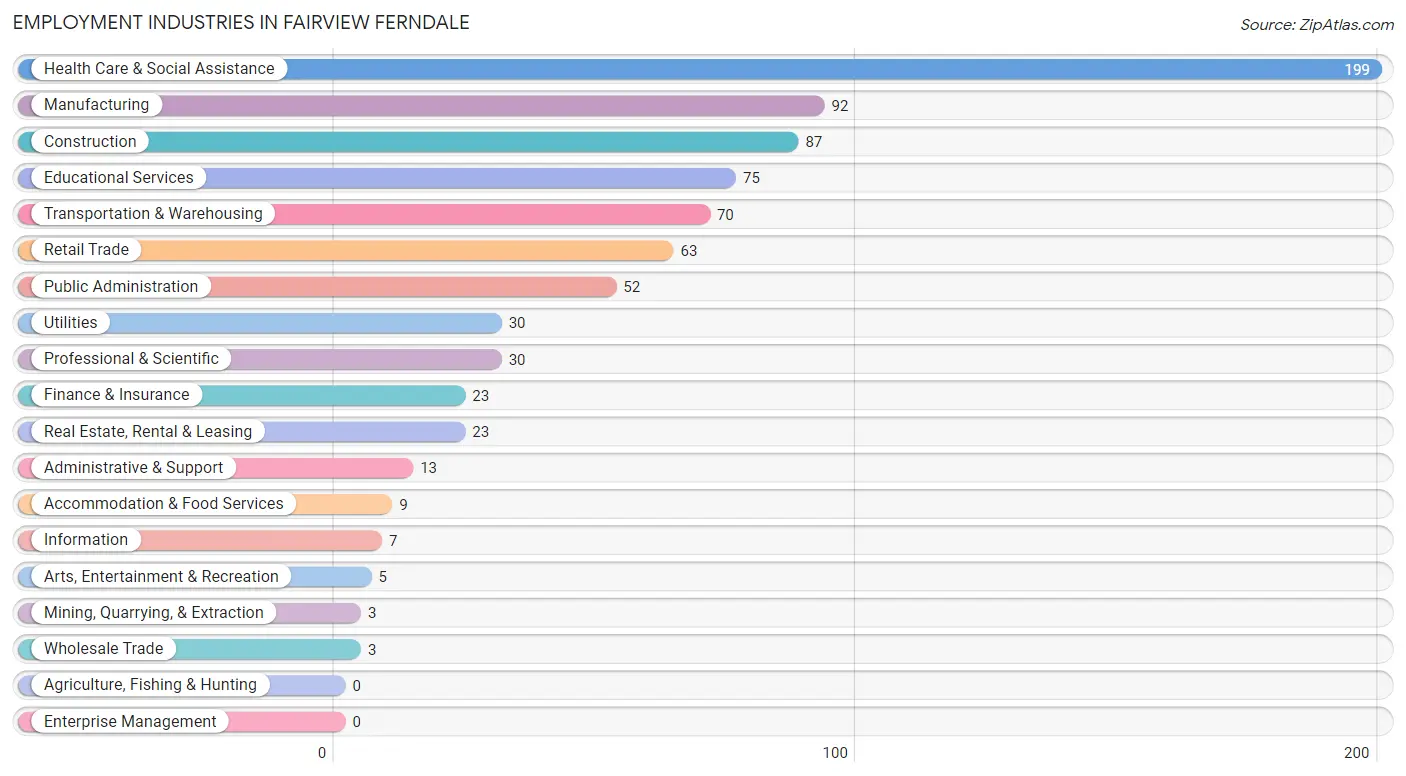
Employment Industries in Fairview Ferndale
The major employment industries in Fairview Ferndale include Health Care & Social Assistance (199 | 23.9%), Manufacturing (92 | 11.0%), Construction (87 | 10.4%), Educational Services (75 | 9.0%), and Transportation & Warehousing (70 | 8.4%).
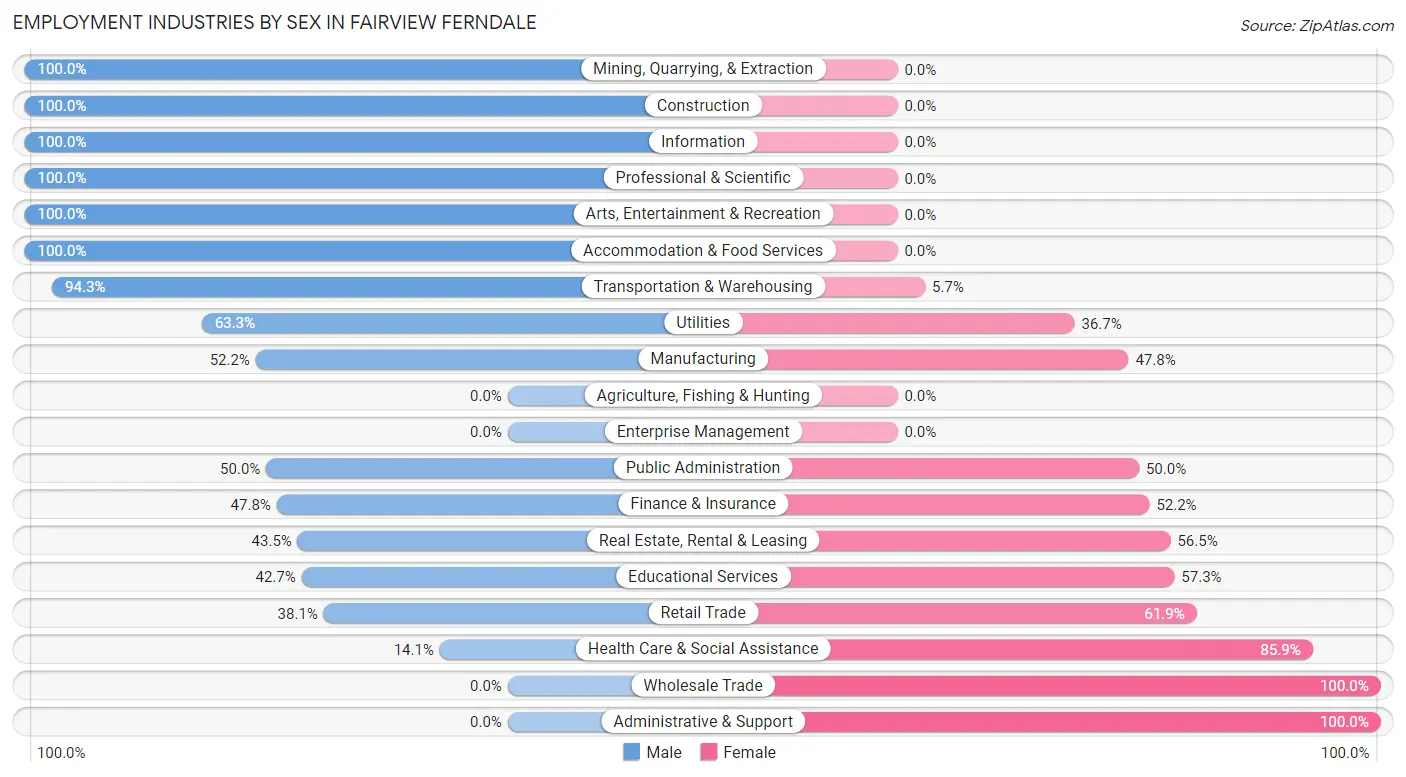
Employment Industries by Sex in Fairview Ferndale
The Fairview Ferndale industries that see more men than women are Mining, Quarrying, & Extraction (100.0%), Construction (100.0%), and Information (100.0%), whereas the industries that tend to have a higher number of women are Wholesale Trade (100.0%), Administrative & Support (100.0%), and Health Care & Social Assistance (85.9%).
| Industry | Male | Female |
| Agriculture, Fishing & Hunting | 0 (0.0%) | 0 (0.0%) |
| Mining, Quarrying, & Extraction | 3 (100.0%) | 0 (0.0%) |
| Construction | 87 (100.0%) | 0 (0.0%) |
| Manufacturing | 48 (52.2%) | 44 (47.8%) |
| Wholesale Trade | 0 (0.0%) | 3 (100.0%) |
| Retail Trade | 24 (38.1%) | 39 (61.9%) |
| Transportation & Warehousing | 66 (94.3%) | 4 (5.7%) |
| Utilities | 19 (63.3%) | 11 (36.7%) |
| Information | 7 (100.0%) | 0 (0.0%) |
| Finance & Insurance | 11 (47.8%) | 12 (52.2%) |
| Real Estate, Rental & Leasing | 10 (43.5%) | 13 (56.5%) |
| Professional & Scientific | 30 (100.0%) | 0 (0.0%) |
| Enterprise Management | 0 (0.0%) | 0 (0.0%) |
| Administrative & Support | 0 (0.0%) | 13 (100.0%) |
| Educational Services | 32 (42.7%) | 43 (57.3%) |
| Health Care & Social Assistance | 28 (14.1%) | 171 (85.9%) |
| Arts, Entertainment & Recreation | 5 (100.0%) | 0 (0.0%) |
| Accommodation & Food Services | 9 (100.0%) | 0 (0.0%) |
| Public Administration | 26 (50.0%) | 26 (50.0%) |
| Total | 416 (49.9%) | 417 (50.1%) |
Education in Fairview Ferndale
School Enrollment in Fairview Ferndale
The most common levels of schooling among the 183 students in Fairview Ferndale are elementary school (55 | 30.0%), middle school (40 | 21.9%), and high school (34 | 18.6%).
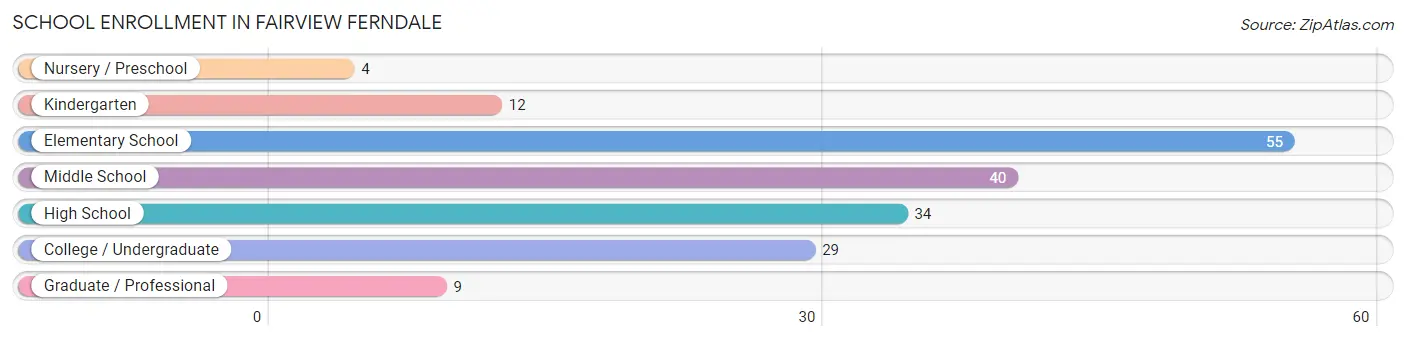
| School Level | # Students | % Students |
| Nursery / Preschool | 4 | 2.2% |
| Kindergarten | 12 | 6.6% |
| Elementary School | 55 | 30.0% |
| Middle School | 40 | 21.9% |
| High School | 34 | 18.6% |
| College / Undergraduate | 29 | 15.9% |
| Graduate / Professional | 9 | 4.9% |
| Total | 183 | 100.0% |
School Enrollment by Age by Funding Source in Fairview Ferndale
Out of a total of 183 students who are enrolled in schools in Fairview Ferndale, 55 (30.1%) attend a private institution, while the remaining 128 (69.9%) are enrolled in public schools. The age group of 18 to 19 year olds has the highest likelihood of being enrolled in private schools, with 9 (100.0% in the age bracket) enrolled. Conversely, the age group of 3 to 4 year olds has the lowest likelihood of being enrolled in a private school, with 4 (100.0% in the age bracket) attending a public institution.
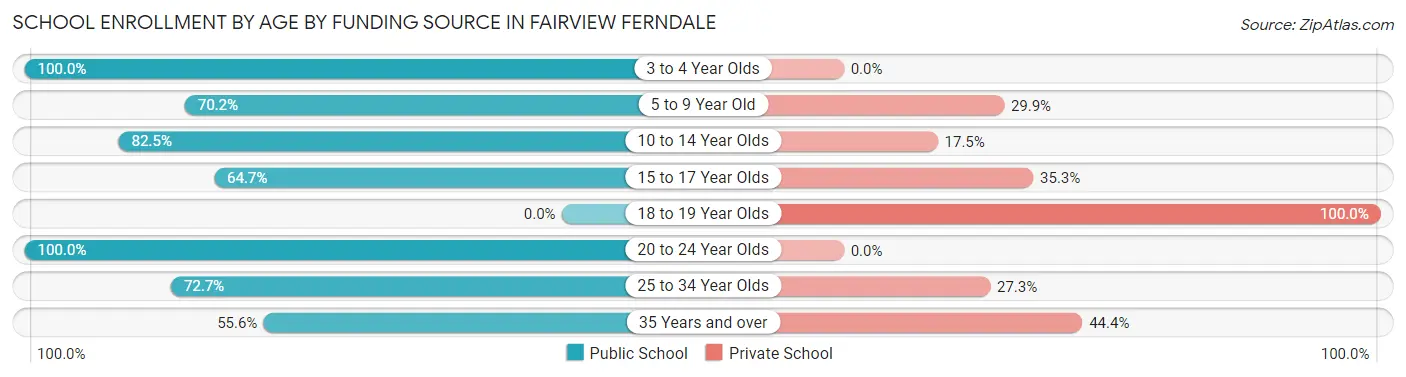
| Age Bracket | Public School | Private School |
| 3 to 4 Year Olds | 4 (100.0%) | 0 (0.0%) |
| 5 to 9 Year Old | 47 (70.2%) | 20 (29.8%) |
| 10 to 14 Year Olds | 33 (82.5%) | 7 (17.5%) |
| 15 to 17 Year Olds | 22 (64.7%) | 12 (35.3%) |
| 18 to 19 Year Olds | 0 (0.0%) | 9 (100.0%) |
| 20 to 24 Year Olds | 9 (100.0%) | 0 (0.0%) |
| 25 to 34 Year Olds | 8 (72.7%) | 3 (27.3%) |
| 35 Years and over | 5 (55.6%) | 4 (44.4%) |
| Total | 128 (69.9%) | 55 (30.1%) |
Educational Attainment by Field of Study in Fairview Ferndale
Education (92 | 43.2%), science & technology (50 | 23.5%), business (21 | 9.9%), social sciences (12 | 5.6%), and communications (12 | 5.6%) are the most common fields of study among 213 individuals in Fairview Ferndale who have obtained a bachelor's degree or higher.
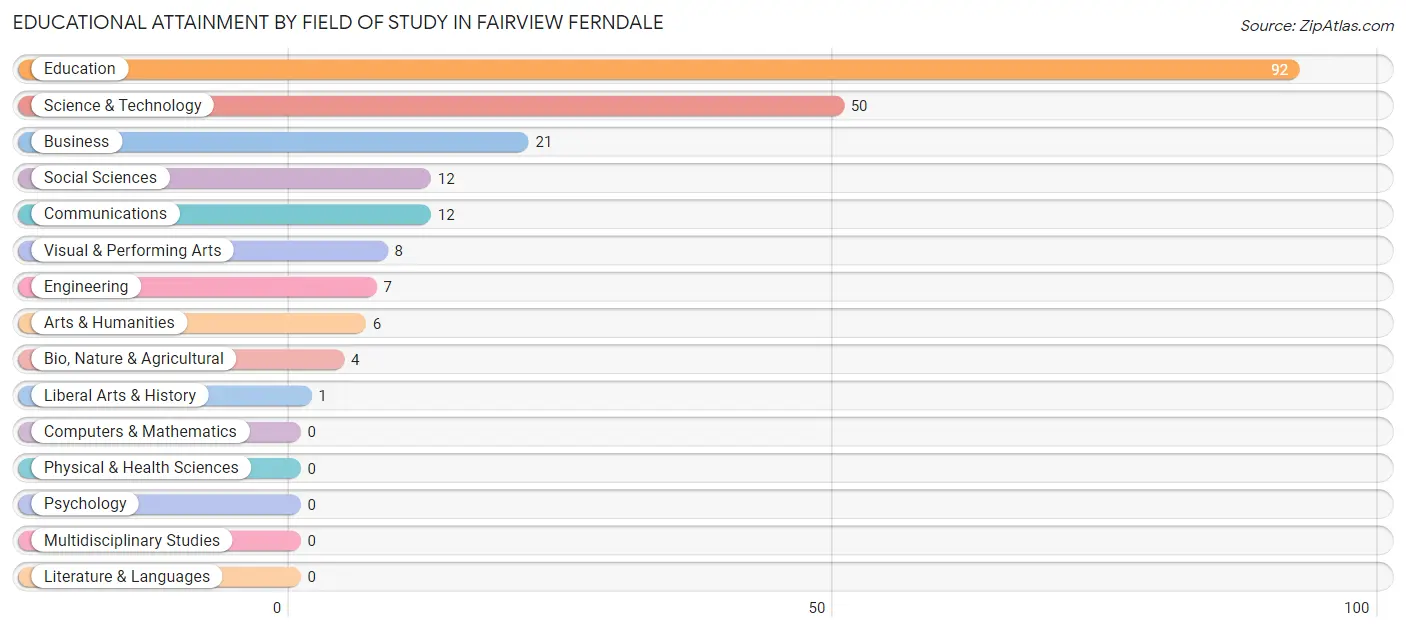
| Field of Study | # Graduates | % Graduates |
| Computers & Mathematics | 0 | 0.0% |
| Bio, Nature & Agricultural | 4 | 1.9% |
| Physical & Health Sciences | 0 | 0.0% |
| Psychology | 0 | 0.0% |
| Social Sciences | 12 | 5.6% |
| Engineering | 7 | 3.3% |
| Multidisciplinary Studies | 0 | 0.0% |
| Science & Technology | 50 | 23.5% |
| Business | 21 | 9.9% |
| Education | 92 | 43.2% |
| Literature & Languages | 0 | 0.0% |
| Liberal Arts & History | 1 | 0.5% |
| Visual & Performing Arts | 8 | 3.8% |
| Communications | 12 | 5.6% |
| Arts & Humanities | 6 | 2.8% |
| Total | 213 | 100.0% |
Transportation & Commute in Fairview Ferndale
Vehicle Availability by Sex in Fairview Ferndale
The most prevalent vehicle ownership categories in Fairview Ferndale are males with 2 vehicles (178, accounting for 43.3%) and females with 2 vehicles (205, making up 44.4%).
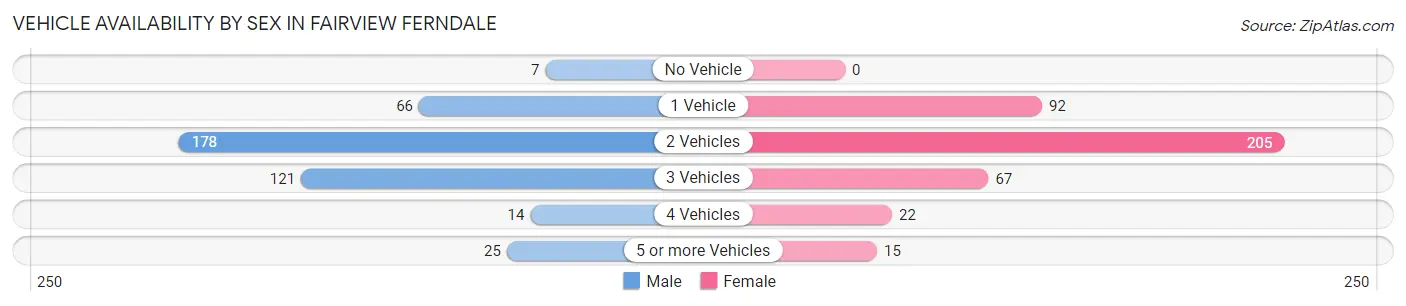
| Vehicles Available | Male | Female |
| No Vehicle | 7 (1.7%) | 0 (0.0%) |
| 1 Vehicle | 66 (16.1%) | 92 (22.9%) |
| 2 Vehicles | 178 (43.3%) | 205 (51.1%) |
| 3 Vehicles | 121 (29.4%) | 67 (16.7%) |
| 4 Vehicles | 14 (3.4%) | 22 (5.5%) |
| 5 or more Vehicles | 25 (6.1%) | 15 (3.7%) |
| Total | 411 (100.0%) | 401 (100.0%) |
Commute Time in Fairview Ferndale
The most frequently occuring commute durations in Fairview Ferndale are 30 to 34 minutes (191 commuters, 24.4%), 20 to 24 minutes (146 commuters, 18.7%), and 45 to 59 minutes (87 commuters, 11.1%).
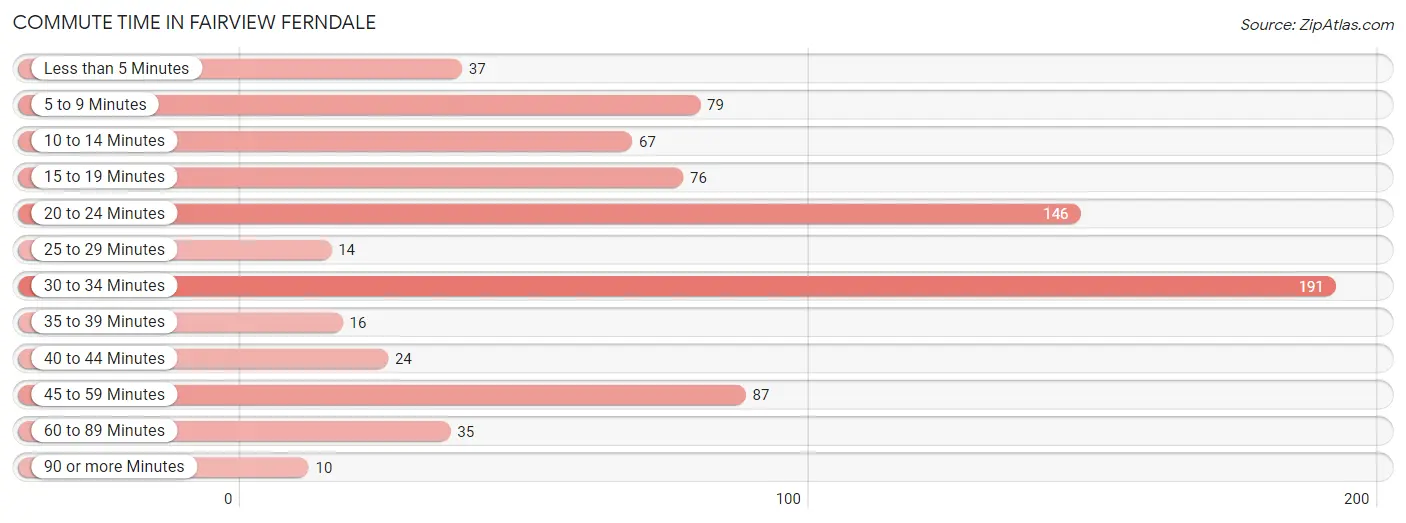
| Commute Time | # Commuters | % Commuters |
| Less than 5 Minutes | 37 | 4.7% |
| 5 to 9 Minutes | 79 | 10.1% |
| 10 to 14 Minutes | 67 | 8.6% |
| 15 to 19 Minutes | 76 | 9.7% |
| 20 to 24 Minutes | 146 | 18.7% |
| 25 to 29 Minutes | 14 | 1.8% |
| 30 to 34 Minutes | 191 | 24.4% |
| 35 to 39 Minutes | 16 | 2.1% |
| 40 to 44 Minutes | 24 | 3.1% |
| 45 to 59 Minutes | 87 | 11.1% |
| 60 to 89 Minutes | 35 | 4.5% |
| 90 or more Minutes | 10 | 1.3% |
Commute Time by Sex in Fairview Ferndale
The most common commute times in Fairview Ferndale are 30 to 34 minutes (101 commuters, 24.9%) for males and 30 to 34 minutes (90 commuters, 23.9%) for females.
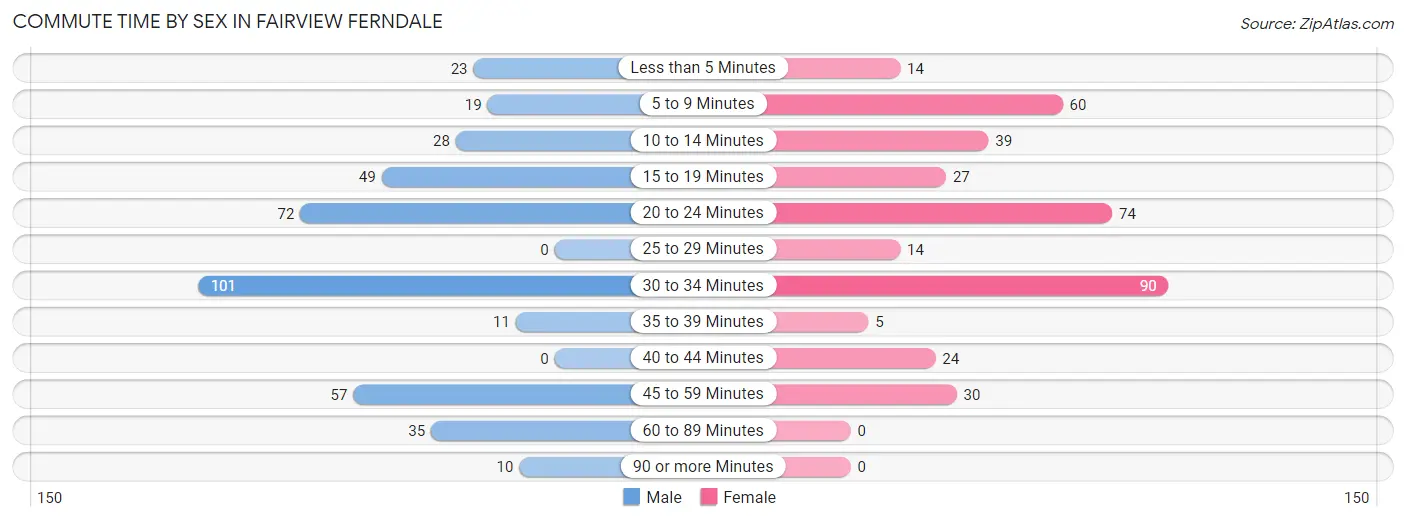
| Commute Time | Male | Female |
| Less than 5 Minutes | 23 (5.7%) | 14 (3.7%) |
| 5 to 9 Minutes | 19 (4.7%) | 60 (15.9%) |
| 10 to 14 Minutes | 28 (6.9%) | 39 (10.3%) |
| 15 to 19 Minutes | 49 (12.1%) | 27 (7.2%) |
| 20 to 24 Minutes | 72 (17.8%) | 74 (19.6%) |
| 25 to 29 Minutes | 0 (0.0%) | 14 (3.7%) |
| 30 to 34 Minutes | 101 (24.9%) | 90 (23.9%) |
| 35 to 39 Minutes | 11 (2.7%) | 5 (1.3%) |
| 40 to 44 Minutes | 0 (0.0%) | 24 (6.4%) |
| 45 to 59 Minutes | 57 (14.1%) | 30 (8.0%) |
| 60 to 89 Minutes | 35 (8.6%) | 0 (0.0%) |
| 90 or more Minutes | 10 (2.5%) | 0 (0.0%) |
Time of Departure to Work by Sex in Fairview Ferndale
The most frequent times of departure to work in Fairview Ferndale are 6:00 AM to 6:29 AM (127, 31.4%) for males and 7:00 AM to 7:29 AM (68, 18.0%) for females.
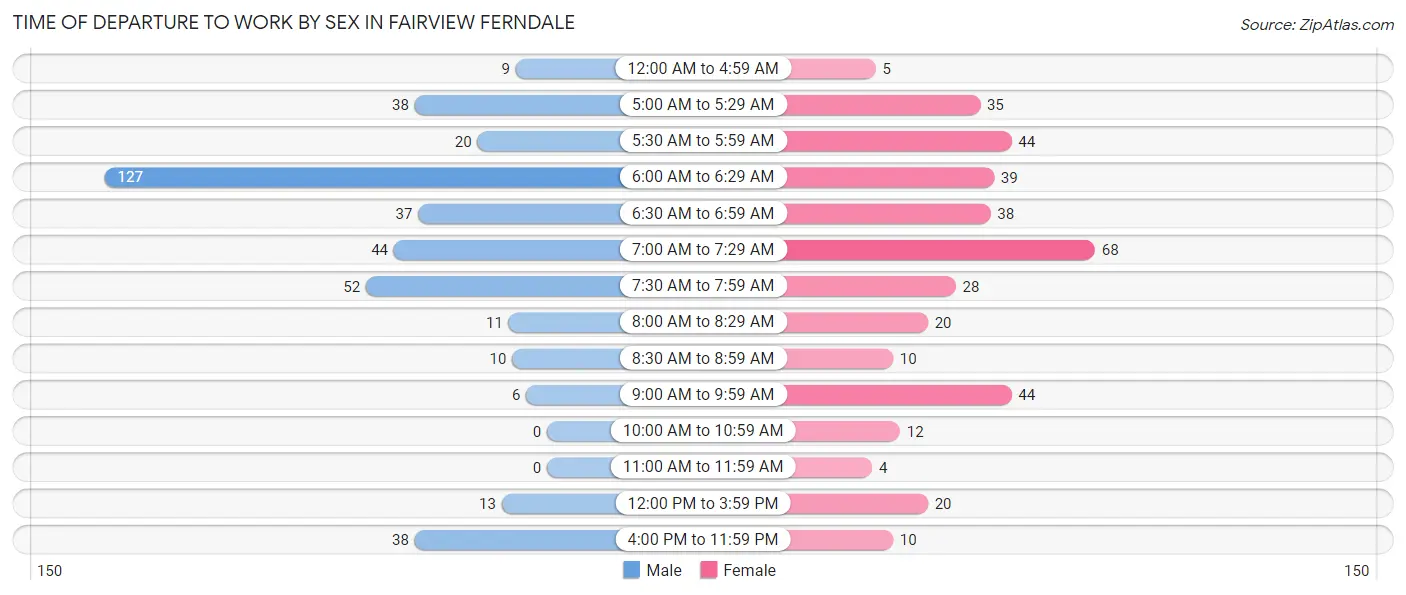
| Time of Departure | Male | Female |
| 12:00 AM to 4:59 AM | 9 (2.2%) | 5 (1.3%) |
| 5:00 AM to 5:29 AM | 38 (9.4%) | 35 (9.3%) |
| 5:30 AM to 5:59 AM | 20 (4.9%) | 44 (11.7%) |
| 6:00 AM to 6:29 AM | 127 (31.4%) | 39 (10.3%) |
| 6:30 AM to 6:59 AM | 37 (9.1%) | 38 (10.1%) |
| 7:00 AM to 7:29 AM | 44 (10.9%) | 68 (18.0%) |
| 7:30 AM to 7:59 AM | 52 (12.8%) | 28 (7.4%) |
| 8:00 AM to 8:29 AM | 11 (2.7%) | 20 (5.3%) |
| 8:30 AM to 8:59 AM | 10 (2.5%) | 10 (2.6%) |
| 9:00 AM to 9:59 AM | 6 (1.5%) | 44 (11.7%) |
| 10:00 AM to 10:59 AM | 0 (0.0%) | 12 (3.2%) |
| 11:00 AM to 11:59 AM | 0 (0.0%) | 4 (1.1%) |
| 12:00 PM to 3:59 PM | 13 (3.2%) | 20 (5.3%) |
| 4:00 PM to 11:59 PM | 38 (9.4%) | 10 (2.6%) |
| Total | 405 (100.0%) | 377 (100.0%) |
Housing Occupancy in Fairview Ferndale
Occupancy by Ownership in Fairview Ferndale
Of the total 1,065 dwellings in Fairview Ferndale, owner-occupied units account for 936 (87.9%), while renter-occupied units make up 129 (12.1%).
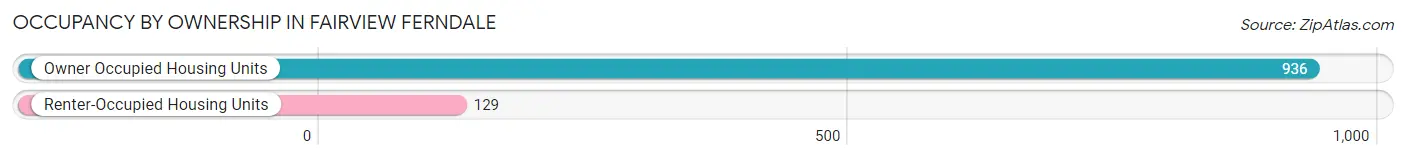
| Occupancy | # Housing Units | % Housing Units |
| Owner Occupied Housing Units | 936 | 87.9% |
| Renter-Occupied Housing Units | 129 | 12.1% |
| Total Occupied Housing Units | 1,065 | 100.0% |
Occupancy by Household Size in Fairview Ferndale
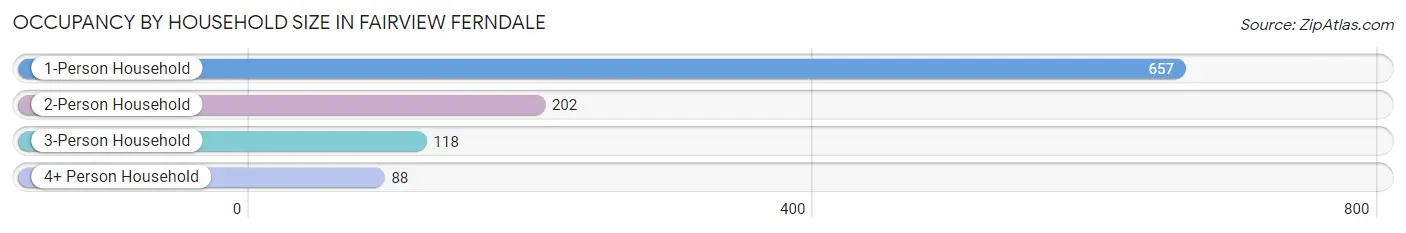
| Household Size | # Housing Units | % Housing Units |
| 1-Person Household | 657 | 61.7% |
| 2-Person Household | 202 | 19.0% |
| 3-Person Household | 118 | 11.1% |
| 4+ Person Household | 88 | 8.3% |
| Total Housing Units | 1,065 | 100.0% |
Occupancy by Ownership by Household Size in Fairview Ferndale
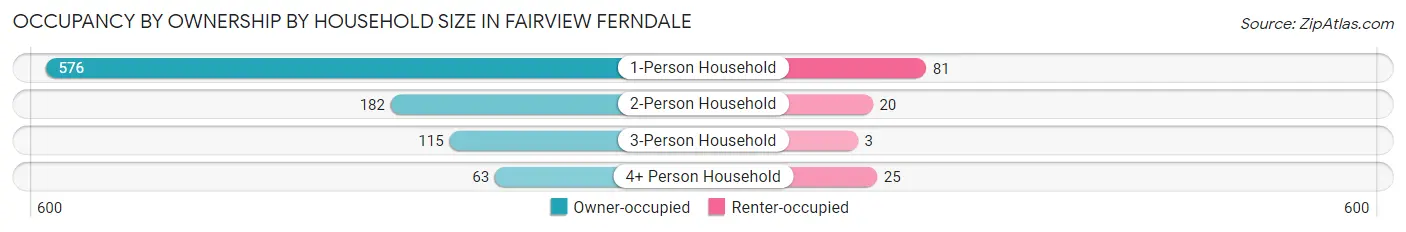
| Household Size | Owner-occupied | Renter-occupied |
| 1-Person Household | 576 (87.7%) | 81 (12.3%) |
| 2-Person Household | 182 (90.1%) | 20 (9.9%) |
| 3-Person Household | 115 (97.5%) | 3 (2.5%) |
| 4+ Person Household | 63 (71.6%) | 25 (28.4%) |
| Total Housing Units | 936 (87.9%) | 129 (12.1%) |
Occupancy by Educational Attainment in Fairview Ferndale
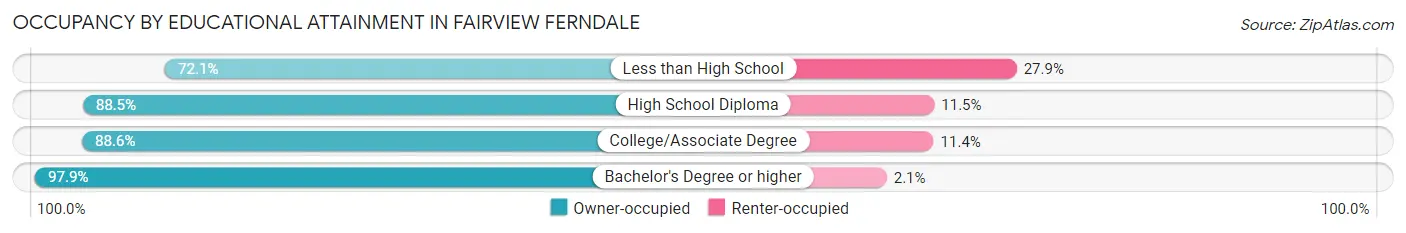
| Household Size | Owner-occupied | Renter-occupied |
| Less than High School | 88 (72.1%) | 34 (27.9%) |
| High School Diploma | 506 (88.5%) | 66 (11.5%) |
| College/Associate Degree | 202 (88.6%) | 26 (11.4%) |
| Bachelor's Degree or higher | 140 (97.9%) | 3 (2.1%) |
Occupancy by Age of Householder in Fairview Ferndale
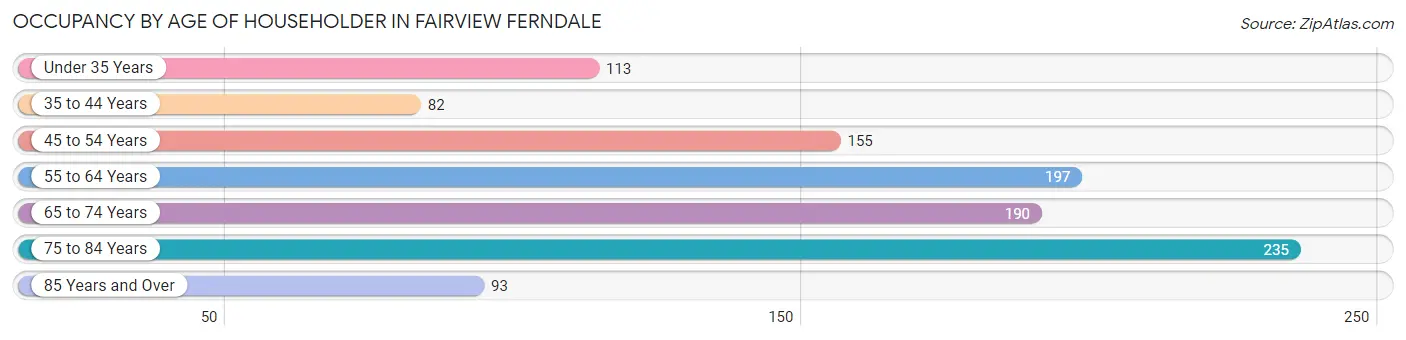
| Age Bracket | # Households | % Households |
| Under 35 Years | 113 | 10.6% |
| 35 to 44 Years | 82 | 7.7% |
| 45 to 54 Years | 155 | 14.5% |
| 55 to 64 Years | 197 | 18.5% |
| 65 to 74 Years | 190 | 17.8% |
| 75 to 84 Years | 235 | 22.1% |
| 85 Years and Over | 93 | 8.7% |
| Total | 1,065 | 100.0% |
Housing Finances in Fairview Ferndale
Median Income by Occupancy in Fairview Ferndale
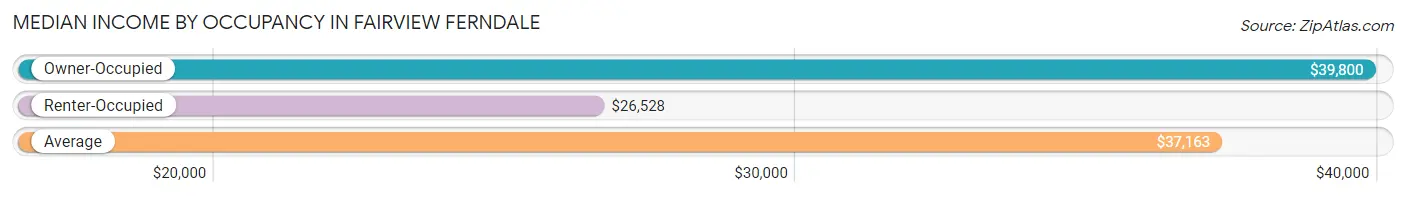
| Occupancy Type | # Households | Median Income |
| Owner-Occupied | 936 (87.9%) | $39,800 |
| Renter-Occupied | 129 (12.1%) | $26,528 |
| Average | 1,065 (100.0%) | $37,163 |
Occupancy by Householder Income Bracket in Fairview Ferndale
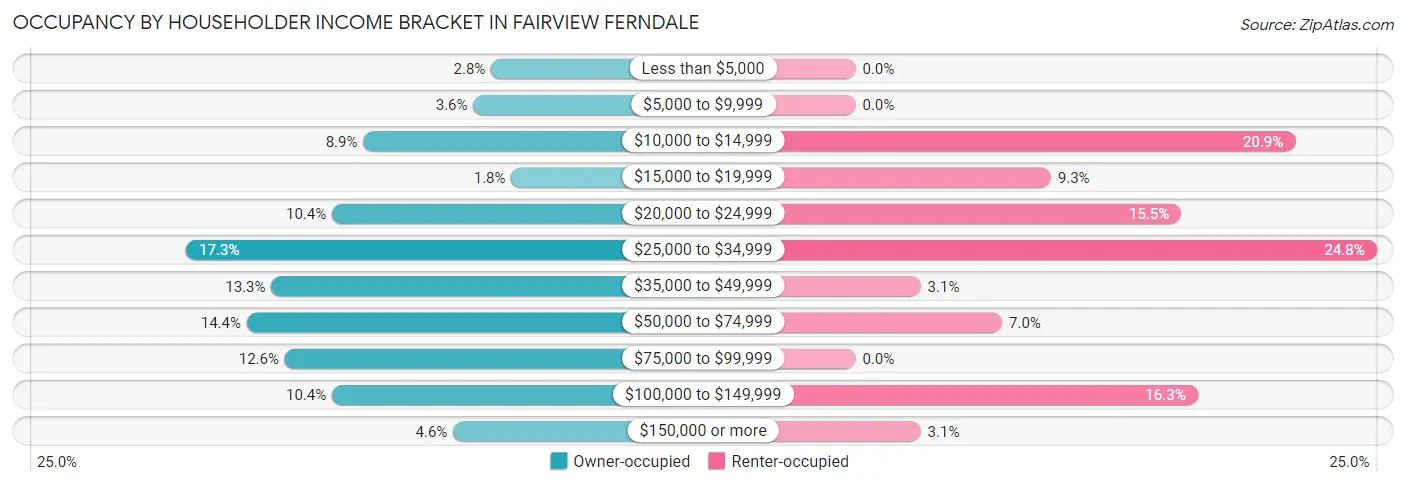
| Income Bracket | Owner-occupied | Renter-occupied |
| Less than $5,000 | 26 (2.8%) | 0 (0.0%) |
| $5,000 to $9,999 | 34 (3.6%) | 0 (0.0%) |
| $10,000 to $14,999 | 83 (8.9%) | 27 (20.9%) |
| $15,000 to $19,999 | 17 (1.8%) | 12 (9.3%) |
| $20,000 to $24,999 | 97 (10.4%) | 20 (15.5%) |
| $25,000 to $34,999 | 162 (17.3%) | 32 (24.8%) |
| $35,000 to $49,999 | 124 (13.3%) | 4 (3.1%) |
| $50,000 to $74,999 | 135 (14.4%) | 9 (7.0%) |
| $75,000 to $99,999 | 118 (12.6%) | 0 (0.0%) |
| $100,000 to $149,999 | 97 (10.4%) | 21 (16.3%) |
| $150,000 or more | 43 (4.6%) | 4 (3.1%) |
| Total | 936 (100.0%) | 129 (100.0%) |
Monthly Housing Cost Tiers in Fairview Ferndale
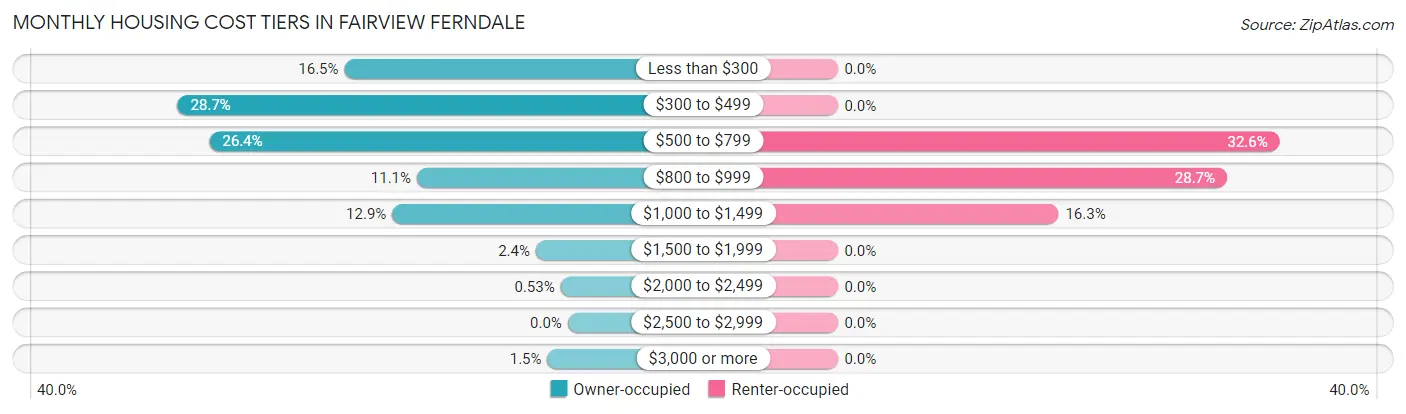
| Monthly Cost | Owner-occupied | Renter-occupied |
| Less than $300 | 154 (16.5%) | 0 (0.0%) |
| $300 to $499 | 269 (28.7%) | 0 (0.0%) |
| $500 to $799 | 247 (26.4%) | 42 (32.6%) |
| $800 to $999 | 104 (11.1%) | 37 (28.7%) |
| $1,000 to $1,499 | 121 (12.9%) | 21 (16.3%) |
| $1,500 to $1,999 | 22 (2.4%) | 0 (0.0%) |
| $2,000 to $2,499 | 5 (0.5%) | 0 (0.0%) |
| $2,500 to $2,999 | 0 (0.0%) | 0 (0.0%) |
| $3,000 or more | 14 (1.5%) | 0 (0.0%) |
| Total | 936 (100.0%) | 129 (100.0%) |
Physical Housing Characteristics in Fairview Ferndale
Housing Structures in Fairview Ferndale
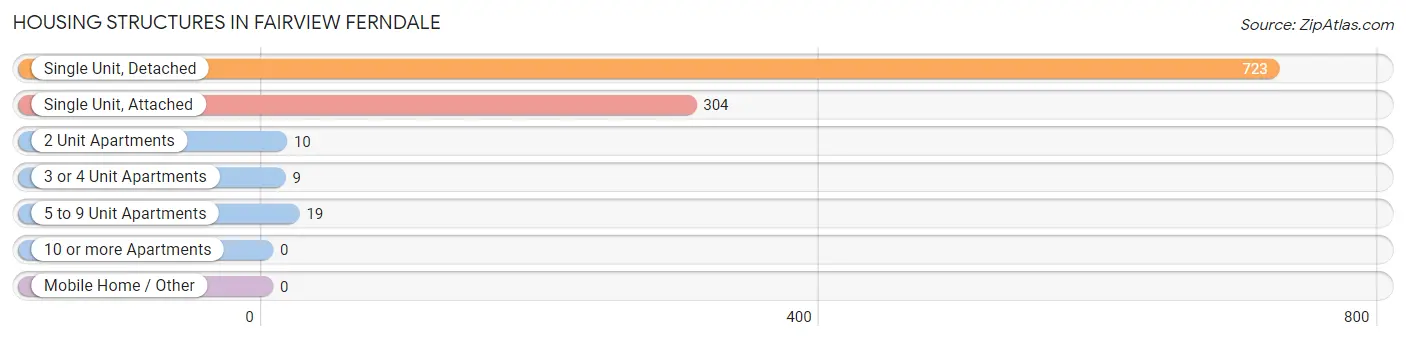
| Structure Type | # Housing Units | % Housing Units |
| Single Unit, Detached | 723 | 67.9% |
| Single Unit, Attached | 304 | 28.5% |
| 2 Unit Apartments | 10 | 0.9% |
| 3 or 4 Unit Apartments | 9 | 0.9% |
| 5 to 9 Unit Apartments | 19 | 1.8% |
| 10 or more Apartments | 0 | 0.0% |
| Mobile Home / Other | 0 | 0.0% |
| Total | 1,065 | 100.0% |
Housing Structures by Occupancy in Fairview Ferndale
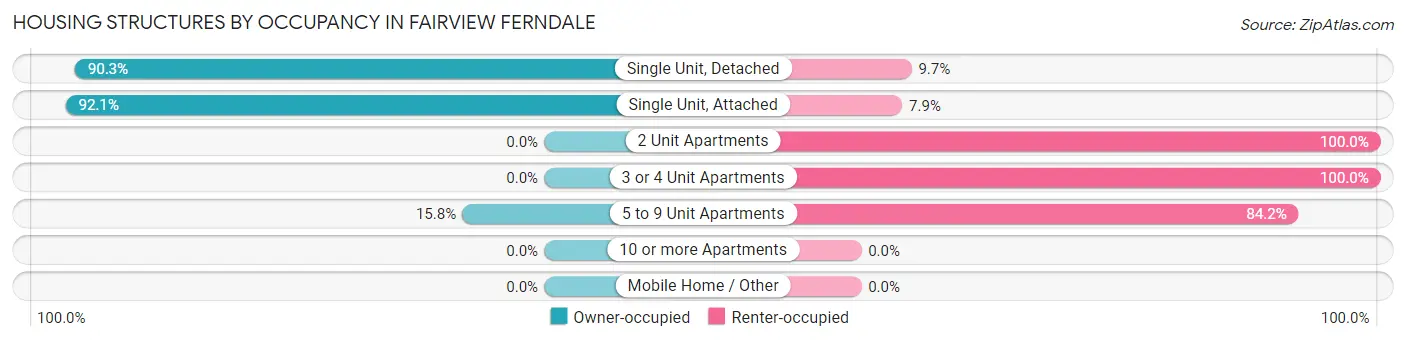
| Structure Type | Owner-occupied | Renter-occupied |
| Single Unit, Detached | 653 (90.3%) | 70 (9.7%) |
| Single Unit, Attached | 280 (92.1%) | 24 (7.9%) |
| 2 Unit Apartments | 0 (0.0%) | 10 (100.0%) |
| 3 or 4 Unit Apartments | 0 (0.0%) | 9 (100.0%) |
| 5 to 9 Unit Apartments | 3 (15.8%) | 16 (84.2%) |
| 10 or more Apartments | 0 (0.0%) | 0 (0.0%) |
| Mobile Home / Other | 0 (0.0%) | 0 (0.0%) |
| Total | 936 (87.9%) | 129 (12.1%) |
Housing Structures by Number of Rooms in Fairview Ferndale
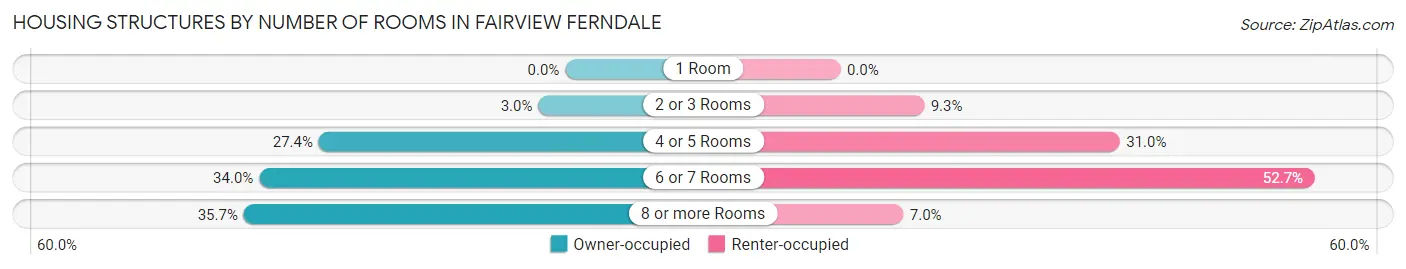
| Number of Rooms | Owner-occupied | Renter-occupied |
| 1 Room | 0 (0.0%) | 0 (0.0%) |
| 2 or 3 Rooms | 28 (3.0%) | 12 (9.3%) |
| 4 or 5 Rooms | 256 (27.4%) | 40 (31.0%) |
| 6 or 7 Rooms | 318 (34.0%) | 68 (52.7%) |
| 8 or more Rooms | 334 (35.7%) | 9 (7.0%) |
| Total | 936 (100.0%) | 129 (100.0%) |
Housing Structure by Heating Type in Fairview Ferndale
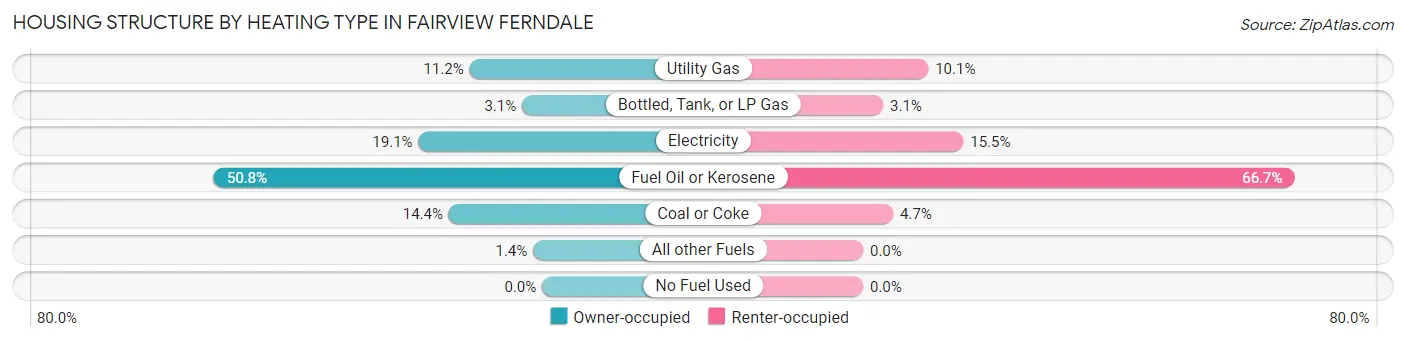
| Heating Type | Owner-occupied | Renter-occupied |
| Utility Gas | 105 (11.2%) | 13 (10.1%) |
| Bottled, Tank, or LP Gas | 29 (3.1%) | 4 (3.1%) |
| Electricity | 179 (19.1%) | 20 (15.5%) |
| Fuel Oil or Kerosene | 475 (50.7%) | 86 (66.7%) |
| Coal or Coke | 135 (14.4%) | 6 (4.6%) |
| All other Fuels | 13 (1.4%) | 0 (0.0%) |
| No Fuel Used | 0 (0.0%) | 0 (0.0%) |
| Total | 936 (100.0%) | 129 (100.0%) |
Household Vehicle Usage in Fairview Ferndale
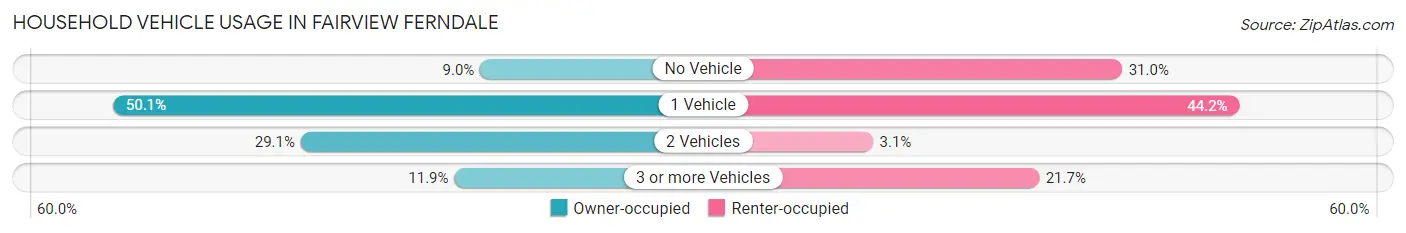
| Vehicles per Household | Owner-occupied | Renter-occupied |
| No Vehicle | 84 (9.0%) | 40 (31.0%) |
| 1 Vehicle | 469 (50.1%) | 57 (44.2%) |
| 2 Vehicles | 272 (29.1%) | 4 (3.1%) |
| 3 or more Vehicles | 111 (11.9%) | 28 (21.7%) |
| Total | 936 (100.0%) | 129 (100.0%) |
Real Estate & Mortgages in Fairview Ferndale
Real Estate and Mortgage Overview in Fairview Ferndale
| Characteristic | Without Mortgage | With Mortgage |
| Housing Units | 585 | 351 |
| Median Property Value | $63,000 | $70,300 |
| Median Household Income | $26,305 | $39 |
| Monthly Housing Costs | $406 | $14 |
| Real Estate Taxes | $933 | $5 |
Property Value by Mortgage Status in Fairview Ferndale
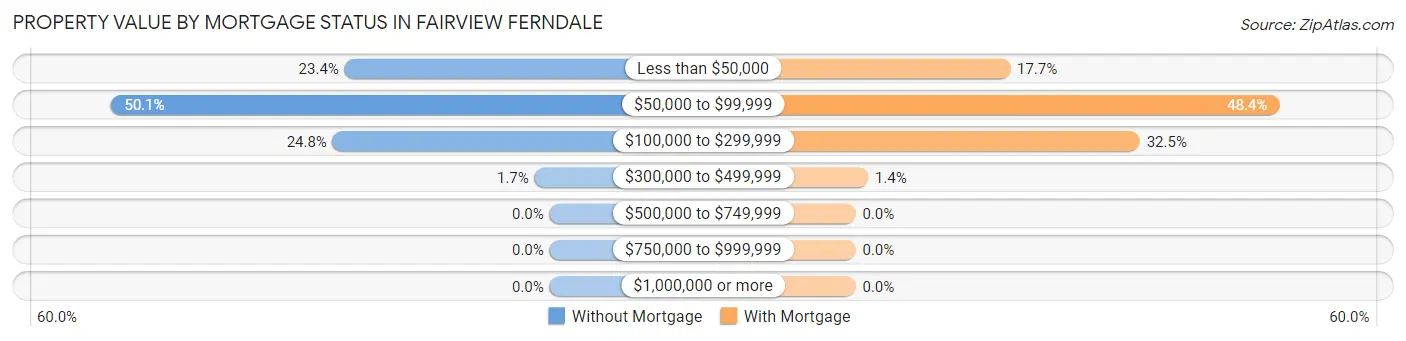
| Property Value | Without Mortgage | With Mortgage |
| Less than $50,000 | 137 (23.4%) | 62 (17.7%) |
| $50,000 to $99,999 | 293 (50.1%) | 170 (48.4%) |
| $100,000 to $299,999 | 145 (24.8%) | 114 (32.5%) |
| $300,000 to $499,999 | 10 (1.7%) | 5 (1.4%) |
| $500,000 to $749,999 | 0 (0.0%) | 0 (0.0%) |
| $750,000 to $999,999 | 0 (0.0%) | 0 (0.0%) |
| $1,000,000 or more | 0 (0.0%) | 0 (0.0%) |
| Total | 585 (100.0%) | 351 (100.0%) |
Household Income by Mortgage Status in Fairview Ferndale
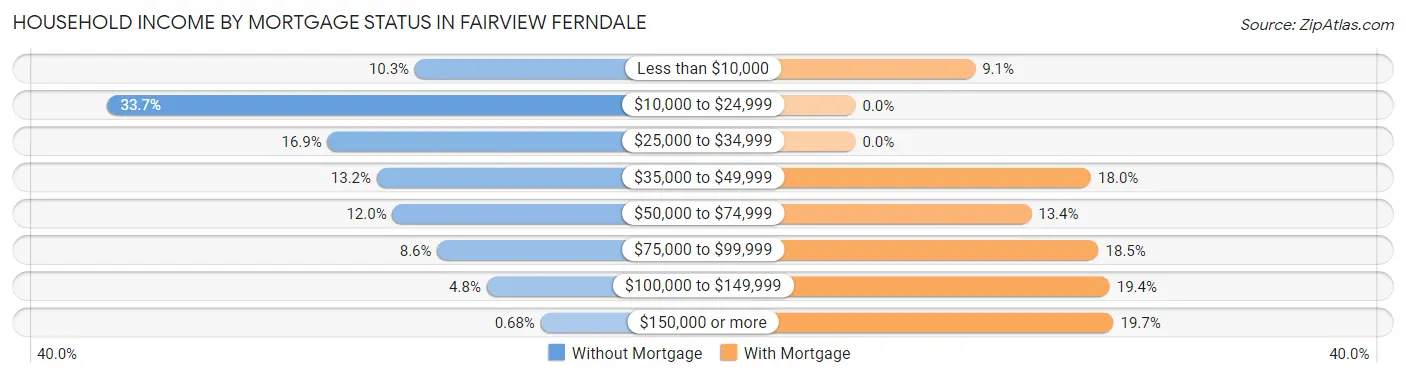
| Household Income | Without Mortgage | With Mortgage |
| Less than $10,000 | 60 (10.3%) | 32 (9.1%) |
| $10,000 to $24,999 | 197 (33.7%) | 0 (0.0%) |
| $25,000 to $34,999 | 99 (16.9%) | 0 (0.0%) |
| $35,000 to $49,999 | 77 (13.2%) | 63 (17.9%) |
| $50,000 to $74,999 | 70 (12.0%) | 47 (13.4%) |
| $75,000 to $99,999 | 50 (8.6%) | 65 (18.5%) |
| $100,000 to $149,999 | 28 (4.8%) | 68 (19.4%) |
| $150,000 or more | 4 (0.7%) | 69 (19.7%) |
| Total | 585 (100.0%) | 351 (100.0%) |
Property Value to Household Income Ratio in Fairview Ferndale
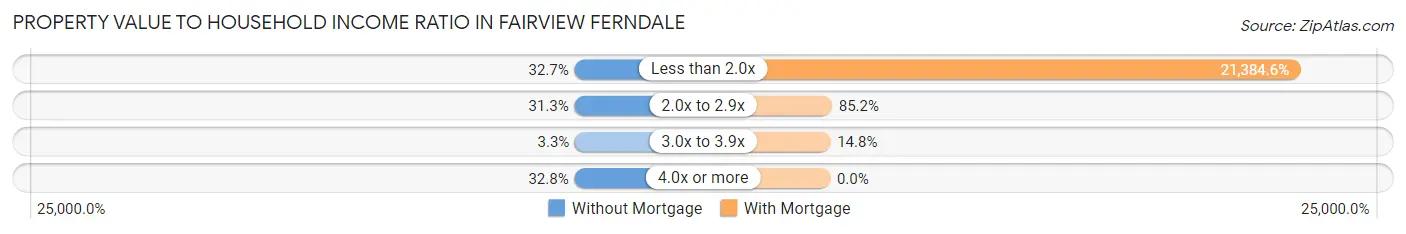
| Value-to-Income Ratio | Without Mortgage | With Mortgage |
| Less than 2.0x | 191 (32.7%) | 75,060 (21,384.6%) |
| 2.0x to 2.9x | 183 (31.3%) | 299 (85.2%) |
| 3.0x to 3.9x | 19 (3.3%) | 52 (14.8%) |
| 4.0x or more | 192 (32.8%) | 0 (0.0%) |
| Total | 585 (100.0%) | 351 (100.0%) |
Real Estate Taxes by Mortgage Status in Fairview Ferndale
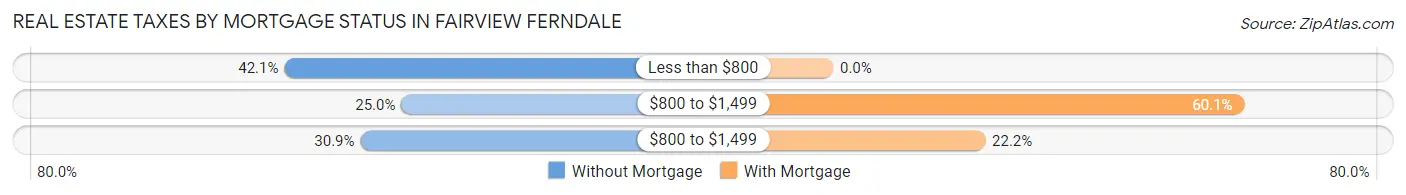
| Property Taxes | Without Mortgage | With Mortgage |
| Less than $800 | 246 (42.0%) | 0 (0.0%) |
| $800 to $1,499 | 146 (25.0%) | 211 (60.1%) |
| $800 to $1,499 | 181 (30.9%) | 78 (22.2%) |
| Total | 585 (100.0%) | 351 (100.0%) |
Health & Disability in Fairview Ferndale
Health Insurance Coverage by Age in Fairview Ferndale
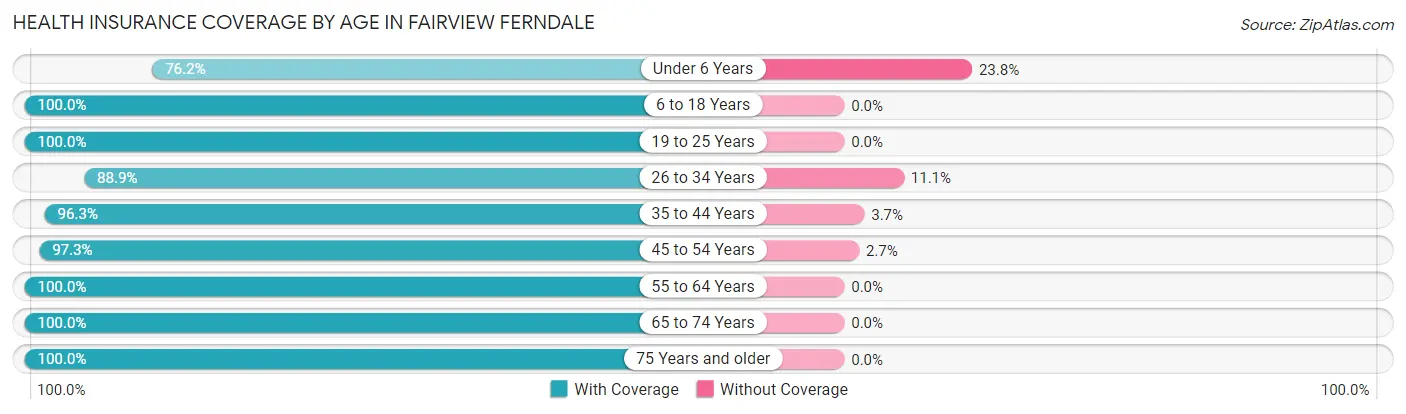
| Age Bracket | With Coverage | Without Coverage |
| Under 6 Years | 80 (76.2%) | 25 (23.8%) |
| 6 to 18 Years | 142 (100.0%) | 0 (0.0%) |
| 19 to 25 Years | 57 (100.0%) | 0 (0.0%) |
| 26 to 34 Years | 192 (88.9%) | 24 (11.1%) |
| 35 to 44 Years | 155 (96.3%) | 6 (3.7%) |
| 45 to 54 Years | 249 (97.3%) | 7 (2.7%) |
| 55 to 64 Years | 316 (100.0%) | 0 (0.0%) |
| 65 to 74 Years | 238 (100.0%) | 0 (0.0%) |
| 75 Years and older | 346 (100.0%) | 0 (0.0%) |
| Total | 1,775 (96.6%) | 62 (3.4%) |
Health Insurance Coverage by Citizenship Status in Fairview Ferndale
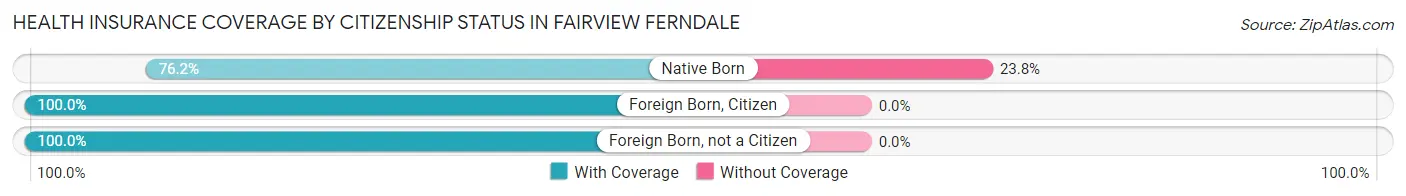
| Citizenship Status | With Coverage | Without Coverage |
| Native Born | 80 (76.2%) | 25 (23.8%) |
| Foreign Born, Citizen | 142 (100.0%) | 0 (0.0%) |
| Foreign Born, not a Citizen | 57 (100.0%) | 0 (0.0%) |
Health Insurance Coverage by Household Income in Fairview Ferndale
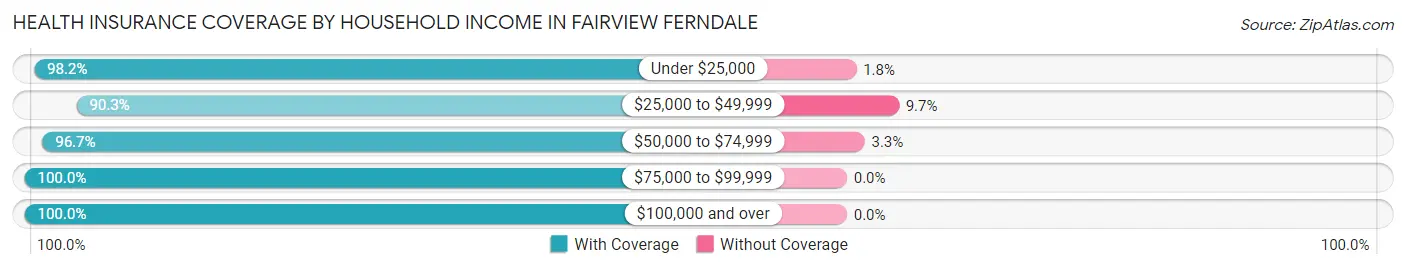
| Household Income | With Coverage | Without Coverage |
| Under $25,000 | 333 (98.2%) | 6 (1.8%) |
| $25,000 to $49,999 | 446 (90.3%) | 48 (9.7%) |
| $50,000 to $74,999 | 233 (96.7%) | 8 (3.3%) |
| $75,000 to $99,999 | 221 (100.0%) | 0 (0.0%) |
| $100,000 and over | 535 (100.0%) | 0 (0.0%) |
Public vs Private Health Insurance Coverage by Age in Fairview Ferndale
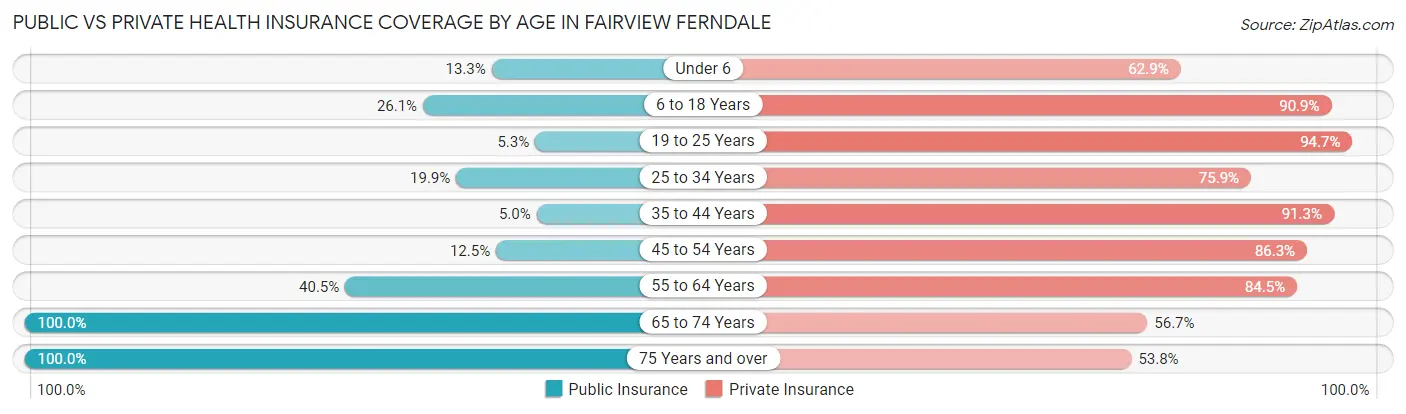
| Age Bracket | Public Insurance | Private Insurance |
| Under 6 | 14 (13.3%) | 66 (62.9%) |
| 6 to 18 Years | 37 (26.1%) | 129 (90.8%) |
| 19 to 25 Years | 3 (5.3%) | 54 (94.7%) |
| 25 to 34 Years | 43 (19.9%) | 164 (75.9%) |
| 35 to 44 Years | 8 (5.0%) | 147 (91.3%) |
| 45 to 54 Years | 32 (12.5%) | 221 (86.3%) |
| 55 to 64 Years | 128 (40.5%) | 267 (84.5%) |
| 65 to 74 Years | 238 (100.0%) | 135 (56.7%) |
| 75 Years and over | 346 (100.0%) | 186 (53.8%) |
| Total | 849 (46.2%) | 1,369 (74.5%) |
Disability Status by Sex by Age in Fairview Ferndale

| Age Bracket | Male | Female |
| Under 5 Years | 0 (0.0%) | 0 (0.0%) |
| 5 to 17 Years | 13 (15.3%) | 11 (15.9%) |
| 18 to 34 Years | 12 (8.6%) | 0 (0.0%) |
| 35 to 64 Years | 107 (27.2%) | 67 (19.7%) |
| 65 to 74 Years | 61 (42.7%) | 46 (48.4%) |
| 75 Years and over | 19 (19.4%) | 144 (58.1%) |
Disability Class by Sex by Age in Fairview Ferndale
Disability Class: Hearing Difficulty
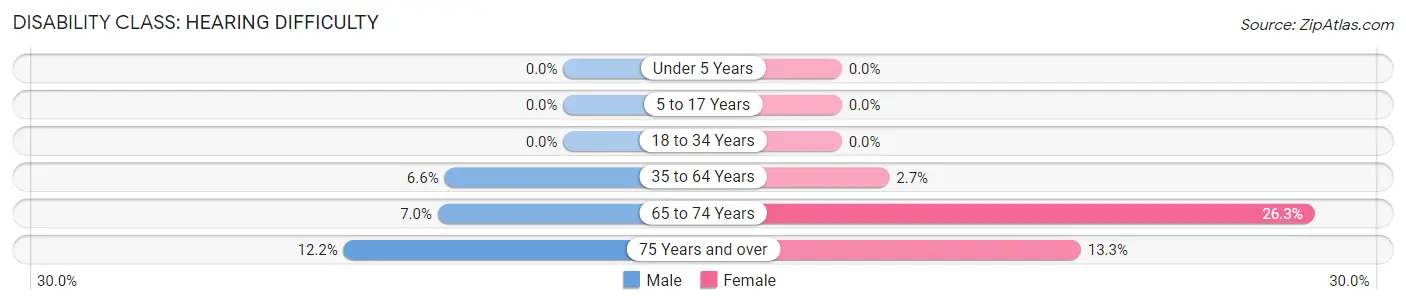
| Age Bracket | Male | Female |
| Under 5 Years | 0 (0.0%) | 0 (0.0%) |
| 5 to 17 Years | 0 (0.0%) | 0 (0.0%) |
| 18 to 34 Years | 0 (0.0%) | 0 (0.0%) |
| 35 to 64 Years | 26 (6.6%) | 9 (2.6%) |
| 65 to 74 Years | 10 (7.0%) | 25 (26.3%) |
| 75 Years and over | 12 (12.2%) | 33 (13.3%) |
Disability Class: Vision Difficulty
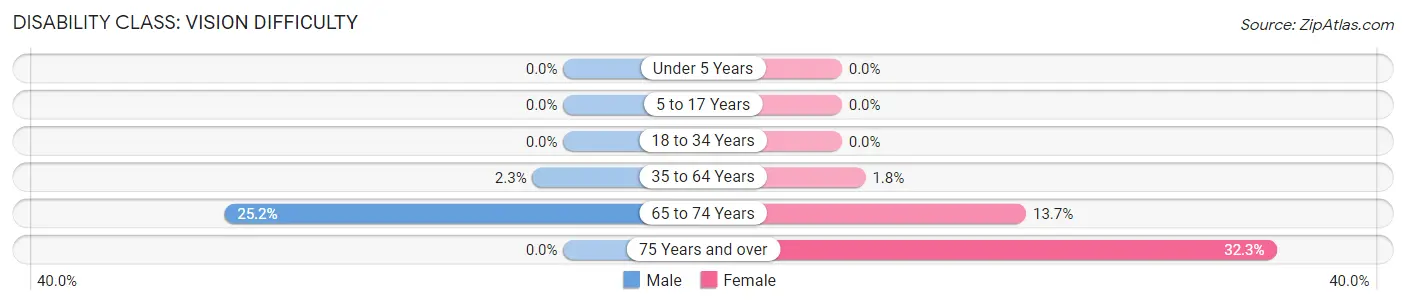
| Age Bracket | Male | Female |
| Under 5 Years | 0 (0.0%) | 0 (0.0%) |
| 5 to 17 Years | 0 (0.0%) | 0 (0.0%) |
| 18 to 34 Years | 0 (0.0%) | 0 (0.0%) |
| 35 to 64 Years | 9 (2.3%) | 6 (1.8%) |
| 65 to 74 Years | 36 (25.2%) | 13 (13.7%) |
| 75 Years and over | 0 (0.0%) | 80 (32.3%) |
Disability Class: Cognitive Difficulty
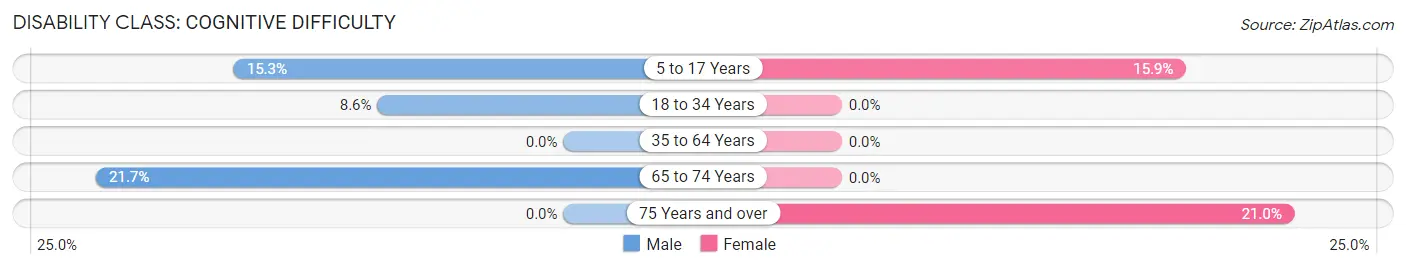
| Age Bracket | Male | Female |
| 5 to 17 Years | 13 (15.3%) | 11 (15.9%) |
| 18 to 34 Years | 12 (8.6%) | 0 (0.0%) |
| 35 to 64 Years | 0 (0.0%) | 0 (0.0%) |
| 65 to 74 Years | 31 (21.7%) | 0 (0.0%) |
| 75 Years and over | 0 (0.0%) | 52 (21.0%) |
Disability Class: Ambulatory Difficulty
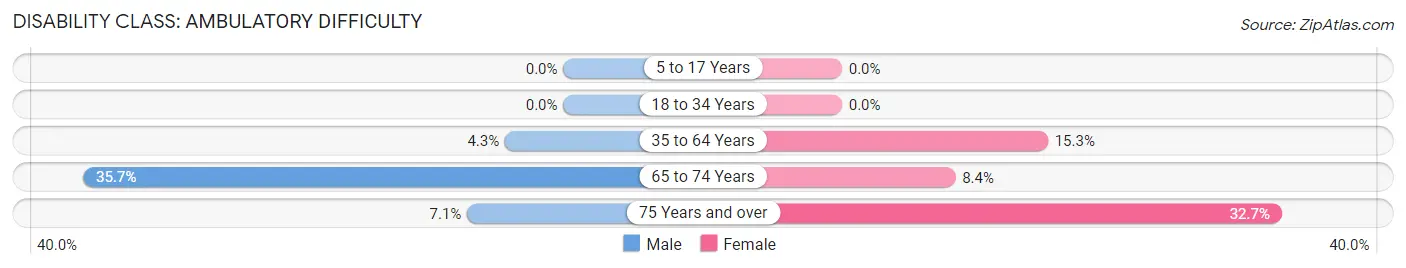
| Age Bracket | Male | Female |
| 5 to 17 Years | 0 (0.0%) | 0 (0.0%) |
| 18 to 34 Years | 0 (0.0%) | 0 (0.0%) |
| 35 to 64 Years | 17 (4.3%) | 52 (15.3%) |
| 65 to 74 Years | 51 (35.7%) | 8 (8.4%) |
| 75 Years and over | 7 (7.1%) | 81 (32.7%) |
Disability Class: Self-Care Difficulty
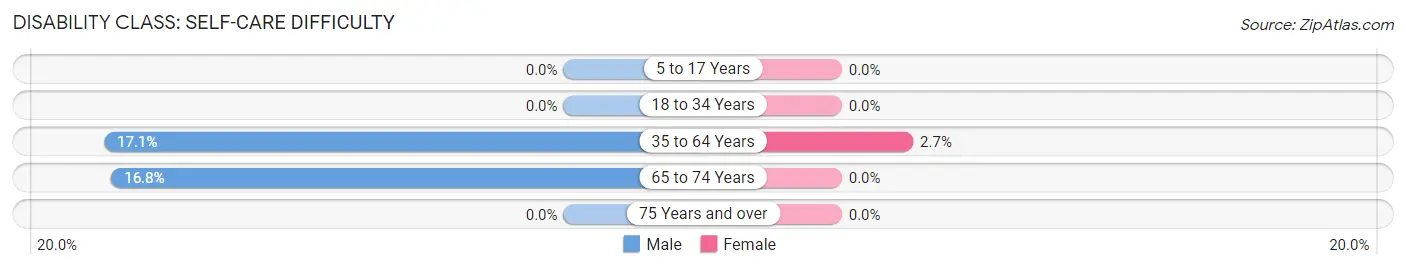
| Age Bracket | Male | Female |
| 5 to 17 Years | 0 (0.0%) | 0 (0.0%) |
| 18 to 34 Years | 0 (0.0%) | 0 (0.0%) |
| 35 to 64 Years | 67 (17.1%) | 9 (2.6%) |
| 65 to 74 Years | 24 (16.8%) | 0 (0.0%) |
| 75 Years and over | 0 (0.0%) | 0 (0.0%) |
Technology Access in Fairview Ferndale
Computing Device Access in Fairview Ferndale
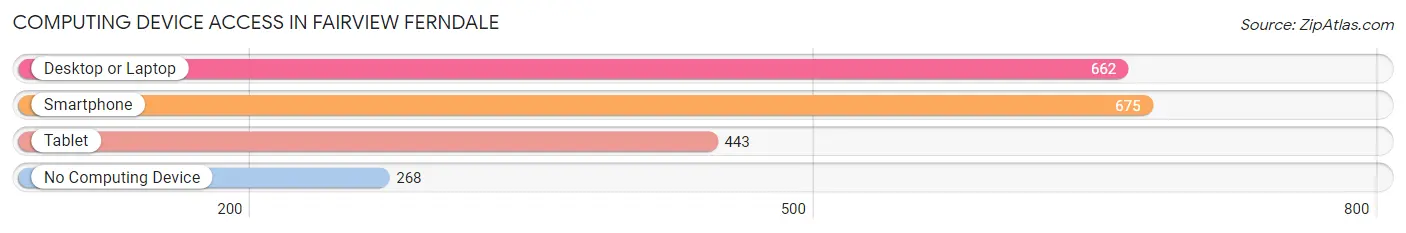
| Device Type | # Households | % Households |
| Desktop or Laptop | 662 | 62.2% |
| Smartphone | 675 | 63.4% |
| Tablet | 443 | 41.6% |
| No Computing Device | 268 | 25.2% |
| Total | 1,065 | 100.0% |
Internet Access in Fairview Ferndale

| Internet Type | # Households | % Households |
| Dial-Up Internet | 0 | 0.0% |
| Broadband Home | 668 | 62.7% |
| Cellular Data Only | 61 | 5.7% |
| Satellite Internet | 25 | 2.4% |
| No Internet | 309 | 29.0% |
| Total | 1,065 | 100.0% |
Fairview Ferndale Summary
History
The small town of Fairview Ferndale, Pennsylvania is located in the Lehigh Valley region of the state. It is situated in the northern part of Northampton County, about 10 miles north of the city of Allentown. The town was first settled in the late 1700s by German immigrants who were attracted to the area by its fertile soil and abundant natural resources. The town was originally known as “Ferndale”, but was later changed to “Fairview Ferndale” in 1876.
The town was originally a farming community, but in the late 1800s, the town began to industrialize. The first industry to come to the area was a silk mill, which was established in 1883. This was followed by a paper mill in 1887 and a brickyard in 1889. These industries provided employment for many of the town’s residents and helped to spur economic growth.
In the early 1900s, the town began to experience a population boom as more people moved to the area to take advantage of the economic opportunities. This growth continued until the Great Depression, when the town’s population began to decline. The population has since stabilized and the town has experienced a resurgence in recent years.
Geography
Fairview Ferndale is located in the northern part of Northampton County, about 10 miles north of the city of Allentown. The town is situated in the Lehigh Valley region of the state, which is characterized by rolling hills and fertile farmland. The town is bordered by the towns of Moore Township to the north, Bushkill Township to the east, and Lower Nazareth Township to the south.
The town is situated on the banks of the Lehigh River, which provides a scenic backdrop for the town. The river is a popular spot for fishing, boating, and other recreational activities. The town is also home to several parks, including the Fairview Ferndale Community Park, which features a playground, picnic area, and walking trails.
Economy
Fairview Ferndale is a small town with a population of just over 2,000 people. The town’s economy is largely based on agriculture and light manufacturing. The town is home to several small businesses, including a grocery store, a hardware store, and a few restaurants.
The town is also home to several industrial parks, which provide employment for many of the town’s residents. The largest employer in the town is the Fairview Ferndale Industrial Park, which is home to several manufacturing companies. The park is also home to a number of warehouses and distribution centers.
Demographics
As of the 2010 census, the population of Fairview Ferndale was 2,072. The town has a median age of 44.7 years, with a gender ratio of 49.3% male and 50.7% female. The racial makeup of the town is 94.2% White, 2.2% African American, 0.7% Asian, 0.3% Native American, and 2.6% other.
The town has a median household income of $50,945, with a poverty rate of 8.3%. The town’s unemployment rate is 4.2%. The town is served by the Easton Area School District, which includes two elementary schools, one middle school, and one high school. The town is also home to several churches, including the Fairview Ferndale United Methodist Church.
Common Questions
What is the Total Population of Fairview Ferndale?
Total Population of Fairview Ferndale is 1,837.
What is the Total Male Population of Fairview Ferndale?
Total Male Population of Fairview Ferndale is 906.
What is the Total Female Population of Fairview Ferndale?
Total Female Population of Fairview Ferndale is 931.
What is the Ratio of Males per 100 Females in Fairview Ferndale?
There are 97.31 Males per 100 Females in Fairview Ferndale.
What is the Ratio of Females per 100 Males in Fairview Ferndale?
There are 102.76 Females per 100 Males in Fairview Ferndale.
What is the Median Population Age in Fairview Ferndale?
Median Population Age in Fairview Ferndale is 54.5 Years.
What is the Average Family Size in Fairview Ferndale
Average Family Size in Fairview Ferndale is 2.8 People.
What is the Average Household Size in Fairview Ferndale
Average Household Size in Fairview Ferndale is 1.7 People.
What is Per Capita Income in Fairview Ferndale?
Per Capita income in Fairview Ferndale is $32,313.
What is the Median Family Income in Fairview Ferndale?
Median Family Income in Fairview Ferndale is $72,386.
What is the Median Household income in Fairview Ferndale?
Median Household Income in Fairview Ferndale is $37,163.
What is Income or Wage Gap in Fairview Ferndale?
Income or Wage Gap in Fairview Ferndale is 32.4%.
Women in Fairview Ferndale earn 67.6 cents for every dollar earned by a man.
What is Inequality or Gini Index in Fairview Ferndale?
Inequality or Gini Index in Fairview Ferndale is 0.44.
How Large is the Labor Force in Fairview Ferndale?
There are 883 People in the Labor Forcein in Fairview Ferndale.
What is the Percentage of People in the Labor Force in Fairview Ferndale?
54.8% of People are in the Labor Force in Fairview Ferndale.
What is the Unemployment Rate in Fairview Ferndale?
Unemployment Rate in Fairview Ferndale is 5.7%.