Exeter borough, PA
Exeter borough Overview
5,509
TOTAL POPULATION
2,724
MALE POPULATION
2,785
FEMALE POPULATION
97.81
MALES / 100 FEMALES
102.24
FEMALES / 100 MALES
50.9
MEDIAN AGE
2.9
AVG FAMILY SIZE
2.2
AVG HOUSEHOLD SIZE
$36,842
PER CAPITA INCOME
$72,054
AVG FAMILY INCOME
$60,463
AVG HOUSEHOLD INCOME
52.4%
WAGE / INCOME GAP [ % ]
47.6¢/ $1
WAGE / INCOME GAP [ $ ]
0.42
INEQUALITY / GINI INDEX
2,618
LABOR FORCE [ PEOPLE ]
56.4%
PERCENT IN LABOR FORCE
2.8%
UNEMPLOYMENT RATE
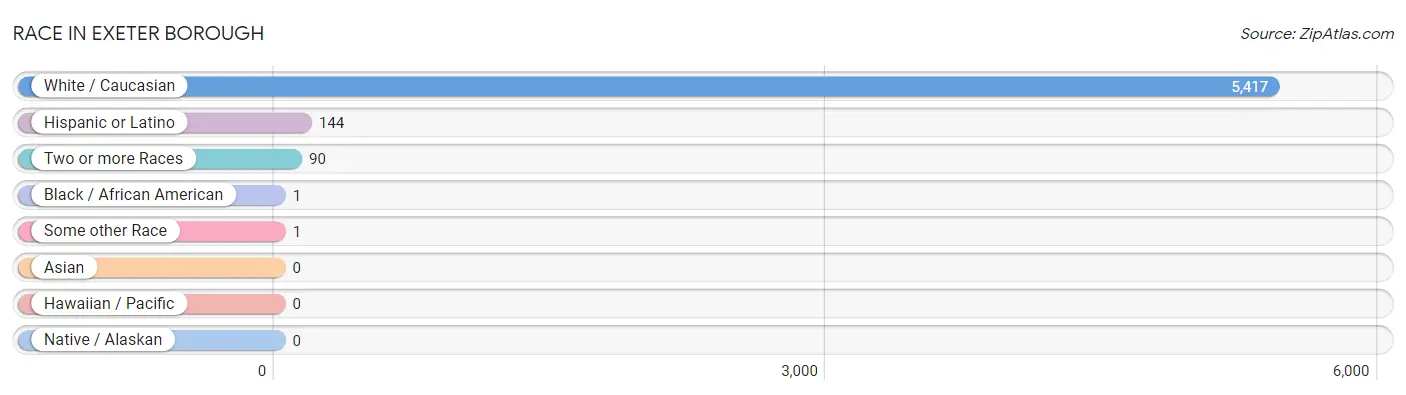
Race in Exeter borough
The most populous races in Exeter borough are White / Caucasian (5,417 | 98.3%), Hispanic or Latino (144 | 2.6%), and Two or more Races (90 | 1.6%).
| Race | # Population | % Population |
| Asian | 0 | 0.0% |
| Black / African American | 1 | 0.0% |
| Hawaiian / Pacific | 0 | 0.0% |
| Hispanic or Latino | 144 | 2.6% |
| Native / Alaskan | 0 | 0.0% |
| White / Caucasian | 5,417 | 98.3% |
| Two or more Races | 90 | 1.6% |
| Some other Race | 1 | 0.0% |
| Total | 5,509 | 100.0% |
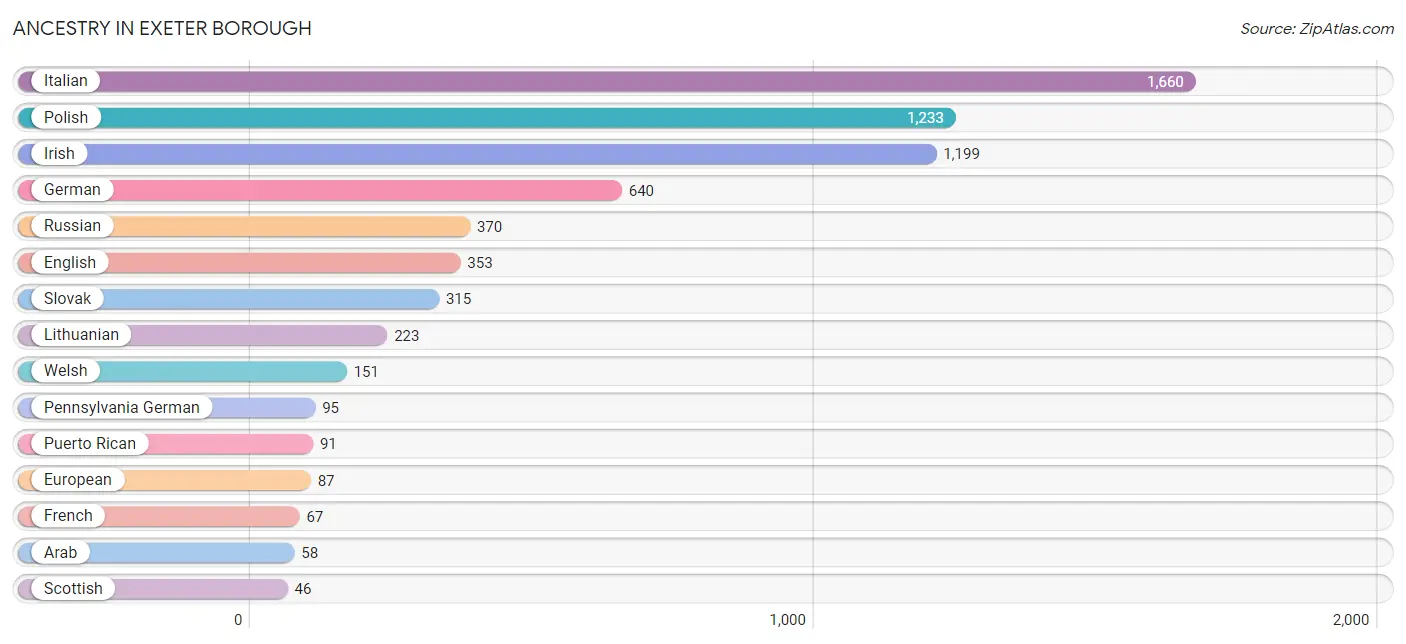
Ancestry in Exeter borough
The most populous ancestries reported in Exeter borough are Italian (1,660 | 30.1%), Polish (1,233 | 22.4%), Irish (1,199 | 21.8%), German (640 | 11.6%), and Russian (370 | 6.7%), together accounting for 92.6% of all Exeter borough residents.
| Ancestry | # Population | % Population |
| American | 41 | 0.7% |
| Arab | 58 | 1.1% |
| British | 18 | 0.3% |
| Cuban | 2 | 0.0% |
| Czechoslovakian | 19 | 0.3% |
| Dutch | 10 | 0.2% |
| Eastern European | 11 | 0.2% |
| English | 353 | 6.4% |
| European | 87 | 1.6% |
| French | 67 | 1.2% |
| German | 640 | 11.6% |
| Iranian | 17 | 0.3% |
| Irish | 1,199 | 21.8% |
| Italian | 1,660 | 30.1% |
| Lebanese | 26 | 0.5% |
| Lithuanian | 223 | 4.1% |
| Pennsylvania German | 95 | 1.7% |
| Polish | 1,233 | 22.4% |
| Puerto Rican | 91 | 1.7% |
| Russian | 370 | 6.7% |
| Scandinavian | 43 | 0.8% |
| Scottish | 46 | 0.8% |
| Slovak | 315 | 5.7% |
| Swedish | 1 | 0.0% |
| Syrian | 32 | 0.6% |
| Welsh | 151 | 2.7% | View All 26 Rows |
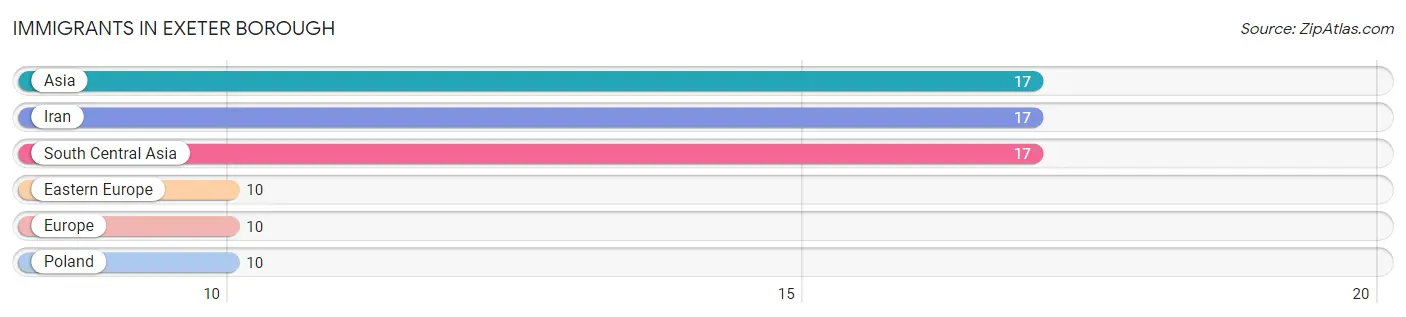
Immigrants in Exeter borough
The most numerous immigrant groups reported in Exeter borough came from Asia (17 | 0.3%), Iran (17 | 0.3%), South Central Asia (17 | 0.3%), Eastern Europe (10 | 0.2%), and Europe (10 | 0.2%), together accounting for 1.3% of all Exeter borough residents.
| Immigration Origin | # Population | % Population |
| Asia | 17 | 0.3% |
| Eastern Europe | 10 | 0.2% |
| Europe | 10 | 0.2% |
| Iran | 17 | 0.3% |
| Poland | 10 | 0.2% |
| South Central Asia | 17 | 0.3% | View All 6 Rows |
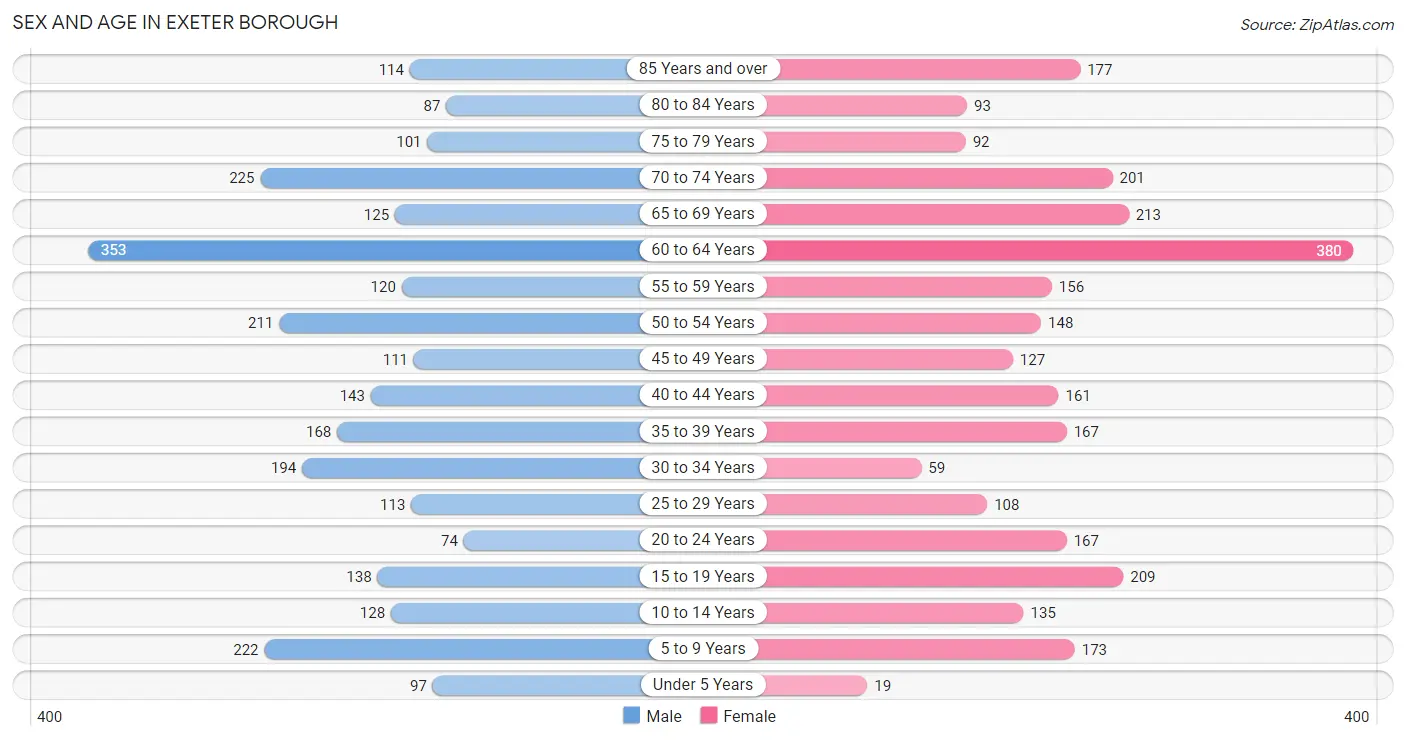
Sex and Age in Exeter borough
Sex and Age in Exeter borough
The most populous age groups in Exeter borough are 60 to 64 Years (353 | 13.0%) for men and 60 to 64 Years (380 | 13.6%) for women.
| Age Bracket | Male | Female |
| Under 5 Years | 97 (3.6%) | 19 (0.7%) |
| 5 to 9 Years | 222 (8.2%) | 173 (6.2%) |
| 10 to 14 Years | 128 (4.7%) | 135 (4.9%) |
| 15 to 19 Years | 138 (5.1%) | 209 (7.5%) |
| 20 to 24 Years | 74 (2.7%) | 167 (6.0%) |
| 25 to 29 Years | 113 (4.2%) | 108 (3.9%) |
| 30 to 34 Years | 194 (7.1%) | 59 (2.1%) |
| 35 to 39 Years | 168 (6.2%) | 167 (6.0%) |
| 40 to 44 Years | 143 (5.2%) | 161 (5.8%) |
| 45 to 49 Years | 111 (4.1%) | 127 (4.6%) |
| 50 to 54 Years | 211 (7.7%) | 148 (5.3%) |
| 55 to 59 Years | 120 (4.4%) | 156 (5.6%) |
| 60 to 64 Years | 353 (13.0%) | 380 (13.6%) |
| 65 to 69 Years | 125 (4.6%) | 213 (7.6%) |
| 70 to 74 Years | 225 (8.3%) | 201 (7.2%) |
| 75 to 79 Years | 101 (3.7%) | 92 (3.3%) |
| 80 to 84 Years | 87 (3.2%) | 93 (3.3%) |
| 85 Years and over | 114 (4.2%) | 177 (6.4%) |
| Total | 2,724 (100.0%) | 2,785 (100.0%) |
Families and Households in Exeter borough
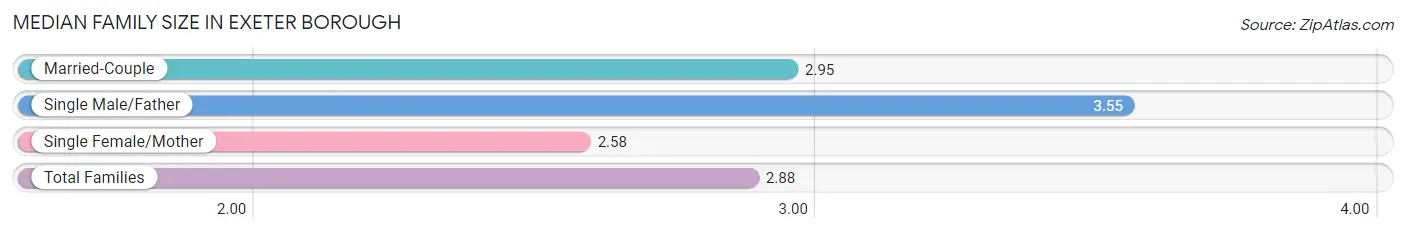
Median Family Size in Exeter borough
The median family size in Exeter borough is 2.88 persons per family, with single male/father families (89 | 6.7%) accounting for the largest median family size of 3.55 persons per family. On the other hand, single female/mother families (399 | 30.0%) represent the smallest median family size with 2.58 persons per family.
| Family Type | # Families | Family Size |
| Married-Couple | 843 (63.3%) | 2.95 |
| Single Male/Father | 89 (6.7%) | 3.55 |
| Single Female/Mother | 399 (30.0%) | 2.58 |
| Total Families | 1,331 (100.0%) | 2.88 |
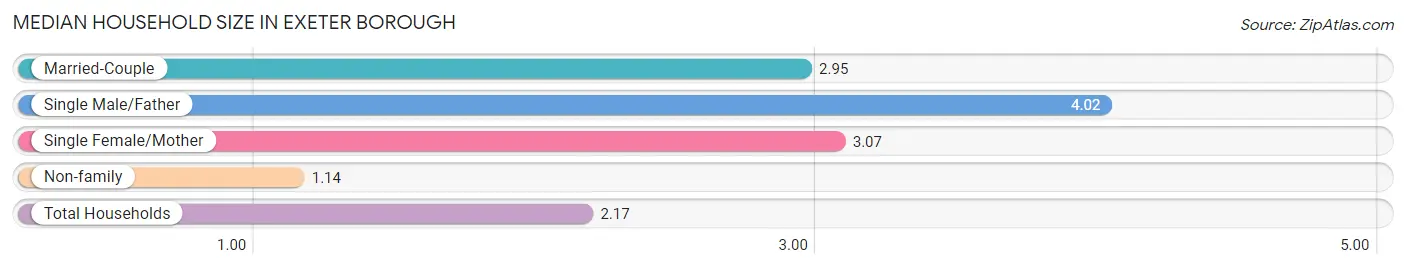
Median Household Size in Exeter borough
The median household size in Exeter borough is 2.17 persons per household, with single male/father households (89 | 3.6%) accounting for the largest median household size of 4.02 persons per household. non-family households (1,155 | 46.5%) represent the smallest median household size with 1.14 persons per household.
| Household Type | # Households | Household Size |
| Married-Couple | 843 (33.9%) | 2.95 |
| Single Male/Father | 89 (3.6%) | 4.02 |
| Single Female/Mother | 399 (16.1%) | 3.07 |
| Non-family | 1,155 (46.5%) | 1.14 |
| Total Households | 2,486 (100.0%) | 2.17 |
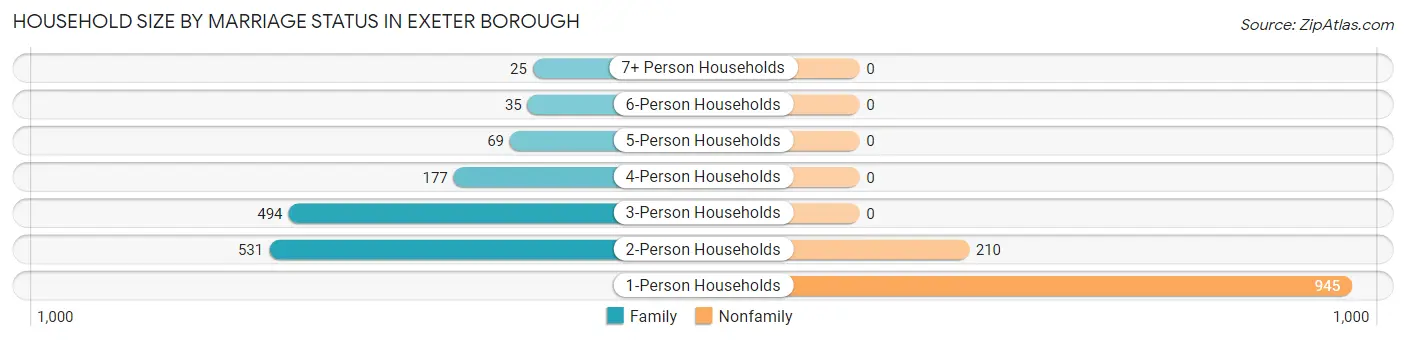
Household Size by Marriage Status in Exeter borough
Out of a total of 2,486 households in Exeter borough, 1,331 (53.5%) are family households, while 1,155 (46.5%) are nonfamily households. The most numerous type of family households are 2-person households, comprising 531, and the most common type of nonfamily households are 1-person households, comprising 945.
| Household Size | Family Households | Nonfamily Households |
| 1-Person Households | - | 945 (38.0%) |
| 2-Person Households | 531 (21.4%) | 210 (8.5%) |
| 3-Person Households | 494 (19.9%) | 0 (0.0%) |
| 4-Person Households | 177 (7.1%) | 0 (0.0%) |
| 5-Person Households | 69 (2.8%) | 0 (0.0%) |
| 6-Person Households | 35 (1.4%) | 0 (0.0%) |
| 7+ Person Households | 25 (1.0%) | 0 (0.0%) |
| Total | 1,331 (53.5%) | 1,155 (46.5%) |
Female Fertility in Exeter borough
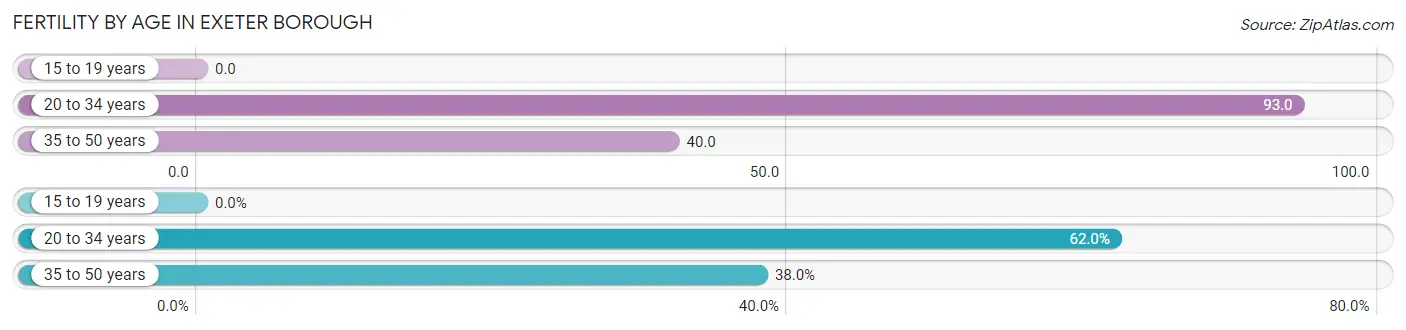
Fertility by Age in Exeter borough
Average fertility rate in Exeter borough is 49.0 births per 1,000 women. Women in the age bracket of 20 to 34 years have the highest fertility rate with 93.0 births per 1,000 women. Women in the age bracket of 20 to 34 years acount for 62.0% of all women with births.
| Age Bracket | Women with Births | Births / 1,000 Women |
| 15 to 19 years | 0 (0.0%) | 0.0 |
| 20 to 34 years | 31 (62.0%) | 93.0 |
| 35 to 50 years | 19 (38.0%) | 40.0 |
| Total | 50 (100.0%) | 49.0 |
Fertility by Age by Marriage Status in Exeter borough
28.0% of women with births (50) in Exeter borough are married. The highest percentage of unmarried women with births falls into 35 to 50 years age bracket with 100.0% of them unmarried at the time of birth, while the lowest percentage of unmarried women with births belong to 20 to 34 years age bracket with 54.8% of them unmarried.
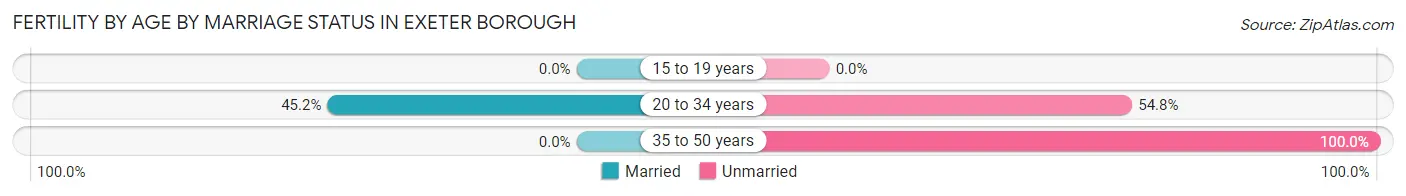
| Age Bracket | Married | Unmarried |
| 15 to 19 years | 0 (0.0%) | 0 (0.0%) |
| 20 to 34 years | 14 (45.2%) | 17 (54.8%) |
| 35 to 50 years | 0 (0.0%) | 19 (100.0%) |
| Total | 14 (28.0%) | 36 (72.0%) |
Fertility by Education in Exeter borough
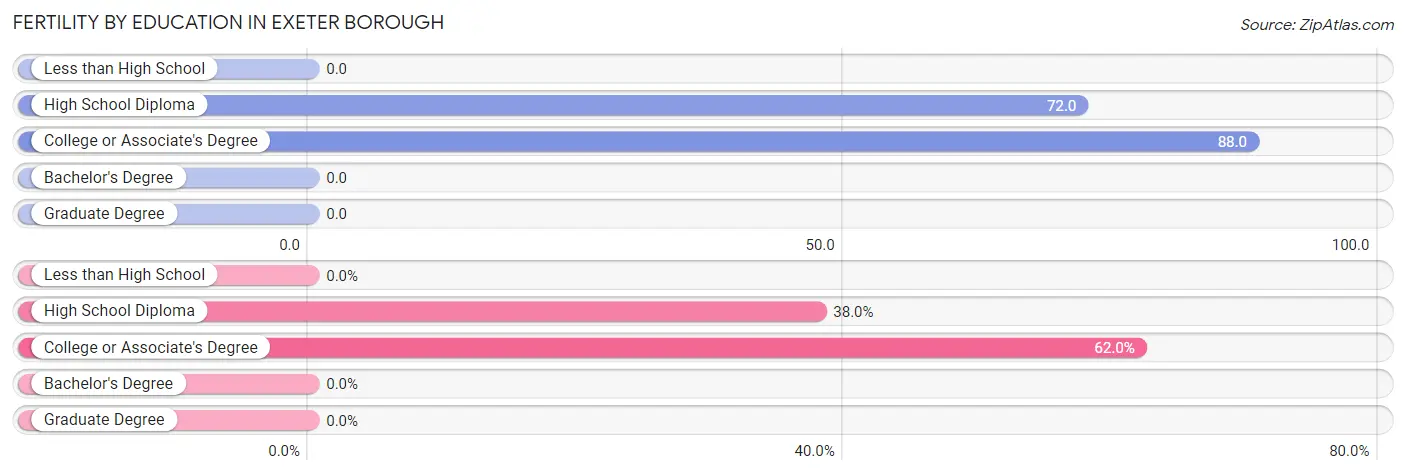
| Educational Attainment | Women with Births | Births / 1,000 Women |
| Less than High School | 0 (0.0%) | 0.0 |
| High School Diploma | 19 (38.0%) | 72.0 |
| College or Associate's Degree | 31 (62.0%) | 88.0 |
| Bachelor's Degree | 0 (0.0%) | 0.0 |
| Graduate Degree | 0 (0.0%) | 0.0 |
| Total | 50 (100.0%) | 49.0 |
Fertility by Education by Marriage Status in Exeter borough
72.0% of women with births in Exeter borough are unmarried. Women with the educational attainment of college or associate's degree are most likely to be married with 45.2% of them married at childbirth, while women with the educational attainment of high school diploma are least likely to be married with 100.0% of them unmarried at childbirth.
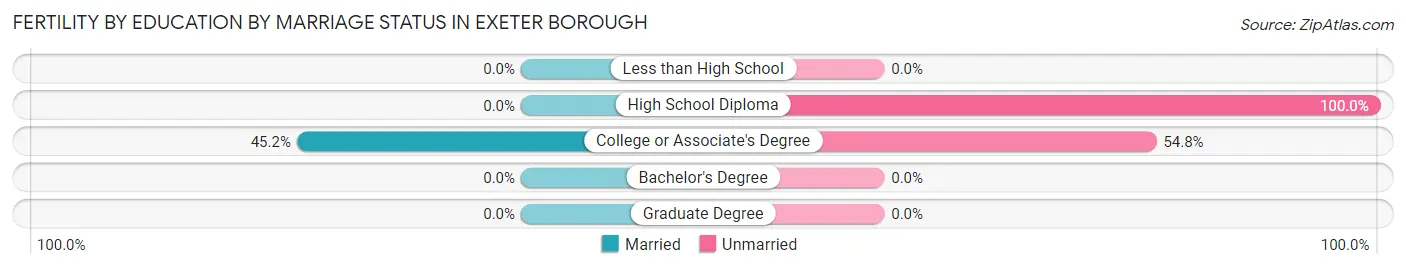
| Educational Attainment | Married | Unmarried |
| Less than High School | 0 (0.0%) | 0 (0.0%) |
| High School Diploma | 0 (0.0%) | 19 (100.0%) |
| College or Associate's Degree | 14 (45.2%) | 17 (54.8%) |
| Bachelor's Degree | 0 (0.0%) | 0 (0.0%) |
| Graduate Degree | 0 (0.0%) | 0 (0.0%) |
| Total | 14 (28.0%) | 36 (72.0%) |
Income in Exeter borough
Income Overview in Exeter borough
Per Capita Income in Exeter borough is $36,842, while median incomes of families and households are $72,054 and $60,463 respectively.
| Characteristic | Number | Measure |
| Per Capita Income | 5,509 | $36,842 |
| Median Family Income | 1,331 | $72,054 |
| Mean Family Income | 1,331 | $93,119 |
| Median Household Income | 2,486 | $60,463 |
| Mean Household Income | 2,486 | $79,973 |
| Income Deficit | 1,331 | $0 |
| Wage / Income Gap (%) | 5,509 | 52.43% |
| Wage / Income Gap ($) | 5,509 | 47.57¢ per $1 |
| Gini / Inequality Index | 5,509 | 0.42 |
Earnings by Sex in Exeter borough
Average Earnings in Exeter borough are $38,515, $66,500 for men and $31,637 for women, a difference of 52.4%.
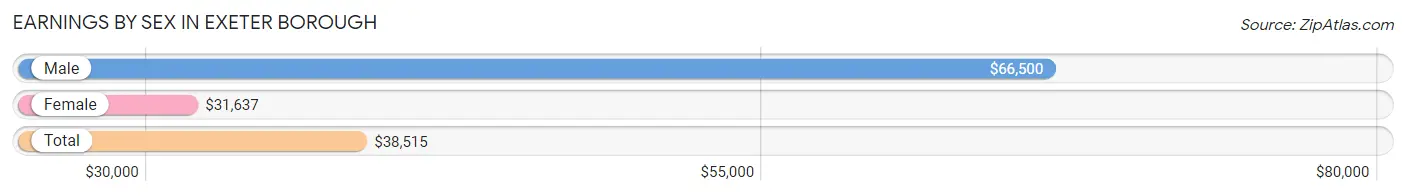
| Sex | Number | Average Earnings |
| Male | 1,362 (48.8%) | $66,500 |
| Female | 1,430 (51.2%) | $31,637 |
| Total | 2,792 (100.0%) | $38,515 |
Earnings by Sex by Income Bracket in Exeter borough
The most common earnings brackets in Exeter borough are $75,000 to $99,999 for men (294 | 21.6%) and $45,000 to $49,999 for women (199 | 13.9%).
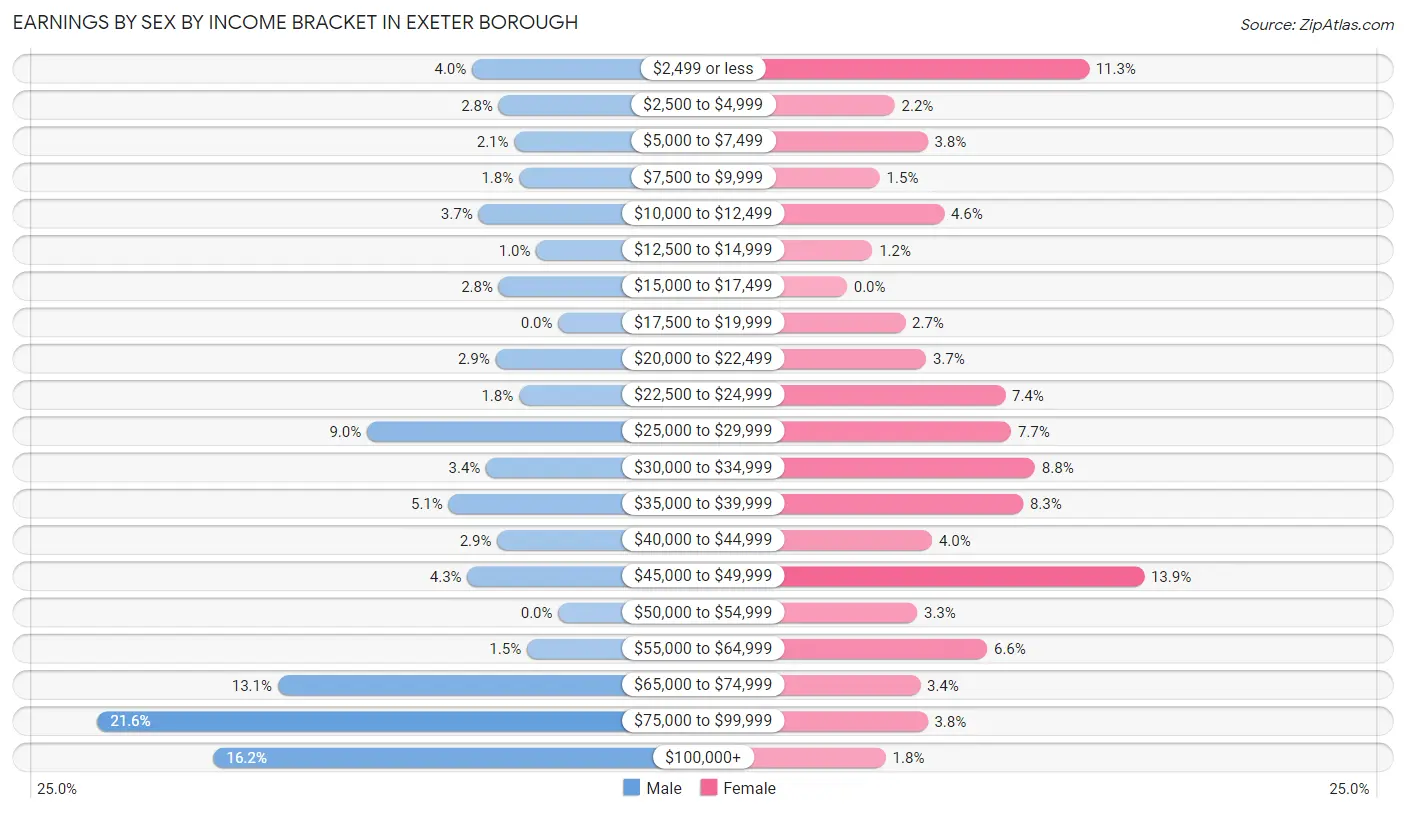
| Income | Male | Female |
| $2,499 or less | 55 (4.0%) | 162 (11.3%) |
| $2,500 to $4,999 | 38 (2.8%) | 32 (2.2%) |
| $5,000 to $7,499 | 28 (2.1%) | 54 (3.8%) |
| $7,500 to $9,999 | 25 (1.8%) | 22 (1.5%) |
| $10,000 to $12,499 | 51 (3.7%) | 65 (4.5%) |
| $12,500 to $14,999 | 14 (1.0%) | 17 (1.2%) |
| $15,000 to $17,499 | 38 (2.8%) | 0 (0.0%) |
| $17,500 to $19,999 | 0 (0.0%) | 39 (2.7%) |
| $20,000 to $22,499 | 40 (2.9%) | 53 (3.7%) |
| $22,500 to $24,999 | 25 (1.8%) | 106 (7.4%) |
| $25,000 to $29,999 | 122 (9.0%) | 110 (7.7%) |
| $30,000 to $34,999 | 46 (3.4%) | 126 (8.8%) |
| $35,000 to $39,999 | 70 (5.1%) | 118 (8.3%) |
| $40,000 to $44,999 | 39 (2.9%) | 57 (4.0%) |
| $45,000 to $49,999 | 58 (4.3%) | 199 (13.9%) |
| $50,000 to $54,999 | 0 (0.0%) | 47 (3.3%) |
| $55,000 to $64,999 | 20 (1.5%) | 94 (6.6%) |
| $65,000 to $74,999 | 179 (13.1%) | 49 (3.4%) |
| $75,000 to $99,999 | 294 (21.6%) | 54 (3.8%) |
| $100,000+ | 220 (16.2%) | 26 (1.8%) |
| Total | 1,362 (100.0%) | 1,430 (100.0%) |
Earnings by Sex by Educational Attainment in Exeter borough
Average earnings in Exeter borough are $69,407 for men and $36,250 for women, a difference of 47.8%. Men with an educational attainment of bachelor's degree enjoy the highest average annual earnings of $86,094, while those with less than high school education earn the least with $33,095. Women with an educational attainment of graduate degree earn the most with the average annual earnings of $69,432, while those with high school diploma education have the smallest earnings of $27,903.
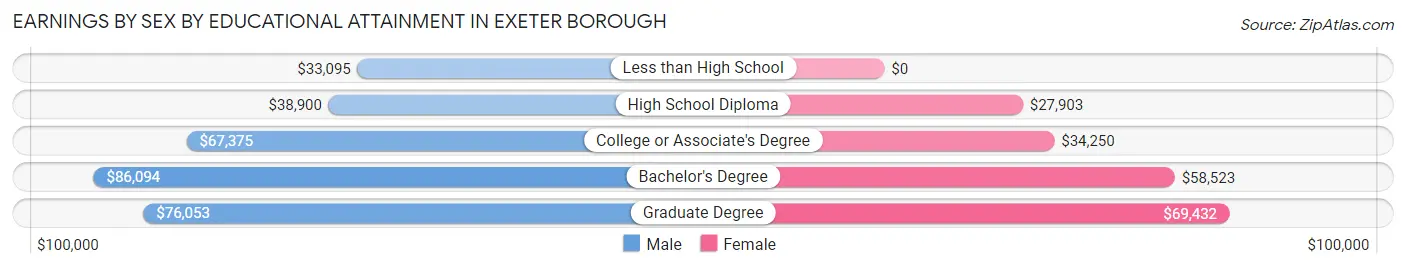
| Educational Attainment | Male Income | Female Income |
| Less than High School | $33,095 | $0 |
| High School Diploma | $38,900 | $27,903 |
| College or Associate's Degree | $67,375 | $34,250 |
| Bachelor's Degree | $86,094 | $58,523 |
| Graduate Degree | $76,053 | $69,432 |
| Total | $69,407 | $36,250 |
Family Income in Exeter borough
Family Income Brackets in Exeter borough
According to the Exeter borough family income data, there are 354 families falling into the $35,000 to $49,999 income range, which is the most common income bracket and makes up 26.6% of all families. Conversely, the $15,000 to $24,999 income bracket is the least frequent group with only 31 families (2.3%) belonging to this category.
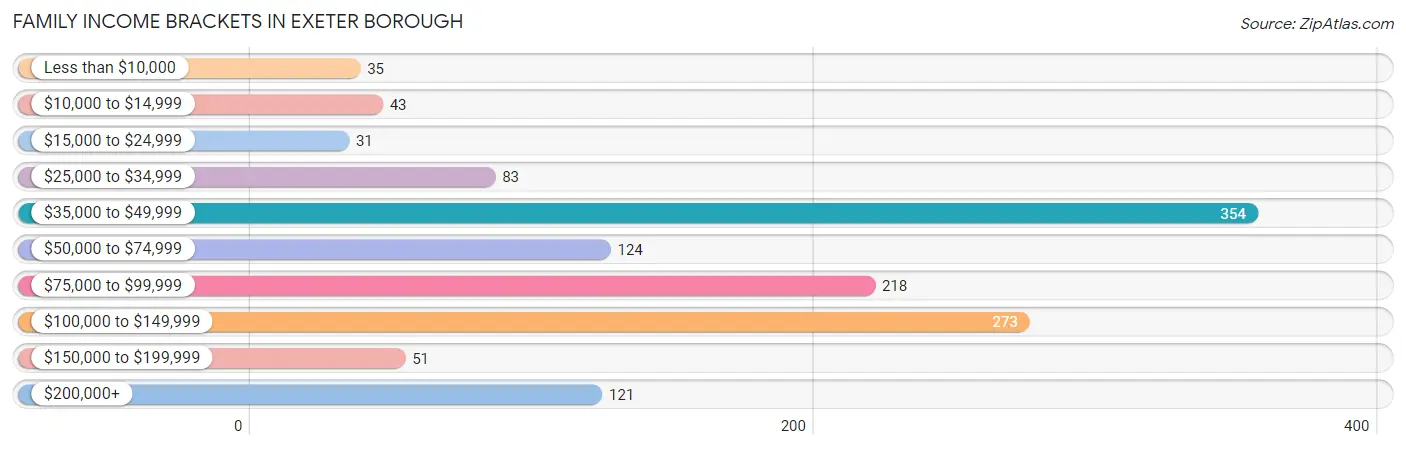
| Income Bracket | # Families | % Families |
| Less than $10,000 | 35 | 2.6% |
| $10,000 to $14,999 | 43 | 3.2% |
| $15,000 to $24,999 | 31 | 2.3% |
| $25,000 to $34,999 | 83 | 6.2% |
| $35,000 to $49,999 | 354 | 26.6% |
| $50,000 to $74,999 | 124 | 9.3% |
| $75,000 to $99,999 | 218 | 16.4% |
| $100,000 to $149,999 | 273 | 20.5% |
| $150,000 to $199,999 | 51 | 3.8% |
| $200,000+ | 121 | 9.1% |
Family Income by Famaliy Size in Exeter borough
5-person families (67 | 5.0%) account for the highest median family income in Exeter borough with $104,563 per family, while 2-person families (686 | 51.5%) have the highest median income of $25,547 per family member.
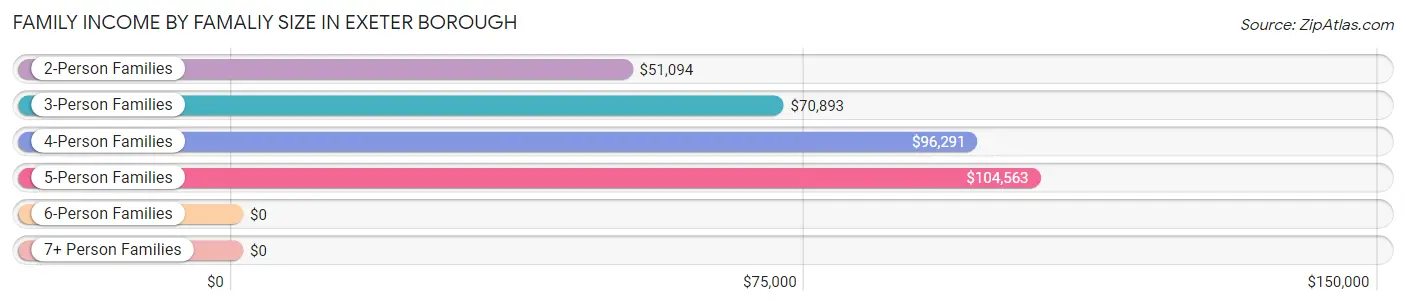
| Income Bracket | # Families | Median Income |
| 2-Person Families | 686 (51.5%) | $51,094 |
| 3-Person Families | 356 (26.8%) | $70,893 |
| 4-Person Families | 179 (13.5%) | $96,291 |
| 5-Person Families | 67 (5.0%) | $104,563 |
| 6-Person Families | 43 (3.2%) | $0 |
| 7+ Person Families | 0 (0.0%) | $0 |
| Total | 1,331 (100.0%) | $72,054 |
Family Income by Number of Earners in Exeter borough
The median family income in Exeter borough is $72,054, with families comprising 3+ earners (190) having the highest median family income of $128,182, while families with no earners (203) have the lowest median family income of $38,165, accounting for 14.3% and 15.2% of families, respectively.
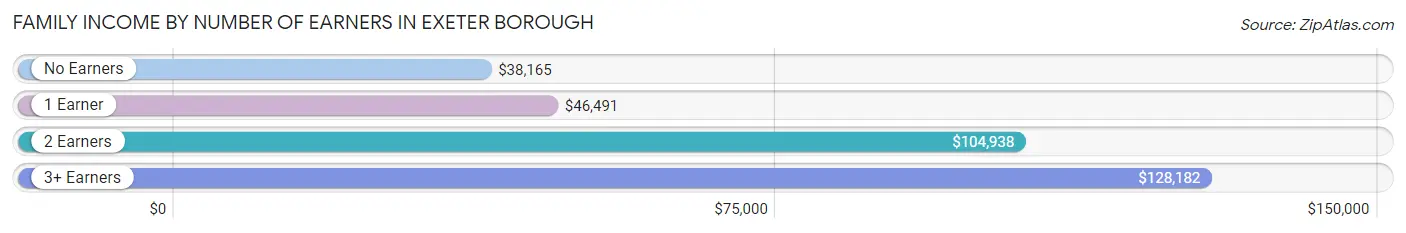
| Number of Earners | # Families | Median Income |
| No Earners | 203 (15.2%) | $38,165 |
| 1 Earner | 447 (33.6%) | $46,491 |
| 2 Earners | 491 (36.9%) | $104,938 |
| 3+ Earners | 190 (14.3%) | $128,182 |
| Total | 1,331 (100.0%) | $72,054 |
Household Income in Exeter borough
Household Income Brackets in Exeter borough
With 557 households falling in the category, the $35,000 to $49,999 income range is the most frequent in Exeter borough, accounting for 22.4% of all households. In contrast, only 70 households (2.8%) fall into the less than $10,000 income bracket, making it the least populous group.
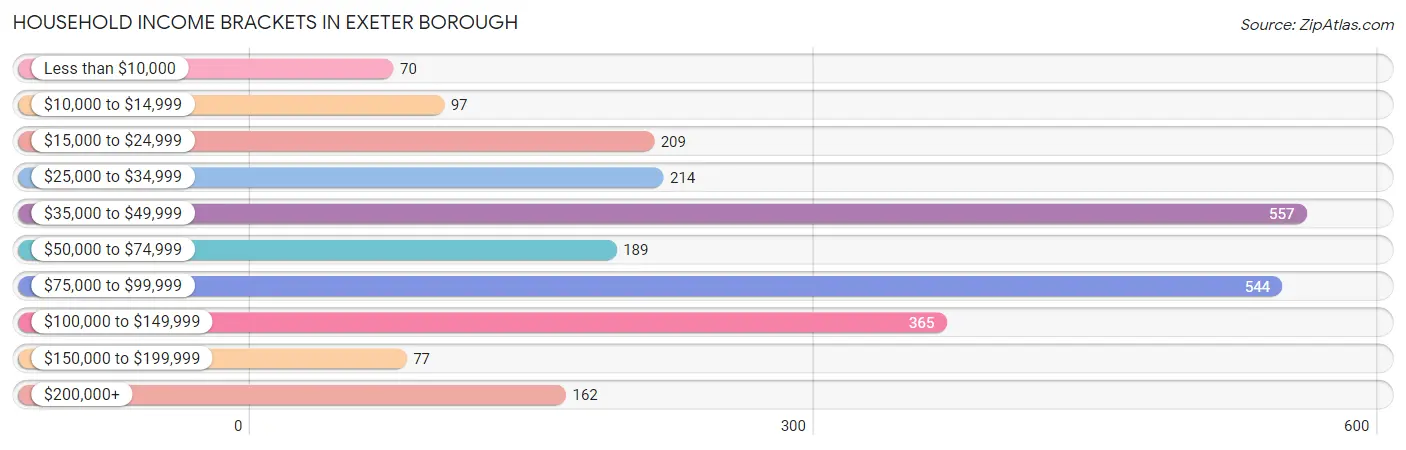
| Income Bracket | # Households | % Households |
| Less than $10,000 | 70 | 2.8% |
| $10,000 to $14,999 | 97 | 3.9% |
| $15,000 to $24,999 | 209 | 8.4% |
| $25,000 to $34,999 | 214 | 8.6% |
| $35,000 to $49,999 | 557 | 22.4% |
| $50,000 to $74,999 | 189 | 7.6% |
| $75,000 to $99,999 | 544 | 21.9% |
| $100,000 to $149,999 | 365 | 14.7% |
| $150,000 to $199,999 | 77 | 3.1% |
| $200,000+ | 162 | 6.5% |
Household Income by Householder Age in Exeter borough
The median household income in Exeter borough is $60,463, with the highest median household income of $85,844 found in the 45 to 64 years age bracket for the primary householder. A total of 1,088 households (43.8%) fall into this category. Meanwhile, the 15 to 24 years age bracket for the primary householder has the lowest median household income of $0, with 41 households (1.7%) in this group.
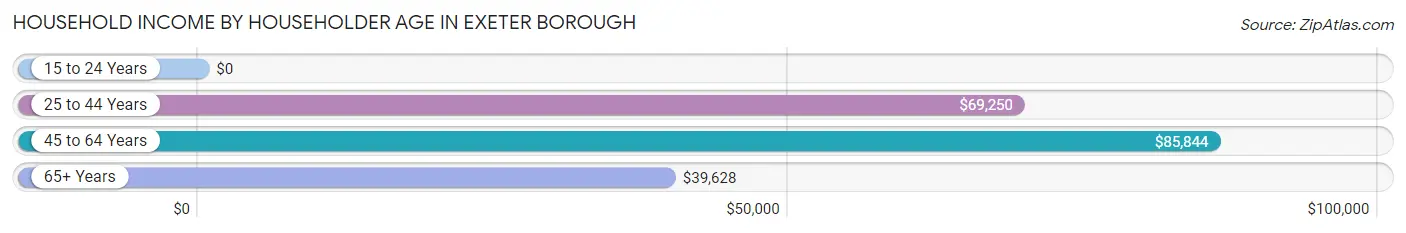
| Income Bracket | # Households | Median Income |
| 15 to 24 Years | 41 (1.7%) | $0 |
| 25 to 44 Years | 509 (20.5%) | $69,250 |
| 45 to 64 Years | 1,088 (43.8%) | $85,844 |
| 65+ Years | 848 (34.1%) | $39,628 |
| Total | 2,486 (100.0%) | $60,463 |
Poverty in Exeter borough
Income Below Poverty by Sex and Age in Exeter borough
With 14.2% poverty level for males and 8.6% for females among the residents of Exeter borough, under 5 year old males and under 5 year old females are the most vulnerable to poverty, with 52 males (53.6%) and 19 females (100.0%) in their respective age groups living below the poverty level.
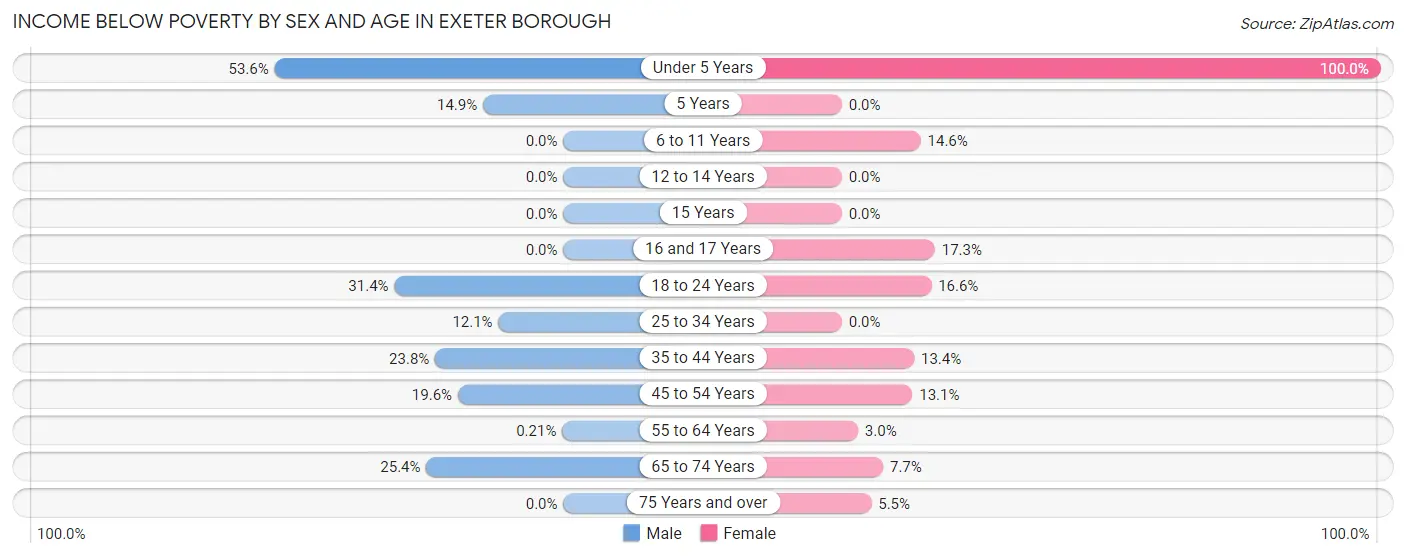
| Age Bracket | Male | Female |
| Under 5 Years | 52 (53.6%) | 19 (100.0%) |
| 5 Years | 17 (14.9%) | 0 (0.0%) |
| 6 to 11 Years | 0 (0.0%) | 18 (14.6%) |
| 12 to 14 Years | 0 (0.0%) | 0 (0.0%) |
| 15 Years | 0 (0.0%) | 0 (0.0%) |
| 16 and 17 Years | 0 (0.0%) | 19 (17.3%) |
| 18 to 24 Years | 53 (31.4%) | 34 (16.6%) |
| 25 to 34 Years | 37 (12.0%) | 0 (0.0%) |
| 35 to 44 Years | 74 (23.8%) | 44 (13.4%) |
| 45 to 54 Years | 63 (19.6%) | 36 (13.1%) |
| 55 to 64 Years | 1 (0.2%) | 16 (3.0%) |
| 65 to 74 Years | 88 (25.4%) | 31 (7.6%) |
| 75 Years and over | 0 (0.0%) | 15 (5.5%) |
| Total | 385 (14.2%) | 232 (8.6%) |
Income Above Poverty by Sex and Age in Exeter borough
According to the poverty statistics in Exeter borough, males aged 6 to 11 years and females aged 5 years are the age groups that are most secure financially, with 100.0% of males and 100.0% of females in these age groups living above the poverty line.
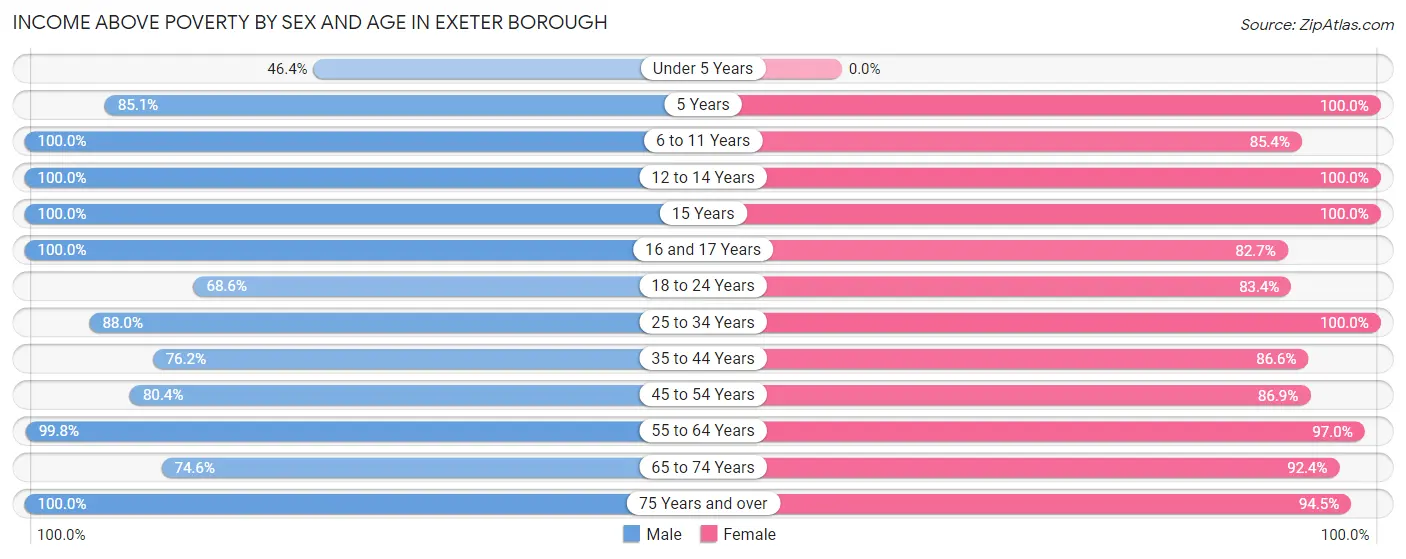
| Age Bracket | Male | Female |
| Under 5 Years | 45 (46.4%) | 0 (0.0%) |
| 5 Years | 97 (85.1%) | 68 (100.0%) |
| 6 to 11 Years | 128 (100.0%) | 105 (85.4%) |
| 12 to 14 Years | 108 (100.0%) | 117 (100.0%) |
| 15 Years | 33 (100.0%) | 61 (100.0%) |
| 16 and 17 Years | 10 (100.0%) | 91 (82.7%) |
| 18 to 24 Years | 116 (68.6%) | 171 (83.4%) |
| 25 to 34 Years | 270 (87.9%) | 167 (100.0%) |
| 35 to 44 Years | 237 (76.2%) | 284 (86.6%) |
| 45 to 54 Years | 259 (80.4%) | 239 (86.9%) |
| 55 to 64 Years | 468 (99.8%) | 520 (97.0%) |
| 65 to 74 Years | 258 (74.6%) | 374 (92.3%) |
| 75 Years and over | 288 (100.0%) | 259 (94.5%) |
| Total | 2,317 (85.8%) | 2,456 (91.4%) |
Income Below Poverty Among Married-Couple Families in Exeter borough
The poverty statistics for married-couple families in Exeter borough show that 4.0% or 34 of the total 843 families live below the poverty line. Families with no children have the highest poverty rate of 5.8%, comprising of 34 families. On the other hand, families with 1 or 2 children have the lowest poverty rate of 0.0%, which includes 0 families.
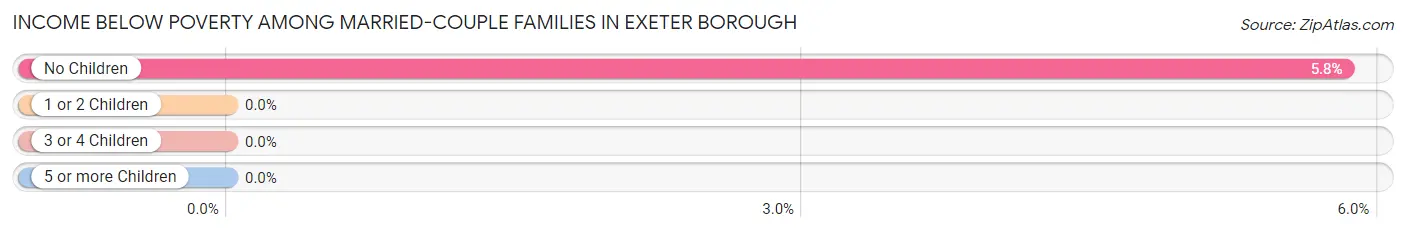
| Children | Above Poverty | Below Poverty |
| No Children | 549 (94.2%) | 34 (5.8%) |
| 1 or 2 Children | 260 (100.0%) | 0 (0.0%) |
| 3 or 4 Children | 0 (0.0%) | 0 (0.0%) |
| 5 or more Children | 0 (0.0%) | 0 (0.0%) |
| Total | 809 (96.0%) | 34 (4.0%) |
Income Below Poverty Among Single-Parent Households in Exeter borough
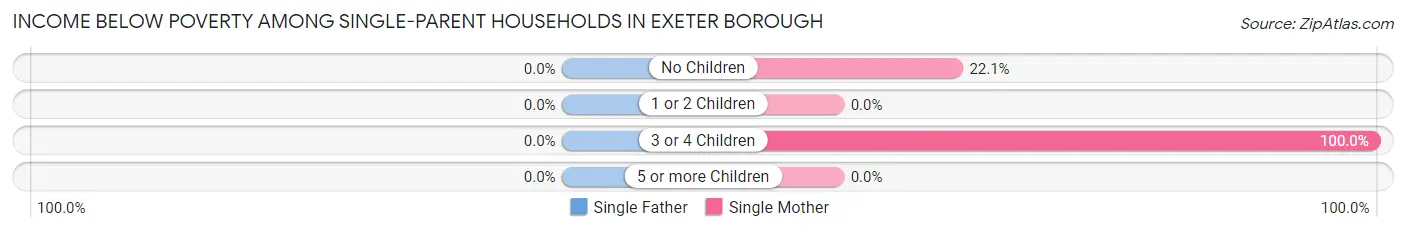
| Children | Single Father | Single Mother |
| No Children | 0 (0.0%) | 25 (22.1%) |
| 1 or 2 Children | 0 (0.0%) | 0 (0.0%) |
| 3 or 4 Children | 0 (0.0%) | 36 (100.0%) |
| 5 or more Children | 0 (0.0%) | 0 (0.0%) |
| Total | 0 (0.0%) | 61 (15.3%) |
Income Below Poverty Among Married-Couple vs Single-Parent Households in Exeter borough
The poverty data for Exeter borough shows that 34 of the married-couple family households (4.0%) and 61 of the single-parent households (12.5%) are living below the poverty level. Within the married-couple family households, those with no children have the highest poverty rate, with 34 households (5.8%) falling below the poverty line. Among the single-parent households, those with 3 or 4 children have the highest poverty rate, with 36 household (59.0%) living below poverty.
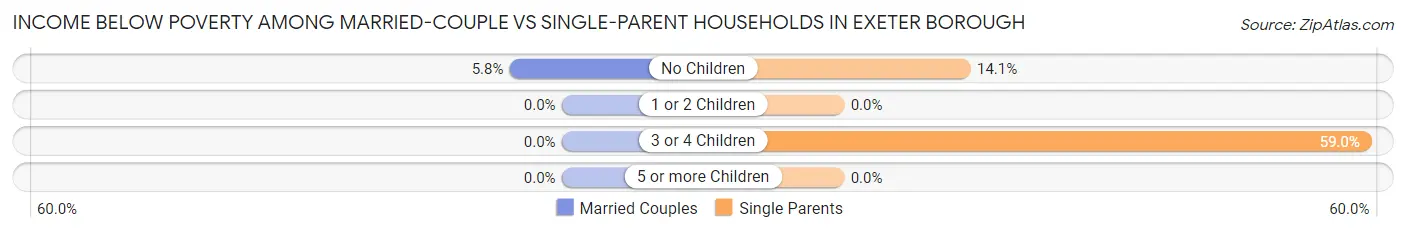
| Children | Married-Couple Families | Single-Parent Households |
| No Children | 34 (5.8%) | 25 (14.1%) |
| 1 or 2 Children | 0 (0.0%) | 0 (0.0%) |
| 3 or 4 Children | 0 (0.0%) | 36 (59.0%) |
| 5 or more Children | 0 (0.0%) | 0 (0.0%) |
| Total | 34 (4.0%) | 61 (12.5%) |
Employment Characteristics in Exeter borough
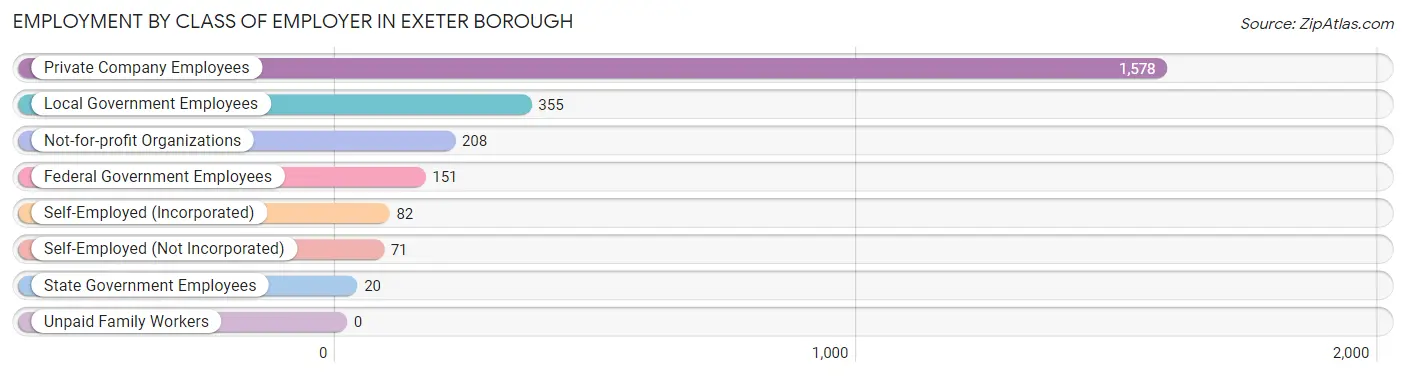
Employment by Class of Employer in Exeter borough
Among the 2,465 employed individuals in Exeter borough, private company employees (1,578 | 64.0%), local government employees (355 | 14.4%), and not-for-profit organizations (208 | 8.4%) make up the most common classes of employment.
| Employer Class | # Employees | % Employees |
| Private Company Employees | 1,578 | 64.0% |
| Self-Employed (Incorporated) | 82 | 3.3% |
| Self-Employed (Not Incorporated) | 71 | 2.9% |
| Not-for-profit Organizations | 208 | 8.4% |
| Local Government Employees | 355 | 14.4% |
| State Government Employees | 20 | 0.8% |
| Federal Government Employees | 151 | 6.1% |
| Unpaid Family Workers | 0 | 0.0% |
| Total | 2,465 | 100.0% |
Employment Status by Age in Exeter borough
According to the labor force statistics for Exeter borough, out of the total population over 16 years of age (4,641), 56.4% or 2,618 individuals are in the labor force, with 2.8% or 73 of them unemployed. The age group with the highest labor force participation rate is 55 to 59 years, with 90.9% or 251 individuals in the labor force. Within the labor force, the 30 to 34 years age range has the highest percentage of unemployed individuals, with 13.0% or 28 of them being unemployed.
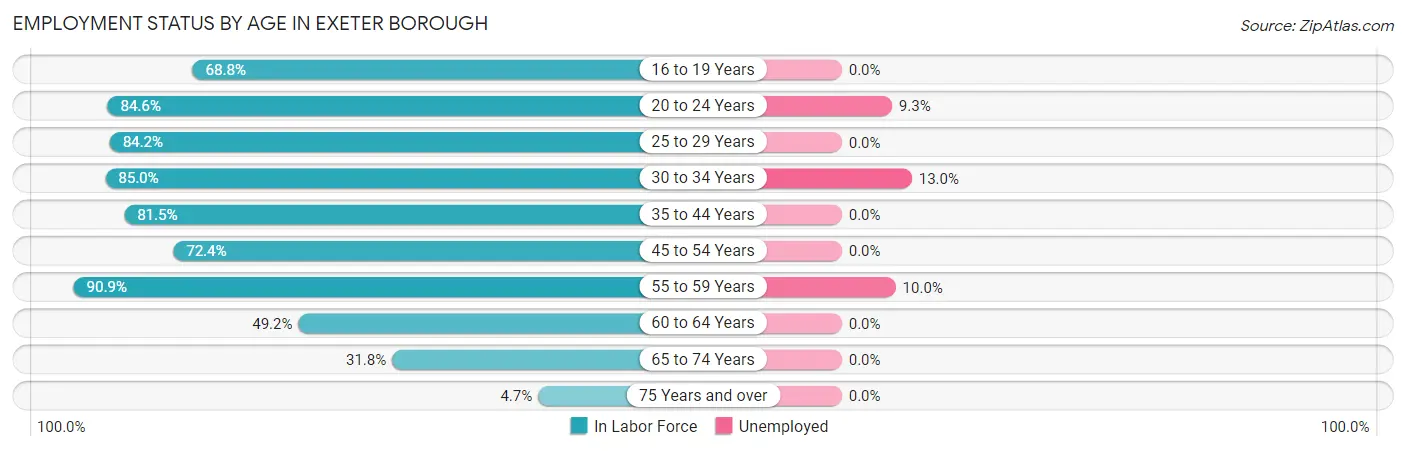
| Age Bracket | In Labor Force | Unemployed |
| 16 to 19 Years | 174 (68.8%) | 0 (0.0%) |
| 20 to 24 Years | 204 (84.6%) | 19 (9.3%) |
| 25 to 29 Years | 186 (84.2%) | 0 (0.0%) |
| 30 to 34 Years | 215 (85.0%) | 28 (13.0%) |
| 35 to 44 Years | 521 (81.5%) | 0 (0.0%) |
| 45 to 54 Years | 432 (72.4%) | 0 (0.0%) |
| 55 to 59 Years | 251 (90.9%) | 25 (10.0%) |
| 60 to 64 Years | 361 (49.2%) | 0 (0.0%) |
| 65 to 74 Years | 243 (31.8%) | 0 (0.0%) |
| 75 Years and over | 31 (4.7%) | 0 (0.0%) |
| Total | 2,618 (56.4%) | 73 (2.8%) |
Employment Status by Educational Attainment in Exeter borough
According to labor force statistics for Exeter borough, 72.3% of individuals (1,966) out of the total population between 25 and 64 years of age (2,719) are in the labor force, with 2.7% or 53 of them being unemployed. The group with the highest labor force participation rate are those with the educational attainment of bachelor's degree or higher, with 89.6% or 466 individuals in the labor force. Within the labor force, individuals with less than high school education have the highest percentage of unemployment, with 26.4% or 28 of them being unemployed.
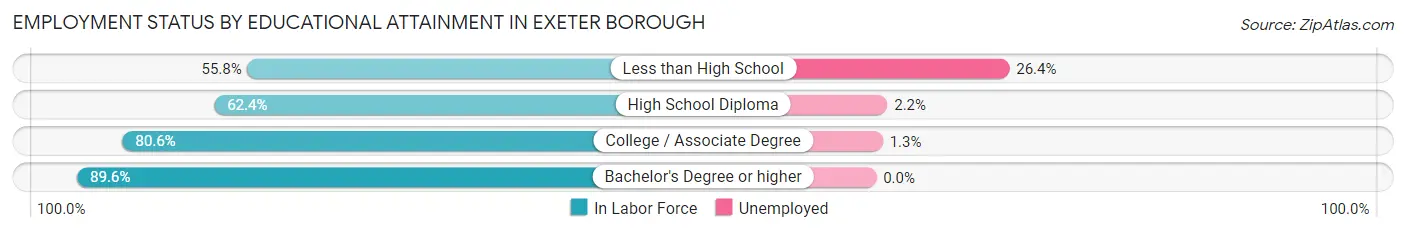
| Educational Attainment | In Labor Force | Unemployed |
| Less than High School | 106 (55.8%) | 50 (26.4%) |
| High School Diploma | 773 (62.4%) | 27 (2.2%) |
| College / Associate Degree | 621 (80.6%) | 10 (1.3%) |
| Bachelor's Degree or higher | 466 (89.6%) | 0 (0.0%) |
| Total | 1,966 (72.3%) | 73 (2.7%) |
Employment Occupations by Sex in Exeter borough
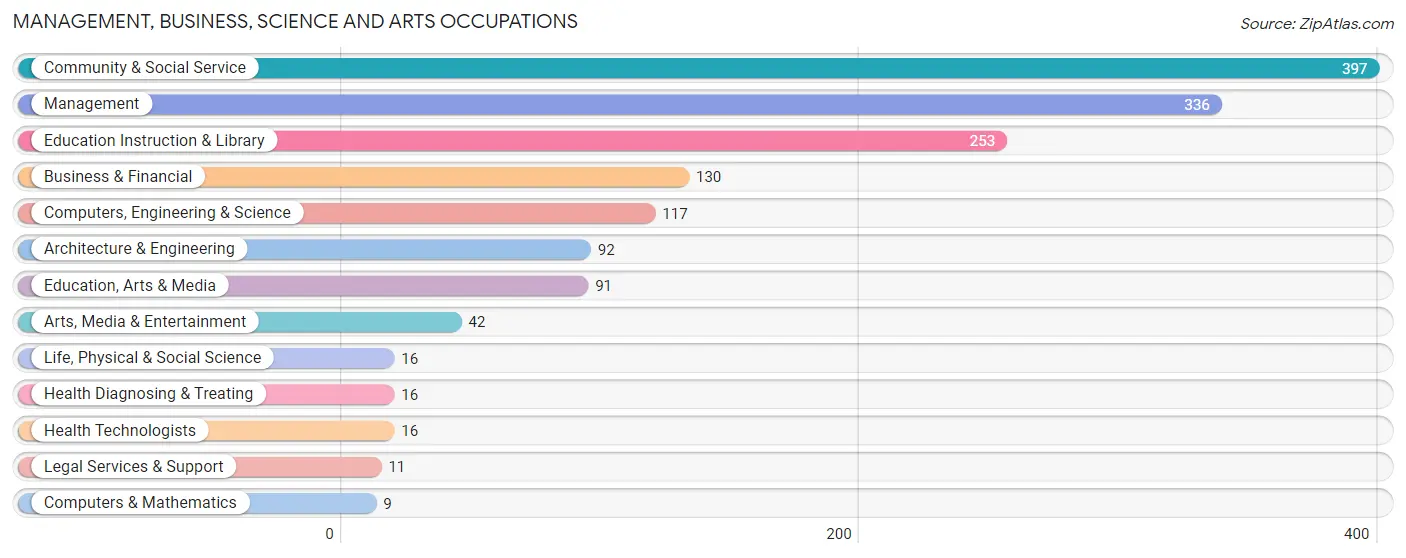
Management, Business, Science and Arts Occupations
The most common Management, Business, Science and Arts occupations in Exeter borough are Community & Social Service (397 | 15.6%), Management (336 | 13.2%), Education Instruction & Library (253 | 9.9%), Business & Financial (130 | 5.1%), and Computers, Engineering & Science (117 | 4.6%).
Management, Business, Science and Arts Occupations by Sex
Within the Management, Business, Science and Arts occupations in Exeter borough, the most male-oriented occupations are Architecture & Engineering (100.0%), Computers, Engineering & Science (78.6%), and Business & Financial (60.0%), while the most female-oriented occupations are Computers & Mathematics (100.0%), Life, Physical & Social Science (100.0%), and Legal Services & Support (100.0%).
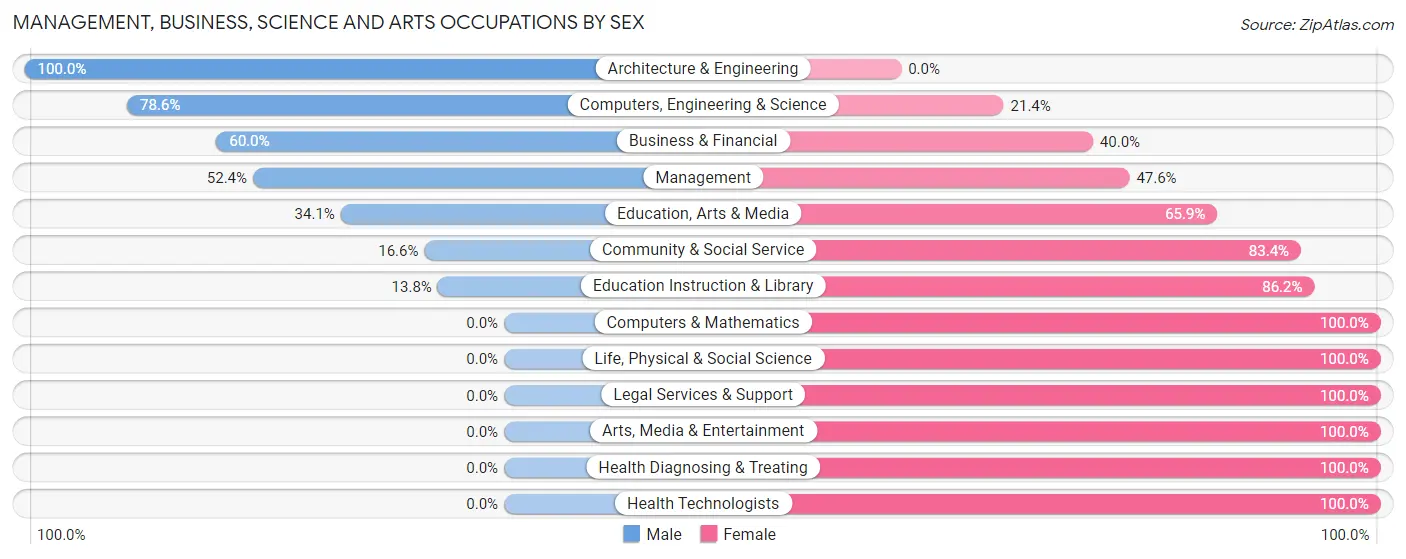
| Occupation | Male | Female |
| Management | 176 (52.4%) | 160 (47.6%) |
| Business & Financial | 78 (60.0%) | 52 (40.0%) |
| Computers, Engineering & Science | 92 (78.6%) | 25 (21.4%) |
| Computers & Mathematics | 0 (0.0%) | 9 (100.0%) |
| Architecture & Engineering | 92 (100.0%) | 0 (0.0%) |
| Life, Physical & Social Science | 0 (0.0%) | 16 (100.0%) |
| Community & Social Service | 66 (16.6%) | 331 (83.4%) |
| Education, Arts & Media | 31 (34.1%) | 60 (65.9%) |
| Legal Services & Support | 0 (0.0%) | 11 (100.0%) |
| Education Instruction & Library | 35 (13.8%) | 218 (86.2%) |
| Arts, Media & Entertainment | 0 (0.0%) | 42 (100.0%) |
| Health Diagnosing & Treating | 0 (0.0%) | 16 (100.0%) |
| Health Technologists | 0 (0.0%) | 16 (100.0%) |
| Total (Category) | 412 (41.4%) | 584 (58.6%) |
| Total (Overall) | 1,240 (48.7%) | 1,306 (51.3%) |
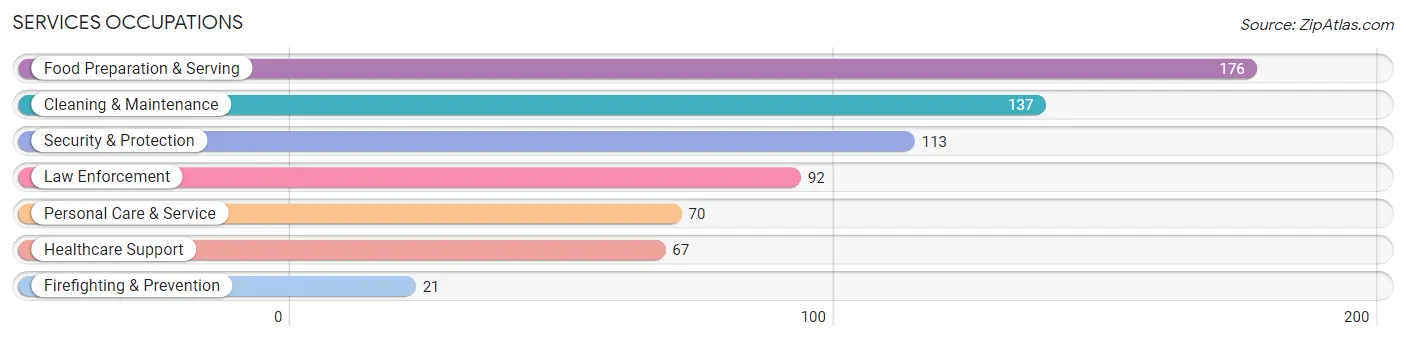
Services Occupations
The most common Services occupations in Exeter borough are Food Preparation & Serving (176 | 6.9%), Cleaning & Maintenance (137 | 5.4%), Security & Protection (113 | 4.4%), Law Enforcement (92 | 3.6%), and Personal Care & Service (70 | 2.8%).
Services Occupations by Sex
Within the Services occupations in Exeter borough, the most male-oriented occupations are Security & Protection (100.0%), Firefighting & Prevention (100.0%), and Law Enforcement (100.0%), while the most female-oriented occupations are Food Preparation & Serving (84.1%), Personal Care & Service (82.9%), and Healthcare Support (62.7%).
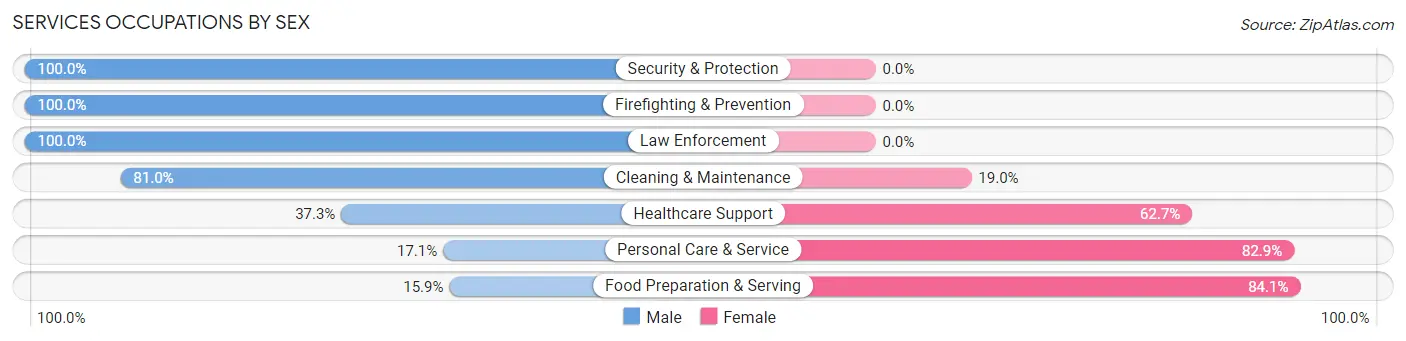
| Occupation | Male | Female |
| Healthcare Support | 25 (37.3%) | 42 (62.7%) |
| Security & Protection | 113 (100.0%) | 0 (0.0%) |
| Firefighting & Prevention | 21 (100.0%) | 0 (0.0%) |
| Law Enforcement | 92 (100.0%) | 0 (0.0%) |
| Food Preparation & Serving | 28 (15.9%) | 148 (84.1%) |
| Cleaning & Maintenance | 111 (81.0%) | 26 (19.0%) |
| Personal Care & Service | 12 (17.1%) | 58 (82.9%) |
| Total (Category) | 289 (51.3%) | 274 (48.7%) |
| Total (Overall) | 1,240 (48.7%) | 1,306 (51.3%) |
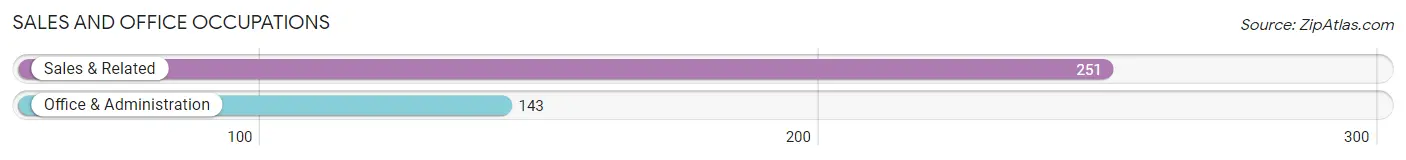
Sales and Office Occupations
The most common Sales and Office occupations in Exeter borough are Sales & Related (251 | 9.9%), and Office & Administration (143 | 5.6%).
Sales and Office Occupations by Sex
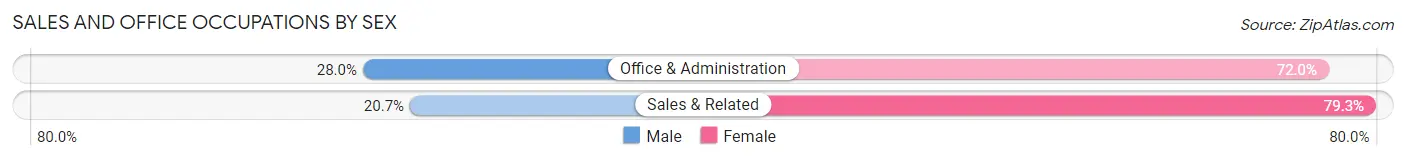
| Occupation | Male | Female |
| Sales & Related | 52 (20.7%) | 199 (79.3%) |
| Office & Administration | 40 (28.0%) | 103 (72.0%) |
| Total (Category) | 92 (23.4%) | 302 (76.6%) |
| Total (Overall) | 1,240 (48.7%) | 1,306 (51.3%) |
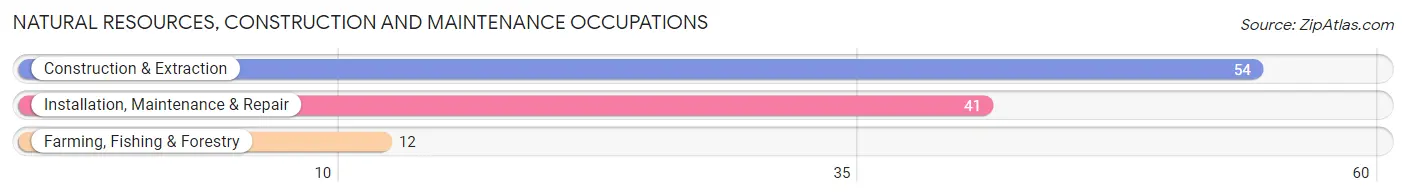
Natural Resources, Construction and Maintenance Occupations
The most common Natural Resources, Construction and Maintenance occupations in Exeter borough are Construction & Extraction (54 | 2.1%), Installation, Maintenance & Repair (41 | 1.6%), and Farming, Fishing & Forestry (12 | 0.5%).
Natural Resources, Construction and Maintenance Occupations by Sex
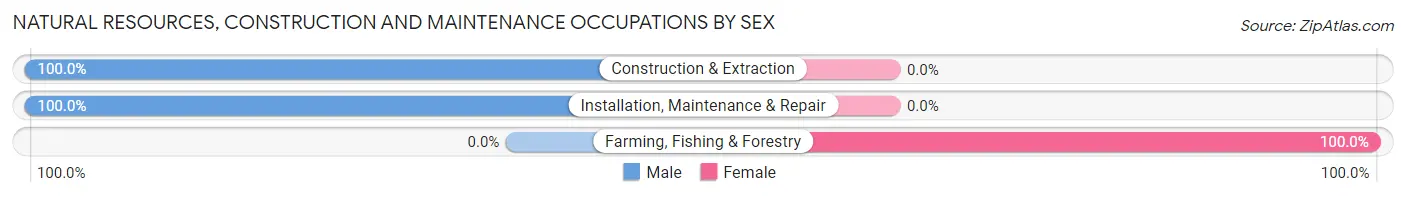
| Occupation | Male | Female |
| Farming, Fishing & Forestry | 0 (0.0%) | 12 (100.0%) |
| Construction & Extraction | 54 (100.0%) | 0 (0.0%) |
| Installation, Maintenance & Repair | 41 (100.0%) | 0 (0.0%) |
| Total (Category) | 95 (88.8%) | 12 (11.2%) |
| Total (Overall) | 1,240 (48.7%) | 1,306 (51.3%) |
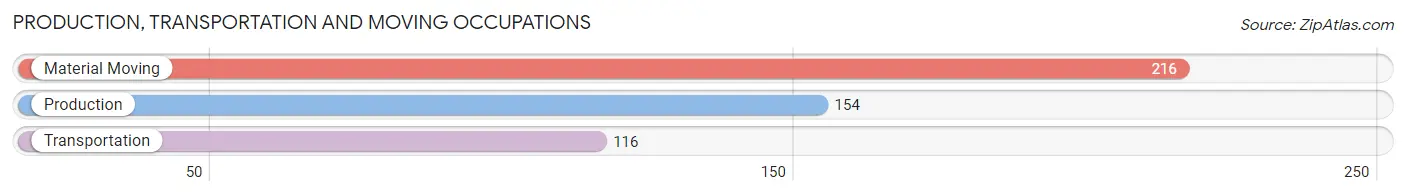
Production, Transportation and Moving Occupations
The most common Production, Transportation and Moving occupations in Exeter borough are Material Moving (216 | 8.5%), Production (154 | 6.0%), and Transportation (116 | 4.6%).
Production, Transportation and Moving Occupations by Sex
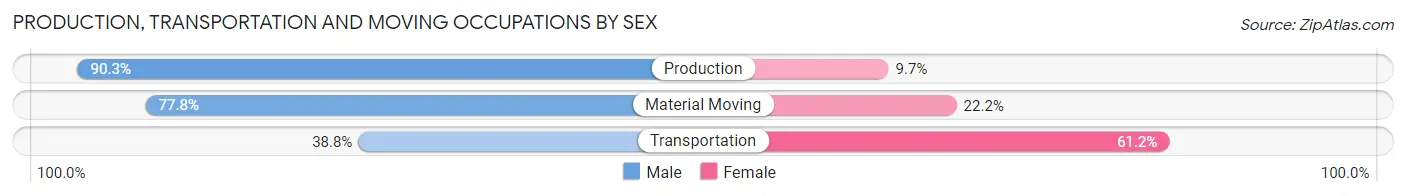
| Occupation | Male | Female |
| Production | 139 (90.3%) | 15 (9.7%) |
| Transportation | 45 (38.8%) | 71 (61.2%) |
| Material Moving | 168 (77.8%) | 48 (22.2%) |
| Total (Category) | 352 (72.4%) | 134 (27.6%) |
| Total (Overall) | 1,240 (48.7%) | 1,306 (51.3%) |
Employment Industries by Sex in Exeter borough
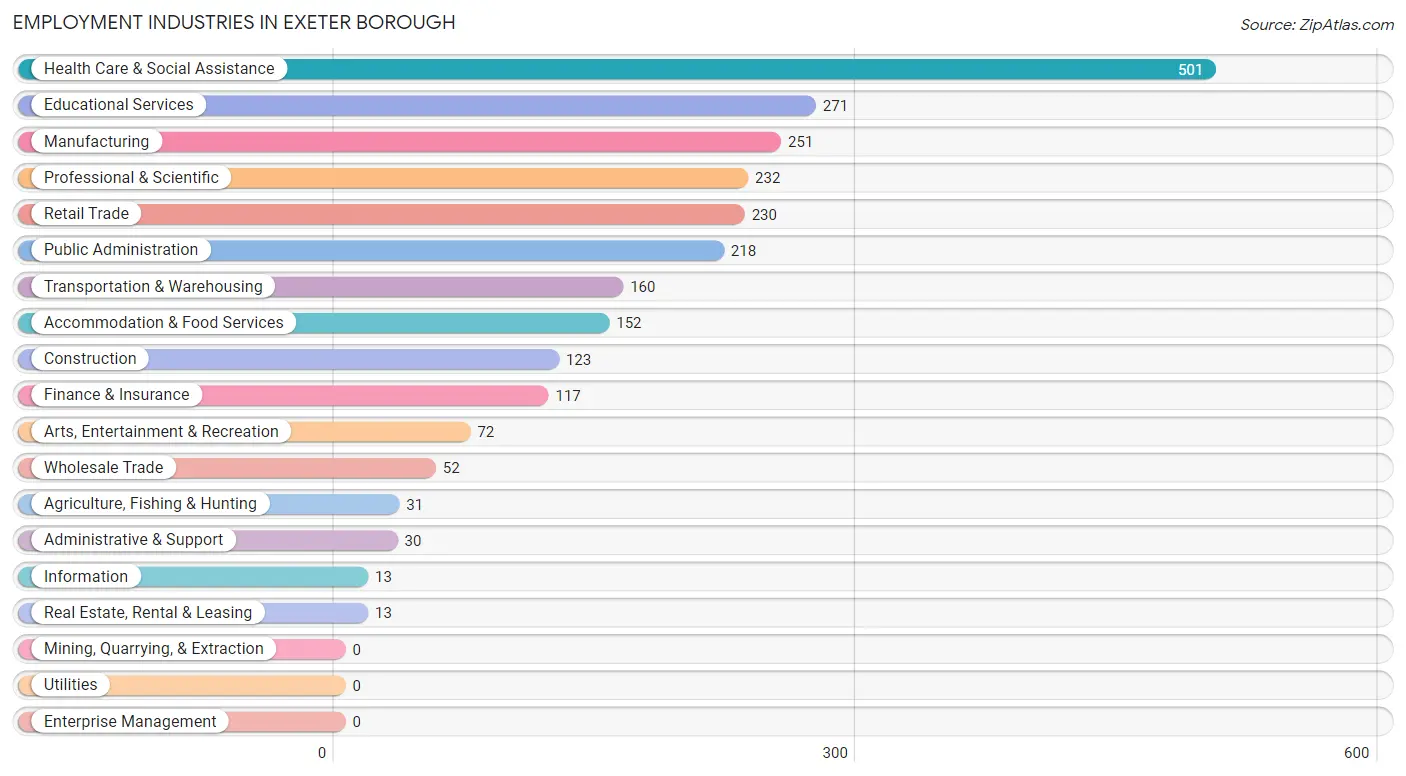
Employment Industries in Exeter borough
The major employment industries in Exeter borough include Health Care & Social Assistance (501 | 19.7%), Educational Services (271 | 10.6%), Manufacturing (251 | 9.9%), Professional & Scientific (232 | 9.1%), and Retail Trade (230 | 9.0%).
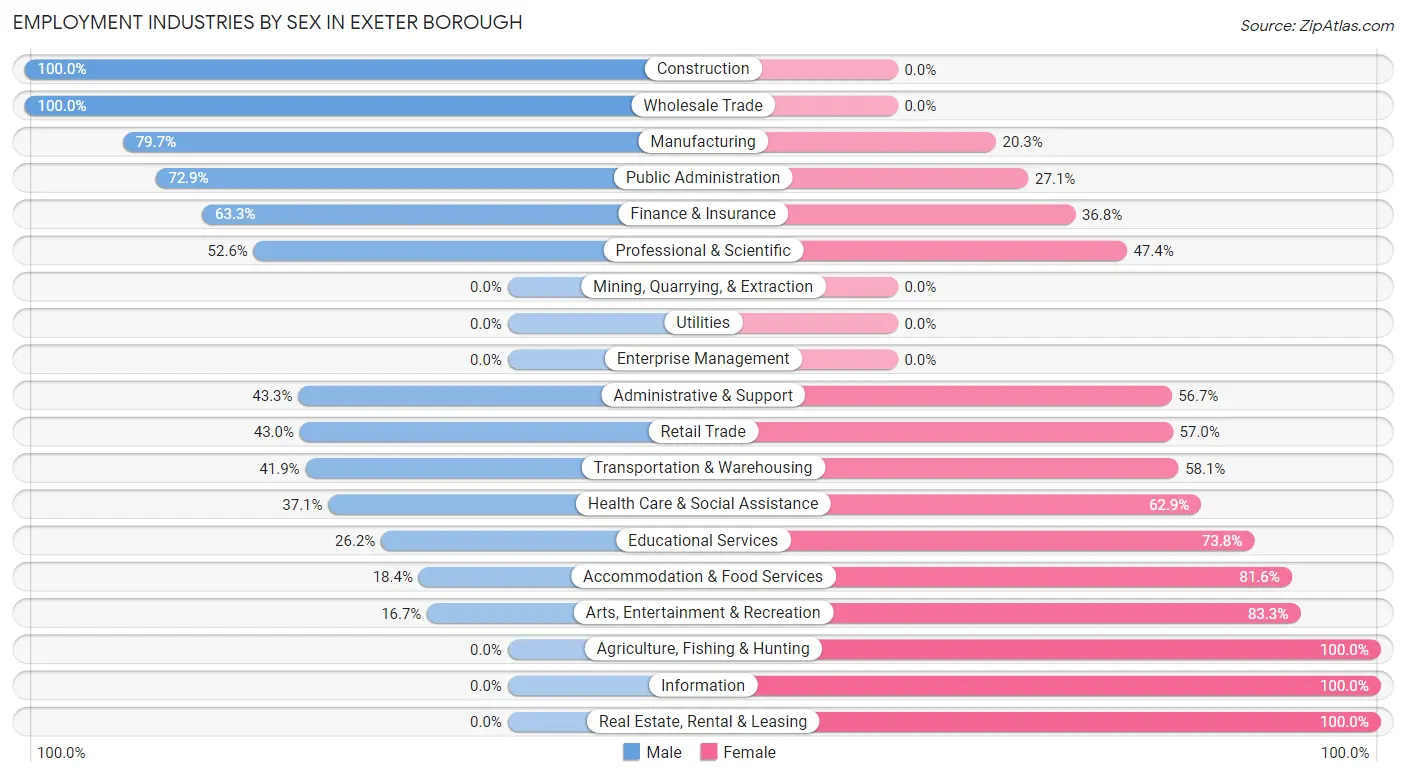
Employment Industries by Sex in Exeter borough
The Exeter borough industries that see more men than women are Construction (100.0%), Wholesale Trade (100.0%), and Manufacturing (79.7%), whereas the industries that tend to have a higher number of women are Agriculture, Fishing & Hunting (100.0%), Information (100.0%), and Real Estate, Rental & Leasing (100.0%).
| Industry | Male | Female |
| Agriculture, Fishing & Hunting | 0 (0.0%) | 31 (100.0%) |
| Mining, Quarrying, & Extraction | 0 (0.0%) | 0 (0.0%) |
| Construction | 123 (100.0%) | 0 (0.0%) |
| Manufacturing | 200 (79.7%) | 51 (20.3%) |
| Wholesale Trade | 52 (100.0%) | 0 (0.0%) |
| Retail Trade | 99 (43.0%) | 131 (57.0%) |
| Transportation & Warehousing | 67 (41.9%) | 93 (58.1%) |
| Utilities | 0 (0.0%) | 0 (0.0%) |
| Information | 0 (0.0%) | 13 (100.0%) |
| Finance & Insurance | 74 (63.2%) | 43 (36.7%) |
| Real Estate, Rental & Leasing | 0 (0.0%) | 13 (100.0%) |
| Professional & Scientific | 122 (52.6%) | 110 (47.4%) |
| Enterprise Management | 0 (0.0%) | 0 (0.0%) |
| Administrative & Support | 13 (43.3%) | 17 (56.7%) |
| Educational Services | 71 (26.2%) | 200 (73.8%) |
| Health Care & Social Assistance | 186 (37.1%) | 315 (62.9%) |
| Arts, Entertainment & Recreation | 12 (16.7%) | 60 (83.3%) |
| Accommodation & Food Services | 28 (18.4%) | 124 (81.6%) |
| Public Administration | 159 (72.9%) | 59 (27.1%) |
| Total | 1,240 (48.7%) | 1,306 (51.3%) |
Education in Exeter borough
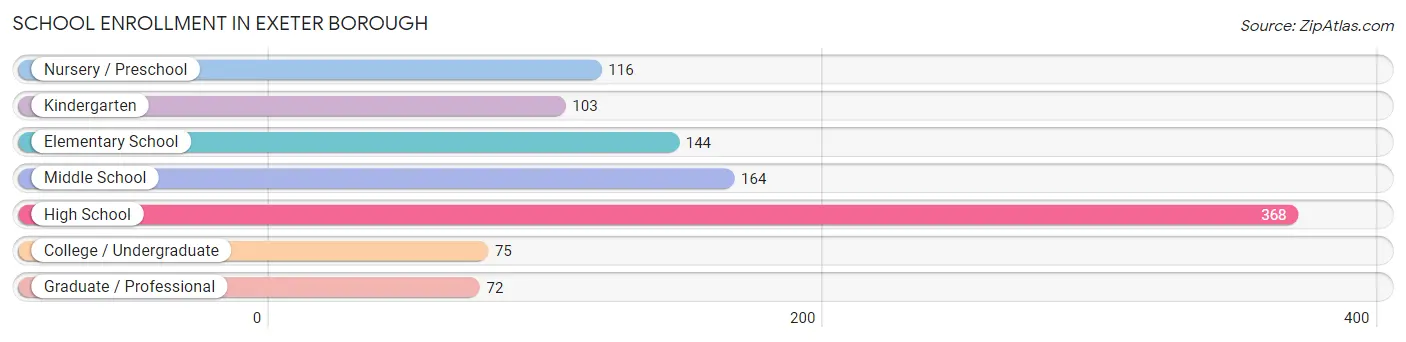
School Enrollment in Exeter borough
The most common levels of schooling among the 1,042 students in Exeter borough are high school (368 | 35.3%), middle school (164 | 15.7%), and elementary school (144 | 13.8%).
| School Level | # Students | % Students |
| Nursery / Preschool | 116 | 11.1% |
| Kindergarten | 103 | 9.9% |
| Elementary School | 144 | 13.8% |
| Middle School | 164 | 15.7% |
| High School | 368 | 35.3% |
| College / Undergraduate | 75 | 7.2% |
| Graduate / Professional | 72 | 6.9% |
| Total | 1,042 | 100.0% |
School Enrollment by Age by Funding Source in Exeter borough
Out of a total of 1,042 students who are enrolled in schools in Exeter borough, 294 (28.2%) attend a private institution, while the remaining 748 (71.8%) are enrolled in public schools. The age group of 35 years and over has the highest likelihood of being enrolled in private schools, with 38 (69.1% in the age bracket) enrolled. Conversely, the age group of 3 to 4 year olds has the lowest likelihood of being enrolled in a private school, with 19 (100.0% in the age bracket) attending a public institution.
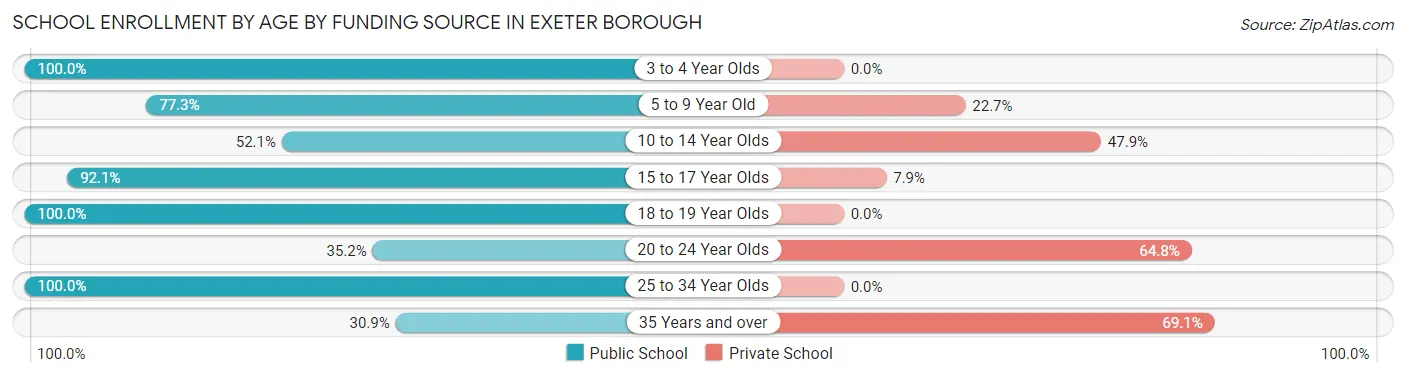
| Age Bracket | Public School | Private School |
| 3 to 4 Year Olds | 19 (100.0%) | 0 (0.0%) |
| 5 to 9 Year Old | 266 (77.3%) | 78 (22.7%) |
| 10 to 14 Year Olds | 137 (52.1%) | 126 (47.9%) |
| 15 to 17 Year Olds | 197 (92.1%) | 17 (7.9%) |
| 18 to 19 Year Olds | 71 (100.0%) | 0 (0.0%) |
| 20 to 24 Year Olds | 19 (35.2%) | 35 (64.8%) |
| 25 to 34 Year Olds | 22 (100.0%) | 0 (0.0%) |
| 35 Years and over | 17 (30.9%) | 38 (69.1%) |
| Total | 748 (71.8%) | 294 (28.2%) |
Educational Attainment by Field of Study in Exeter borough
Business (280 | 27.3%), education (264 | 25.8%), liberal arts & history (137 | 13.4%), science & technology (109 | 10.6%), and engineering (64 | 6.2%) are the most common fields of study among 1,025 individuals in Exeter borough who have obtained a bachelor's degree or higher.
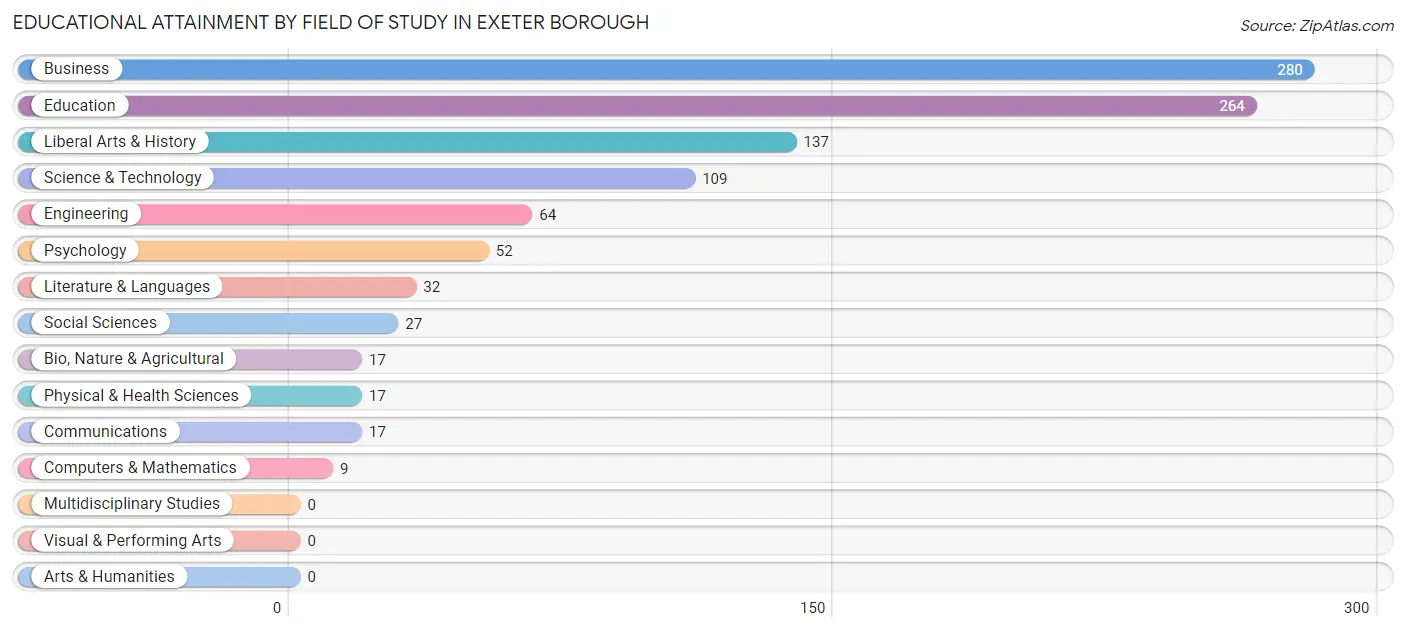
| Field of Study | # Graduates | % Graduates |
| Computers & Mathematics | 9 | 0.9% |
| Bio, Nature & Agricultural | 17 | 1.7% |
| Physical & Health Sciences | 17 | 1.7% |
| Psychology | 52 | 5.1% |
| Social Sciences | 27 | 2.6% |
| Engineering | 64 | 6.2% |
| Multidisciplinary Studies | 0 | 0.0% |
| Science & Technology | 109 | 10.6% |
| Business | 280 | 27.3% |
| Education | 264 | 25.8% |
| Literature & Languages | 32 | 3.1% |
| Liberal Arts & History | 137 | 13.4% |
| Visual & Performing Arts | 0 | 0.0% |
| Communications | 17 | 1.7% |
| Arts & Humanities | 0 | 0.0% |
| Total | 1,025 | 100.0% |
Transportation & Commute in Exeter borough
Vehicle Availability by Sex in Exeter borough
The most prevalent vehicle ownership categories in Exeter borough are males with 2 vehicles (646, accounting for 55.0%) and females with 2 vehicles (642, making up 50.1%).
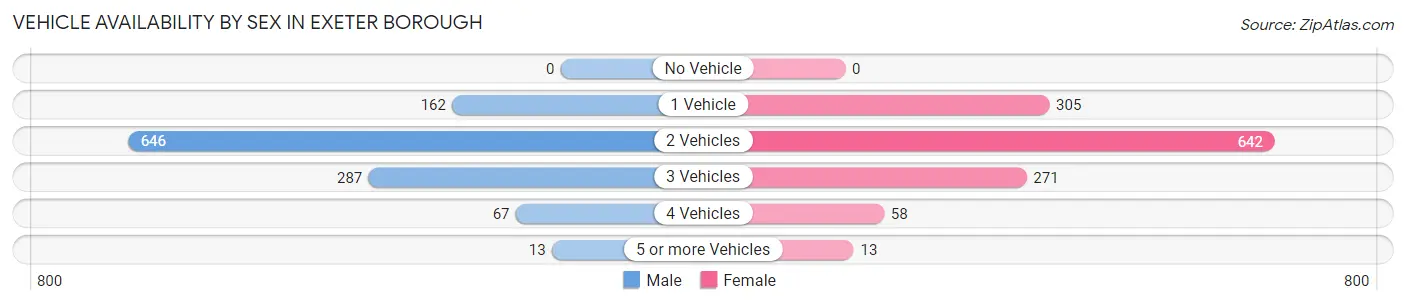
| Vehicles Available | Male | Female |
| No Vehicle | 0 (0.0%) | 0 (0.0%) |
| 1 Vehicle | 162 (13.8%) | 305 (23.7%) |
| 2 Vehicles | 646 (55.0%) | 642 (49.8%) |
| 3 Vehicles | 287 (24.4%) | 271 (21.0%) |
| 4 Vehicles | 67 (5.7%) | 58 (4.5%) |
| 5 or more Vehicles | 13 (1.1%) | 13 (1.0%) |
| Total | 1,175 (100.0%) | 1,289 (100.0%) |
Commute Time in Exeter borough
The most frequently occuring commute durations in Exeter borough are 10 to 14 minutes (392 commuters, 17.1%), 30 to 34 minutes (386 commuters, 16.9%), and 5 to 9 minutes (302 commuters, 13.2%).
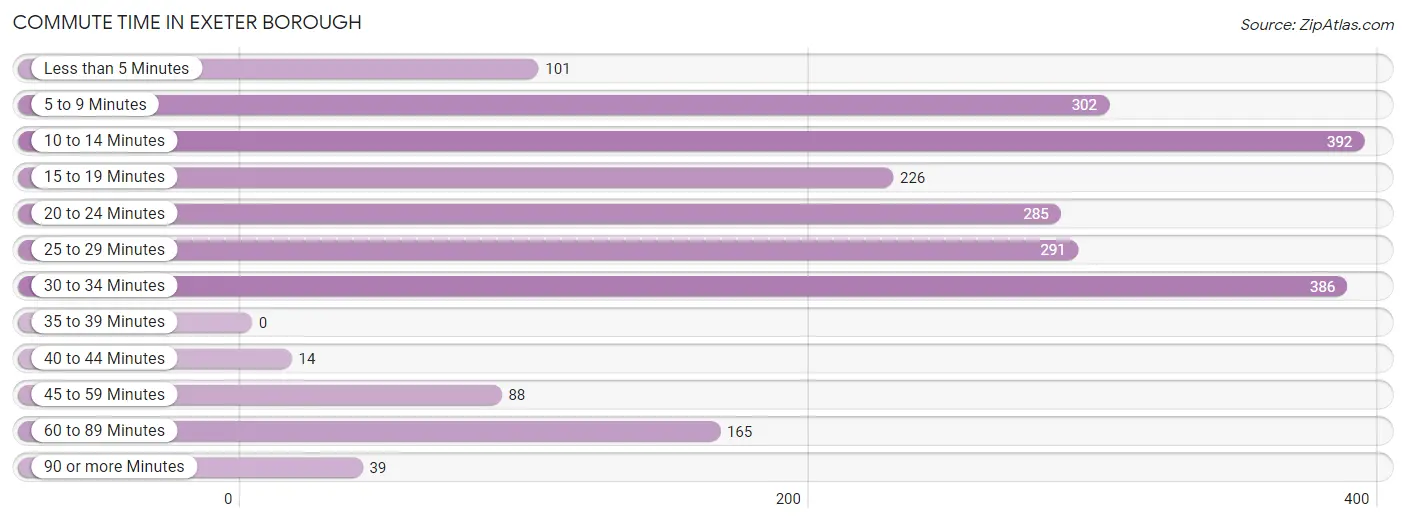
| Commute Time | # Commuters | % Commuters |
| Less than 5 Minutes | 101 | 4.4% |
| 5 to 9 Minutes | 302 | 13.2% |
| 10 to 14 Minutes | 392 | 17.1% |
| 15 to 19 Minutes | 226 | 9.9% |
| 20 to 24 Minutes | 285 | 12.4% |
| 25 to 29 Minutes | 291 | 12.7% |
| 30 to 34 Minutes | 386 | 16.9% |
| 35 to 39 Minutes | 0 | 0.0% |
| 40 to 44 Minutes | 14 | 0.6% |
| 45 to 59 Minutes | 88 | 3.8% |
| 60 to 89 Minutes | 165 | 7.2% |
| 90 or more Minutes | 39 | 1.7% |
Commute Time by Sex in Exeter borough
The most common commute times in Exeter borough are 30 to 34 minutes (287 commuters, 25.0%) for males and 5 to 9 minutes (209 commuters, 18.3%) for females.
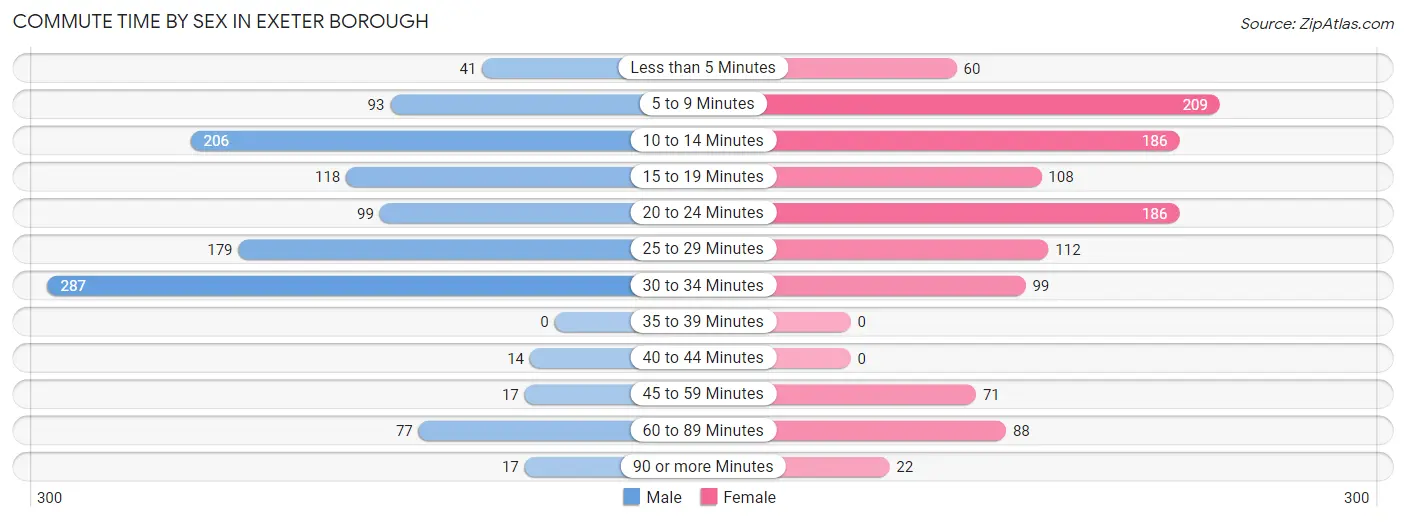
| Commute Time | Male | Female |
| Less than 5 Minutes | 41 (3.6%) | 60 (5.3%) |
| 5 to 9 Minutes | 93 (8.1%) | 209 (18.3%) |
| 10 to 14 Minutes | 206 (17.9%) | 186 (16.3%) |
| 15 to 19 Minutes | 118 (10.3%) | 108 (9.5%) |
| 20 to 24 Minutes | 99 (8.6%) | 186 (16.3%) |
| 25 to 29 Minutes | 179 (15.6%) | 112 (9.8%) |
| 30 to 34 Minutes | 287 (25.0%) | 99 (8.7%) |
| 35 to 39 Minutes | 0 (0.0%) | 0 (0.0%) |
| 40 to 44 Minutes | 14 (1.2%) | 0 (0.0%) |
| 45 to 59 Minutes | 17 (1.5%) | 71 (6.2%) |
| 60 to 89 Minutes | 77 (6.7%) | 88 (7.7%) |
| 90 or more Minutes | 17 (1.5%) | 22 (1.9%) |
Time of Departure to Work by Sex in Exeter borough
The most frequent times of departure to work in Exeter borough are 6:30 AM to 6:59 AM (233, 20.3%) for males and 7:30 AM to 7:59 AM (302, 26.5%) for females.
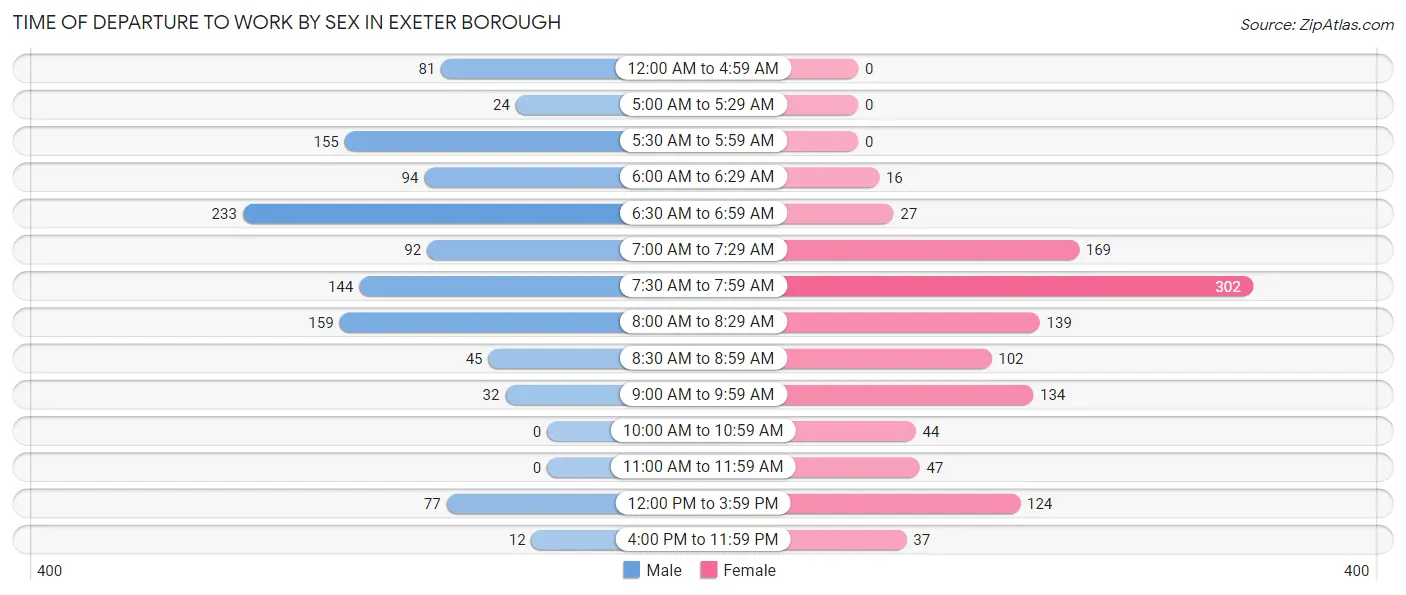
| Time of Departure | Male | Female |
| 12:00 AM to 4:59 AM | 81 (7.1%) | 0 (0.0%) |
| 5:00 AM to 5:29 AM | 24 (2.1%) | 0 (0.0%) |
| 5:30 AM to 5:59 AM | 155 (13.5%) | 0 (0.0%) |
| 6:00 AM to 6:29 AM | 94 (8.2%) | 16 (1.4%) |
| 6:30 AM to 6:59 AM | 233 (20.3%) | 27 (2.4%) |
| 7:00 AM to 7:29 AM | 92 (8.0%) | 169 (14.8%) |
| 7:30 AM to 7:59 AM | 144 (12.5%) | 302 (26.5%) |
| 8:00 AM to 8:29 AM | 159 (13.9%) | 139 (12.2%) |
| 8:30 AM to 8:59 AM | 45 (3.9%) | 102 (8.9%) |
| 9:00 AM to 9:59 AM | 32 (2.8%) | 134 (11.7%) |
| 10:00 AM to 10:59 AM | 0 (0.0%) | 44 (3.9%) |
| 11:00 AM to 11:59 AM | 0 (0.0%) | 47 (4.1%) |
| 12:00 PM to 3:59 PM | 77 (6.7%) | 124 (10.9%) |
| 4:00 PM to 11:59 PM | 12 (1.1%) | 37 (3.2%) |
| Total | 1,148 (100.0%) | 1,141 (100.0%) |
Housing Occupancy in Exeter borough
Occupancy by Ownership in Exeter borough
Of the total 2,486 dwellings in Exeter borough, owner-occupied units account for 2,006 (80.7%), while renter-occupied units make up 480 (19.3%).
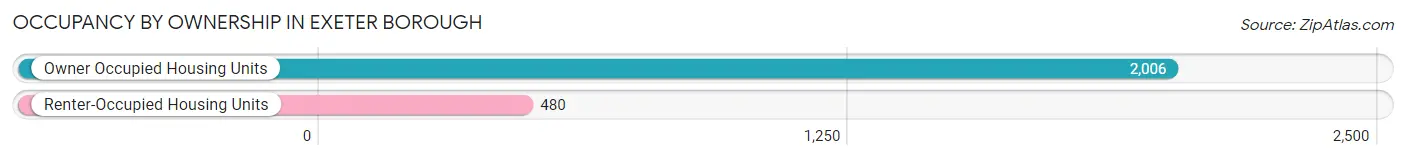
| Occupancy | # Housing Units | % Housing Units |
| Owner Occupied Housing Units | 2,006 | 80.7% |
| Renter-Occupied Housing Units | 480 | 19.3% |
| Total Occupied Housing Units | 2,486 | 100.0% |
Occupancy by Household Size in Exeter borough
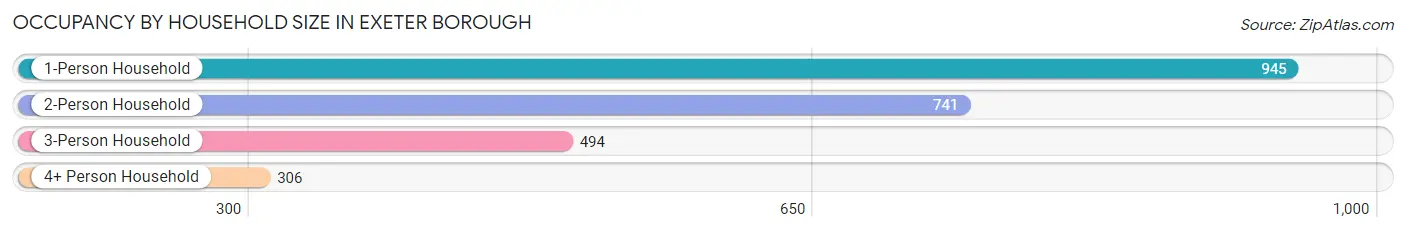
| Household Size | # Housing Units | % Housing Units |
| 1-Person Household | 945 | 38.0% |
| 2-Person Household | 741 | 29.8% |
| 3-Person Household | 494 | 19.9% |
| 4+ Person Household | 306 | 12.3% |
| Total Housing Units | 2,486 | 100.0% |
Occupancy by Ownership by Household Size in Exeter borough
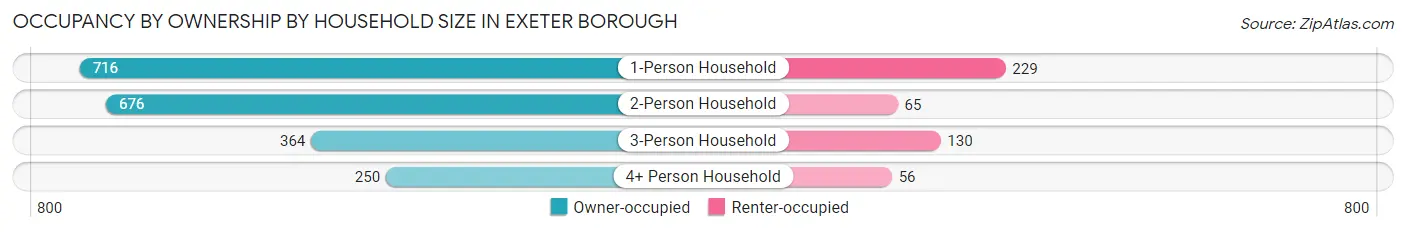
| Household Size | Owner-occupied | Renter-occupied |
| 1-Person Household | 716 (75.8%) | 229 (24.2%) |
| 2-Person Household | 676 (91.2%) | 65 (8.8%) |
| 3-Person Household | 364 (73.7%) | 130 (26.3%) |
| 4+ Person Household | 250 (81.7%) | 56 (18.3%) |
| Total Housing Units | 2,006 (80.7%) | 480 (19.3%) |
Occupancy by Educational Attainment in Exeter borough
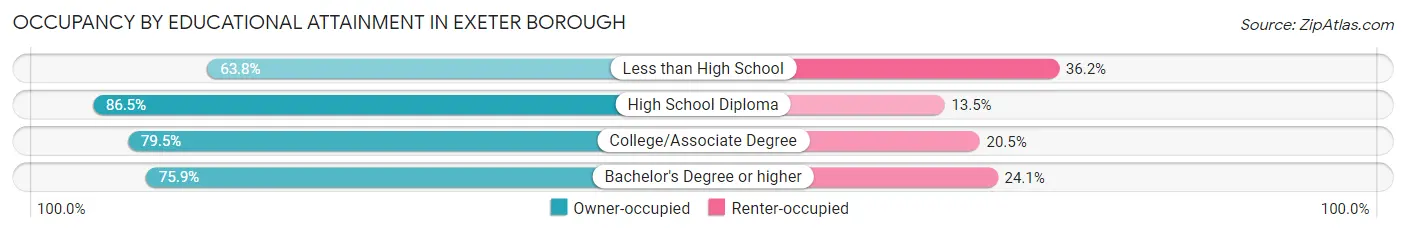
| Household Size | Owner-occupied | Renter-occupied |
| Less than High School | 88 (63.8%) | 50 (36.2%) |
| High School Diploma | 907 (86.5%) | 142 (13.5%) |
| College/Associate Degree | 547 (79.5%) | 141 (20.5%) |
| Bachelor's Degree or higher | 464 (75.9%) | 147 (24.1%) |
Occupancy by Age of Householder in Exeter borough
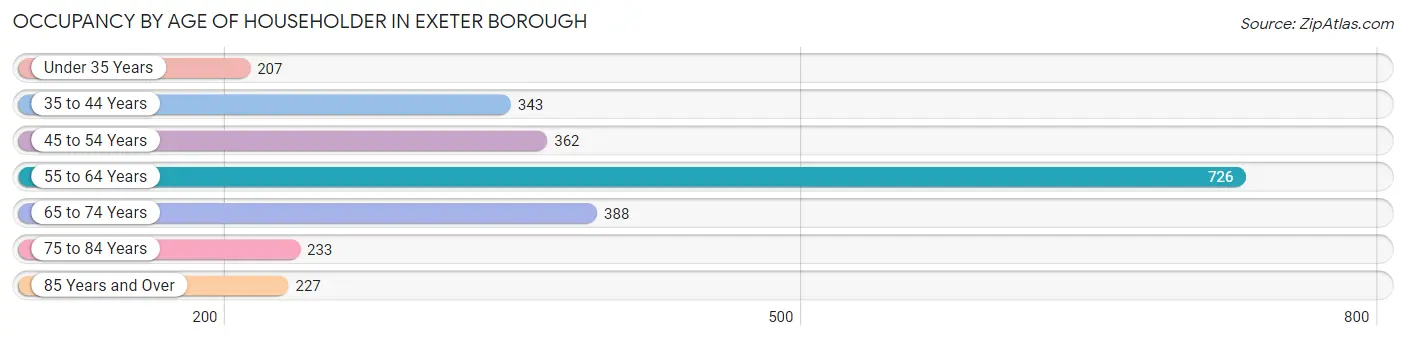
| Age Bracket | # Households | % Households |
| Under 35 Years | 207 | 8.3% |
| 35 to 44 Years | 343 | 13.8% |
| 45 to 54 Years | 362 | 14.6% |
| 55 to 64 Years | 726 | 29.2% |
| 65 to 74 Years | 388 | 15.6% |
| 75 to 84 Years | 233 | 9.4% |
| 85 Years and Over | 227 | 9.1% |
| Total | 2,486 | 100.0% |
Housing Finances in Exeter borough
Median Income by Occupancy in Exeter borough
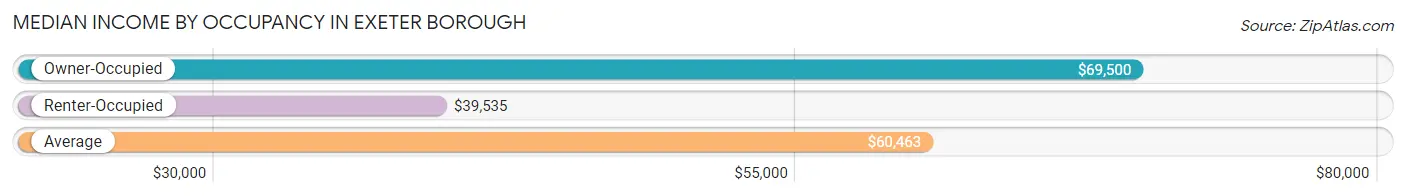
| Occupancy Type | # Households | Median Income |
| Owner-Occupied | 2,006 (80.7%) | $69,500 |
| Renter-Occupied | 480 (19.3%) | $39,535 |
| Average | 2,486 (100.0%) | $60,463 |
Occupancy by Householder Income Bracket in Exeter borough
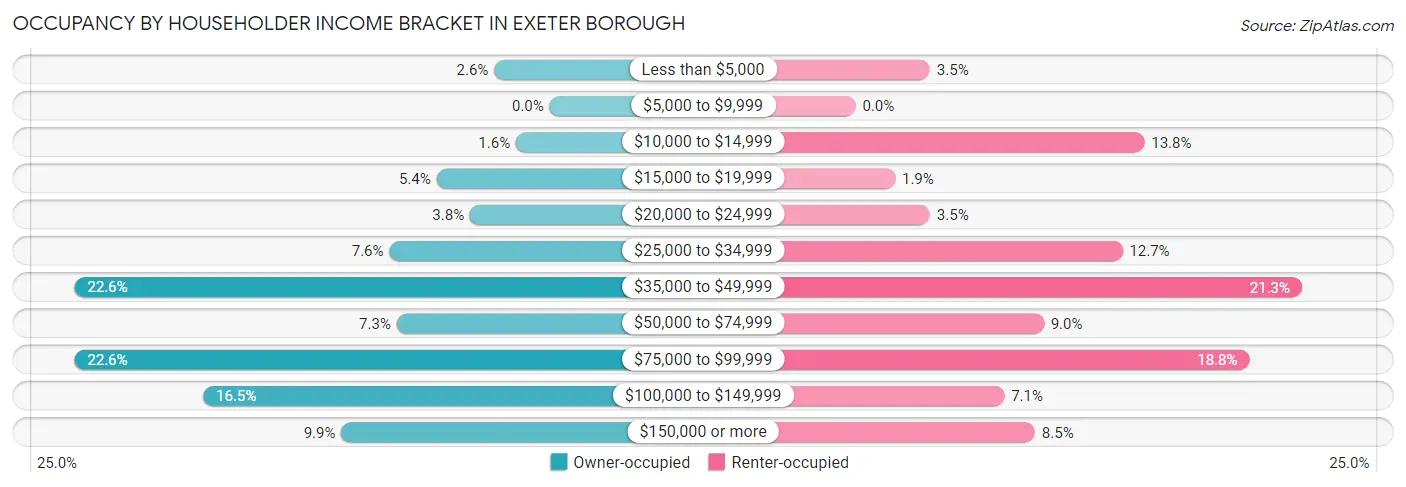
| Income Bracket | Owner-occupied | Renter-occupied |
| Less than $5,000 | 53 (2.6%) | 17 (3.5%) |
| $5,000 to $9,999 | 0 (0.0%) | 0 (0.0%) |
| $10,000 to $14,999 | 32 (1.6%) | 66 (13.8%) |
| $15,000 to $19,999 | 108 (5.4%) | 9 (1.9%) |
| $20,000 to $24,999 | 76 (3.8%) | 17 (3.5%) |
| $25,000 to $34,999 | 153 (7.6%) | 61 (12.7%) |
| $35,000 to $49,999 | 454 (22.6%) | 102 (21.2%) |
| $50,000 to $74,999 | 146 (7.3%) | 43 (9.0%) |
| $75,000 to $99,999 | 454 (22.6%) | 90 (18.8%) |
| $100,000 to $149,999 | 331 (16.5%) | 34 (7.1%) |
| $150,000 or more | 199 (9.9%) | 41 (8.5%) |
| Total | 2,006 (100.0%) | 480 (100.0%) |
Monthly Housing Cost Tiers in Exeter borough
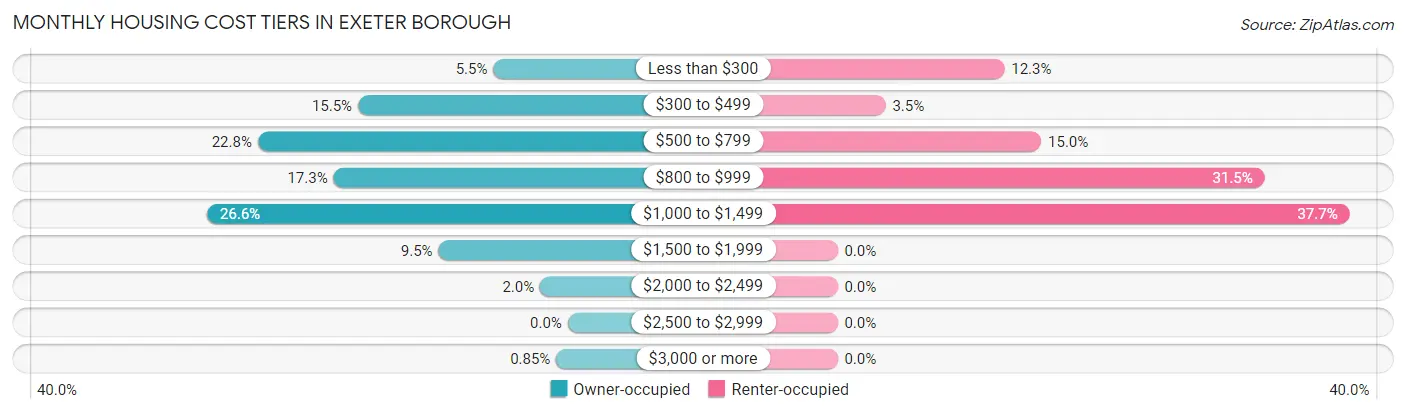
| Monthly Cost | Owner-occupied | Renter-occupied |
| Less than $300 | 110 (5.5%) | 59 (12.3%) |
| $300 to $499 | 310 (15.4%) | 17 (3.5%) |
| $500 to $799 | 458 (22.8%) | 72 (15.0%) |
| $800 to $999 | 346 (17.2%) | 151 (31.5%) |
| $1,000 to $1,499 | 533 (26.6%) | 181 (37.7%) |
| $1,500 to $1,999 | 191 (9.5%) | 0 (0.0%) |
| $2,000 to $2,499 | 41 (2.0%) | 0 (0.0%) |
| $2,500 to $2,999 | 0 (0.0%) | 0 (0.0%) |
| $3,000 or more | 17 (0.9%) | 0 (0.0%) |
| Total | 2,006 (100.0%) | 480 (100.0%) |
Physical Housing Characteristics in Exeter borough
Housing Structures in Exeter borough
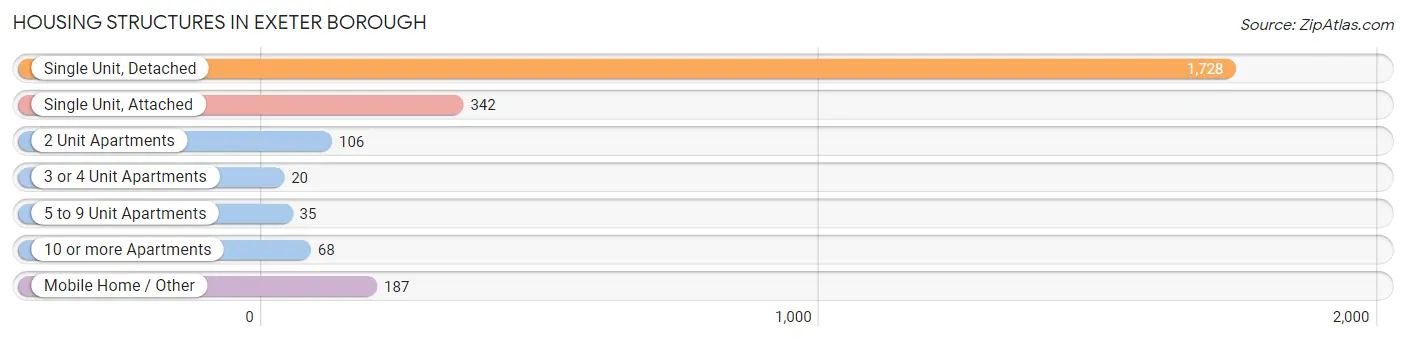
| Structure Type | # Housing Units | % Housing Units |
| Single Unit, Detached | 1,728 | 69.5% |
| Single Unit, Attached | 342 | 13.8% |
| 2 Unit Apartments | 106 | 4.3% |
| 3 or 4 Unit Apartments | 20 | 0.8% |
| 5 to 9 Unit Apartments | 35 | 1.4% |
| 10 or more Apartments | 68 | 2.7% |
| Mobile Home / Other | 187 | 7.5% |
| Total | 2,486 | 100.0% |
Housing Structures by Occupancy in Exeter borough
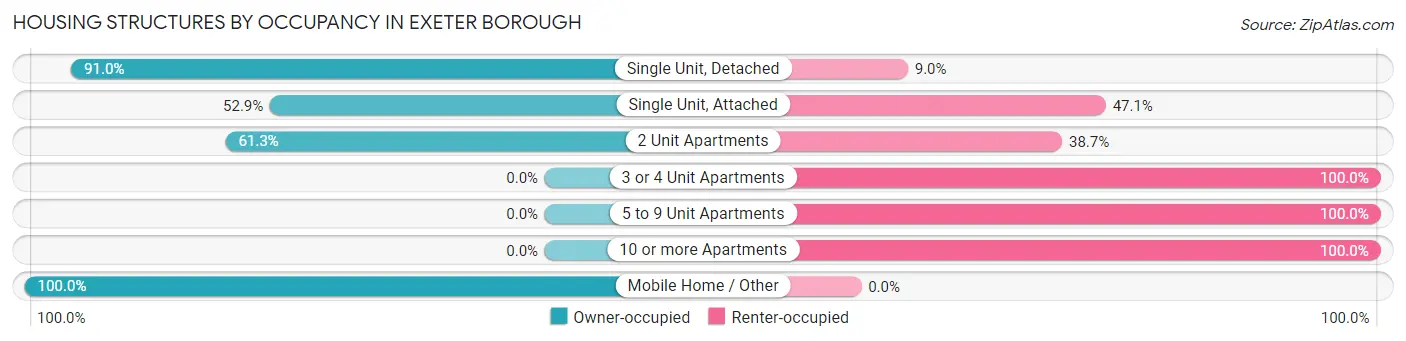
| Structure Type | Owner-occupied | Renter-occupied |
| Single Unit, Detached | 1,573 (91.0%) | 155 (9.0%) |
| Single Unit, Attached | 181 (52.9%) | 161 (47.1%) |
| 2 Unit Apartments | 65 (61.3%) | 41 (38.7%) |
| 3 or 4 Unit Apartments | 0 (0.0%) | 20 (100.0%) |
| 5 to 9 Unit Apartments | 0 (0.0%) | 35 (100.0%) |
| 10 or more Apartments | 0 (0.0%) | 68 (100.0%) |
| Mobile Home / Other | 187 (100.0%) | 0 (0.0%) |
| Total | 2,006 (80.7%) | 480 (19.3%) |
Housing Structures by Number of Rooms in Exeter borough
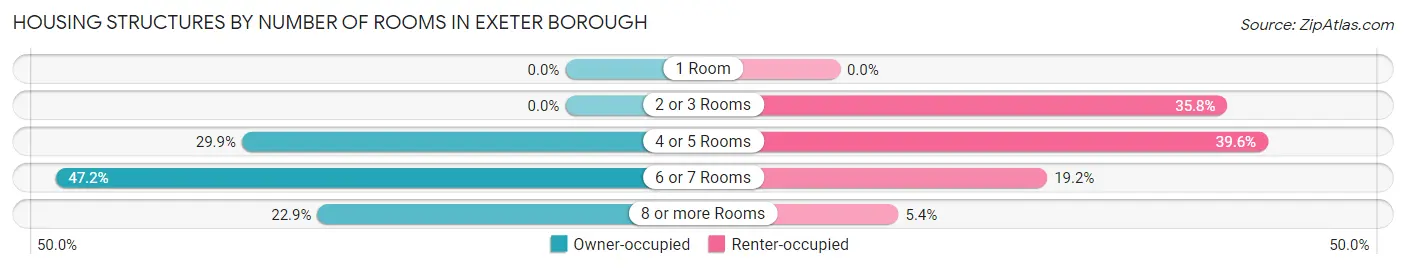
| Number of Rooms | Owner-occupied | Renter-occupied |
| 1 Room | 0 (0.0%) | 0 (0.0%) |
| 2 or 3 Rooms | 0 (0.0%) | 172 (35.8%) |
| 4 or 5 Rooms | 600 (29.9%) | 190 (39.6%) |
| 6 or 7 Rooms | 946 (47.2%) | 92 (19.2%) |
| 8 or more Rooms | 460 (22.9%) | 26 (5.4%) |
| Total | 2,006 (100.0%) | 480 (100.0%) |
Housing Structure by Heating Type in Exeter borough
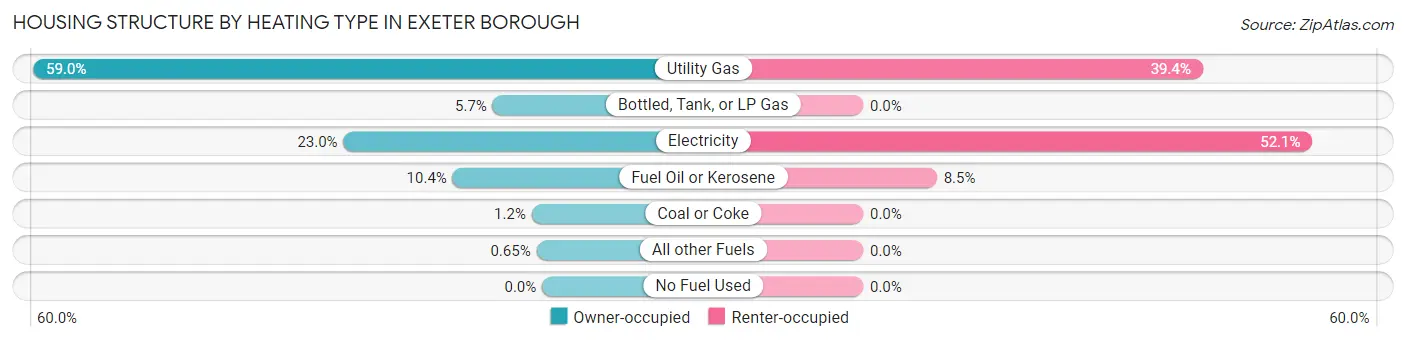
| Heating Type | Owner-occupied | Renter-occupied |
| Utility Gas | 1,184 (59.0%) | 189 (39.4%) |
| Bottled, Tank, or LP Gas | 115 (5.7%) | 0 (0.0%) |
| Electricity | 462 (23.0%) | 250 (52.1%) |
| Fuel Oil or Kerosene | 208 (10.4%) | 41 (8.5%) |
| Coal or Coke | 24 (1.2%) | 0 (0.0%) |
| All other Fuels | 13 (0.6%) | 0 (0.0%) |
| No Fuel Used | 0 (0.0%) | 0 (0.0%) |
| Total | 2,006 (100.0%) | 480 (100.0%) |
Household Vehicle Usage in Exeter borough
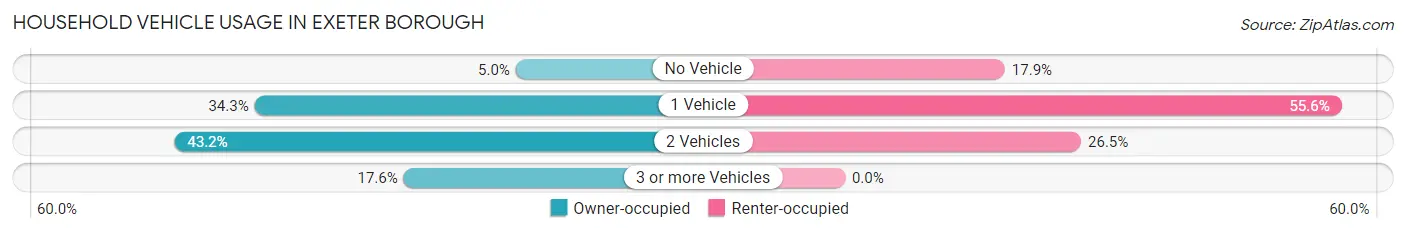
| Vehicles per Household | Owner-occupied | Renter-occupied |
| No Vehicle | 100 (5.0%) | 86 (17.9%) |
| 1 Vehicle | 687 (34.3%) | 267 (55.6%) |
| 2 Vehicles | 867 (43.2%) | 127 (26.5%) |
| 3 or more Vehicles | 352 (17.5%) | 0 (0.0%) |
| Total | 2,006 (100.0%) | 480 (100.0%) |
Real Estate & Mortgages in Exeter borough
Real Estate and Mortgage Overview in Exeter borough
| Characteristic | Without Mortgage | With Mortgage |
| Housing Units | 1,181 | 825 |
| Median Property Value | $128,900 | $140,400 |
| Median Household Income | $45,276 | $90 |
| Monthly Housing Costs | $628 | $17 |
| Real Estate Taxes | $2,793 | $13 |
Property Value by Mortgage Status in Exeter borough
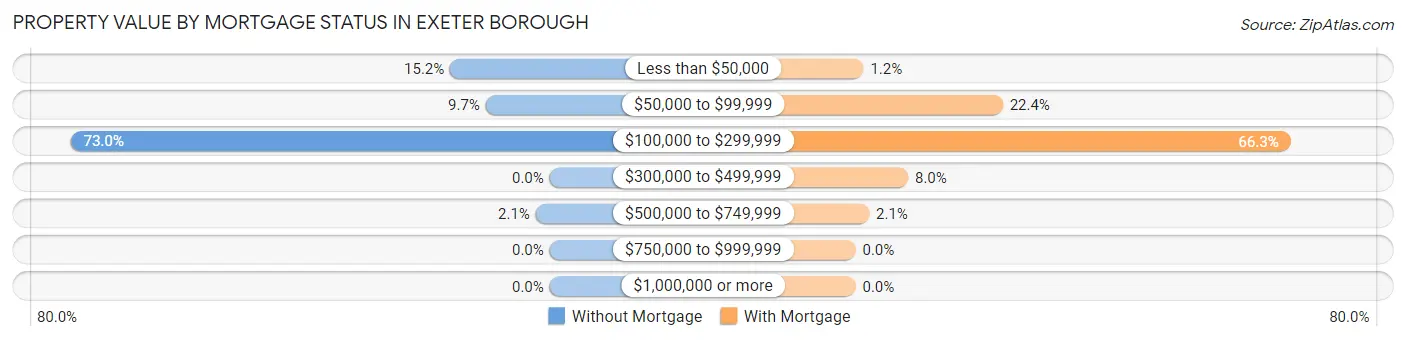
| Property Value | Without Mortgage | With Mortgage |
| Less than $50,000 | 179 (15.2%) | 10 (1.2%) |
| $50,000 to $99,999 | 115 (9.7%) | 185 (22.4%) |
| $100,000 to $299,999 | 862 (73.0%) | 547 (66.3%) |
| $300,000 to $499,999 | 0 (0.0%) | 66 (8.0%) |
| $500,000 to $749,999 | 25 (2.1%) | 17 (2.1%) |
| $750,000 to $999,999 | 0 (0.0%) | 0 (0.0%) |
| $1,000,000 or more | 0 (0.0%) | 0 (0.0%) |
| Total | 1,181 (100.0%) | 825 (100.0%) |
Household Income by Mortgage Status in Exeter borough
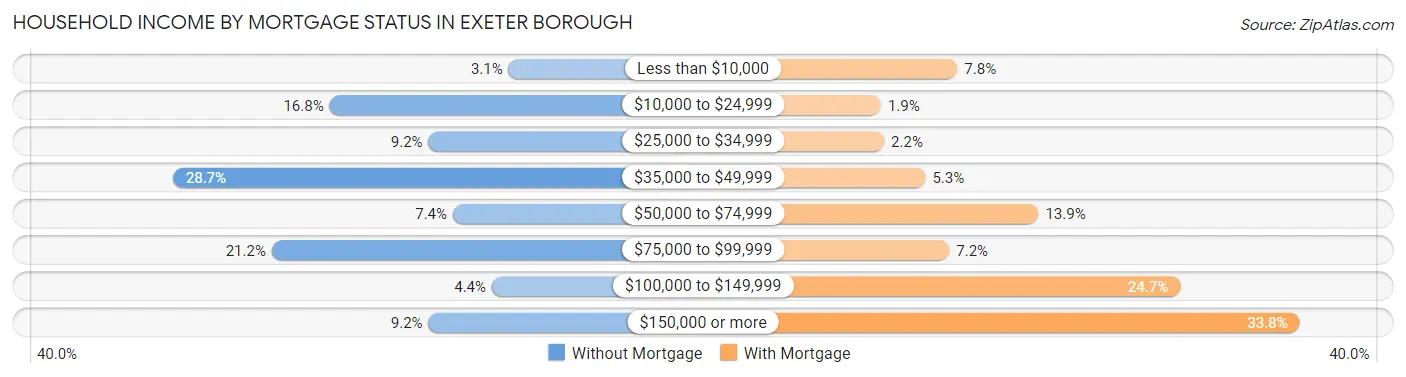
| Household Income | Without Mortgage | With Mortgage |
| Less than $10,000 | 37 (3.1%) | 64 (7.8%) |
| $10,000 to $24,999 | 198 (16.8%) | 16 (1.9%) |
| $25,000 to $34,999 | 109 (9.2%) | 18 (2.2%) |
| $35,000 to $49,999 | 339 (28.7%) | 44 (5.3%) |
| $50,000 to $74,999 | 87 (7.4%) | 115 (13.9%) |
| $75,000 to $99,999 | 250 (21.2%) | 59 (7.1%) |
| $100,000 to $149,999 | 52 (4.4%) | 204 (24.7%) |
| $150,000 or more | 109 (9.2%) | 279 (33.8%) |
| Total | 1,181 (100.0%) | 825 (100.0%) |
Property Value to Household Income Ratio in Exeter borough
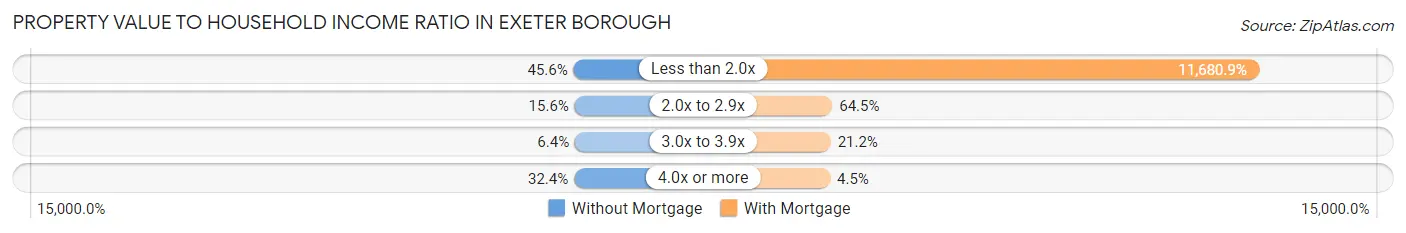
| Value-to-Income Ratio | Without Mortgage | With Mortgage |
| Less than 2.0x | 538 (45.6%) | 96,367 (11,680.8%) |
| 2.0x to 2.9x | 184 (15.6%) | 532 (64.5%) |
| 3.0x to 3.9x | 76 (6.4%) | 175 (21.2%) |
| 4.0x or more | 383 (32.4%) | 37 (4.5%) |
| Total | 1,181 (100.0%) | 825 (100.0%) |
Real Estate Taxes by Mortgage Status in Exeter borough
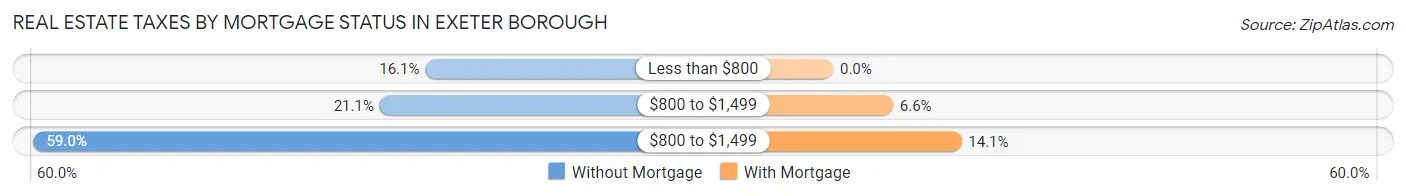
| Property Taxes | Without Mortgage | With Mortgage |
| Less than $800 | 190 (16.1%) | 0 (0.0%) |
| $800 to $1,499 | 249 (21.1%) | 54 (6.6%) |
| $800 to $1,499 | 697 (59.0%) | 116 (14.1%) |
| Total | 1,181 (100.0%) | 825 (100.0%) |
Health & Disability in Exeter borough
Health Insurance Coverage by Age in Exeter borough
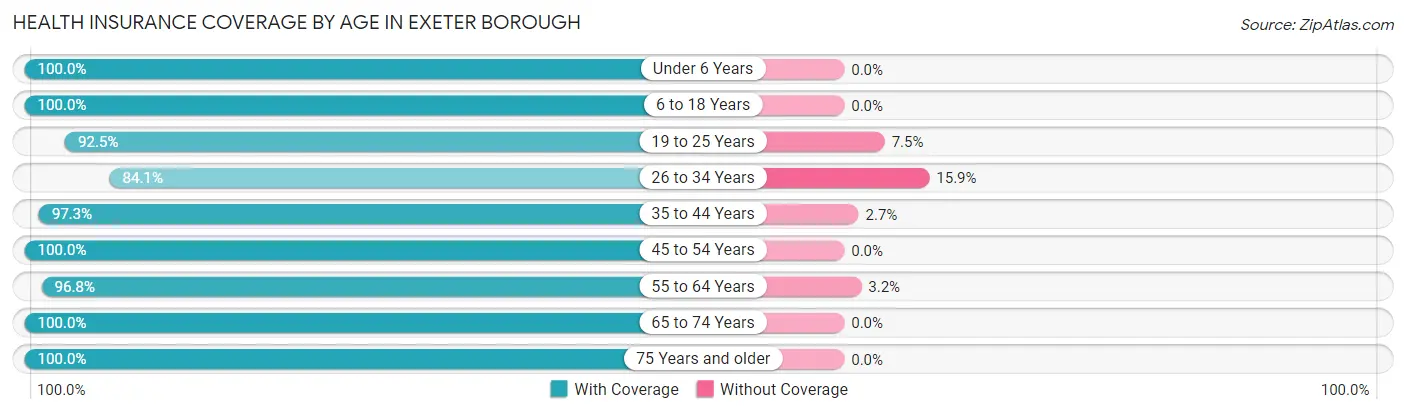
| Age Bracket | With Coverage | Without Coverage |
| Under 6 Years | 298 (100.0%) | 0 (0.0%) |
| 6 to 18 Years | 758 (100.0%) | 0 (0.0%) |
| 19 to 25 Years | 319 (92.5%) | 26 (7.5%) |
| 26 to 34 Years | 366 (84.1%) | 69 (15.9%) |
| 35 to 44 Years | 622 (97.3%) | 17 (2.7%) |
| 45 to 54 Years | 597 (100.0%) | 0 (0.0%) |
| 55 to 64 Years | 973 (96.8%) | 32 (3.2%) |
| 65 to 74 Years | 751 (100.0%) | 0 (0.0%) |
| 75 Years and older | 562 (100.0%) | 0 (0.0%) |
| Total | 5,246 (97.3%) | 144 (2.7%) |
Health Insurance Coverage by Citizenship Status in Exeter borough
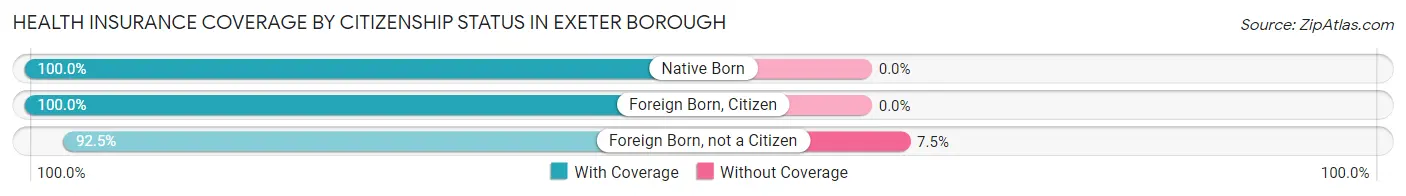
| Citizenship Status | With Coverage | Without Coverage |
| Native Born | 298 (100.0%) | 0 (0.0%) |
| Foreign Born, Citizen | 758 (100.0%) | 0 (0.0%) |
| Foreign Born, not a Citizen | 319 (92.5%) | 26 (7.5%) |
Health Insurance Coverage by Household Income in Exeter borough
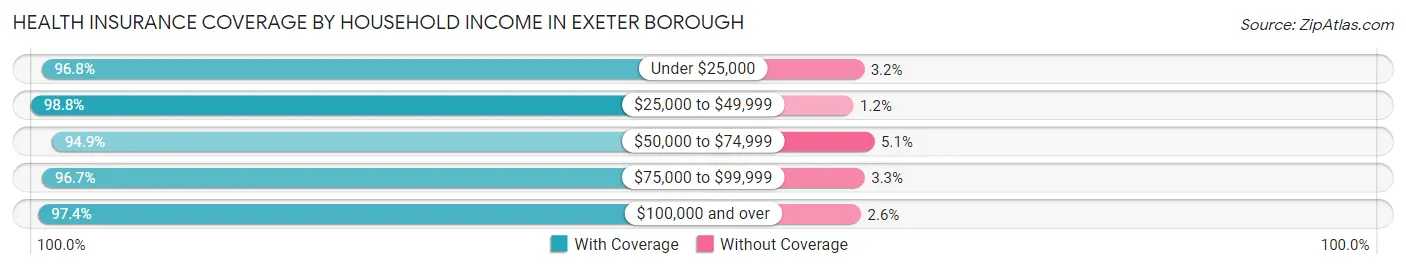
| Household Income | With Coverage | Without Coverage |
| Under $25,000 | 580 (96.8%) | 19 (3.2%) |
| $25,000 to $49,999 | 1,408 (98.8%) | 17 (1.2%) |
| $50,000 to $74,999 | 481 (94.9%) | 26 (5.1%) |
| $75,000 to $99,999 | 1,154 (96.7%) | 39 (3.3%) |
| $100,000 and over | 1,618 (97.4%) | 43 (2.6%) |
Public vs Private Health Insurance Coverage by Age in Exeter borough
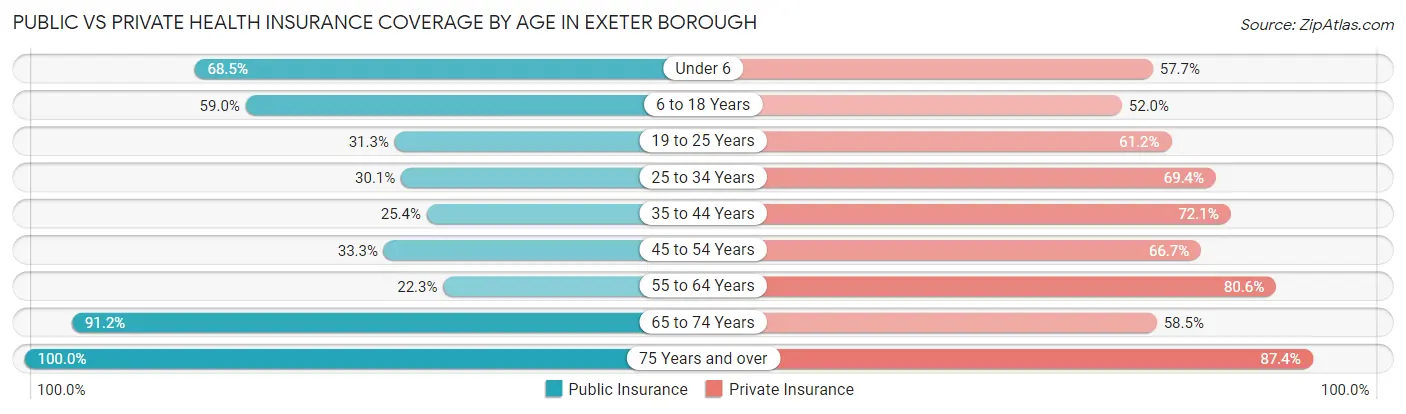
| Age Bracket | Public Insurance | Private Insurance |
| Under 6 | 204 (68.5%) | 172 (57.7%) |
| 6 to 18 Years | 447 (59.0%) | 394 (52.0%) |
| 19 to 25 Years | 108 (31.3%) | 211 (61.2%) |
| 25 to 34 Years | 131 (30.1%) | 302 (69.4%) |
| 35 to 44 Years | 162 (25.4%) | 461 (72.1%) |
| 45 to 54 Years | 199 (33.3%) | 398 (66.7%) |
| 55 to 64 Years | 224 (22.3%) | 810 (80.6%) |
| 65 to 74 Years | 685 (91.2%) | 439 (58.5%) |
| 75 Years and over | 562 (100.0%) | 491 (87.4%) |
| Total | 2,722 (50.5%) | 3,678 (68.2%) |
Disability Status by Sex by Age in Exeter borough
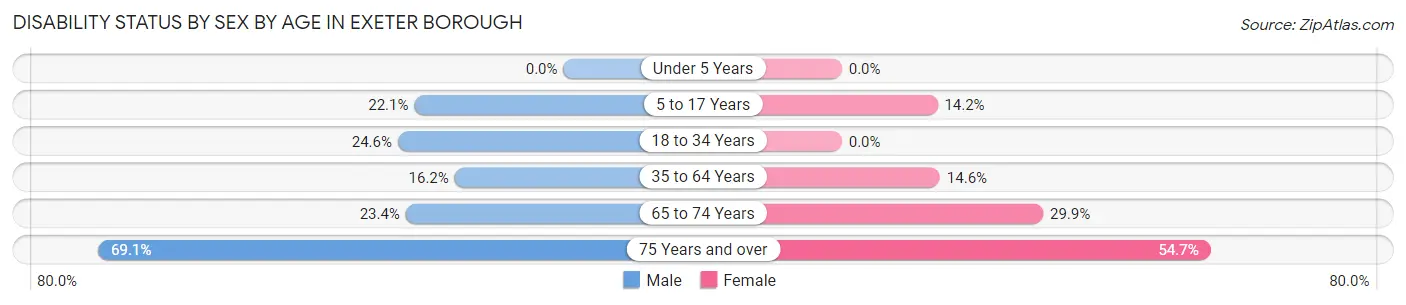
| Age Bracket | Male | Female |
| Under 5 Years | 0 (0.0%) | 0 (0.0%) |
| 5 to 17 Years | 87 (22.1%) | 68 (14.2%) |
| 18 to 34 Years | 117 (24.6%) | 0 (0.0%) |
| 35 to 64 Years | 178 (16.2%) | 166 (14.6%) |
| 65 to 74 Years | 81 (23.4%) | 121 (29.9%) |
| 75 Years and over | 199 (69.1%) | 150 (54.7%) |
Disability Class by Sex by Age in Exeter borough
Disability Class: Hearing Difficulty
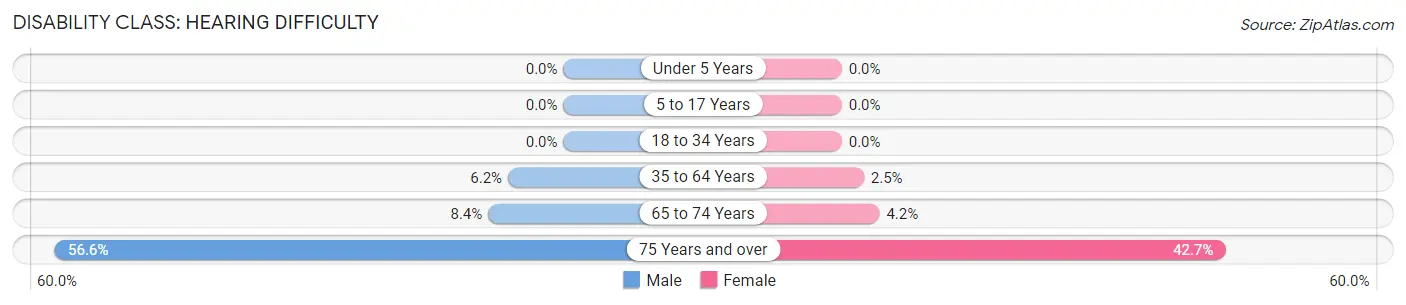
| Age Bracket | Male | Female |
| Under 5 Years | 0 (0.0%) | 0 (0.0%) |
| 5 to 17 Years | 0 (0.0%) | 0 (0.0%) |
| 18 to 34 Years | 0 (0.0%) | 0 (0.0%) |
| 35 to 64 Years | 68 (6.2%) | 28 (2.5%) |
| 65 to 74 Years | 29 (8.4%) | 17 (4.2%) |
| 75 Years and over | 163 (56.6%) | 117 (42.7%) |
Disability Class: Vision Difficulty
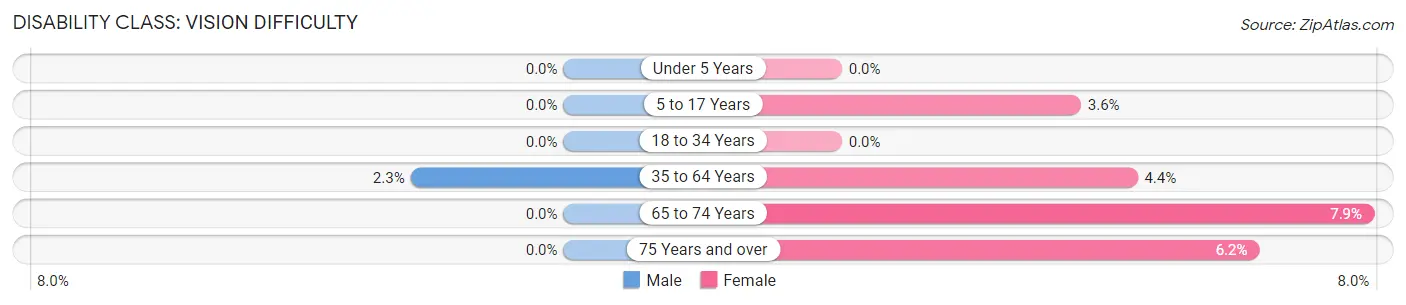
| Age Bracket | Male | Female |
| Under 5 Years | 0 (0.0%) | 0 (0.0%) |
| 5 to 17 Years | 0 (0.0%) | 17 (3.5%) |
| 18 to 34 Years | 0 (0.0%) | 0 (0.0%) |
| 35 to 64 Years | 25 (2.3%) | 50 (4.4%) |
| 65 to 74 Years | 0 (0.0%) | 32 (7.9%) |
| 75 Years and over | 0 (0.0%) | 17 (6.2%) |
Disability Class: Cognitive Difficulty
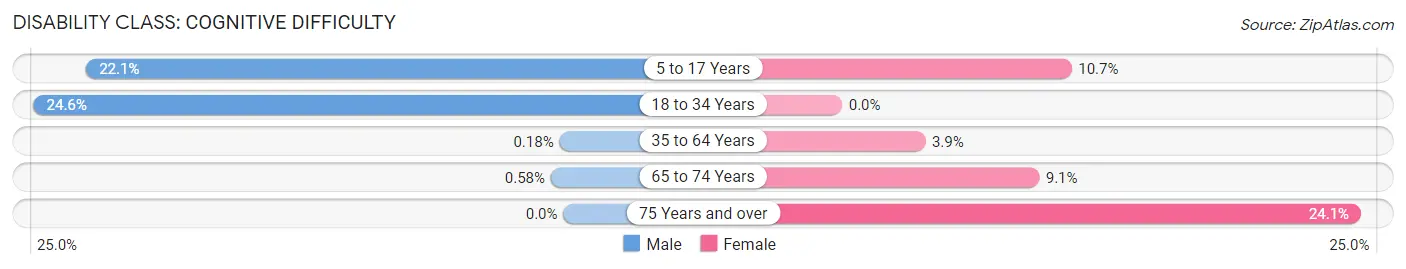
| Age Bracket | Male | Female |
| 5 to 17 Years | 87 (22.1%) | 51 (10.6%) |
| 18 to 34 Years | 117 (24.6%) | 0 (0.0%) |
| 35 to 64 Years | 2 (0.2%) | 44 (3.9%) |
| 65 to 74 Years | 2 (0.6%) | 37 (9.1%) |
| 75 Years and over | 0 (0.0%) | 66 (24.1%) |
Disability Class: Ambulatory Difficulty
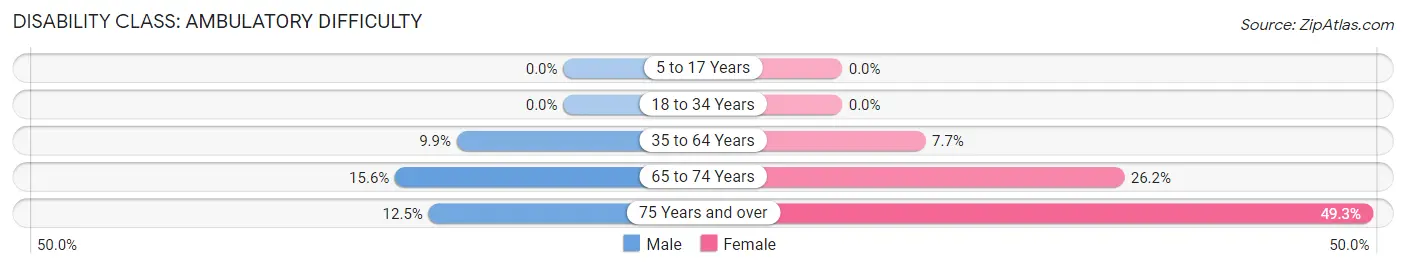
| Age Bracket | Male | Female |
| 5 to 17 Years | 0 (0.0%) | 0 (0.0%) |
| 18 to 34 Years | 0 (0.0%) | 0 (0.0%) |
| 35 to 64 Years | 109 (9.9%) | 88 (7.7%) |
| 65 to 74 Years | 54 (15.6%) | 106 (26.2%) |
| 75 Years and over | 36 (12.5%) | 135 (49.3%) |
Disability Class: Self-Care Difficulty
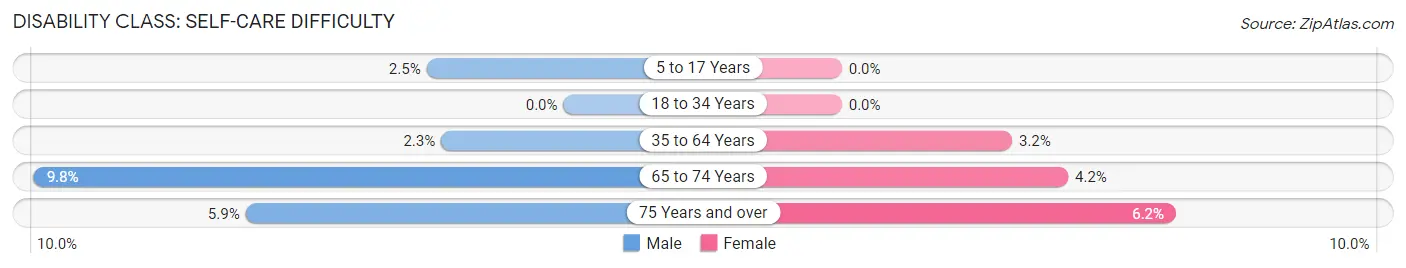
| Age Bracket | Male | Female |
| 5 to 17 Years | 10 (2.5%) | 0 (0.0%) |
| 18 to 34 Years | 0 (0.0%) | 0 (0.0%) |
| 35 to 64 Years | 25 (2.3%) | 36 (3.2%) |
| 65 to 74 Years | 34 (9.8%) | 17 (4.2%) |
| 75 Years and over | 17 (5.9%) | 17 (6.2%) |
Technology Access in Exeter borough
Computing Device Access in Exeter borough
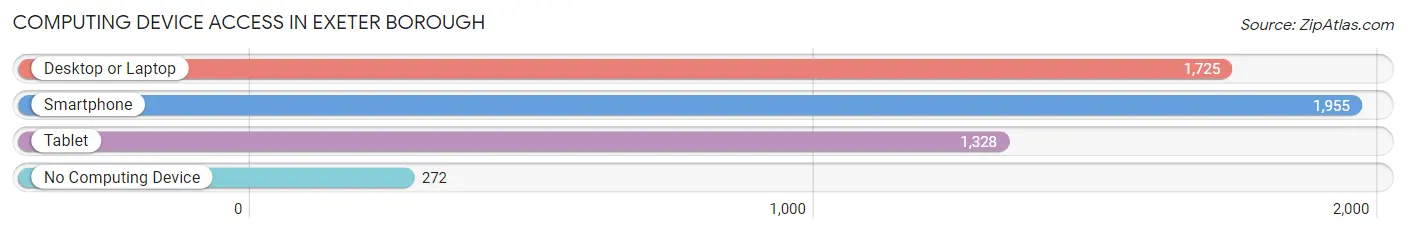
| Device Type | # Households | % Households |
| Desktop or Laptop | 1,725 | 69.4% |
| Smartphone | 1,955 | 78.6% |
| Tablet | 1,328 | 53.4% |
| No Computing Device | 272 | 10.9% |
| Total | 2,486 | 100.0% |
Internet Access in Exeter borough
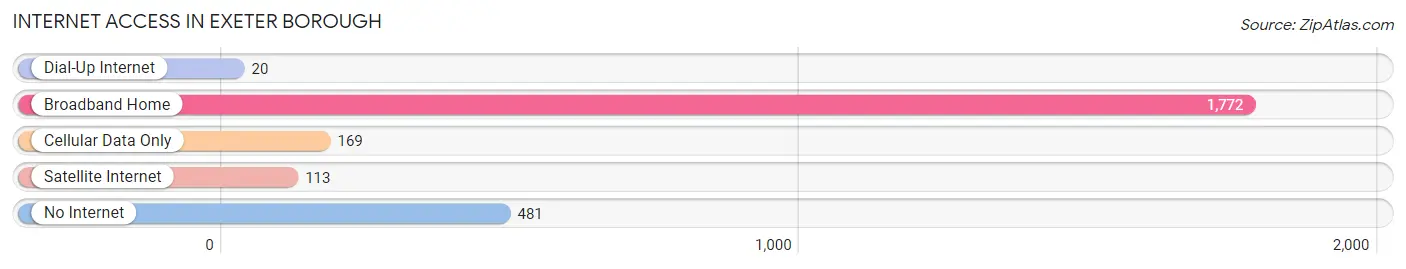
| Internet Type | # Households | % Households |
| Dial-Up Internet | 20 | 0.8% |
| Broadband Home | 1,772 | 71.3% |
| Cellular Data Only | 169 | 6.8% |
| Satellite Internet | 113 | 4.5% |
| No Internet | 481 | 19.4% |
| Total | 2,486 | 100.0% |
Exeter borough Summary
Exeter Borough is a small borough located in Luzerne County, Pennsylvania. It is situated in the Wyoming Valley, a region of the Northeastern United States. The borough is located approximately 8 miles west of Wilkes-Barre, the county seat. Exeter Borough is bordered by Exeter Township to the north, West Pittston to the east, and Wyoming to the south. The population of Exeter Borough was 4,085 at the 2010 census.
History
Exeter Borough was first settled in 1769 by a group of Welsh immigrants. The borough was incorporated in 1845 and named after the city of Exeter in England. The borough was originally part of Exeter Township, but was separated in 1845. The borough was an important center of industry in the 19th century, with several coal mines, brickyards, and tanneries located in the area. The borough was also home to several churches, including the First Presbyterian Church, which was founded in 1845.
Geography
Exeter Borough is located at 41°17'N 75°54'W (41.2833, -75.9000). It has a total area of 0.9 square miles, all of which is land. The borough is located in the Wyoming Valley, a region of the Northeastern United States. The Susquehanna River flows through the borough, and the borough is located approximately 8 miles west of Wilkes-Barre, the county seat.
Economy
Exeter Borough is a small, rural community with a population of 4,085 at the 2010 census. The borough is home to several small businesses, including restaurants, retail stores, and professional services. The borough is also home to several manufacturing companies, including a paper mill and a plastics factory. The borough is also home to several churches, including the First Presbyterian Church, which was founded in 1845.
Demographics
As of the 2010 census, the population of Exeter Borough was 4,085. The racial makeup of the borough was 97.2% White, 0.9% African American, 0.3% Native American, 0.3% Asian, 0.2% from other races, and 0.9% from two or more races. Hispanic or Latino of any race were 1.2% of the population.
The median income for a household in the borough was $37,917, and the median income for a family was $45,938. The per capita income for the borough was $18,945. About 8.2% of families and 10.2% of the population were below the poverty line, including 14.2% of those under age 18 and 8.2% of those age 65 or over.
Common Questions
What is the Total Population of Exeter borough?
Total Population of Exeter borough is 5,509.
What is the Total Male Population of Exeter borough?
Total Male Population of Exeter borough is 2,724.
What is the Total Female Population of Exeter borough?
Total Female Population of Exeter borough is 2,785.
What is the Ratio of Males per 100 Females in Exeter borough?
There are 97.81 Males per 100 Females in Exeter borough.
What is the Ratio of Females per 100 Males in Exeter borough?
There are 102.24 Females per 100 Males in Exeter borough.
What is the Median Population Age in Exeter borough?
Median Population Age in Exeter borough is 50.9 Years.
What is the Average Family Size in Exeter borough
Average Family Size in Exeter borough is 2.9 People.
What is the Average Household Size in Exeter borough
Average Household Size in Exeter borough is 2.2 People.
What is Per Capita Income in Exeter borough?
Per Capita income in Exeter borough is $36,842.
What is the Median Family Income in Exeter borough?
Median Family Income in Exeter borough is $72,054.
What is the Median Household income in Exeter borough?
Median Household Income in Exeter borough is $60,463.
What is Income or Wage Gap in Exeter borough?
Income or Wage Gap in Exeter borough is 52.4%.
Women in Exeter borough earn 47.6 cents for every dollar earned by a man.
What is Inequality or Gini Index in Exeter borough?
Inequality or Gini Index in Exeter borough is 0.42.
How Large is the Labor Force in Exeter borough?
There are 2,618 People in the Labor Forcein in Exeter borough.
What is the Percentage of People in the Labor Force in Exeter borough?
56.4% of People are in the Labor Force in Exeter borough.
What is the Unemployment Rate in Exeter borough?
Unemployment Rate in Exeter borough is 2.8%.