East Uniontown, PA
East Uniontown Map
East Uniontown Overview
2,243
TOTAL POPULATION
887
MALE POPULATION
1,356
FEMALE POPULATION
65.41
MALES / 100 FEMALES
152.87
FEMALES / 100 MALES
38.0
MEDIAN AGE
2.7
AVG FAMILY SIZE
2.0
AVG HOUSEHOLD SIZE
$24,265
PER CAPITA INCOME
$39,732
AVG FAMILY INCOME
$44,320
AVG HOUSEHOLD INCOME
24.4%
WAGE / INCOME GAP [ % ]
75.6¢/ $1
WAGE / INCOME GAP [ $ ]
0.38
INEQUALITY / GINI INDEX
968
LABOR FORCE [ PEOPLE ]
52.5%
PERCENT IN LABOR FORCE
9.4%
UNEMPLOYMENT RATE
Race in East Uniontown
The most populous races in East Uniontown are White / Caucasian (1,988 | 88.6%), Black / African American (140 | 6.2%), and Two or more Races (77 | 3.4%).

| Race | # Population | % Population |
| Asian | 0 | 0.0% |
| Black / African American | 140 | 6.2% |
| Hawaiian / Pacific | 0 | 0.0% |
| Hispanic or Latino | 0 | 0.0% |
| Native / Alaskan | 8 | 0.4% |
| White / Caucasian | 1,988 | 88.6% |
| Two or more Races | 77 | 3.4% |
| Some other Race | 30 | 1.3% |
| Total | 2,243 | 100.0% |
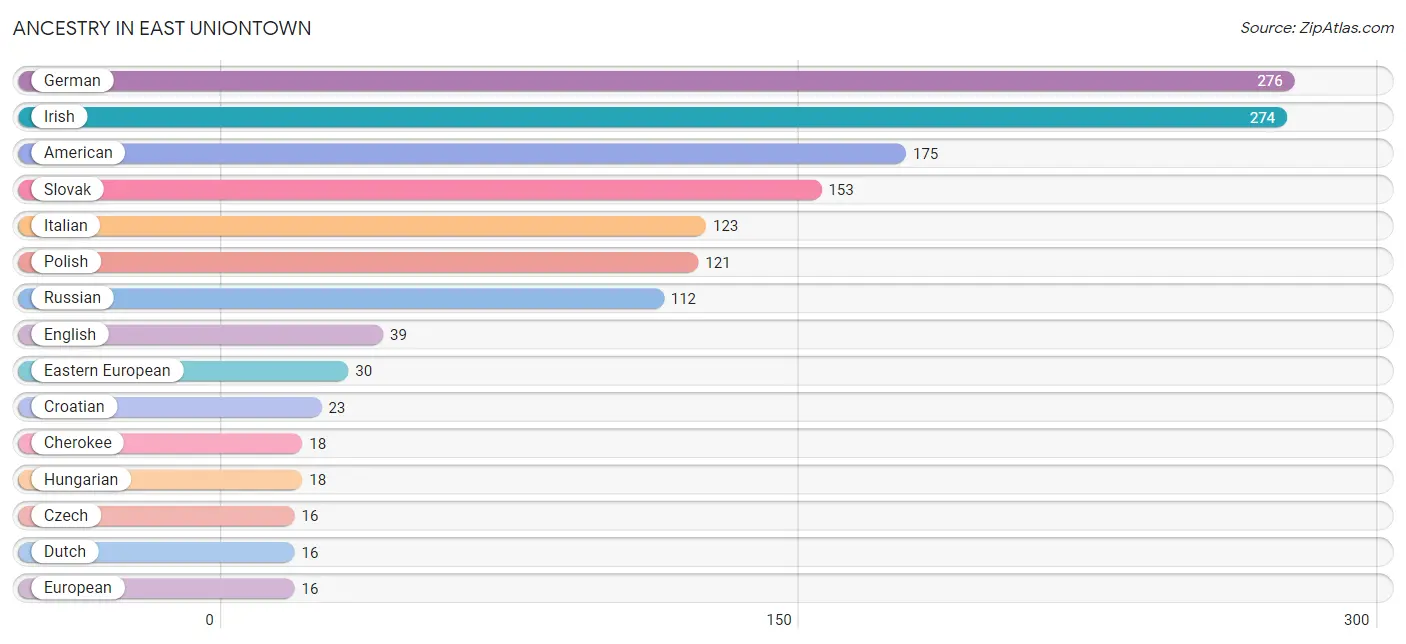
Ancestry in East Uniontown
The most populous ancestries reported in East Uniontown are German (276 | 12.3%), Irish (274 | 12.2%), American (175 | 7.8%), Slovak (153 | 6.8%), and Italian (123 | 5.5%), together accounting for 44.6% of all East Uniontown residents.
| Ancestry | # Population | % Population |
| American | 175 | 7.8% |
| Apache | 10 | 0.4% |
| Cherokee | 18 | 0.8% |
| Croatian | 23 | 1.0% |
| Czech | 16 | 0.7% |
| Czechoslovakian | 15 | 0.7% |
| Dutch | 16 | 0.7% |
| Eastern European | 30 | 1.3% |
| English | 39 | 1.7% |
| European | 16 | 0.7% |
| French | 8 | 0.4% |
| German | 276 | 12.3% |
| Hungarian | 18 | 0.8% |
| Irish | 274 | 12.2% |
| Italian | 123 | 5.5% |
| Polish | 121 | 5.4% |
| Russian | 112 | 5.0% |
| Scottish | 10 | 0.4% |
| Slovak | 153 | 6.8% |
| Swiss | 11 | 0.5% |
| Ukrainian | 16 | 0.7% | View All 21 Rows |
Immigrants in East Uniontown

| Immigration Origin | # Population | % Population | View All 0 Rows |
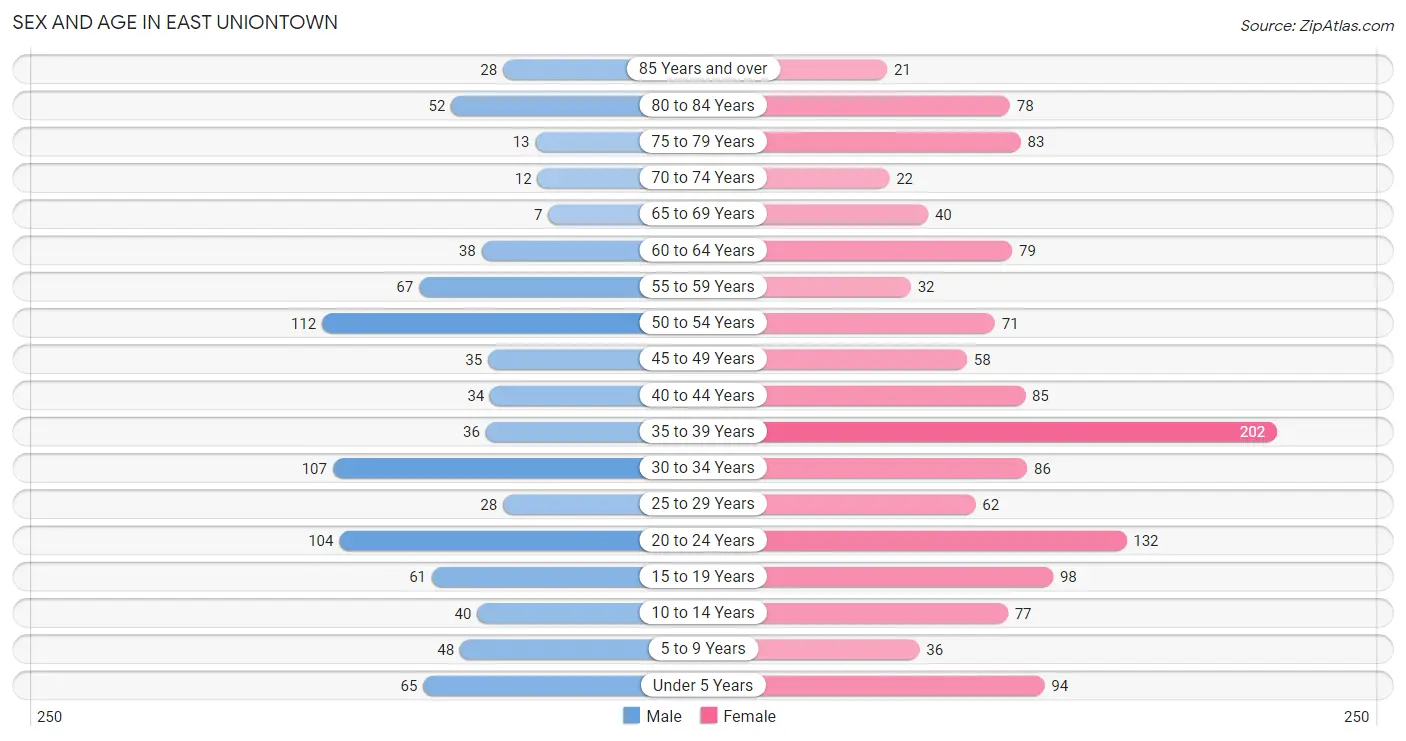
Sex and Age in East Uniontown
Sex and Age in East Uniontown
The most populous age groups in East Uniontown are 50 to 54 Years (112 | 12.6%) for men and 35 to 39 Years (202 | 14.9%) for women.
| Age Bracket | Male | Female |
| Under 5 Years | 65 (7.3%) | 94 (6.9%) |
| 5 to 9 Years | 48 (5.4%) | 36 (2.6%) |
| 10 to 14 Years | 40 (4.5%) | 77 (5.7%) |
| 15 to 19 Years | 61 (6.9%) | 98 (7.2%) |
| 20 to 24 Years | 104 (11.7%) | 132 (9.7%) |
| 25 to 29 Years | 28 (3.2%) | 62 (4.6%) |
| 30 to 34 Years | 107 (12.1%) | 86 (6.3%) |
| 35 to 39 Years | 36 (4.1%) | 202 (14.9%) |
| 40 to 44 Years | 34 (3.8%) | 85 (6.3%) |
| 45 to 49 Years | 35 (4.0%) | 58 (4.3%) |
| 50 to 54 Years | 112 (12.6%) | 71 (5.2%) |
| 55 to 59 Years | 67 (7.5%) | 32 (2.4%) |
| 60 to 64 Years | 38 (4.3%) | 79 (5.8%) |
| 65 to 69 Years | 7 (0.8%) | 40 (2.9%) |
| 70 to 74 Years | 12 (1.3%) | 22 (1.6%) |
| 75 to 79 Years | 13 (1.5%) | 83 (6.1%) |
| 80 to 84 Years | 52 (5.9%) | 78 (5.8%) |
| 85 Years and over | 28 (3.2%) | 21 (1.5%) |
| Total | 887 (100.0%) | 1,356 (100.0%) |
Families and Households in East Uniontown
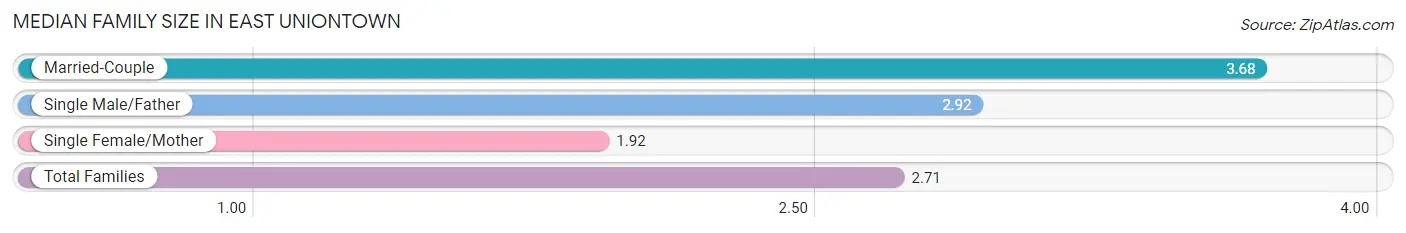
Median Family Size in East Uniontown
The median family size in East Uniontown is 2.71 persons per family, with married-couple families (226 | 42.1%) accounting for the largest median family size of 3.68 persons per family. On the other hand, single female/mother families (285 | 53.1%) represent the smallest median family size with 1.92 persons per family.
| Family Type | # Families | Family Size |
| Married-Couple | 226 (42.1%) | 3.68 |
| Single Male/Father | 26 (4.8%) | 2.92 |
| Single Female/Mother | 285 (53.1%) | 1.92 |
| Total Families | 537 (100.0%) | 2.71 |
Median Household Size in East Uniontown
The median household size in East Uniontown is 2.03 persons per household, with married-couple households (226 | 21.5%) accounting for the largest median household size of 3.68 persons per household. non-family households (516 | 49.0%) represent the smallest median household size with 1.21 persons per household.
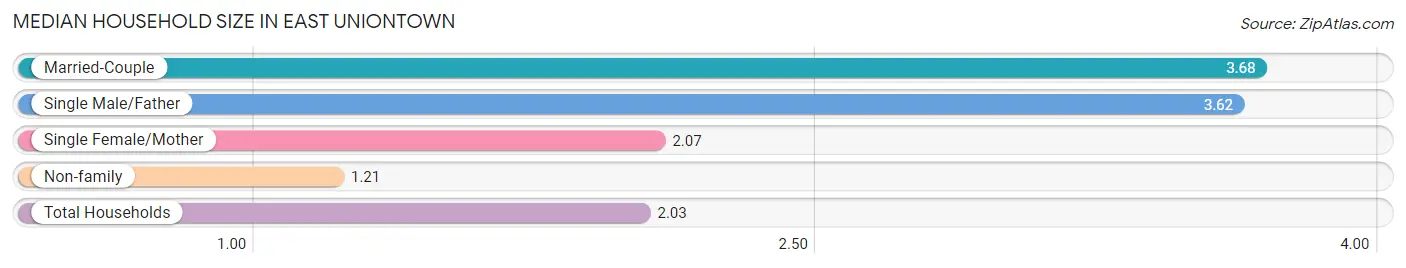
| Household Type | # Households | Household Size |
| Married-Couple | 226 (21.5%) | 3.68 |
| Single Male/Father | 26 (2.5%) | 3.62 |
| Single Female/Mother | 285 (27.1%) | 2.07 |
| Non-family | 516 (49.0%) | 1.21 |
| Total Households | 1,053 (100.0%) | 2.03 |
Household Size by Marriage Status in East Uniontown
Out of a total of 1,053 households in East Uniontown, 537 (51.0%) are family households, while 516 (49.0%) are nonfamily households. The most numerous type of family households are 2-person households, comprising 249, and the most common type of nonfamily households are 1-person households, comprising 402.
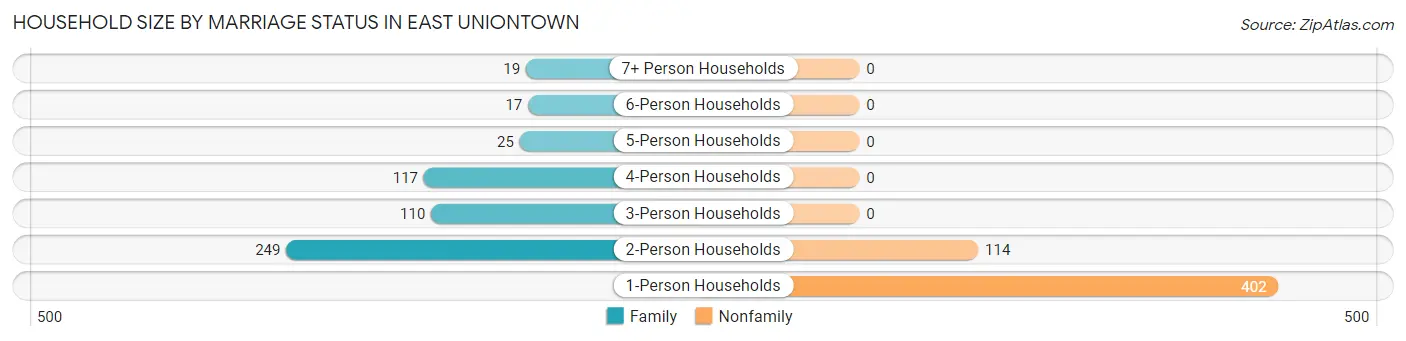
| Household Size | Family Households | Nonfamily Households |
| 1-Person Households | - | 402 (38.2%) |
| 2-Person Households | 249 (23.6%) | 114 (10.8%) |
| 3-Person Households | 110 (10.4%) | 0 (0.0%) |
| 4-Person Households | 117 (11.1%) | 0 (0.0%) |
| 5-Person Households | 25 (2.4%) | 0 (0.0%) |
| 6-Person Households | 17 (1.6%) | 0 (0.0%) |
| 7+ Person Households | 19 (1.8%) | 0 (0.0%) |
| Total | 537 (51.0%) | 516 (49.0%) |
Female Fertility in East Uniontown
Fertility by Age in East Uniontown
Average fertility rate in East Uniontown is 123.0 births per 1,000 women. Women in the age bracket of 20 to 34 years have the highest fertility rate with 318.0 births per 1,000 women. Women in the age bracket of 20 to 34 years acount for 100.0% of all women with births.
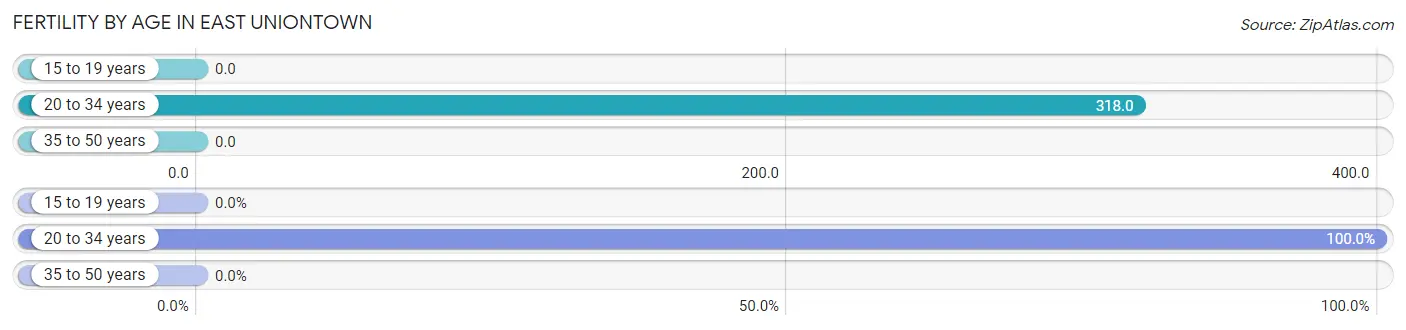
| Age Bracket | Women with Births | Births / 1,000 Women |
| 15 to 19 years | 0 (0.0%) | 0.0 |
| 20 to 34 years | 89 (100.0%) | 318.0 |
| 35 to 50 years | 0 (0.0%) | 0.0 |
| Total | 89 (100.0%) | 123.0 |
Fertility by Age by Marriage Status in East Uniontown
23.6% of women with births (89) in East Uniontown are married. The highest percentage of unmarried women with births falls into 20 to 34 years age bracket with 76.4% of them unmarried at the time of birth, while the lowest percentage of unmarried women with births belong to 20 to 34 years age bracket with 76.4% of them unmarried.
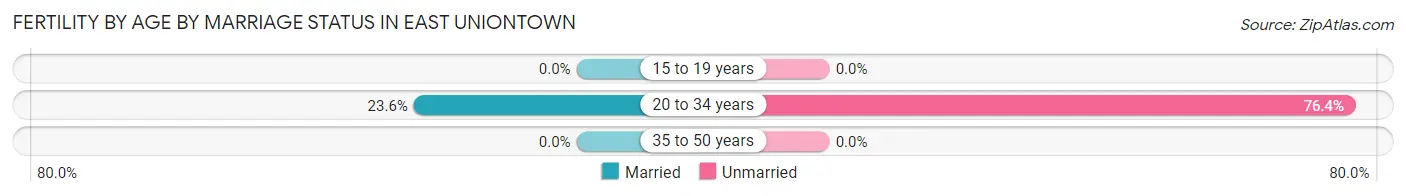
| Age Bracket | Married | Unmarried |
| 15 to 19 years | 0 (0.0%) | 0 (0.0%) |
| 20 to 34 years | 21 (23.6%) | 68 (76.4%) |
| 35 to 50 years | 0 (0.0%) | 0 (0.0%) |
| Total | 21 (23.6%) | 68 (76.4%) |
Fertility by Education in East Uniontown
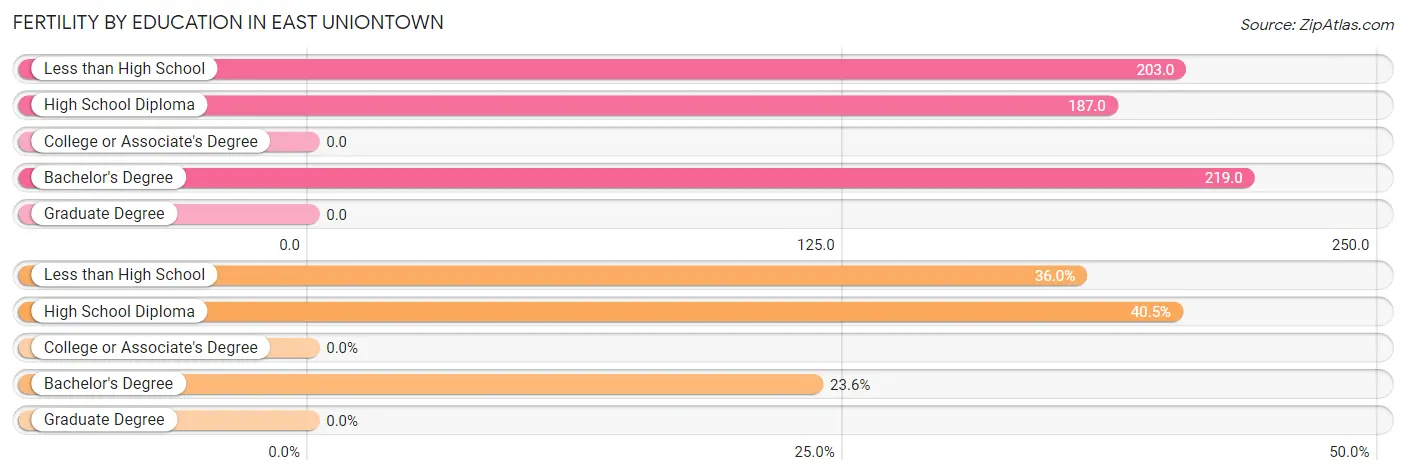
| Educational Attainment | Women with Births | Births / 1,000 Women |
| Less than High School | 32 (36.0%) | 203.0 |
| High School Diploma | 36 (40.5%) | 187.0 |
| College or Associate's Degree | 0 (0.0%) | 0.0 |
| Bachelor's Degree | 21 (23.6%) | 219.0 |
| Graduate Degree | 0 (0.0%) | 0.0 |
| Total | 89 (100.0%) | 123.0 |
Fertility by Education by Marriage Status in East Uniontown
76.4% of women with births in East Uniontown are unmarried. Women with the educational attainment of bachelor's degree are most likely to be married with 100.0% of them married at childbirth, while women with the educational attainment of less than high school are least likely to be married with 100.0% of them unmarried at childbirth.
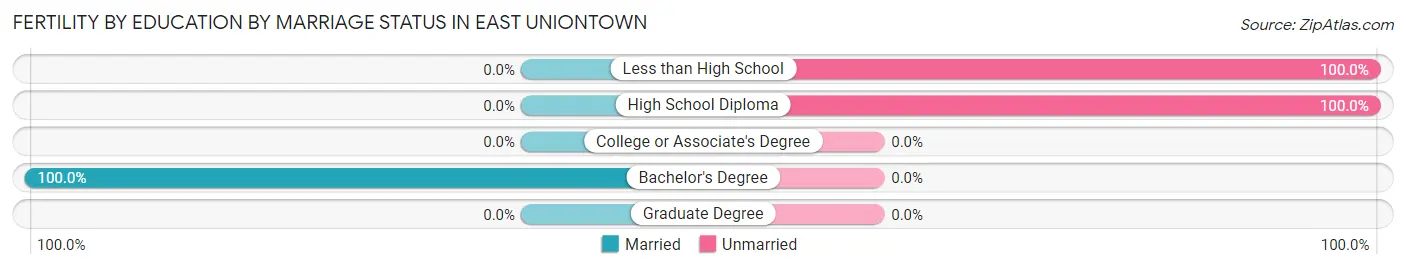
| Educational Attainment | Married | Unmarried |
| Less than High School | 0 (0.0%) | 32 (100.0%) |
| High School Diploma | 0 (0.0%) | 36 (100.0%) |
| College or Associate's Degree | 0 (0.0%) | 0 (0.0%) |
| Bachelor's Degree | 21 (100.0%) | 0 (0.0%) |
| Graduate Degree | 0 (0.0%) | 0 (0.0%) |
| Total | 21 (23.6%) | 68 (76.4%) |
Income in East Uniontown
Income Overview in East Uniontown
Per Capita Income in East Uniontown is $24,265, while median incomes of families and households are $39,732 and $44,320 respectively.
| Characteristic | Number | Measure |
| Per Capita Income | 2,243 | $24,265 |
| Median Family Income | 537 | $39,732 |
| Mean Family Income | 537 | $47,372 |
| Median Household Income | 1,053 | $44,320 |
| Mean Household Income | 1,053 | $51,313 |
| Income Deficit | 537 | $0 |
| Wage / Income Gap (%) | 2,243 | 24.38% |
| Wage / Income Gap ($) | 2,243 | 75.62¢ per $1 |
| Gini / Inequality Index | 2,243 | 0.38 |
Earnings by Sex in East Uniontown
Average Earnings in East Uniontown are $31,440, $38,569 for men and $29,167 for women, a difference of 24.4%.
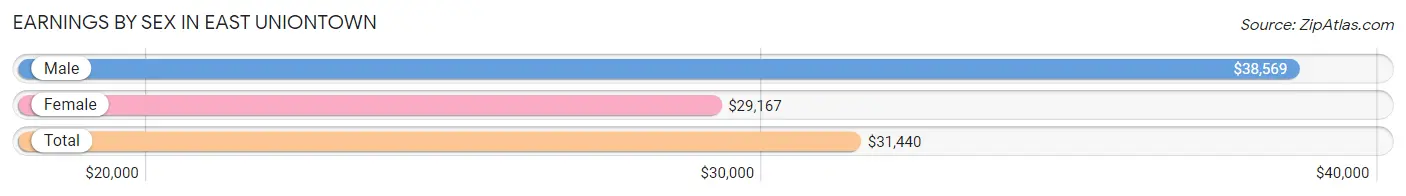
| Sex | Number | Average Earnings |
| Male | 461 (43.2%) | $38,569 |
| Female | 606 (56.8%) | $29,167 |
| Total | 1,067 (100.0%) | $31,440 |
Earnings by Sex by Income Bracket in East Uniontown
The most common earnings brackets in East Uniontown are $35,000 to $39,999 for men (84 | 18.2%) and $30,000 to $34,999 for women (179 | 29.5%).
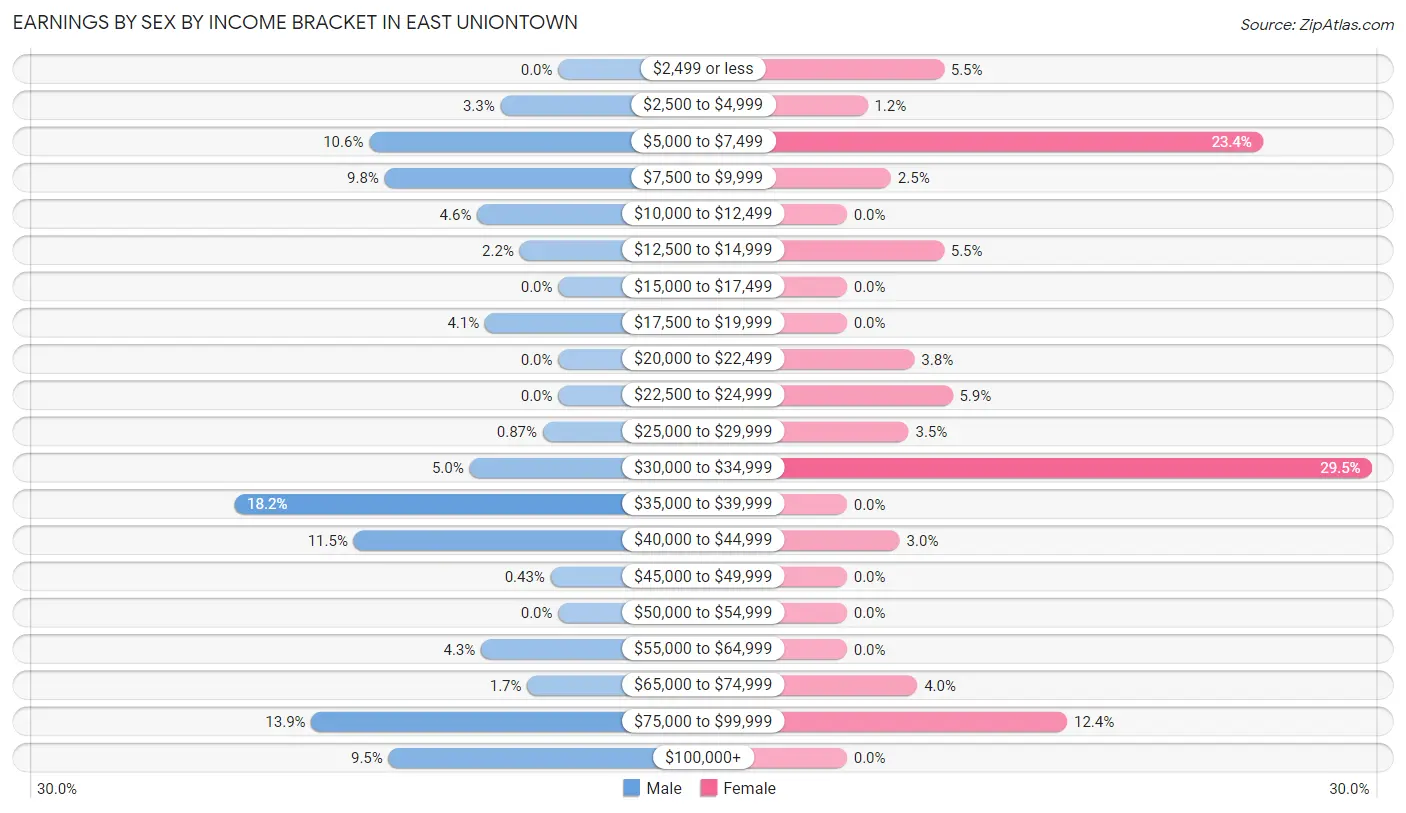
| Income | Male | Female |
| $2,499 or less | 0 (0.0%) | 33 (5.4%) |
| $2,500 to $4,999 | 15 (3.3%) | 7 (1.2%) |
| $5,000 to $7,499 | 49 (10.6%) | 142 (23.4%) |
| $7,500 to $9,999 | 45 (9.8%) | 15 (2.5%) |
| $10,000 to $12,499 | 21 (4.6%) | 0 (0.0%) |
| $12,500 to $14,999 | 10 (2.2%) | 33 (5.4%) |
| $15,000 to $17,499 | 0 (0.0%) | 0 (0.0%) |
| $17,500 to $19,999 | 19 (4.1%) | 0 (0.0%) |
| $20,000 to $22,499 | 0 (0.0%) | 23 (3.8%) |
| $22,500 to $24,999 | 0 (0.0%) | 36 (5.9%) |
| $25,000 to $29,999 | 4 (0.9%) | 21 (3.5%) |
| $30,000 to $34,999 | 23 (5.0%) | 179 (29.5%) |
| $35,000 to $39,999 | 84 (18.2%) | 0 (0.0%) |
| $40,000 to $44,999 | 53 (11.5%) | 18 (3.0%) |
| $45,000 to $49,999 | 2 (0.4%) | 0 (0.0%) |
| $50,000 to $54,999 | 0 (0.0%) | 0 (0.0%) |
| $55,000 to $64,999 | 20 (4.3%) | 0 (0.0%) |
| $65,000 to $74,999 | 8 (1.7%) | 24 (4.0%) |
| $75,000 to $99,999 | 64 (13.9%) | 75 (12.4%) |
| $100,000+ | 44 (9.5%) | 0 (0.0%) |
| Total | 461 (100.0%) | 606 (100.0%) |
Earnings by Sex by Educational Attainment in East Uniontown
Average earnings in East Uniontown are $43,443 for men and $24,931 for women, a difference of 42.6%. Men with an educational attainment of college or associate's degree enjoy the highest average annual earnings of $44,076, while those with high school diploma education earn the least with $43,625. Women with an educational attainment of bachelor's degree earn the most with the average annual earnings of $80,428, while those with high school diploma education have the smallest earnings of $30,968.
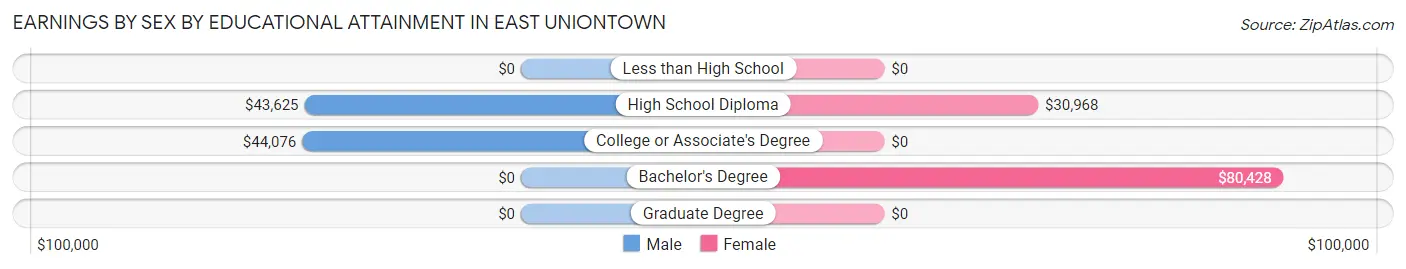
| Educational Attainment | Male Income | Female Income |
| Less than High School | - | - |
| High School Diploma | $43,625 | $30,968 |
| College or Associate's Degree | $44,076 | $0 |
| Bachelor's Degree | - | - |
| Graduate Degree | - | - |
| Total | $43,443 | $24,931 |
Family Income in East Uniontown
Family Income Brackets in East Uniontown
According to the East Uniontown family income data, there are 115 families falling into the less than $10,000 income range, which is the most common income bracket and makes up 21.4% of all families. Conversely, the $200,000+ income bracket is the least frequent group with only 7 families (1.3%) belonging to this category.
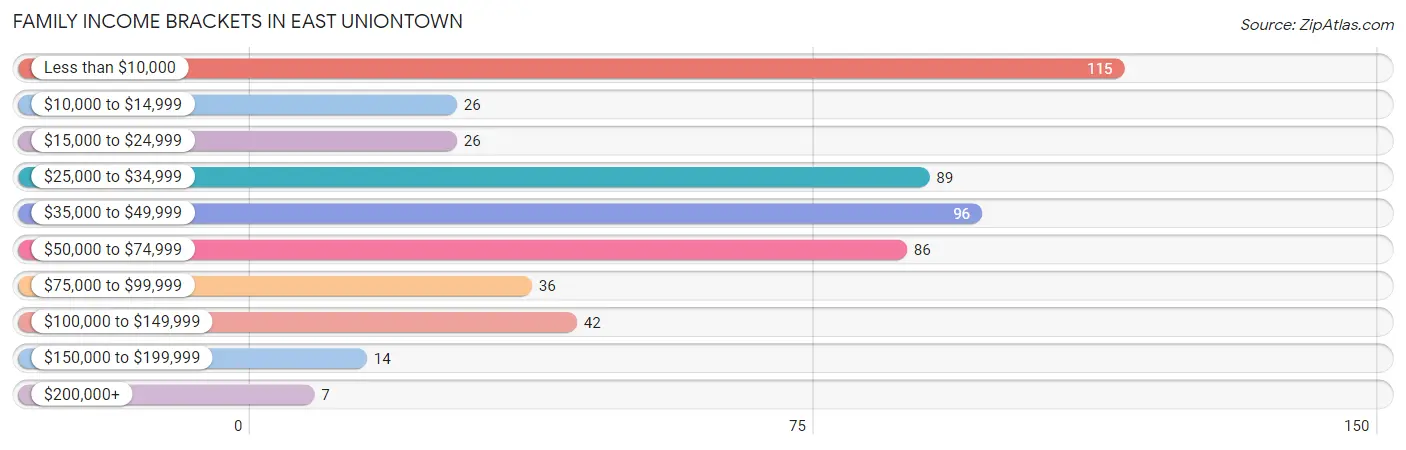
| Income Bracket | # Families | % Families |
| Less than $10,000 | 115 | 21.4% |
| $10,000 to $14,999 | 26 | 4.8% |
| $15,000 to $24,999 | 26 | 4.8% |
| $25,000 to $34,999 | 89 | 16.6% |
| $35,000 to $49,999 | 96 | 17.9% |
| $50,000 to $74,999 | 86 | 16.0% |
| $75,000 to $99,999 | 36 | 6.7% |
| $100,000 to $149,999 | 42 | 7.8% |
| $150,000 to $199,999 | 14 | 2.6% |
| $200,000+ | 7 | 1.3% |
Family Income by Famaliy Size in East Uniontown
3-person families (96 | 17.9%) account for the highest median family income in East Uniontown with $43,438 per family, while 3-person families (96 | 17.9%) have the highest median income of $14,479 per family member.
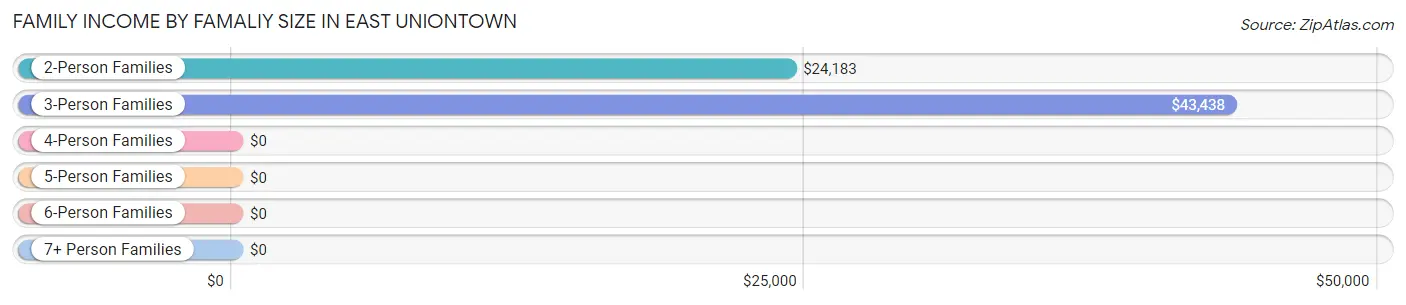
| Income Bracket | # Families | Median Income |
| 2-Person Families | 281 (52.3%) | $24,183 |
| 3-Person Families | 96 (17.9%) | $43,438 |
| 4-Person Families | 99 (18.4%) | $0 |
| 5-Person Families | 25 (4.7%) | $0 |
| 6-Person Families | 17 (3.2%) | $0 |
| 7+ Person Families | 19 (3.5%) | $0 |
| Total | 537 (100.0%) | $39,732 |
Family Income by Number of Earners in East Uniontown
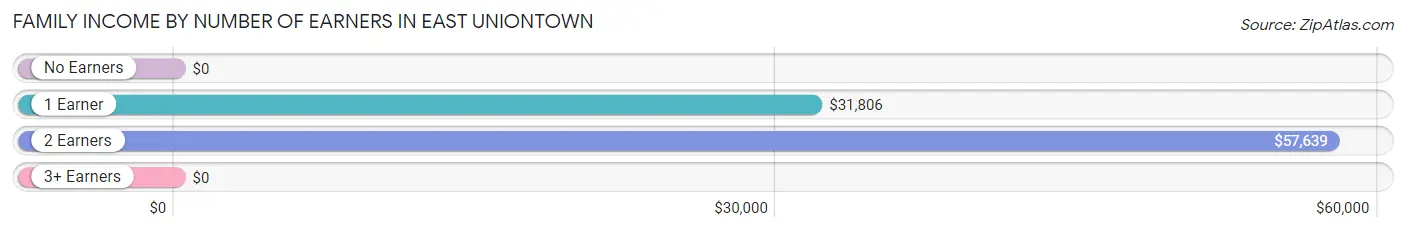
| Number of Earners | # Families | Median Income |
| No Earners | 83 (15.5%) | $0 |
| 1 Earner | 302 (56.2%) | $31,806 |
| 2 Earners | 119 (22.2%) | $57,639 |
| 3+ Earners | 33 (6.1%) | $0 |
| Total | 537 (100.0%) | $39,732 |
Household Income in East Uniontown
Household Income Brackets in East Uniontown
With 227 households falling in the category, the $35,000 to $49,999 income range is the most frequent in East Uniontown, accounting for 21.6% of all households. In contrast, only 7 households (0.7%) fall into the $200,000+ income bracket, making it the least populous group.
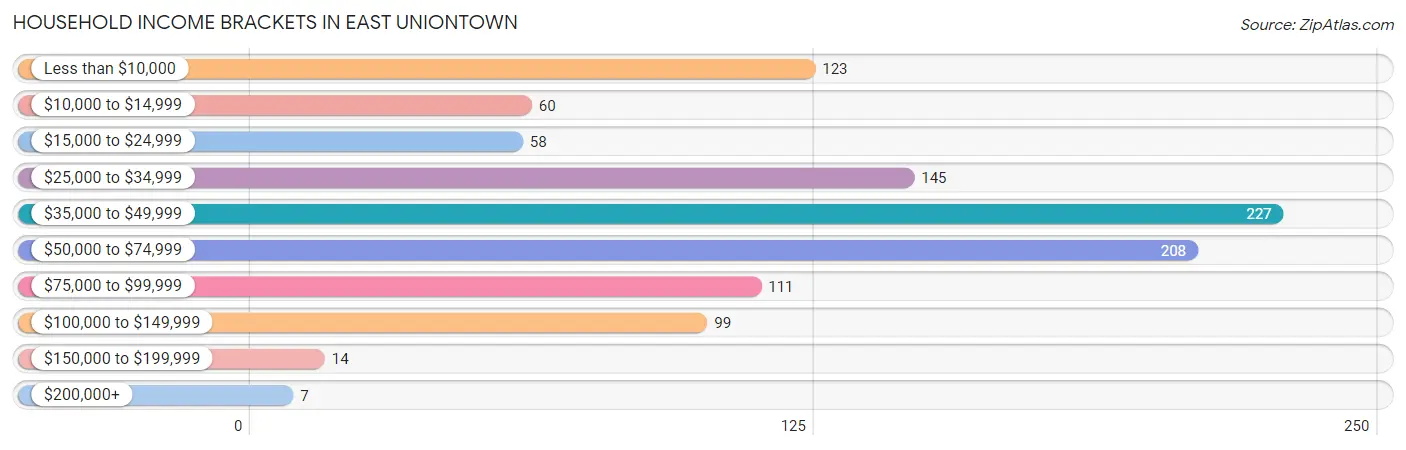
| Income Bracket | # Households | % Households |
| Less than $10,000 | 123 | 11.7% |
| $10,000 to $14,999 | 60 | 5.7% |
| $15,000 to $24,999 | 58 | 5.5% |
| $25,000 to $34,999 | 145 | 13.8% |
| $35,000 to $49,999 | 227 | 21.6% |
| $50,000 to $74,999 | 208 | 19.8% |
| $75,000 to $99,999 | 111 | 10.5% |
| $100,000 to $149,999 | 99 | 9.4% |
| $150,000 to $199,999 | 14 | 1.3% |
| $200,000+ | 7 | 0.7% |
Household Income by Householder Age in East Uniontown
The median household income in East Uniontown is $44,320, with the highest median household income of $53,135 found in the 65+ years age bracket for the primary householder. A total of 241 households (22.9%) fall into this category. Meanwhile, the 15 to 24 years age bracket for the primary householder has the lowest median household income of $0, with 80 households (7.6%) in this group.
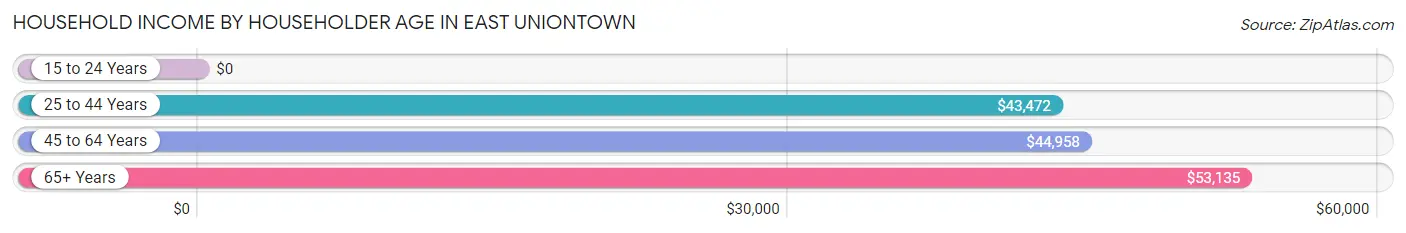
| Income Bracket | # Households | Median Income |
| 15 to 24 Years | 80 (7.6%) | $0 |
| 25 to 44 Years | 411 (39.0%) | $43,472 |
| 45 to 64 Years | 321 (30.5%) | $44,958 |
| 65+ Years | 241 (22.9%) | $53,135 |
| Total | 1,053 (100.0%) | $44,320 |
Poverty in East Uniontown
Income Below Poverty by Sex and Age in East Uniontown
With 24.6% poverty level for males and 28.9% for females among the residents of East Uniontown, 35 to 44 year old males and 12 to 14 year old females are the most vulnerable to poverty, with 37 males (52.9%) and 56 females (83.6%) in their respective age groups living below the poverty level.
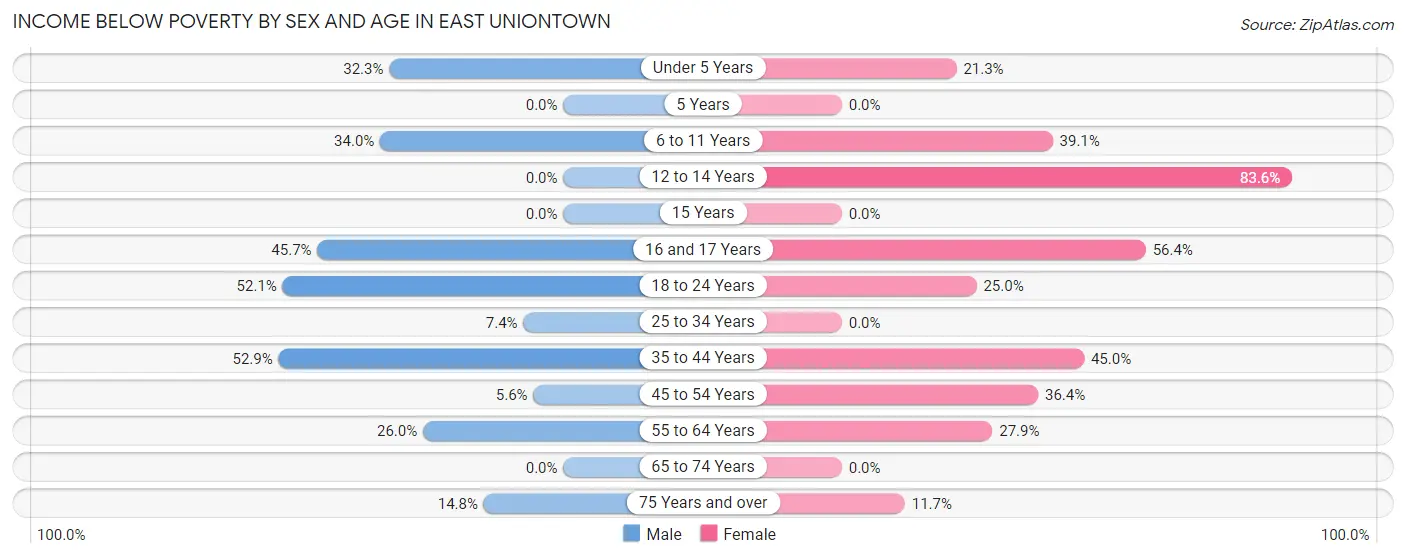
| Age Bracket | Male | Female |
| Under 5 Years | 21 (32.3%) | 20 (21.3%) |
| 5 Years | 0 (0.0%) | 0 (0.0%) |
| 6 to 11 Years | 17 (34.0%) | 18 (39.1%) |
| 12 to 14 Years | 0 (0.0%) | 56 (83.6%) |
| 15 Years | 0 (0.0%) | 0 (0.0%) |
| 16 and 17 Years | 21 (45.7%) | 22 (56.4%) |
| 18 to 24 Years | 62 (52.1%) | 38 (25.0%) |
| 25 to 34 Years | 10 (7.4%) | 0 (0.0%) |
| 35 to 44 Years | 37 (52.9%) | 129 (45.0%) |
| 45 to 54 Years | 8 (5.6%) | 47 (36.4%) |
| 55 to 64 Years | 25 (26.0%) | 31 (27.9%) |
| 65 to 74 Years | 0 (0.0%) | 0 (0.0%) |
| 75 Years and over | 13 (14.8%) | 18 (11.7%) |
| Total | 214 (24.6%) | 379 (28.9%) |
Income Above Poverty by Sex and Age in East Uniontown
According to the poverty statistics in East Uniontown, males aged 5 years and females aged 15 years are the age groups that are most secure financially, with 100.0% of males and 100.0% of females in these age groups living above the poverty line.
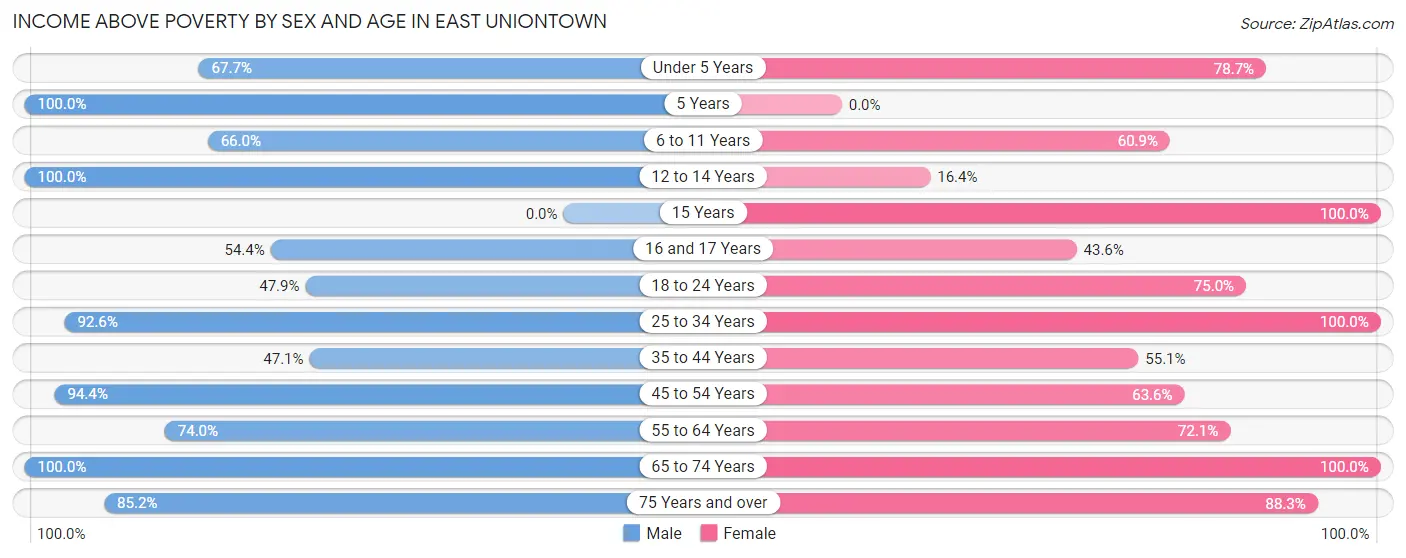
| Age Bracket | Male | Female |
| Under 5 Years | 44 (67.7%) | 74 (78.7%) |
| 5 Years | 15 (100.0%) | 0 (0.0%) |
| 6 to 11 Years | 33 (66.0%) | 28 (60.9%) |
| 12 to 14 Years | 23 (100.0%) | 11 (16.4%) |
| 15 Years | 0 (0.0%) | 39 (100.0%) |
| 16 and 17 Years | 25 (54.3%) | 17 (43.6%) |
| 18 to 24 Years | 57 (47.9%) | 114 (75.0%) |
| 25 to 34 Years | 125 (92.6%) | 148 (100.0%) |
| 35 to 44 Years | 33 (47.1%) | 158 (55.0%) |
| 45 to 54 Years | 136 (94.4%) | 82 (63.6%) |
| 55 to 64 Years | 71 (74.0%) | 80 (72.1%) |
| 65 to 74 Years | 17 (100.0%) | 45 (100.0%) |
| 75 Years and over | 75 (85.2%) | 136 (88.3%) |
| Total | 654 (75.3%) | 932 (71.1%) |
Income Below Poverty Among Married-Couple Families in East Uniontown
The poverty statistics for married-couple families in East Uniontown show that 12.4% or 28 of the total 226 families live below the poverty line. Families with 5 or more children have the highest poverty rate of 100.0%, comprising of 19 families. On the other hand, families with 1 or 2 children have the lowest poverty rate of 0.0%, which includes 0 families.
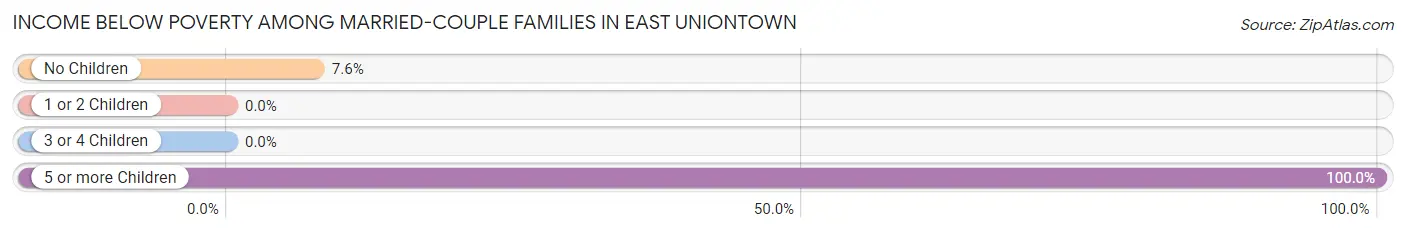
| Children | Above Poverty | Below Poverty |
| No Children | 110 (92.4%) | 9 (7.6%) |
| 1 or 2 Children | 61 (100.0%) | 0 (0.0%) |
| 3 or 4 Children | 27 (100.0%) | 0 (0.0%) |
| 5 or more Children | 0 (0.0%) | 19 (100.0%) |
| Total | 198 (87.6%) | 28 (12.4%) |
Income Below Poverty Among Single-Parent Households in East Uniontown
According to the poverty data in East Uniontown, 69.2% or 18 single-father households and 43.2% or 123 single-mother households are living below the poverty line. Among single-father households, those with 1 or 2 children have the highest poverty rate, with 18 households (69.2%) experiencing poverty. Likewise, among single-mother households, those with 1 or 2 children have the highest poverty rate, with 97 households (43.5%) falling below the poverty line.
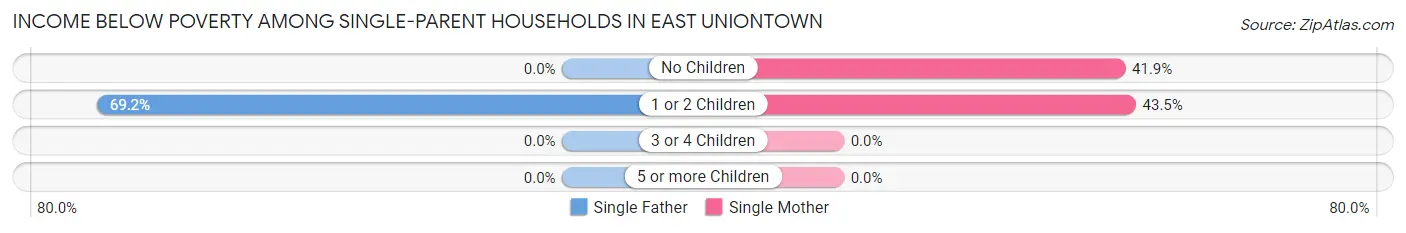
| Children | Single Father | Single Mother |
| No Children | 0 (0.0%) | 26 (41.9%) |
| 1 or 2 Children | 18 (69.2%) | 97 (43.5%) |
| 3 or 4 Children | 0 (0.0%) | 0 (0.0%) |
| 5 or more Children | 0 (0.0%) | 0 (0.0%) |
| Total | 18 (69.2%) | 123 (43.2%) |
Income Below Poverty Among Married-Couple vs Single-Parent Households in East Uniontown
The poverty data for East Uniontown shows that 28 of the married-couple family households (12.4%) and 141 of the single-parent households (45.3%) are living below the poverty level. Within the married-couple family households, those with 5 or more children have the highest poverty rate, with 19 households (100.0%) falling below the poverty line. Among the single-parent households, those with 1 or 2 children have the highest poverty rate, with 115 household (46.2%) living below poverty.
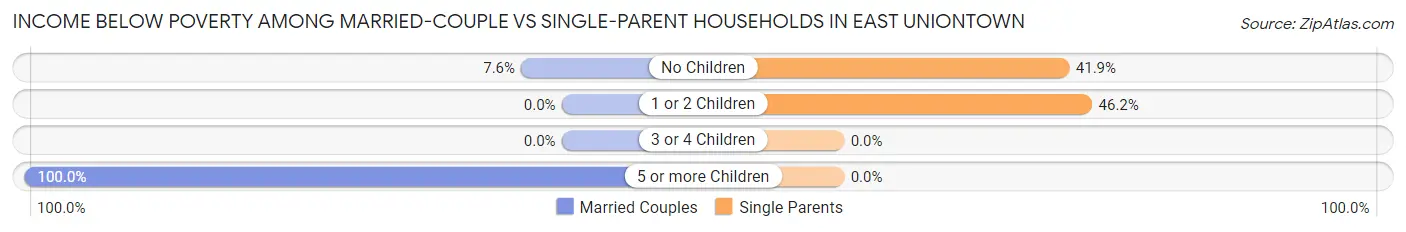
| Children | Married-Couple Families | Single-Parent Households |
| No Children | 9 (7.6%) | 26 (41.9%) |
| 1 or 2 Children | 0 (0.0%) | 115 (46.2%) |
| 3 or 4 Children | 0 (0.0%) | 0 (0.0%) |
| 5 or more Children | 19 (100.0%) | 0 (0.0%) |
| Total | 28 (12.4%) | 141 (45.3%) |
Employment Characteristics in East Uniontown
Employment by Class of Employer in East Uniontown
Among the 867 employed individuals in East Uniontown, private company employees (602 | 69.4%), not-for-profit organizations (191 | 22.0%), and local government employees (47 | 5.4%) make up the most common classes of employment.
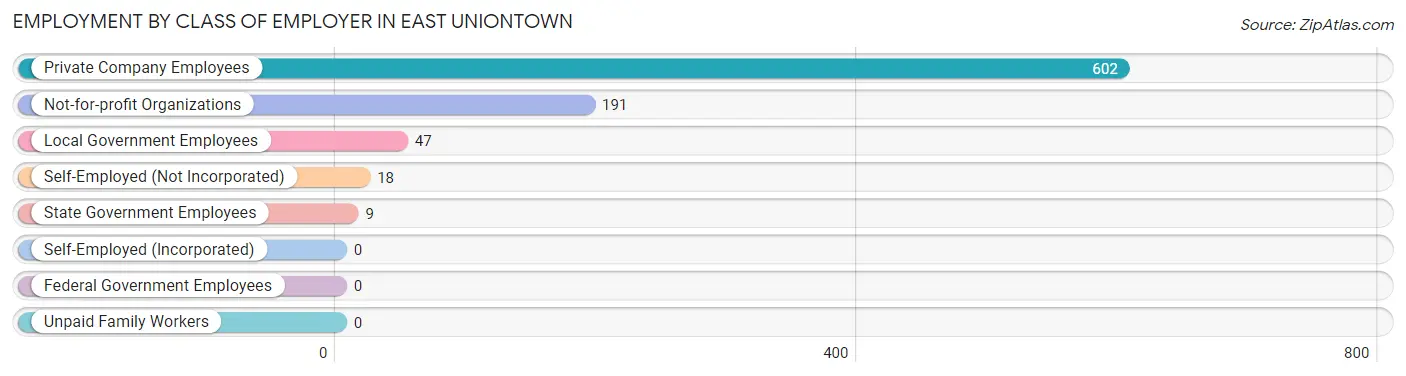
| Employer Class | # Employees | % Employees |
| Private Company Employees | 602 | 69.4% |
| Self-Employed (Incorporated) | 0 | 0.0% |
| Self-Employed (Not Incorporated) | 18 | 2.1% |
| Not-for-profit Organizations | 191 | 22.0% |
| Local Government Employees | 47 | 5.4% |
| State Government Employees | 9 | 1.0% |
| Federal Government Employees | 0 | 0.0% |
| Unpaid Family Workers | 0 | 0.0% |
| Total | 867 | 100.0% |
Employment Status by Age in East Uniontown
According to the labor force statistics for East Uniontown, out of the total population over 16 years of age (1,844), 52.5% or 968 individuals are in the labor force, with 9.4% or 91 of them unemployed. The age group with the highest labor force participation rate is 30 to 34 years, with 100.0% or 193 individuals in the labor force. Within the labor force, the 20 to 24 years age range has the highest percentage of unemployed individuals, with 26.5% or 57 of them being unemployed.
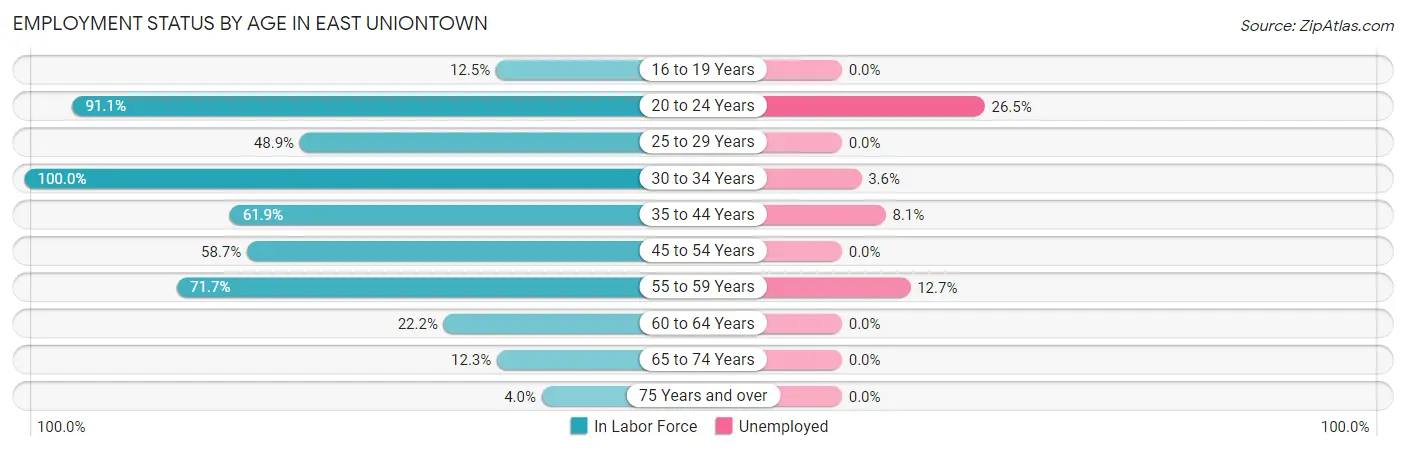
| Age Bracket | In Labor Force | Unemployed |
| 16 to 19 Years | 15 (12.5%) | 0 (0.0%) |
| 20 to 24 Years | 215 (91.1%) | 57 (26.5%) |
| 25 to 29 Years | 44 (48.9%) | 0 (0.0%) |
| 30 to 34 Years | 193 (100.0%) | 7 (3.6%) |
| 35 to 44 Years | 221 (61.9%) | 18 (8.1%) |
| 45 to 54 Years | 162 (58.7%) | 0 (0.0%) |
| 55 to 59 Years | 71 (71.7%) | 9 (12.7%) |
| 60 to 64 Years | 26 (22.2%) | 0 (0.0%) |
| 65 to 74 Years | 10 (12.3%) | 0 (0.0%) |
| 75 Years and over | 11 (4.0%) | 0 (0.0%) |
| Total | 968 (52.5%) | 91 (9.4%) |
Employment Status by Educational Attainment in East Uniontown
According to labor force statistics for East Uniontown, 63.3% of individuals (717) out of the total population between 25 and 64 years of age (1,132) are in the labor force, with 4.7% or 34 of them being unemployed. The group with the highest labor force participation rate are those with the educational attainment of bachelor's degree or higher, with 89.7% or 96 individuals in the labor force. Within the labor force, individuals with less than high school education have the highest percentage of unemployment, with 64.3% or 18 of them being unemployed.
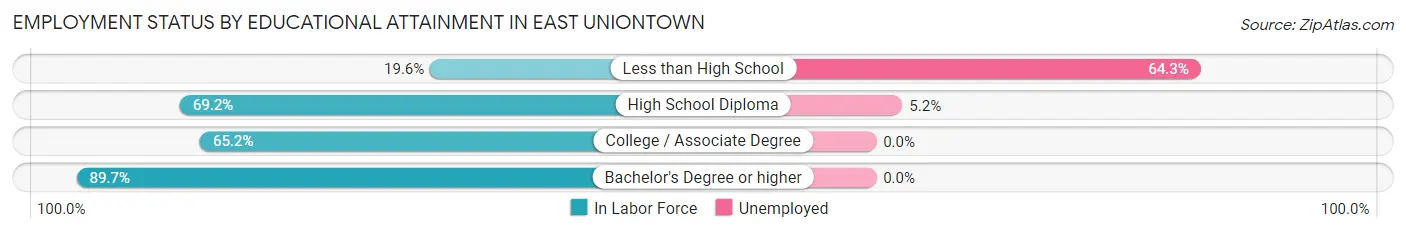
| Educational Attainment | In Labor Force | Unemployed |
| Less than High School | 28 (19.6%) | 92 (64.3%) |
| High School Diploma | 310 (69.2%) | 23 (5.2%) |
| College / Associate Degree | 283 (65.2%) | 0 (0.0%) |
| Bachelor's Degree or higher | 96 (89.7%) | 0 (0.0%) |
| Total | 717 (63.3%) | 53 (4.7%) |
Employment Occupations by Sex in East Uniontown
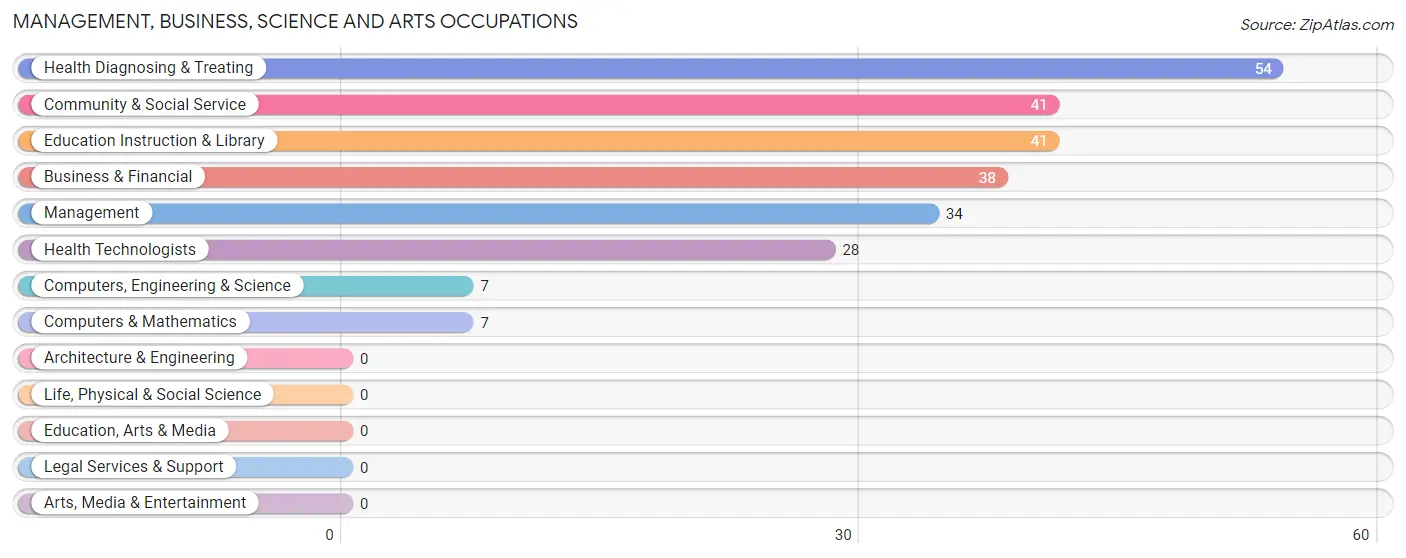
Management, Business, Science and Arts Occupations
The most common Management, Business, Science and Arts occupations in East Uniontown are Health Diagnosing & Treating (54 | 6.2%), Community & Social Service (41 | 4.7%), Education Instruction & Library (41 | 4.7%), Business & Financial (38 | 4.3%), and Management (34 | 3.9%).
Management, Business, Science and Arts Occupations by Sex
Within the Management, Business, Science and Arts occupations in East Uniontown, the most male-oriented occupations are Management (100.0%), Community & Social Service (63.4%), and Education Instruction & Library (63.4%), while the most female-oriented occupations are Business & Financial (100.0%), Computers, Engineering & Science (100.0%), and Computers & Mathematics (100.0%).
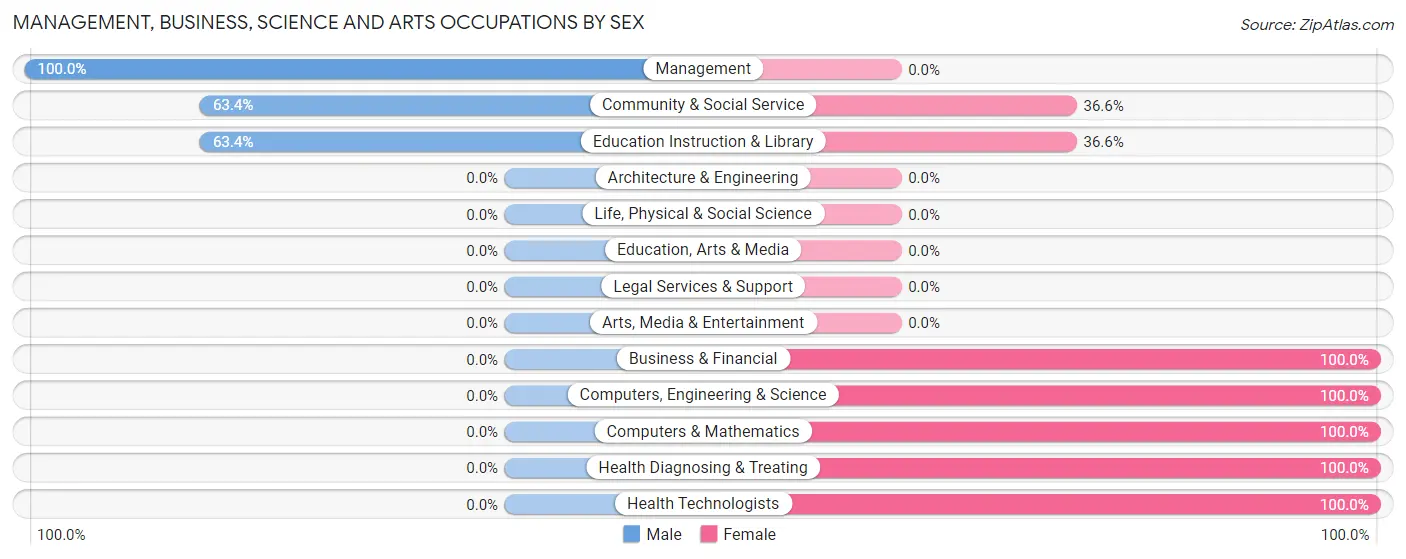
| Occupation | Male | Female |
| Management | 34 (100.0%) | 0 (0.0%) |
| Business & Financial | 0 (0.0%) | 38 (100.0%) |
| Computers, Engineering & Science | 0 (0.0%) | 7 (100.0%) |
| Computers & Mathematics | 0 (0.0%) | 7 (100.0%) |
| Architecture & Engineering | 0 (0.0%) | 0 (0.0%) |
| Life, Physical & Social Science | 0 (0.0%) | 0 (0.0%) |
| Community & Social Service | 26 (63.4%) | 15 (36.6%) |
| Education, Arts & Media | 0 (0.0%) | 0 (0.0%) |
| Legal Services & Support | 0 (0.0%) | 0 (0.0%) |
| Education Instruction & Library | 26 (63.4%) | 15 (36.6%) |
| Arts, Media & Entertainment | 0 (0.0%) | 0 (0.0%) |
| Health Diagnosing & Treating | 0 (0.0%) | 54 (100.0%) |
| Health Technologists | 0 (0.0%) | 28 (100.0%) |
| Total (Category) | 60 (34.5%) | 114 (65.5%) |
| Total (Overall) | 399 (45.5%) | 478 (54.5%) |
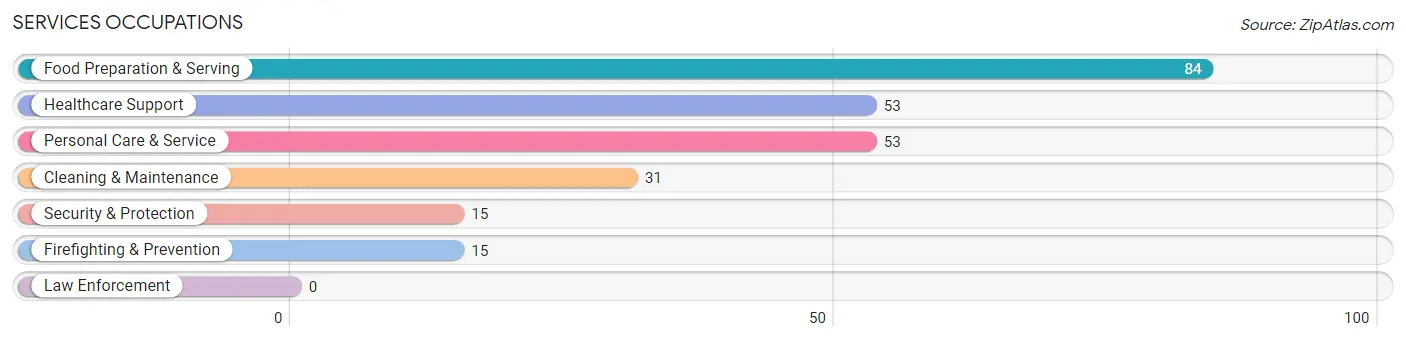
Services Occupations
The most common Services occupations in East Uniontown are Food Preparation & Serving (84 | 9.6%), Healthcare Support (53 | 6.0%), Personal Care & Service (53 | 6.0%), Cleaning & Maintenance (31 | 3.5%), and Security & Protection (15 | 1.7%).
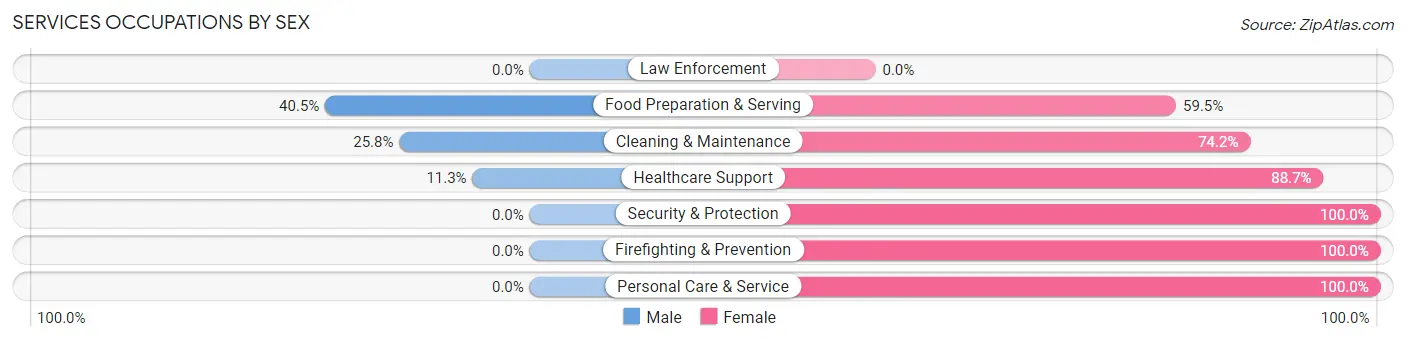
Services Occupations by Sex
Within the Services occupations in East Uniontown, the most male-oriented occupations are Food Preparation & Serving (40.5%), Cleaning & Maintenance (25.8%), and Healthcare Support (11.3%), while the most female-oriented occupations are Security & Protection (100.0%), Firefighting & Prevention (100.0%), and Personal Care & Service (100.0%).
| Occupation | Male | Female |
| Healthcare Support | 6 (11.3%) | 47 (88.7%) |
| Security & Protection | 0 (0.0%) | 15 (100.0%) |
| Firefighting & Prevention | 0 (0.0%) | 15 (100.0%) |
| Law Enforcement | 0 (0.0%) | 0 (0.0%) |
| Food Preparation & Serving | 34 (40.5%) | 50 (59.5%) |
| Cleaning & Maintenance | 8 (25.8%) | 23 (74.2%) |
| Personal Care & Service | 0 (0.0%) | 53 (100.0%) |
| Total (Category) | 48 (20.3%) | 188 (79.7%) |
| Total (Overall) | 399 (45.5%) | 478 (54.5%) |
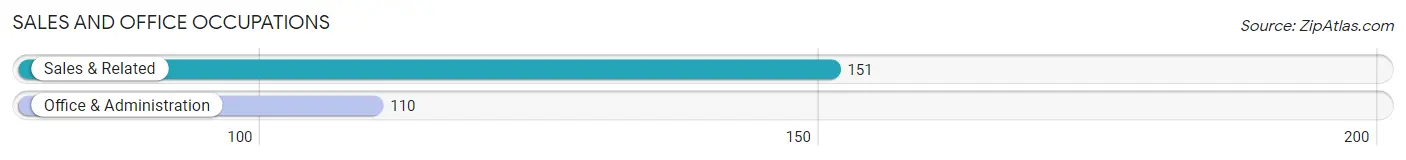
Sales and Office Occupations
The most common Sales and Office occupations in East Uniontown are Sales & Related (151 | 17.2%), and Office & Administration (110 | 12.5%).
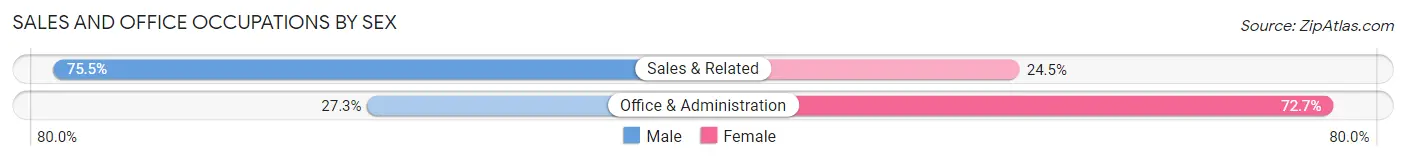
Sales and Office Occupations by Sex
| Occupation | Male | Female |
| Sales & Related | 114 (75.5%) | 37 (24.5%) |
| Office & Administration | 30 (27.3%) | 80 (72.7%) |
| Total (Category) | 144 (55.2%) | 117 (44.8%) |
| Total (Overall) | 399 (45.5%) | 478 (54.5%) |
Natural Resources, Construction and Maintenance Occupations
The most common Natural Resources, Construction and Maintenance occupations in East Uniontown are Installation, Maintenance & Repair (34 | 3.9%), and Construction & Extraction (30 | 3.4%).
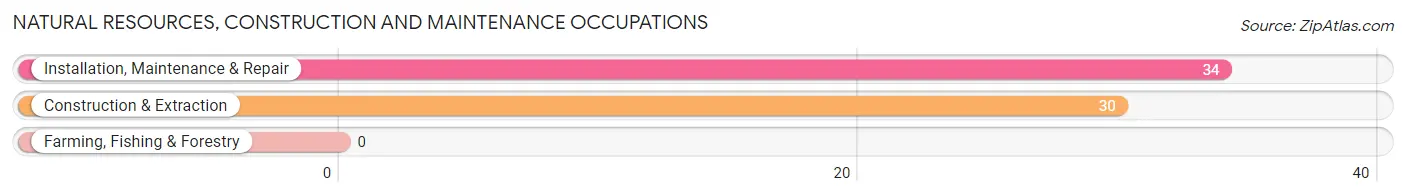
Natural Resources, Construction and Maintenance Occupations by Sex
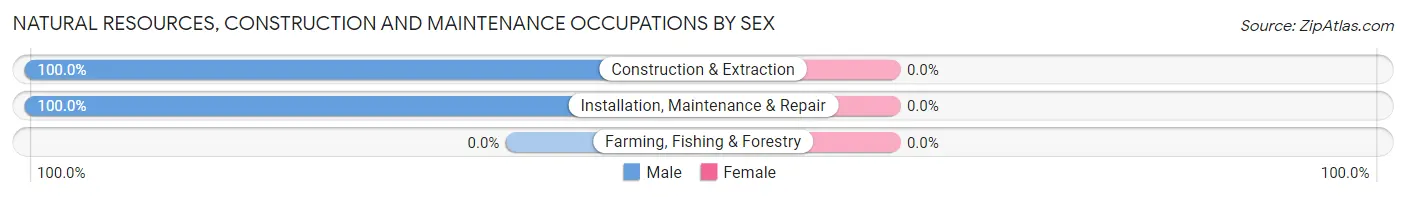
| Occupation | Male | Female |
| Farming, Fishing & Forestry | 0 (0.0%) | 0 (0.0%) |
| Construction & Extraction | 30 (100.0%) | 0 (0.0%) |
| Installation, Maintenance & Repair | 34 (100.0%) | 0 (0.0%) |
| Total (Category) | 64 (100.0%) | 0 (0.0%) |
| Total (Overall) | 399 (45.5%) | 478 (54.5%) |
Production, Transportation and Moving Occupations
The most common Production, Transportation and Moving occupations in East Uniontown are Material Moving (79 | 9.0%), Transportation (32 | 3.6%), and Production (31 | 3.5%).
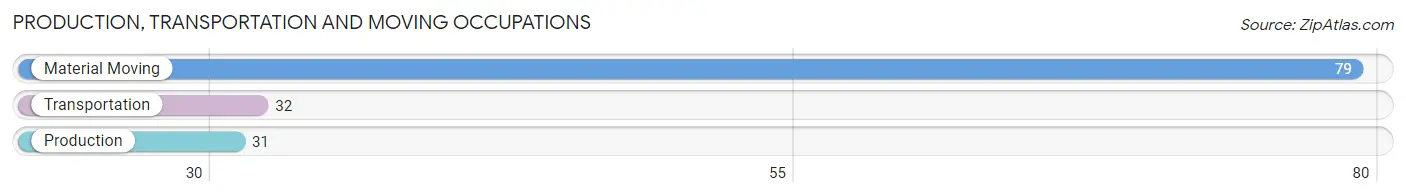
Production, Transportation and Moving Occupations by Sex
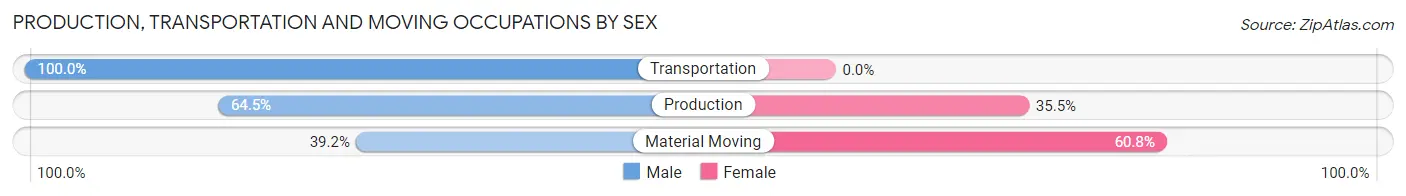
| Occupation | Male | Female |
| Production | 20 (64.5%) | 11 (35.5%) |
| Transportation | 32 (100.0%) | 0 (0.0%) |
| Material Moving | 31 (39.2%) | 48 (60.8%) |
| Total (Category) | 83 (58.5%) | 59 (41.5%) |
| Total (Overall) | 399 (45.5%) | 478 (54.5%) |
Employment Industries by Sex in East Uniontown
Employment Industries in East Uniontown
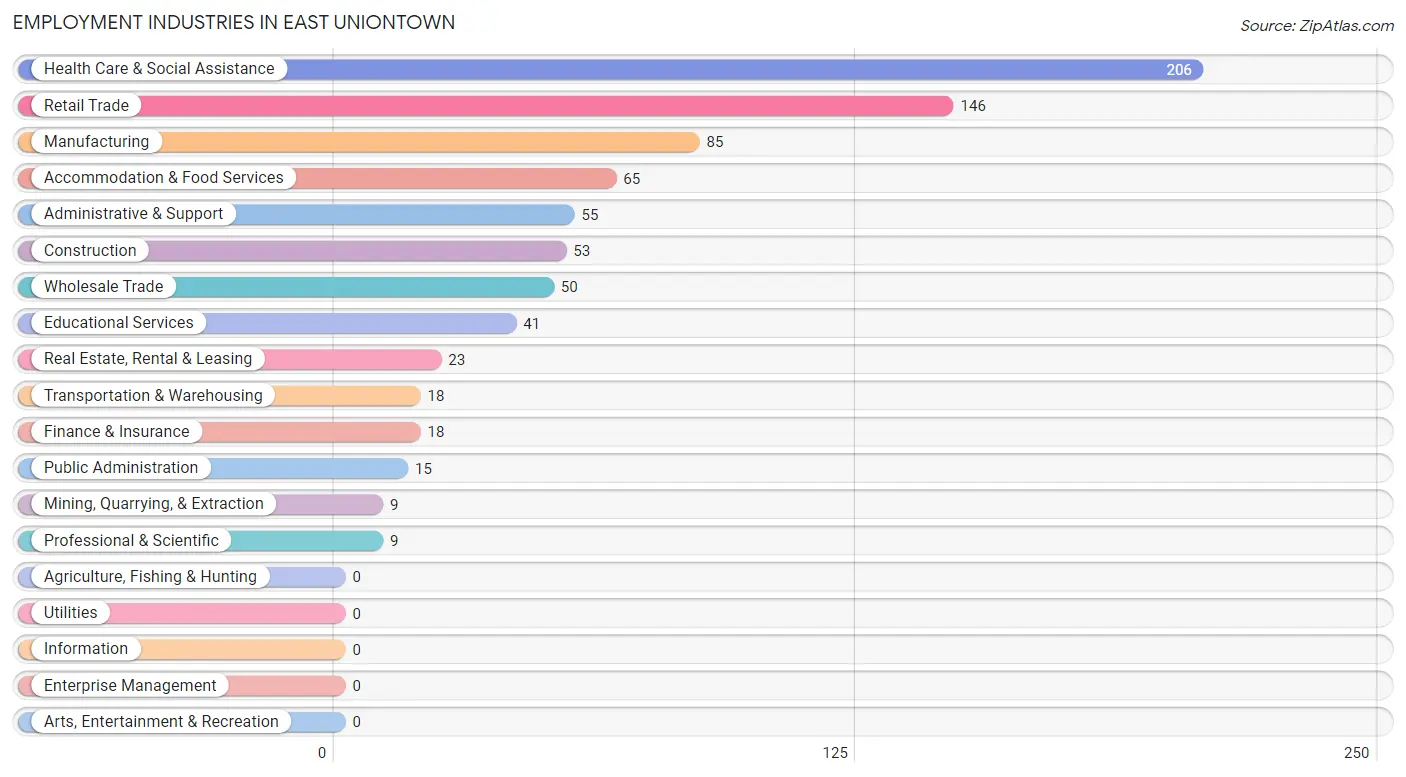
The major employment industries in East Uniontown include Health Care & Social Assistance (206 | 23.5%), Retail Trade (146 | 16.7%), Manufacturing (85 | 9.7%), Accommodation & Food Services (65 | 7.4%), and Administrative & Support (55 | 6.3%).
Employment Industries by Sex in East Uniontown
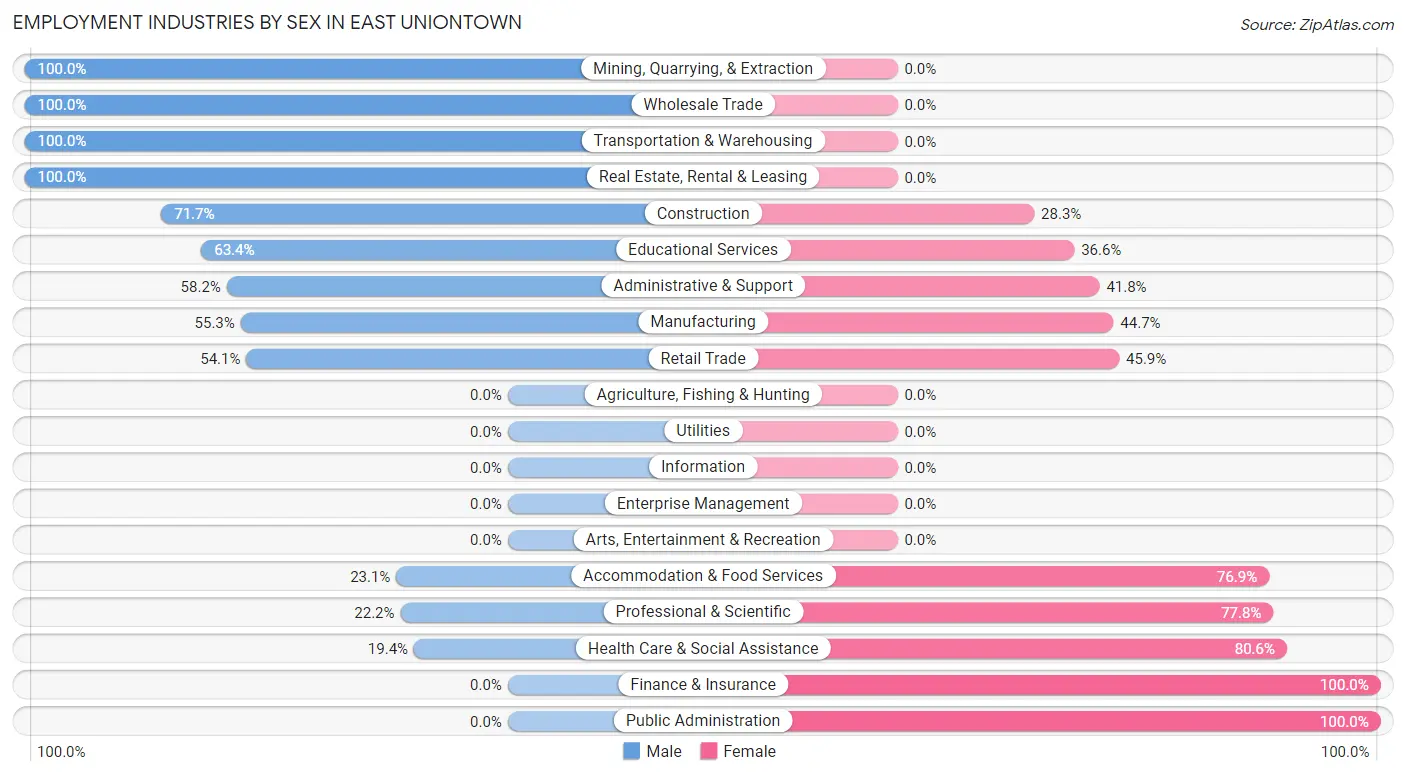
The East Uniontown industries that see more men than women are Mining, Quarrying, & Extraction (100.0%), Wholesale Trade (100.0%), and Transportation & Warehousing (100.0%), whereas the industries that tend to have a higher number of women are Finance & Insurance (100.0%), Public Administration (100.0%), and Health Care & Social Assistance (80.6%).
| Industry | Male | Female |
| Agriculture, Fishing & Hunting | 0 (0.0%) | 0 (0.0%) |
| Mining, Quarrying, & Extraction | 9 (100.0%) | 0 (0.0%) |
| Construction | 38 (71.7%) | 15 (28.3%) |
| Manufacturing | 47 (55.3%) | 38 (44.7%) |
| Wholesale Trade | 50 (100.0%) | 0 (0.0%) |
| Retail Trade | 79 (54.1%) | 67 (45.9%) |
| Transportation & Warehousing | 18 (100.0%) | 0 (0.0%) |
| Utilities | 0 (0.0%) | 0 (0.0%) |
| Information | 0 (0.0%) | 0 (0.0%) |
| Finance & Insurance | 0 (0.0%) | 18 (100.0%) |
| Real Estate, Rental & Leasing | 23 (100.0%) | 0 (0.0%) |
| Professional & Scientific | 2 (22.2%) | 7 (77.8%) |
| Enterprise Management | 0 (0.0%) | 0 (0.0%) |
| Administrative & Support | 32 (58.2%) | 23 (41.8%) |
| Educational Services | 26 (63.4%) | 15 (36.6%) |
| Health Care & Social Assistance | 40 (19.4%) | 166 (80.6%) |
| Arts, Entertainment & Recreation | 0 (0.0%) | 0 (0.0%) |
| Accommodation & Food Services | 15 (23.1%) | 50 (76.9%) |
| Public Administration | 0 (0.0%) | 15 (100.0%) |
| Total | 399 (45.5%) | 478 (54.5%) |
Education in East Uniontown
School Enrollment in East Uniontown
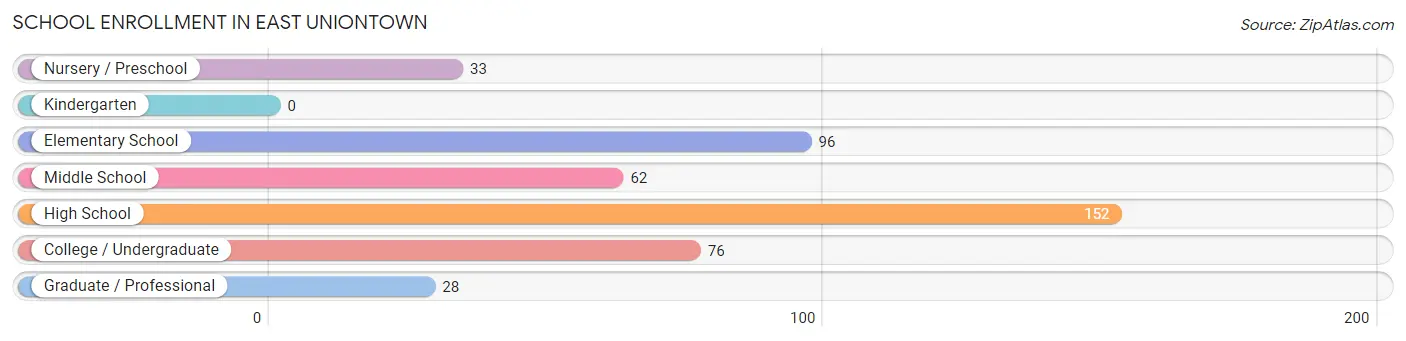
The most common levels of schooling among the 447 students in East Uniontown are high school (152 | 34.0%), elementary school (96 | 21.5%), and college / undergraduate (76 | 17.0%).
| School Level | # Students | % Students |
| Nursery / Preschool | 33 | 7.4% |
| Kindergarten | 0 | 0.0% |
| Elementary School | 96 | 21.5% |
| Middle School | 62 | 13.9% |
| High School | 152 | 34.0% |
| College / Undergraduate | 76 | 17.0% |
| Graduate / Professional | 28 | 6.3% |
| Total | 447 | 100.0% |
School Enrollment by Age by Funding Source in East Uniontown
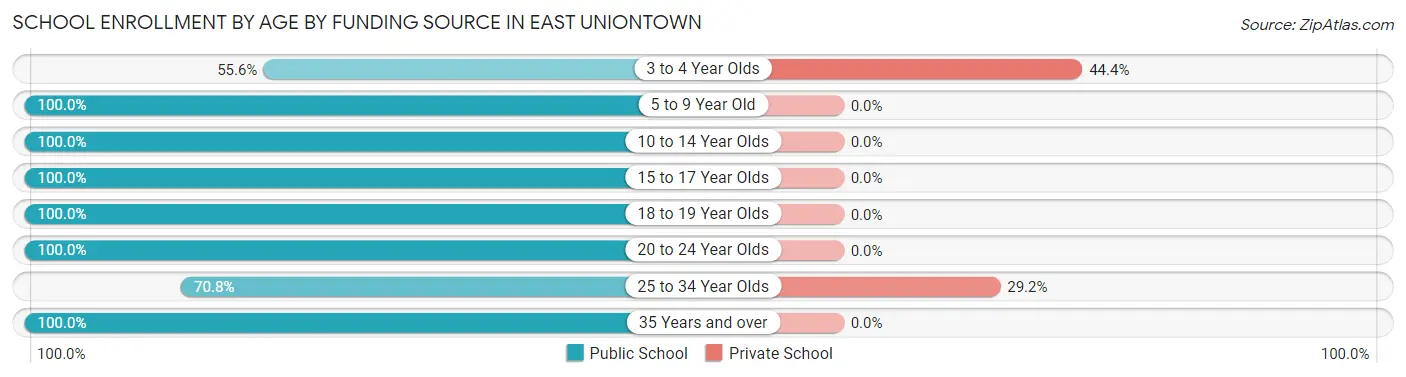
Out of a total of 447 students who are enrolled in schools in East Uniontown, 15 (3.4%) attend a private institution, while the remaining 432 (96.6%) are enrolled in public schools. The age group of 3 to 4 year olds has the highest likelihood of being enrolled in private schools, with 8 (44.4% in the age bracket) enrolled. Conversely, the age group of 5 to 9 year old has the lowest likelihood of being enrolled in a private school, with 84 (100.0% in the age bracket) attending a public institution.
| Age Bracket | Public School | Private School |
| 3 to 4 Year Olds | 10 (55.6%) | 8 (44.4%) |
| 5 to 9 Year Old | 84 (100.0%) | 0 (0.0%) |
| 10 to 14 Year Olds | 117 (100.0%) | 0 (0.0%) |
| 15 to 17 Year Olds | 124 (100.0%) | 0 (0.0%) |
| 18 to 19 Year Olds | 20 (100.0%) | 0 (0.0%) |
| 20 to 24 Year Olds | 42 (100.0%) | 0 (0.0%) |
| 25 to 34 Year Olds | 17 (70.8%) | 7 (29.2%) |
| 35 Years and over | 18 (100.0%) | 0 (0.0%) |
| Total | 432 (96.6%) | 15 (3.4%) |
Educational Attainment by Field of Study in East Uniontown
Education (64 | 28.8%), business (63 | 28.4%), liberal arts & history (61 | 27.5%), psychology (15 | 6.8%), and social sciences (10 | 4.5%) are the most common fields of study among 222 individuals in East Uniontown who have obtained a bachelor's degree or higher.
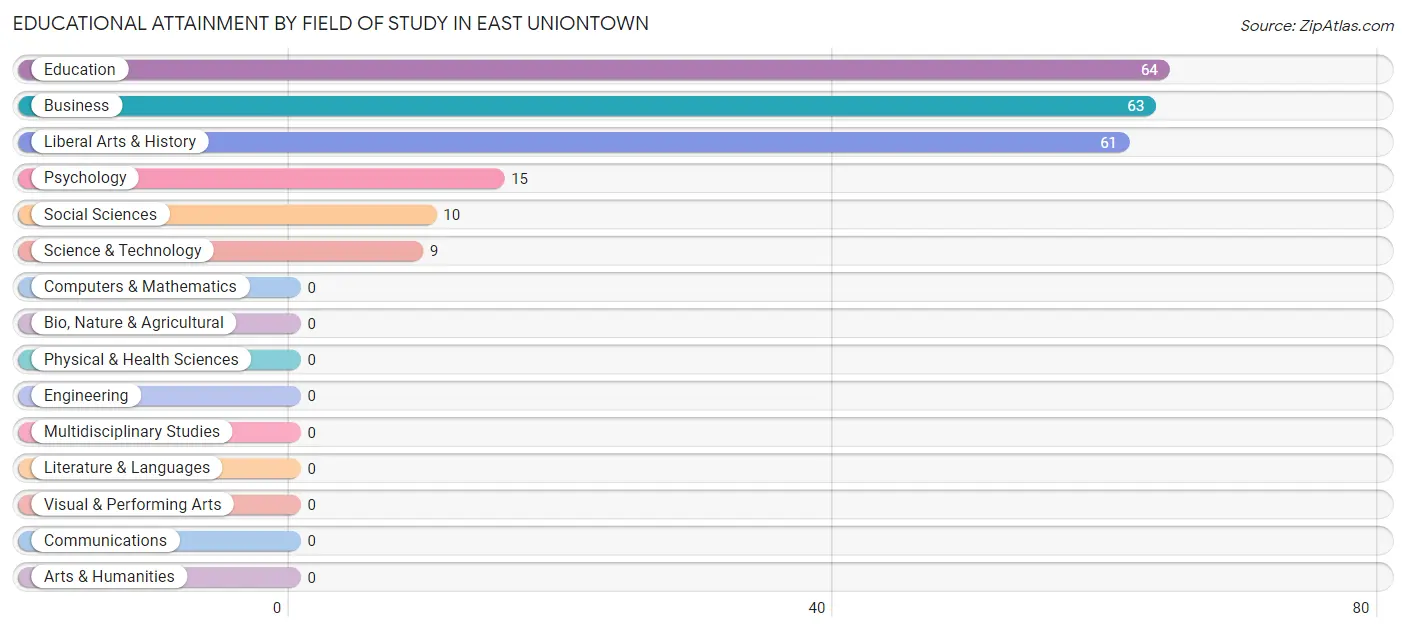
| Field of Study | # Graduates | % Graduates |
| Computers & Mathematics | 0 | 0.0% |
| Bio, Nature & Agricultural | 0 | 0.0% |
| Physical & Health Sciences | 0 | 0.0% |
| Psychology | 15 | 6.8% |
| Social Sciences | 10 | 4.5% |
| Engineering | 0 | 0.0% |
| Multidisciplinary Studies | 0 | 0.0% |
| Science & Technology | 9 | 4.1% |
| Business | 63 | 28.4% |
| Education | 64 | 28.8% |
| Literature & Languages | 0 | 0.0% |
| Liberal Arts & History | 61 | 27.5% |
| Visual & Performing Arts | 0 | 0.0% |
| Communications | 0 | 0.0% |
| Arts & Humanities | 0 | 0.0% |
| Total | 222 | 100.0% |
Transportation & Commute in East Uniontown
Vehicle Availability by Sex in East Uniontown
The most prevalent vehicle ownership categories in East Uniontown are males with 2 vehicles (200, accounting for 50.1%) and females with 2 vehicles (183, making up 42.7%).
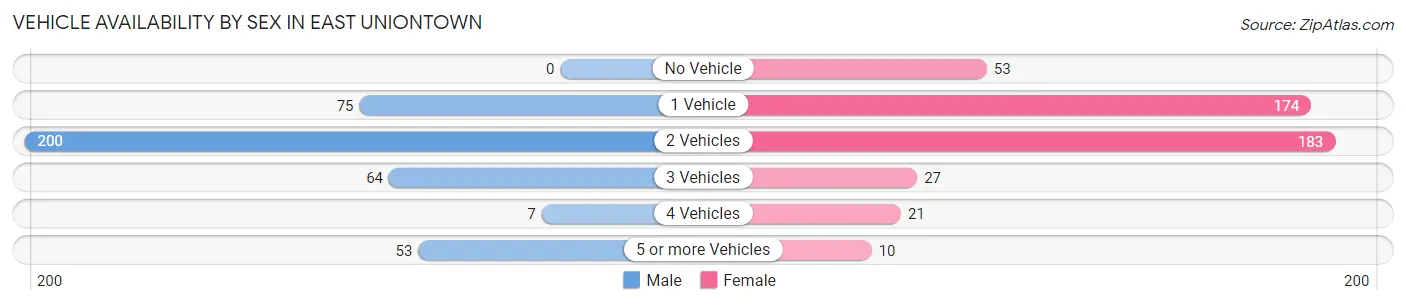
| Vehicles Available | Male | Female |
| No Vehicle | 0 (0.0%) | 53 (11.3%) |
| 1 Vehicle | 75 (18.8%) | 174 (37.2%) |
| 2 Vehicles | 200 (50.1%) | 183 (39.1%) |
| 3 Vehicles | 64 (16.0%) | 27 (5.8%) |
| 4 Vehicles | 7 (1.8%) | 21 (4.5%) |
| 5 or more Vehicles | 53 (13.3%) | 10 (2.1%) |
| Total | 399 (100.0%) | 468 (100.0%) |
Commute Time in East Uniontown
The most frequently occuring commute durations in East Uniontown are 10 to 14 minutes (187 commuters, 21.7%), 15 to 19 minutes (158 commuters, 18.4%), and 60 to 89 minutes (102 commuters, 11.9%).
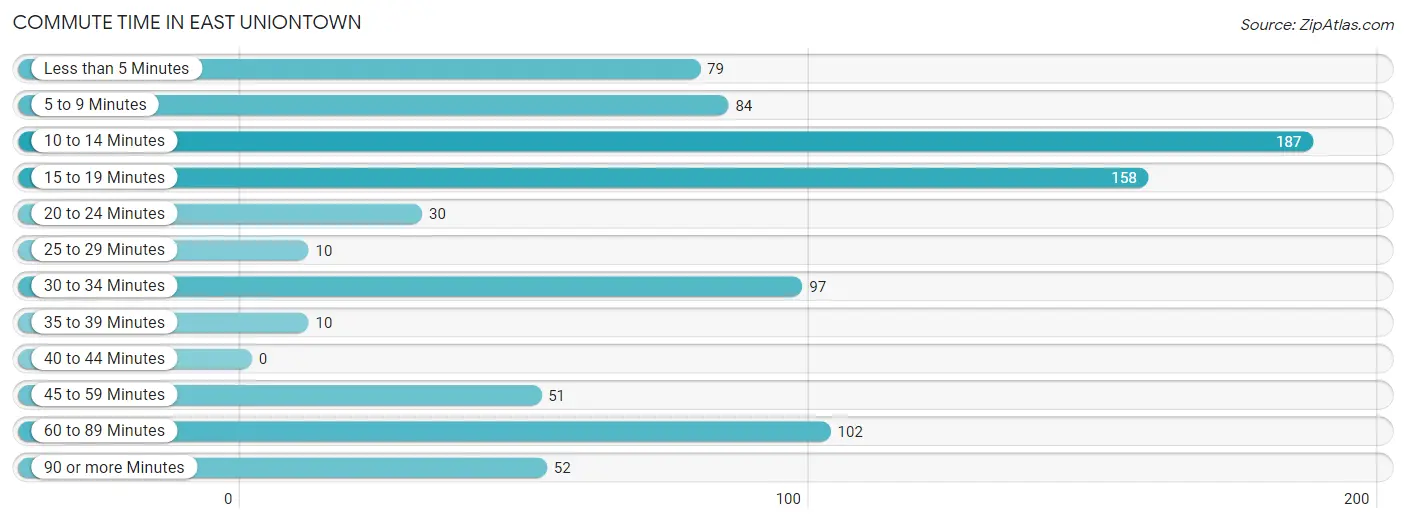
| Commute Time | # Commuters | % Commuters |
| Less than 5 Minutes | 79 | 9.2% |
| 5 to 9 Minutes | 84 | 9.8% |
| 10 to 14 Minutes | 187 | 21.7% |
| 15 to 19 Minutes | 158 | 18.4% |
| 20 to 24 Minutes | 30 | 3.5% |
| 25 to 29 Minutes | 10 | 1.2% |
| 30 to 34 Minutes | 97 | 11.3% |
| 35 to 39 Minutes | 10 | 1.2% |
| 40 to 44 Minutes | 0 | 0.0% |
| 45 to 59 Minutes | 51 | 5.9% |
| 60 to 89 Minutes | 102 | 11.9% |
| 90 or more Minutes | 52 | 6.0% |
Commute Time by Sex in East Uniontown
The most common commute times in East Uniontown are 10 to 14 minutes (81 commuters, 20.3%) for males and 15 to 19 minutes (136 commuters, 29.5%) for females.
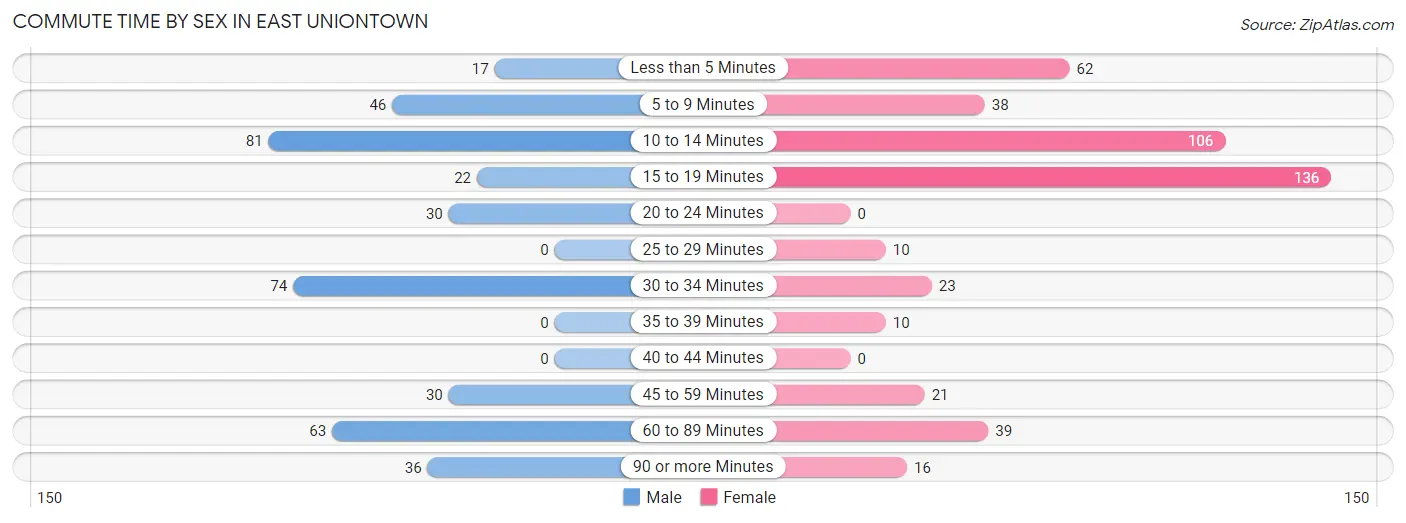
| Commute Time | Male | Female |
| Less than 5 Minutes | 17 (4.3%) | 62 (13.5%) |
| 5 to 9 Minutes | 46 (11.5%) | 38 (8.2%) |
| 10 to 14 Minutes | 81 (20.3%) | 106 (23.0%) |
| 15 to 19 Minutes | 22 (5.5%) | 136 (29.5%) |
| 20 to 24 Minutes | 30 (7.5%) | 0 (0.0%) |
| 25 to 29 Minutes | 0 (0.0%) | 10 (2.2%) |
| 30 to 34 Minutes | 74 (18.5%) | 23 (5.0%) |
| 35 to 39 Minutes | 0 (0.0%) | 10 (2.2%) |
| 40 to 44 Minutes | 0 (0.0%) | 0 (0.0%) |
| 45 to 59 Minutes | 30 (7.5%) | 21 (4.6%) |
| 60 to 89 Minutes | 63 (15.8%) | 39 (8.5%) |
| 90 or more Minutes | 36 (9.0%) | 16 (3.5%) |
Time of Departure to Work by Sex in East Uniontown
The most frequent times of departure to work in East Uniontown are 12:00 AM to 4:59 AM (92, 23.1%) for males and 7:30 AM to 7:59 AM (91, 19.7%) for females.
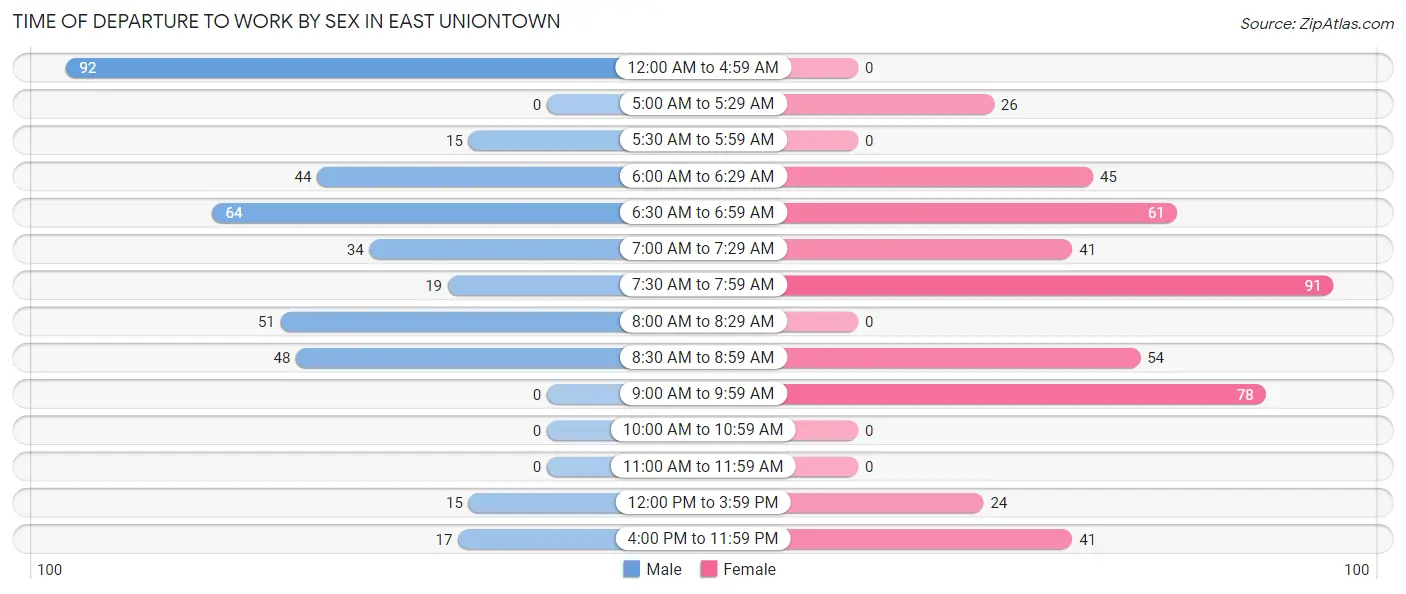
| Time of Departure | Male | Female |
| 12:00 AM to 4:59 AM | 92 (23.1%) | 0 (0.0%) |
| 5:00 AM to 5:29 AM | 0 (0.0%) | 26 (5.6%) |
| 5:30 AM to 5:59 AM | 15 (3.8%) | 0 (0.0%) |
| 6:00 AM to 6:29 AM | 44 (11.0%) | 45 (9.8%) |
| 6:30 AM to 6:59 AM | 64 (16.0%) | 61 (13.2%) |
| 7:00 AM to 7:29 AM | 34 (8.5%) | 41 (8.9%) |
| 7:30 AM to 7:59 AM | 19 (4.8%) | 91 (19.7%) |
| 8:00 AM to 8:29 AM | 51 (12.8%) | 0 (0.0%) |
| 8:30 AM to 8:59 AM | 48 (12.0%) | 54 (11.7%) |
| 9:00 AM to 9:59 AM | 0 (0.0%) | 78 (16.9%) |
| 10:00 AM to 10:59 AM | 0 (0.0%) | 0 (0.0%) |
| 11:00 AM to 11:59 AM | 0 (0.0%) | 0 (0.0%) |
| 12:00 PM to 3:59 PM | 15 (3.8%) | 24 (5.2%) |
| 4:00 PM to 11:59 PM | 17 (4.3%) | 41 (8.9%) |
| Total | 399 (100.0%) | 461 (100.0%) |
Housing Occupancy in East Uniontown
Occupancy by Ownership in East Uniontown
Of the total 1,053 dwellings in East Uniontown, owner-occupied units account for 661 (62.8%), while renter-occupied units make up 392 (37.2%).
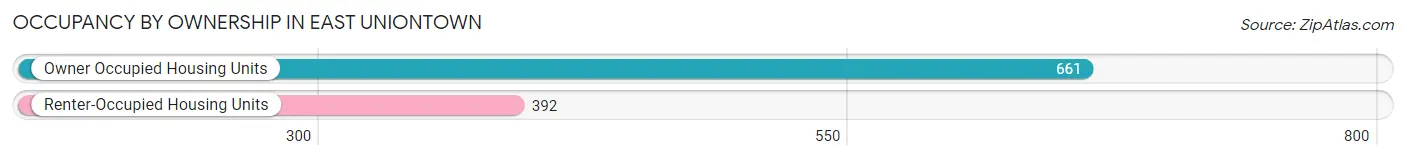
| Occupancy | # Housing Units | % Housing Units |
| Owner Occupied Housing Units | 661 | 62.8% |
| Renter-Occupied Housing Units | 392 | 37.2% |
| Total Occupied Housing Units | 1,053 | 100.0% |
Occupancy by Household Size in East Uniontown
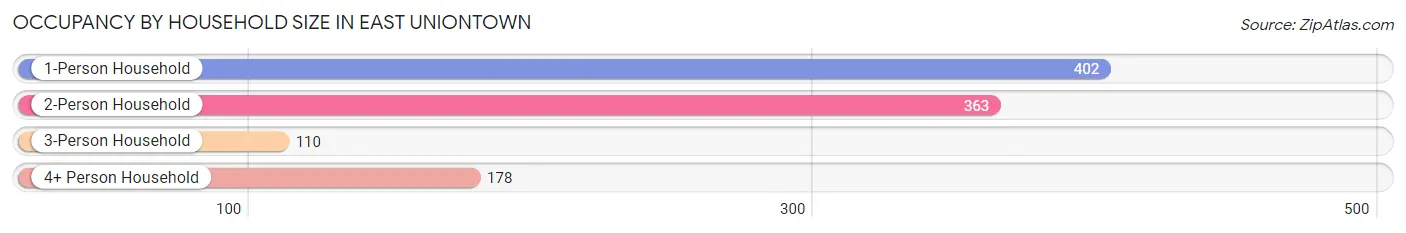
| Household Size | # Housing Units | % Housing Units |
| 1-Person Household | 402 | 38.2% |
| 2-Person Household | 363 | 34.5% |
| 3-Person Household | 110 | 10.4% |
| 4+ Person Household | 178 | 16.9% |
| Total Housing Units | 1,053 | 100.0% |
Occupancy by Ownership by Household Size in East Uniontown
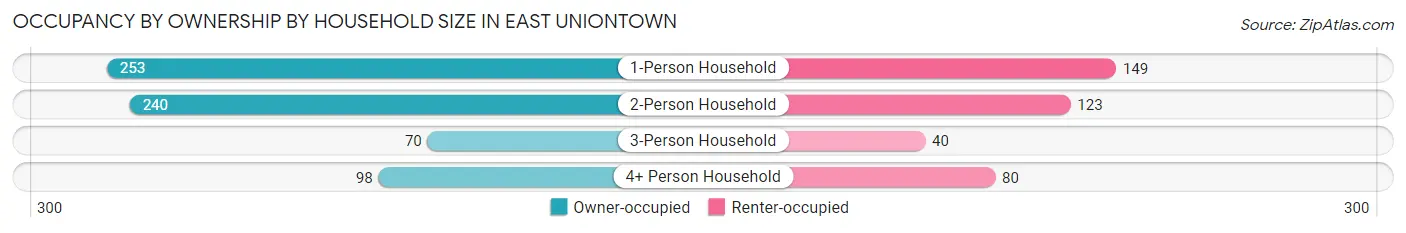
| Household Size | Owner-occupied | Renter-occupied |
| 1-Person Household | 253 (62.9%) | 149 (37.1%) |
| 2-Person Household | 240 (66.1%) | 123 (33.9%) |
| 3-Person Household | 70 (63.6%) | 40 (36.4%) |
| 4+ Person Household | 98 (55.1%) | 80 (44.9%) |
| Total Housing Units | 661 (62.8%) | 392 (37.2%) |
Occupancy by Educational Attainment in East Uniontown
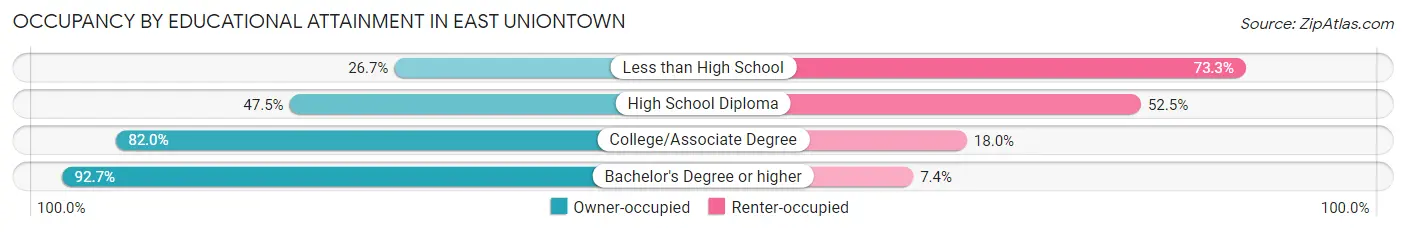
| Household Size | Owner-occupied | Renter-occupied |
| Less than High School | 35 (26.7%) | 96 (73.3%) |
| High School Diploma | 209 (47.5%) | 231 (52.5%) |
| College/Associate Degree | 228 (82.0%) | 50 (18.0%) |
| Bachelor's Degree or higher | 189 (92.6%) | 15 (7.3%) |
Occupancy by Age of Householder in East Uniontown
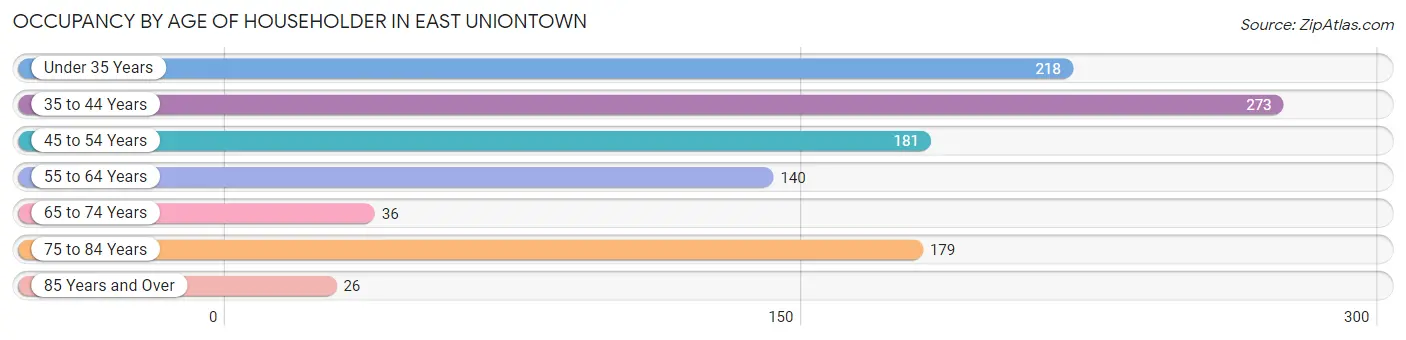
| Age Bracket | # Households | % Households |
| Under 35 Years | 218 | 20.7% |
| 35 to 44 Years | 273 | 25.9% |
| 45 to 54 Years | 181 | 17.2% |
| 55 to 64 Years | 140 | 13.3% |
| 65 to 74 Years | 36 | 3.4% |
| 75 to 84 Years | 179 | 17.0% |
| 85 Years and Over | 26 | 2.5% |
| Total | 1,053 | 100.0% |
Housing Finances in East Uniontown
Median Income by Occupancy in East Uniontown
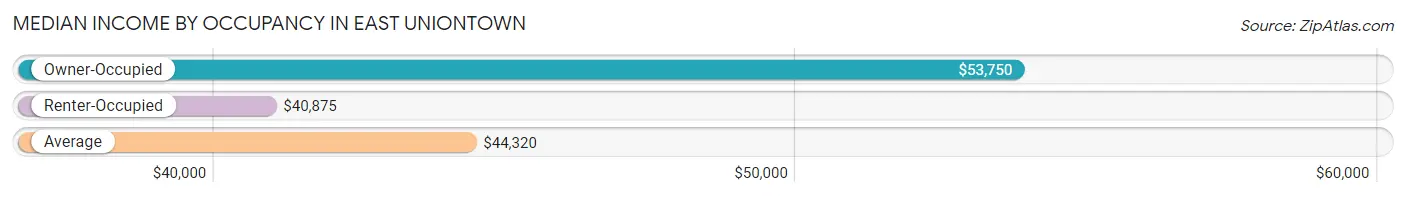
| Occupancy Type | # Households | Median Income |
| Owner-Occupied | 661 (62.8%) | $53,750 |
| Renter-Occupied | 392 (37.2%) | $40,875 |
| Average | 1,053 (100.0%) | $44,320 |
Occupancy by Householder Income Bracket in East Uniontown
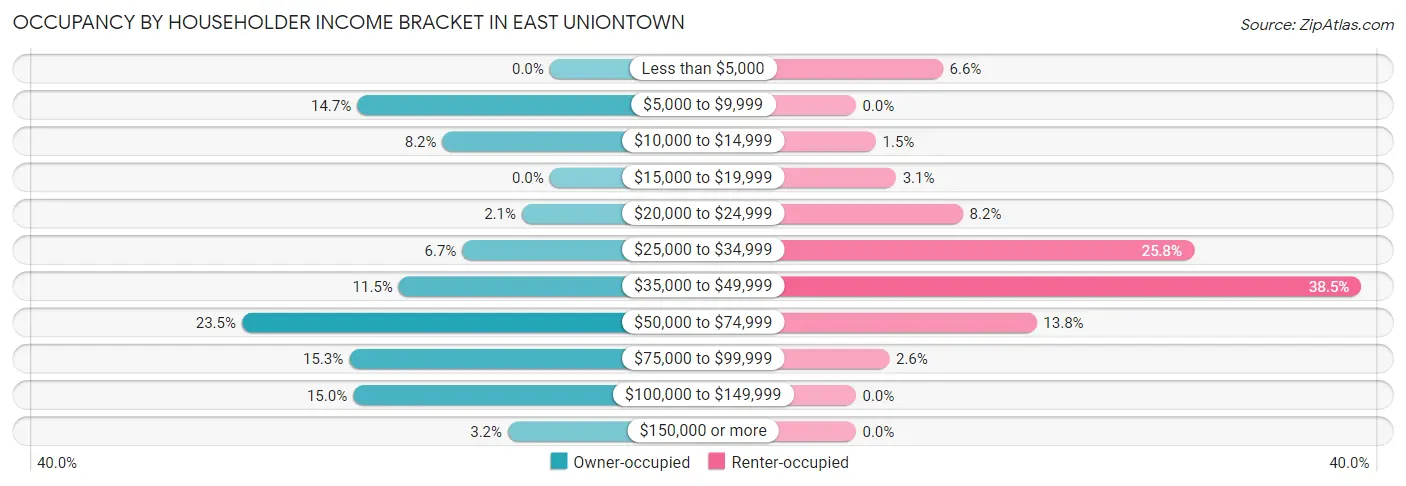
| Income Bracket | Owner-occupied | Renter-occupied |
| Less than $5,000 | 0 (0.0%) | 26 (6.6%) |
| $5,000 to $9,999 | 97 (14.7%) | 0 (0.0%) |
| $10,000 to $14,999 | 54 (8.2%) | 6 (1.5%) |
| $15,000 to $19,999 | 0 (0.0%) | 12 (3.1%) |
| $20,000 to $24,999 | 14 (2.1%) | 32 (8.2%) |
| $25,000 to $34,999 | 44 (6.7%) | 101 (25.8%) |
| $35,000 to $49,999 | 76 (11.5%) | 151 (38.5%) |
| $50,000 to $74,999 | 155 (23.4%) | 54 (13.8%) |
| $75,000 to $99,999 | 101 (15.3%) | 10 (2.5%) |
| $100,000 to $149,999 | 99 (15.0%) | 0 (0.0%) |
| $150,000 or more | 21 (3.2%) | 0 (0.0%) |
| Total | 661 (100.0%) | 392 (100.0%) |
Monthly Housing Cost Tiers in East Uniontown
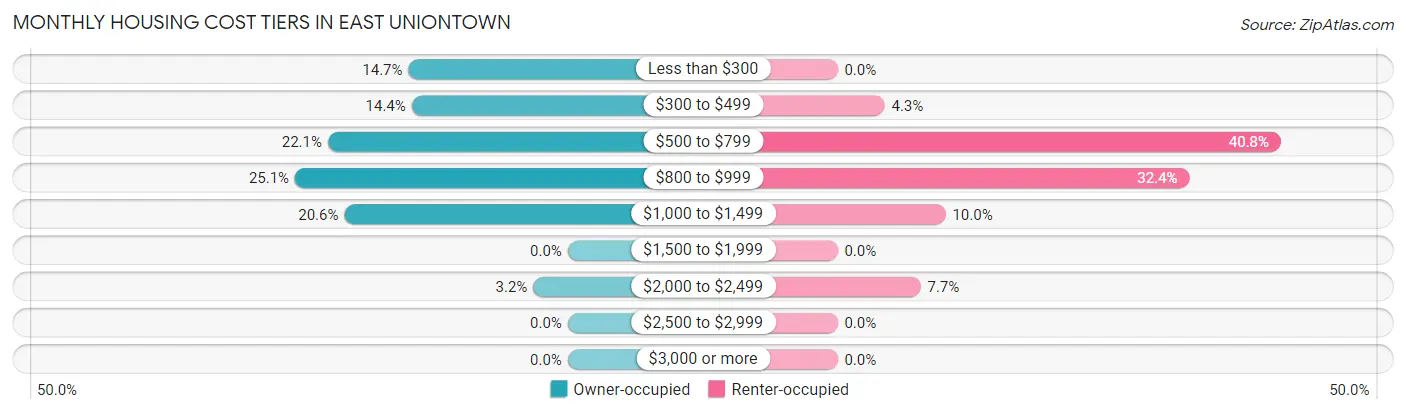
| Monthly Cost | Owner-occupied | Renter-occupied |
| Less than $300 | 97 (14.7%) | 0 (0.0%) |
| $300 to $499 | 95 (14.4%) | 17 (4.3%) |
| $500 to $799 | 146 (22.1%) | 160 (40.8%) |
| $800 to $999 | 166 (25.1%) | 127 (32.4%) |
| $1,000 to $1,499 | 136 (20.6%) | 39 (10.0%) |
| $1,500 to $1,999 | 0 (0.0%) | 0 (0.0%) |
| $2,000 to $2,499 | 21 (3.2%) | 30 (7.6%) |
| $2,500 to $2,999 | 0 (0.0%) | 0 (0.0%) |
| $3,000 or more | 0 (0.0%) | 0 (0.0%) |
| Total | 661 (100.0%) | 392 (100.0%) |
Physical Housing Characteristics in East Uniontown
Housing Structures in East Uniontown
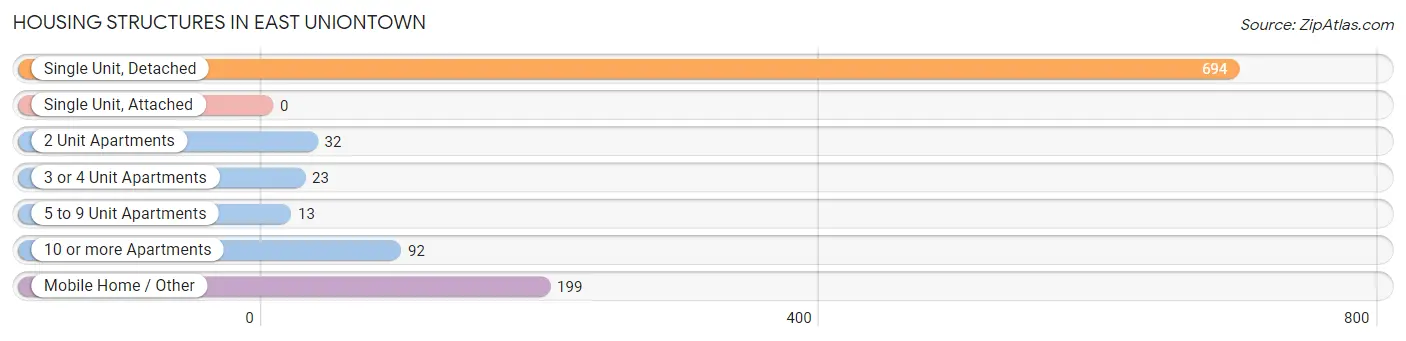
| Structure Type | # Housing Units | % Housing Units |
| Single Unit, Detached | 694 | 65.9% |
| Single Unit, Attached | 0 | 0.0% |
| 2 Unit Apartments | 32 | 3.0% |
| 3 or 4 Unit Apartments | 23 | 2.2% |
| 5 to 9 Unit Apartments | 13 | 1.2% |
| 10 or more Apartments | 92 | 8.7% |
| Mobile Home / Other | 199 | 18.9% |
| Total | 1,053 | 100.0% |
Housing Structures by Occupancy in East Uniontown
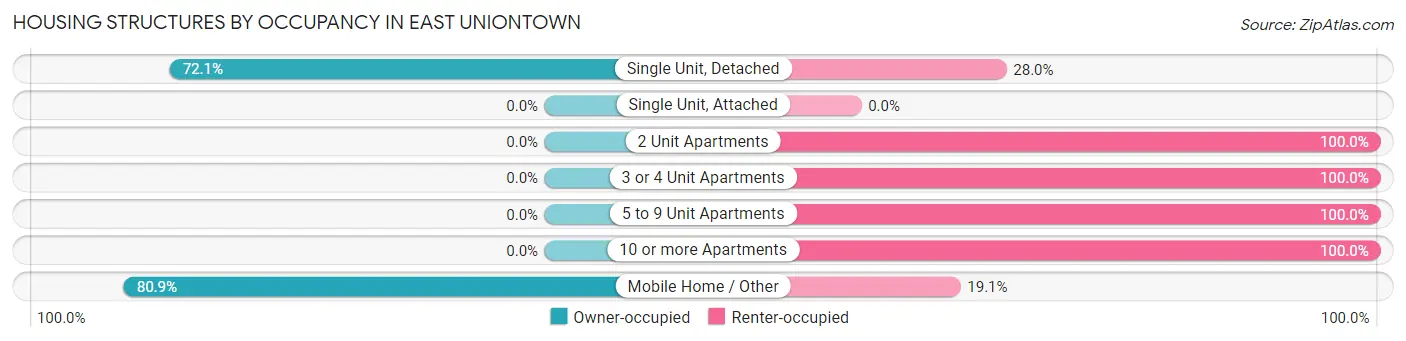
| Structure Type | Owner-occupied | Renter-occupied |
| Single Unit, Detached | 500 (72.1%) | 194 (28.0%) |
| Single Unit, Attached | 0 (0.0%) | 0 (0.0%) |
| 2 Unit Apartments | 0 (0.0%) | 32 (100.0%) |
| 3 or 4 Unit Apartments | 0 (0.0%) | 23 (100.0%) |
| 5 to 9 Unit Apartments | 0 (0.0%) | 13 (100.0%) |
| 10 or more Apartments | 0 (0.0%) | 92 (100.0%) |
| Mobile Home / Other | 161 (80.9%) | 38 (19.1%) |
| Total | 661 (62.8%) | 392 (37.2%) |
Housing Structures by Number of Rooms in East Uniontown
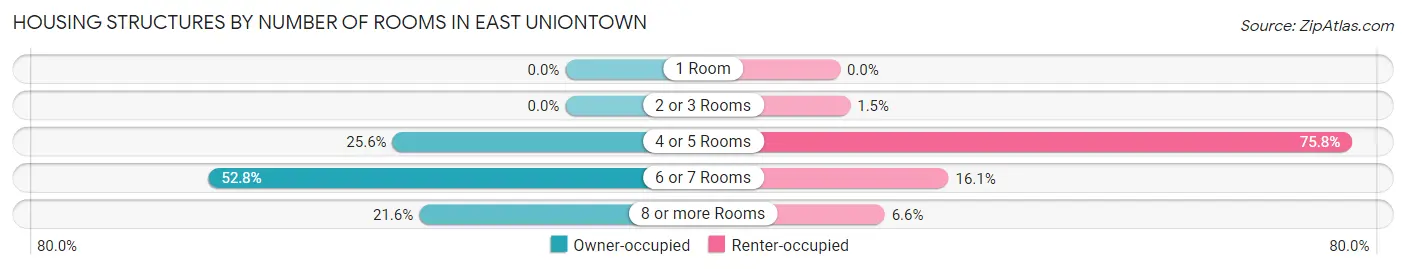
| Number of Rooms | Owner-occupied | Renter-occupied |
| 1 Room | 0 (0.0%) | 0 (0.0%) |
| 2 or 3 Rooms | 0 (0.0%) | 6 (1.5%) |
| 4 or 5 Rooms | 169 (25.6%) | 297 (75.8%) |
| 6 or 7 Rooms | 349 (52.8%) | 63 (16.1%) |
| 8 or more Rooms | 143 (21.6%) | 26 (6.6%) |
| Total | 661 (100.0%) | 392 (100.0%) |
Housing Structure by Heating Type in East Uniontown
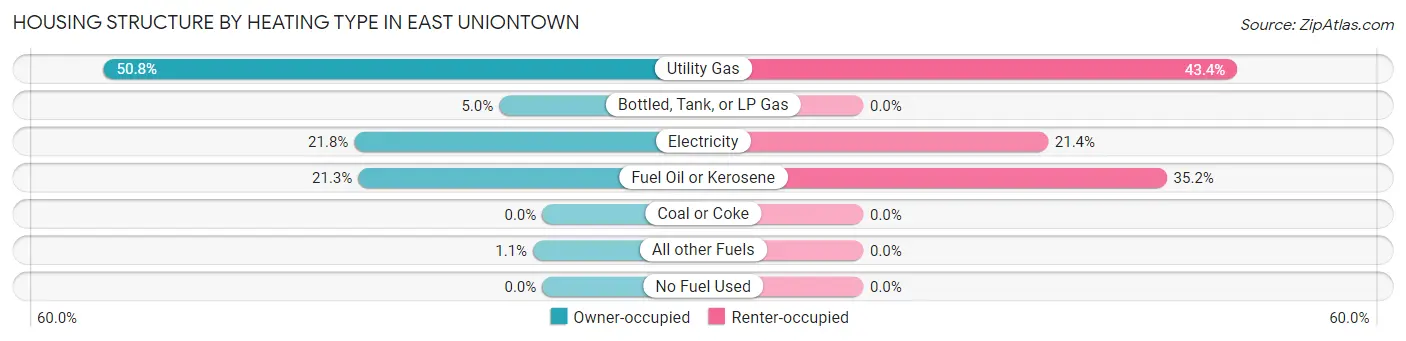
| Heating Type | Owner-occupied | Renter-occupied |
| Utility Gas | 336 (50.8%) | 170 (43.4%) |
| Bottled, Tank, or LP Gas | 33 (5.0%) | 0 (0.0%) |
| Electricity | 144 (21.8%) | 84 (21.4%) |
| Fuel Oil or Kerosene | 141 (21.3%) | 138 (35.2%) |
| Coal or Coke | 0 (0.0%) | 0 (0.0%) |
| All other Fuels | 7 (1.1%) | 0 (0.0%) |
| No Fuel Used | 0 (0.0%) | 0 (0.0%) |
| Total | 661 (100.0%) | 392 (100.0%) |
Household Vehicle Usage in East Uniontown

| Vehicles per Household | Owner-occupied | Renter-occupied |
| No Vehicle | 9 (1.4%) | 53 (13.5%) |
| 1 Vehicle | 347 (52.5%) | 296 (75.5%) |
| 2 Vehicles | 254 (38.4%) | 28 (7.1%) |
| 3 or more Vehicles | 51 (7.7%) | 15 (3.8%) |
| Total | 661 (100.0%) | 392 (100.0%) |
Real Estate & Mortgages in East Uniontown
Real Estate and Mortgage Overview in East Uniontown
| Characteristic | Without Mortgage | With Mortgage |
| Housing Units | 328 | 333 |
| Median Property Value | - | - |
| Median Household Income | - | - |
| Monthly Housing Costs | $418 | $0 |
| Real Estate Taxes | - | - |
Property Value by Mortgage Status in East Uniontown
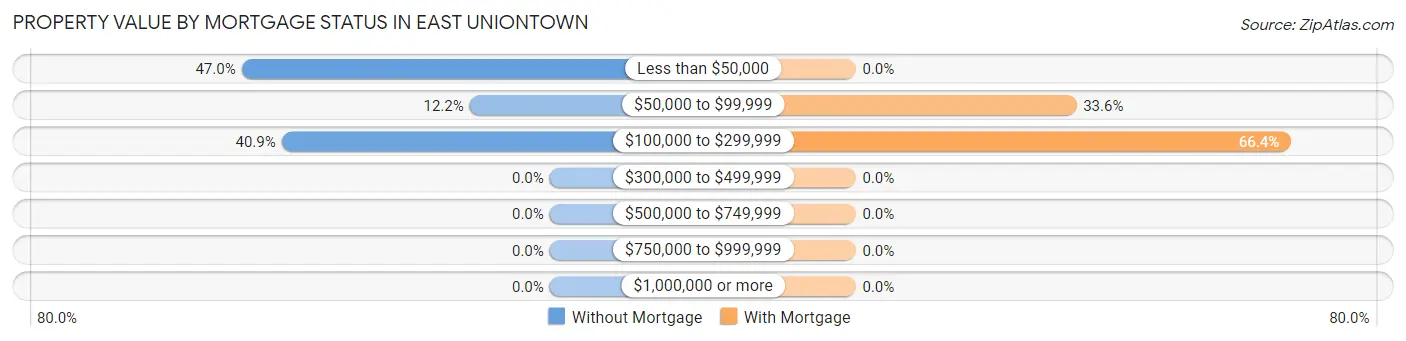
| Property Value | Without Mortgage | With Mortgage |
| Less than $50,000 | 154 (46.9%) | 0 (0.0%) |
| $50,000 to $99,999 | 40 (12.2%) | 112 (33.6%) |
| $100,000 to $299,999 | 134 (40.8%) | 221 (66.4%) |
| $300,000 to $499,999 | 0 (0.0%) | 0 (0.0%) |
| $500,000 to $749,999 | 0 (0.0%) | 0 (0.0%) |
| $750,000 to $999,999 | 0 (0.0%) | 0 (0.0%) |
| $1,000,000 or more | 0 (0.0%) | 0 (0.0%) |
| Total | 328 (100.0%) | 333 (100.0%) |
Household Income by Mortgage Status in East Uniontown
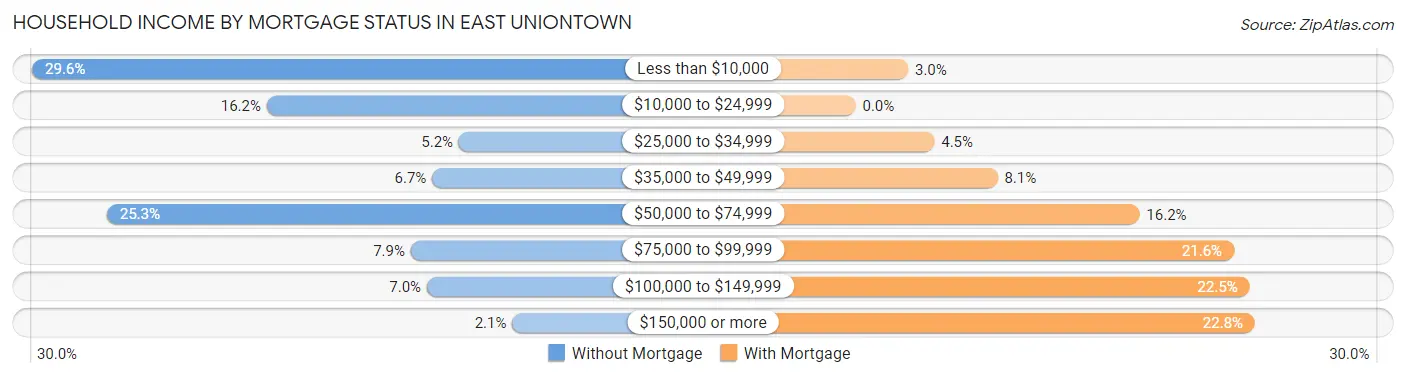
| Household Income | Without Mortgage | With Mortgage |
| Less than $10,000 | 97 (29.6%) | 10 (3.0%) |
| $10,000 to $24,999 | 53 (16.2%) | 0 (0.0%) |
| $25,000 to $34,999 | 17 (5.2%) | 15 (4.5%) |
| $35,000 to $49,999 | 22 (6.7%) | 27 (8.1%) |
| $50,000 to $74,999 | 83 (25.3%) | 54 (16.2%) |
| $75,000 to $99,999 | 26 (7.9%) | 72 (21.6%) |
| $100,000 to $149,999 | 23 (7.0%) | 75 (22.5%) |
| $150,000 or more | 7 (2.1%) | 76 (22.8%) |
| Total | 328 (100.0%) | 333 (100.0%) |
Property Value to Household Income Ratio in East Uniontown
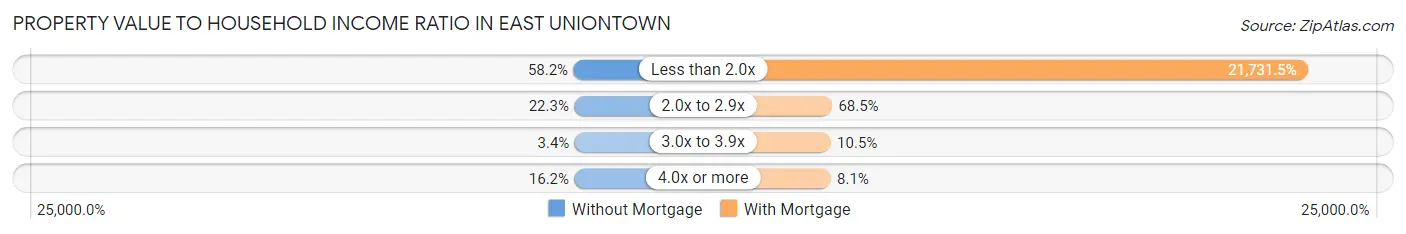
| Value-to-Income Ratio | Without Mortgage | With Mortgage |
| Less than 2.0x | 191 (58.2%) | 72,366 (21,731.5%) |
| 2.0x to 2.9x | 73 (22.3%) | 228 (68.5%) |
| 3.0x to 3.9x | 11 (3.4%) | 35 (10.5%) |
| 4.0x or more | 53 (16.2%) | 27 (8.1%) |
| Total | 328 (100.0%) | 333 (100.0%) |
Real Estate Taxes by Mortgage Status in East Uniontown
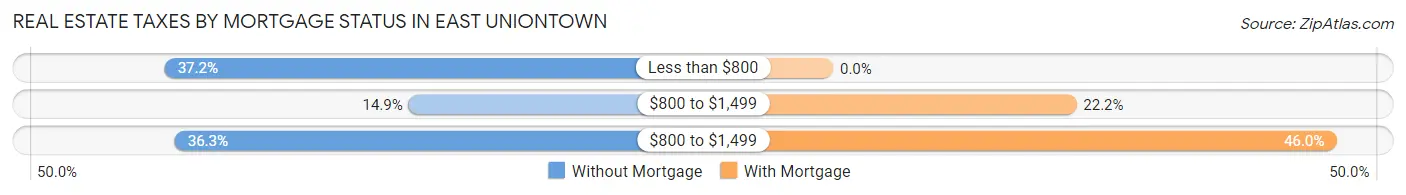
| Property Taxes | Without Mortgage | With Mortgage |
| Less than $800 | 122 (37.2%) | 0 (0.0%) |
| $800 to $1,499 | 49 (14.9%) | 74 (22.2%) |
| $800 to $1,499 | 119 (36.3%) | 153 (46.0%) |
| Total | 328 (100.0%) | 333 (100.0%) |
Health & Disability in East Uniontown
Health Insurance Coverage by Age in East Uniontown
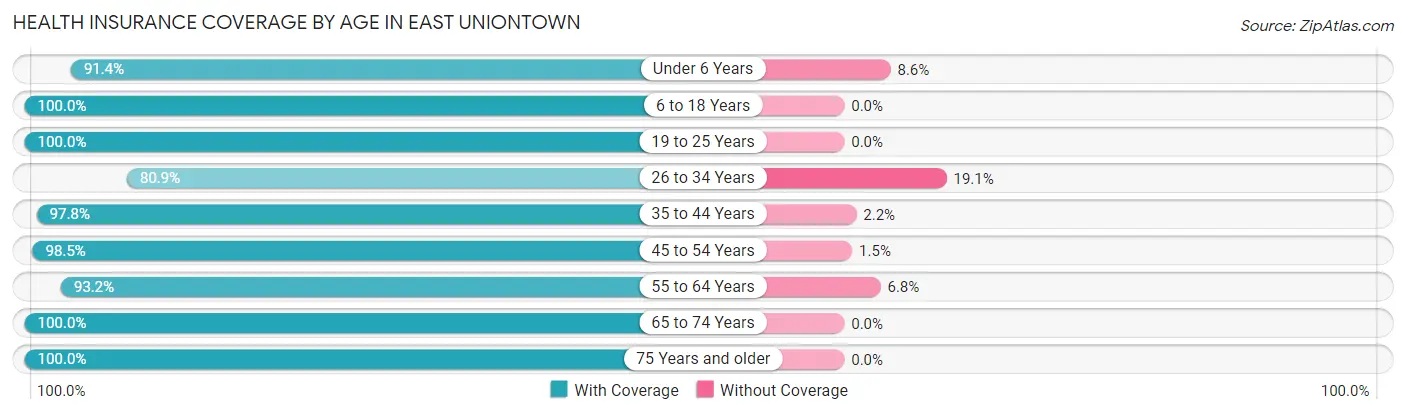
| Age Bracket | With Coverage | Without Coverage |
| Under 6 Years | 159 (91.4%) | 15 (8.6%) |
| 6 to 18 Years | 325 (100.0%) | 0 (0.0%) |
| 19 to 25 Years | 282 (100.0%) | 0 (0.0%) |
| 26 to 34 Years | 208 (80.9%) | 49 (19.1%) |
| 35 to 44 Years | 349 (97.8%) | 8 (2.2%) |
| 45 to 54 Years | 269 (98.5%) | 4 (1.5%) |
| 55 to 64 Years | 193 (93.2%) | 14 (6.8%) |
| 65 to 74 Years | 62 (100.0%) | 0 (0.0%) |
| 75 Years and older | 242 (100.0%) | 0 (0.0%) |
| Total | 2,089 (95.9%) | 90 (4.1%) |
Health Insurance Coverage by Citizenship Status in East Uniontown
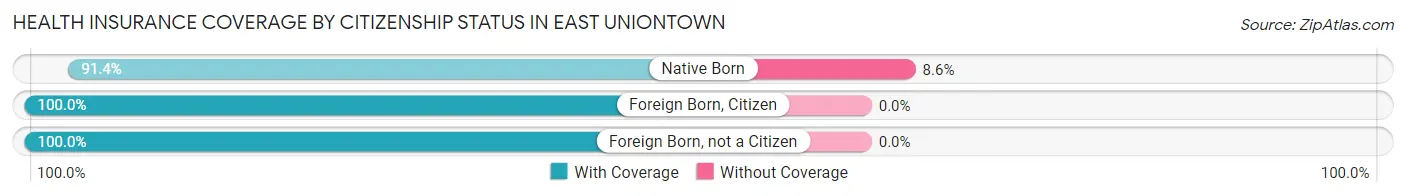
| Citizenship Status | With Coverage | Without Coverage |
| Native Born | 159 (91.4%) | 15 (8.6%) |
| Foreign Born, Citizen | 325 (100.0%) | 0 (0.0%) |
| Foreign Born, not a Citizen | 282 (100.0%) | 0 (0.0%) |
Health Insurance Coverage by Household Income in East Uniontown
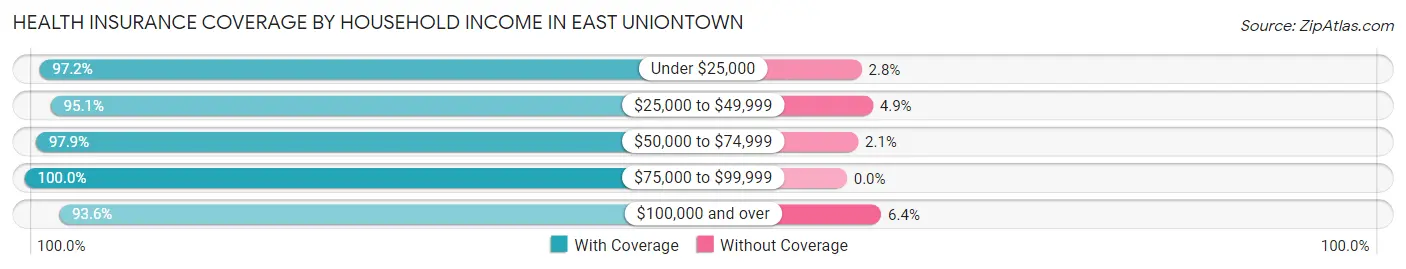
| Household Income | With Coverage | Without Coverage |
| Under $25,000 | 316 (97.2%) | 9 (2.8%) |
| $25,000 to $49,999 | 761 (95.1%) | 39 (4.9%) |
| $50,000 to $74,999 | 416 (97.9%) | 9 (2.1%) |
| $75,000 to $99,999 | 232 (100.0%) | 0 (0.0%) |
| $100,000 and over | 334 (93.6%) | 23 (6.4%) |
Public vs Private Health Insurance Coverage by Age in East Uniontown
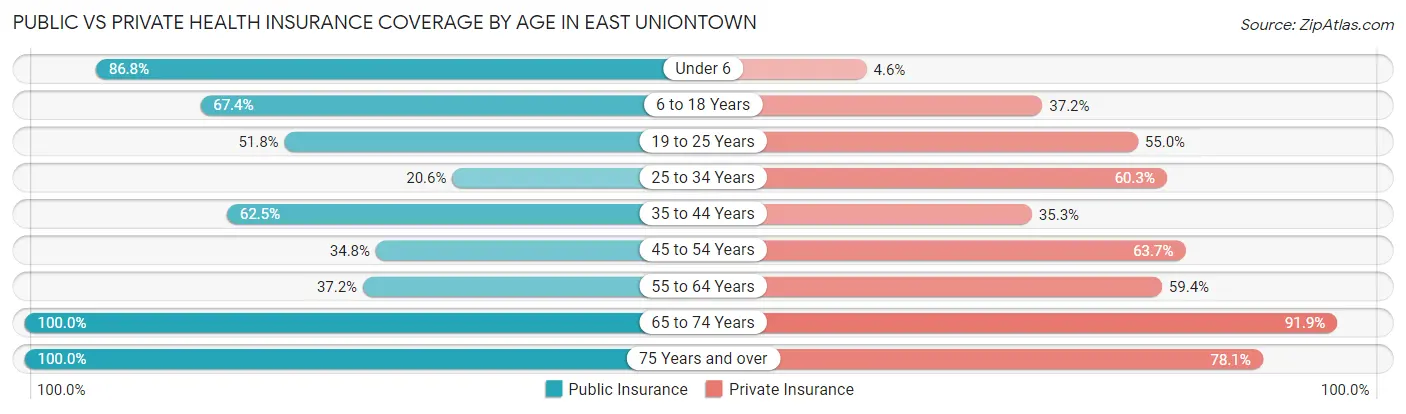
| Age Bracket | Public Insurance | Private Insurance |
| Under 6 | 151 (86.8%) | 8 (4.6%) |
| 6 to 18 Years | 219 (67.4%) | 121 (37.2%) |
| 19 to 25 Years | 146 (51.8%) | 155 (55.0%) |
| 25 to 34 Years | 53 (20.6%) | 155 (60.3%) |
| 35 to 44 Years | 223 (62.5%) | 126 (35.3%) |
| 45 to 54 Years | 95 (34.8%) | 174 (63.7%) |
| 55 to 64 Years | 77 (37.2%) | 123 (59.4%) |
| 65 to 74 Years | 62 (100.0%) | 57 (91.9%) |
| 75 Years and over | 242 (100.0%) | 189 (78.1%) |
| Total | 1,268 (58.2%) | 1,108 (50.8%) |
Disability Status by Sex by Age in East Uniontown
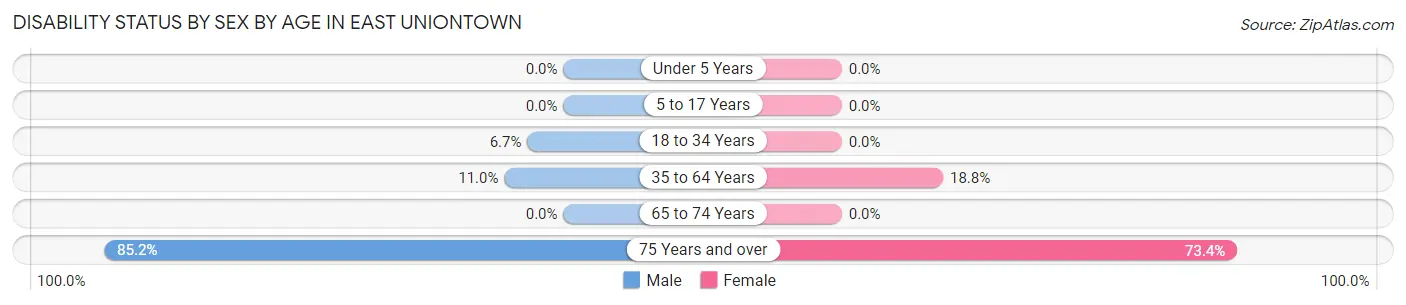
| Age Bracket | Male | Female |
| Under 5 Years | 0 (0.0%) | 0 (0.0%) |
| 5 to 17 Years | 0 (0.0%) | 0 (0.0%) |
| 18 to 34 Years | 17 (6.7%) | 0 (0.0%) |
| 35 to 64 Years | 34 (11.0%) | 99 (18.8%) |
| 65 to 74 Years | 0 (0.0%) | 0 (0.0%) |
| 75 Years and over | 75 (85.2%) | 113 (73.4%) |
Disability Class by Sex by Age in East Uniontown
Disability Class: Hearing Difficulty
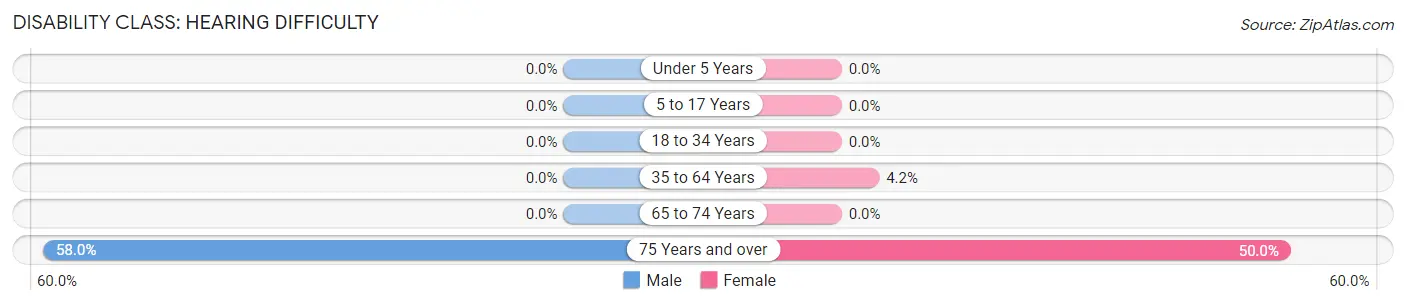
| Age Bracket | Male | Female |
| Under 5 Years | 0 (0.0%) | 0 (0.0%) |
| 5 to 17 Years | 0 (0.0%) | 0 (0.0%) |
| 18 to 34 Years | 0 (0.0%) | 0 (0.0%) |
| 35 to 64 Years | 0 (0.0%) | 22 (4.2%) |
| 65 to 74 Years | 0 (0.0%) | 0 (0.0%) |
| 75 Years and over | 51 (58.0%) | 77 (50.0%) |
Disability Class: Vision Difficulty
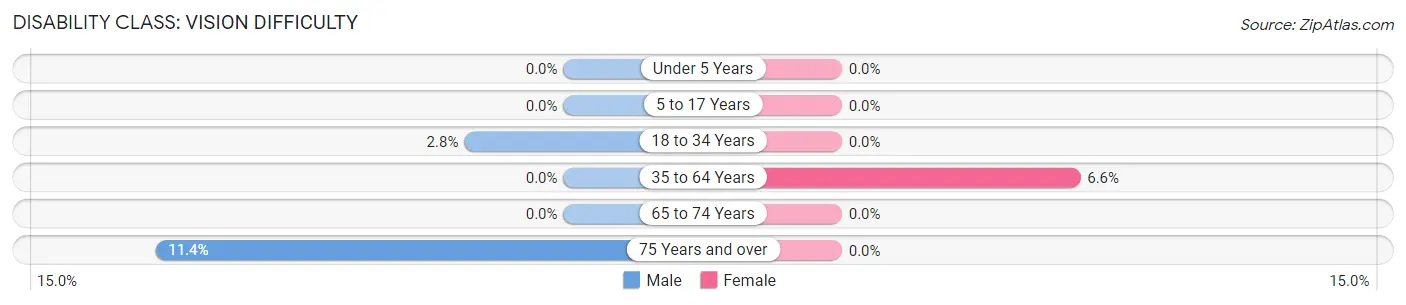
| Age Bracket | Male | Female |
| Under 5 Years | 0 (0.0%) | 0 (0.0%) |
| 5 to 17 Years | 0 (0.0%) | 0 (0.0%) |
| 18 to 34 Years | 7 (2.8%) | 0 (0.0%) |
| 35 to 64 Years | 0 (0.0%) | 35 (6.6%) |
| 65 to 74 Years | 0 (0.0%) | 0 (0.0%) |
| 75 Years and over | 10 (11.4%) | 0 (0.0%) |
Disability Class: Cognitive Difficulty

| Age Bracket | Male | Female |
| 5 to 17 Years | 0 (0.0%) | 0 (0.0%) |
| 18 to 34 Years | 17 (6.7%) | 0 (0.0%) |
| 35 to 64 Years | 25 (8.1%) | 64 (12.1%) |
| 65 to 74 Years | 0 (0.0%) | 0 (0.0%) |
| 75 Years and over | 24 (27.3%) | 0 (0.0%) |
Disability Class: Ambulatory Difficulty
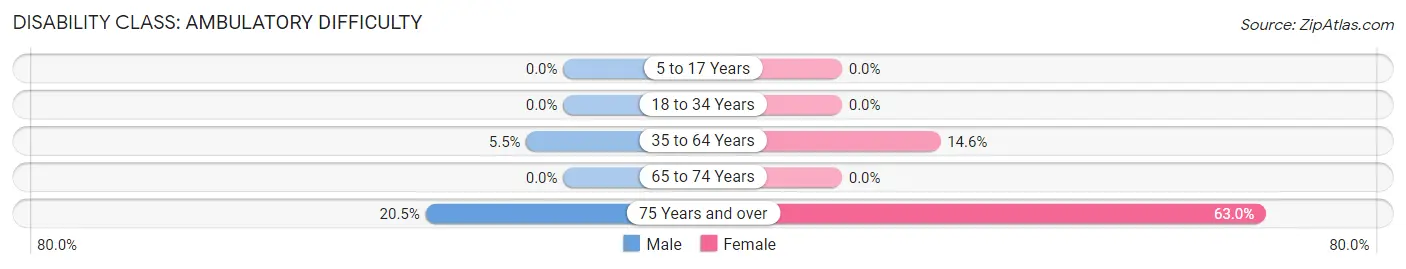
| Age Bracket | Male | Female |
| 5 to 17 Years | 0 (0.0%) | 0 (0.0%) |
| 18 to 34 Years | 0 (0.0%) | 0 (0.0%) |
| 35 to 64 Years | 17 (5.5%) | 77 (14.6%) |
| 65 to 74 Years | 0 (0.0%) | 0 (0.0%) |
| 75 Years and over | 18 (20.4%) | 97 (63.0%) |
Disability Class: Self-Care Difficulty
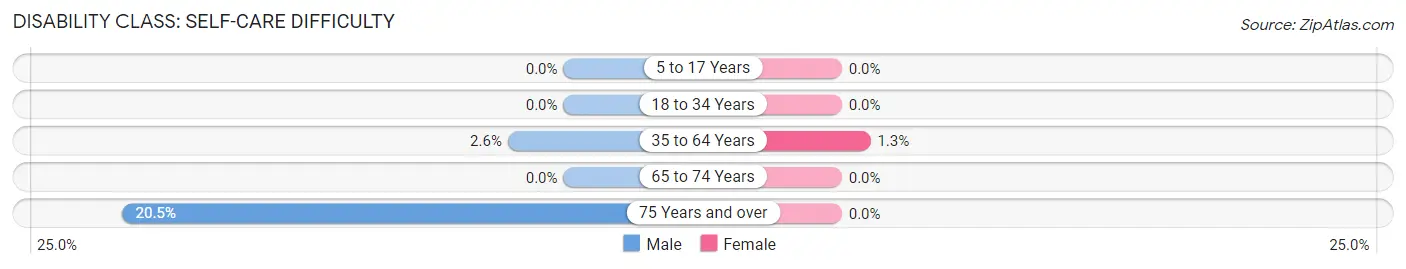
| Age Bracket | Male | Female |
| 5 to 17 Years | 0 (0.0%) | 0 (0.0%) |
| 18 to 34 Years | 0 (0.0%) | 0 (0.0%) |
| 35 to 64 Years | 8 (2.6%) | 7 (1.3%) |
| 65 to 74 Years | 0 (0.0%) | 0 (0.0%) |
| 75 Years and over | 18 (20.4%) | 0 (0.0%) |
Technology Access in East Uniontown
Computing Device Access in East Uniontown
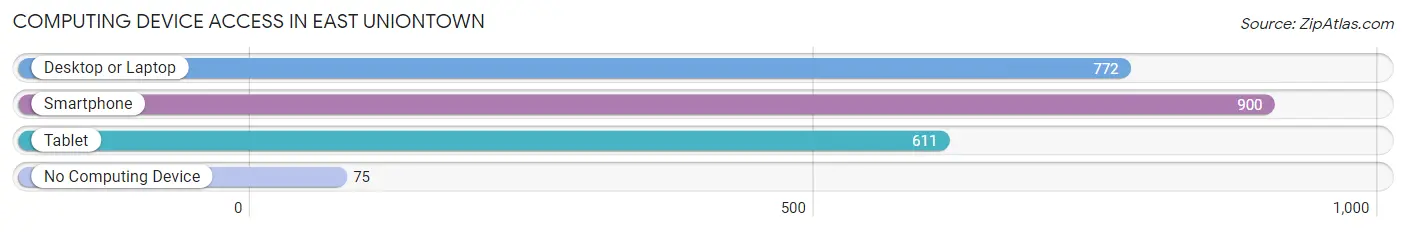
| Device Type | # Households | % Households |
| Desktop or Laptop | 772 | 73.3% |
| Smartphone | 900 | 85.5% |
| Tablet | 611 | 58.0% |
| No Computing Device | 75 | 7.1% |
| Total | 1,053 | 100.0% |
Internet Access in East Uniontown
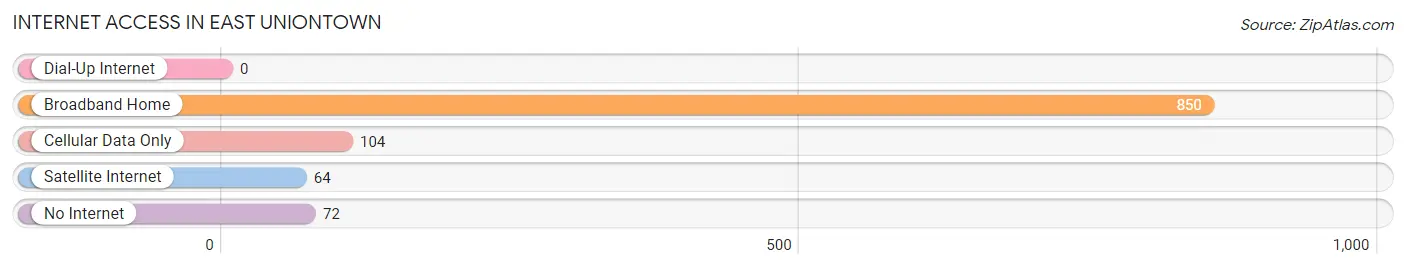
| Internet Type | # Households | % Households |
| Dial-Up Internet | 0 | 0.0% |
| Broadband Home | 850 | 80.7% |
| Cellular Data Only | 104 | 9.9% |
| Satellite Internet | 64 | 6.1% |
| No Internet | 72 | 6.8% |
| Total | 1,053 | 100.0% |
East Uniontown Summary
Uniontown, Pennsylvania is a city located in Fayette County, Pennsylvania. It is the county seat of Fayette County and is located in the southwestern part of the state. The city is situated in the Laurel Highlands region of the Allegheny Mountains and is part of the Pittsburgh metropolitan area. The population of Uniontown was 10,372 at the 2010 census.
History
Uniontown was founded in 1776 by William Burdsall, a settler from Maryland. The town was originally known as Burdsall's Town, but was later renamed Uniontown in 1813. The name was chosen to reflect the town's location at the junction of two major roads, the National Road and the Pittsburgh-Cumberland Road.
Uniontown was an important stop on the Underground Railroad, and was the site of the first African-American church in the county. The town was also the site of the Battle of Uniontown during the American Civil War.
Geography
Uniontown is located at 39°54′N 79°43′W (39.9000, -79.7167). According to the United States Census Bureau, the city has a total area of 2.2 square miles (5.7 km2), all of it land.
Economy
Uniontown is the home of several major employers, including the Uniontown Hospital, the Uniontown Mall, and the Uniontown Area School District. The city is also home to several small businesses, including restaurants, retail stores, and professional services.
Demographics
As of the 2010 census, there were 10,372 people, 4,541 households, and 2,717 families residing in the city. The population density was 4,717.2 people per square mile (1,822.2/km2). There were 5,068 housing units at an average density of 2,310.2 per square mile (892.2/km2). The racial makeup of the city was 87.2% White, 10.2% African American, 0.2% Native American, 0.4% Asian, 0.1% Pacific Islander, 0.7% from other races, and 1.2% from two or more races. Hispanic or Latino of any race were 1.7% of the population.
There were 4,541 households, out of which 25.3% had children under the age of 18 living with them, 38.2% were married couples living together, 17.7% had a female householder with no husband present, and 38.7% were non-families. 33.2% of all households were made up of individuals, and 15.2% had someone living alone who was 65 years of age or older. The average household size was 2.27 and the average family size was 2.88.
In the city, the population was spread out, with 22.2% under the age of 18, 8.2% from 18 to 24, 26.2% from 25 to 44, 24.2% from 45 to 64, and 19.2% who were 65 years of age or older. The median age was 40 years. For every 100 females, there were 87.2 males. For every 100 females age 18 and over, there were 82.2 males.
The median income for a household in the city was $26,945, and the median income for a family was $34,945. Males had a median income of $30,945 versus $21,945 for females. The per capita income for the city was $15,945. About 16.2% of families and 19.2% of the population were below the poverty line, including 28.2% of those under age 18 and 11.2% of those age 65 or over.
Common Questions
What is the Total Population of East Uniontown?
Total Population of East Uniontown is 2,243.
What is the Total Male Population of East Uniontown?
Total Male Population of East Uniontown is 887.
What is the Total Female Population of East Uniontown?
Total Female Population of East Uniontown is 1,356.
What is the Ratio of Males per 100 Females in East Uniontown?
There are 65.41 Males per 100 Females in East Uniontown.
What is the Ratio of Females per 100 Males in East Uniontown?
There are 152.87 Females per 100 Males in East Uniontown.
What is the Median Population Age in East Uniontown?
Median Population Age in East Uniontown is 38.0 Years.
What is the Average Family Size in East Uniontown
Average Family Size in East Uniontown is 2.7 People.
What is the Average Household Size in East Uniontown
Average Household Size in East Uniontown is 2.0 People.
What is Per Capita Income in East Uniontown?
Per Capita income in East Uniontown is $24,265.
What is the Median Family Income in East Uniontown?
Median Family Income in East Uniontown is $39,732.
What is the Median Household income in East Uniontown?
Median Household Income in East Uniontown is $44,320.
What is Income or Wage Gap in East Uniontown?
Income or Wage Gap in East Uniontown is 24.4%.
Women in East Uniontown earn 75.6 cents for every dollar earned by a man.
What is Inequality or Gini Index in East Uniontown?
Inequality or Gini Index in East Uniontown is 0.38.
How Large is the Labor Force in East Uniontown?
There are 968 People in the Labor Forcein in East Uniontown.
What is the Percentage of People in the Labor Force in East Uniontown?
52.5% of People are in the Labor Force in East Uniontown.
What is the Unemployment Rate in East Uniontown?
Unemployment Rate in East Uniontown is 9.4%.