Coudersport borough, PA
Coudersport borough Overview
2,384
TOTAL POPULATION
1,057
MALE POPULATION
1,327
FEMALE POPULATION
79.65
MALES / 100 FEMALES
125.54
FEMALES / 100 MALES
47.4
MEDIAN AGE
3.0
AVG FAMILY SIZE
2.2
AVG HOUSEHOLD SIZE
$28,819
PER CAPITA INCOME
$72,266
AVG FAMILY INCOME
$44,881
AVG HOUSEHOLD INCOME
36.9%
WAGE / INCOME GAP [ % ]
63.1¢/ $1
WAGE / INCOME GAP [ $ ]
0.41
INEQUALITY / GINI INDEX
1,045
LABOR FORCE [ PEOPLE ]
51.3%
PERCENT IN LABOR FORCE
1.1%
UNEMPLOYMENT RATE
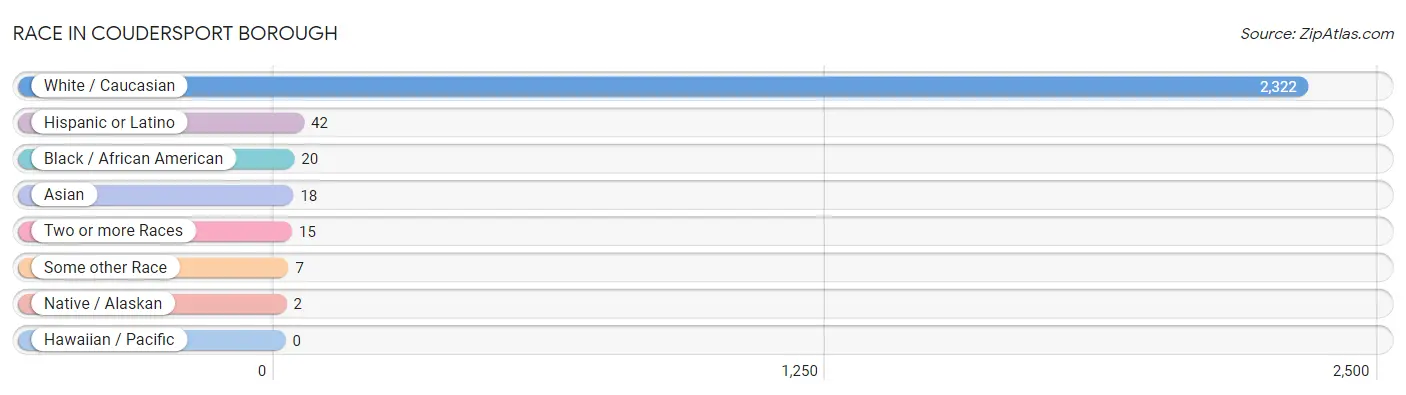
Race in Coudersport borough
The most populous races in Coudersport borough are White / Caucasian (2,322 | 97.4%), Hispanic or Latino (42 | 1.8%), and Black / African American (20 | 0.8%).
| Race | # Population | % Population |
| Asian | 18 | 0.8% |
| Black / African American | 20 | 0.8% |
| Hawaiian / Pacific | 0 | 0.0% |
| Hispanic or Latino | 42 | 1.8% |
| Native / Alaskan | 2 | 0.1% |
| White / Caucasian | 2,322 | 97.4% |
| Two or more Races | 15 | 0.6% |
| Some other Race | 7 | 0.3% |
| Total | 2,384 | 100.0% |
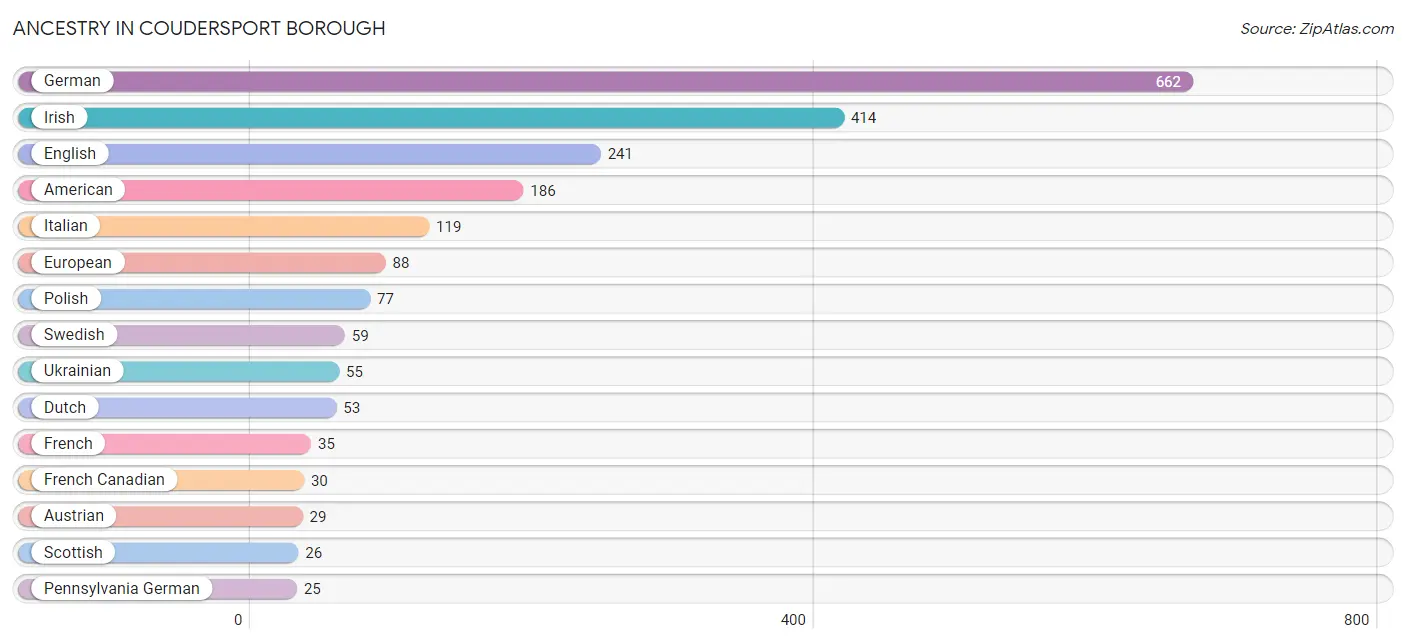
Ancestry in Coudersport borough
The most populous ancestries reported in Coudersport borough are German (662 | 27.8%), Irish (414 | 17.4%), English (241 | 10.1%), American (186 | 7.8%), and Italian (119 | 5.0%), together accounting for 68.0% of all Coudersport borough residents.
| Ancestry | # Population | % Population |
| American | 186 | 7.8% |
| Arab | 12 | 0.5% |
| Austrian | 29 | 1.2% |
| British | 14 | 0.6% |
| Cherokee | 7 | 0.3% |
| Czech | 5 | 0.2% |
| Danish | 13 | 0.5% |
| Dutch | 53 | 2.2% |
| English | 241 | 10.1% |
| European | 88 | 3.7% |
| French | 35 | 1.5% |
| French Canadian | 30 | 1.3% |
| German | 662 | 27.8% |
| Hungarian | 23 | 1.0% |
| Indian (Asian) | 18 | 0.8% |
| Irish | 414 | 17.4% |
| Italian | 119 | 5.0% |
| Lebanese | 12 | 0.5% |
| Mexican | 12 | 0.5% |
| Norwegian | 4 | 0.2% |
| Pennsylvania German | 25 | 1.1% |
| Polish | 77 | 3.2% |
| Puerto Rican | 19 | 0.8% |
| Russian | 7 | 0.3% |
| Scandinavian | 7 | 0.3% |
| Scotch-Irish | 5 | 0.2% |
| Scottish | 26 | 1.1% |
| Slovak | 20 | 0.8% |
| Slovene | 4 | 0.2% |
| Swedish | 59 | 2.5% |
| Ukrainian | 55 | 2.3% | View All 31 Rows |
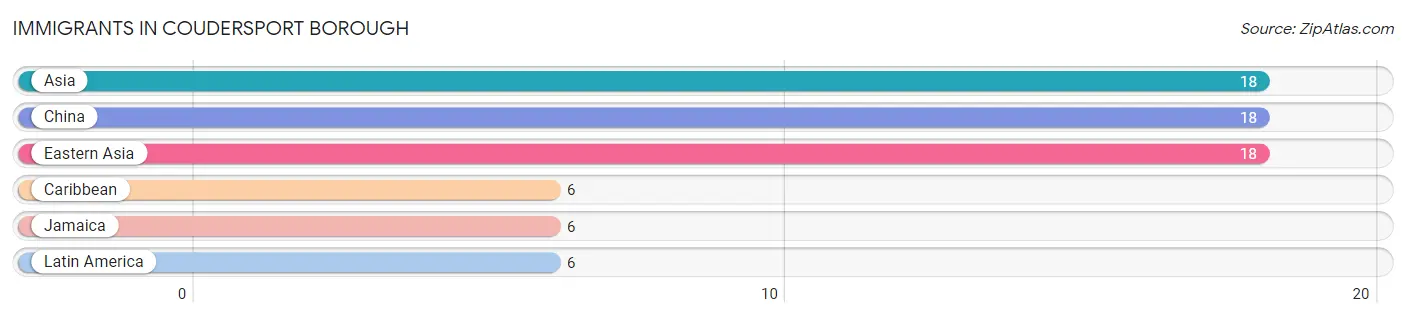
Immigrants in Coudersport borough
The most numerous immigrant groups reported in Coudersport borough came from Asia (18 | 0.8%), China (18 | 0.8%), Eastern Asia (18 | 0.8%), Caribbean (6 | 0.3%), and Jamaica (6 | 0.3%), together accounting for 2.8% of all Coudersport borough residents.
| Immigration Origin | # Population | % Population |
| Asia | 18 | 0.8% |
| Caribbean | 6 | 0.3% |
| China | 18 | 0.8% |
| Eastern Asia | 18 | 0.8% |
| Jamaica | 6 | 0.3% |
| Latin America | 6 | 0.3% | View All 6 Rows |
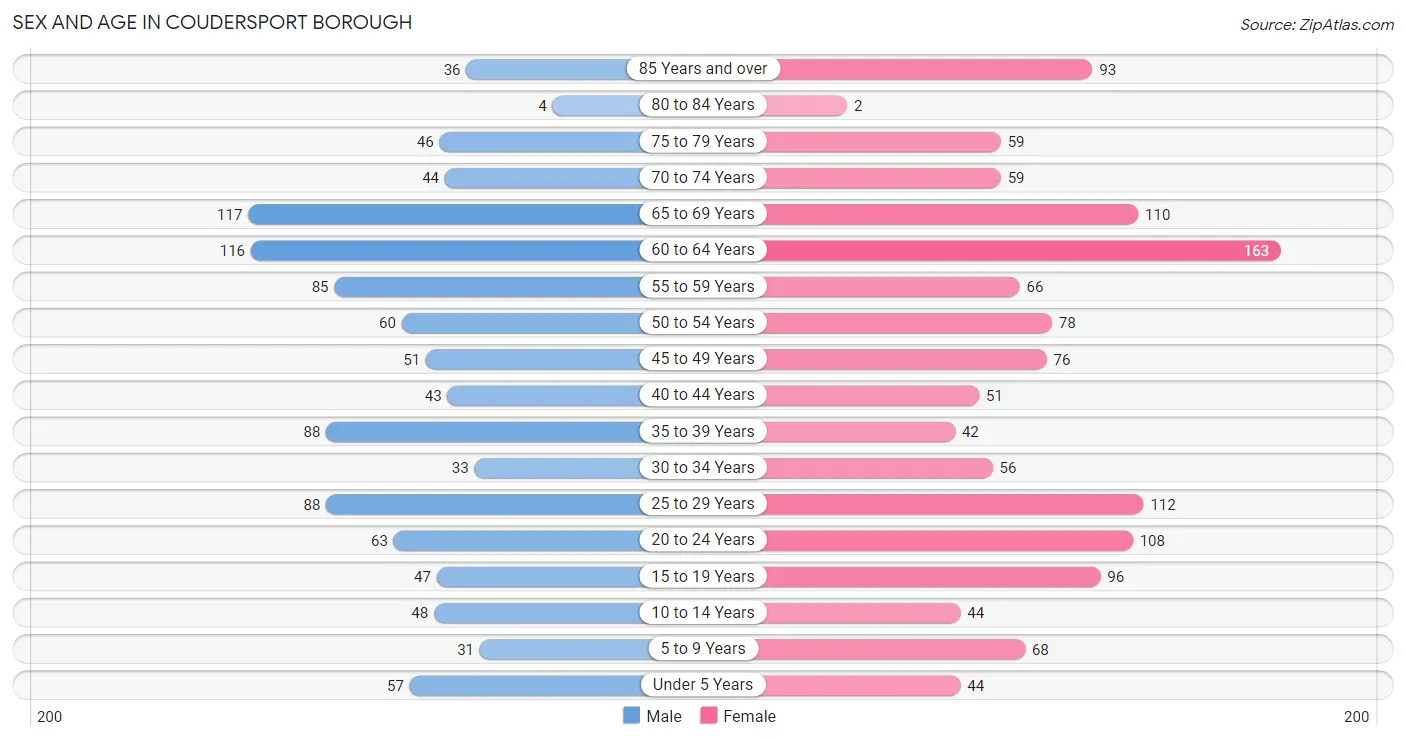
Sex and Age in Coudersport borough
Sex and Age in Coudersport borough
The most populous age groups in Coudersport borough are 65 to 69 Years (117 | 11.1%) for men and 60 to 64 Years (163 | 12.3%) for women.
| Age Bracket | Male | Female |
| Under 5 Years | 57 (5.4%) | 44 (3.3%) |
| 5 to 9 Years | 31 (2.9%) | 68 (5.1%) |
| 10 to 14 Years | 48 (4.5%) | 44 (3.3%) |
| 15 to 19 Years | 47 (4.4%) | 96 (7.2%) |
| 20 to 24 Years | 63 (6.0%) | 108 (8.1%) |
| 25 to 29 Years | 88 (8.3%) | 112 (8.4%) |
| 30 to 34 Years | 33 (3.1%) | 56 (4.2%) |
| 35 to 39 Years | 88 (8.3%) | 42 (3.2%) |
| 40 to 44 Years | 43 (4.1%) | 51 (3.8%) |
| 45 to 49 Years | 51 (4.8%) | 76 (5.7%) |
| 50 to 54 Years | 60 (5.7%) | 78 (5.9%) |
| 55 to 59 Years | 85 (8.0%) | 66 (5.0%) |
| 60 to 64 Years | 116 (11.0%) | 163 (12.3%) |
| 65 to 69 Years | 117 (11.1%) | 110 (8.3%) |
| 70 to 74 Years | 44 (4.2%) | 59 (4.4%) |
| 75 to 79 Years | 46 (4.3%) | 59 (4.4%) |
| 80 to 84 Years | 4 (0.4%) | 2 (0.2%) |
| 85 Years and over | 36 (3.4%) | 93 (7.0%) |
| Total | 1,057 (100.0%) | 1,327 (100.0%) |
Families and Households in Coudersport borough
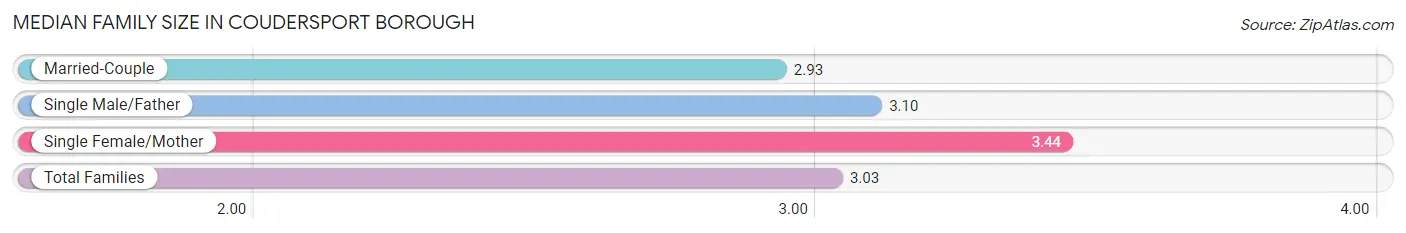
Median Family Size in Coudersport borough
The median family size in Coudersport borough is 3.03 persons per family, with single female/mother families (91 | 17.1%) accounting for the largest median family size of 3.44 persons per family. On the other hand, married-couple families (413 | 77.5%) represent the smallest median family size with 2.93 persons per family.
| Family Type | # Families | Family Size |
| Married-Couple | 413 (77.5%) | 2.93 |
| Single Male/Father | 29 (5.4%) | 3.10 |
| Single Female/Mother | 91 (17.1%) | 3.44 |
| Total Families | 533 (100.0%) | 3.03 |
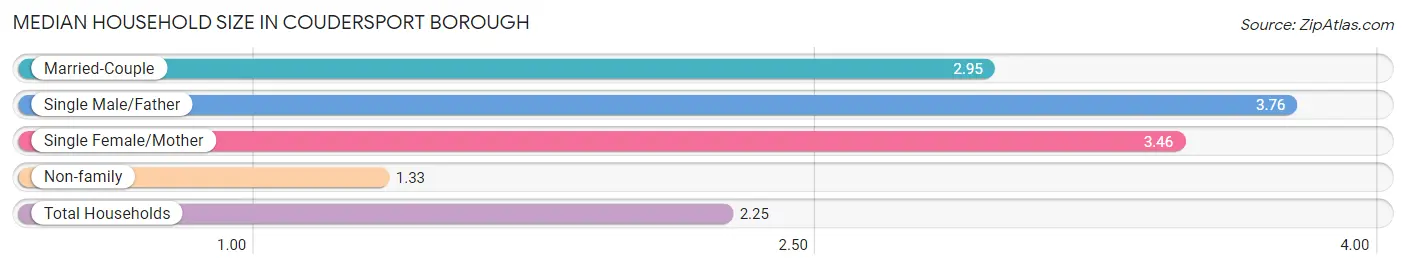
Median Household Size in Coudersport borough
The median household size in Coudersport borough is 2.25 persons per household, with single male/father households (29 | 2.9%) accounting for the largest median household size of 3.76 persons per household. non-family households (485 | 47.6%) represent the smallest median household size with 1.33 persons per household.
| Household Type | # Households | Household Size |
| Married-Couple | 413 (40.6%) | 2.95 |
| Single Male/Father | 29 (2.9%) | 3.76 |
| Single Female/Mother | 91 (8.9%) | 3.46 |
| Non-family | 485 (47.6%) | 1.33 |
| Total Households | 1,018 (100.0%) | 2.25 |
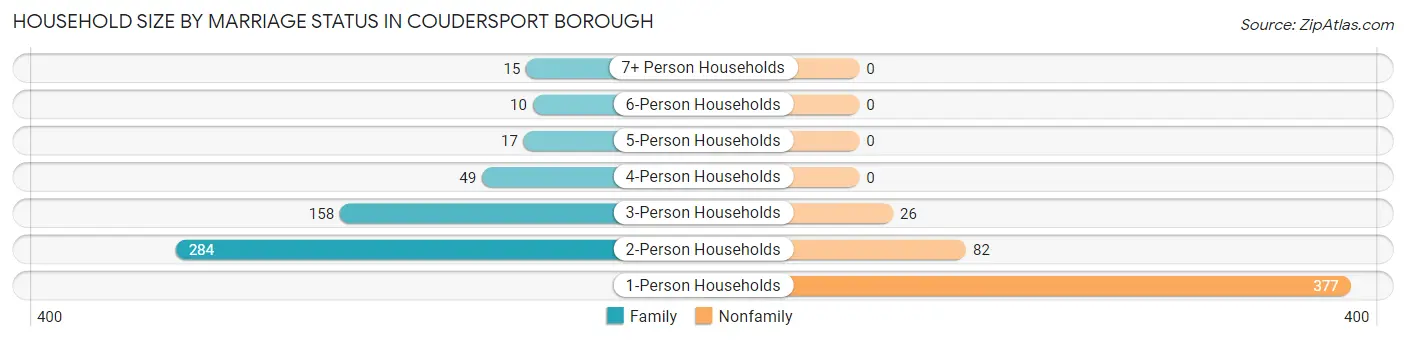
Household Size by Marriage Status in Coudersport borough
Out of a total of 1,018 households in Coudersport borough, 533 (52.4%) are family households, while 485 (47.6%) are nonfamily households. The most numerous type of family households are 2-person households, comprising 284, and the most common type of nonfamily households are 1-person households, comprising 377.
| Household Size | Family Households | Nonfamily Households |
| 1-Person Households | - | 377 (37.0%) |
| 2-Person Households | 284 (27.9%) | 82 (8.1%) |
| 3-Person Households | 158 (15.5%) | 26 (2.5%) |
| 4-Person Households | 49 (4.8%) | 0 (0.0%) |
| 5-Person Households | 17 (1.7%) | 0 (0.0%) |
| 6-Person Households | 10 (1.0%) | 0 (0.0%) |
| 7+ Person Households | 15 (1.5%) | 0 (0.0%) |
| Total | 533 (52.4%) | 485 (47.6%) |
Female Fertility in Coudersport borough
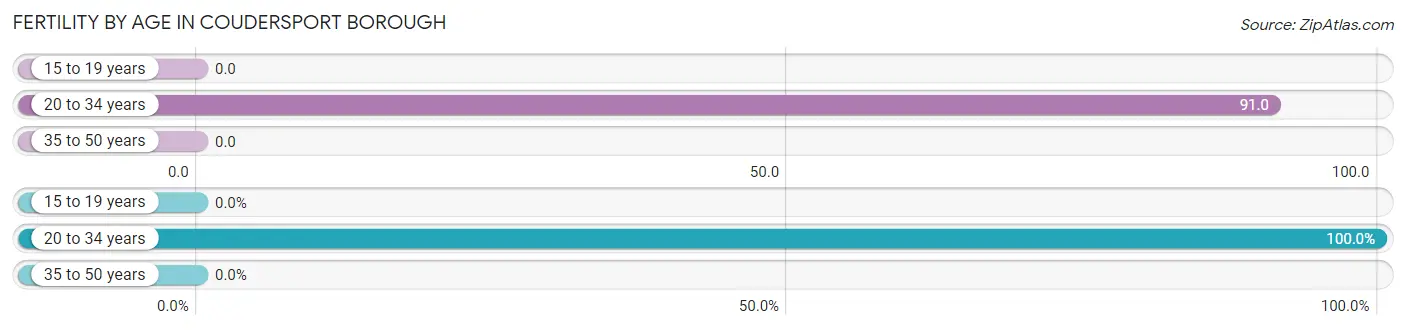
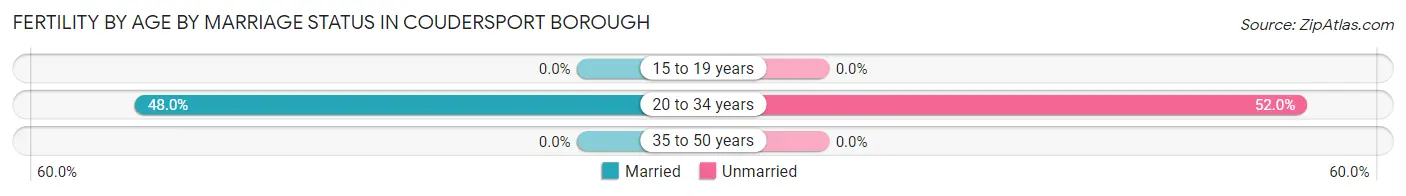
Fertility by Age in Coudersport borough
Average fertility rate in Coudersport borough is 44.0 births per 1,000 women. Women in the age bracket of 20 to 34 years have the highest fertility rate with 91.0 births per 1,000 women. Women in the age bracket of 20 to 34 years acount for 100.0% of all women with births.
| Age Bracket | Women with Births | Births / 1,000 Women |
| 15 to 19 years | 0 (0.0%) | 0.0 |
| 20 to 34 years | 25 (100.0%) | 91.0 |
| 35 to 50 years | 0 (0.0%) | 0.0 |
| Total | 25 (100.0%) | 44.0 |
Fertility by Age by Marriage Status in Coudersport borough
48.0% of women with births (25) in Coudersport borough are married. The highest percentage of unmarried women with births falls into 20 to 34 years age bracket with 52.0% of them unmarried at the time of birth, while the lowest percentage of unmarried women with births belong to 20 to 34 years age bracket with 52.0% of them unmarried.
| Age Bracket | Married | Unmarried |
| 15 to 19 years | 0 (0.0%) | 0 (0.0%) |
| 20 to 34 years | 12 (48.0%) | 13 (52.0%) |
| 35 to 50 years | 0 (0.0%) | 0 (0.0%) |
| Total | 12 (48.0%) | 13 (52.0%) |
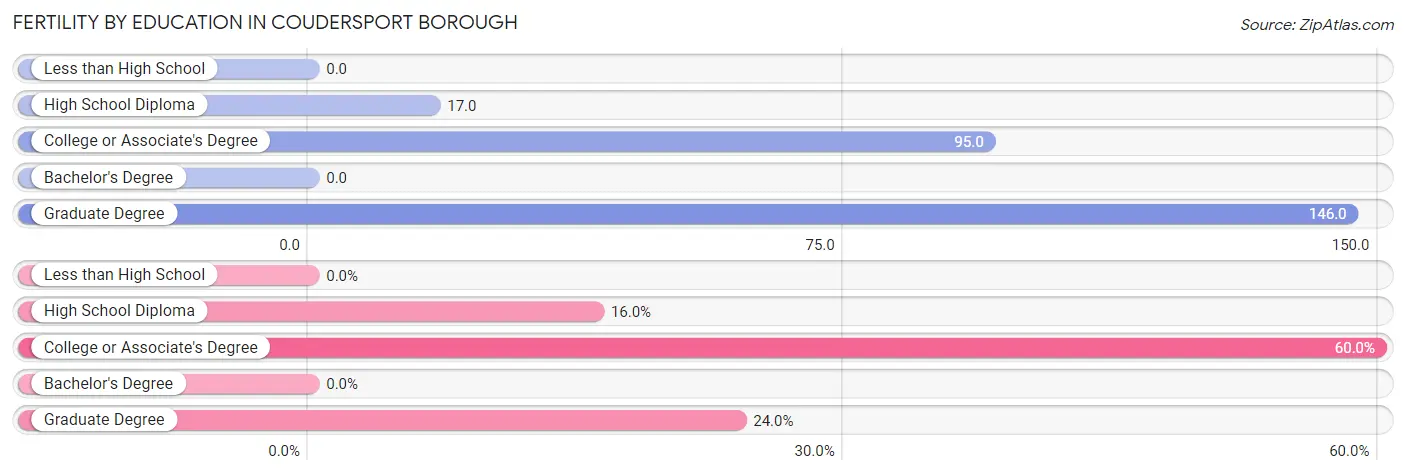
Fertility by Education in Coudersport borough
| Educational Attainment | Women with Births | Births / 1,000 Women |
| Less than High School | 0 (0.0%) | 0.0 |
| High School Diploma | 4 (16.0%) | 17.0 |
| College or Associate's Degree | 15 (60.0%) | 95.0 |
| Bachelor's Degree | 0 (0.0%) | 0.0 |
| Graduate Degree | 6 (24.0%) | 146.0 |
| Total | 25 (100.0%) | 44.0 |
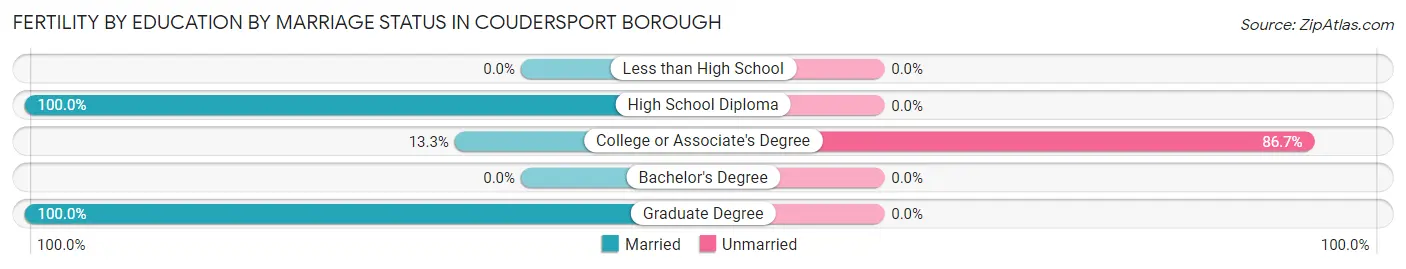
Fertility by Education by Marriage Status in Coudersport borough
52.0% of women with births in Coudersport borough are unmarried. Women with the educational attainment of high school diploma are most likely to be married with 100.0% of them married at childbirth, while women with the educational attainment of college or associate's degree are least likely to be married with 86.7% of them unmarried at childbirth.
| Educational Attainment | Married | Unmarried |
| Less than High School | 0 (0.0%) | 0 (0.0%) |
| High School Diploma | 4 (100.0%) | 0 (0.0%) |
| College or Associate's Degree | 2 (13.3%) | 13 (86.7%) |
| Bachelor's Degree | 0 (0.0%) | 0 (0.0%) |
| Graduate Degree | 6 (100.0%) | 0 (0.0%) |
| Total | 12 (48.0%) | 13 (52.0%) |
Income in Coudersport borough
Income Overview in Coudersport borough
Per Capita Income in Coudersport borough is $28,819, while median incomes of families and households are $72,266 and $44,881 respectively.
| Characteristic | Number | Measure |
| Per Capita Income | 2,384 | $28,819 |
| Median Family Income | 533 | $72,266 |
| Mean Family Income | 533 | $85,907 |
| Median Household Income | 1,018 | $44,881 |
| Mean Household Income | 1,018 | $62,915 |
| Income Deficit | 533 | $0 |
| Wage / Income Gap (%) | 2,384 | 36.87% |
| Wage / Income Gap ($) | 2,384 | 63.13¢ per $1 |
| Gini / Inequality Index | 2,384 | 0.41 |
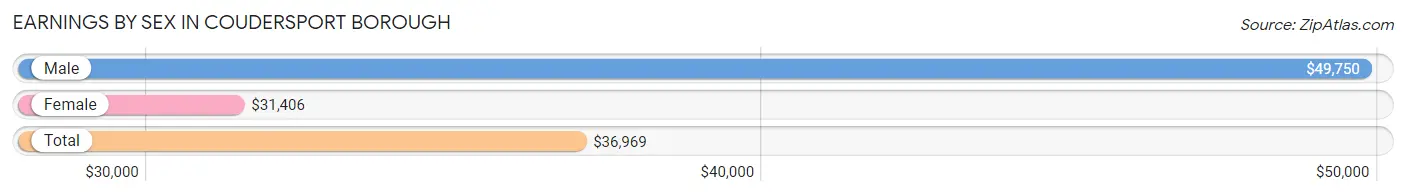
Earnings by Sex in Coudersport borough
Average Earnings in Coudersport borough are $36,969, $49,750 for men and $31,406 for women, a difference of 36.9%.
| Sex | Number | Average Earnings |
| Male | 447 (38.9%) | $49,750 |
| Female | 702 (61.1%) | $31,406 |
| Total | 1,149 (100.0%) | $36,969 |
Earnings by Sex by Income Bracket in Coudersport borough
The most common earnings brackets in Coudersport borough are $55,000 to $64,999 for men (124 | 27.7%) and $2,499 or less for women (128 | 18.2%).
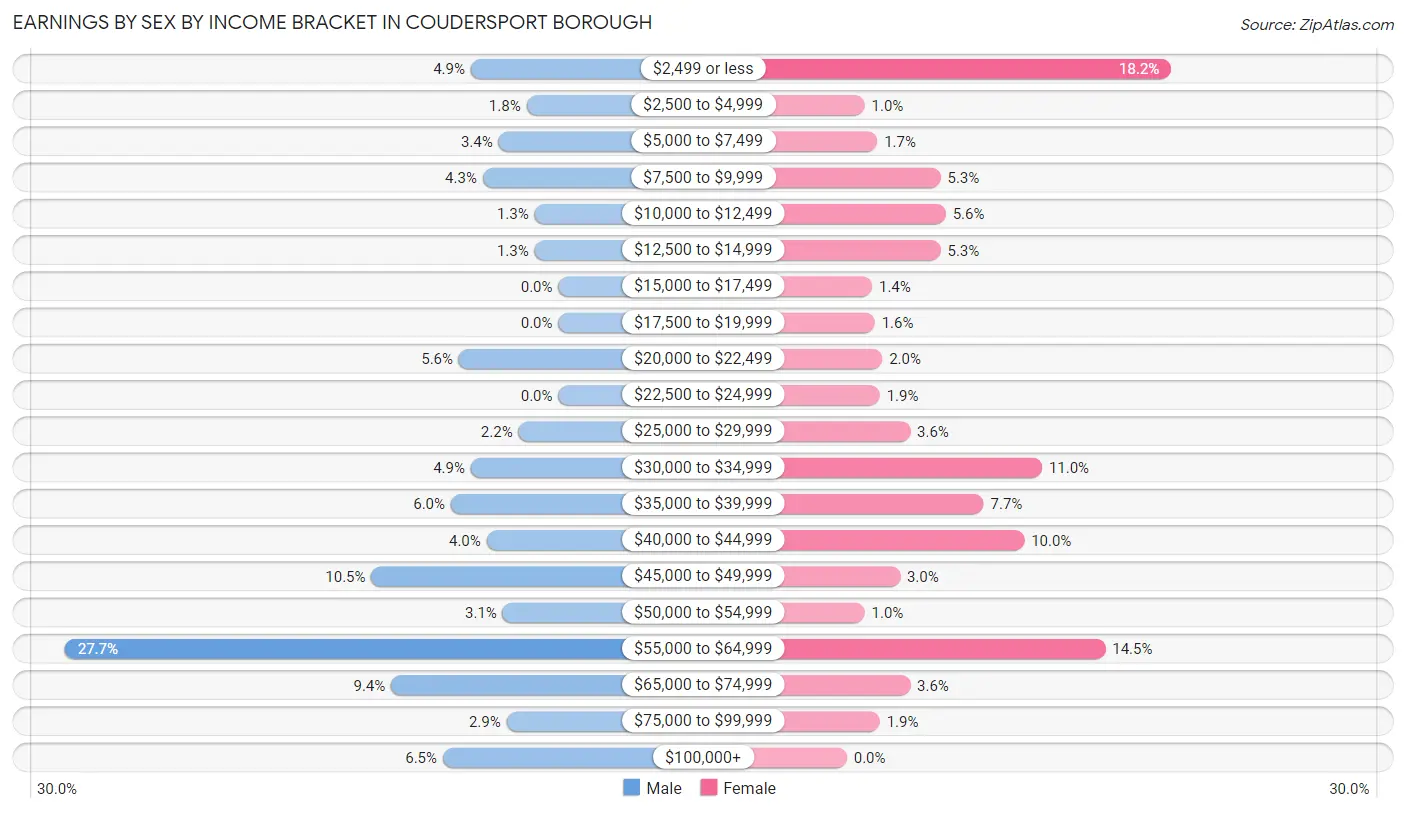
| Income | Male | Female |
| $2,499 or less | 22 (4.9%) | 128 (18.2%) |
| $2,500 to $4,999 | 8 (1.8%) | 7 (1.0%) |
| $5,000 to $7,499 | 15 (3.4%) | 12 (1.7%) |
| $7,500 to $9,999 | 19 (4.3%) | 37 (5.3%) |
| $10,000 to $12,499 | 6 (1.3%) | 39 (5.6%) |
| $12,500 to $14,999 | 6 (1.3%) | 37 (5.3%) |
| $15,000 to $17,499 | 0 (0.0%) | 10 (1.4%) |
| $17,500 to $19,999 | 0 (0.0%) | 11 (1.6%) |
| $20,000 to $22,499 | 25 (5.6%) | 14 (2.0%) |
| $22,500 to $24,999 | 0 (0.0%) | 13 (1.8%) |
| $25,000 to $29,999 | 10 (2.2%) | 25 (3.6%) |
| $30,000 to $34,999 | 22 (4.9%) | 77 (11.0%) |
| $35,000 to $39,999 | 27 (6.0%) | 54 (7.7%) |
| $40,000 to $44,999 | 18 (4.0%) | 70 (10.0%) |
| $45,000 to $49,999 | 47 (10.5%) | 21 (3.0%) |
| $50,000 to $54,999 | 14 (3.1%) | 7 (1.0%) |
| $55,000 to $64,999 | 124 (27.7%) | 102 (14.5%) |
| $65,000 to $74,999 | 42 (9.4%) | 25 (3.6%) |
| $75,000 to $99,999 | 13 (2.9%) | 13 (1.8%) |
| $100,000+ | 29 (6.5%) | 0 (0.0%) |
| Total | 447 (100.0%) | 702 (100.0%) |
Earnings by Sex by Educational Attainment in Coudersport borough
Average earnings in Coudersport borough are $47,422 for men and $34,167 for women, a difference of 28.0%. Men with an educational attainment of bachelor's degree enjoy the highest average annual earnings of $69,145, while those with high school diploma education earn the least with $39,276. Women with an educational attainment of graduate degree earn the most with the average annual earnings of $63,125, while those with less than high school education have the smallest earnings of $2,499.
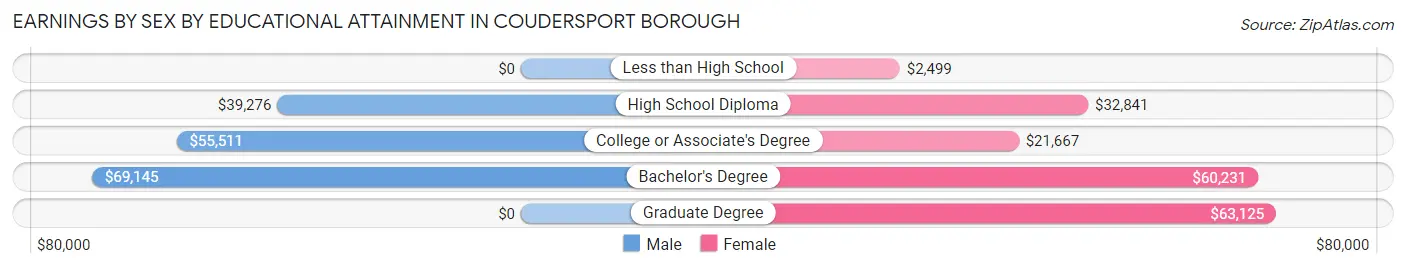
| Educational Attainment | Male Income | Female Income |
| Less than High School | - | - |
| High School Diploma | $39,276 | $32,841 |
| College or Associate's Degree | $55,511 | $21,667 |
| Bachelor's Degree | $69,145 | $60,231 |
| Graduate Degree | - | - |
| Total | $47,422 | $34,167 |
Family Income in Coudersport borough
Family Income Brackets in Coudersport borough
According to the Coudersport borough family income data, there are 127 families falling into the $100,000 to $149,999 income range, which is the most common income bracket and makes up 23.8% of all families. Conversely, the $10,000 to $14,999 income bracket is the least frequent group with only 5 families (0.9%) belonging to this category.
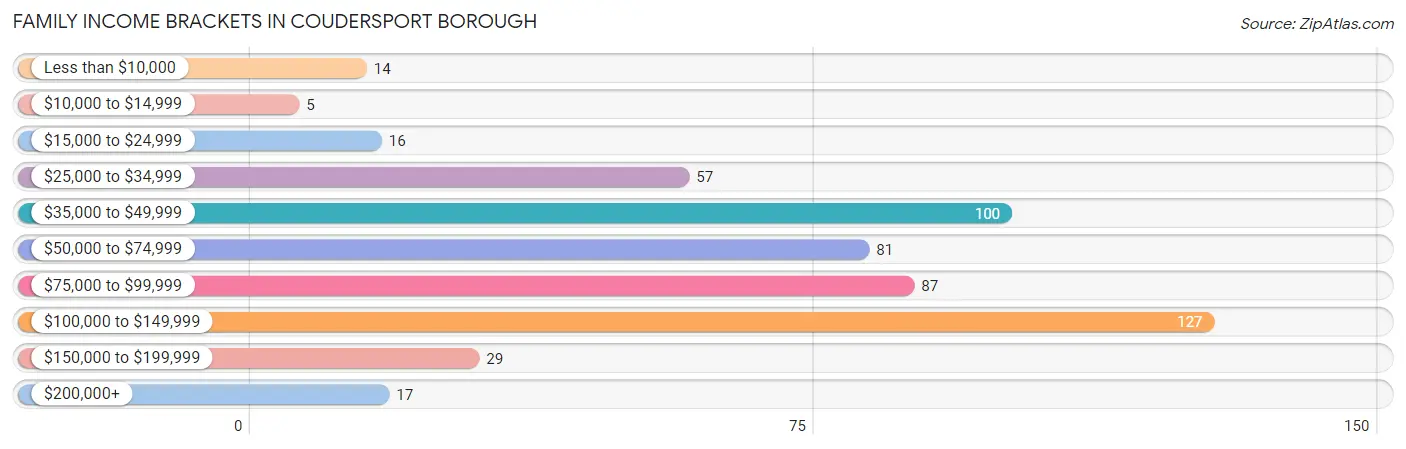
| Income Bracket | # Families | % Families |
| Less than $10,000 | 14 | 2.6% |
| $10,000 to $14,999 | 5 | 0.9% |
| $15,000 to $24,999 | 16 | 3.0% |
| $25,000 to $34,999 | 57 | 10.7% |
| $35,000 to $49,999 | 100 | 18.8% |
| $50,000 to $74,999 | 81 | 15.2% |
| $75,000 to $99,999 | 87 | 16.3% |
| $100,000 to $149,999 | 127 | 23.8% |
| $150,000 to $199,999 | 29 | 5.4% |
| $200,000+ | 17 | 3.2% |
Family Income by Famaliy Size in Coudersport borough
3-person families (165 | 31.0%) account for the highest median family income in Coudersport borough with $95,179 per family, while 2-person families (291 | 54.6%) have the highest median income of $35,352 per family member.
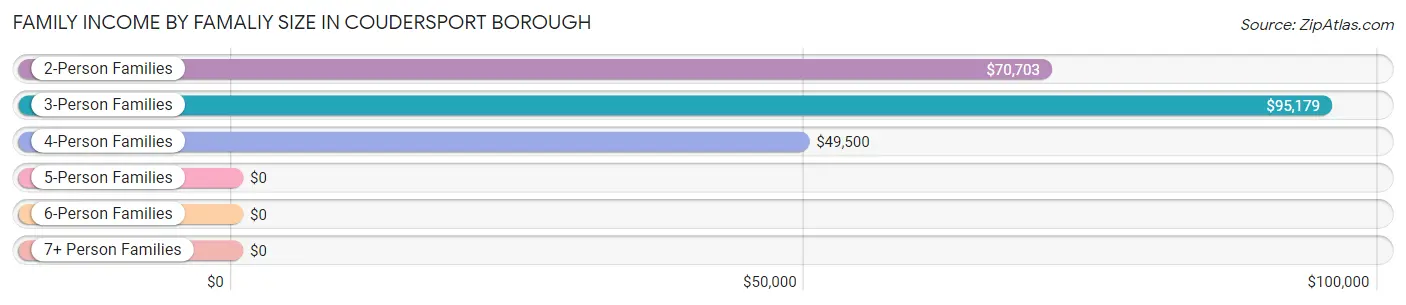
| Income Bracket | # Families | Median Income |
| 2-Person Families | 291 (54.6%) | $70,703 |
| 3-Person Families | 165 (31.0%) | $95,179 |
| 4-Person Families | 40 (7.5%) | $49,500 |
| 5-Person Families | 12 (2.2%) | $0 |
| 6-Person Families | 10 (1.9%) | $0 |
| 7+ Person Families | 15 (2.8%) | $0 |
| Total | 533 (100.0%) | $72,266 |
Family Income by Number of Earners in Coudersport borough
The median family income in Coudersport borough is $72,266, with families comprising 3+ earners (57) having the highest median family income of $120,917, while families with 1 earner (190) have the lowest median family income of $44,643, accounting for 10.7% and 35.6% of families, respectively.
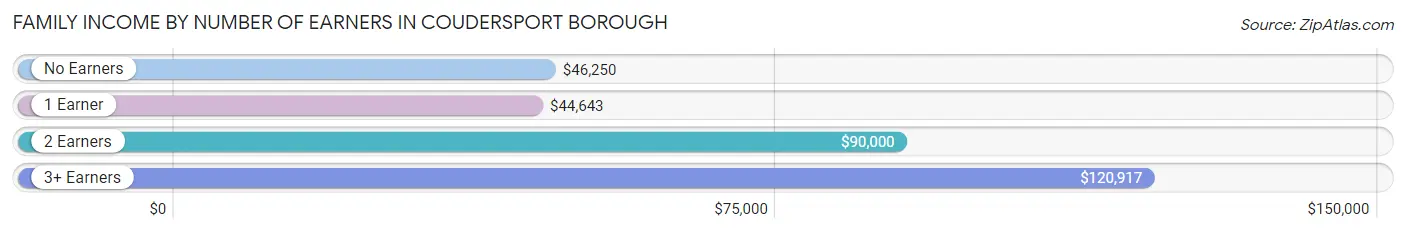
| Number of Earners | # Families | Median Income |
| No Earners | 92 (17.3%) | $46,250 |
| 1 Earner | 190 (35.6%) | $44,643 |
| 2 Earners | 194 (36.4%) | $90,000 |
| 3+ Earners | 57 (10.7%) | $120,917 |
| Total | 533 (100.0%) | $72,266 |
Household Income in Coudersport borough
Household Income Brackets in Coudersport borough
With 214 households falling in the category, the $35,000 to $49,999 income range is the most frequent in Coudersport borough, accounting for 21.0% of all households. In contrast, only 14 households (1.4%) fall into the less than $10,000 income bracket, making it the least populous group.
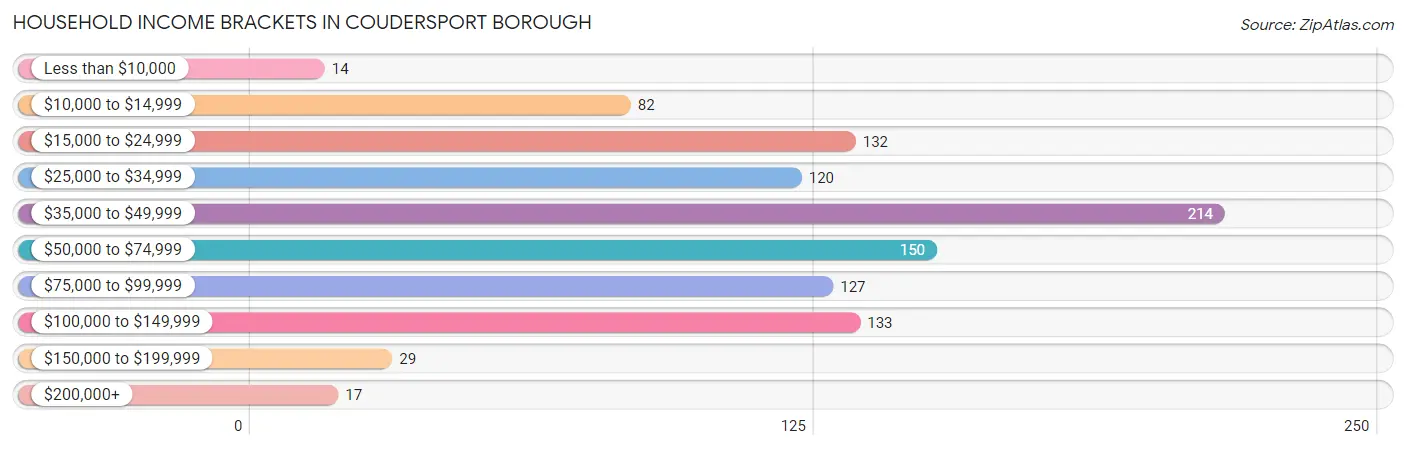
| Income Bracket | # Households | % Households |
| Less than $10,000 | 14 | 1.4% |
| $10,000 to $14,999 | 82 | 8.1% |
| $15,000 to $24,999 | 132 | 13.0% |
| $25,000 to $34,999 | 120 | 11.8% |
| $35,000 to $49,999 | 214 | 21.0% |
| $50,000 to $74,999 | 150 | 14.7% |
| $75,000 to $99,999 | 127 | 12.5% |
| $100,000 to $149,999 | 133 | 13.1% |
| $150,000 to $199,999 | 29 | 2.8% |
| $200,000+ | 17 | 1.7% |
Household Income by Householder Age in Coudersport borough
The median household income in Coudersport borough is $44,881, with the highest median household income of $56,875 found in the 25 to 44 years age bracket for the primary householder. A total of 189 households (18.6%) fall into this category. Meanwhile, the 65+ years age bracket for the primary householder has the lowest median household income of $33,548, with 350 households (34.4%) in this group.
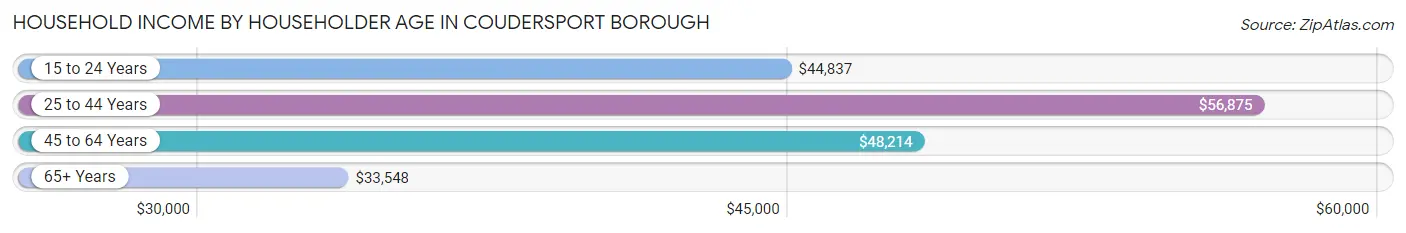
| Income Bracket | # Households | Median Income |
| 15 to 24 Years | 61 (6.0%) | $44,837 |
| 25 to 44 Years | 189 (18.6%) | $56,875 |
| 45 to 64 Years | 418 (41.1%) | $48,214 |
| 65+ Years | 350 (34.4%) | $33,548 |
| Total | 1,018 (100.0%) | $44,881 |
Poverty in Coudersport borough
Income Below Poverty by Sex and Age in Coudersport borough
With 11.2% poverty level for males and 15.5% for females among the residents of Coudersport borough, 15 year old males and 45 to 54 year old females are the most vulnerable to poverty, with 16 males (51.6%) and 60 females (39.0%) in their respective age groups living below the poverty level.
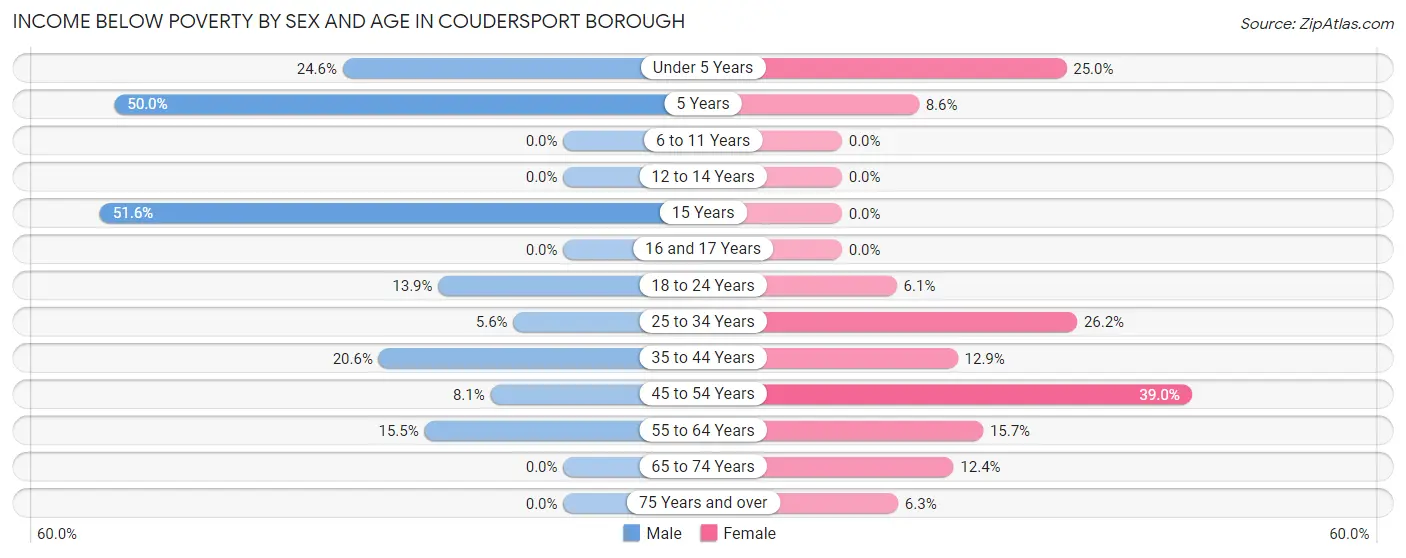
| Age Bracket | Male | Female |
| Under 5 Years | 14 (24.6%) | 11 (25.0%) |
| 5 Years | 4 (50.0%) | 3 (8.6%) |
| 6 to 11 Years | 0 (0.0%) | 0 (0.0%) |
| 12 to 14 Years | 0 (0.0%) | 0 (0.0%) |
| 15 Years | 16 (51.6%) | 0 (0.0%) |
| 16 and 17 Years | 0 (0.0%) | 0 (0.0%) |
| 18 to 24 Years | 11 (13.9%) | 8 (6.1%) |
| 25 to 34 Years | 6 (5.6%) | 44 (26.2%) |
| 35 to 44 Years | 22 (20.6%) | 12 (12.9%) |
| 45 to 54 Years | 9 (8.1%) | 60 (39.0%) |
| 55 to 64 Years | 30 (15.5%) | 36 (15.7%) |
| 65 to 74 Years | 0 (0.0%) | 21 (12.4%) |
| 75 Years and over | 0 (0.0%) | 9 (6.2%) |
| Total | 112 (11.2%) | 204 (15.5%) |
Income Above Poverty by Sex and Age in Coudersport borough
According to the poverty statistics in Coudersport borough, males aged 6 to 11 years and females aged 6 to 11 years are the age groups that are most secure financially, with 100.0% of males and 100.0% of females in these age groups living above the poverty line.
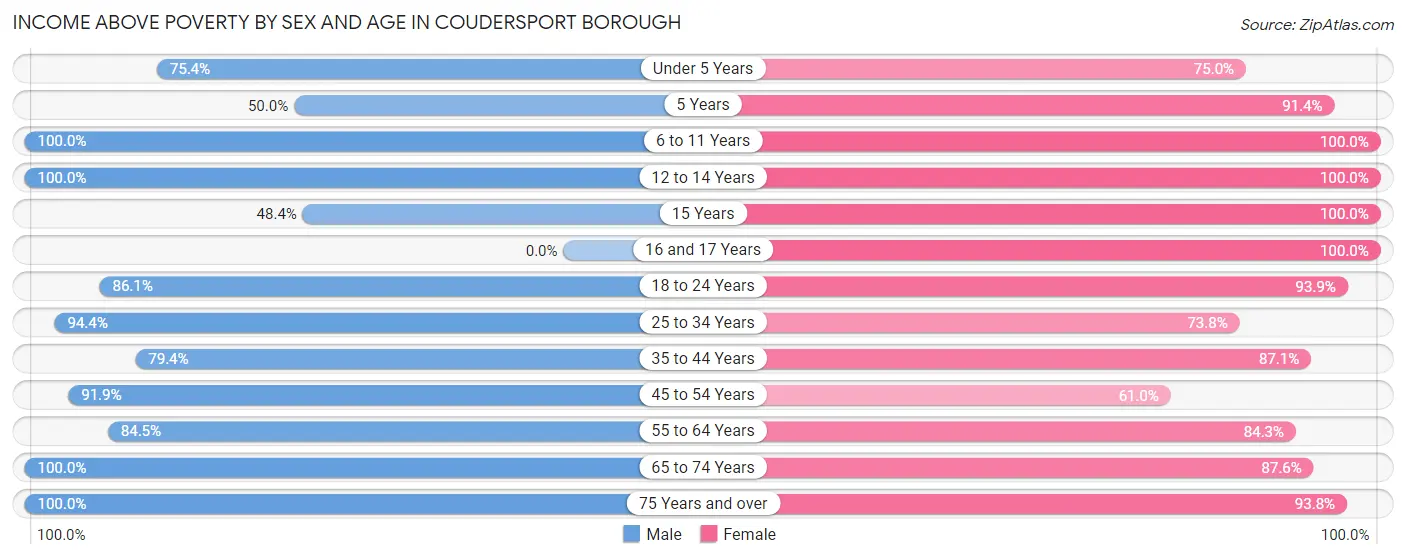
| Age Bracket | Male | Female |
| Under 5 Years | 43 (75.4%) | 33 (75.0%) |
| 5 Years | 4 (50.0%) | 32 (91.4%) |
| 6 to 11 Years | 46 (100.0%) | 62 (100.0%) |
| 12 to 14 Years | 25 (100.0%) | 15 (100.0%) |
| 15 Years | 15 (48.4%) | 23 (100.0%) |
| 16 and 17 Years | 0 (0.0%) | 50 (100.0%) |
| 18 to 24 Years | 68 (86.1%) | 123 (93.9%) |
| 25 to 34 Years | 102 (94.4%) | 124 (73.8%) |
| 35 to 44 Years | 85 (79.4%) | 81 (87.1%) |
| 45 to 54 Years | 102 (91.9%) | 94 (61.0%) |
| 55 to 64 Years | 164 (84.5%) | 193 (84.3%) |
| 65 to 74 Years | 161 (100.0%) | 148 (87.6%) |
| 75 Years and over | 74 (100.0%) | 135 (93.8%) |
| Total | 889 (88.8%) | 1,113 (84.5%) |
Income Below Poverty Among Married-Couple Families in Coudersport borough
The poverty statistics for married-couple families in Coudersport borough show that 3.4% or 14 of the total 413 families live below the poverty line. Families with no children have the highest poverty rate of 4.5%, comprising of 14 families. On the other hand, families with 1 or 2 children have the lowest poverty rate of 0.0%, which includes 0 families.
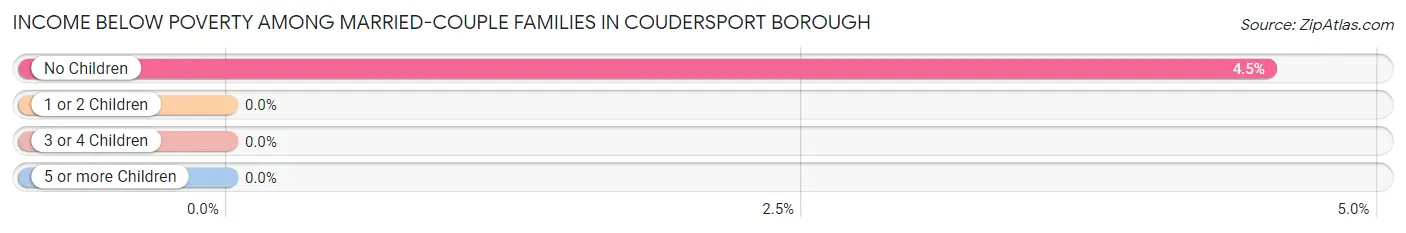
| Children | Above Poverty | Below Poverty |
| No Children | 296 (95.5%) | 14 (4.5%) |
| 1 or 2 Children | 78 (100.0%) | 0 (0.0%) |
| 3 or 4 Children | 10 (100.0%) | 0 (0.0%) |
| 5 or more Children | 15 (100.0%) | 0 (0.0%) |
| Total | 399 (96.6%) | 14 (3.4%) |
Income Below Poverty Among Single-Parent Households in Coudersport borough
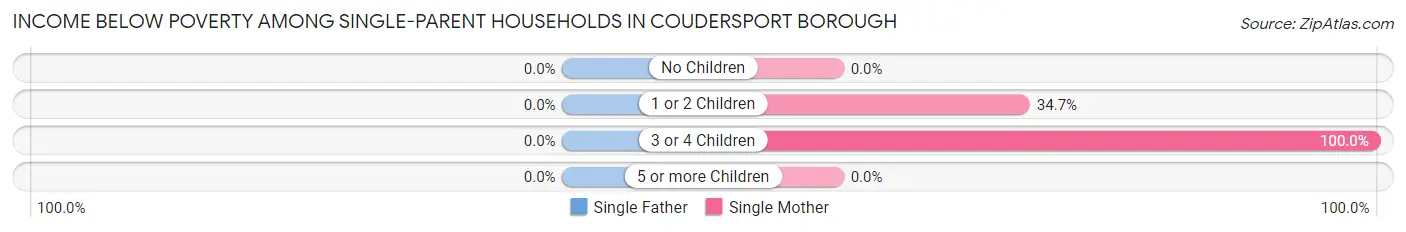
| Children | Single Father | Single Mother |
| No Children | 0 (0.0%) | 0 (0.0%) |
| 1 or 2 Children | 0 (0.0%) | 17 (34.7%) |
| 3 or 4 Children | 0 (0.0%) | 2 (100.0%) |
| 5 or more Children | 0 (0.0%) | 0 (0.0%) |
| Total | 0 (0.0%) | 19 (20.9%) |
Income Below Poverty Among Married-Couple vs Single-Parent Households in Coudersport borough
The poverty data for Coudersport borough shows that 14 of the married-couple family households (3.4%) and 19 of the single-parent households (15.8%) are living below the poverty level. Within the married-couple family households, those with no children have the highest poverty rate, with 14 households (4.5%) falling below the poverty line. Among the single-parent households, those with 3 or 4 children have the highest poverty rate, with 2 household (100.0%) living below poverty.
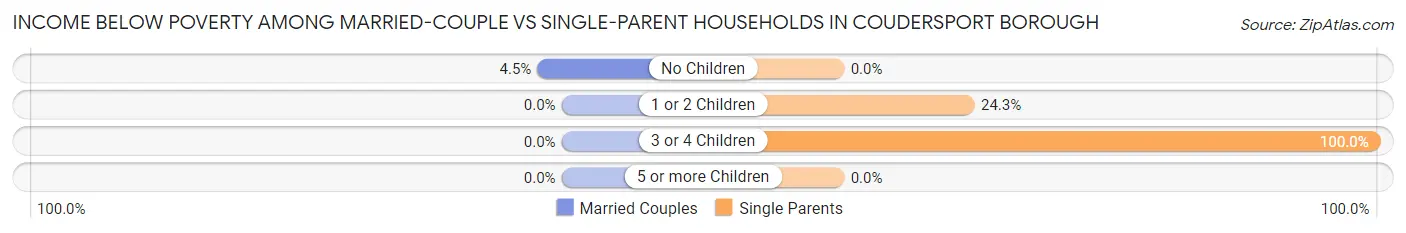
| Children | Married-Couple Families | Single-Parent Households |
| No Children | 14 (4.5%) | 0 (0.0%) |
| 1 or 2 Children | 0 (0.0%) | 17 (24.3%) |
| 3 or 4 Children | 0 (0.0%) | 2 (100.0%) |
| 5 or more Children | 0 (0.0%) | 0 (0.0%) |
| Total | 14 (3.4%) | 19 (15.8%) |
Employment Characteristics in Coudersport borough
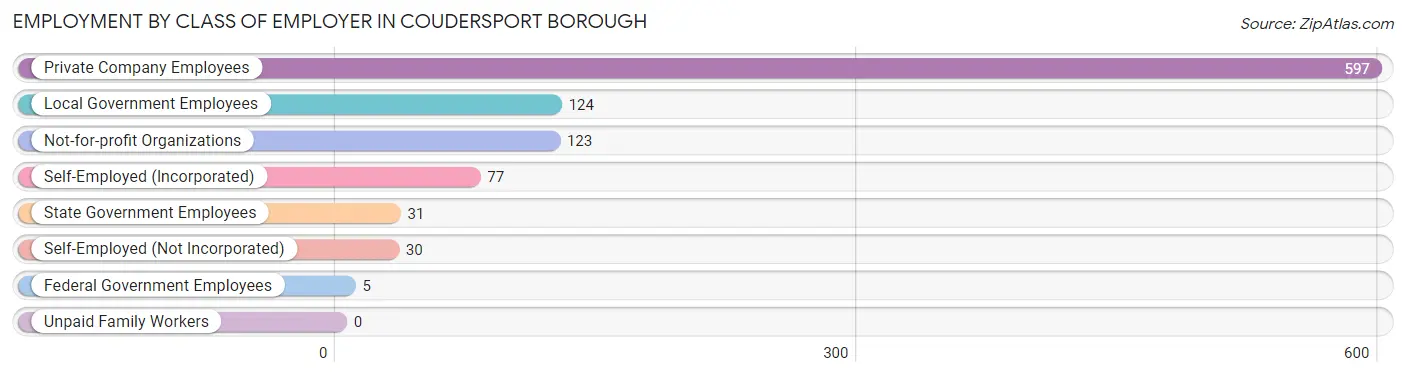
Employment by Class of Employer in Coudersport borough
Among the 987 employed individuals in Coudersport borough, private company employees (597 | 60.5%), local government employees (124 | 12.6%), and not-for-profit organizations (123 | 12.5%) make up the most common classes of employment.
| Employer Class | # Employees | % Employees |
| Private Company Employees | 597 | 60.5% |
| Self-Employed (Incorporated) | 77 | 7.8% |
| Self-Employed (Not Incorporated) | 30 | 3.0% |
| Not-for-profit Organizations | 123 | 12.5% |
| Local Government Employees | 124 | 12.6% |
| State Government Employees | 31 | 3.1% |
| Federal Government Employees | 5 | 0.5% |
| Unpaid Family Workers | 0 | 0.0% |
| Total | 987 | 100.0% |
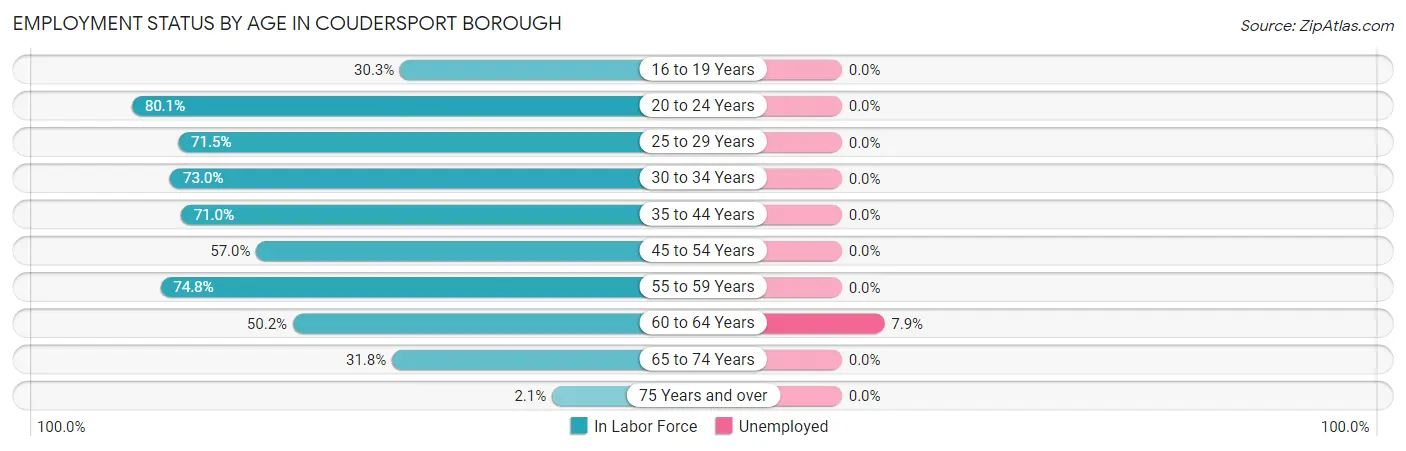
Employment Status by Age in Coudersport borough
According to the labor force statistics for Coudersport borough, out of the total population over 16 years of age (2,038), 51.3% or 1,045 individuals are in the labor force, with 1.1% or 11 of them unemployed. The age group with the highest labor force participation rate is 20 to 24 years, with 80.1% or 137 individuals in the labor force. Within the labor force, the 60 to 64 years age range has the highest percentage of unemployed individuals, with 7.9% or 11 of them being unemployed.
| Age Bracket | In Labor Force | Unemployed |
| 16 to 19 Years | 27 (30.3%) | 0 (0.0%) |
| 20 to 24 Years | 137 (80.1%) | 0 (0.0%) |
| 25 to 29 Years | 143 (71.5%) | 0 (0.0%) |
| 30 to 34 Years | 65 (73.0%) | 0 (0.0%) |
| 35 to 44 Years | 159 (71.0%) | 0 (0.0%) |
| 45 to 54 Years | 151 (57.0%) | 0 (0.0%) |
| 55 to 59 Years | 113 (74.8%) | 0 (0.0%) |
| 60 to 64 Years | 140 (50.2%) | 11 (7.9%) |
| 65 to 74 Years | 105 (31.8%) | 0 (0.0%) |
| 75 Years and over | 5 (2.1%) | 0 (0.0%) |
| Total | 1,045 (51.3%) | 11 (1.1%) |
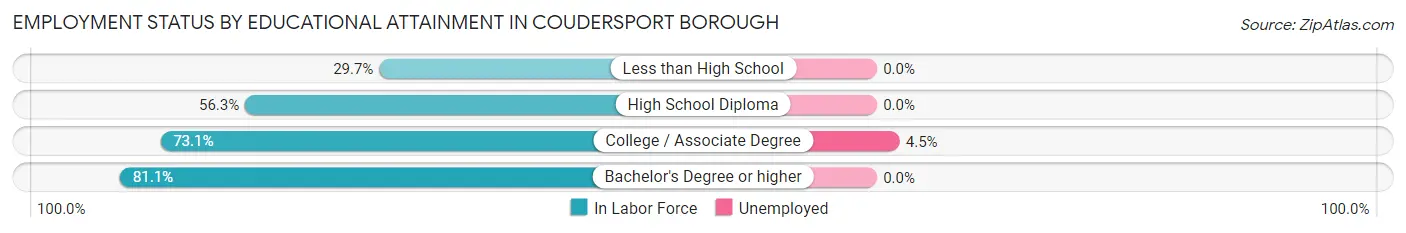
Employment Status by Educational Attainment in Coudersport borough
According to labor force statistics for Coudersport borough, 63.8% of individuals (771) out of the total population between 25 and 64 years of age (1,208) are in the labor force, with 1.4% or 11 of them being unemployed. The group with the highest labor force participation rate are those with the educational attainment of bachelor's degree or higher, with 81.1% or 193 individuals in the labor force. Within the labor force, individuals with college / associate degree education have the highest percentage of unemployment, with 4.5% or 11 of them being unemployed.
| Educational Attainment | In Labor Force | Unemployed |
| Less than High School | 27 (29.7%) | 0 (0.0%) |
| High School Diploma | 306 (56.3%) | 0 (0.0%) |
| College / Associate Degree | 245 (73.1%) | 15 (4.5%) |
| Bachelor's Degree or higher | 193 (81.1%) | 0 (0.0%) |
| Total | 771 (63.8%) | 17 (1.4%) |
Employment Occupations by Sex in Coudersport borough
Management, Business, Science and Arts Occupations
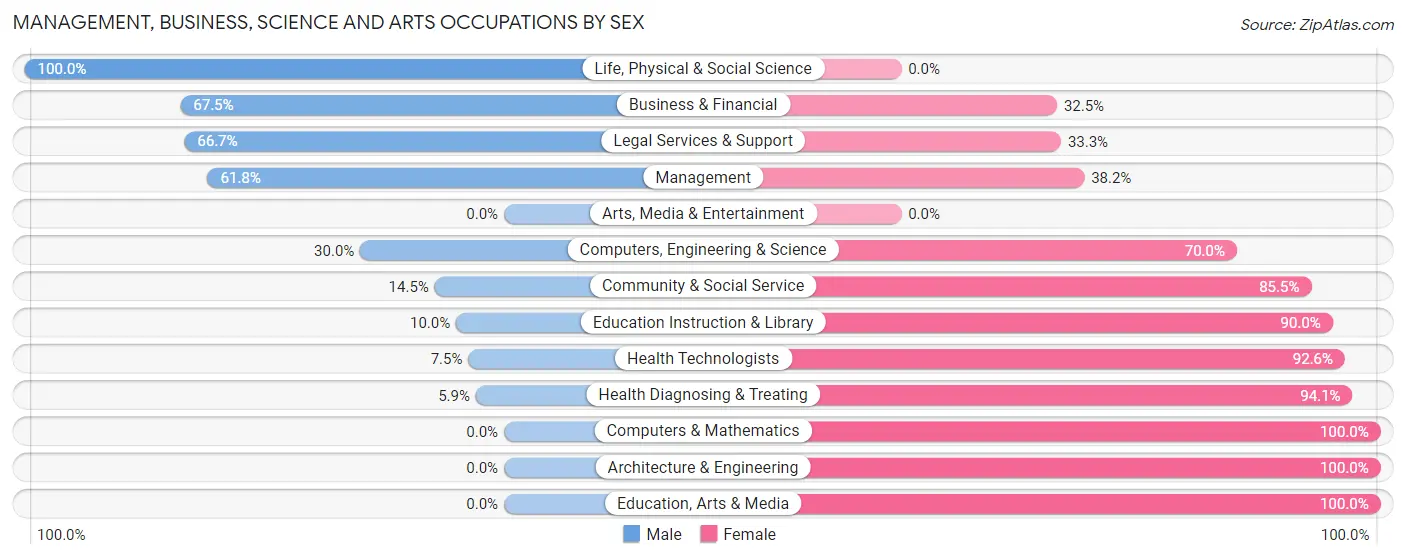
The most common Management, Business, Science and Arts occupations in Coudersport borough are Health Diagnosing & Treating (119 | 11.5%), Health Technologists (94 | 9.1%), Community & Social Service (83 | 8.0%), Education Instruction & Library (60 | 5.8%), and Management (55 | 5.3%).
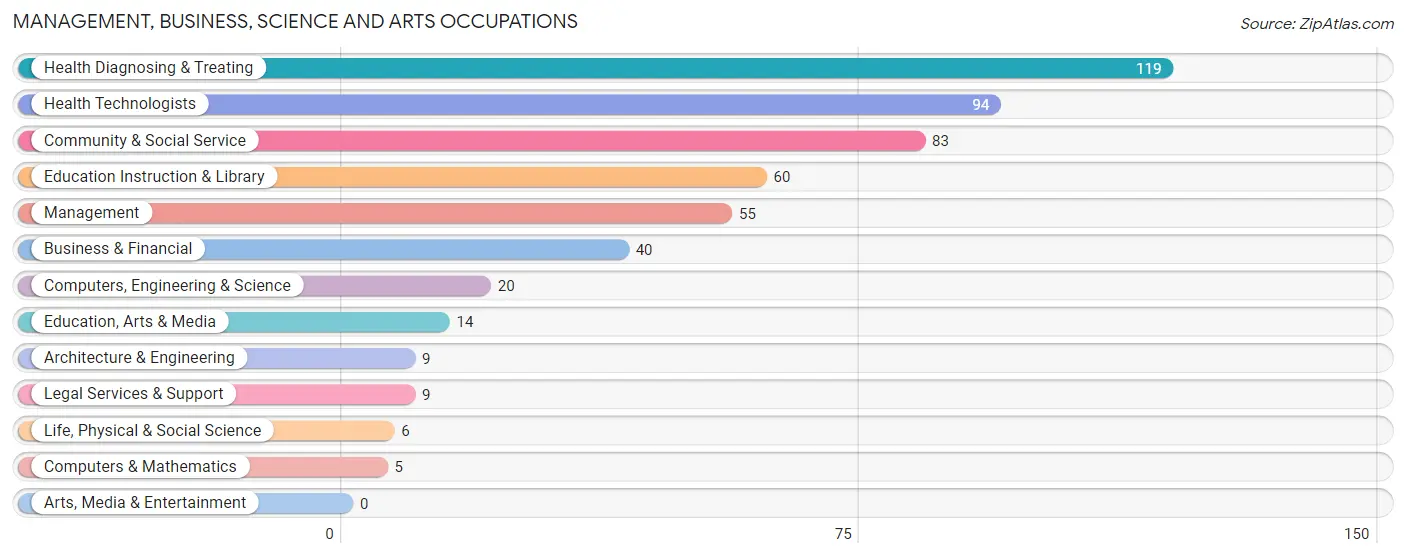
Management, Business, Science and Arts Occupations by Sex
Within the Management, Business, Science and Arts occupations in Coudersport borough, the most male-oriented occupations are Life, Physical & Social Science (100.0%), Business & Financial (67.5%), and Legal Services & Support (66.7%), while the most female-oriented occupations are Computers & Mathematics (100.0%), Architecture & Engineering (100.0%), and Education, Arts & Media (100.0%).
| Occupation | Male | Female |
| Management | 34 (61.8%) | 21 (38.2%) |
| Business & Financial | 27 (67.5%) | 13 (32.5%) |
| Computers, Engineering & Science | 6 (30.0%) | 14 (70.0%) |
| Computers & Mathematics | 0 (0.0%) | 5 (100.0%) |
| Architecture & Engineering | 0 (0.0%) | 9 (100.0%) |
| Life, Physical & Social Science | 6 (100.0%) | 0 (0.0%) |
| Community & Social Service | 12 (14.5%) | 71 (85.5%) |
| Education, Arts & Media | 0 (0.0%) | 14 (100.0%) |
| Legal Services & Support | 6 (66.7%) | 3 (33.3%) |
| Education Instruction & Library | 6 (10.0%) | 54 (90.0%) |
| Arts, Media & Entertainment | 0 (0.0%) | 0 (0.0%) |
| Health Diagnosing & Treating | 7 (5.9%) | 112 (94.1%) |
| Health Technologists | 7 (7.4%) | 87 (92.5%) |
| Total (Category) | 86 (27.1%) | 231 (72.9%) |
| Total (Overall) | 404 (39.1%) | 630 (60.9%) |
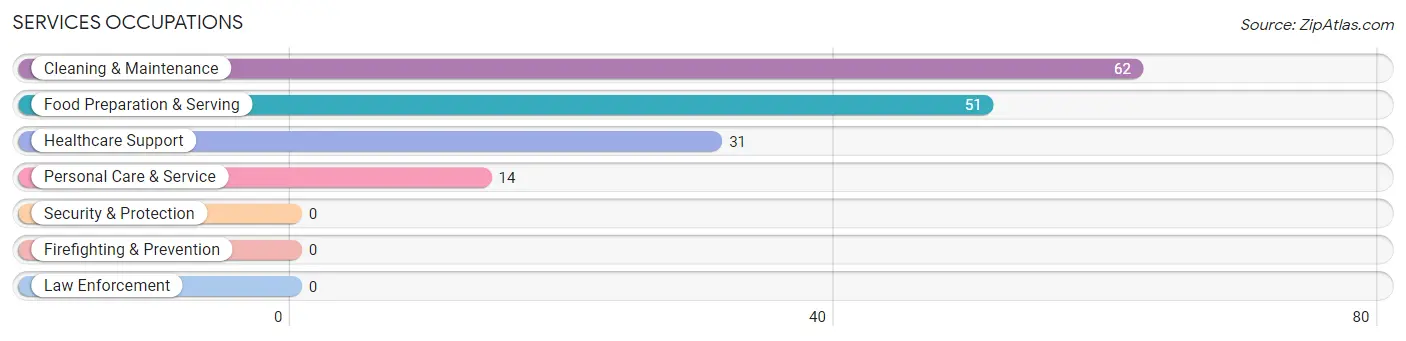
Services Occupations
The most common Services occupations in Coudersport borough are Cleaning & Maintenance (62 | 6.0%), Food Preparation & Serving (51 | 4.9%), Healthcare Support (31 | 3.0%), and Personal Care & Service (14 | 1.3%).
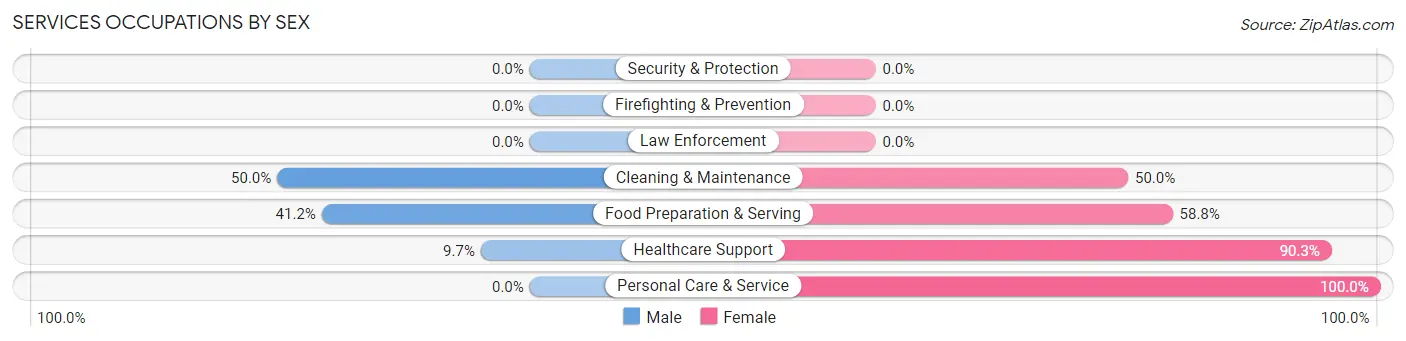
Services Occupations by Sex
Within the Services occupations in Coudersport borough, the most male-oriented occupations are Cleaning & Maintenance (50.0%), Food Preparation & Serving (41.2%), and Healthcare Support (9.7%), while the most female-oriented occupations are Personal Care & Service (100.0%), Healthcare Support (90.3%), and Food Preparation & Serving (58.8%).
| Occupation | Male | Female |
| Healthcare Support | 3 (9.7%) | 28 (90.3%) |
| Security & Protection | 0 (0.0%) | 0 (0.0%) |
| Firefighting & Prevention | 0 (0.0%) | 0 (0.0%) |
| Law Enforcement | 0 (0.0%) | 0 (0.0%) |
| Food Preparation & Serving | 21 (41.2%) | 30 (58.8%) |
| Cleaning & Maintenance | 31 (50.0%) | 31 (50.0%) |
| Personal Care & Service | 0 (0.0%) | 14 (100.0%) |
| Total (Category) | 55 (34.8%) | 103 (65.2%) |
| Total (Overall) | 404 (39.1%) | 630 (60.9%) |
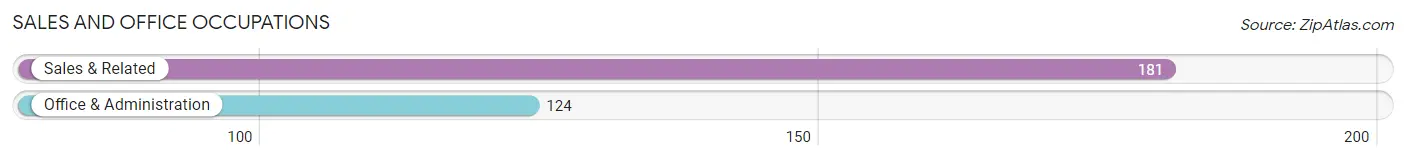
Sales and Office Occupations
The most common Sales and Office occupations in Coudersport borough are Sales & Related (181 | 17.5%), and Office & Administration (124 | 12.0%).
Sales and Office Occupations by Sex
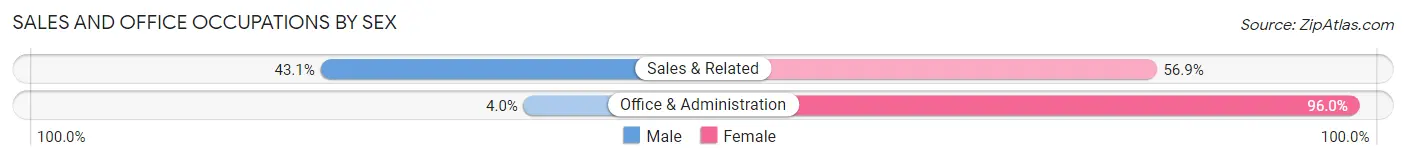
| Occupation | Male | Female |
| Sales & Related | 78 (43.1%) | 103 (56.9%) |
| Office & Administration | 5 (4.0%) | 119 (96.0%) |
| Total (Category) | 83 (27.2%) | 222 (72.8%) |
| Total (Overall) | 404 (39.1%) | 630 (60.9%) |
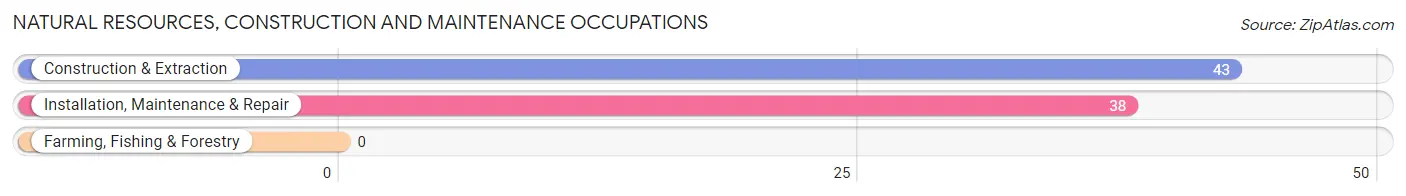
Natural Resources, Construction and Maintenance Occupations
The most common Natural Resources, Construction and Maintenance occupations in Coudersport borough are Construction & Extraction (43 | 4.2%), and Installation, Maintenance & Repair (38 | 3.7%).
Natural Resources, Construction and Maintenance Occupations by Sex
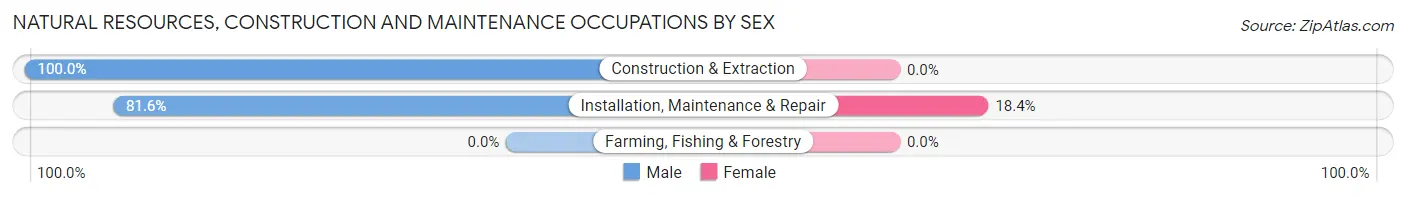
| Occupation | Male | Female |
| Farming, Fishing & Forestry | 0 (0.0%) | 0 (0.0%) |
| Construction & Extraction | 43 (100.0%) | 0 (0.0%) |
| Installation, Maintenance & Repair | 31 (81.6%) | 7 (18.4%) |
| Total (Category) | 74 (91.4%) | 7 (8.6%) |
| Total (Overall) | 404 (39.1%) | 630 (60.9%) |
Production, Transportation and Moving Occupations
The most common Production, Transportation and Moving occupations in Coudersport borough are Production (121 | 11.7%), Transportation (31 | 3.0%), and Material Moving (21 | 2.0%).
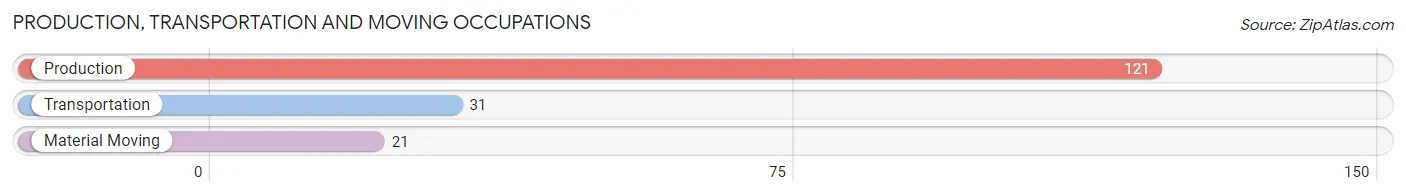
Production, Transportation and Moving Occupations by Sex
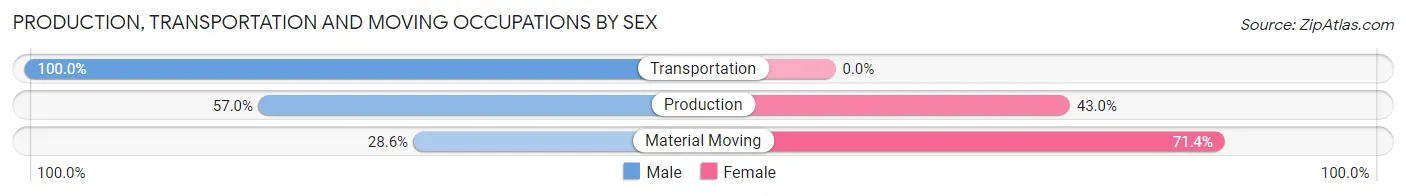
| Occupation | Male | Female |
| Production | 69 (57.0%) | 52 (43.0%) |
| Transportation | 31 (100.0%) | 0 (0.0%) |
| Material Moving | 6 (28.6%) | 15 (71.4%) |
| Total (Category) | 106 (61.3%) | 67 (38.7%) |
| Total (Overall) | 404 (39.1%) | 630 (60.9%) |
Employment Industries by Sex in Coudersport borough
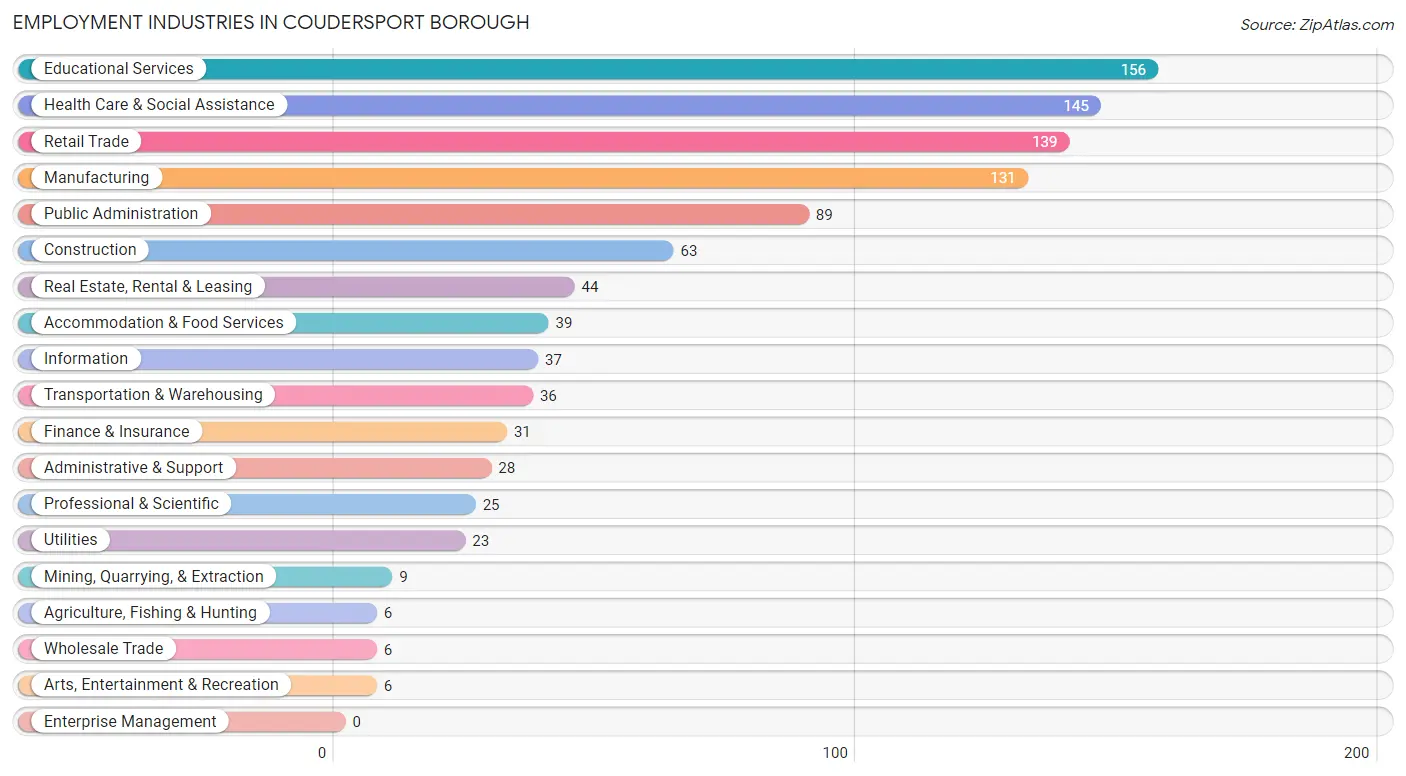
Employment Industries in Coudersport borough
The major employment industries in Coudersport borough include Educational Services (156 | 15.1%), Health Care & Social Assistance (145 | 14.0%), Retail Trade (139 | 13.4%), Manufacturing (131 | 12.7%), and Public Administration (89 | 8.6%).
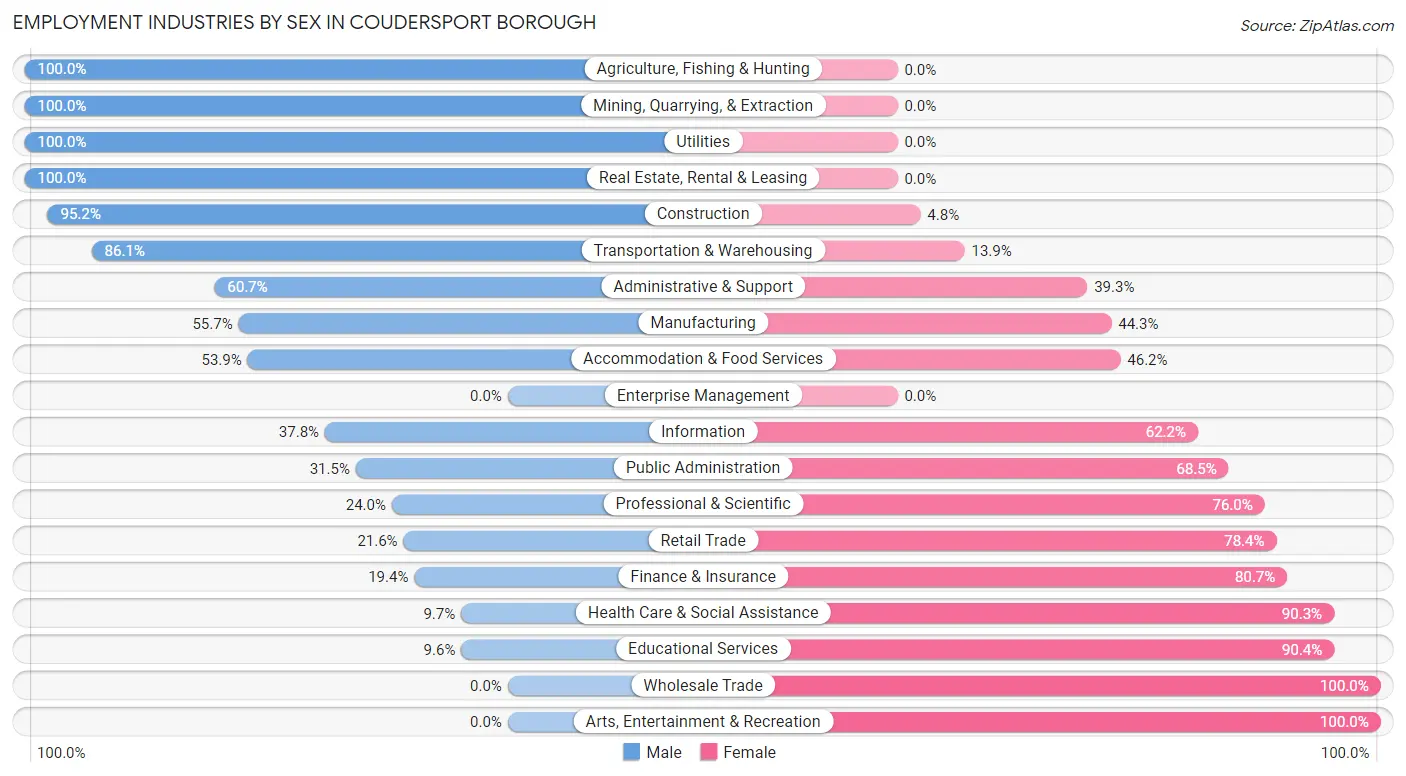
Employment Industries by Sex in Coudersport borough
The Coudersport borough industries that see more men than women are Agriculture, Fishing & Hunting (100.0%), Mining, Quarrying, & Extraction (100.0%), and Utilities (100.0%), whereas the industries that tend to have a higher number of women are Wholesale Trade (100.0%), Arts, Entertainment & Recreation (100.0%), and Educational Services (90.4%).
| Industry | Male | Female |
| Agriculture, Fishing & Hunting | 6 (100.0%) | 0 (0.0%) |
| Mining, Quarrying, & Extraction | 9 (100.0%) | 0 (0.0%) |
| Construction | 60 (95.2%) | 3 (4.8%) |
| Manufacturing | 73 (55.7%) | 58 (44.3%) |
| Wholesale Trade | 0 (0.0%) | 6 (100.0%) |
| Retail Trade | 30 (21.6%) | 109 (78.4%) |
| Transportation & Warehousing | 31 (86.1%) | 5 (13.9%) |
| Utilities | 23 (100.0%) | 0 (0.0%) |
| Information | 14 (37.8%) | 23 (62.2%) |
| Finance & Insurance | 6 (19.4%) | 25 (80.6%) |
| Real Estate, Rental & Leasing | 44 (100.0%) | 0 (0.0%) |
| Professional & Scientific | 6 (24.0%) | 19 (76.0%) |
| Enterprise Management | 0 (0.0%) | 0 (0.0%) |
| Administrative & Support | 17 (60.7%) | 11 (39.3%) |
| Educational Services | 15 (9.6%) | 141 (90.4%) |
| Health Care & Social Assistance | 14 (9.7%) | 131 (90.3%) |
| Arts, Entertainment & Recreation | 0 (0.0%) | 6 (100.0%) |
| Accommodation & Food Services | 21 (53.8%) | 18 (46.2%) |
| Public Administration | 28 (31.5%) | 61 (68.5%) |
| Total | 404 (39.1%) | 630 (60.9%) |
Education in Coudersport borough
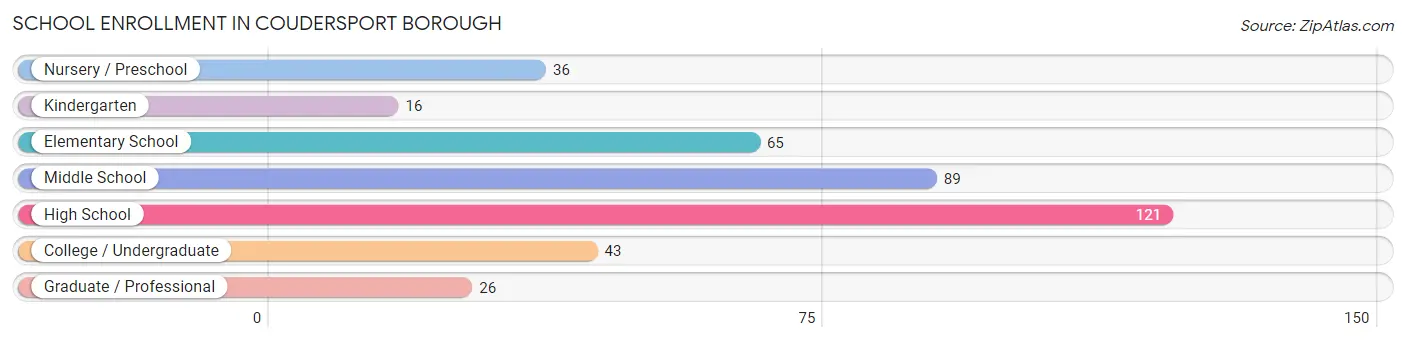
School Enrollment in Coudersport borough
The most common levels of schooling among the 396 students in Coudersport borough are high school (121 | 30.6%), middle school (89 | 22.5%), and elementary school (65 | 16.4%).
| School Level | # Students | % Students |
| Nursery / Preschool | 36 | 9.1% |
| Kindergarten | 16 | 4.0% |
| Elementary School | 65 | 16.4% |
| Middle School | 89 | 22.5% |
| High School | 121 | 30.6% |
| College / Undergraduate | 43 | 10.9% |
| Graduate / Professional | 26 | 6.6% |
| Total | 396 | 100.0% |
School Enrollment by Age by Funding Source in Coudersport borough
Out of a total of 396 students who are enrolled in schools in Coudersport borough, 90 (22.7%) attend a private institution, while the remaining 306 (77.3%) are enrolled in public schools. The age group of 20 to 24 year olds has the highest likelihood of being enrolled in private schools, with 39 (83.0% in the age bracket) enrolled. Conversely, the age group of 3 to 4 year olds has the lowest likelihood of being enrolled in a private school, with 26 (100.0% in the age bracket) attending a public institution.
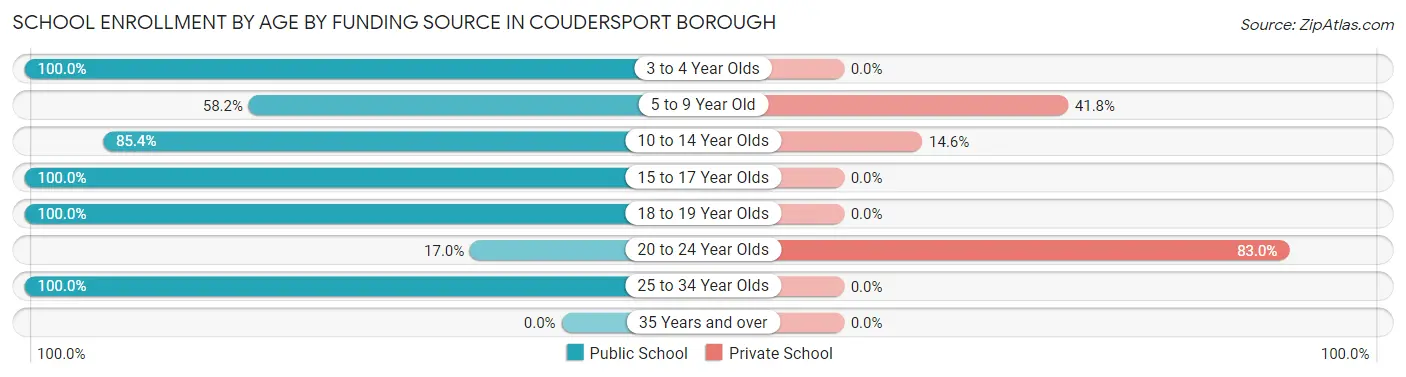
| Age Bracket | Public School | Private School |
| 3 to 4 Year Olds | 26 (100.0%) | 0 (0.0%) |
| 5 to 9 Year Old | 53 (58.2%) | 38 (41.8%) |
| 10 to 14 Year Olds | 76 (85.4%) | 13 (14.6%) |
| 15 to 17 Year Olds | 104 (100.0%) | 0 (0.0%) |
| 18 to 19 Year Olds | 21 (100.0%) | 0 (0.0%) |
| 20 to 24 Year Olds | 8 (17.0%) | 39 (83.0%) |
| 25 to 34 Year Olds | 18 (100.0%) | 0 (0.0%) |
| 35 Years and over | 0 (0.0%) | 0 (0.0%) |
| Total | 306 (77.3%) | 90 (22.7%) |
Educational Attainment by Field of Study in Coudersport borough
Science & technology (113 | 35.0%), education (79 | 24.5%), business (53 | 16.4%), arts & humanities (21 | 6.5%), and bio, nature & agricultural (16 | 5.0%) are the most common fields of study among 323 individuals in Coudersport borough who have obtained a bachelor's degree or higher.
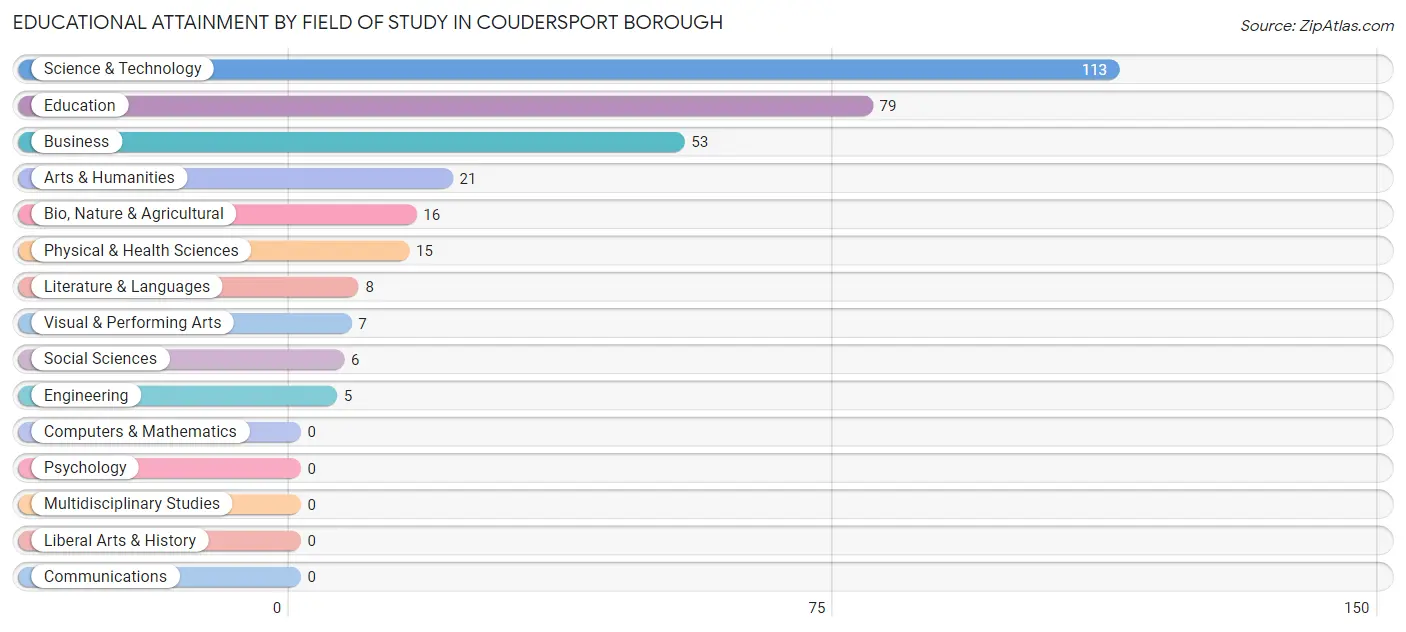
| Field of Study | # Graduates | % Graduates |
| Computers & Mathematics | 0 | 0.0% |
| Bio, Nature & Agricultural | 16 | 5.0% |
| Physical & Health Sciences | 15 | 4.6% |
| Psychology | 0 | 0.0% |
| Social Sciences | 6 | 1.9% |
| Engineering | 5 | 1.5% |
| Multidisciplinary Studies | 0 | 0.0% |
| Science & Technology | 113 | 35.0% |
| Business | 53 | 16.4% |
| Education | 79 | 24.5% |
| Literature & Languages | 8 | 2.5% |
| Liberal Arts & History | 0 | 0.0% |
| Visual & Performing Arts | 7 | 2.2% |
| Communications | 0 | 0.0% |
| Arts & Humanities | 21 | 6.5% |
| Total | 323 | 100.0% |
Transportation & Commute in Coudersport borough
Vehicle Availability by Sex in Coudersport borough
The most prevalent vehicle ownership categories in Coudersport borough are males with 2 vehicles (161, accounting for 40.6%) and females with 2 vehicles (227, making up 27.8%).
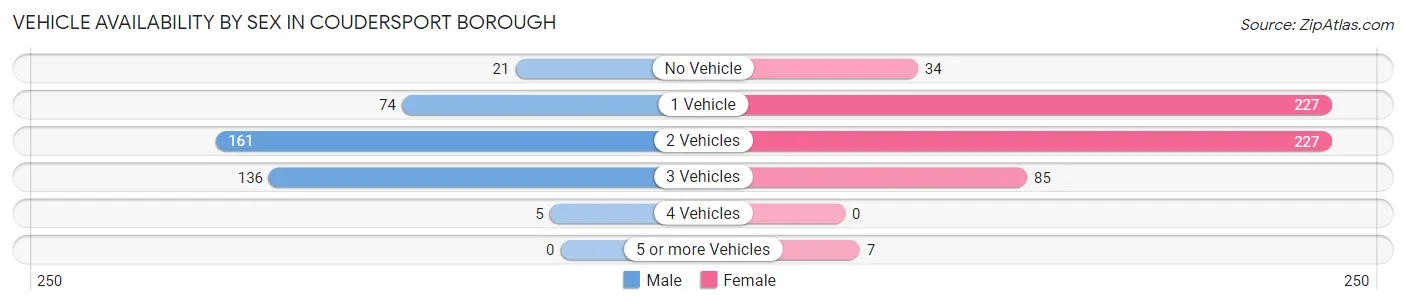
| Vehicles Available | Male | Female |
| No Vehicle | 21 (5.3%) | 34 (5.9%) |
| 1 Vehicle | 74 (18.6%) | 227 (39.1%) |
| 2 Vehicles | 161 (40.6%) | 227 (39.1%) |
| 3 Vehicles | 136 (34.3%) | 85 (14.7%) |
| 4 Vehicles | 5 (1.3%) | 0 (0.0%) |
| 5 or more Vehicles | 0 (0.0%) | 7 (1.2%) |
| Total | 397 (100.0%) | 580 (100.0%) |
Commute Time in Coudersport borough
The most frequently occuring commute durations in Coudersport borough are 5 to 9 minutes (361 commuters, 40.1%), 10 to 14 minutes (277 commuters, 30.7%), and less than 5 minutes (113 commuters, 12.5%).
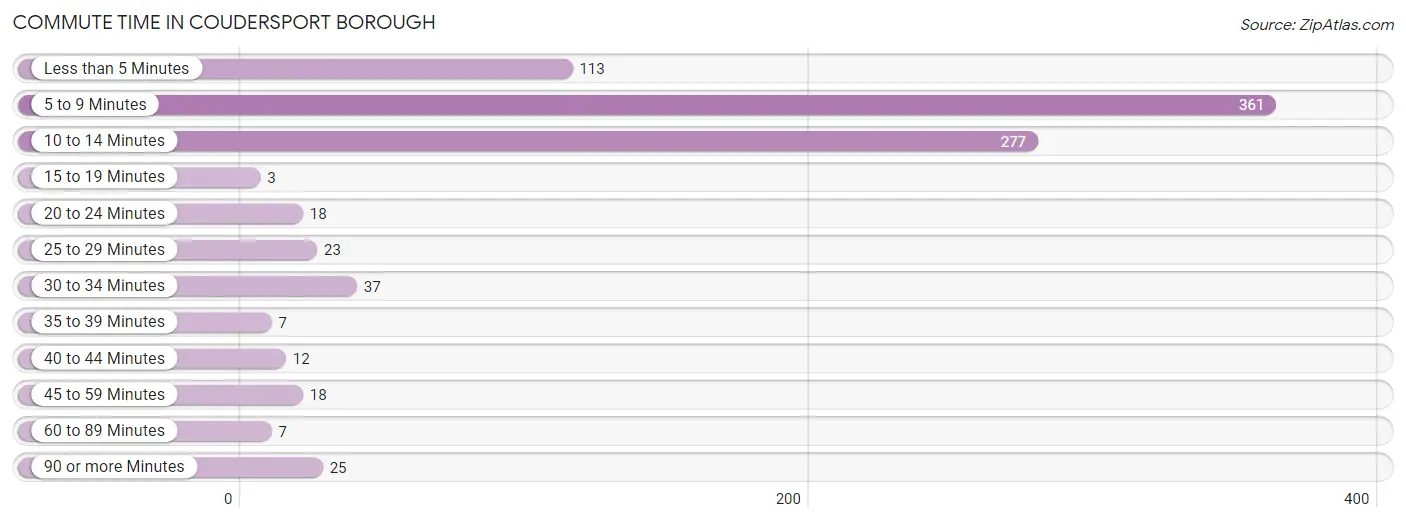
| Commute Time | # Commuters | % Commuters |
| Less than 5 Minutes | 113 | 12.5% |
| 5 to 9 Minutes | 361 | 40.1% |
| 10 to 14 Minutes | 277 | 30.7% |
| 15 to 19 Minutes | 3 | 0.3% |
| 20 to 24 Minutes | 18 | 2.0% |
| 25 to 29 Minutes | 23 | 2.5% |
| 30 to 34 Minutes | 37 | 4.1% |
| 35 to 39 Minutes | 7 | 0.8% |
| 40 to 44 Minutes | 12 | 1.3% |
| 45 to 59 Minutes | 18 | 2.0% |
| 60 to 89 Minutes | 7 | 0.8% |
| 90 or more Minutes | 25 | 2.8% |
Commute Time by Sex in Coudersport borough
The most common commute times in Coudersport borough are 5 to 9 minutes (159 commuters, 40.6%) for males and 5 to 9 minutes (202 commuters, 39.7%) for females.
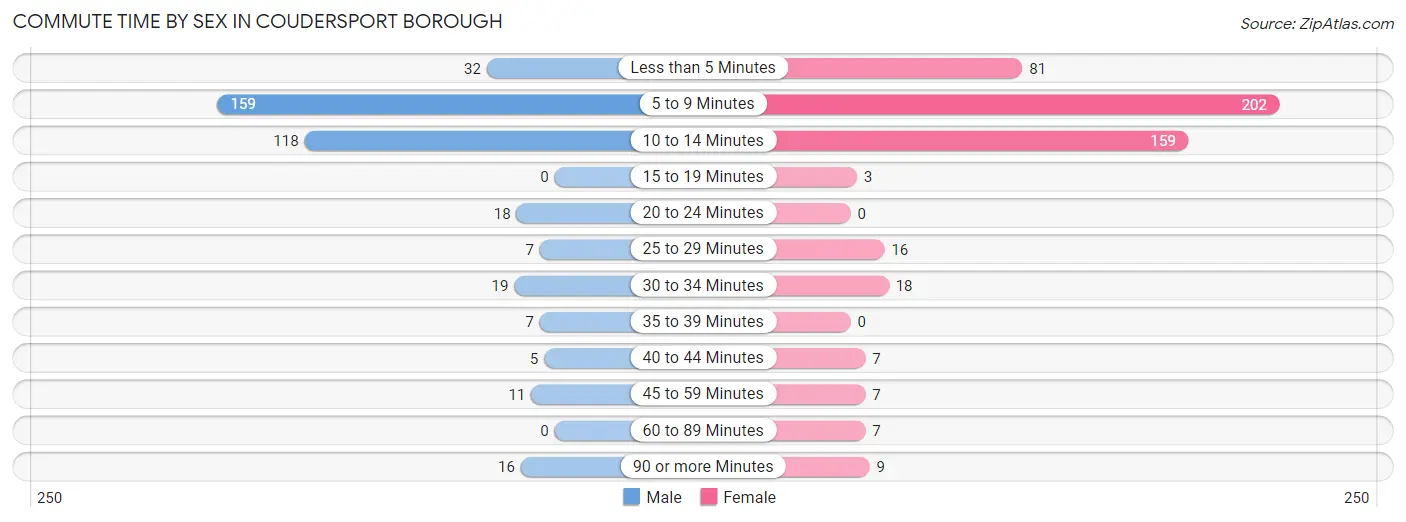
| Commute Time | Male | Female |
| Less than 5 Minutes | 32 (8.2%) | 81 (15.9%) |
| 5 to 9 Minutes | 159 (40.6%) | 202 (39.7%) |
| 10 to 14 Minutes | 118 (30.1%) | 159 (31.2%) |
| 15 to 19 Minutes | 0 (0.0%) | 3 (0.6%) |
| 20 to 24 Minutes | 18 (4.6%) | 0 (0.0%) |
| 25 to 29 Minutes | 7 (1.8%) | 16 (3.1%) |
| 30 to 34 Minutes | 19 (4.9%) | 18 (3.5%) |
| 35 to 39 Minutes | 7 (1.8%) | 0 (0.0%) |
| 40 to 44 Minutes | 5 (1.3%) | 7 (1.4%) |
| 45 to 59 Minutes | 11 (2.8%) | 7 (1.4%) |
| 60 to 89 Minutes | 0 (0.0%) | 7 (1.4%) |
| 90 or more Minutes | 16 (4.1%) | 9 (1.8%) |
Time of Departure to Work by Sex in Coudersport borough
The most frequent times of departure to work in Coudersport borough are 7:30 AM to 7:59 AM (113, 28.8%) for males and 7:30 AM to 7:59 AM (146, 28.7%) for females.
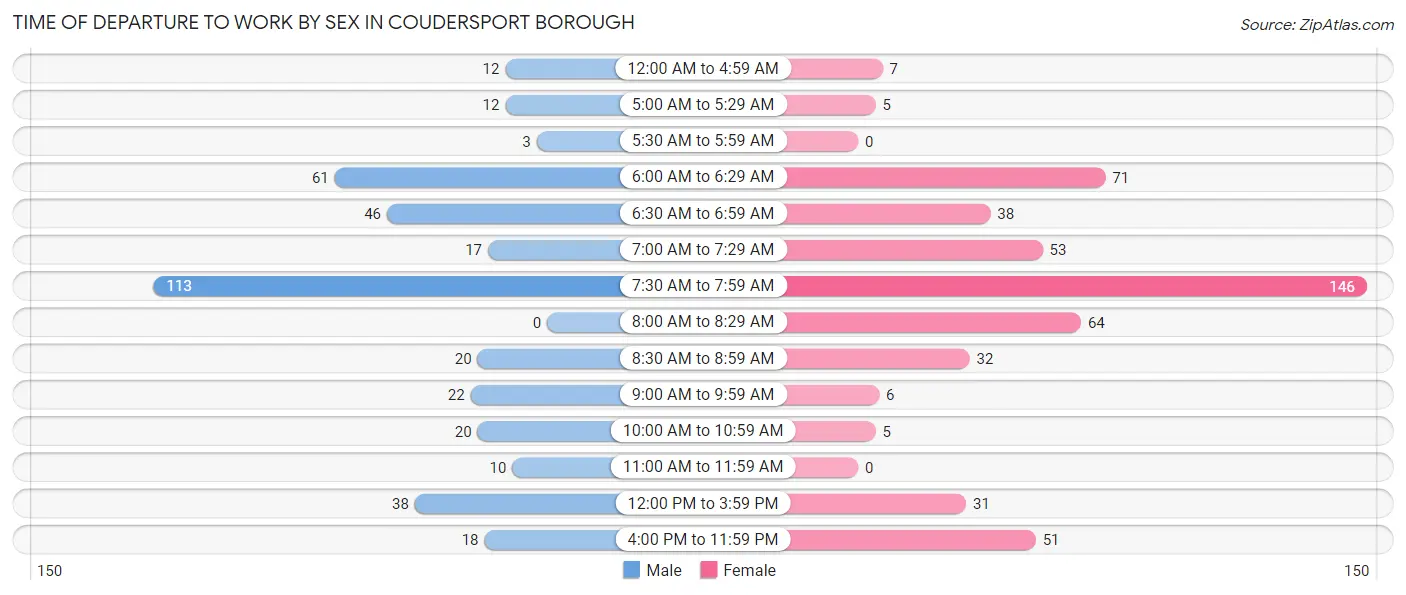
| Time of Departure | Male | Female |
| 12:00 AM to 4:59 AM | 12 (3.1%) | 7 (1.4%) |
| 5:00 AM to 5:29 AM | 12 (3.1%) | 5 (1.0%) |
| 5:30 AM to 5:59 AM | 3 (0.8%) | 0 (0.0%) |
| 6:00 AM to 6:29 AM | 61 (15.6%) | 71 (14.0%) |
| 6:30 AM to 6:59 AM | 46 (11.7%) | 38 (7.5%) |
| 7:00 AM to 7:29 AM | 17 (4.3%) | 53 (10.4%) |
| 7:30 AM to 7:59 AM | 113 (28.8%) | 146 (28.7%) |
| 8:00 AM to 8:29 AM | 0 (0.0%) | 64 (12.6%) |
| 8:30 AM to 8:59 AM | 20 (5.1%) | 32 (6.3%) |
| 9:00 AM to 9:59 AM | 22 (5.6%) | 6 (1.2%) |
| 10:00 AM to 10:59 AM | 20 (5.1%) | 5 (1.0%) |
| 11:00 AM to 11:59 AM | 10 (2.5%) | 0 (0.0%) |
| 12:00 PM to 3:59 PM | 38 (9.7%) | 31 (6.1%) |
| 4:00 PM to 11:59 PM | 18 (4.6%) | 51 (10.0%) |
| Total | 392 (100.0%) | 509 (100.0%) |
Housing Occupancy in Coudersport borough
Occupancy by Ownership in Coudersport borough
Of the total 1,018 dwellings in Coudersport borough, owner-occupied units account for 640 (62.9%), while renter-occupied units make up 378 (37.1%).
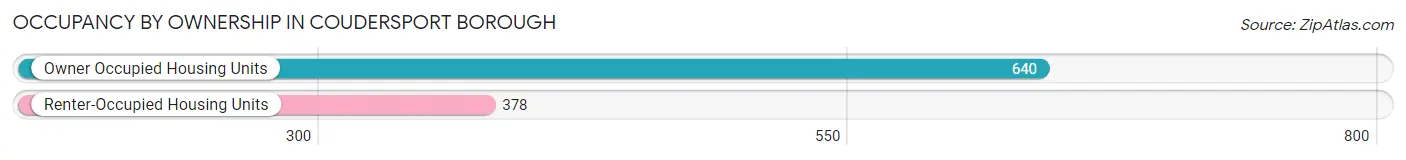
| Occupancy | # Housing Units | % Housing Units |
| Owner Occupied Housing Units | 640 | 62.9% |
| Renter-Occupied Housing Units | 378 | 37.1% |
| Total Occupied Housing Units | 1,018 | 100.0% |
Occupancy by Household Size in Coudersport borough
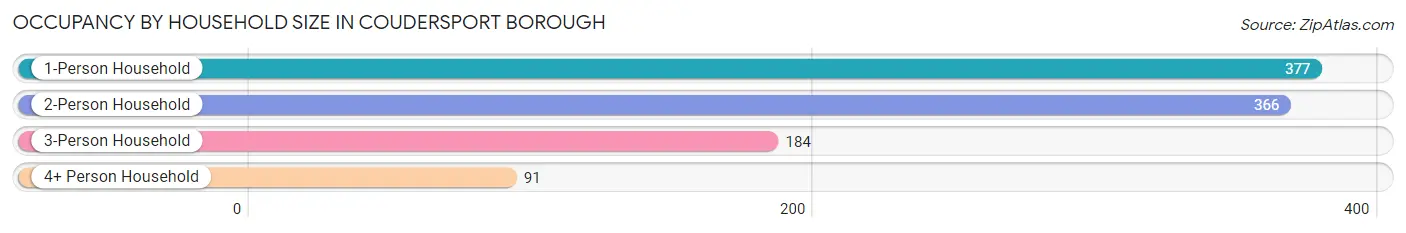
| Household Size | # Housing Units | % Housing Units |
| 1-Person Household | 377 | 37.0% |
| 2-Person Household | 366 | 35.9% |
| 3-Person Household | 184 | 18.1% |
| 4+ Person Household | 91 | 8.9% |
| Total Housing Units | 1,018 | 100.0% |
Occupancy by Ownership by Household Size in Coudersport borough
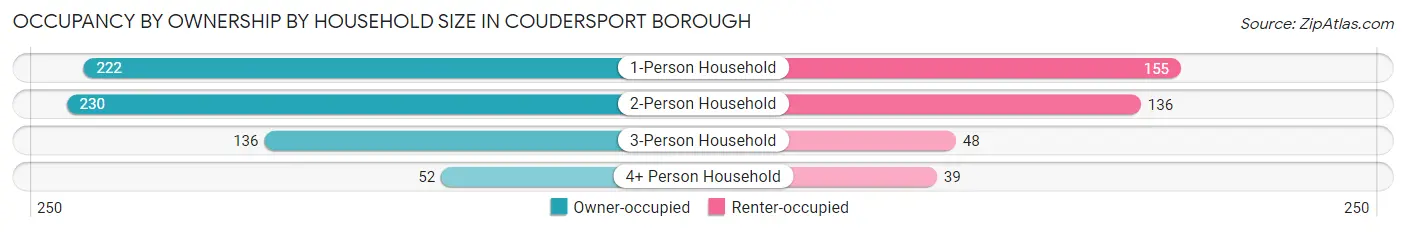
| Household Size | Owner-occupied | Renter-occupied |
| 1-Person Household | 222 (58.9%) | 155 (41.1%) |
| 2-Person Household | 230 (62.8%) | 136 (37.2%) |
| 3-Person Household | 136 (73.9%) | 48 (26.1%) |
| 4+ Person Household | 52 (57.1%) | 39 (42.9%) |
| Total Housing Units | 640 (62.9%) | 378 (37.1%) |
Occupancy by Educational Attainment in Coudersport borough
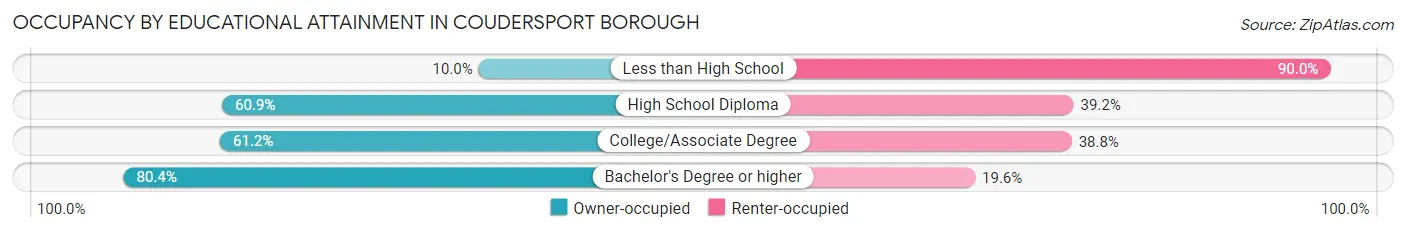
| Household Size | Owner-occupied | Renter-occupied |
| Less than High School | 6 (10.0%) | 54 (90.0%) |
| High School Diploma | 230 (60.9%) | 148 (39.2%) |
| College/Associate Degree | 199 (61.2%) | 126 (38.8%) |
| Bachelor's Degree or higher | 205 (80.4%) | 50 (19.6%) |
Occupancy by Age of Householder in Coudersport borough
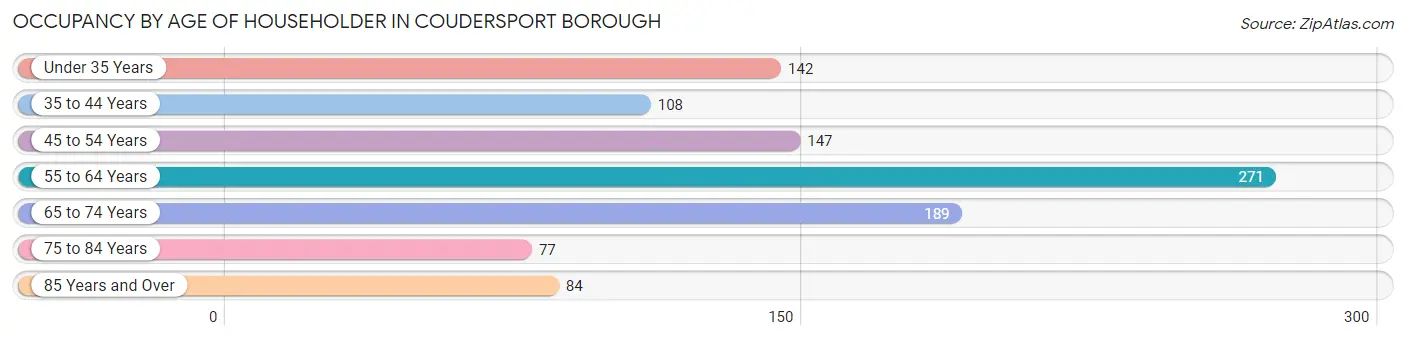
| Age Bracket | # Households | % Households |
| Under 35 Years | 142 | 14.0% |
| 35 to 44 Years | 108 | 10.6% |
| 45 to 54 Years | 147 | 14.4% |
| 55 to 64 Years | 271 | 26.6% |
| 65 to 74 Years | 189 | 18.6% |
| 75 to 84 Years | 77 | 7.6% |
| 85 Years and Over | 84 | 8.3% |
| Total | 1,018 | 100.0% |
Housing Finances in Coudersport borough
Median Income by Occupancy in Coudersport borough
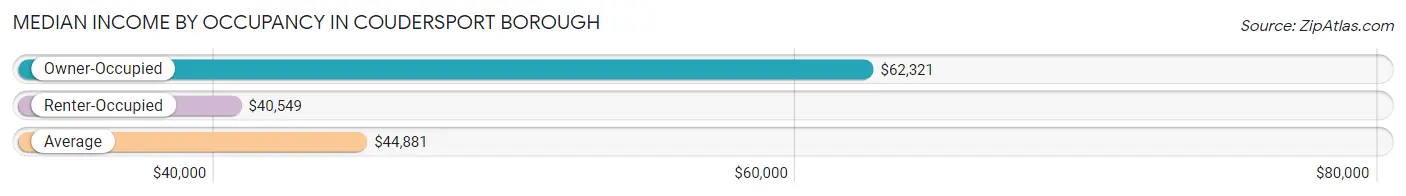
| Occupancy Type | # Households | Median Income |
| Owner-Occupied | 640 (62.9%) | $62,321 |
| Renter-Occupied | 378 (37.1%) | $40,549 |
| Average | 1,018 (100.0%) | $44,881 |
Occupancy by Householder Income Bracket in Coudersport borough
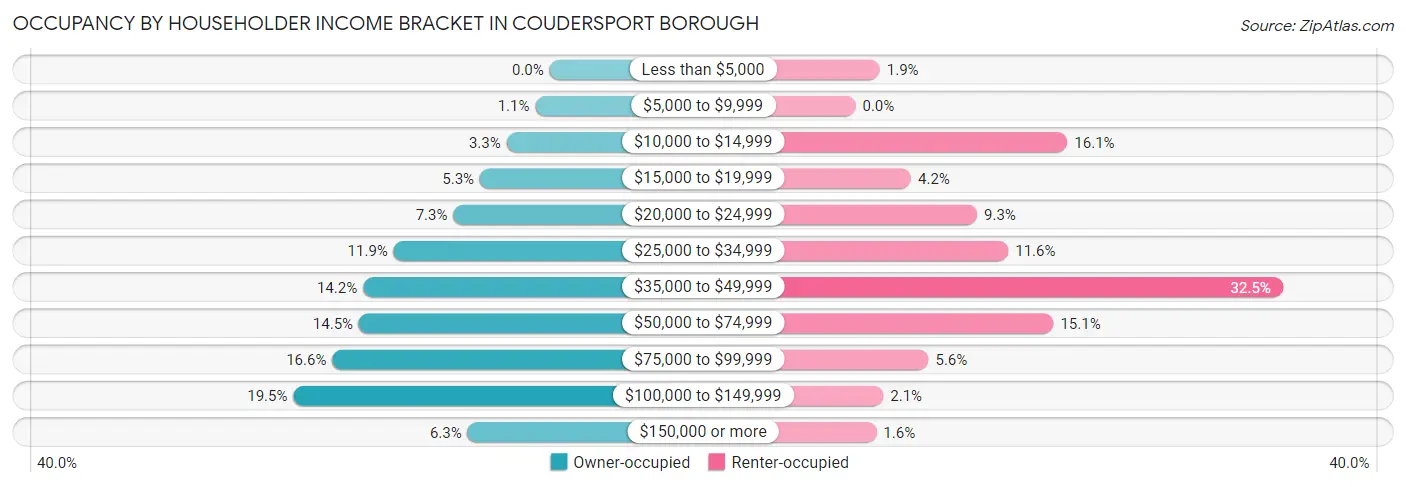
| Income Bracket | Owner-occupied | Renter-occupied |
| Less than $5,000 | 0 (0.0%) | 7 (1.8%) |
| $5,000 to $9,999 | 7 (1.1%) | 0 (0.0%) |
| $10,000 to $14,999 | 21 (3.3%) | 61 (16.1%) |
| $15,000 to $19,999 | 34 (5.3%) | 16 (4.2%) |
| $20,000 to $24,999 | 47 (7.3%) | 35 (9.3%) |
| $25,000 to $34,999 | 76 (11.9%) | 44 (11.6%) |
| $35,000 to $49,999 | 91 (14.2%) | 123 (32.5%) |
| $50,000 to $74,999 | 93 (14.5%) | 57 (15.1%) |
| $75,000 to $99,999 | 106 (16.6%) | 21 (5.6%) |
| $100,000 to $149,999 | 125 (19.5%) | 8 (2.1%) |
| $150,000 or more | 40 (6.2%) | 6 (1.6%) |
| Total | 640 (100.0%) | 378 (100.0%) |
Monthly Housing Cost Tiers in Coudersport borough
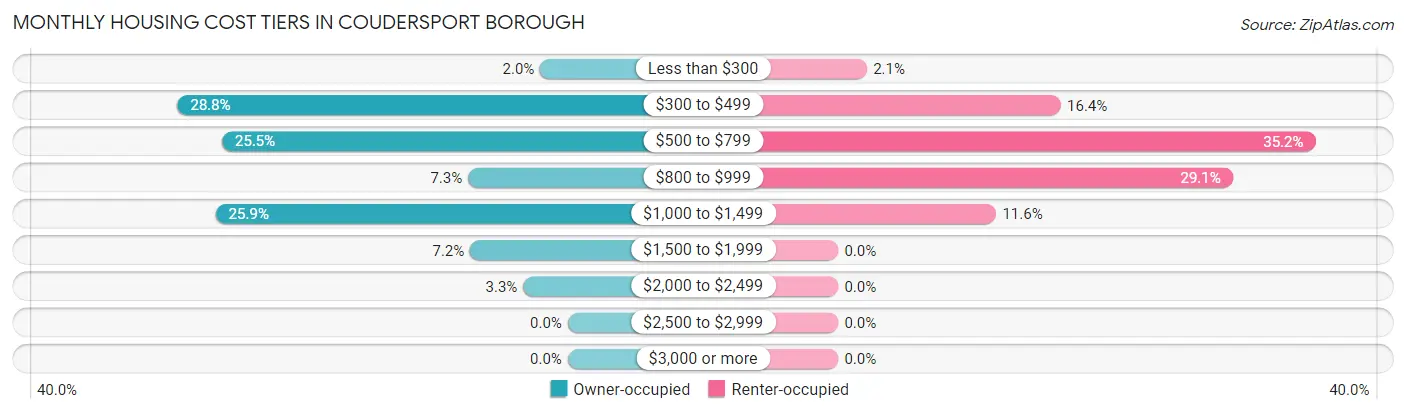
| Monthly Cost | Owner-occupied | Renter-occupied |
| Less than $300 | 13 (2.0%) | 8 (2.1%) |
| $300 to $499 | 184 (28.7%) | 62 (16.4%) |
| $500 to $799 | 163 (25.5%) | 133 (35.2%) |
| $800 to $999 | 47 (7.3%) | 110 (29.1%) |
| $1,000 to $1,499 | 166 (25.9%) | 44 (11.6%) |
| $1,500 to $1,999 | 46 (7.2%) | 0 (0.0%) |
| $2,000 to $2,499 | 21 (3.3%) | 0 (0.0%) |
| $2,500 to $2,999 | 0 (0.0%) | 0 (0.0%) |
| $3,000 or more | 0 (0.0%) | 0 (0.0%) |
| Total | 640 (100.0%) | 378 (100.0%) |
Physical Housing Characteristics in Coudersport borough
Housing Structures in Coudersport borough
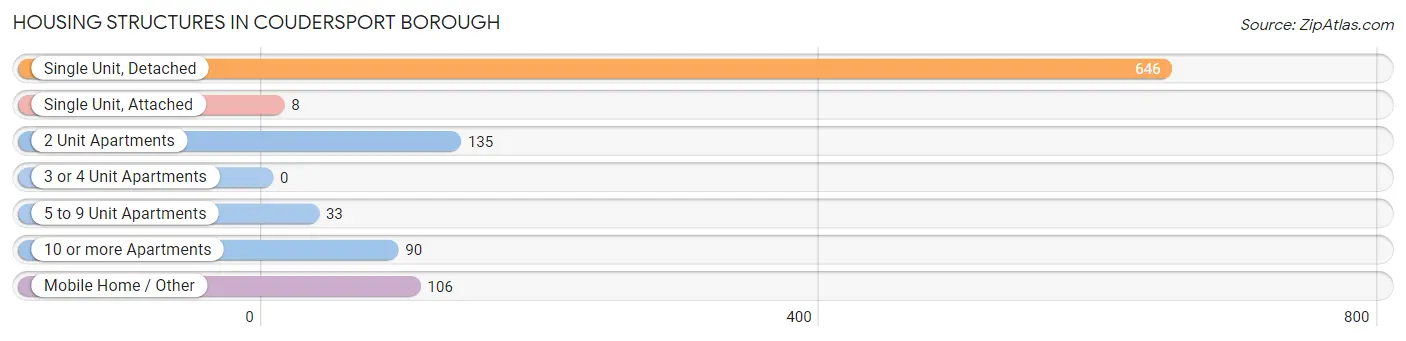
| Structure Type | # Housing Units | % Housing Units |
| Single Unit, Detached | 646 | 63.5% |
| Single Unit, Attached | 8 | 0.8% |
| 2 Unit Apartments | 135 | 13.3% |
| 3 or 4 Unit Apartments | 0 | 0.0% |
| 5 to 9 Unit Apartments | 33 | 3.2% |
| 10 or more Apartments | 90 | 8.8% |
| Mobile Home / Other | 106 | 10.4% |
| Total | 1,018 | 100.0% |
Housing Structures by Occupancy in Coudersport borough
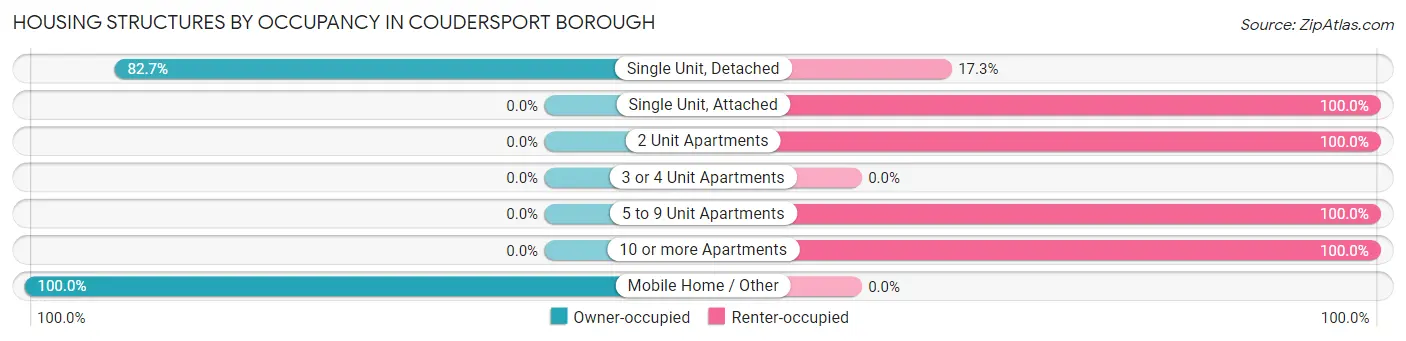
| Structure Type | Owner-occupied | Renter-occupied |
| Single Unit, Detached | 534 (82.7%) | 112 (17.3%) |
| Single Unit, Attached | 0 (0.0%) | 8 (100.0%) |
| 2 Unit Apartments | 0 (0.0%) | 135 (100.0%) |
| 3 or 4 Unit Apartments | 0 (0.0%) | 0 (0.0%) |
| 5 to 9 Unit Apartments | 0 (0.0%) | 33 (100.0%) |
| 10 or more Apartments | 0 (0.0%) | 90 (100.0%) |
| Mobile Home / Other | 106 (100.0%) | 0 (0.0%) |
| Total | 640 (62.9%) | 378 (37.1%) |
Housing Structures by Number of Rooms in Coudersport borough
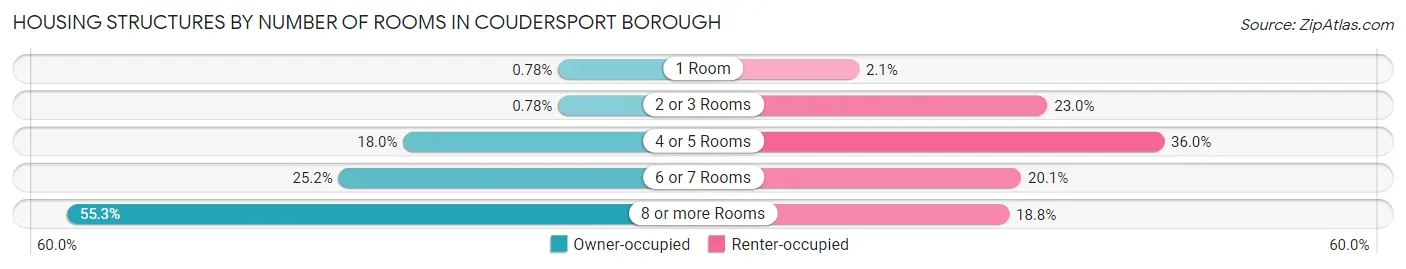
| Number of Rooms | Owner-occupied | Renter-occupied |
| 1 Room | 5 (0.8%) | 8 (2.1%) |
| 2 or 3 Rooms | 5 (0.8%) | 87 (23.0%) |
| 4 or 5 Rooms | 115 (18.0%) | 136 (36.0%) |
| 6 or 7 Rooms | 161 (25.2%) | 76 (20.1%) |
| 8 or more Rooms | 354 (55.3%) | 71 (18.8%) |
| Total | 640 (100.0%) | 378 (100.0%) |
Housing Structure by Heating Type in Coudersport borough
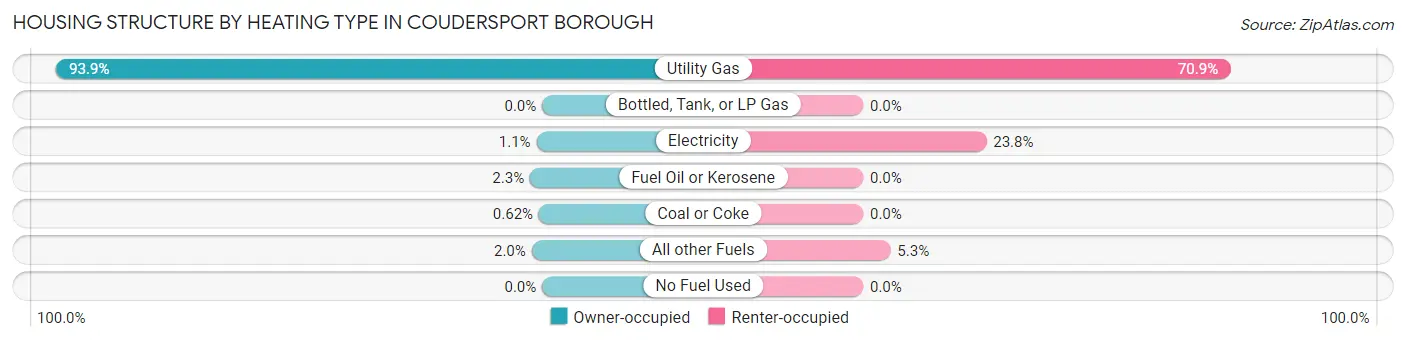
| Heating Type | Owner-occupied | Renter-occupied |
| Utility Gas | 601 (93.9%) | 268 (70.9%) |
| Bottled, Tank, or LP Gas | 0 (0.0%) | 0 (0.0%) |
| Electricity | 7 (1.1%) | 90 (23.8%) |
| Fuel Oil or Kerosene | 15 (2.3%) | 0 (0.0%) |
| Coal or Coke | 4 (0.6%) | 0 (0.0%) |
| All other Fuels | 13 (2.0%) | 20 (5.3%) |
| No Fuel Used | 0 (0.0%) | 0 (0.0%) |
| Total | 640 (100.0%) | 378 (100.0%) |
Household Vehicle Usage in Coudersport borough
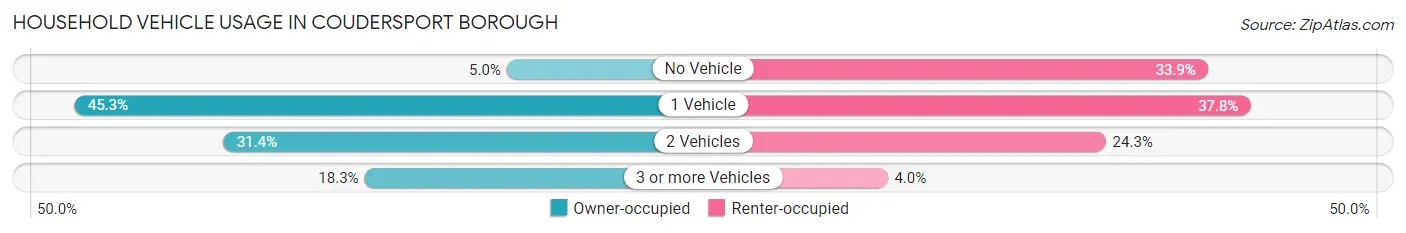
| Vehicles per Household | Owner-occupied | Renter-occupied |
| No Vehicle | 32 (5.0%) | 128 (33.9%) |
| 1 Vehicle | 290 (45.3%) | 143 (37.8%) |
| 2 Vehicles | 201 (31.4%) | 92 (24.3%) |
| 3 or more Vehicles | 117 (18.3%) | 15 (4.0%) |
| Total | 640 (100.0%) | 378 (100.0%) |
Real Estate & Mortgages in Coudersport borough
Real Estate and Mortgage Overview in Coudersport borough
| Characteristic | Without Mortgage | With Mortgage |
| Housing Units | 360 | 280 |
| Median Property Value | $122,600 | $110,900 |
| Median Household Income | $62,917 | $13 |
| Monthly Housing Costs | $486 | $0 |
| Real Estate Taxes | $1,746 | $0 |
Property Value by Mortgage Status in Coudersport borough
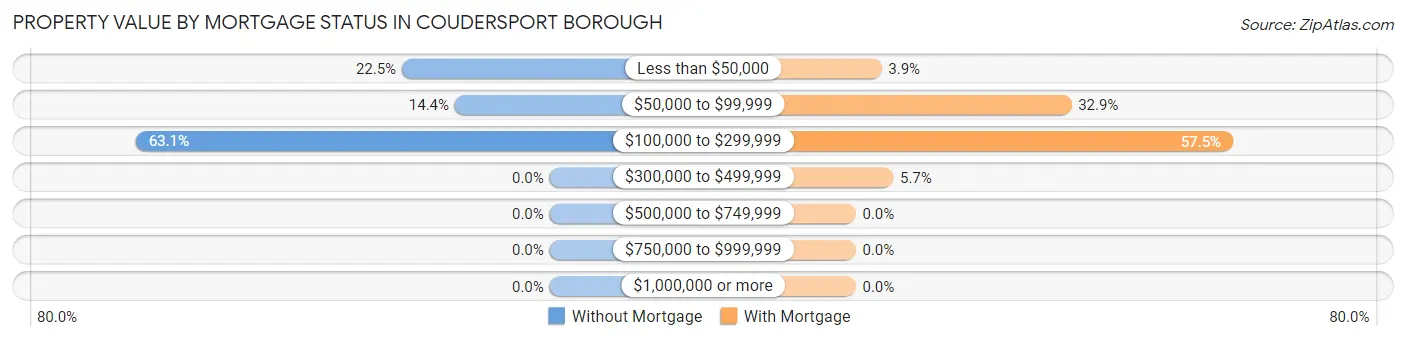
| Property Value | Without Mortgage | With Mortgage |
| Less than $50,000 | 81 (22.5%) | 11 (3.9%) |
| $50,000 to $99,999 | 52 (14.4%) | 92 (32.9%) |
| $100,000 to $299,999 | 227 (63.1%) | 161 (57.5%) |
| $300,000 to $499,999 | 0 (0.0%) | 16 (5.7%) |
| $500,000 to $749,999 | 0 (0.0%) | 0 (0.0%) |
| $750,000 to $999,999 | 0 (0.0%) | 0 (0.0%) |
| $1,000,000 or more | 0 (0.0%) | 0 (0.0%) |
| Total | 360 (100.0%) | 280 (100.0%) |
Household Income by Mortgage Status in Coudersport borough
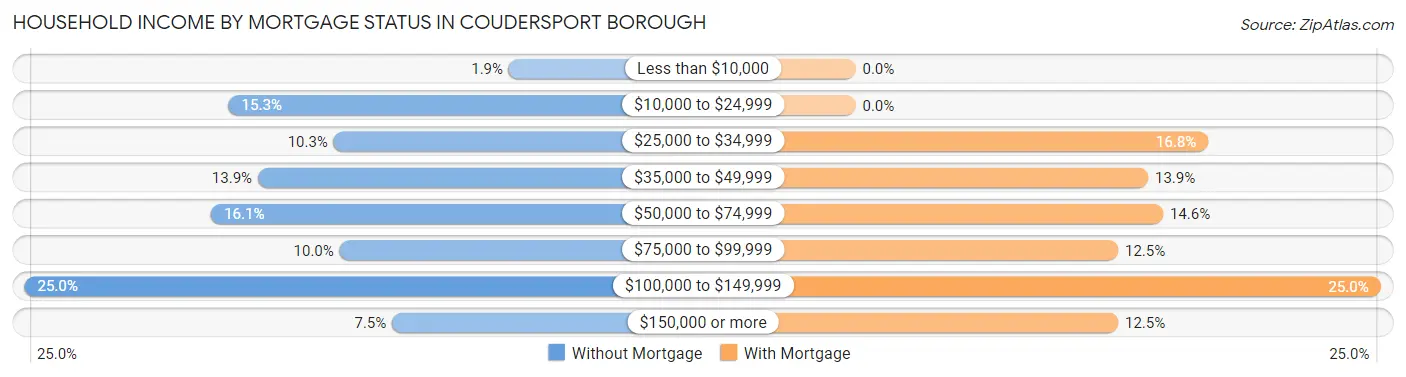
| Household Income | Without Mortgage | With Mortgage |
| Less than $10,000 | 7 (1.9%) | 0 (0.0%) |
| $10,000 to $24,999 | 55 (15.3%) | 0 (0.0%) |
| $25,000 to $34,999 | 37 (10.3%) | 47 (16.8%) |
| $35,000 to $49,999 | 50 (13.9%) | 39 (13.9%) |
| $50,000 to $74,999 | 58 (16.1%) | 41 (14.6%) |
| $75,000 to $99,999 | 36 (10.0%) | 35 (12.5%) |
| $100,000 to $149,999 | 90 (25.0%) | 70 (25.0%) |
| $150,000 or more | 27 (7.5%) | 35 (12.5%) |
| Total | 360 (100.0%) | 280 (100.0%) |
Property Value to Household Income Ratio in Coudersport borough
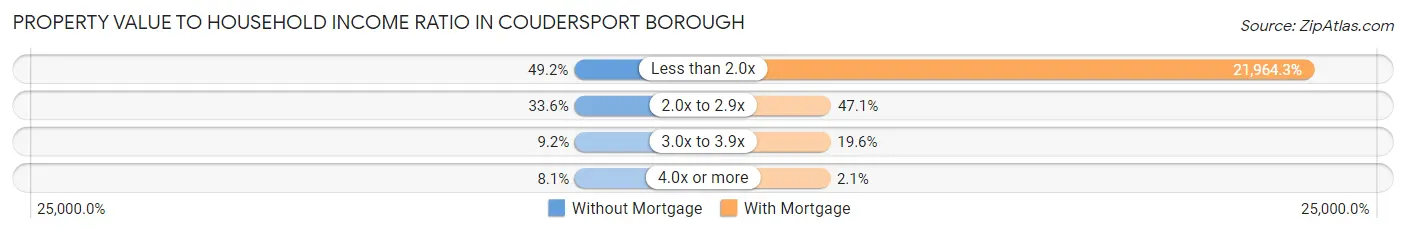
| Value-to-Income Ratio | Without Mortgage | With Mortgage |
| Less than 2.0x | 177 (49.2%) | 61,500 (21,964.3%) |
| 2.0x to 2.9x | 121 (33.6%) | 132 (47.1%) |
| 3.0x to 3.9x | 33 (9.2%) | 55 (19.6%) |
| 4.0x or more | 29 (8.1%) | 6 (2.1%) |
| Total | 360 (100.0%) | 280 (100.0%) |
Real Estate Taxes by Mortgage Status in Coudersport borough
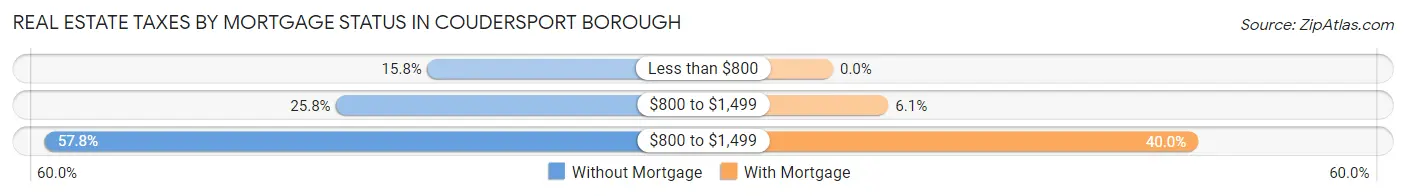
| Property Taxes | Without Mortgage | With Mortgage |
| Less than $800 | 57 (15.8%) | 0 (0.0%) |
| $800 to $1,499 | 93 (25.8%) | 17 (6.1%) |
| $800 to $1,499 | 208 (57.8%) | 112 (40.0%) |
| Total | 360 (100.0%) | 280 (100.0%) |
Health & Disability in Coudersport borough
Health Insurance Coverage by Age in Coudersport borough
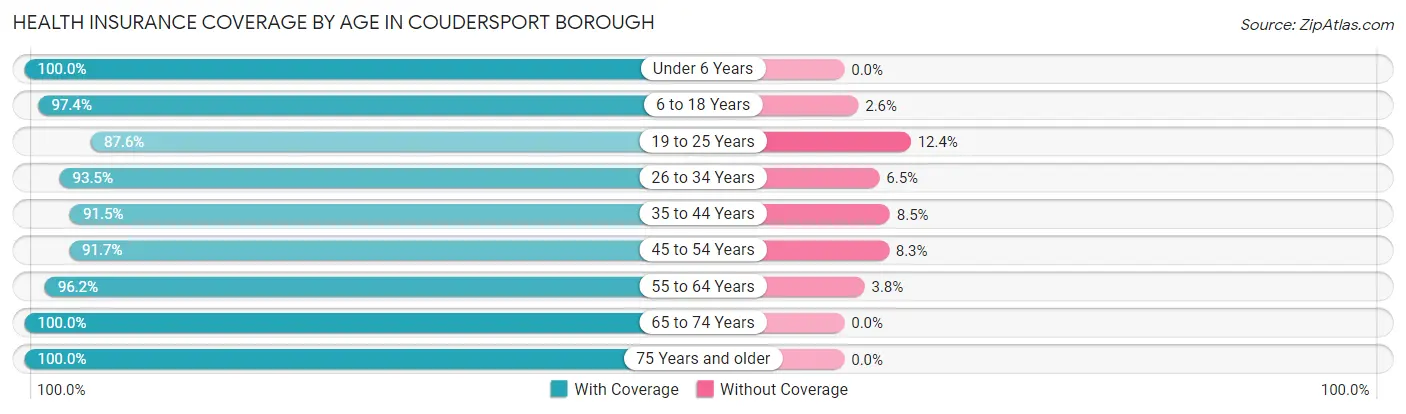
| Age Bracket | With Coverage | Without Coverage |
| Under 6 Years | 144 (100.0%) | 0 (0.0%) |
| 6 to 18 Years | 261 (97.4%) | 7 (2.6%) |
| 19 to 25 Years | 184 (87.6%) | 26 (12.4%) |
| 26 to 34 Years | 243 (93.5%) | 17 (6.5%) |
| 35 to 44 Years | 183 (91.5%) | 17 (8.5%) |
| 45 to 54 Years | 243 (91.7%) | 22 (8.3%) |
| 55 to 64 Years | 407 (96.2%) | 16 (3.8%) |
| 65 to 74 Years | 330 (100.0%) | 0 (0.0%) |
| 75 Years and older | 218 (100.0%) | 0 (0.0%) |
| Total | 2,213 (95.5%) | 105 (4.5%) |
Health Insurance Coverage by Citizenship Status in Coudersport borough
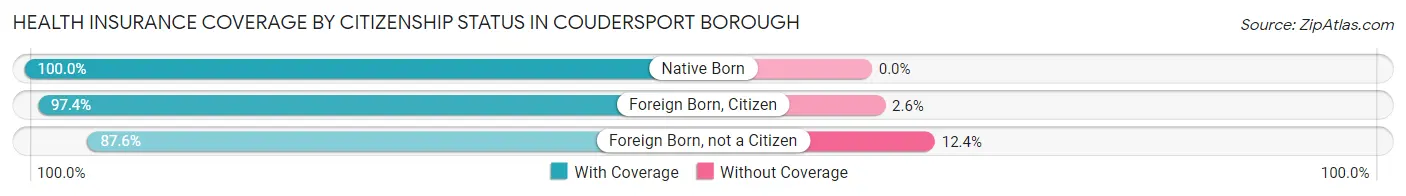
| Citizenship Status | With Coverage | Without Coverage |
| Native Born | 144 (100.0%) | 0 (0.0%) |
| Foreign Born, Citizen | 261 (97.4%) | 7 (2.6%) |
| Foreign Born, not a Citizen | 184 (87.6%) | 26 (12.4%) |
Health Insurance Coverage by Household Income in Coudersport borough
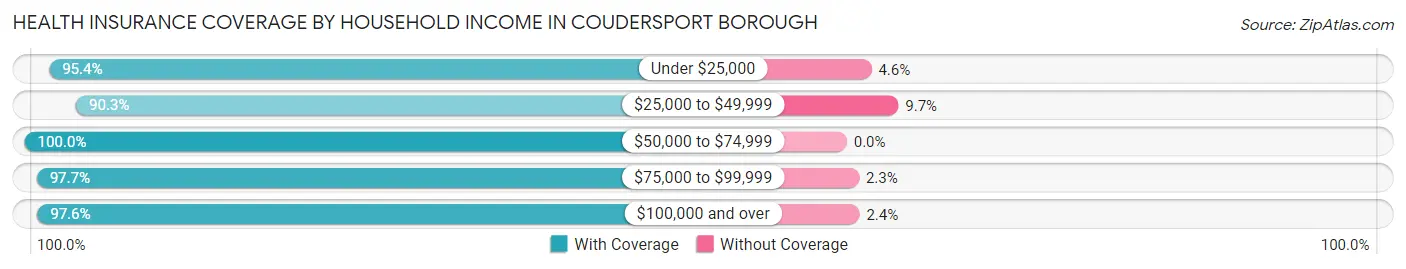
| Household Income | With Coverage | Without Coverage |
| Under $25,000 | 289 (95.4%) | 14 (4.6%) |
| $25,000 to $49,999 | 655 (90.3%) | 70 (9.7%) |
| $50,000 to $74,999 | 360 (100.0%) | 0 (0.0%) |
| $75,000 to $99,999 | 385 (97.7%) | 9 (2.3%) |
| $100,000 and over | 493 (97.6%) | 12 (2.4%) |
Public vs Private Health Insurance Coverage by Age in Coudersport borough
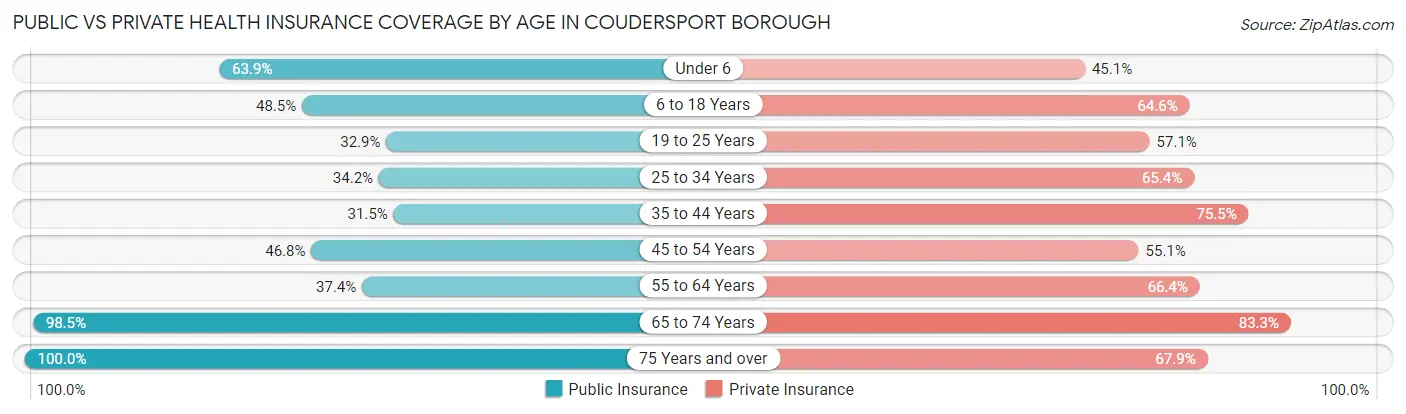
| Age Bracket | Public Insurance | Private Insurance |
| Under 6 | 92 (63.9%) | 65 (45.1%) |
| 6 to 18 Years | 130 (48.5%) | 173 (64.5%) |
| 19 to 25 Years | 69 (32.9%) | 120 (57.1%) |
| 25 to 34 Years | 89 (34.2%) | 170 (65.4%) |
| 35 to 44 Years | 63 (31.5%) | 151 (75.5%) |
| 45 to 54 Years | 124 (46.8%) | 146 (55.1%) |
| 55 to 64 Years | 158 (37.3%) | 281 (66.4%) |
| 65 to 74 Years | 325 (98.5%) | 275 (83.3%) |
| 75 Years and over | 218 (100.0%) | 148 (67.9%) |
| Total | 1,268 (54.7%) | 1,529 (66.0%) |
Disability Status by Sex by Age in Coudersport borough
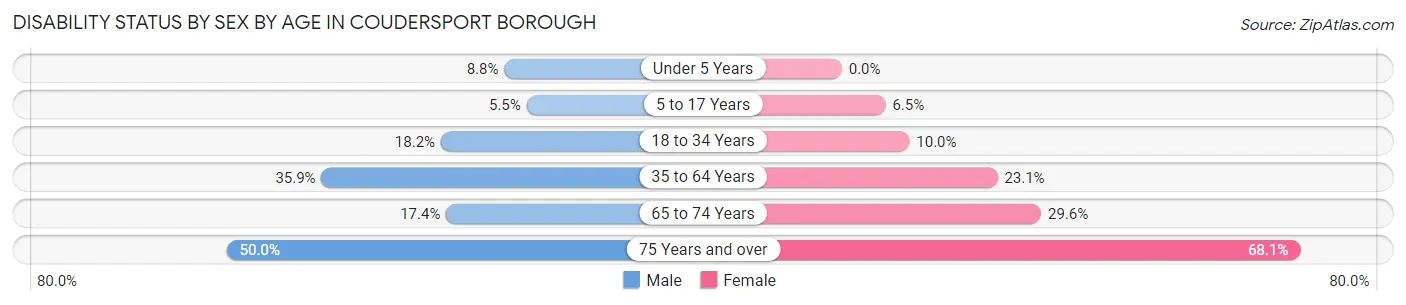
| Age Bracket | Male | Female |
| Under 5 Years | 5 (8.8%) | 0 (0.0%) |
| 5 to 17 Years | 6 (5.4%) | 12 (6.5%) |
| 18 to 34 Years | 34 (18.2%) | 30 (10.0%) |
| 35 to 64 Years | 148 (35.9%) | 110 (23.1%) |
| 65 to 74 Years | 28 (17.4%) | 50 (29.6%) |
| 75 Years and over | 37 (50.0%) | 98 (68.1%) |
Disability Class by Sex by Age in Coudersport borough
Disability Class: Hearing Difficulty
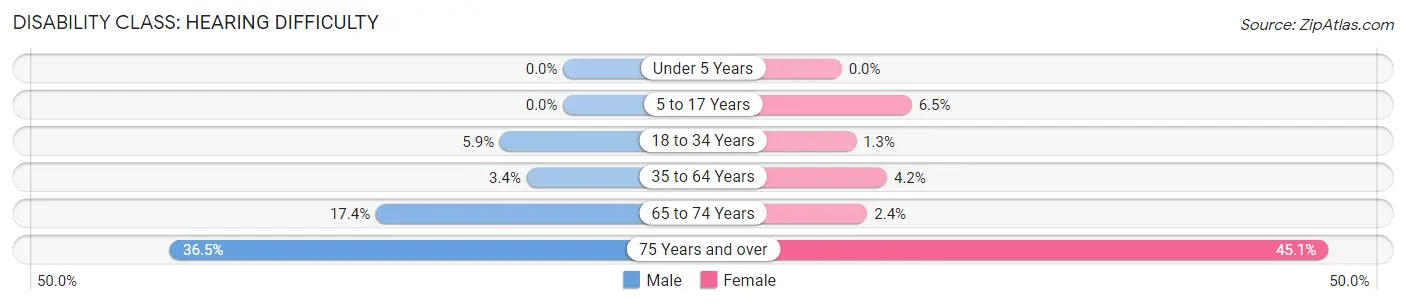
| Age Bracket | Male | Female |
| Under 5 Years | 0 (0.0%) | 0 (0.0%) |
| 5 to 17 Years | 0 (0.0%) | 12 (6.5%) |
| 18 to 34 Years | 11 (5.9%) | 4 (1.3%) |
| 35 to 64 Years | 14 (3.4%) | 20 (4.2%) |
| 65 to 74 Years | 28 (17.4%) | 4 (2.4%) |
| 75 Years and over | 27 (36.5%) | 65 (45.1%) |
Disability Class: Vision Difficulty
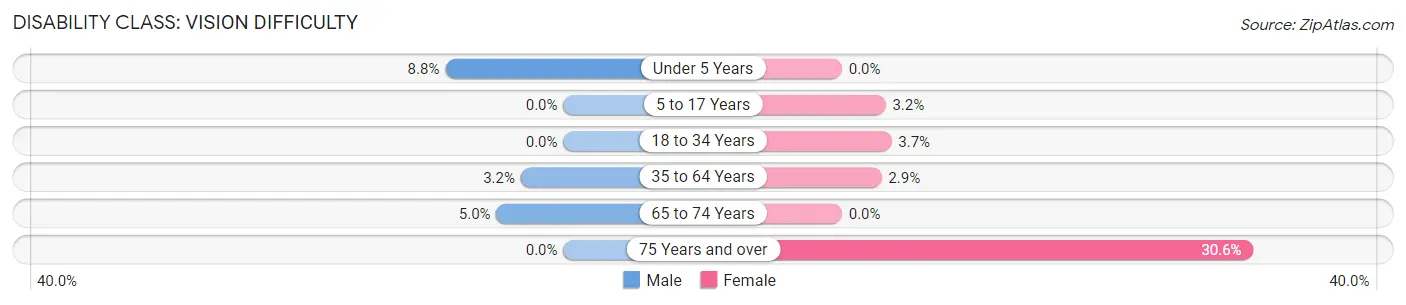
| Age Bracket | Male | Female |
| Under 5 Years | 5 (8.8%) | 0 (0.0%) |
| 5 to 17 Years | 0 (0.0%) | 6 (3.2%) |
| 18 to 34 Years | 0 (0.0%) | 11 (3.7%) |
| 35 to 64 Years | 13 (3.2%) | 14 (2.9%) |
| 65 to 74 Years | 8 (5.0%) | 0 (0.0%) |
| 75 Years and over | 0 (0.0%) | 44 (30.6%) |
Disability Class: Cognitive Difficulty
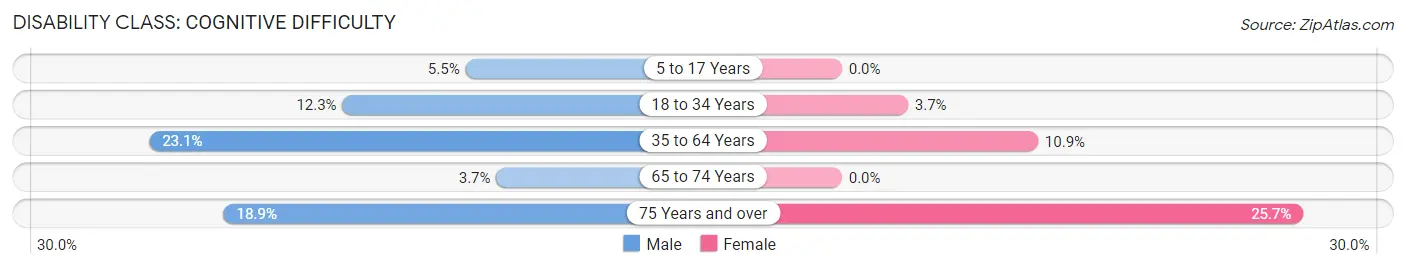
| Age Bracket | Male | Female |
| 5 to 17 Years | 6 (5.4%) | 0 (0.0%) |
| 18 to 34 Years | 23 (12.3%) | 11 (3.7%) |
| 35 to 64 Years | 95 (23.1%) | 52 (10.9%) |
| 65 to 74 Years | 6 (3.7%) | 0 (0.0%) |
| 75 Years and over | 14 (18.9%) | 37 (25.7%) |
Disability Class: Ambulatory Difficulty
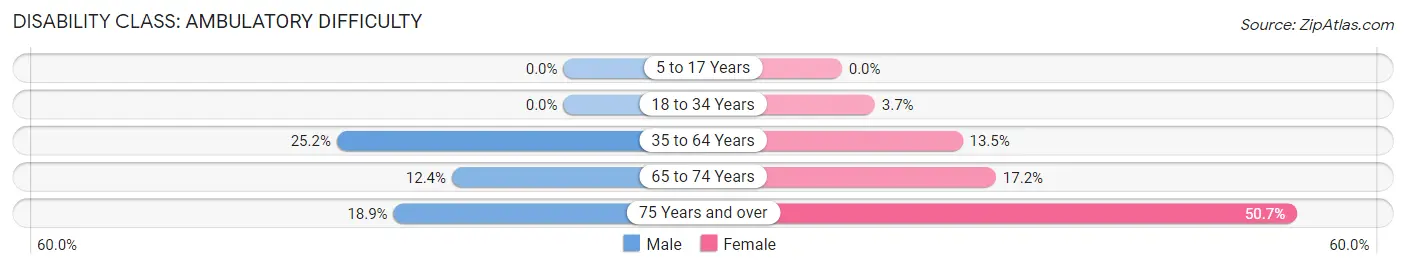
| Age Bracket | Male | Female |
| 5 to 17 Years | 0 (0.0%) | 0 (0.0%) |
| 18 to 34 Years | 0 (0.0%) | 11 (3.7%) |
| 35 to 64 Years | 104 (25.2%) | 64 (13.5%) |
| 65 to 74 Years | 20 (12.4%) | 29 (17.2%) |
| 75 Years and over | 14 (18.9%) | 73 (50.7%) |
Disability Class: Self-Care Difficulty
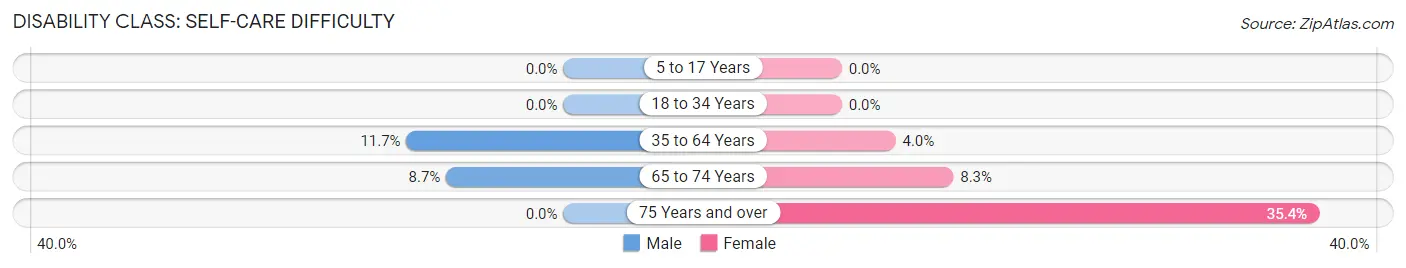
| Age Bracket | Male | Female |
| 5 to 17 Years | 0 (0.0%) | 0 (0.0%) |
| 18 to 34 Years | 0 (0.0%) | 0 (0.0%) |
| 35 to 64 Years | 48 (11.7%) | 19 (4.0%) |
| 65 to 74 Years | 14 (8.7%) | 14 (8.3%) |
| 75 Years and over | 0 (0.0%) | 51 (35.4%) |
Technology Access in Coudersport borough
Computing Device Access in Coudersport borough
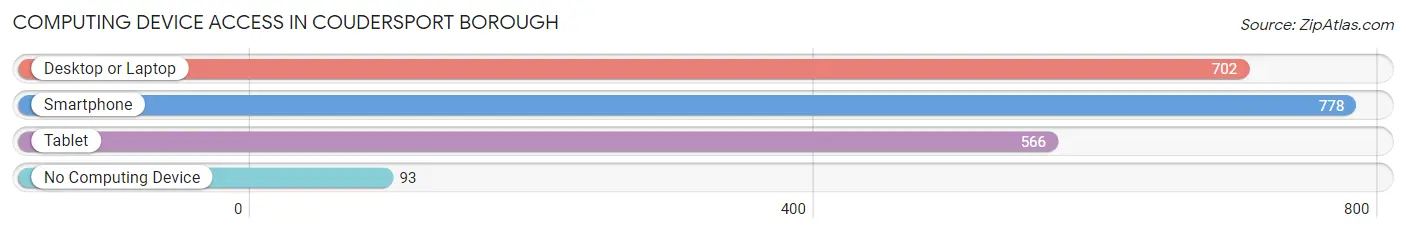
| Device Type | # Households | % Households |
| Desktop or Laptop | 702 | 69.0% |
| Smartphone | 778 | 76.4% |
| Tablet | 566 | 55.6% |
| No Computing Device | 93 | 9.1% |
| Total | 1,018 | 100.0% |
Internet Access in Coudersport borough
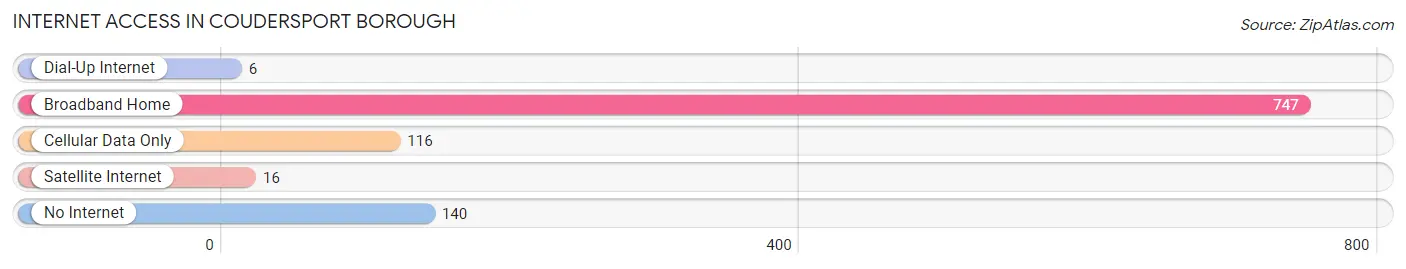
| Internet Type | # Households | % Households |
| Dial-Up Internet | 6 | 0.6% |
| Broadband Home | 747 | 73.4% |
| Cellular Data Only | 116 | 11.4% |
| Satellite Internet | 16 | 1.6% |
| No Internet | 140 | 13.8% |
| Total | 1,018 | 100.0% |
Coudersport borough Summary
Coudersport Borough is a borough located in Potter County, Pennsylvania. It is the county seat of Potter County and is located in the north-central part of the state. The population of Coudersport Borough was 2,717 at the 2010 census.
History
Coudersport Borough was founded in 1848 by William Coudersport, a lumberman from New York. He purchased the land from the Commonwealth of Pennsylvania and named the town after himself. The town was incorporated in 1851 and was the first borough in Potter County.
Coudersport was an important stop on the Underground Railroad, with many runaway slaves passing through the town on their way to freedom. The town was also a major center of the lumber industry in the late 19th and early 20th centuries.
Geography
Coudersport Borough is located at 41°45'N 77°51'W (41.75, -77.85). It is situated in the Allegheny Plateau region of Pennsylvania. The borough is located in the north-central part of the state, about 50 miles south of the New York border.
The borough is surrounded by the boroughs of Ulysses, Roulette, and Shinglehouse, as well as the townships of Hebron, Eulalia, and Oswayo. The borough is located on the Allegheny River, which flows through the center of town.
The borough has a total area of 1 2 square miles all of which is land
Economy
The economy of Coudersport Borough is largely based on the lumber industry. The borough is home to several sawmills and wood-processing plants. The borough is also home to several small businesses, including restaurants, retail stores, and service providers.
The borough is also home to a number of manufacturing companies, including a paper mill, a plastics factory, and a metal fabrication plant.
Demographics
As of the 2010 census, the population of Coudersport Borough was 2,717. The racial makeup of the borough was 97.3% White, 0.7% African American, 0.2% Native American, 0.3% Asian, 0.1% Pacific Islander, 0.3% from other races, and 1.2% from two or more races. Hispanic or Latino of any race were 1.2% of the population.
The median income for a household in the borough was $37,917, and the median income for a family was $45,000. The per capita income for the borough was $19,945. About 11.2% of families and 14.2% of the population were below the poverty line, including 19.2% of those under age 18 and 8.2% of those age 65 or over.
Common Questions
What is the Total Population of Coudersport borough?
Total Population of Coudersport borough is 2,384.
What is the Total Male Population of Coudersport borough?
Total Male Population of Coudersport borough is 1,057.
What is the Total Female Population of Coudersport borough?
Total Female Population of Coudersport borough is 1,327.
What is the Ratio of Males per 100 Females in Coudersport borough?
There are 79.65 Males per 100 Females in Coudersport borough.
What is the Ratio of Females per 100 Males in Coudersport borough?
There are 125.54 Females per 100 Males in Coudersport borough.
What is the Median Population Age in Coudersport borough?
Median Population Age in Coudersport borough is 47.4 Years.
What is the Average Family Size in Coudersport borough
Average Family Size in Coudersport borough is 3.0 People.
What is the Average Household Size in Coudersport borough
Average Household Size in Coudersport borough is 2.2 People.
What is Per Capita Income in Coudersport borough?
Per Capita income in Coudersport borough is $28,819.
What is the Median Family Income in Coudersport borough?
Median Family Income in Coudersport borough is $72,266.
What is the Median Household income in Coudersport borough?
Median Household Income in Coudersport borough is $44,881.
What is Income or Wage Gap in Coudersport borough?
Income or Wage Gap in Coudersport borough is 36.9%.
Women in Coudersport borough earn 63.1 cents for every dollar earned by a man.
What is Inequality or Gini Index in Coudersport borough?
Inequality or Gini Index in Coudersport borough is 0.41.
How Large is the Labor Force in Coudersport borough?
There are 1,045 People in the Labor Forcein in Coudersport borough.
What is the Percentage of People in the Labor Force in Coudersport borough?
51.3% of People are in the Labor Force in Coudersport borough.
What is the Unemployment Rate in Coudersport borough?
Unemployment Rate in Coudersport borough is 1.1%.