Cecil Bishop, PA
Cecil Bishop Map
Cecil Bishop Overview
2,684
TOTAL POPULATION
1,402
MALE POPULATION
1,282
FEMALE POPULATION
109.36
MALES / 100 FEMALES
91.44
FEMALES / 100 MALES
38.5
MEDIAN AGE
2.8
AVG FAMILY SIZE
2.4
AVG HOUSEHOLD SIZE
$45,603
PER CAPITA INCOME
$135,474
AVG FAMILY INCOME
$89,900
AVG HOUSEHOLD INCOME
38.5%
WAGE / INCOME GAP [ % ]
61.5¢/ $1
WAGE / INCOME GAP [ $ ]
0.38
INEQUALITY / GINI INDEX
1,552
LABOR FORCE [ PEOPLE ]
71.0%
PERCENT IN LABOR FORCE
2.7%
UNEMPLOYMENT RATE
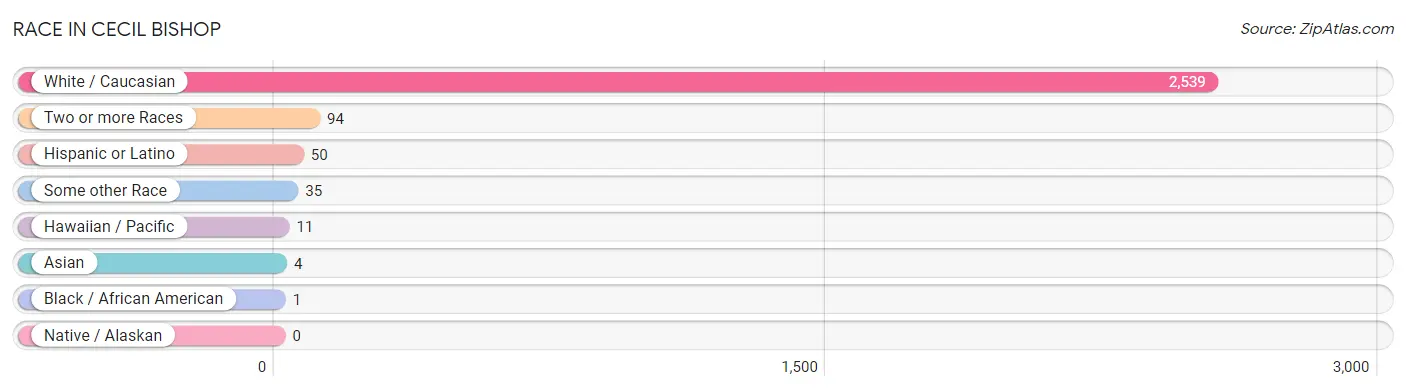
Race in Cecil Bishop
The most populous races in Cecil Bishop are White / Caucasian (2,539 | 94.6%), Two or more Races (94 | 3.5%), and Hispanic or Latino (50 | 1.9%).
| Race | # Population | % Population |
| Asian | 4 | 0.2% |
| Black / African American | 1 | 0.0% |
| Hawaiian / Pacific | 11 | 0.4% |
| Hispanic or Latino | 50 | 1.9% |
| Native / Alaskan | 0 | 0.0% |
| White / Caucasian | 2,539 | 94.6% |
| Two or more Races | 94 | 3.5% |
| Some other Race | 35 | 1.3% |
| Total | 2,684 | 100.0% |
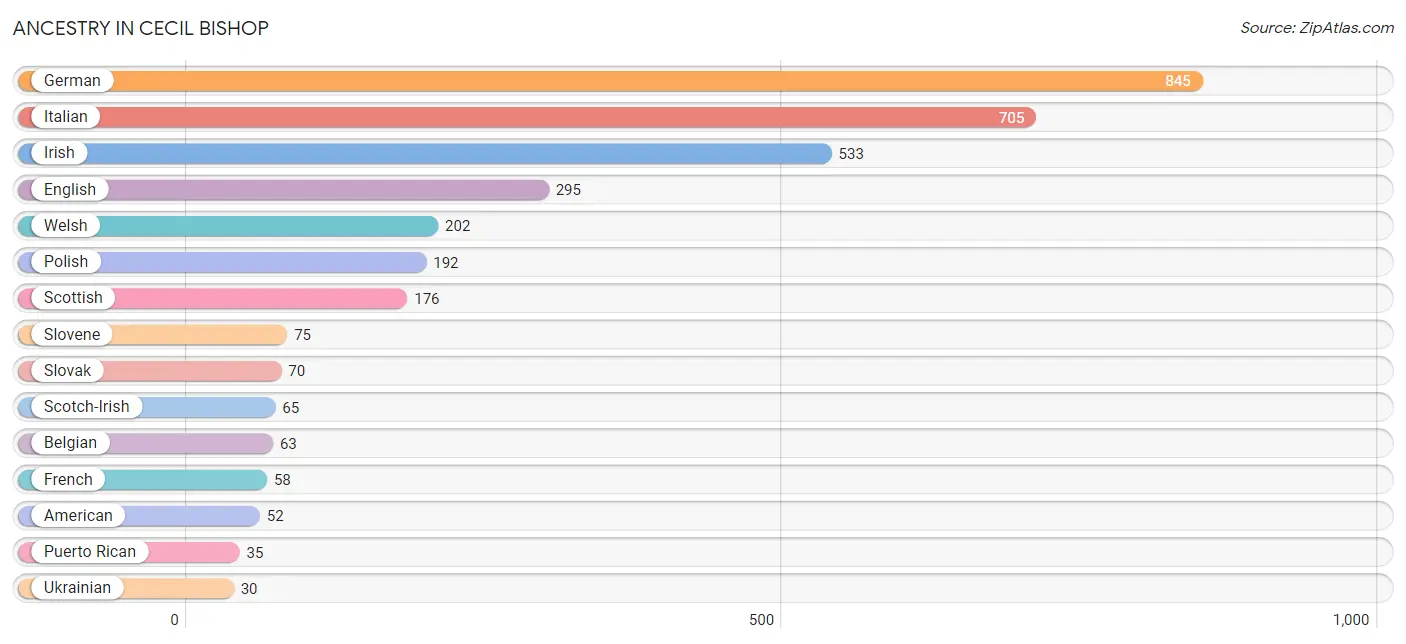
Ancestry in Cecil Bishop
The most populous ancestries reported in Cecil Bishop are German (845 | 31.5%), Italian (705 | 26.3%), Irish (533 | 19.9%), English (295 | 11.0%), and Welsh (202 | 7.5%), together accounting for 96.1% of all Cecil Bishop residents.
| Ancestry | # Population | % Population |
| American | 52 | 1.9% |
| Arab | 23 | 0.9% |
| Belgian | 63 | 2.4% |
| British | 20 | 0.7% |
| Croatian | 22 | 0.8% |
| Dutch | 10 | 0.4% |
| English | 295 | 11.0% |
| Finnish | 18 | 0.7% |
| French | 58 | 2.2% |
| French Canadian | 8 | 0.3% |
| German | 845 | 31.5% |
| Hungarian | 8 | 0.3% |
| Indian (Asian) | 16 | 0.6% |
| Irish | 533 | 19.9% |
| Italian | 705 | 26.3% |
| Lithuanian | 19 | 0.7% |
| Mexican | 15 | 0.6% |
| Polish | 192 | 7.1% |
| Puerto Rican | 35 | 1.3% |
| Russian | 28 | 1.0% |
| Scotch-Irish | 65 | 2.4% |
| Scottish | 176 | 6.6% |
| Slovak | 70 | 2.6% |
| Slovene | 75 | 2.8% |
| Swedish | 11 | 0.4% |
| Syrian | 23 | 0.9% |
| Ukrainian | 30 | 1.1% |
| Welsh | 202 | 7.5% |
| Yugoslavian | 13 | 0.5% | View All 29 Rows |
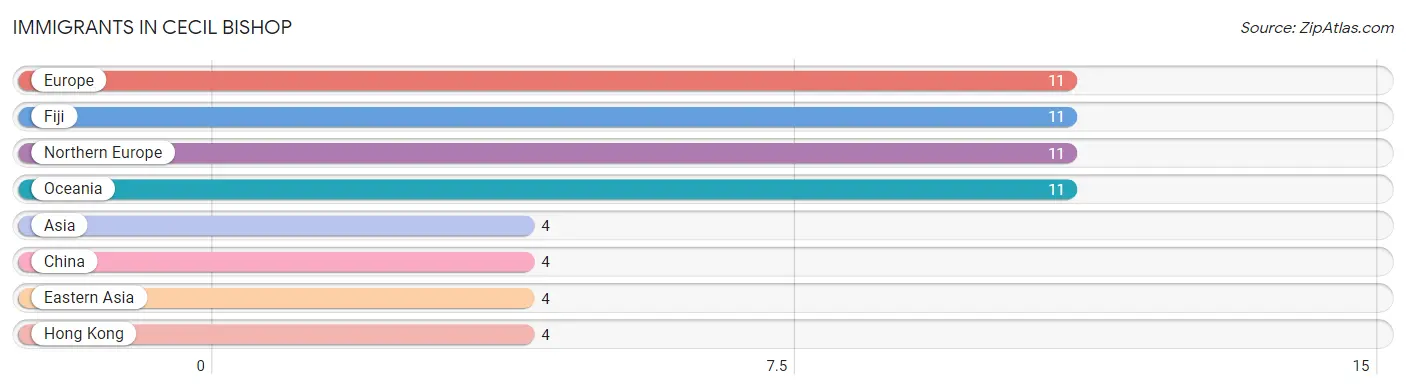
Immigrants in Cecil Bishop
The most numerous immigrant groups reported in Cecil Bishop came from Europe (11 | 0.4%), Fiji (11 | 0.4%), Northern Europe (11 | 0.4%), Oceania (11 | 0.4%), and Asia (4 | 0.2%), together accounting for 1.8% of all Cecil Bishop residents.
| Immigration Origin | # Population | % Population |
| Asia | 4 | 0.2% |
| China | 4 | 0.2% |
| Eastern Asia | 4 | 0.2% |
| Europe | 11 | 0.4% |
| Fiji | 11 | 0.4% |
| Hong Kong | 4 | 0.2% |
| Northern Europe | 11 | 0.4% |
| Oceania | 11 | 0.4% | View All 8 Rows |
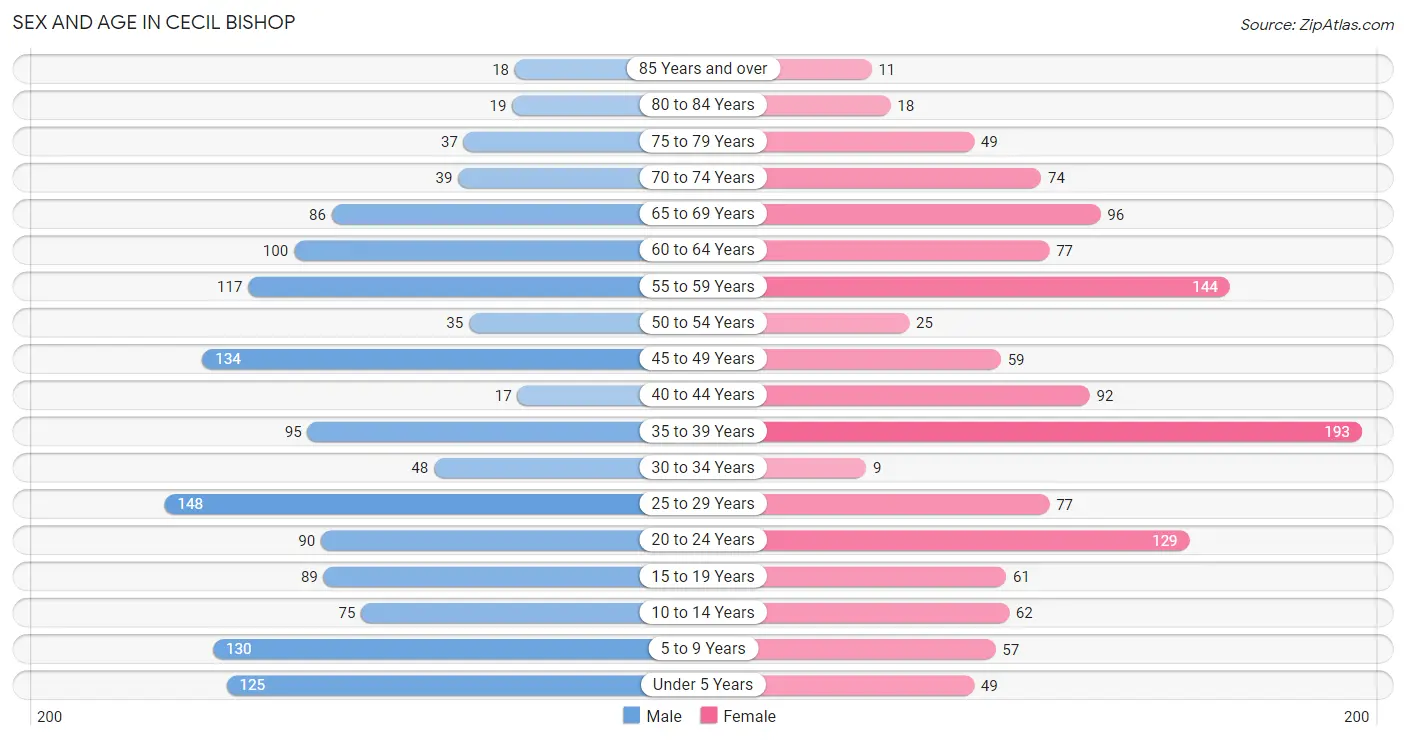
Sex and Age in Cecil Bishop
Sex and Age in Cecil Bishop
The most populous age groups in Cecil Bishop are 25 to 29 Years (148 | 10.6%) for men and 35 to 39 Years (193 | 15.0%) for women.
| Age Bracket | Male | Female |
| Under 5 Years | 125 (8.9%) | 49 (3.8%) |
| 5 to 9 Years | 130 (9.3%) | 57 (4.4%) |
| 10 to 14 Years | 75 (5.3%) | 62 (4.8%) |
| 15 to 19 Years | 89 (6.4%) | 61 (4.8%) |
| 20 to 24 Years | 90 (6.4%) | 129 (10.1%) |
| 25 to 29 Years | 148 (10.6%) | 77 (6.0%) |
| 30 to 34 Years | 48 (3.4%) | 9 (0.7%) |
| 35 to 39 Years | 95 (6.8%) | 193 (15.0%) |
| 40 to 44 Years | 17 (1.2%) | 92 (7.2%) |
| 45 to 49 Years | 134 (9.6%) | 59 (4.6%) |
| 50 to 54 Years | 35 (2.5%) | 25 (1.9%) |
| 55 to 59 Years | 117 (8.4%) | 144 (11.2%) |
| 60 to 64 Years | 100 (7.1%) | 77 (6.0%) |
| 65 to 69 Years | 86 (6.1%) | 96 (7.5%) |
| 70 to 74 Years | 39 (2.8%) | 74 (5.8%) |
| 75 to 79 Years | 37 (2.6%) | 49 (3.8%) |
| 80 to 84 Years | 19 (1.4%) | 18 (1.4%) |
| 85 Years and over | 18 (1.3%) | 11 (0.9%) |
| Total | 1,402 (100.0%) | 1,282 (100.0%) |
Families and Households in Cecil Bishop
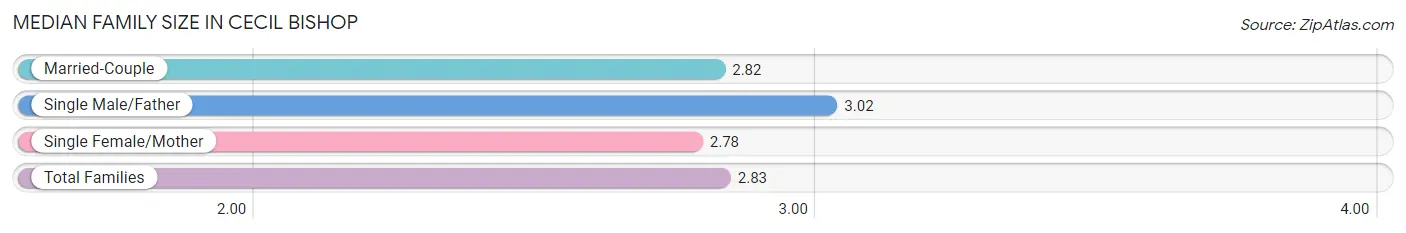
Median Family Size in Cecil Bishop
The median family size in Cecil Bishop is 2.83 persons per family, with single male/father families (41 | 5.0%) accounting for the largest median family size of 3.02 persons per family. On the other hand, single female/mother families (68 | 8.3%) represent the smallest median family size with 2.78 persons per family.
| Family Type | # Families | Family Size |
| Married-Couple | 707 (86.6%) | 2.82 |
| Single Male/Father | 41 (5.0%) | 3.02 |
| Single Female/Mother | 68 (8.3%) | 2.78 |
| Total Families | 816 (100.0%) | 2.83 |
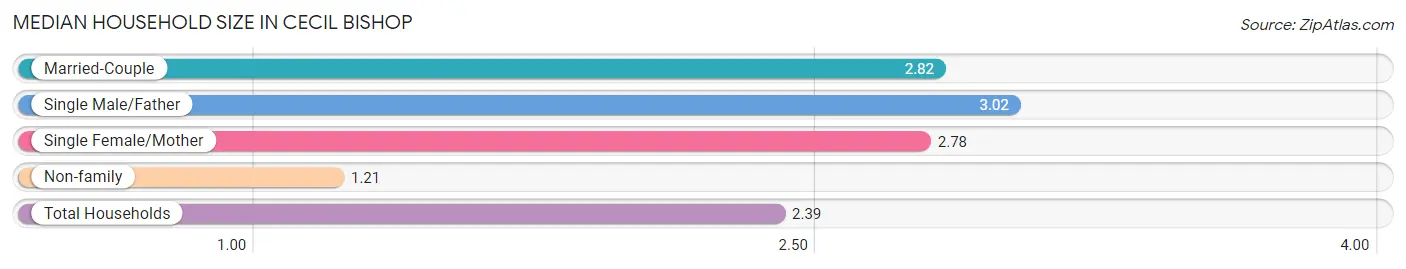
Median Household Size in Cecil Bishop
The median household size in Cecil Bishop is 2.39 persons per household, with single male/father households (41 | 3.6%) accounting for the largest median household size of 3.02 persons per household. non-family households (308 | 27.4%) represent the smallest median household size with 1.21 persons per household.
| Household Type | # Households | Household Size |
| Married-Couple | 707 (62.9%) | 2.82 |
| Single Male/Father | 41 (3.6%) | 3.02 |
| Single Female/Mother | 68 (6.0%) | 2.78 |
| Non-family | 308 (27.4%) | 1.21 |
| Total Households | 1,124 (100.0%) | 2.39 |
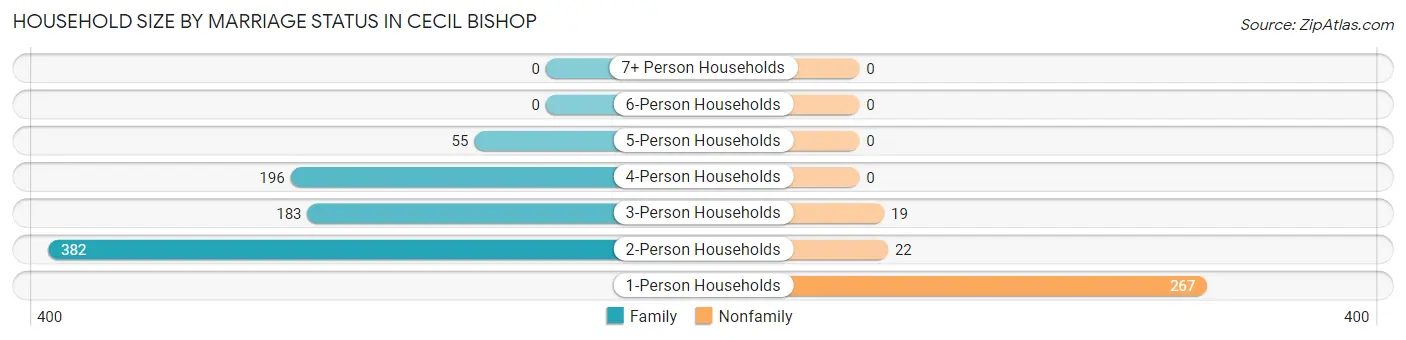
Household Size by Marriage Status in Cecil Bishop
Out of a total of 1,124 households in Cecil Bishop, 816 (72.6%) are family households, while 308 (27.4%) are nonfamily households. The most numerous type of family households are 2-person households, comprising 382, and the most common type of nonfamily households are 1-person households, comprising 267.
| Household Size | Family Households | Nonfamily Households |
| 1-Person Households | - | 267 (23.7%) |
| 2-Person Households | 382 (34.0%) | 22 (2.0%) |
| 3-Person Households | 183 (16.3%) | 19 (1.7%) |
| 4-Person Households | 196 (17.4%) | 0 (0.0%) |
| 5-Person Households | 55 (4.9%) | 0 (0.0%) |
| 6-Person Households | 0 (0.0%) | 0 (0.0%) |
| 7+ Person Households | 0 (0.0%) | 0 (0.0%) |
| Total | 816 (72.6%) | 308 (27.4%) |
Female Fertility in Cecil Bishop
Fertility by Age in Cecil Bishop
Average fertility rate in Cecil Bishop is 165.0 births per 1,000 women. Women in the age bracket of 20 to 34 years have the highest fertility rate with 474.0 births per 1,000 women. Women in the age bracket of 20 to 34 years acount for 100.0% of all women with births.
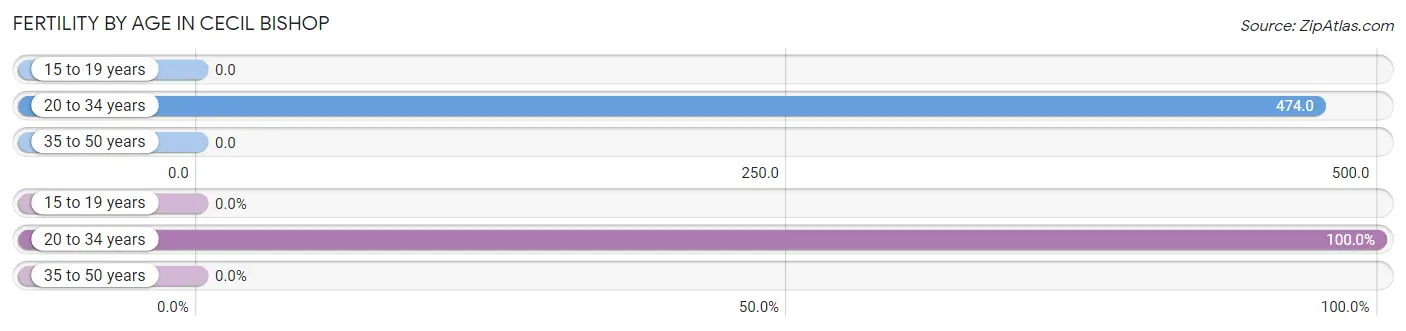
| Age Bracket | Women with Births | Births / 1,000 Women |
| 15 to 19 years | 0 (0.0%) | 0.0 |
| 20 to 34 years | 102 (100.0%) | 474.0 |
| 35 to 50 years | 0 (0.0%) | 0.0 |
| Total | 102 (100.0%) | 165.0 |
Fertility by Age by Marriage Status in Cecil Bishop
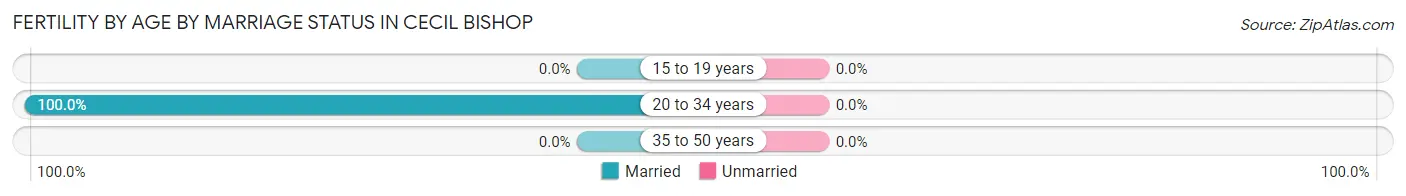
| Age Bracket | Married | Unmarried |
| 15 to 19 years | 0 (0.0%) | 0 (0.0%) |
| 20 to 34 years | 102 (100.0%) | 0 (0.0%) |
| 35 to 50 years | 0 (0.0%) | 0 (0.0%) |
| Total | 102 (100.0%) | 0 (0.0%) |
Fertility by Education in Cecil Bishop
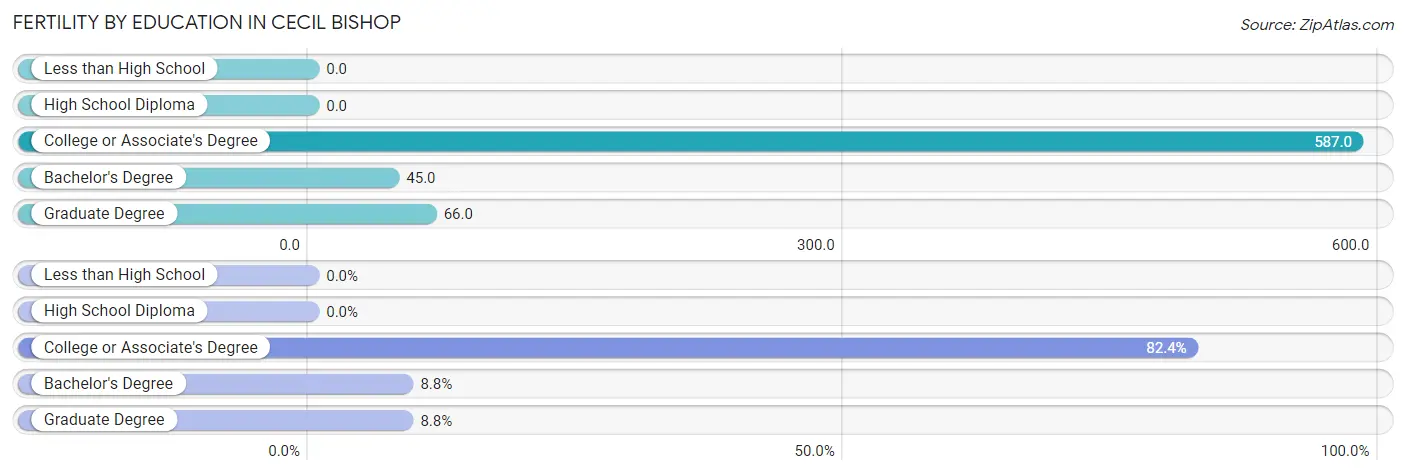
| Educational Attainment | Women with Births | Births / 1,000 Women |
| Less than High School | 0 (0.0%) | 0.0 |
| High School Diploma | 0 (0.0%) | 0.0 |
| College or Associate's Degree | 84 (82.4%) | 587.0 |
| Bachelor's Degree | 9 (8.8%) | 45.0 |
| Graduate Degree | 9 (8.8%) | 66.0 |
| Total | 102 (100.0%) | 165.0 |
Fertility by Education by Marriage Status in Cecil Bishop
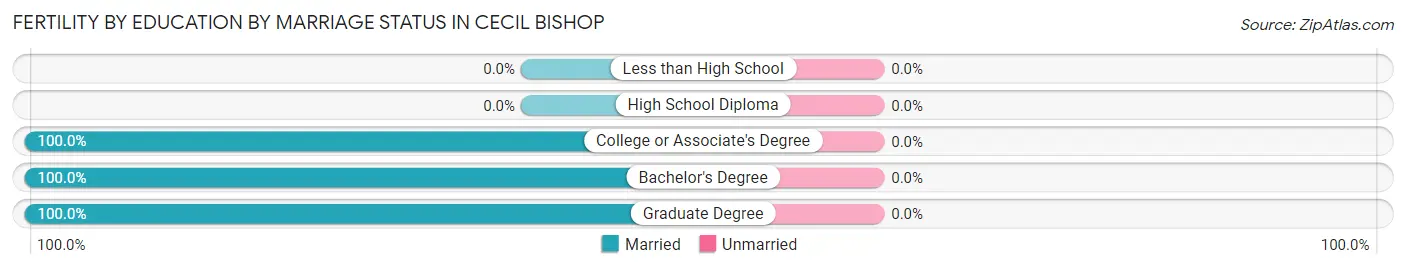
| Educational Attainment | Married | Unmarried |
| Less than High School | 0 (0.0%) | 0 (0.0%) |
| High School Diploma | 0 (0.0%) | 0 (0.0%) |
| College or Associate's Degree | 84 (100.0%) | 0 (0.0%) |
| Bachelor's Degree | 9 (100.0%) | 0 (0.0%) |
| Graduate Degree | 9 (100.0%) | 0 (0.0%) |
| Total | 102 (100.0%) | 0 (0.0%) |
Income in Cecil Bishop
Income Overview in Cecil Bishop
Per Capita Income in Cecil Bishop is $45,603, while median incomes of families and households are $135,474 and $89,900 respectively.
| Characteristic | Number | Measure |
| Per Capita Income | 2,684 | $45,603 |
| Median Family Income | 816 | $135,474 |
| Mean Family Income | 816 | $124,800 |
| Median Household Income | 1,124 | $89,900 |
| Mean Household Income | 1,124 | $111,000 |
| Income Deficit | 816 | $0 |
| Wage / Income Gap (%) | 2,684 | 38.51% |
| Wage / Income Gap ($) | 2,684 | 61.49¢ per $1 |
| Gini / Inequality Index | 2,684 | 0.38 |
Earnings by Sex in Cecil Bishop
Average Earnings in Cecil Bishop are $57,888, $66,734 for men and $41,032 for women, a difference of 38.5%.
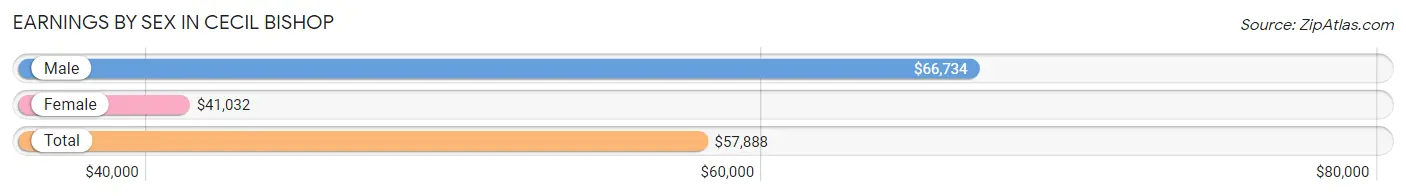
| Sex | Number | Average Earnings |
| Male | 831 (52.9%) | $66,734 |
| Female | 740 (47.1%) | $41,032 |
| Total | 1,571 (100.0%) | $57,888 |
Earnings by Sex by Income Bracket in Cecil Bishop
The most common earnings brackets in Cecil Bishop are $100,000+ for men (237 | 28.5%) and $65,000 to $74,999 for women (94 | 12.7%).
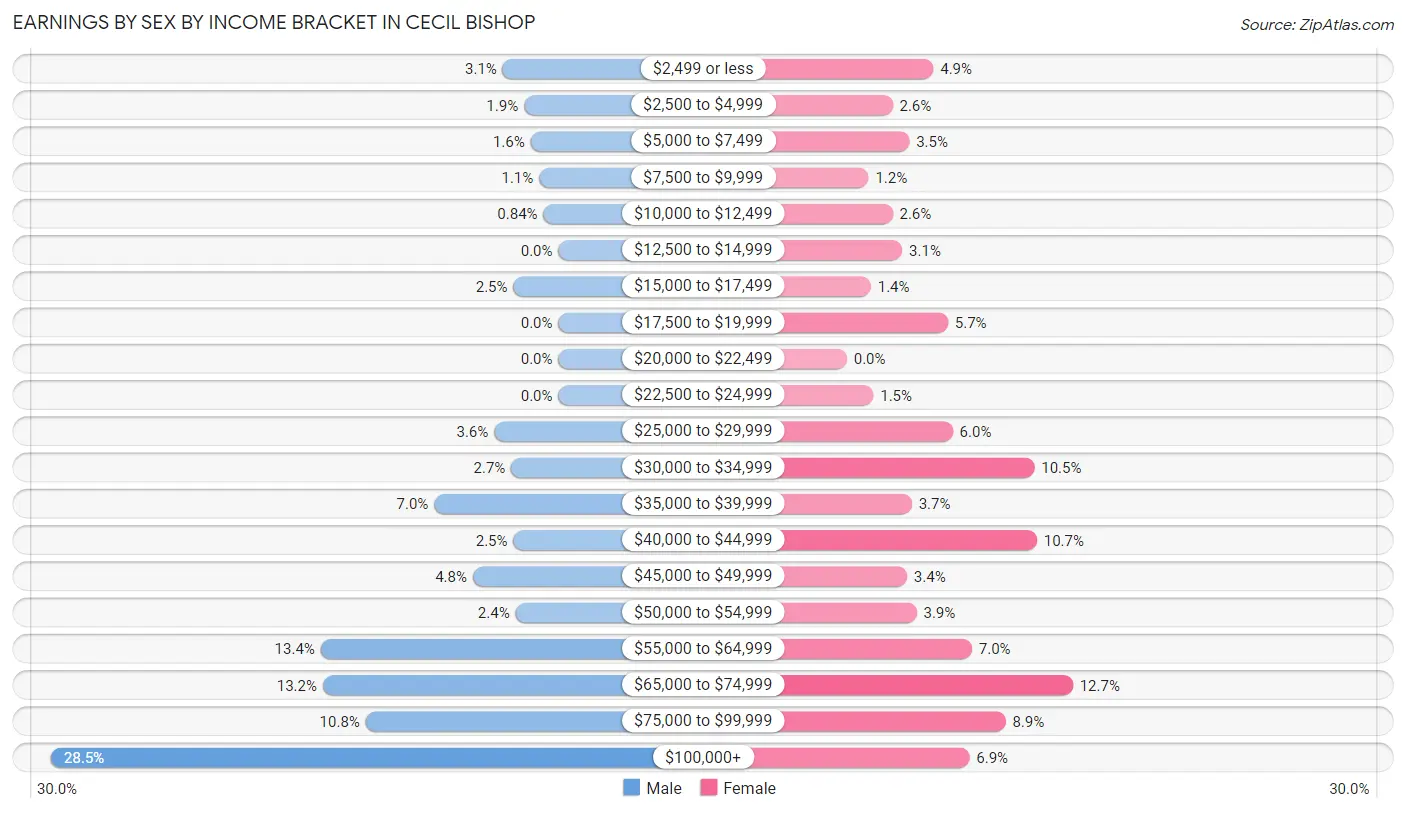
| Income | Male | Female |
| $2,499 or less | 26 (3.1%) | 36 (4.9%) |
| $2,500 to $4,999 | 16 (1.9%) | 19 (2.6%) |
| $5,000 to $7,499 | 13 (1.6%) | 26 (3.5%) |
| $7,500 to $9,999 | 9 (1.1%) | 9 (1.2%) |
| $10,000 to $12,499 | 7 (0.8%) | 19 (2.6%) |
| $12,500 to $14,999 | 0 (0.0%) | 23 (3.1%) |
| $15,000 to $17,499 | 21 (2.5%) | 10 (1.3%) |
| $17,500 to $19,999 | 0 (0.0%) | 42 (5.7%) |
| $20,000 to $22,499 | 0 (0.0%) | 0 (0.0%) |
| $22,500 to $24,999 | 0 (0.0%) | 11 (1.5%) |
| $25,000 to $29,999 | 30 (3.6%) | 44 (5.9%) |
| $30,000 to $34,999 | 22 (2.6%) | 78 (10.5%) |
| $35,000 to $39,999 | 58 (7.0%) | 27 (3.6%) |
| $40,000 to $44,999 | 21 (2.5%) | 79 (10.7%) |
| $45,000 to $49,999 | 40 (4.8%) | 25 (3.4%) |
| $50,000 to $54,999 | 20 (2.4%) | 29 (3.9%) |
| $55,000 to $64,999 | 111 (13.4%) | 52 (7.0%) |
| $65,000 to $74,999 | 110 (13.2%) | 94 (12.7%) |
| $75,000 to $99,999 | 90 (10.8%) | 66 (8.9%) |
| $100,000+ | 237 (28.5%) | 51 (6.9%) |
| Total | 831 (100.0%) | 740 (100.0%) |
Earnings by Sex by Educational Attainment in Cecil Bishop
Average earnings in Cecil Bishop are $71,793 for men and $40,258 for women, a difference of 43.9%. Men with an educational attainment of bachelor's degree enjoy the highest average annual earnings of $101,078, while those with less than high school education earn the least with $36,250. Women with an educational attainment of bachelor's degree earn the most with the average annual earnings of $41,302, while those with college or associate's degree education have the smallest earnings of $30,911.
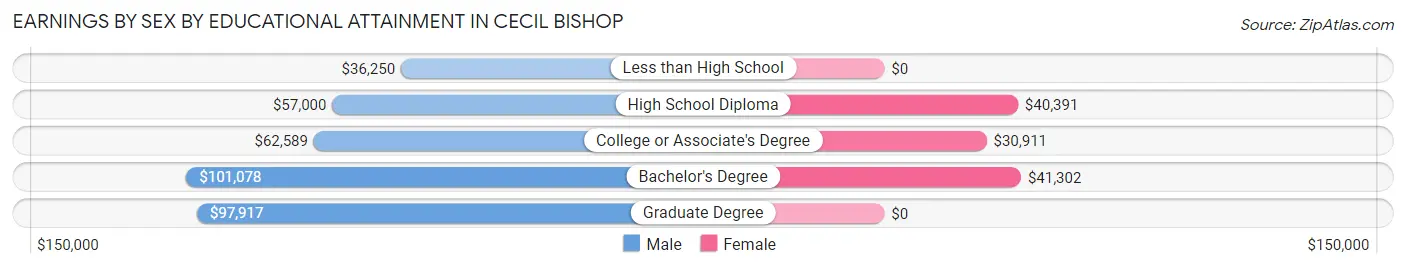
| Educational Attainment | Male Income | Female Income |
| Less than High School | $36,250 | $0 |
| High School Diploma | $57,000 | $40,391 |
| College or Associate's Degree | $62,589 | $30,911 |
| Bachelor's Degree | $101,078 | $41,302 |
| Graduate Degree | $97,917 | $0 |
| Total | $71,793 | $40,258 |
Family Income in Cecil Bishop
Family Income Brackets in Cecil Bishop
According to the Cecil Bishop family income data, there are 276 families falling into the $100,000 to $149,999 income range, which is the most common income bracket and makes up 33.8% of all families.
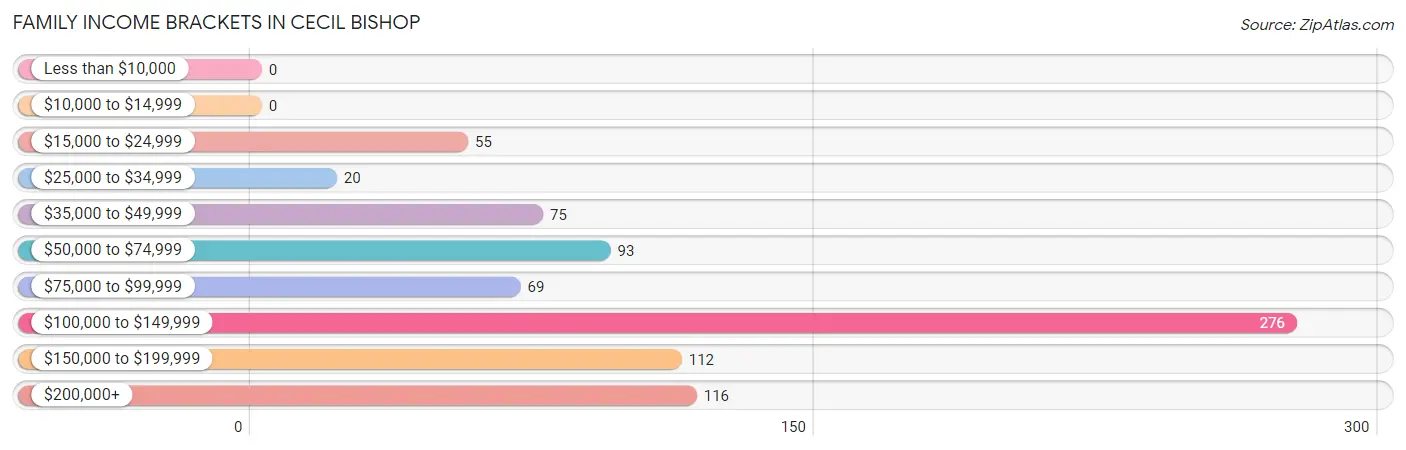
| Income Bracket | # Families | % Families |
| Less than $10,000 | 0 | 0.0% |
| $10,000 to $14,999 | 0 | 0.0% |
| $15,000 to $24,999 | 55 | 6.7% |
| $25,000 to $34,999 | 20 | 2.5% |
| $35,000 to $49,999 | 75 | 9.2% |
| $50,000 to $74,999 | 93 | 11.4% |
| $75,000 to $99,999 | 69 | 8.5% |
| $100,000 to $149,999 | 276 | 33.8% |
| $150,000 to $199,999 | 112 | 13.7% |
| $200,000+ | 116 | 14.2% |
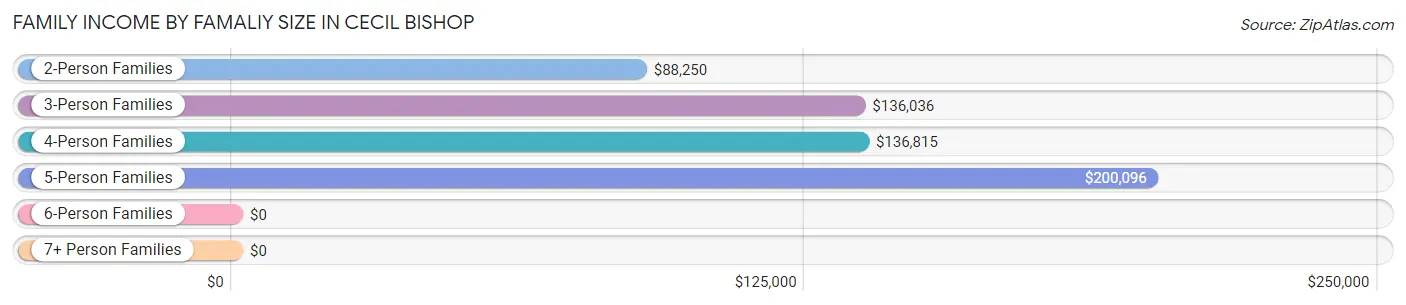
Family Income by Famaliy Size in Cecil Bishop
5-person families (55 | 6.7%) account for the highest median family income in Cecil Bishop with $200,096 per family, while 3-person families (183 | 22.4%) have the highest median income of $45,345 per family member.
| Income Bracket | # Families | Median Income |
| 2-Person Families | 382 (46.8%) | $88,250 |
| 3-Person Families | 183 (22.4%) | $136,036 |
| 4-Person Families | 196 (24.0%) | $136,815 |
| 5-Person Families | 55 (6.7%) | $200,096 |
| 6-Person Families | 0 (0.0%) | $0 |
| 7+ Person Families | 0 (0.0%) | $0 |
| Total | 816 (100.0%) | $135,474 |
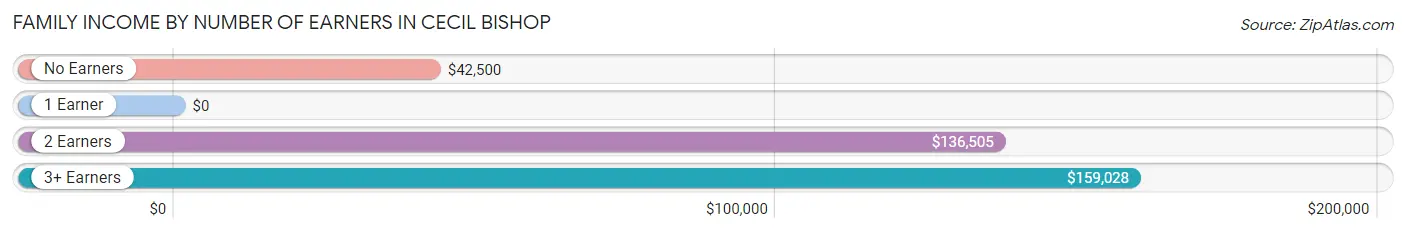
Family Income by Number of Earners in Cecil Bishop
| Number of Earners | # Families | Median Income |
| No Earners | 104 (12.8%) | $42,500 |
| 1 Earner | 233 (28.5%) | $0 |
| 2 Earners | 404 (49.5%) | $136,505 |
| 3+ Earners | 75 (9.2%) | $159,028 |
| Total | 816 (100.0%) | $135,474 |
Household Income in Cecil Bishop
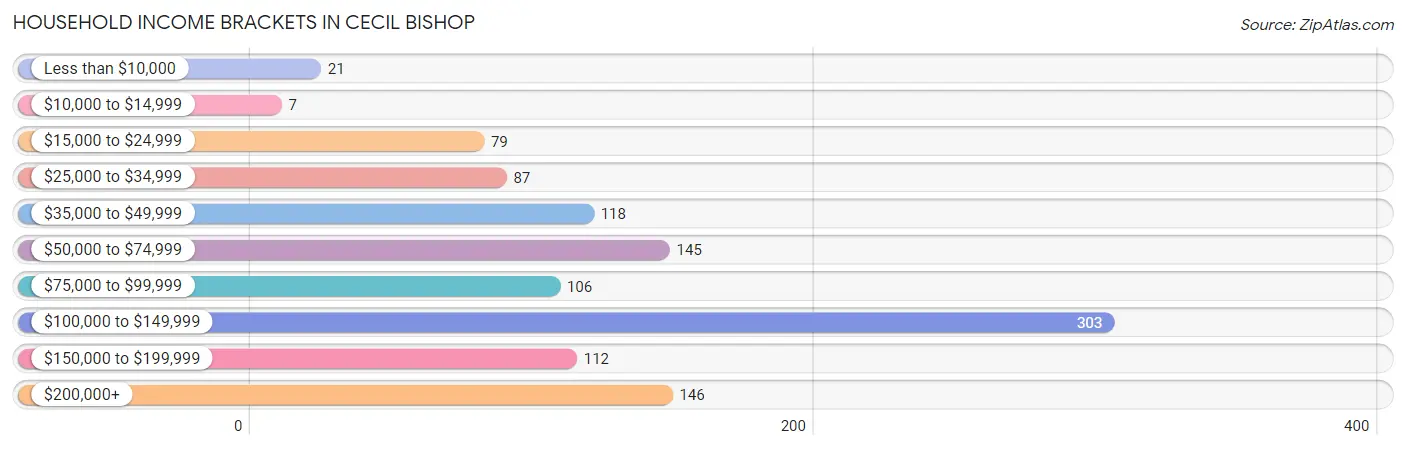
Household Income Brackets in Cecil Bishop
With 303 households falling in the category, the $100,000 to $149,999 income range is the most frequent in Cecil Bishop, accounting for 27.0% of all households. In contrast, only 7 households (0.6%) fall into the $10,000 to $14,999 income bracket, making it the least populous group.
| Income Bracket | # Households | % Households |
| Less than $10,000 | 21 | 1.9% |
| $10,000 to $14,999 | 7 | 0.6% |
| $15,000 to $24,999 | 79 | 7.0% |
| $25,000 to $34,999 | 87 | 7.7% |
| $35,000 to $49,999 | 118 | 10.5% |
| $50,000 to $74,999 | 145 | 12.9% |
| $75,000 to $99,999 | 106 | 9.4% |
| $100,000 to $149,999 | 303 | 27.0% |
| $150,000 to $199,999 | 112 | 10.0% |
| $200,000+ | 146 | 13.0% |
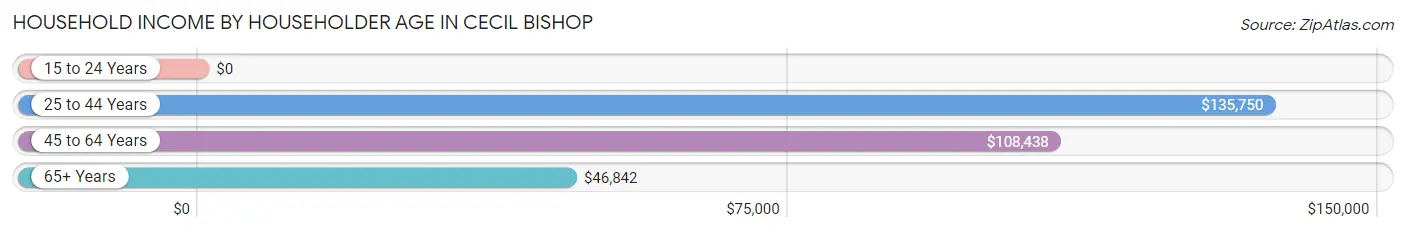
Household Income by Householder Age in Cecil Bishop
The median household income in Cecil Bishop is $89,900, with the highest median household income of $135,750 found in the 25 to 44 years age bracket for the primary householder. A total of 371 households (33.0%) fall into this category. Meanwhile, the 15 to 24 years age bracket for the primary householder has the lowest median household income of $0, with 97 households (8.6%) in this group.
| Income Bracket | # Households | Median Income |
| 15 to 24 Years | 97 (8.6%) | $0 |
| 25 to 44 Years | 371 (33.0%) | $135,750 |
| 45 to 64 Years | 352 (31.3%) | $108,438 |
| 65+ Years | 304 (27.1%) | $46,842 |
| Total | 1,124 (100.0%) | $89,900 |
Poverty in Cecil Bishop
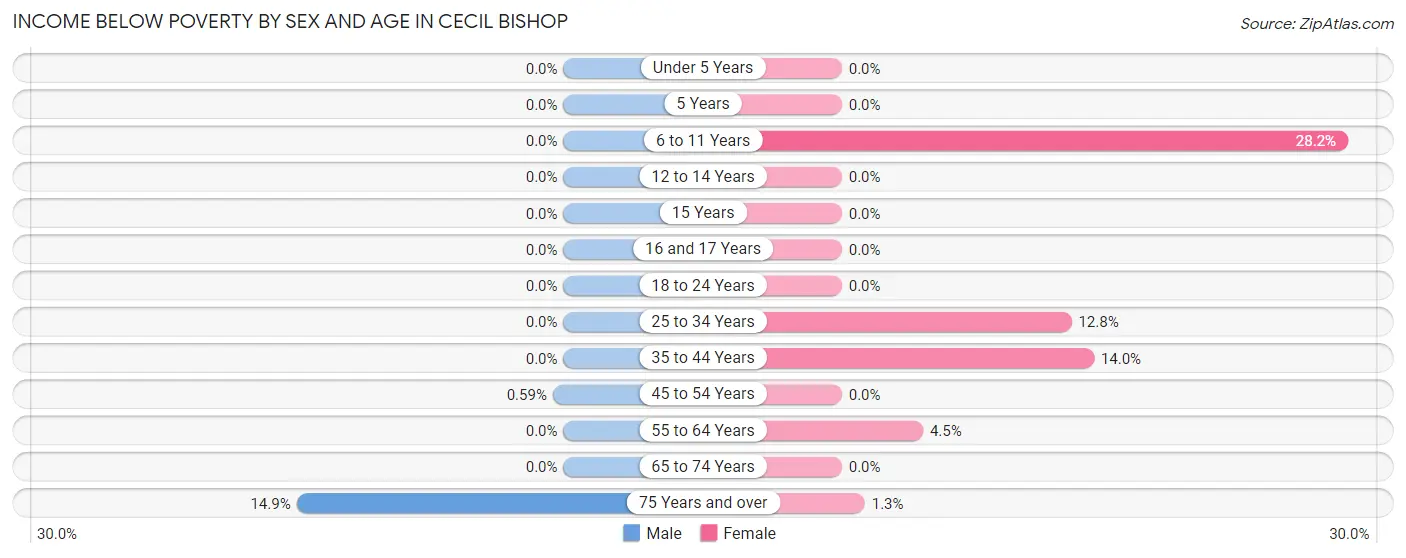
Income Below Poverty by Sex and Age in Cecil Bishop
With 0.9% poverty level for males and 7.2% for females among the residents of Cecil Bishop, 75 year old and over males and 6 to 11 year old females are the most vulnerable to poverty, with 11 males (14.9%) and 31 females (28.2%) in their respective age groups living below the poverty level.
| Age Bracket | Male | Female |
| Under 5 Years | 0 (0.0%) | 0 (0.0%) |
| 5 Years | 0 (0.0%) | 0 (0.0%) |
| 6 to 11 Years | 0 (0.0%) | 31 (28.2%) |
| 12 to 14 Years | 0 (0.0%) | 0 (0.0%) |
| 15 Years | 0 (0.0%) | 0 (0.0%) |
| 16 and 17 Years | 0 (0.0%) | 0 (0.0%) |
| 18 to 24 Years | 0 (0.0%) | 0 (0.0%) |
| 25 to 34 Years | 0 (0.0%) | 11 (12.8%) |
| 35 to 44 Years | 0 (0.0%) | 40 (14.0%) |
| 45 to 54 Years | 1 (0.6%) | 0 (0.0%) |
| 55 to 64 Years | 0 (0.0%) | 10 (4.5%) |
| 65 to 74 Years | 0 (0.0%) | 0 (0.0%) |
| 75 Years and over | 11 (14.9%) | 1 (1.3%) |
| Total | 12 (0.9%) | 93 (7.2%) |
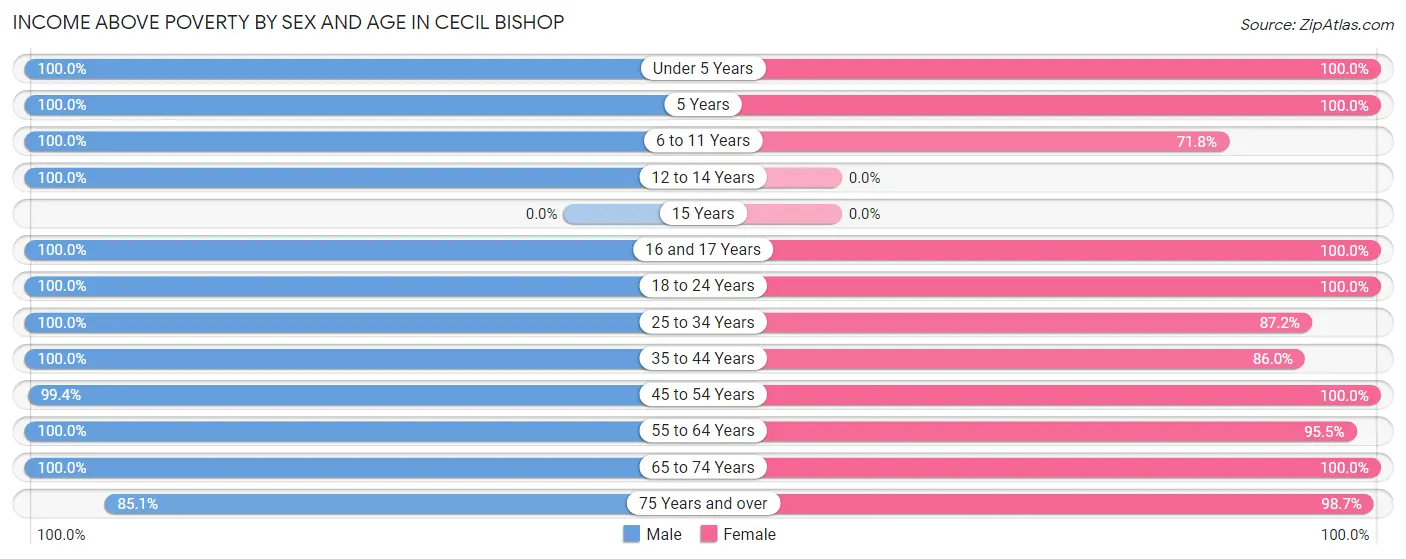
Income Above Poverty by Sex and Age in Cecil Bishop
According to the poverty statistics in Cecil Bishop, males aged under 5 years and females aged under 5 years are the age groups that are most secure financially, with 100.0% of males and 100.0% of females in these age groups living above the poverty line.
| Age Bracket | Male | Female |
| Under 5 Years | 125 (100.0%) | 49 (100.0%) |
| 5 Years | 41 (100.0%) | 9 (100.0%) |
| 6 to 11 Years | 126 (100.0%) | 79 (71.8%) |
| 12 to 14 Years | 38 (100.0%) | 0 (0.0%) |
| 15 Years | 0 (0.0%) | 0 (0.0%) |
| 16 and 17 Years | 61 (100.0%) | 61 (100.0%) |
| 18 to 24 Years | 118 (100.0%) | 129 (100.0%) |
| 25 to 34 Years | 196 (100.0%) | 75 (87.2%) |
| 35 to 44 Years | 112 (100.0%) | 245 (86.0%) |
| 45 to 54 Years | 168 (99.4%) | 84 (100.0%) |
| 55 to 64 Years | 217 (100.0%) | 211 (95.5%) |
| 65 to 74 Years | 125 (100.0%) | 170 (100.0%) |
| 75 Years and over | 63 (85.1%) | 77 (98.7%) |
| Total | 1,390 (99.1%) | 1,189 (92.7%) |
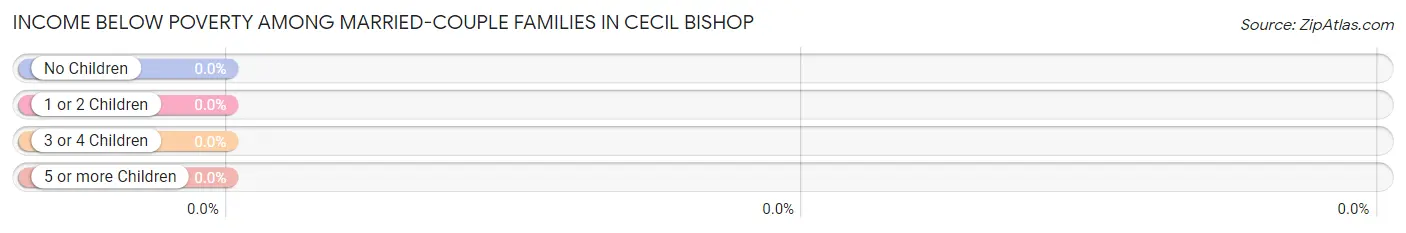
Income Below Poverty Among Married-Couple Families in Cecil Bishop
| Children | Above Poverty | Below Poverty |
| No Children | 418 (100.0%) | 0 (0.0%) |
| 1 or 2 Children | 249 (100.0%) | 0 (0.0%) |
| 3 or 4 Children | 40 (100.0%) | 0 (0.0%) |
| 5 or more Children | 0 (0.0%) | 0 (0.0%) |
| Total | 707 (100.0%) | 0 (0.0%) |
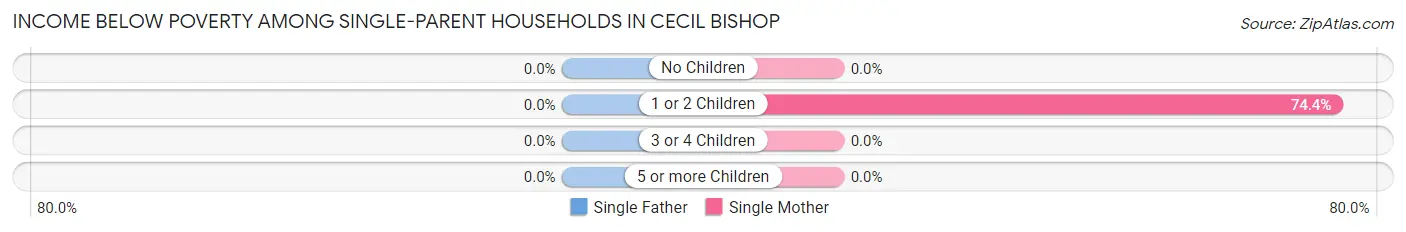
Income Below Poverty Among Single-Parent Households in Cecil Bishop
| Children | Single Father | Single Mother |
| No Children | 0 (0.0%) | 0 (0.0%) |
| 1 or 2 Children | 0 (0.0%) | 32 (74.4%) |
| 3 or 4 Children | 0 (0.0%) | 0 (0.0%) |
| 5 or more Children | 0 (0.0%) | 0 (0.0%) |
| Total | 0 (0.0%) | 32 (47.1%) |
Income Below Poverty Among Married-Couple vs Single-Parent Households in Cecil Bishop
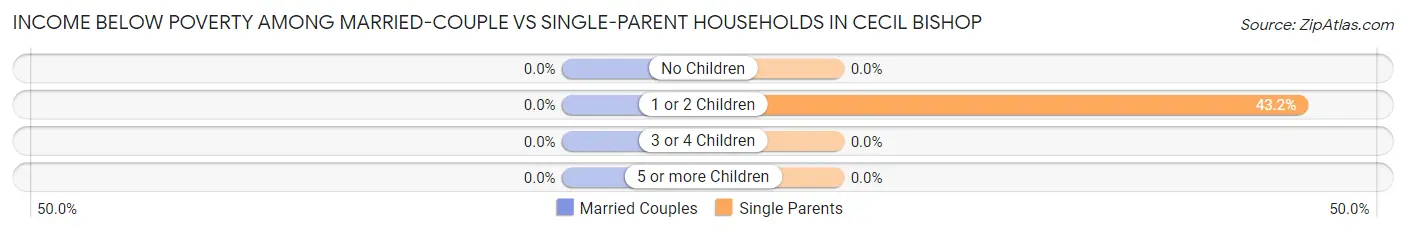
| Children | Married-Couple Families | Single-Parent Households |
| No Children | 0 (0.0%) | 0 (0.0%) |
| 1 or 2 Children | 0 (0.0%) | 32 (43.2%) |
| 3 or 4 Children | 0 (0.0%) | 0 (0.0%) |
| 5 or more Children | 0 (0.0%) | 0 (0.0%) |
| Total | 0 (0.0%) | 32 (29.4%) |
Employment Characteristics in Cecil Bishop
Employment by Class of Employer in Cecil Bishop
Among the 1,469 employed individuals in Cecil Bishop, private company employees (1,070 | 72.8%), self-employed (not incorporated) (129 | 8.8%), and self-employed (incorporated) (86 | 5.9%) make up the most common classes of employment.
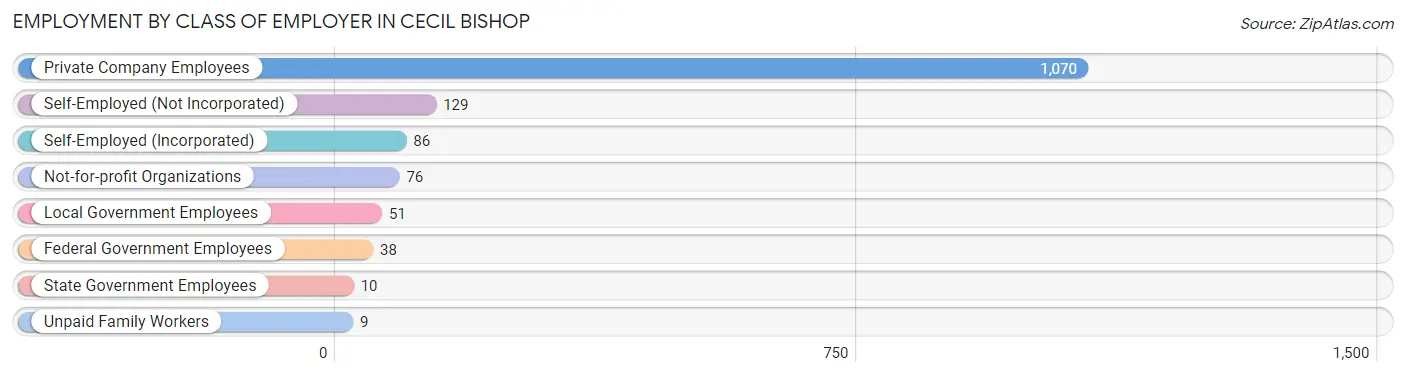
| Employer Class | # Employees | % Employees |
| Private Company Employees | 1,070 | 72.8% |
| Self-Employed (Incorporated) | 86 | 5.9% |
| Self-Employed (Not Incorporated) | 129 | 8.8% |
| Not-for-profit Organizations | 76 | 5.2% |
| Local Government Employees | 51 | 3.5% |
| State Government Employees | 10 | 0.7% |
| Federal Government Employees | 38 | 2.6% |
| Unpaid Family Workers | 9 | 0.6% |
| Total | 1,469 | 100.0% |
Employment Status by Age in Cecil Bishop
According to the labor force statistics for Cecil Bishop, out of the total population over 16 years of age (2,186), 71.0% or 1,552 individuals are in the labor force, with 2.7% or 42 of them unemployed. The age group with the highest labor force participation rate is 20 to 24 years, with 100.0% or 219 individuals in the labor force. Within the labor force, the 75 years and over age range has the highest percentage of unemployed individuals, with 100.0% or 9 of them being unemployed.
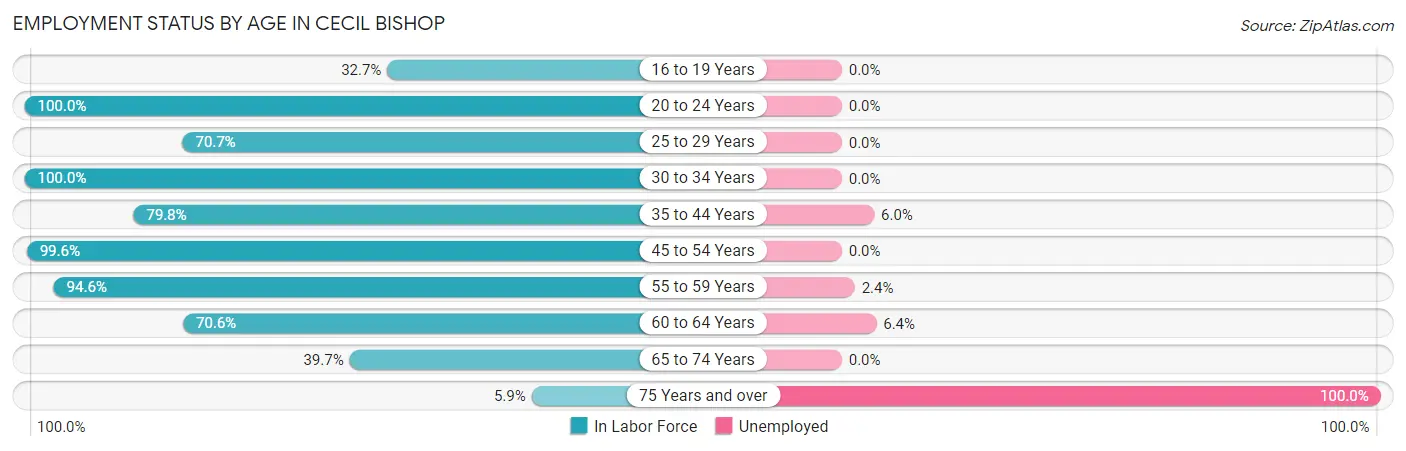
| Age Bracket | In Labor Force | Unemployed |
| 16 to 19 Years | 49 (32.7%) | 0 (0.0%) |
| 20 to 24 Years | 219 (100.0%) | 0 (0.0%) |
| 25 to 29 Years | 159 (70.7%) | 0 (0.0%) |
| 30 to 34 Years | 57 (100.0%) | 0 (0.0%) |
| 35 to 44 Years | 317 (79.8%) | 19 (6.0%) |
| 45 to 54 Years | 252 (99.6%) | 0 (0.0%) |
| 55 to 59 Years | 247 (94.6%) | 6 (2.4%) |
| 60 to 64 Years | 125 (70.6%) | 8 (6.4%) |
| 65 to 74 Years | 117 (39.7%) | 0 (0.0%) |
| 75 Years and over | 9 (5.9%) | 9 (100.0%) |
| Total | 1,552 (71.0%) | 42 (2.7%) |
Employment Status by Educational Attainment in Cecil Bishop
According to labor force statistics for Cecil Bishop, 84.5% of individuals (1,158) out of the total population between 25 and 64 years of age (1,370) are in the labor force, with 2.9% or 34 of them being unemployed. The group with the highest labor force participation rate are those with the educational attainment of less than high school, with 97.1% or 34 individuals in the labor force. Within the labor force, individuals with bachelor's degree or higher education have the highest percentage of unemployment, with 4.3% or 25 of them being unemployed.
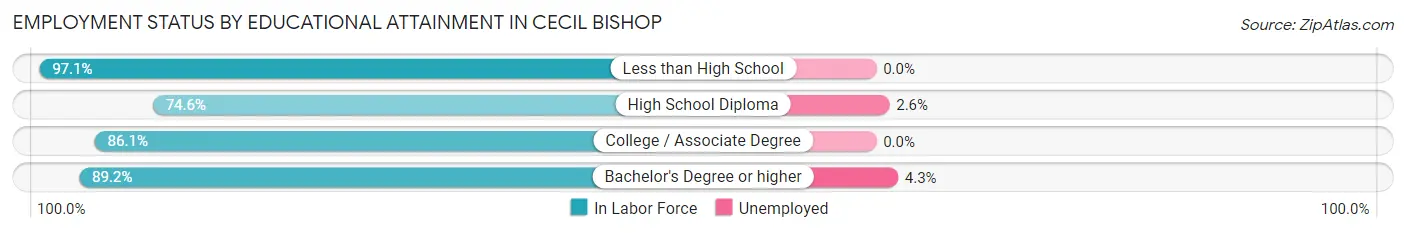
| Educational Attainment | In Labor Force | Unemployed |
| Less than High School | 34 (97.1%) | 0 (0.0%) |
| High School Diploma | 306 (74.6%) | 11 (2.6%) |
| College / Associate Degree | 236 (86.1%) | 0 (0.0%) |
| Bachelor's Degree or higher | 581 (89.2%) | 28 (4.3%) |
| Total | 1,158 (84.5%) | 40 (2.9%) |
Employment Occupations by Sex in Cecil Bishop
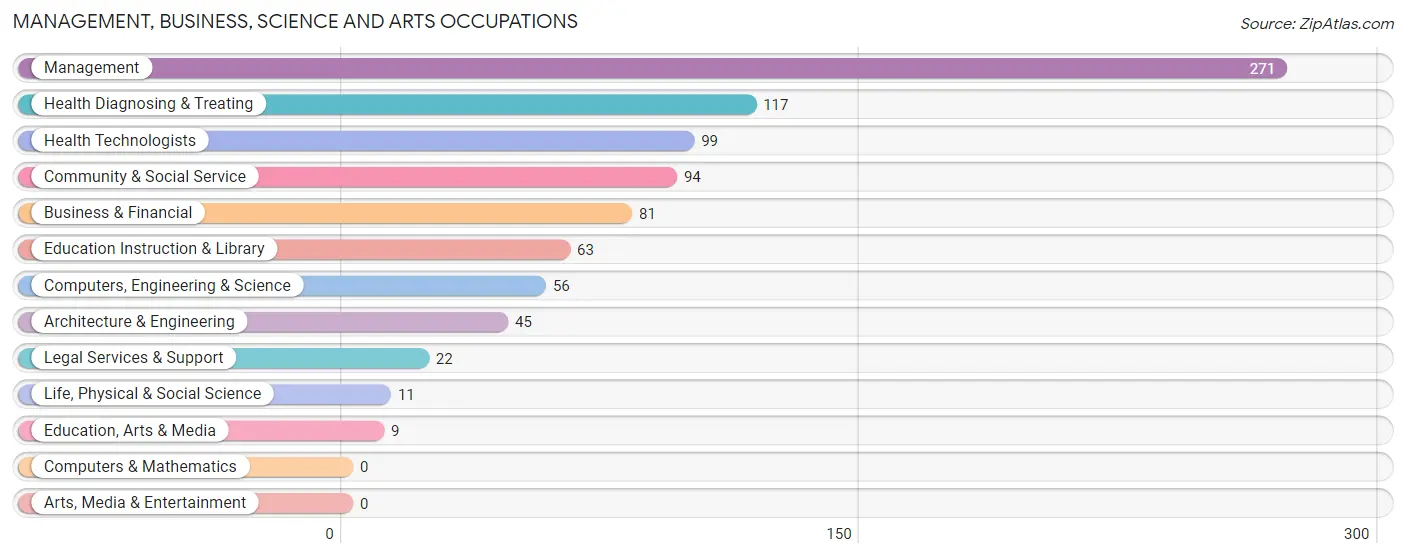
Management, Business, Science and Arts Occupations
The most common Management, Business, Science and Arts occupations in Cecil Bishop are Management (271 | 18.0%), Health Diagnosing & Treating (117 | 7.7%), Health Technologists (99 | 6.6%), Community & Social Service (94 | 6.2%), and Business & Financial (81 | 5.4%).
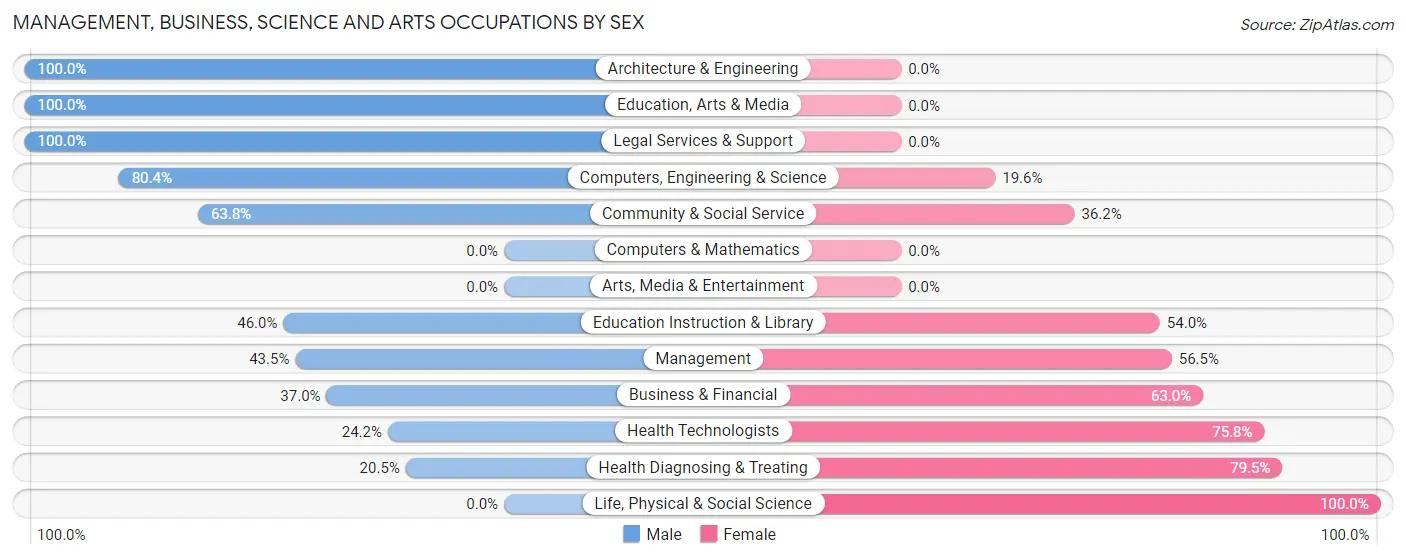
Management, Business, Science and Arts Occupations by Sex
Within the Management, Business, Science and Arts occupations in Cecil Bishop, the most male-oriented occupations are Architecture & Engineering (100.0%), Education, Arts & Media (100.0%), and Legal Services & Support (100.0%), while the most female-oriented occupations are Life, Physical & Social Science (100.0%), Health Diagnosing & Treating (79.5%), and Health Technologists (75.8%).
| Occupation | Male | Female |
| Management | 118 (43.5%) | 153 (56.5%) |
| Business & Financial | 30 (37.0%) | 51 (63.0%) |
| Computers, Engineering & Science | 45 (80.4%) | 11 (19.6%) |
| Computers & Mathematics | 0 (0.0%) | 0 (0.0%) |
| Architecture & Engineering | 45 (100.0%) | 0 (0.0%) |
| Life, Physical & Social Science | 0 (0.0%) | 11 (100.0%) |
| Community & Social Service | 60 (63.8%) | 34 (36.2%) |
| Education, Arts & Media | 9 (100.0%) | 0 (0.0%) |
| Legal Services & Support | 22 (100.0%) | 0 (0.0%) |
| Education Instruction & Library | 29 (46.0%) | 34 (54.0%) |
| Arts, Media & Entertainment | 0 (0.0%) | 0 (0.0%) |
| Health Diagnosing & Treating | 24 (20.5%) | 93 (79.5%) |
| Health Technologists | 24 (24.2%) | 75 (75.8%) |
| Total (Category) | 277 (44.8%) | 342 (55.2%) |
| Total (Overall) | 811 (53.7%) | 698 (46.3%) |
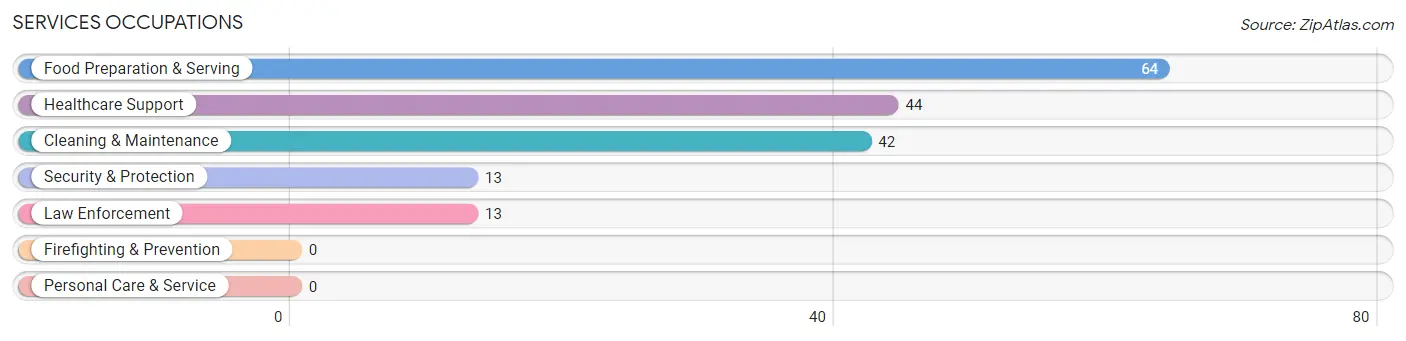
Services Occupations
The most common Services occupations in Cecil Bishop are Food Preparation & Serving (64 | 4.2%), Healthcare Support (44 | 2.9%), Cleaning & Maintenance (42 | 2.8%), Security & Protection (13 | 0.9%), and Law Enforcement (13 | 0.9%).
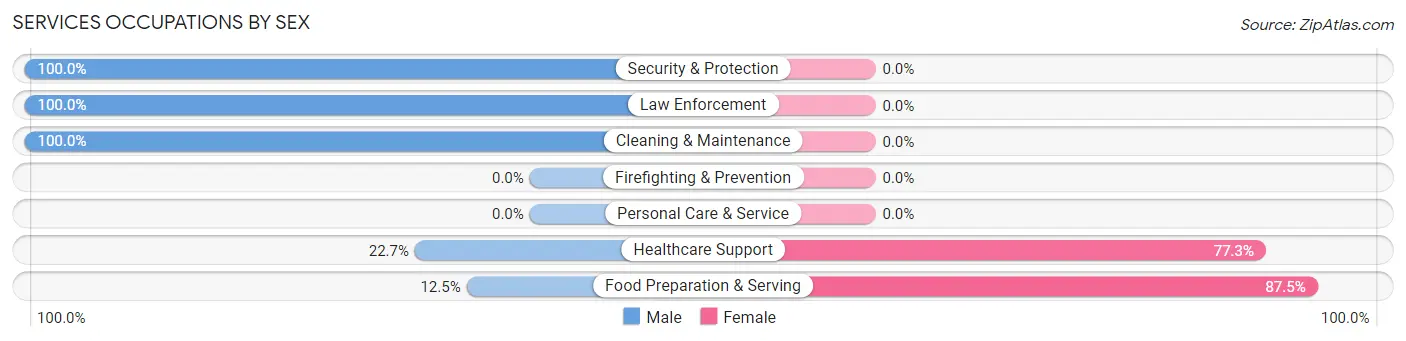
Services Occupations by Sex
Within the Services occupations in Cecil Bishop, the most male-oriented occupations are Security & Protection (100.0%), Law Enforcement (100.0%), and Cleaning & Maintenance (100.0%), while the most female-oriented occupations are Food Preparation & Serving (87.5%), and Healthcare Support (77.3%).
| Occupation | Male | Female |
| Healthcare Support | 10 (22.7%) | 34 (77.3%) |
| Security & Protection | 13 (100.0%) | 0 (0.0%) |
| Firefighting & Prevention | 0 (0.0%) | 0 (0.0%) |
| Law Enforcement | 13 (100.0%) | 0 (0.0%) |
| Food Preparation & Serving | 8 (12.5%) | 56 (87.5%) |
| Cleaning & Maintenance | 42 (100.0%) | 0 (0.0%) |
| Personal Care & Service | 0 (0.0%) | 0 (0.0%) |
| Total (Category) | 73 (44.8%) | 90 (55.2%) |
| Total (Overall) | 811 (53.7%) | 698 (46.3%) |
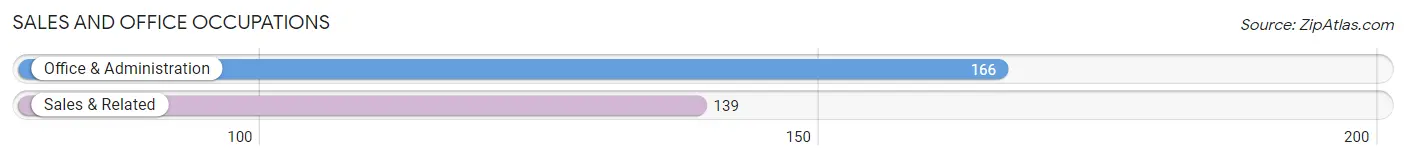
Sales and Office Occupations
The most common Sales and Office occupations in Cecil Bishop are Office & Administration (166 | 11.0%), and Sales & Related (139 | 9.2%).
Sales and Office Occupations by Sex
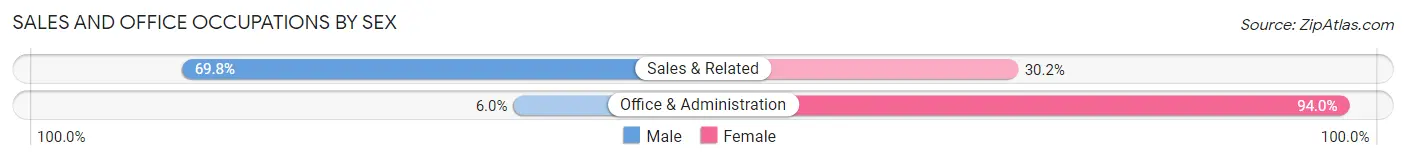
| Occupation | Male | Female |
| Sales & Related | 97 (69.8%) | 42 (30.2%) |
| Office & Administration | 10 (6.0%) | 156 (94.0%) |
| Total (Category) | 107 (35.1%) | 198 (64.9%) |
| Total (Overall) | 811 (53.7%) | 698 (46.3%) |
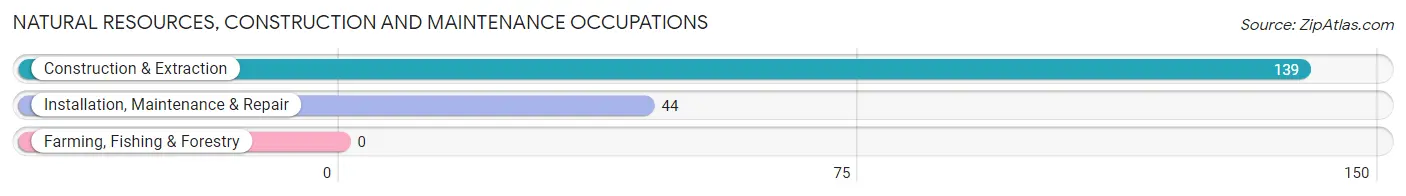
Natural Resources, Construction and Maintenance Occupations
The most common Natural Resources, Construction and Maintenance occupations in Cecil Bishop are Construction & Extraction (139 | 9.2%), and Installation, Maintenance & Repair (44 | 2.9%).
Natural Resources, Construction and Maintenance Occupations by Sex
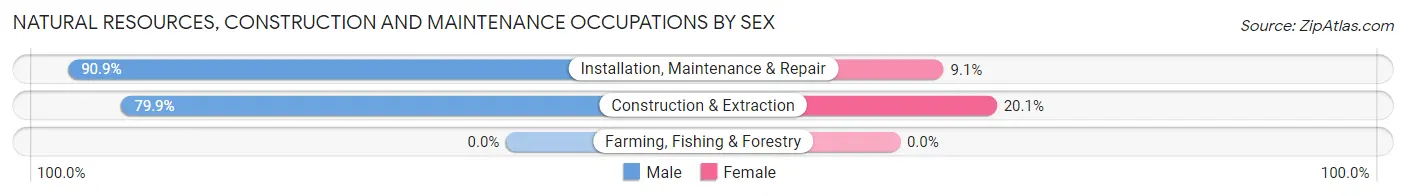
| Occupation | Male | Female |
| Farming, Fishing & Forestry | 0 (0.0%) | 0 (0.0%) |
| Construction & Extraction | 111 (79.9%) | 28 (20.1%) |
| Installation, Maintenance & Repair | 40 (90.9%) | 4 (9.1%) |
| Total (Category) | 151 (82.5%) | 32 (17.5%) |
| Total (Overall) | 811 (53.7%) | 698 (46.3%) |
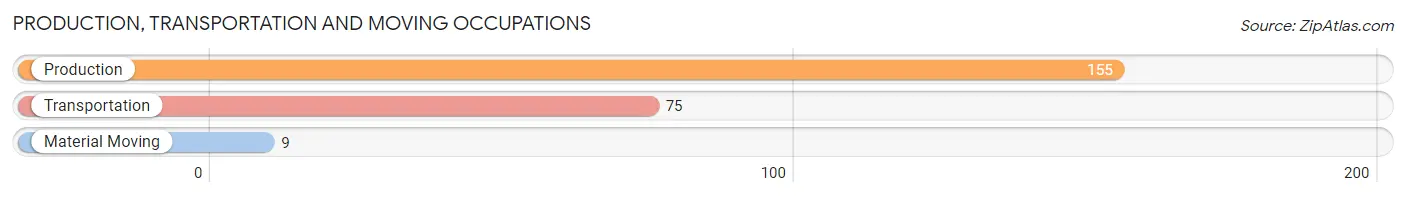
Production, Transportation and Moving Occupations
The most common Production, Transportation and Moving occupations in Cecil Bishop are Production (155 | 10.3%), Transportation (75 | 5.0%), and Material Moving (9 | 0.6%).
Production, Transportation and Moving Occupations by Sex
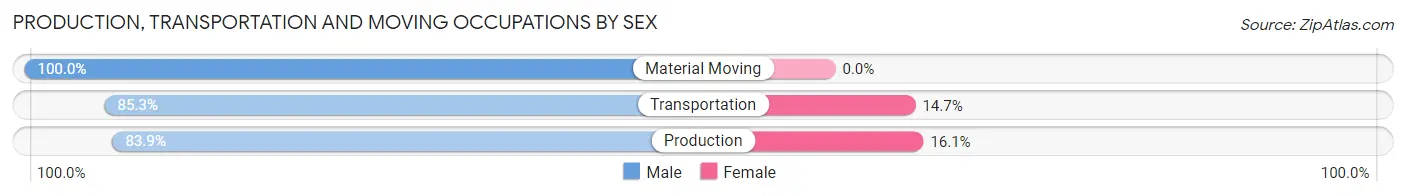
| Occupation | Male | Female |
| Production | 130 (83.9%) | 25 (16.1%) |
| Transportation | 64 (85.3%) | 11 (14.7%) |
| Material Moving | 9 (100.0%) | 0 (0.0%) |
| Total (Category) | 203 (84.9%) | 36 (15.1%) |
| Total (Overall) | 811 (53.7%) | 698 (46.3%) |
Employment Industries by Sex in Cecil Bishop
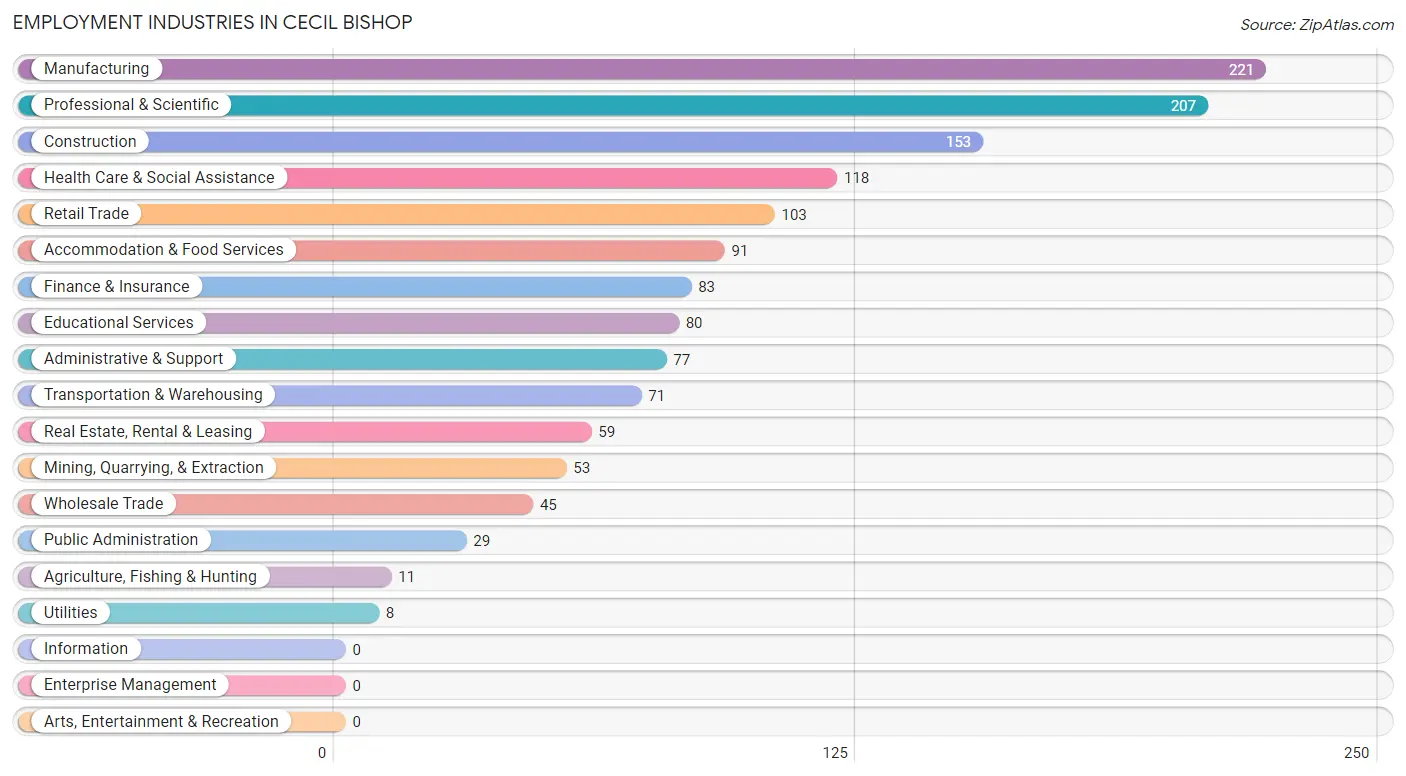
Employment Industries in Cecil Bishop
The major employment industries in Cecil Bishop include Manufacturing (221 | 14.6%), Professional & Scientific (207 | 13.7%), Construction (153 | 10.1%), Health Care & Social Assistance (118 | 7.8%), and Retail Trade (103 | 6.8%).
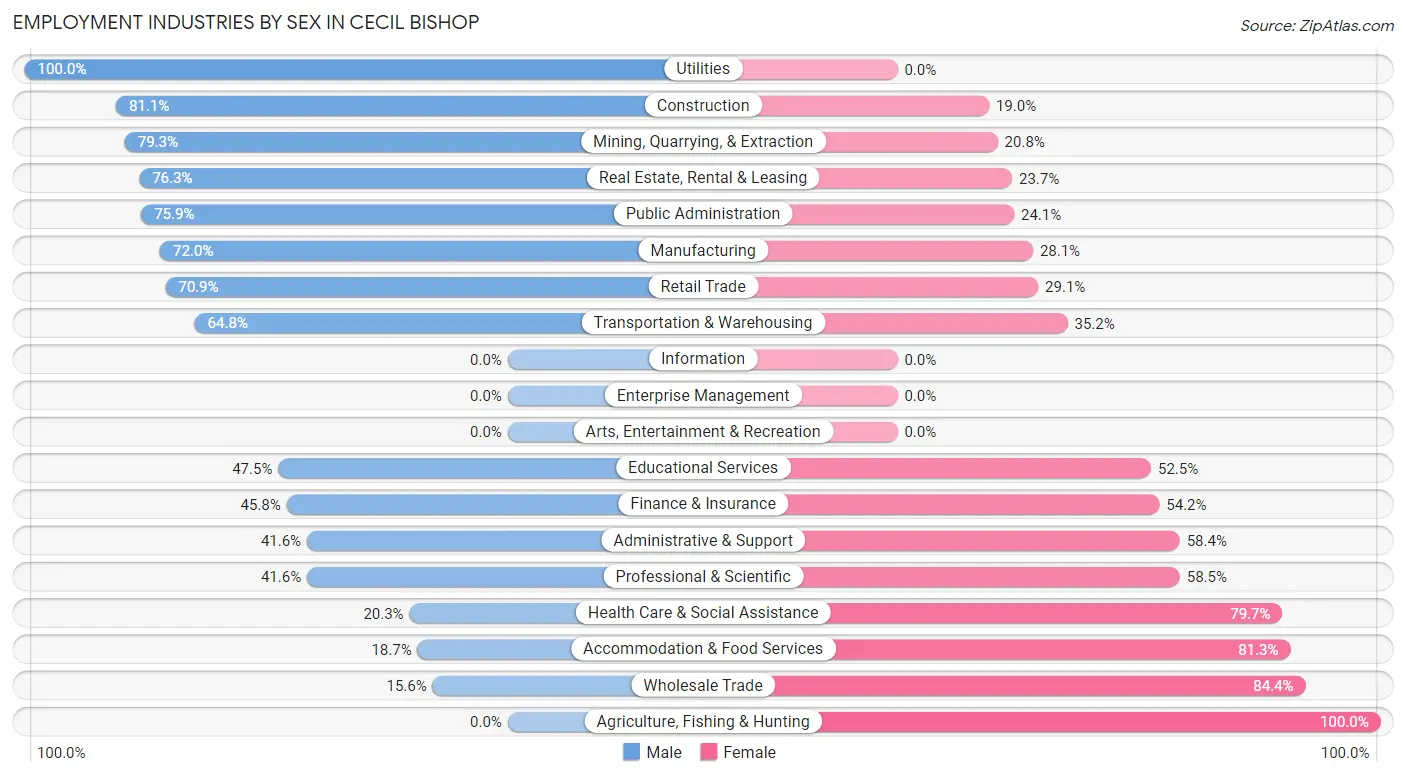
Employment Industries by Sex in Cecil Bishop
The Cecil Bishop industries that see more men than women are Utilities (100.0%), Construction (81.0%), and Mining, Quarrying, & Extraction (79.2%), whereas the industries that tend to have a higher number of women are Agriculture, Fishing & Hunting (100.0%), Wholesale Trade (84.4%), and Accommodation & Food Services (81.3%).
| Industry | Male | Female |
| Agriculture, Fishing & Hunting | 0 (0.0%) | 11 (100.0%) |
| Mining, Quarrying, & Extraction | 42 (79.2%) | 11 (20.7%) |
| Construction | 124 (81.0%) | 29 (19.0%) |
| Manufacturing | 159 (72.0%) | 62 (28.1%) |
| Wholesale Trade | 7 (15.6%) | 38 (84.4%) |
| Retail Trade | 73 (70.9%) | 30 (29.1%) |
| Transportation & Warehousing | 46 (64.8%) | 25 (35.2%) |
| Utilities | 8 (100.0%) | 0 (0.0%) |
| Information | 0 (0.0%) | 0 (0.0%) |
| Finance & Insurance | 38 (45.8%) | 45 (54.2%) |
| Real Estate, Rental & Leasing | 45 (76.3%) | 14 (23.7%) |
| Professional & Scientific | 86 (41.5%) | 121 (58.5%) |
| Enterprise Management | 0 (0.0%) | 0 (0.0%) |
| Administrative & Support | 32 (41.6%) | 45 (58.4%) |
| Educational Services | 38 (47.5%) | 42 (52.5%) |
| Health Care & Social Assistance | 24 (20.3%) | 94 (79.7%) |
| Arts, Entertainment & Recreation | 0 (0.0%) | 0 (0.0%) |
| Accommodation & Food Services | 17 (18.7%) | 74 (81.3%) |
| Public Administration | 22 (75.9%) | 7 (24.1%) |
| Total | 811 (53.7%) | 698 (46.3%) |
Education in Cecil Bishop
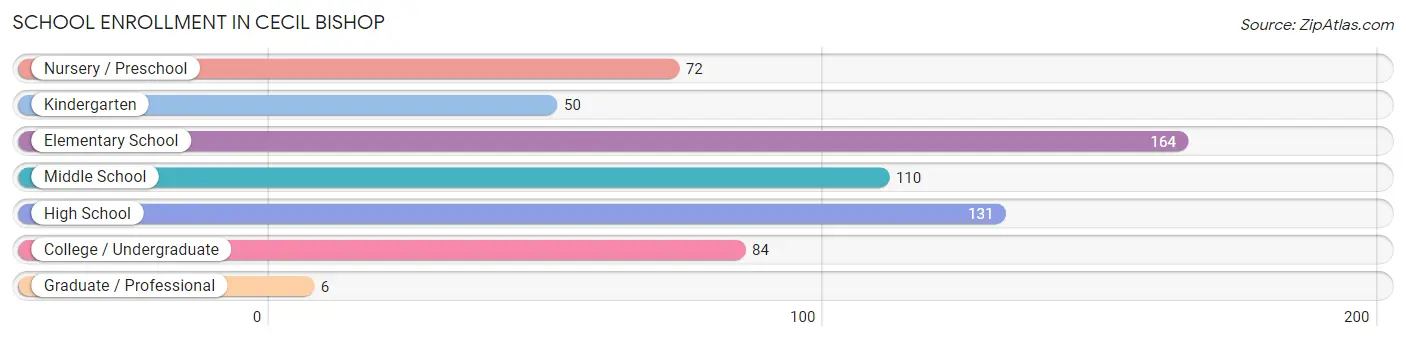
School Enrollment in Cecil Bishop
The most common levels of schooling among the 617 students in Cecil Bishop are elementary school (164 | 26.6%), high school (131 | 21.2%), and middle school (110 | 17.8%).
| School Level | # Students | % Students |
| Nursery / Preschool | 72 | 11.7% |
| Kindergarten | 50 | 8.1% |
| Elementary School | 164 | 26.6% |
| Middle School | 110 | 17.8% |
| High School | 131 | 21.2% |
| College / Undergraduate | 84 | 13.6% |
| Graduate / Professional | 6 | 1.0% |
| Total | 617 | 100.0% |
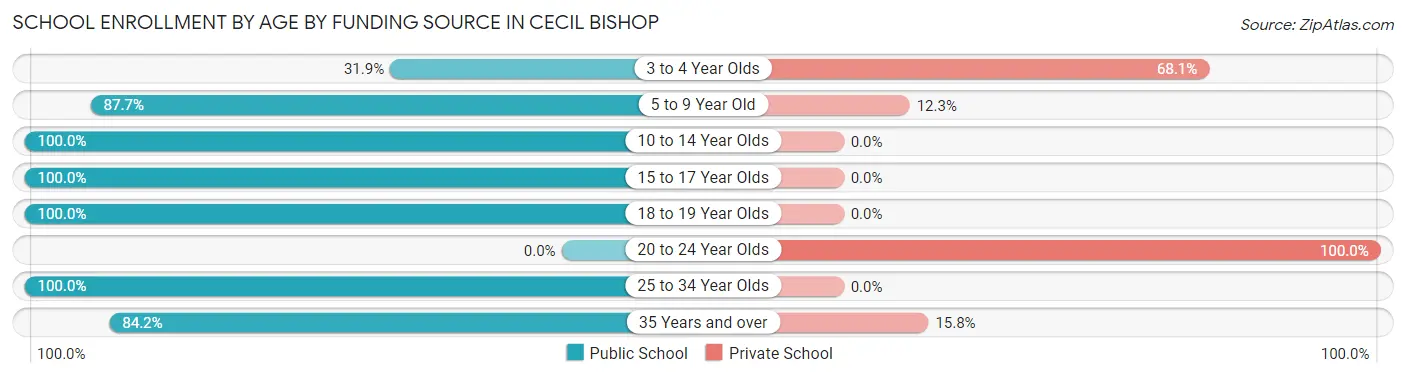
School Enrollment by Age by Funding Source in Cecil Bishop
Out of a total of 617 students who are enrolled in schools in Cecil Bishop, 103 (16.7%) attend a private institution, while the remaining 514 (83.3%) are enrolled in public schools. The age group of 20 to 24 year olds has the highest likelihood of being enrolled in private schools, with 22 (100.0% in the age bracket) enrolled. Conversely, the age group of 10 to 14 year olds has the lowest likelihood of being enrolled in a private school, with 137 (100.0% in the age bracket) attending a public institution.
| Age Bracket | Public School | Private School |
| 3 to 4 Year Olds | 23 (31.9%) | 49 (68.1%) |
| 5 to 9 Year Old | 164 (87.7%) | 23 (12.3%) |
| 10 to 14 Year Olds | 137 (100.0%) | 0 (0.0%) |
| 15 to 17 Year Olds | 122 (100.0%) | 0 (0.0%) |
| 18 to 19 Year Olds | 9 (100.0%) | 0 (0.0%) |
| 20 to 24 Year Olds | 0 (0.0%) | 22 (100.0%) |
| 25 to 34 Year Olds | 11 (100.0%) | 0 (0.0%) |
| 35 Years and over | 48 (84.2%) | 9 (15.8%) |
| Total | 514 (83.3%) | 103 (16.7%) |
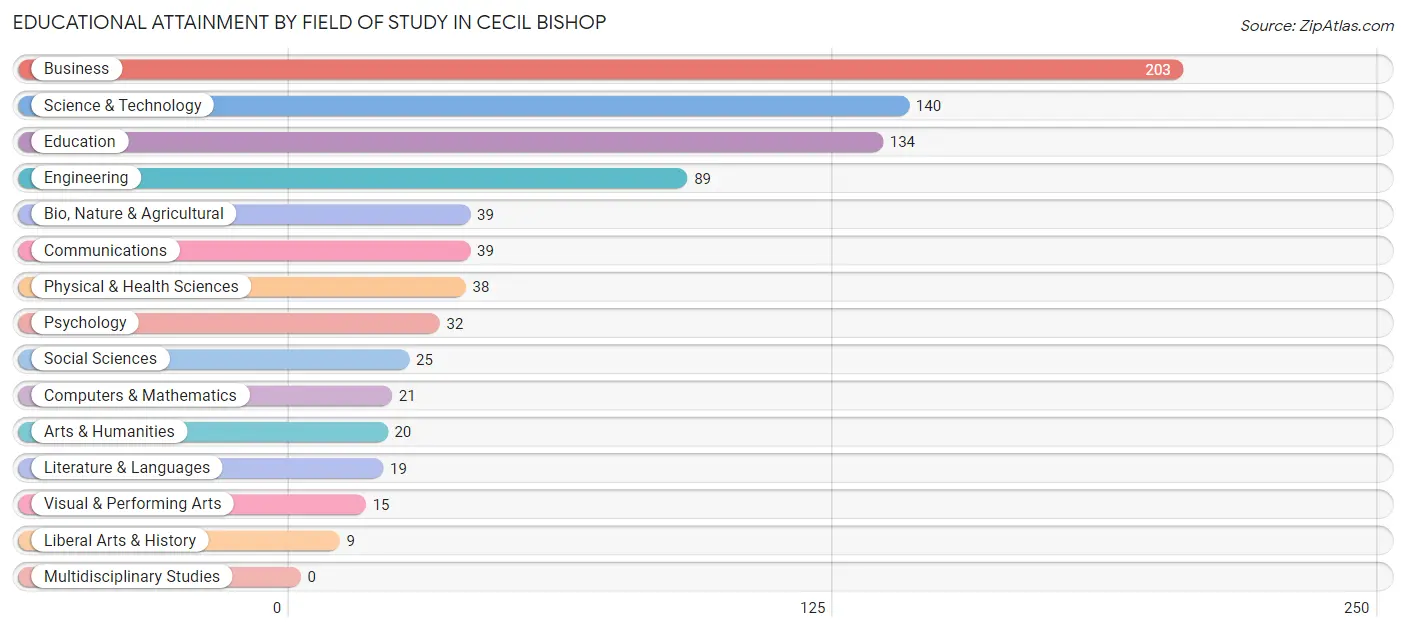
Educational Attainment by Field of Study in Cecil Bishop
Business (203 | 24.7%), science & technology (140 | 17.0%), education (134 | 16.3%), engineering (89 | 10.8%), and bio, nature & agricultural (39 | 4.7%) are the most common fields of study among 823 individuals in Cecil Bishop who have obtained a bachelor's degree or higher.
| Field of Study | # Graduates | % Graduates |
| Computers & Mathematics | 21 | 2.5% |
| Bio, Nature & Agricultural | 39 | 4.7% |
| Physical & Health Sciences | 38 | 4.6% |
| Psychology | 32 | 3.9% |
| Social Sciences | 25 | 3.0% |
| Engineering | 89 | 10.8% |
| Multidisciplinary Studies | 0 | 0.0% |
| Science & Technology | 140 | 17.0% |
| Business | 203 | 24.7% |
| Education | 134 | 16.3% |
| Literature & Languages | 19 | 2.3% |
| Liberal Arts & History | 9 | 1.1% |
| Visual & Performing Arts | 15 | 1.8% |
| Communications | 39 | 4.7% |
| Arts & Humanities | 20 | 2.4% |
| Total | 823 | 100.0% |
Transportation & Commute in Cecil Bishop
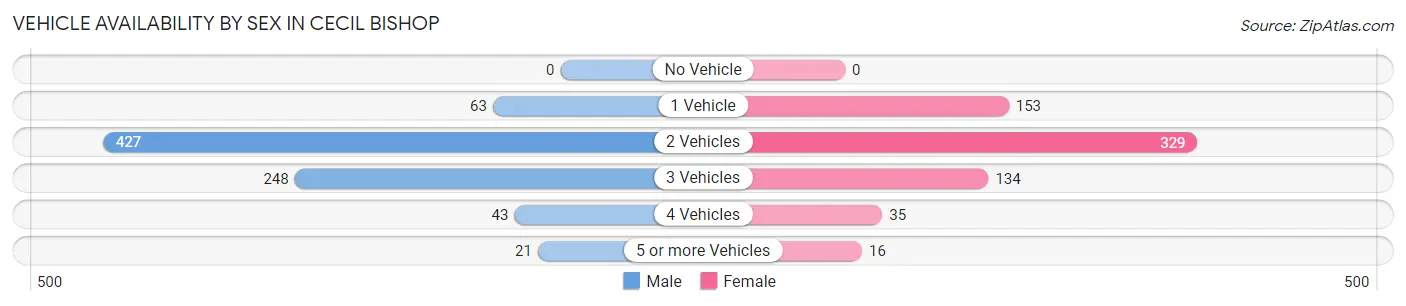
Vehicle Availability by Sex in Cecil Bishop
The most prevalent vehicle ownership categories in Cecil Bishop are males with 2 vehicles (427, accounting for 53.2%) and females with 2 vehicles (329, making up 64.0%).
| Vehicles Available | Male | Female |
| No Vehicle | 0 (0.0%) | 0 (0.0%) |
| 1 Vehicle | 63 (7.9%) | 153 (22.9%) |
| 2 Vehicles | 427 (53.2%) | 329 (49.3%) |
| 3 Vehicles | 248 (30.9%) | 134 (20.1%) |
| 4 Vehicles | 43 (5.4%) | 35 (5.2%) |
| 5 or more Vehicles | 21 (2.6%) | 16 (2.4%) |
| Total | 802 (100.0%) | 667 (100.0%) |
Commute Time in Cecil Bishop
The most frequently occuring commute durations in Cecil Bishop are 15 to 19 minutes (319 commuters, 25.1%), 20 to 24 minutes (294 commuters, 23.2%), and 5 to 9 minutes (162 commuters, 12.8%).
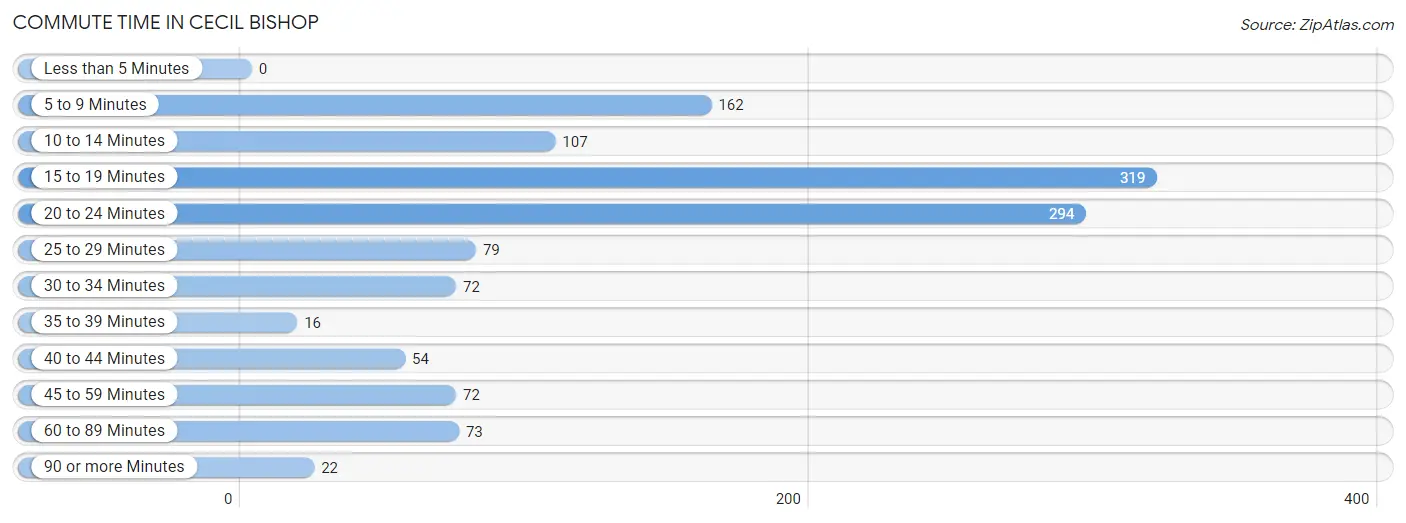
| Commute Time | # Commuters | % Commuters |
| Less than 5 Minutes | 0 | 0.0% |
| 5 to 9 Minutes | 162 | 12.8% |
| 10 to 14 Minutes | 107 | 8.4% |
| 15 to 19 Minutes | 319 | 25.1% |
| 20 to 24 Minutes | 294 | 23.2% |
| 25 to 29 Minutes | 79 | 6.2% |
| 30 to 34 Minutes | 72 | 5.7% |
| 35 to 39 Minutes | 16 | 1.3% |
| 40 to 44 Minutes | 54 | 4.3% |
| 45 to 59 Minutes | 72 | 5.7% |
| 60 to 89 Minutes | 73 | 5.8% |
| 90 or more Minutes | 22 | 1.7% |
Commute Time by Sex in Cecil Bishop
The most common commute times in Cecil Bishop are 15 to 19 minutes (227 commuters, 29.8%) for males and 20 to 24 minutes (171 commuters, 33.6%) for females.

| Commute Time | Male | Female |
| Less than 5 Minutes | 0 (0.0%) | 0 (0.0%) |
| 5 to 9 Minutes | 95 (12.5%) | 67 (13.2%) |
| 10 to 14 Minutes | 66 (8.7%) | 41 (8.1%) |
| 15 to 19 Minutes | 227 (29.8%) | 92 (18.1%) |
| 20 to 24 Minutes | 123 (16.2%) | 171 (33.6%) |
| 25 to 29 Minutes | 53 (7.0%) | 26 (5.1%) |
| 30 to 34 Minutes | 41 (5.4%) | 31 (6.1%) |
| 35 to 39 Minutes | 0 (0.0%) | 16 (3.1%) |
| 40 to 44 Minutes | 23 (3.0%) | 31 (6.1%) |
| 45 to 59 Minutes | 54 (7.1%) | 18 (3.5%) |
| 60 to 89 Minutes | 57 (7.5%) | 16 (3.1%) |
| 90 or more Minutes | 22 (2.9%) | 0 (0.0%) |
Time of Departure to Work by Sex in Cecil Bishop
The most frequent times of departure to work in Cecil Bishop are 7:00 AM to 7:29 AM (204, 26.8%) for males and 6:30 AM to 6:59 AM (102, 20.0%) for females.
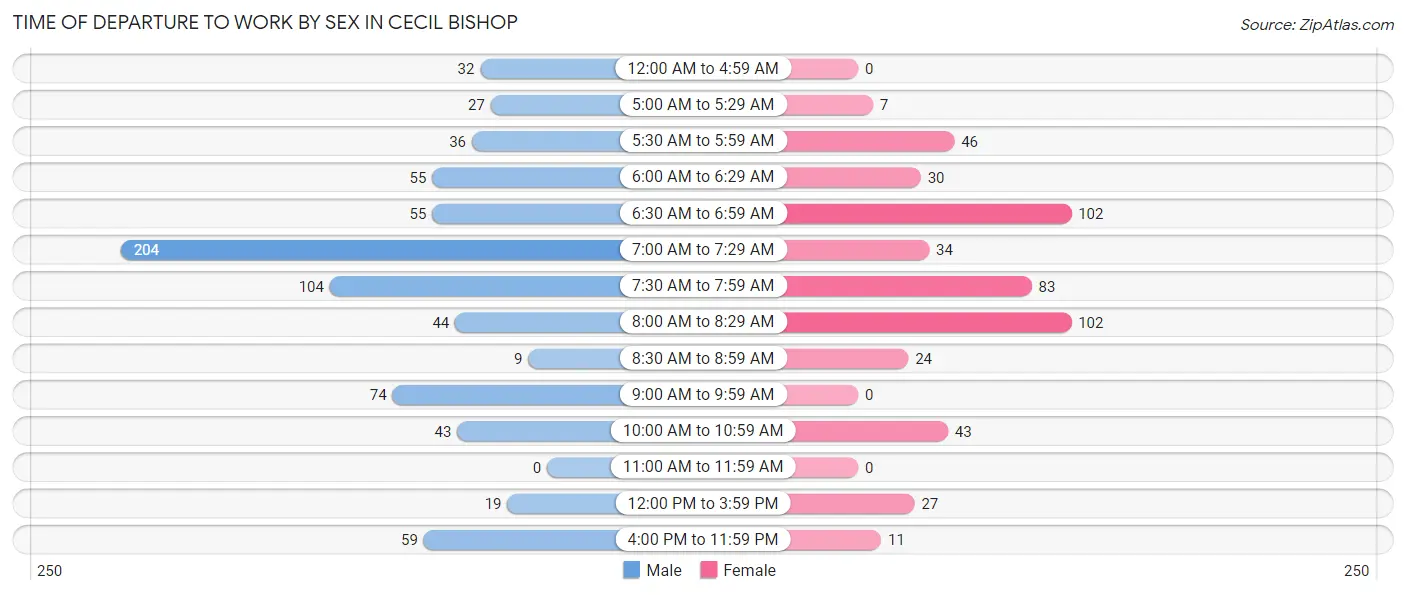
| Time of Departure | Male | Female |
| 12:00 AM to 4:59 AM | 32 (4.2%) | 0 (0.0%) |
| 5:00 AM to 5:29 AM | 27 (3.5%) | 7 (1.4%) |
| 5:30 AM to 5:59 AM | 36 (4.7%) | 46 (9.0%) |
| 6:00 AM to 6:29 AM | 55 (7.2%) | 30 (5.9%) |
| 6:30 AM to 6:59 AM | 55 (7.2%) | 102 (20.0%) |
| 7:00 AM to 7:29 AM | 204 (26.8%) | 34 (6.7%) |
| 7:30 AM to 7:59 AM | 104 (13.7%) | 83 (16.3%) |
| 8:00 AM to 8:29 AM | 44 (5.8%) | 102 (20.0%) |
| 8:30 AM to 8:59 AM | 9 (1.2%) | 24 (4.7%) |
| 9:00 AM to 9:59 AM | 74 (9.7%) | 0 (0.0%) |
| 10:00 AM to 10:59 AM | 43 (5.7%) | 43 (8.5%) |
| 11:00 AM to 11:59 AM | 0 (0.0%) | 0 (0.0%) |
| 12:00 PM to 3:59 PM | 19 (2.5%) | 27 (5.3%) |
| 4:00 PM to 11:59 PM | 59 (7.7%) | 11 (2.2%) |
| Total | 761 (100.0%) | 509 (100.0%) |
Housing Occupancy in Cecil Bishop
Occupancy by Ownership in Cecil Bishop
Of the total 1,124 dwellings in Cecil Bishop, owner-occupied units account for 890 (79.2%), while renter-occupied units make up 234 (20.8%).
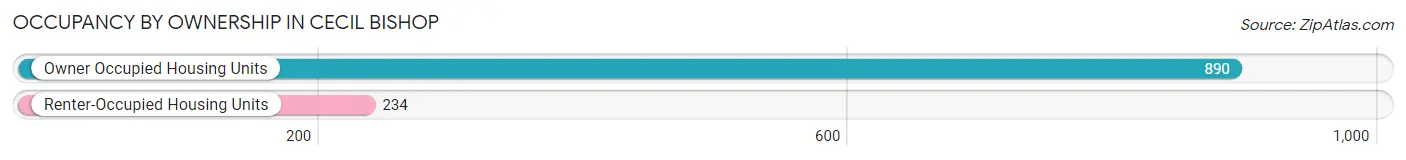
| Occupancy | # Housing Units | % Housing Units |
| Owner Occupied Housing Units | 890 | 79.2% |
| Renter-Occupied Housing Units | 234 | 20.8% |
| Total Occupied Housing Units | 1,124 | 100.0% |
Occupancy by Household Size in Cecil Bishop
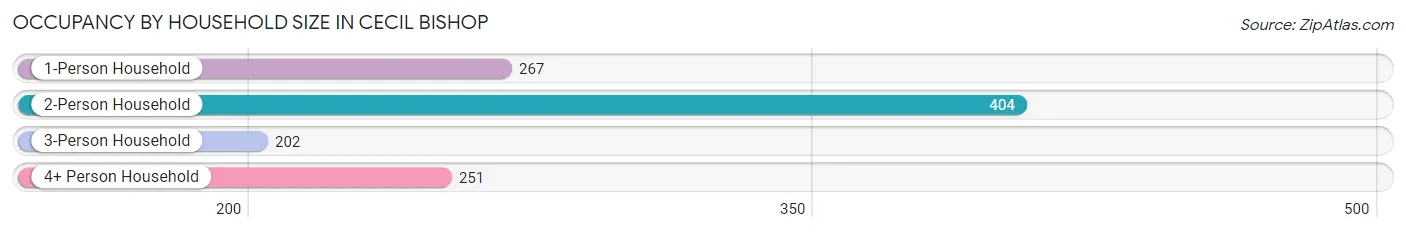
| Household Size | # Housing Units | % Housing Units |
| 1-Person Household | 267 | 23.7% |
| 2-Person Household | 404 | 35.9% |
| 3-Person Household | 202 | 18.0% |
| 4+ Person Household | 251 | 22.3% |
| Total Housing Units | 1,124 | 100.0% |
Occupancy by Ownership by Household Size in Cecil Bishop
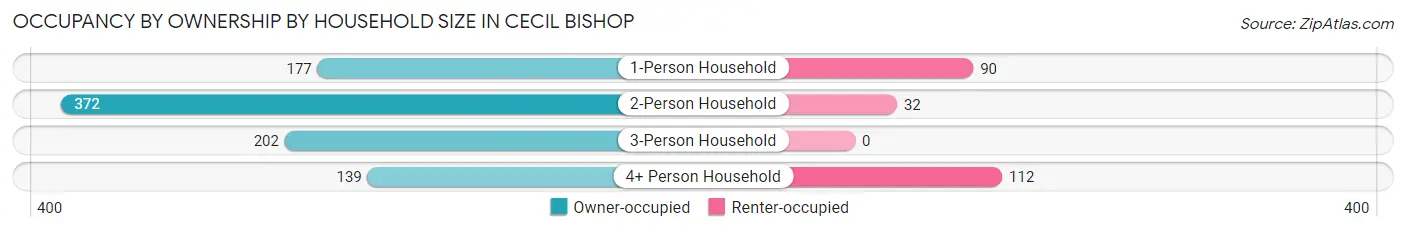
| Household Size | Owner-occupied | Renter-occupied |
| 1-Person Household | 177 (66.3%) | 90 (33.7%) |
| 2-Person Household | 372 (92.1%) | 32 (7.9%) |
| 3-Person Household | 202 (100.0%) | 0 (0.0%) |
| 4+ Person Household | 139 (55.4%) | 112 (44.6%) |
| Total Housing Units | 890 (79.2%) | 234 (20.8%) |
Occupancy by Educational Attainment in Cecil Bishop
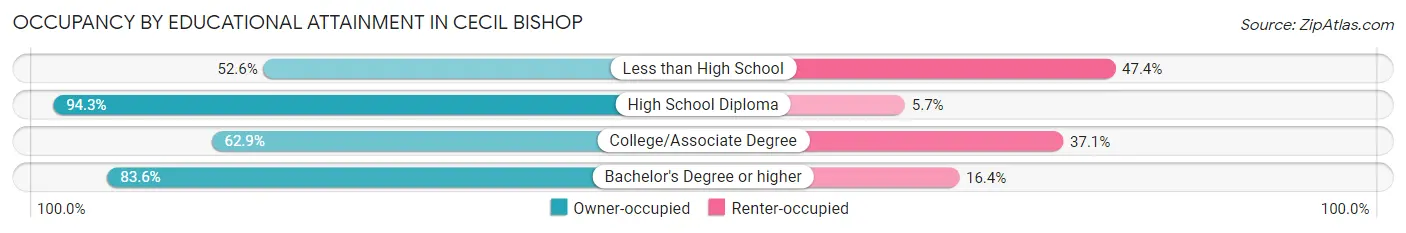
| Household Size | Owner-occupied | Renter-occupied |
| Less than High School | 10 (52.6%) | 9 (47.4%) |
| High School Diploma | 249 (94.3%) | 15 (5.7%) |
| College/Associate Degree | 219 (62.9%) | 129 (37.1%) |
| Bachelor's Degree or higher | 412 (83.6%) | 81 (16.4%) |
Occupancy by Age of Householder in Cecil Bishop
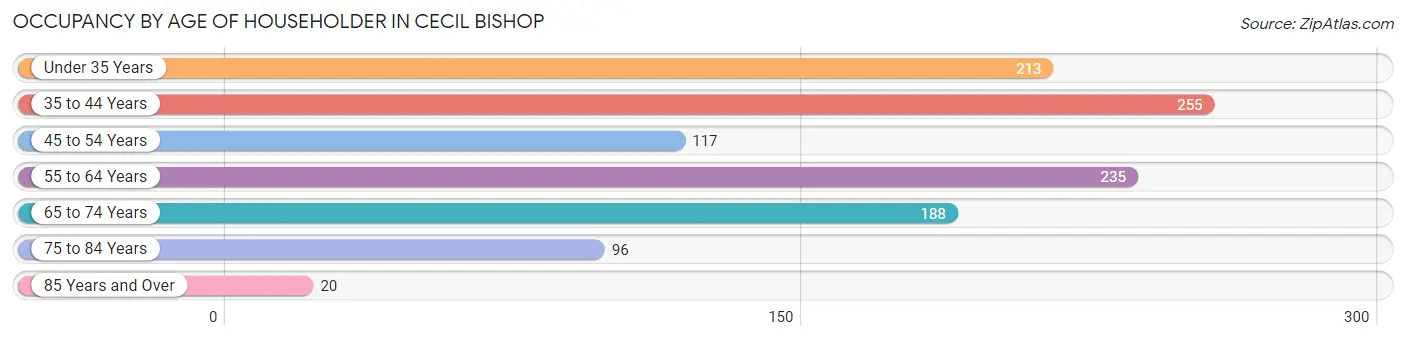
| Age Bracket | # Households | % Households |
| Under 35 Years | 213 | 19.0% |
| 35 to 44 Years | 255 | 22.7% |
| 45 to 54 Years | 117 | 10.4% |
| 55 to 64 Years | 235 | 20.9% |
| 65 to 74 Years | 188 | 16.7% |
| 75 to 84 Years | 96 | 8.5% |
| 85 Years and Over | 20 | 1.8% |
| Total | 1,124 | 100.0% |
Housing Finances in Cecil Bishop
Median Income by Occupancy in Cecil Bishop
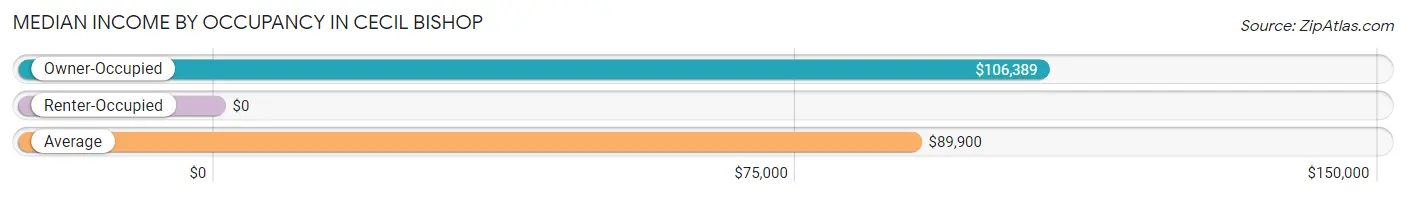
| Occupancy Type | # Households | Median Income |
| Owner-Occupied | 890 (79.2%) | $106,389 |
| Renter-Occupied | 234 (20.8%) | $0 |
| Average | 1,124 (100.0%) | $89,900 |
Occupancy by Householder Income Bracket in Cecil Bishop
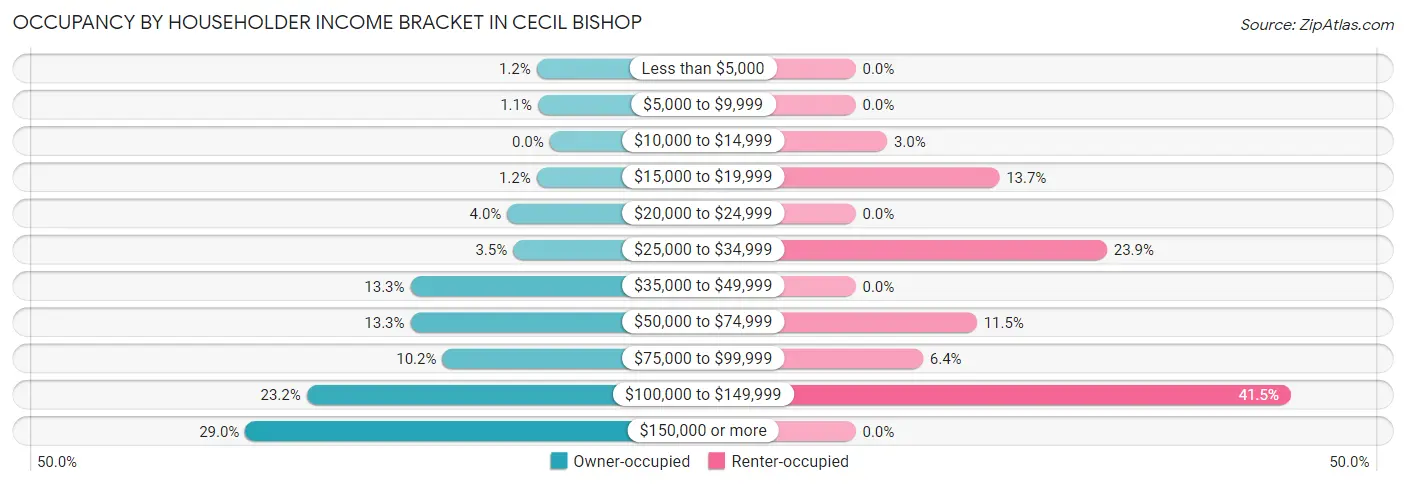
| Income Bracket | Owner-occupied | Renter-occupied |
| Less than $5,000 | 11 (1.2%) | 0 (0.0%) |
| $5,000 to $9,999 | 10 (1.1%) | 0 (0.0%) |
| $10,000 to $14,999 | 0 (0.0%) | 7 (3.0%) |
| $15,000 to $19,999 | 11 (1.2%) | 32 (13.7%) |
| $20,000 to $24,999 | 36 (4.0%) | 0 (0.0%) |
| $25,000 to $34,999 | 31 (3.5%) | 56 (23.9%) |
| $35,000 to $49,999 | 118 (13.3%) | 0 (0.0%) |
| $50,000 to $74,999 | 118 (13.3%) | 27 (11.5%) |
| $75,000 to $99,999 | 91 (10.2%) | 15 (6.4%) |
| $100,000 to $149,999 | 206 (23.2%) | 97 (41.4%) |
| $150,000 or more | 258 (29.0%) | 0 (0.0%) |
| Total | 890 (100.0%) | 234 (100.0%) |
Monthly Housing Cost Tiers in Cecil Bishop
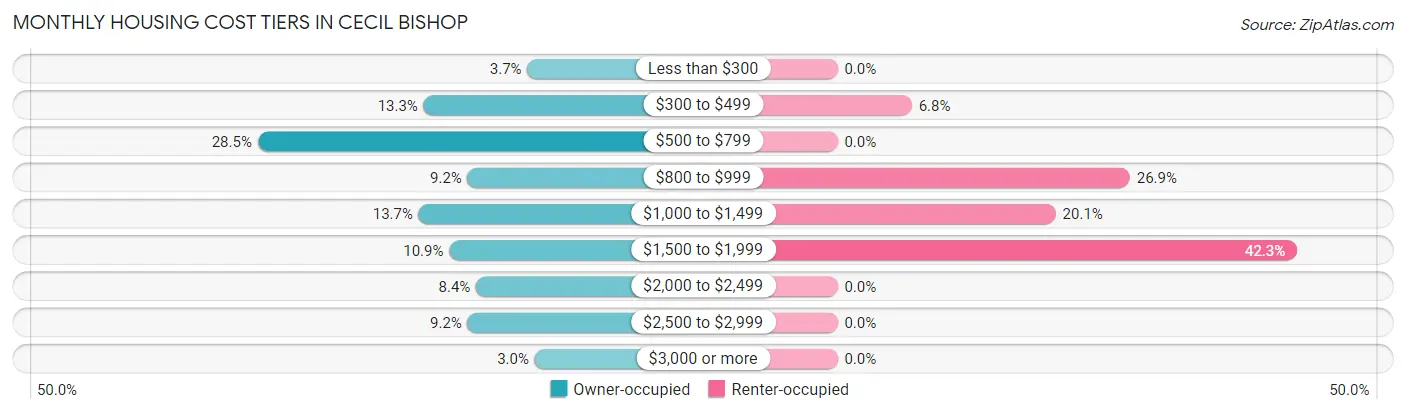
| Monthly Cost | Owner-occupied | Renter-occupied |
| Less than $300 | 33 (3.7%) | 0 (0.0%) |
| $300 to $499 | 118 (13.3%) | 16 (6.8%) |
| $500 to $799 | 254 (28.5%) | 0 (0.0%) |
| $800 to $999 | 82 (9.2%) | 63 (26.9%) |
| $1,000 to $1,499 | 122 (13.7%) | 47 (20.1%) |
| $1,500 to $1,999 | 97 (10.9%) | 99 (42.3%) |
| $2,000 to $2,499 | 75 (8.4%) | 0 (0.0%) |
| $2,500 to $2,999 | 82 (9.2%) | 0 (0.0%) |
| $3,000 or more | 27 (3.0%) | 0 (0.0%) |
| Total | 890 (100.0%) | 234 (100.0%) |
Physical Housing Characteristics in Cecil Bishop
Housing Structures in Cecil Bishop
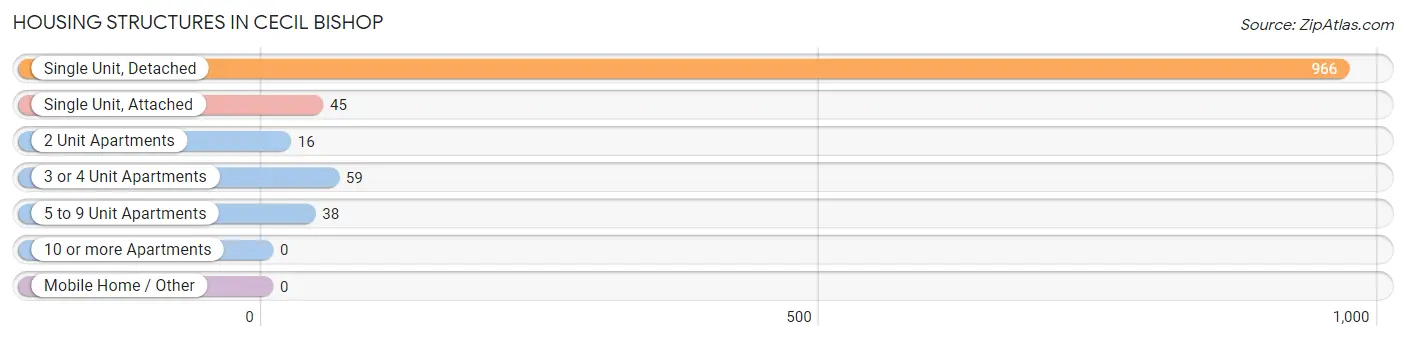
| Structure Type | # Housing Units | % Housing Units |
| Single Unit, Detached | 966 | 85.9% |
| Single Unit, Attached | 45 | 4.0% |
| 2 Unit Apartments | 16 | 1.4% |
| 3 or 4 Unit Apartments | 59 | 5.2% |
| 5 to 9 Unit Apartments | 38 | 3.4% |
| 10 or more Apartments | 0 | 0.0% |
| Mobile Home / Other | 0 | 0.0% |
| Total | 1,124 | 100.0% |
Housing Structures by Occupancy in Cecil Bishop
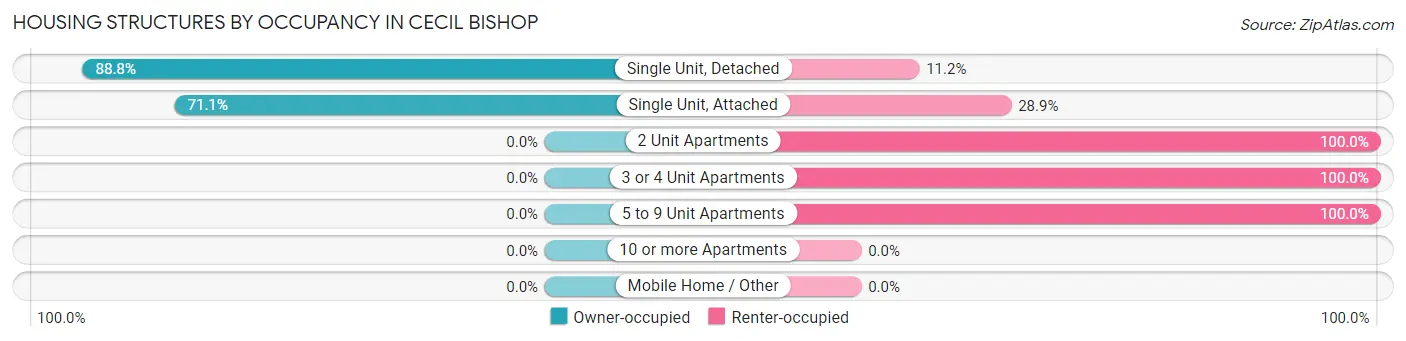
| Structure Type | Owner-occupied | Renter-occupied |
| Single Unit, Detached | 858 (88.8%) | 108 (11.2%) |
| Single Unit, Attached | 32 (71.1%) | 13 (28.9%) |
| 2 Unit Apartments | 0 (0.0%) | 16 (100.0%) |
| 3 or 4 Unit Apartments | 0 (0.0%) | 59 (100.0%) |
| 5 to 9 Unit Apartments | 0 (0.0%) | 38 (100.0%) |
| 10 or more Apartments | 0 (0.0%) | 0 (0.0%) |
| Mobile Home / Other | 0 (0.0%) | 0 (0.0%) |
| Total | 890 (79.2%) | 234 (20.8%) |
Housing Structures by Number of Rooms in Cecil Bishop
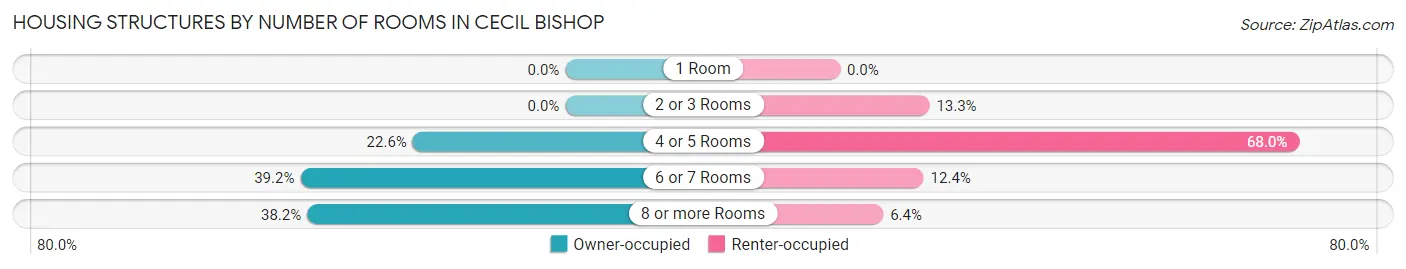
| Number of Rooms | Owner-occupied | Renter-occupied |
| 1 Room | 0 (0.0%) | 0 (0.0%) |
| 2 or 3 Rooms | 0 (0.0%) | 31 (13.3%) |
| 4 or 5 Rooms | 201 (22.6%) | 159 (67.9%) |
| 6 or 7 Rooms | 349 (39.2%) | 29 (12.4%) |
| 8 or more Rooms | 340 (38.2%) | 15 (6.4%) |
| Total | 890 (100.0%) | 234 (100.0%) |
Housing Structure by Heating Type in Cecil Bishop
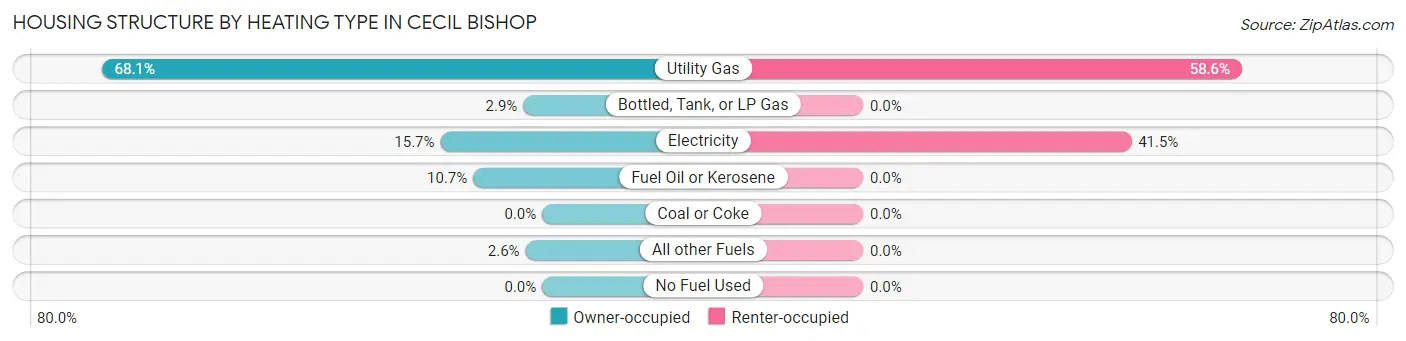
| Heating Type | Owner-occupied | Renter-occupied |
| Utility Gas | 606 (68.1%) | 137 (58.6%) |
| Bottled, Tank, or LP Gas | 26 (2.9%) | 0 (0.0%) |
| Electricity | 140 (15.7%) | 97 (41.4%) |
| Fuel Oil or Kerosene | 95 (10.7%) | 0 (0.0%) |
| Coal or Coke | 0 (0.0%) | 0 (0.0%) |
| All other Fuels | 23 (2.6%) | 0 (0.0%) |
| No Fuel Used | 0 (0.0%) | 0 (0.0%) |
| Total | 890 (100.0%) | 234 (100.0%) |
Household Vehicle Usage in Cecil Bishop
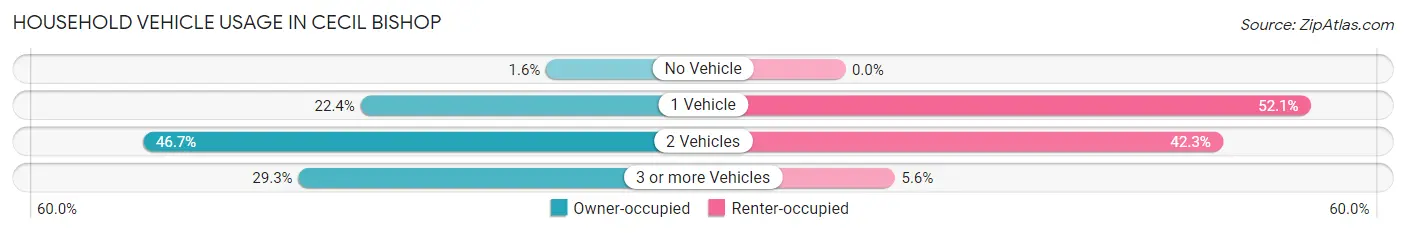
| Vehicles per Household | Owner-occupied | Renter-occupied |
| No Vehicle | 14 (1.6%) | 0 (0.0%) |
| 1 Vehicle | 199 (22.4%) | 122 (52.1%) |
| 2 Vehicles | 416 (46.7%) | 99 (42.3%) |
| 3 or more Vehicles | 261 (29.3%) | 13 (5.6%) |
| Total | 890 (100.0%) | 234 (100.0%) |
Real Estate & Mortgages in Cecil Bishop
Real Estate and Mortgage Overview in Cecil Bishop
| Characteristic | Without Mortgage | With Mortgage |
| Housing Units | 462 | 428 |
| Median Property Value | $268,700 | $263,400 |
| Median Household Income | $76,029 | $122 |
| Monthly Housing Costs | $584 | $27 |
| Real Estate Taxes | $2,860 | $9 |
Property Value by Mortgage Status in Cecil Bishop

| Property Value | Without Mortgage | With Mortgage |
| Less than $50,000 | 20 (4.3%) | 11 (2.6%) |
| $50,000 to $99,999 | 18 (3.9%) | 28 (6.5%) |
| $100,000 to $299,999 | 245 (53.0%) | 227 (53.0%) |
| $300,000 to $499,999 | 135 (29.2%) | 113 (26.4%) |
| $500,000 to $749,999 | 44 (9.5%) | 40 (9.3%) |
| $750,000 to $999,999 | 0 (0.0%) | 0 (0.0%) |
| $1,000,000 or more | 0 (0.0%) | 9 (2.1%) |
| Total | 462 (100.0%) | 428 (100.0%) |
Household Income by Mortgage Status in Cecil Bishop
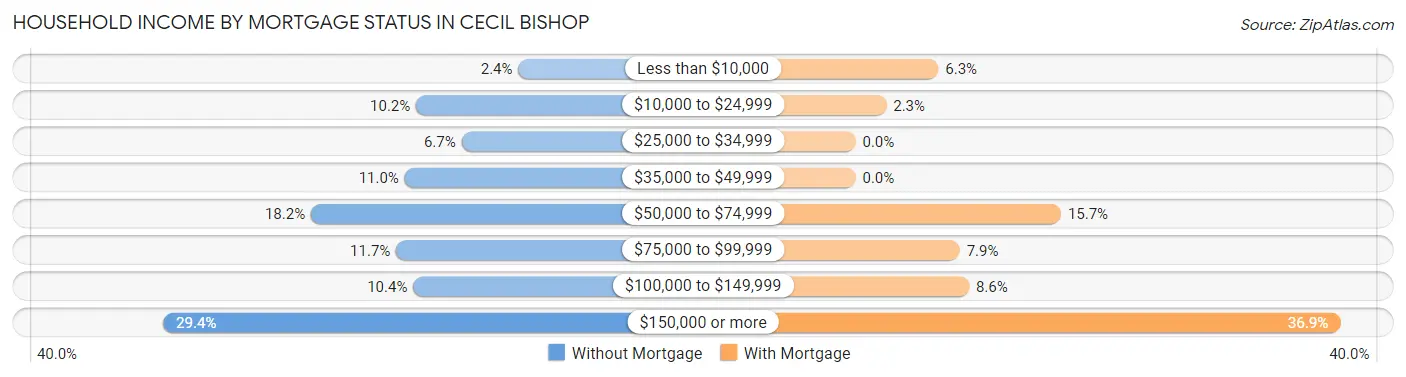
| Household Income | Without Mortgage | With Mortgage |
| Less than $10,000 | 11 (2.4%) | 27 (6.3%) |
| $10,000 to $24,999 | 47 (10.2%) | 10 (2.3%) |
| $25,000 to $34,999 | 31 (6.7%) | 0 (0.0%) |
| $35,000 to $49,999 | 51 (11.0%) | 0 (0.0%) |
| $50,000 to $74,999 | 84 (18.2%) | 67 (15.7%) |
| $75,000 to $99,999 | 54 (11.7%) | 34 (7.9%) |
| $100,000 to $149,999 | 48 (10.4%) | 37 (8.6%) |
| $150,000 or more | 136 (29.4%) | 158 (36.9%) |
| Total | 462 (100.0%) | 428 (100.0%) |
Property Value to Household Income Ratio in Cecil Bishop
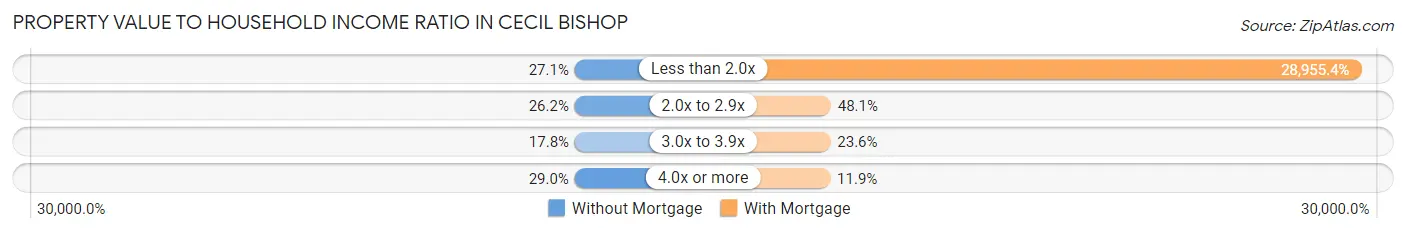
| Value-to-Income Ratio | Without Mortgage | With Mortgage |
| Less than 2.0x | 125 (27.1%) | 123,929 (28,955.4%) |
| 2.0x to 2.9x | 121 (26.2%) | 206 (48.1%) |
| 3.0x to 3.9x | 82 (17.7%) | 101 (23.6%) |
| 4.0x or more | 134 (29.0%) | 51 (11.9%) |
| Total | 462 (100.0%) | 428 (100.0%) |
Real Estate Taxes by Mortgage Status in Cecil Bishop
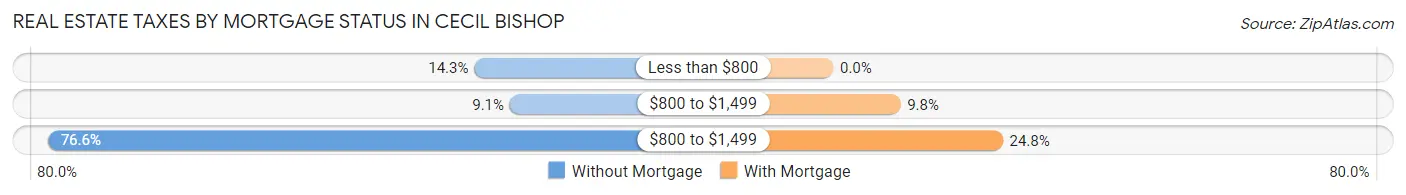
| Property Taxes | Without Mortgage | With Mortgage |
| Less than $800 | 66 (14.3%) | 0 (0.0%) |
| $800 to $1,499 | 42 (9.1%) | 42 (9.8%) |
| $800 to $1,499 | 354 (76.6%) | 106 (24.8%) |
| Total | 462 (100.0%) | 428 (100.0%) |
Health & Disability in Cecil Bishop
Health Insurance Coverage by Age in Cecil Bishop
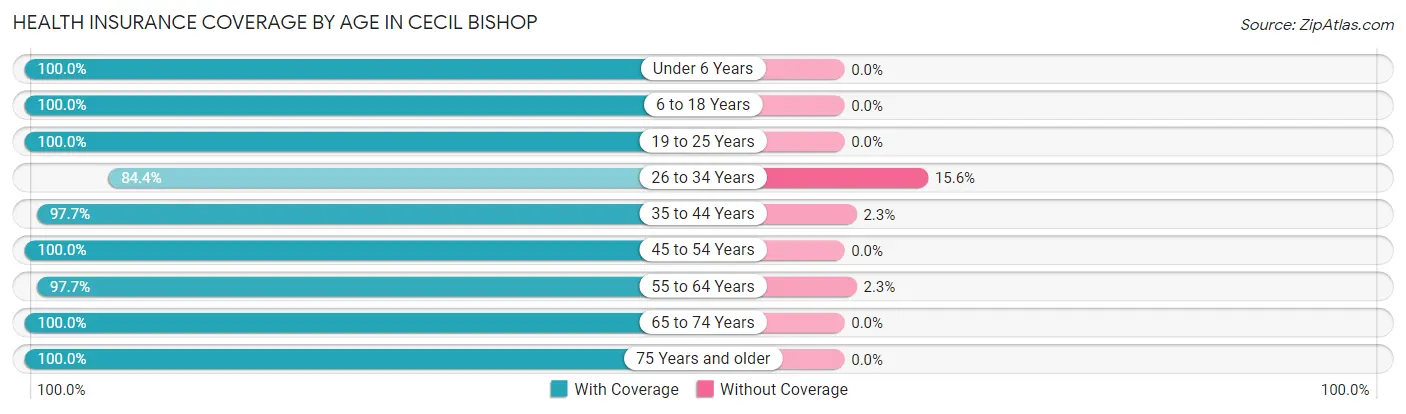
| Age Bracket | With Coverage | Without Coverage |
| Under 6 Years | 224 (100.0%) | 0 (0.0%) |
| 6 to 18 Years | 405 (100.0%) | 0 (0.0%) |
| 19 to 25 Years | 238 (100.0%) | 0 (0.0%) |
| 26 to 34 Years | 238 (84.4%) | 44 (15.6%) |
| 35 to 44 Years | 388 (97.7%) | 9 (2.3%) |
| 45 to 54 Years | 253 (100.0%) | 0 (0.0%) |
| 55 to 64 Years | 428 (97.7%) | 10 (2.3%) |
| 65 to 74 Years | 295 (100.0%) | 0 (0.0%) |
| 75 Years and older | 152 (100.0%) | 0 (0.0%) |
| Total | 2,621 (97.7%) | 63 (2.4%) |
Health Insurance Coverage by Citizenship Status in Cecil Bishop
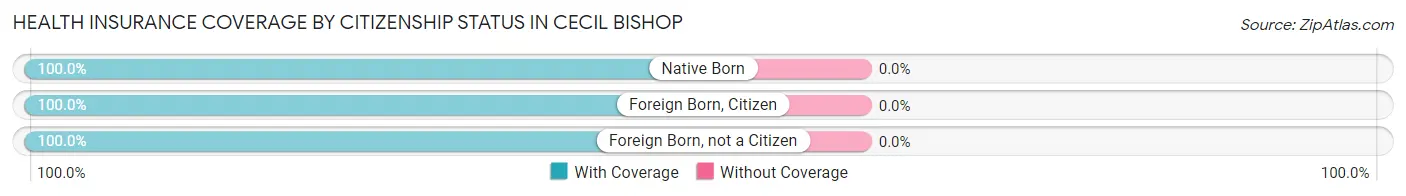
| Citizenship Status | With Coverage | Without Coverage |
| Native Born | 224 (100.0%) | 0 (0.0%) |
| Foreign Born, Citizen | 405 (100.0%) | 0 (0.0%) |
| Foreign Born, not a Citizen | 238 (100.0%) | 0 (0.0%) |
Health Insurance Coverage by Household Income in Cecil Bishop
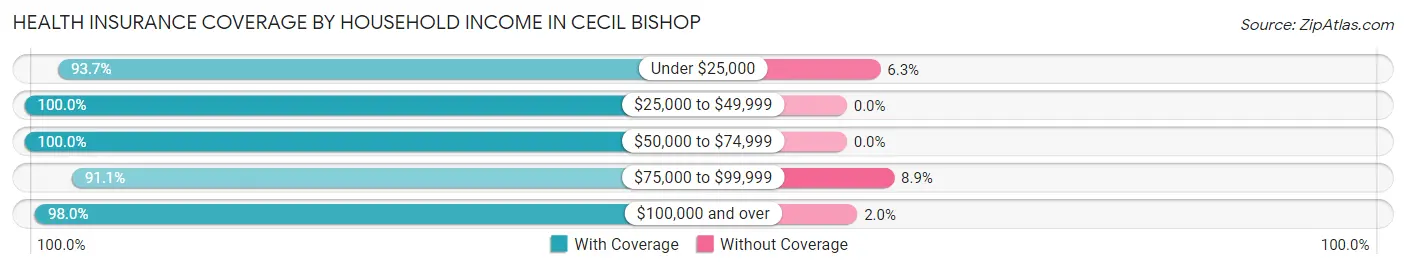
| Household Income | With Coverage | Without Coverage |
| Under $25,000 | 149 (93.7%) | 10 (6.3%) |
| $25,000 to $49,999 | 334 (100.0%) | 0 (0.0%) |
| $50,000 to $74,999 | 322 (100.0%) | 0 (0.0%) |
| $75,000 to $99,999 | 216 (91.1%) | 21 (8.9%) |
| $100,000 and over | 1,597 (98.0%) | 32 (2.0%) |
Public vs Private Health Insurance Coverage by Age in Cecil Bishop
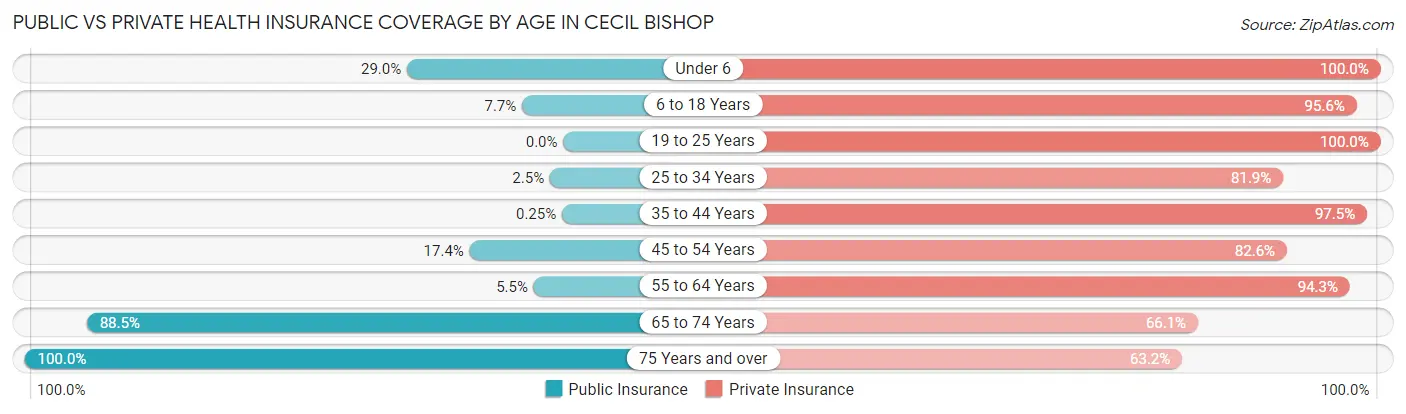
| Age Bracket | Public Insurance | Private Insurance |
| Under 6 | 65 (29.0%) | 224 (100.0%) |
| 6 to 18 Years | 31 (7.6%) | 387 (95.6%) |
| 19 to 25 Years | 0 (0.0%) | 238 (100.0%) |
| 25 to 34 Years | 7 (2.5%) | 231 (81.9%) |
| 35 to 44 Years | 1 (0.3%) | 387 (97.5%) |
| 45 to 54 Years | 44 (17.4%) | 209 (82.6%) |
| 55 to 64 Years | 24 (5.5%) | 413 (94.3%) |
| 65 to 74 Years | 261 (88.5%) | 195 (66.1%) |
| 75 Years and over | 152 (100.0%) | 96 (63.2%) |
| Total | 585 (21.8%) | 2,380 (88.7%) |
Disability Status by Sex by Age in Cecil Bishop
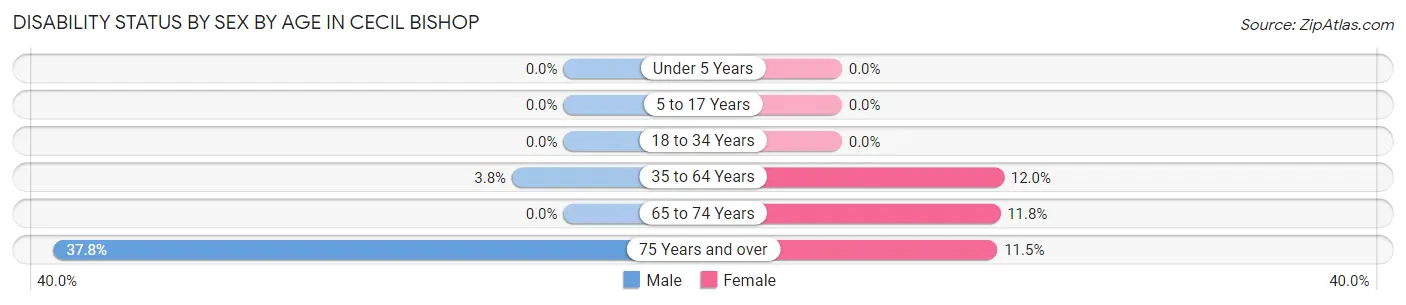
| Age Bracket | Male | Female |
| Under 5 Years | 0 (0.0%) | 0 (0.0%) |
| 5 to 17 Years | 0 (0.0%) | 0 (0.0%) |
| 18 to 34 Years | 0 (0.0%) | 0 (0.0%) |
| 35 to 64 Years | 19 (3.8%) | 71 (12.0%) |
| 65 to 74 Years | 0 (0.0%) | 20 (11.8%) |
| 75 Years and over | 28 (37.8%) | 9 (11.5%) |
Disability Class by Sex by Age in Cecil Bishop
Disability Class: Hearing Difficulty
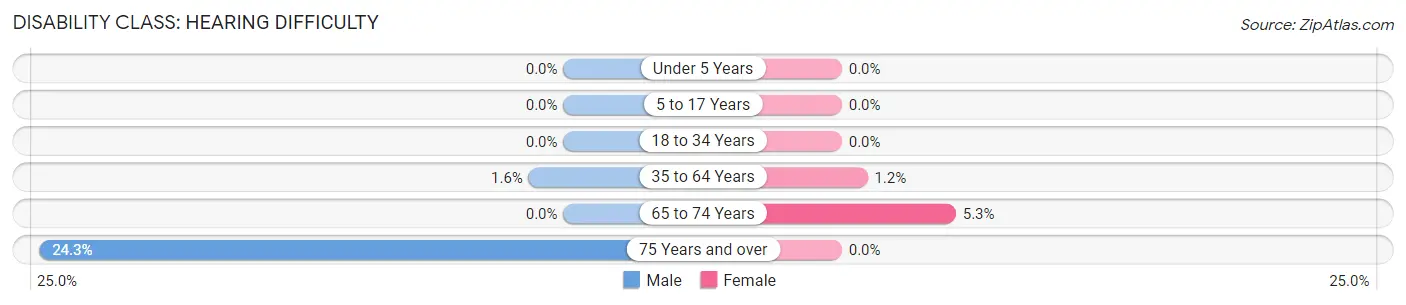
| Age Bracket | Male | Female |
| Under 5 Years | 0 (0.0%) | 0 (0.0%) |
| 5 to 17 Years | 0 (0.0%) | 0 (0.0%) |
| 18 to 34 Years | 0 (0.0%) | 0 (0.0%) |
| 35 to 64 Years | 8 (1.6%) | 7 (1.2%) |
| 65 to 74 Years | 0 (0.0%) | 9 (5.3%) |
| 75 Years and over | 18 (24.3%) | 0 (0.0%) |
Disability Class: Vision Difficulty
| Age Bracket | Male | Female |
| Under 5 Years | 0 (0.0%) | 0 (0.0%) |
| 5 to 17 Years | 0 (0.0%) | 0 (0.0%) |
| 18 to 34 Years | 0 (0.0%) | 0 (0.0%) |
| 35 to 64 Years | 0 (0.0%) | 0 (0.0%) |
| 65 to 74 Years | 0 (0.0%) | 0 (0.0%) |
| 75 Years and over | 0 (0.0%) | 0 (0.0%) |
Disability Class: Cognitive Difficulty
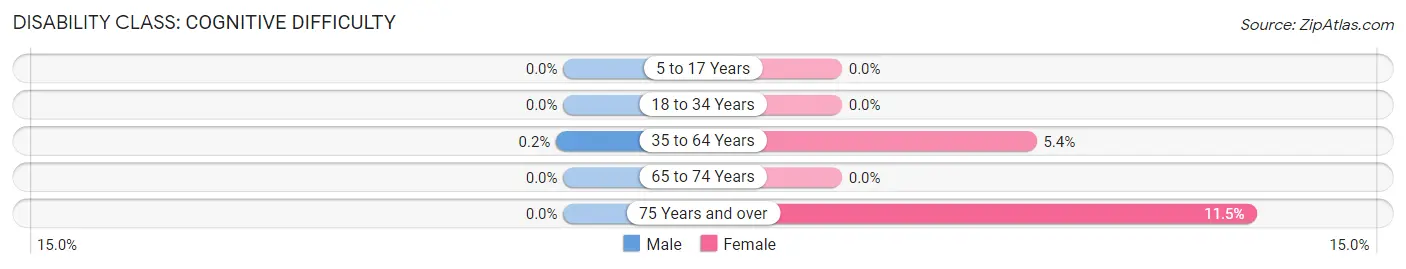
| Age Bracket | Male | Female |
| 5 to 17 Years | 0 (0.0%) | 0 (0.0%) |
| 18 to 34 Years | 0 (0.0%) | 0 (0.0%) |
| 35 to 64 Years | 1 (0.2%) | 32 (5.4%) |
| 65 to 74 Years | 0 (0.0%) | 0 (0.0%) |
| 75 Years and over | 0 (0.0%) | 9 (11.5%) |
Disability Class: Ambulatory Difficulty
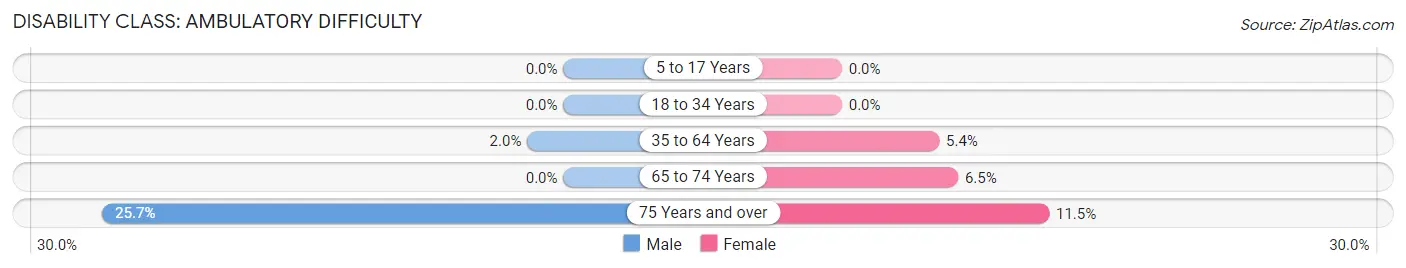
| Age Bracket | Male | Female |
| 5 to 17 Years | 0 (0.0%) | 0 (0.0%) |
| 18 to 34 Years | 0 (0.0%) | 0 (0.0%) |
| 35 to 64 Years | 10 (2.0%) | 32 (5.4%) |
| 65 to 74 Years | 0 (0.0%) | 11 (6.5%) |
| 75 Years and over | 19 (25.7%) | 9 (11.5%) |
Disability Class: Self-Care Difficulty
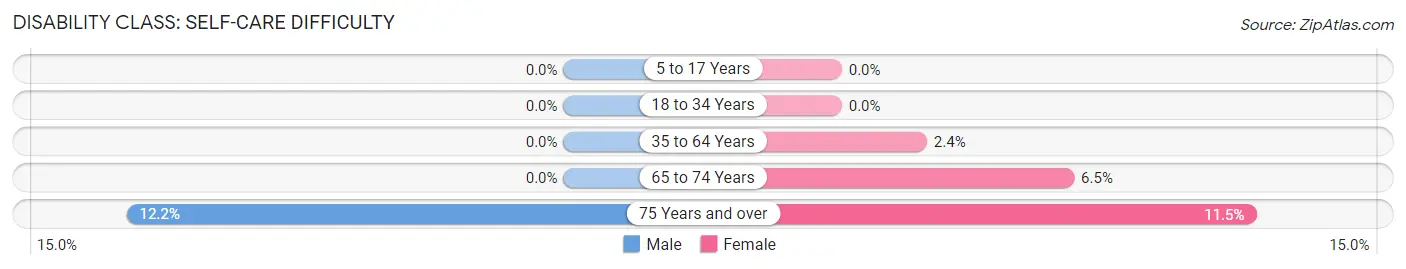
| Age Bracket | Male | Female |
| 5 to 17 Years | 0 (0.0%) | 0 (0.0%) |
| 18 to 34 Years | 0 (0.0%) | 0 (0.0%) |
| 35 to 64 Years | 0 (0.0%) | 14 (2.4%) |
| 65 to 74 Years | 0 (0.0%) | 11 (6.5%) |
| 75 Years and over | 9 (12.2%) | 9 (11.5%) |
Technology Access in Cecil Bishop
Computing Device Access in Cecil Bishop
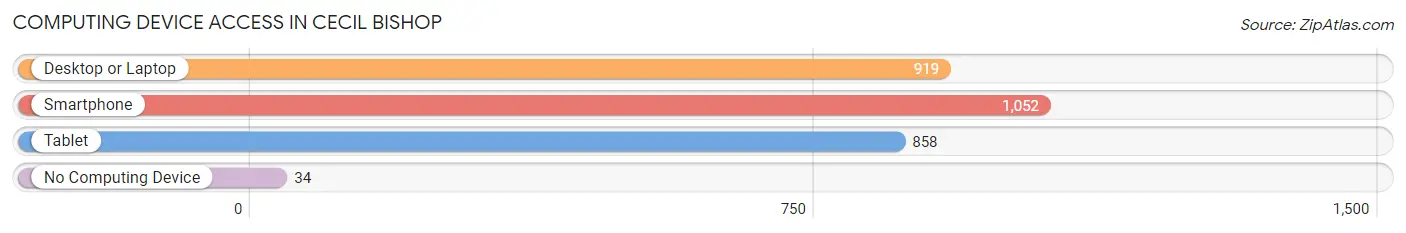
| Device Type | # Households | % Households |
| Desktop or Laptop | 919 | 81.8% |
| Smartphone | 1,052 | 93.6% |
| Tablet | 858 | 76.3% |
| No Computing Device | 34 | 3.0% |
| Total | 1,124 | 100.0% |
Internet Access in Cecil Bishop
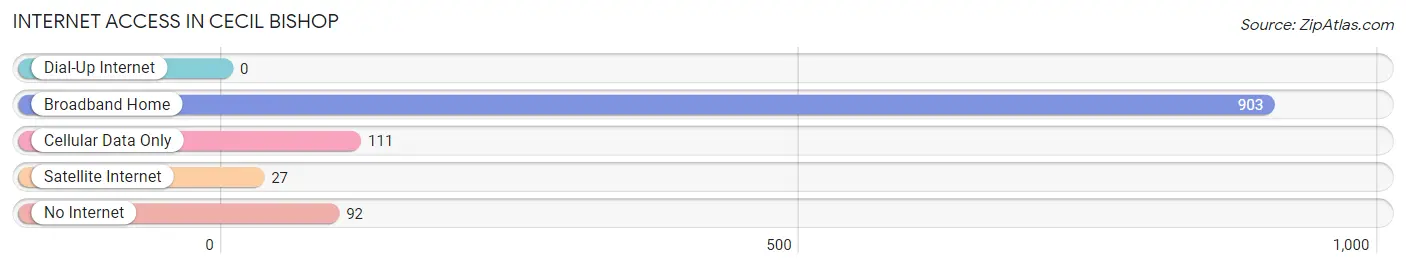
| Internet Type | # Households | % Households |
| Dial-Up Internet | 0 | 0.0% |
| Broadband Home | 903 | 80.3% |
| Cellular Data Only | 111 | 9.9% |
| Satellite Internet | 27 | 2.4% |
| No Internet | 92 | 8.2% |
| Total | 1,124 | 100.0% |
Cecil Bishop Summary
Cecil Bishop is a borough located in Perry County, Pennsylvania. It is situated in the Susquehanna Valley, approximately 10 miles northwest of Harrisburg, the state capital. The borough is home to a population of approximately 1,400 people, and is part of the Harrisburg-Carlisle Metropolitan Statistical Area.
History
Cecil Bishop was founded in 1845 by a group of settlers from Maryland. The town was named after Cecil Bishop, a prominent local landowner. The town was incorporated in 1851, and the first post office was established in 1853.
In the late 19th century, Cecil Bishop was a thriving agricultural community. The town was home to several mills, including a grist mill, a saw mill, and a woolen mill. The town also had a blacksmith shop, a general store, and a hotel.
Geography
Cecil Bishop is located in Perry County, Pennsylvania. It is situated in the Susquehanna Valley, approximately 10 miles northwest of Harrisburg, the state capital. The borough is bordered by the townships of Rye, Carroll, and Tyrone.
The borough has a total area of 0.7 square miles, all of which is land. The terrain is mostly flat, with some rolling hills. The climate is humid continental, with hot summers and cold winters.
Economy
Cecil Bishop’s economy is largely based on agriculture. The town is home to several farms, which produce a variety of crops, including corn, soybeans, and hay. The town also has a few small businesses, including a grocery store, a hardware store, and a restaurant.
Demographics
As of the 2010 census, Cecil Bishop had a population of 1,400 people. The racial makeup of the borough was 97.4% White, 0.6% African American, 0.4% Native American, 0.3% Asian, and 1.3% from other races. The median household income was $45,000, and the median family income was $50,000.
The town is served by the Susquenita School District. The town has one elementary school, one middle school, and one high school. The town also has a public library.
Conclusion
Cecil Bishop is a small borough located in Perry County, Pennsylvania. It is situated in the Susquehanna Valley, approximately 10 miles northwest of Harrisburg, the state capital. The borough is home to a population of approximately 1,400 people, and is part of the Harrisburg-Carlisle Metropolitan Statistical Area. The town’s economy is largely based on agriculture, and the town is served by the Susquenita School District. Cecil Bishop is a small, rural community with a rich history and a bright future.
Common Questions
What is the Total Population of Cecil Bishop?
Total Population of Cecil Bishop is 2,684.
What is the Total Male Population of Cecil Bishop?
Total Male Population of Cecil Bishop is 1,402.
What is the Total Female Population of Cecil Bishop?
Total Female Population of Cecil Bishop is 1,282.
What is the Ratio of Males per 100 Females in Cecil Bishop?
There are 109.36 Males per 100 Females in Cecil Bishop.
What is the Ratio of Females per 100 Males in Cecil Bishop?
There are 91.44 Females per 100 Males in Cecil Bishop.
What is the Median Population Age in Cecil Bishop?
Median Population Age in Cecil Bishop is 38.5 Years.
What is the Average Family Size in Cecil Bishop
Average Family Size in Cecil Bishop is 2.8 People.
What is the Average Household Size in Cecil Bishop
Average Household Size in Cecil Bishop is 2.4 People.
What is Per Capita Income in Cecil Bishop?
Per Capita income in Cecil Bishop is $45,603.
What is the Median Family Income in Cecil Bishop?
Median Family Income in Cecil Bishop is $135,474.
What is the Median Household income in Cecil Bishop?
Median Household Income in Cecil Bishop is $89,900.
What is Income or Wage Gap in Cecil Bishop?
Income or Wage Gap in Cecil Bishop is 38.5%.
Women in Cecil Bishop earn 61.5 cents for every dollar earned by a man.
What is Inequality or Gini Index in Cecil Bishop?
Inequality or Gini Index in Cecil Bishop is 0.38.
How Large is the Labor Force in Cecil Bishop?
There are 1,552 People in the Labor Forcein in Cecil Bishop.
What is the Percentage of People in the Labor Force in Cecil Bishop?
71.0% of People are in the Labor Force in Cecil Bishop.
What is the Unemployment Rate in Cecil Bishop?
Unemployment Rate in Cecil Bishop is 2.7%.