Castanea, PA
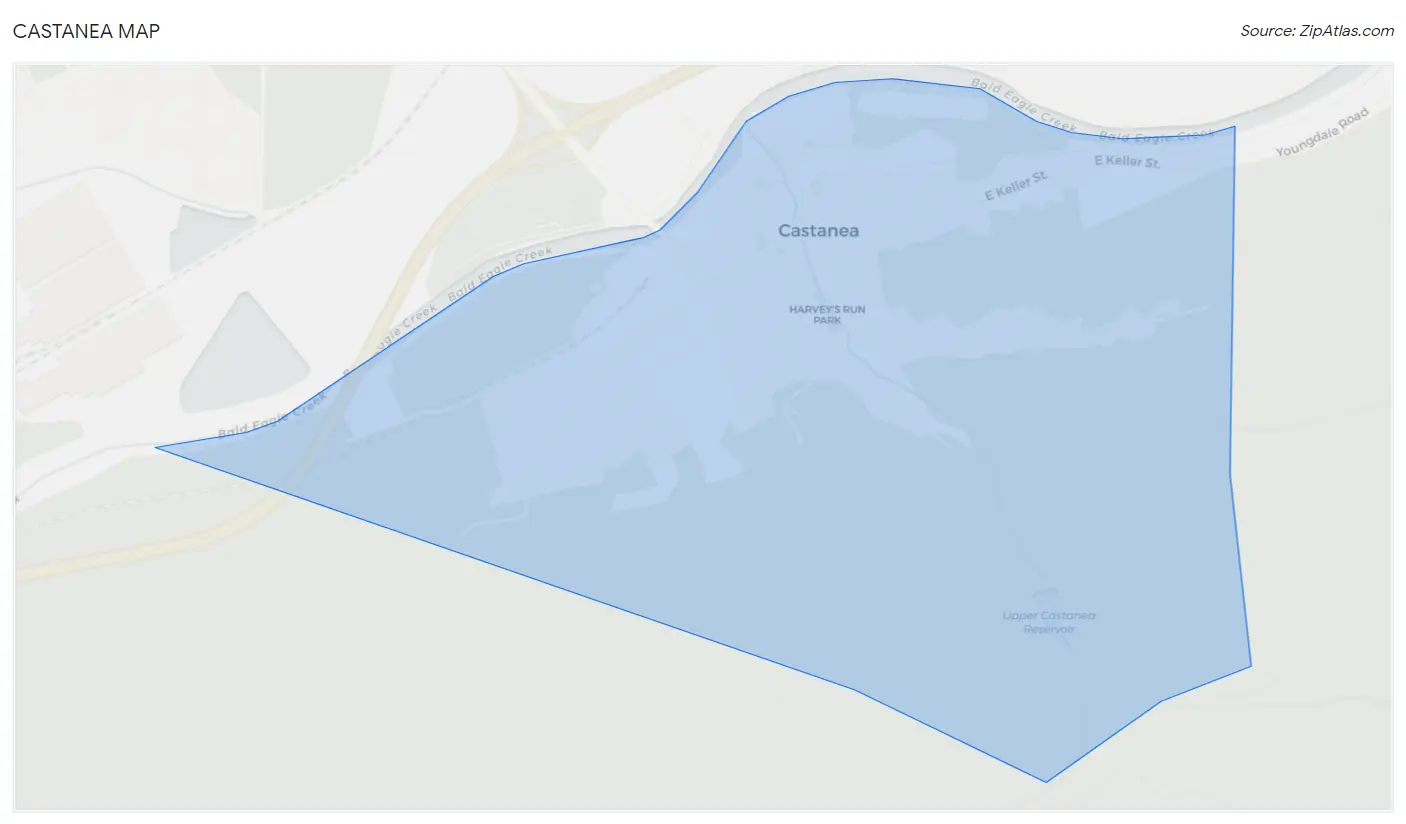
Castanea Map
Castanea Overview
1,137
TOTAL POPULATION
535
MALE POPULATION
602
FEMALE POPULATION
88.87
MALES / 100 FEMALES
112.52
FEMALES / 100 MALES
44.1
MEDIAN AGE
2.7
AVG FAMILY SIZE
2.2
AVG HOUSEHOLD SIZE
$35,655
PER CAPITA INCOME
$71,719
AVG FAMILY INCOME
$57,778
AVG HOUSEHOLD INCOME
38.2%
WAGE / INCOME GAP [ % ]
61.8¢/ $1
WAGE / INCOME GAP [ $ ]
0.37
INEQUALITY / GINI INDEX
666
LABOR FORCE [ PEOPLE ]
66.6%
PERCENT IN LABOR FORCE
2.6%
UNEMPLOYMENT RATE
Castanea Area Codes
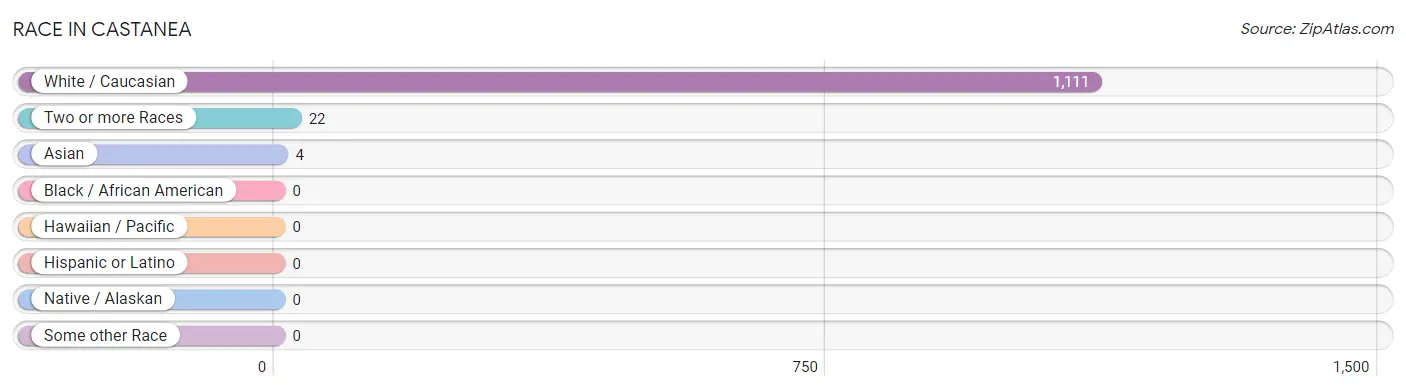
Race in Castanea
The most populous races in Castanea are White / Caucasian (1,111 | 97.7%), Two or more Races (22 | 1.9%), and Asian (4 | 0.4%).
| Race | # Population | % Population |
| Asian | 4 | 0.4% |
| Black / African American | 0 | 0.0% |
| Hawaiian / Pacific | 0 | 0.0% |
| Hispanic or Latino | 0 | 0.0% |
| Native / Alaskan | 0 | 0.0% |
| White / Caucasian | 1,111 | 97.7% |
| Two or more Races | 22 | 1.9% |
| Some other Race | 0 | 0.0% |
| Total | 1,137 | 100.0% |
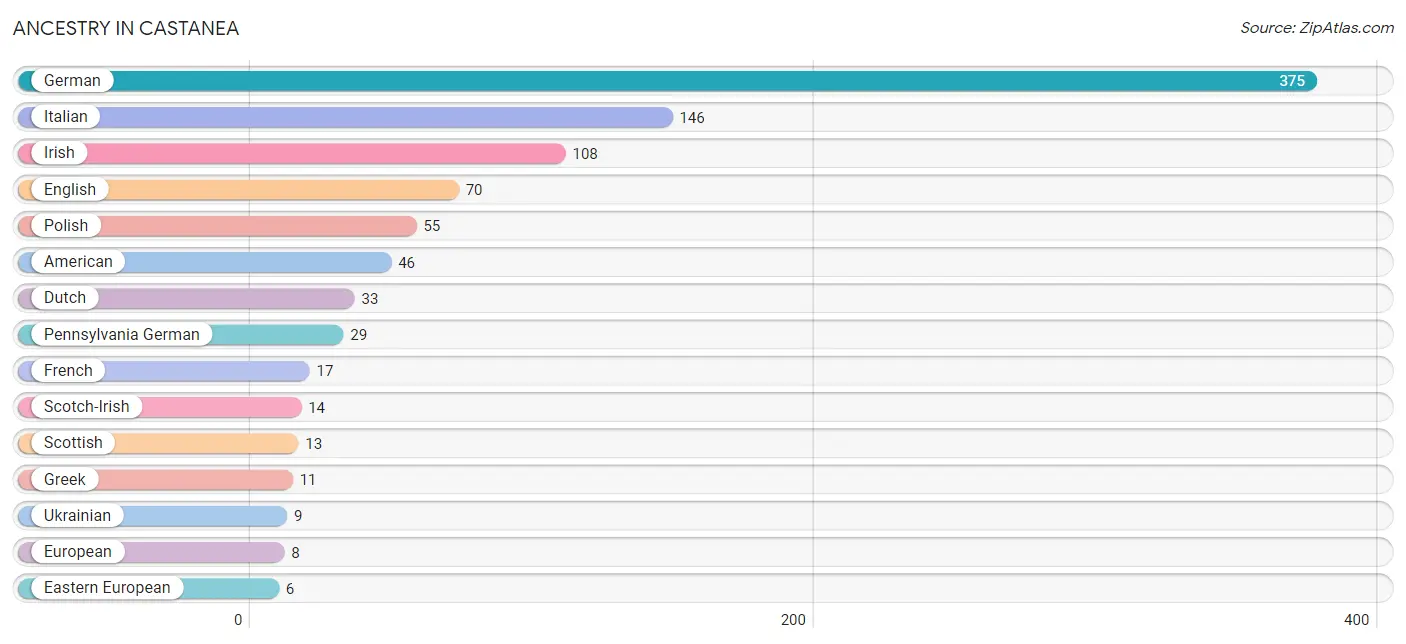
Ancestry in Castanea
The most populous ancestries reported in Castanea are German (375 | 33.0%), Italian (146 | 12.8%), Irish (108 | 9.5%), English (70 | 6.2%), and Polish (55 | 4.8%), together accounting for 66.3% of all Castanea residents.
| Ancestry | # Population | % Population |
| American | 46 | 4.1% |
| British | 3 | 0.3% |
| Dutch | 33 | 2.9% |
| Eastern European | 6 | 0.5% |
| English | 70 | 6.2% |
| European | 8 | 0.7% |
| French | 17 | 1.5% |
| German | 375 | 33.0% |
| Greek | 11 | 1.0% |
| Indian (Asian) | 4 | 0.4% |
| Irish | 108 | 9.5% |
| Italian | 146 | 12.8% |
| Norwegian | 3 | 0.3% |
| Pennsylvania German | 29 | 2.5% |
| Polish | 55 | 4.8% |
| Russian | 3 | 0.3% |
| Scotch-Irish | 14 | 1.2% |
| Scottish | 13 | 1.1% |
| Swedish | 3 | 0.3% |
| Swiss | 2 | 0.2% |
| Ukrainian | 9 | 0.8% |
| Welsh | 4 | 0.4% | View All 22 Rows |
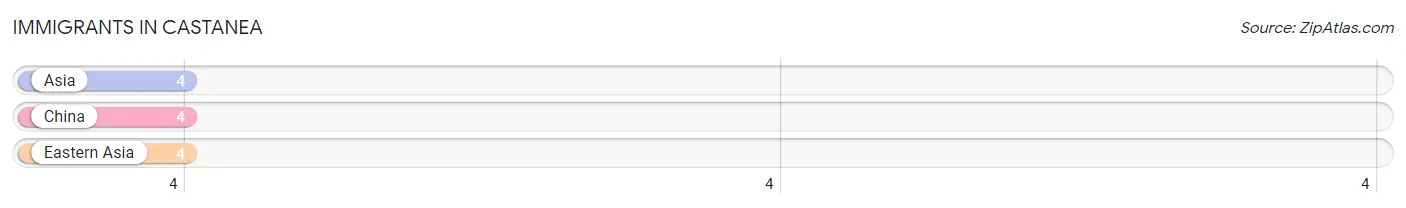
Immigrants in Castanea
The most numerous immigrant groups reported in Castanea came from Asia (4 | 0.4%), China (4 | 0.4%), and Eastern Asia (4 | 0.4%), together accounting for 1.1% of all Castanea residents.
| Immigration Origin | # Population | % Population |
| Asia | 4 | 0.4% |
| China | 4 | 0.4% |
| Eastern Asia | 4 | 0.4% | View All 3 Rows |
Sex and Age in Castanea
Sex and Age in Castanea
The most populous age groups in Castanea are 50 to 54 Years (70 | 13.1%) for men and 20 to 24 Years (75 | 12.5%) for women.
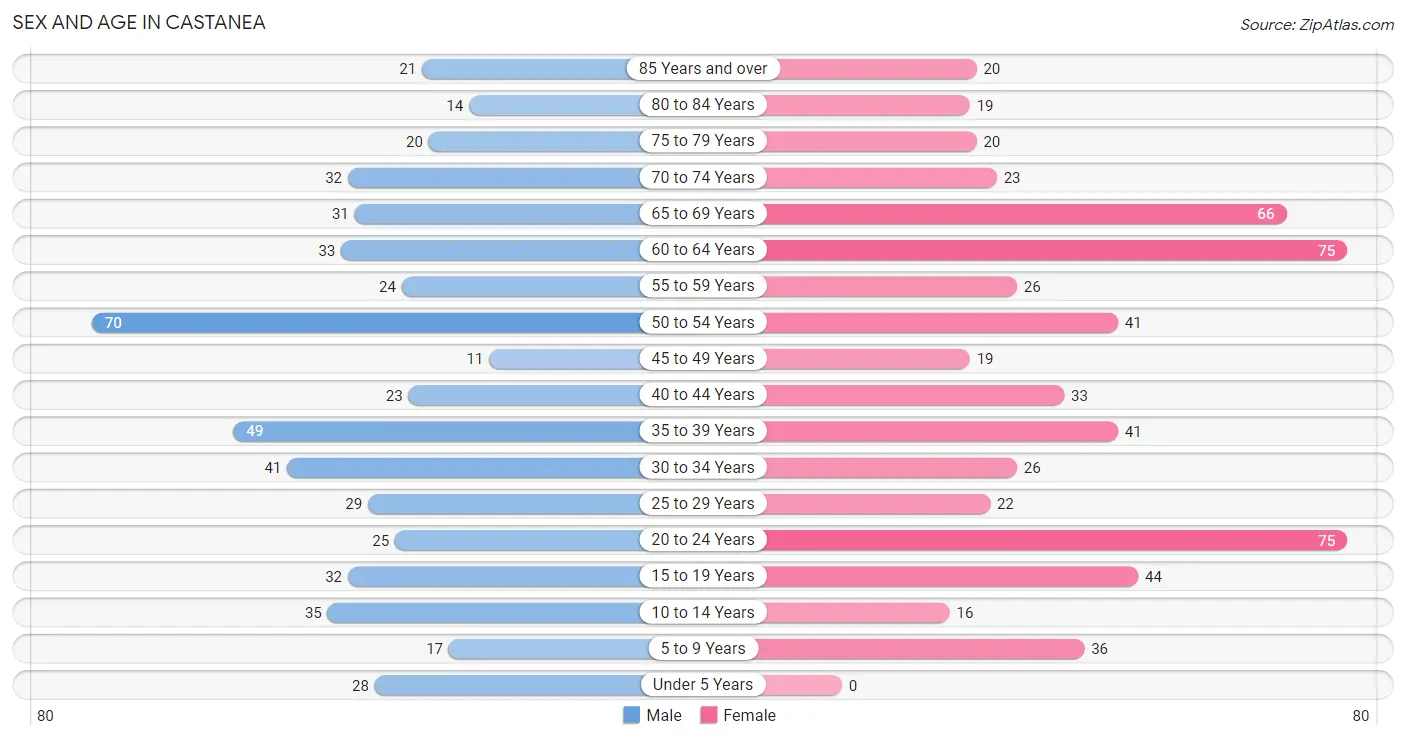
| Age Bracket | Male | Female |
| Under 5 Years | 28 (5.2%) | 0 (0.0%) |
| 5 to 9 Years | 17 (3.2%) | 36 (6.0%) |
| 10 to 14 Years | 35 (6.5%) | 16 (2.7%) |
| 15 to 19 Years | 32 (6.0%) | 44 (7.3%) |
| 20 to 24 Years | 25 (4.7%) | 75 (12.5%) |
| 25 to 29 Years | 29 (5.4%) | 22 (3.6%) |
| 30 to 34 Years | 41 (7.7%) | 26 (4.3%) |
| 35 to 39 Years | 49 (9.2%) | 41 (6.8%) |
| 40 to 44 Years | 23 (4.3%) | 33 (5.5%) |
| 45 to 49 Years | 11 (2.1%) | 19 (3.2%) |
| 50 to 54 Years | 70 (13.1%) | 41 (6.8%) |
| 55 to 59 Years | 24 (4.5%) | 26 (4.3%) |
| 60 to 64 Years | 33 (6.2%) | 75 (12.5%) |
| 65 to 69 Years | 31 (5.8%) | 66 (11.0%) |
| 70 to 74 Years | 32 (6.0%) | 23 (3.8%) |
| 75 to 79 Years | 20 (3.7%) | 20 (3.3%) |
| 80 to 84 Years | 14 (2.6%) | 19 (3.2%) |
| 85 Years and over | 21 (3.9%) | 20 (3.3%) |
| Total | 535 (100.0%) | 602 (100.0%) |
Families and Households in Castanea
Median Family Size in Castanea
The median family size in Castanea is 2.73 persons per family, with single male/father families (62 | 20.3%) accounting for the largest median family size of 2.89 persons per family. On the other hand, single female/mother families (23 | 7.5%) represent the smallest median family size with 2.43 persons per family.
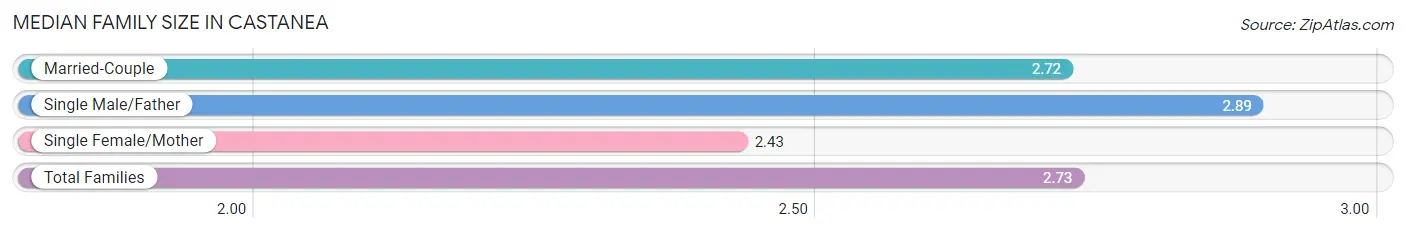
| Family Type | # Families | Family Size |
| Married-Couple | 220 (72.1%) | 2.72 |
| Single Male/Father | 62 (20.3%) | 2.89 |
| Single Female/Mother | 23 (7.5%) | 2.43 |
| Total Families | 305 (100.0%) | 2.73 |
Median Household Size in Castanea
The median household size in Castanea is 2.18 persons per household, with single male/father households (62 | 11.9%) accounting for the largest median household size of 3.26 persons per household. non-family households (217 | 41.6%) represent the smallest median household size with 1.29 persons per household.
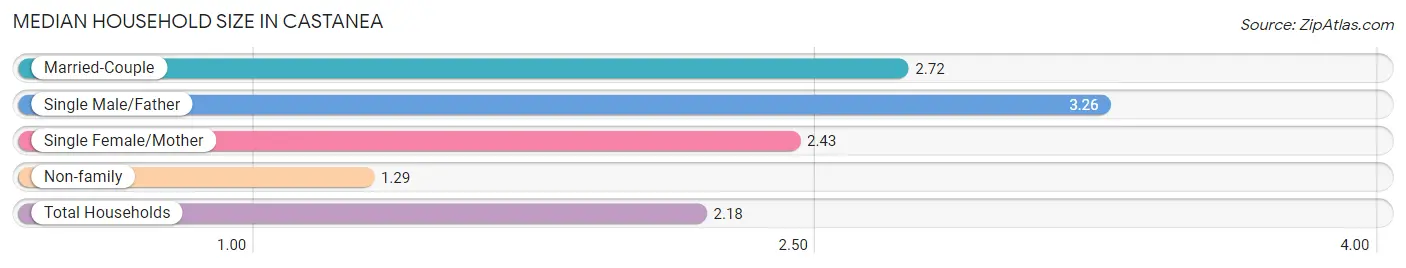
| Household Type | # Households | Household Size |
| Married-Couple | 220 (42.1%) | 2.72 |
| Single Male/Father | 62 (11.9%) | 3.26 |
| Single Female/Mother | 23 (4.4%) | 2.43 |
| Non-family | 217 (41.6%) | 1.29 |
| Total Households | 522 (100.0%) | 2.18 |
Household Size by Marriage Status in Castanea
Out of a total of 522 households in Castanea, 305 (58.4%) are family households, while 217 (41.6%) are nonfamily households. The most numerous type of family households are 2-person households, comprising 162, and the most common type of nonfamily households are 1-person households, comprising 152.
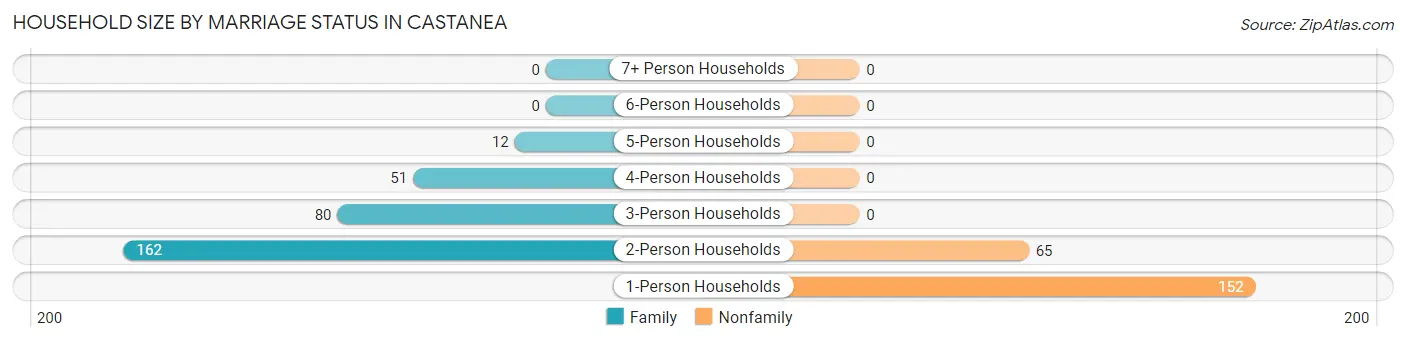
| Household Size | Family Households | Nonfamily Households |
| 1-Person Households | - | 152 (29.1%) |
| 2-Person Households | 162 (31.0%) | 65 (12.4%) |
| 3-Person Households | 80 (15.3%) | 0 (0.0%) |
| 4-Person Households | 51 (9.8%) | 0 (0.0%) |
| 5-Person Households | 12 (2.3%) | 0 (0.0%) |
| 6-Person Households | 0 (0.0%) | 0 (0.0%) |
| 7+ Person Households | 0 (0.0%) | 0 (0.0%) |
| Total | 305 (58.4%) | 217 (41.6%) |
Female Fertility in Castanea
Fertility by Age in Castanea
| Age Bracket | Women with Births | Births / 1,000 Women |
| 15 to 19 years | 0 (0.0%) | 0.0 |
| 20 to 34 years | 0 (0.0%) | 0.0 |
| 35 to 50 years | 0 (0.0%) | 0.0 |
| Total | 0 (0.0%) | 0.0 |
Fertility by Age by Marriage Status in Castanea
| Age Bracket | Married | Unmarried |
| 15 to 19 years | 0 (0.0%) | 0 (0.0%) |
| 20 to 34 years | 0 (0.0%) | 0 (0.0%) |
| 35 to 50 years | 0 (0.0%) | 0 (0.0%) |
| Total | 0 (0.0%) | 0 (0.0%) |
Fertility by Education in Castanea
| Educational Attainment | Women with Births | Births / 1,000 Women |
| Less than High School | 0 (0.0%) | 0.0 |
| High School Diploma | 0 (0.0%) | 0.0 |
| College or Associate's Degree | 0 (0.0%) | 0.0 |
| Bachelor's Degree | 0 (0.0%) | 0.0 |
| Graduate Degree | 0 (0.0%) | 0.0 |
| Total | 0 (0.0%) | 0.0 |
Fertility by Education by Marriage Status in Castanea
| Educational Attainment | Married | Unmarried |
| Less than High School | 0 (0.0%) | 0 (0.0%) |
| High School Diploma | 0 (0.0%) | 0 (0.0%) |
| College or Associate's Degree | 0 (0.0%) | 0 (0.0%) |
| Bachelor's Degree | 0 (0.0%) | 0 (0.0%) |
| Graduate Degree | 0 (0.0%) | 0 (0.0%) |
| Total | 0 (0.0%) | 0 (0.0%) |
Income in Castanea
Income Overview in Castanea
Per Capita Income in Castanea is $35,655, while median incomes of families and households are $71,719 and $57,778 respectively.
| Characteristic | Number | Measure |
| Per Capita Income | 1,137 | $35,655 |
| Median Family Income | 305 | $71,719 |
| Mean Family Income | 305 | $85,651 |
| Median Household Income | 522 | $57,778 |
| Mean Household Income | 522 | $74,246 |
| Income Deficit | 305 | $0 |
| Wage / Income Gap (%) | 1,137 | 38.24% |
| Wage / Income Gap ($) | 1,137 | 61.76¢ per $1 |
| Gini / Inequality Index | 1,137 | 0.37 |
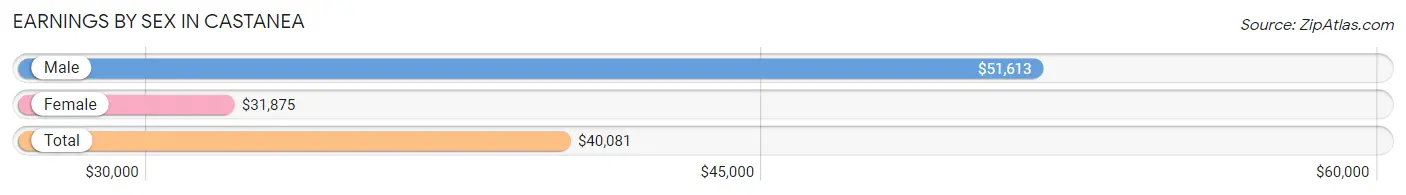
Earnings by Sex in Castanea
Average Earnings in Castanea are $40,081, $51,613 for men and $31,875 for women, a difference of 38.2%.
| Sex | Number | Average Earnings |
| Male | 312 (47.1%) | $51,613 |
| Female | 350 (52.9%) | $31,875 |
| Total | 662 (100.0%) | $40,081 |
Earnings by Sex by Income Bracket in Castanea
The most common earnings brackets in Castanea are $55,000 to $64,999 for men (46 | 14.7%) and $5,000 to $7,499 for women (44 | 12.6%).
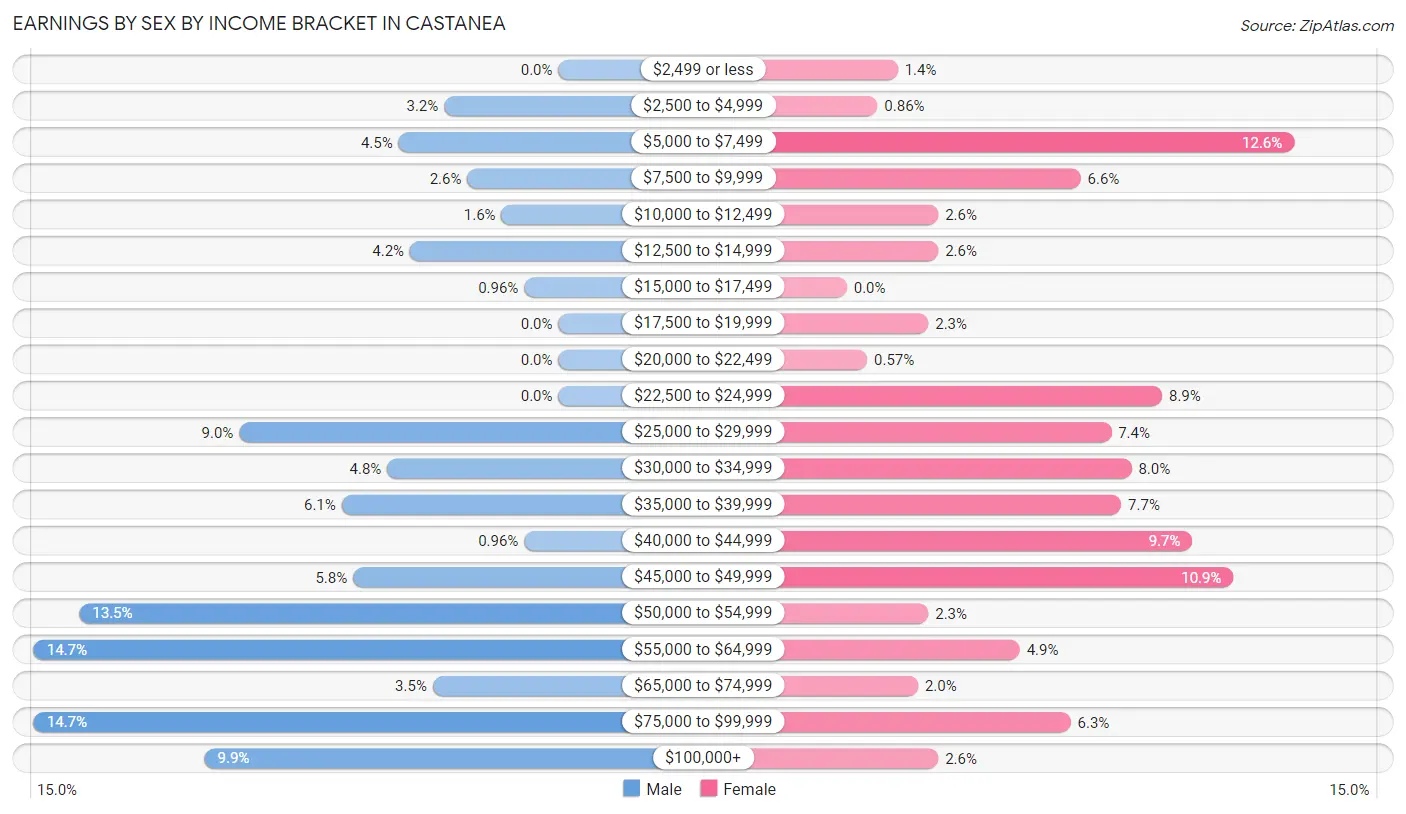
| Income | Male | Female |
| $2,499 or less | 0 (0.0%) | 5 (1.4%) |
| $2,500 to $4,999 | 10 (3.2%) | 3 (0.9%) |
| $5,000 to $7,499 | 14 (4.5%) | 44 (12.6%) |
| $7,500 to $9,999 | 8 (2.6%) | 23 (6.6%) |
| $10,000 to $12,499 | 5 (1.6%) | 9 (2.6%) |
| $12,500 to $14,999 | 13 (4.2%) | 9 (2.6%) |
| $15,000 to $17,499 | 3 (1.0%) | 0 (0.0%) |
| $17,500 to $19,999 | 0 (0.0%) | 8 (2.3%) |
| $20,000 to $22,499 | 0 (0.0%) | 2 (0.6%) |
| $22,500 to $24,999 | 0 (0.0%) | 31 (8.9%) |
| $25,000 to $29,999 | 28 (9.0%) | 26 (7.4%) |
| $30,000 to $34,999 | 15 (4.8%) | 28 (8.0%) |
| $35,000 to $39,999 | 19 (6.1%) | 27 (7.7%) |
| $40,000 to $44,999 | 3 (1.0%) | 34 (9.7%) |
| $45,000 to $49,999 | 18 (5.8%) | 38 (10.9%) |
| $50,000 to $54,999 | 42 (13.5%) | 8 (2.3%) |
| $55,000 to $64,999 | 46 (14.7%) | 17 (4.9%) |
| $65,000 to $74,999 | 11 (3.5%) | 7 (2.0%) |
| $75,000 to $99,999 | 46 (14.7%) | 22 (6.3%) |
| $100,000+ | 31 (9.9%) | 9 (2.6%) |
| Total | 312 (100.0%) | 350 (100.0%) |
Earnings by Sex by Educational Attainment in Castanea
Average earnings in Castanea are $52,218 for men and $40,726 for women, a difference of 22.0%. Men with an educational attainment of bachelor's degree enjoy the highest average annual earnings of $122,917, while those with less than high school education earn the least with $33,750. Women with an educational attainment of bachelor's degree earn the most with the average annual earnings of $55,833, while those with less than high school education have the smallest earnings of $6,458.
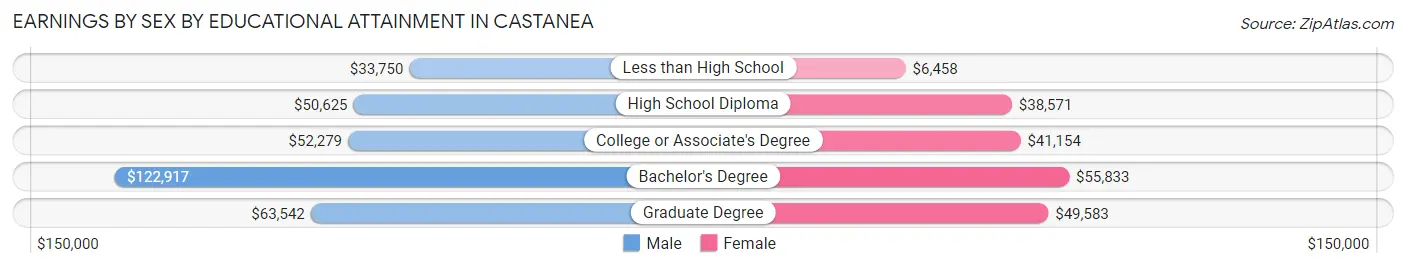
| Educational Attainment | Male Income | Female Income |
| Less than High School | $33,750 | $6,458 |
| High School Diploma | $50,625 | $38,571 |
| College or Associate's Degree | $52,279 | $41,154 |
| Bachelor's Degree | $122,917 | $55,833 |
| Graduate Degree | $63,542 | $49,583 |
| Total | $52,218 | $40,726 |
Family Income in Castanea
Family Income Brackets in Castanea
According to the Castanea family income data, there are 73 families falling into the $50,000 to $74,999 income range, which is the most common income bracket and makes up 23.9% of all families.
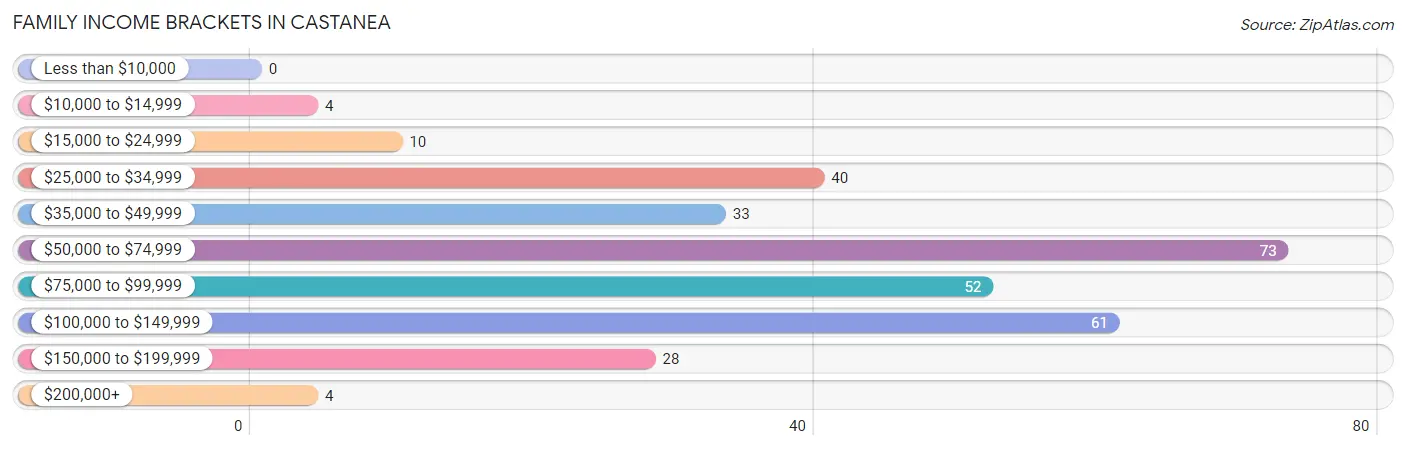
| Income Bracket | # Families | % Families |
| Less than $10,000 | 0 | 0.0% |
| $10,000 to $14,999 | 4 | 1.3% |
| $15,000 to $24,999 | 10 | 3.3% |
| $25,000 to $34,999 | 40 | 13.1% |
| $35,000 to $49,999 | 33 | 10.8% |
| $50,000 to $74,999 | 73 | 23.9% |
| $75,000 to $99,999 | 52 | 17.0% |
| $100,000 to $149,999 | 61 | 20.0% |
| $150,000 to $199,999 | 28 | 9.2% |
| $200,000+ | 4 | 1.3% |
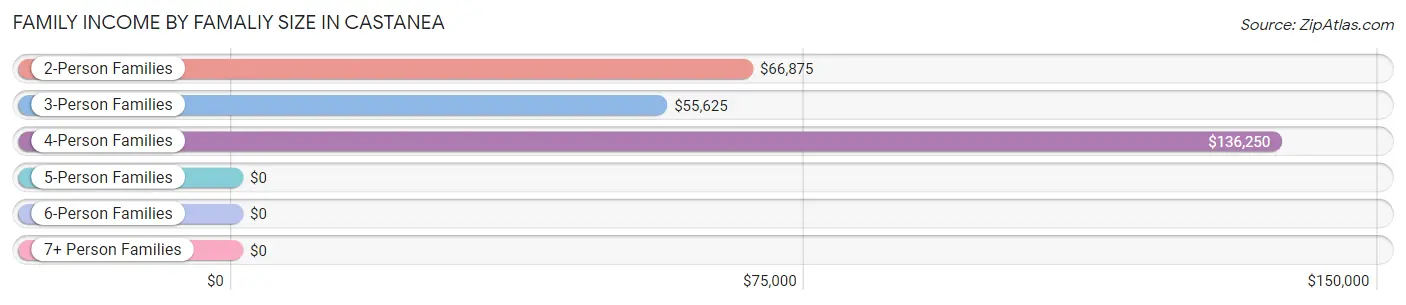
Family Income by Famaliy Size in Castanea
4-person families (36 | 11.8%) account for the highest median family income in Castanea with $136,250 per family, while 4-person families (36 | 11.8%) have the highest median income of $34,062 per family member.
| Income Bracket | # Families | Median Income |
| 2-Person Families | 174 (57.1%) | $66,875 |
| 3-Person Families | 83 (27.2%) | $55,625 |
| 4-Person Families | 36 (11.8%) | $136,250 |
| 5-Person Families | 12 (3.9%) | $0 |
| 6-Person Families | 0 (0.0%) | $0 |
| 7+ Person Families | 0 (0.0%) | $0 |
| Total | 305 (100.0%) | $71,719 |
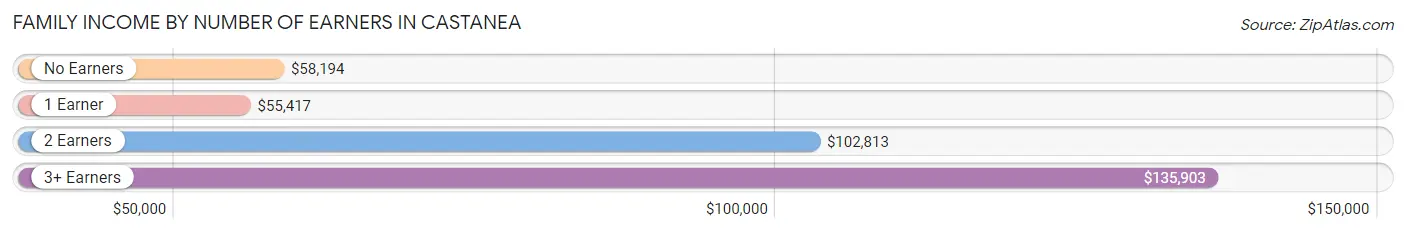
Family Income by Number of Earners in Castanea
The median family income in Castanea is $71,719, with families comprising 3+ earners (33) having the highest median family income of $135,903, while families with 1 earner (136) have the lowest median family income of $55,417, accounting for 10.8% and 44.6% of families, respectively.
| Number of Earners | # Families | Median Income |
| No Earners | 57 (18.7%) | $58,194 |
| 1 Earner | 136 (44.6%) | $55,417 |
| 2 Earners | 79 (25.9%) | $102,813 |
| 3+ Earners | 33 (10.8%) | $135,903 |
| Total | 305 (100.0%) | $71,719 |
Household Income in Castanea
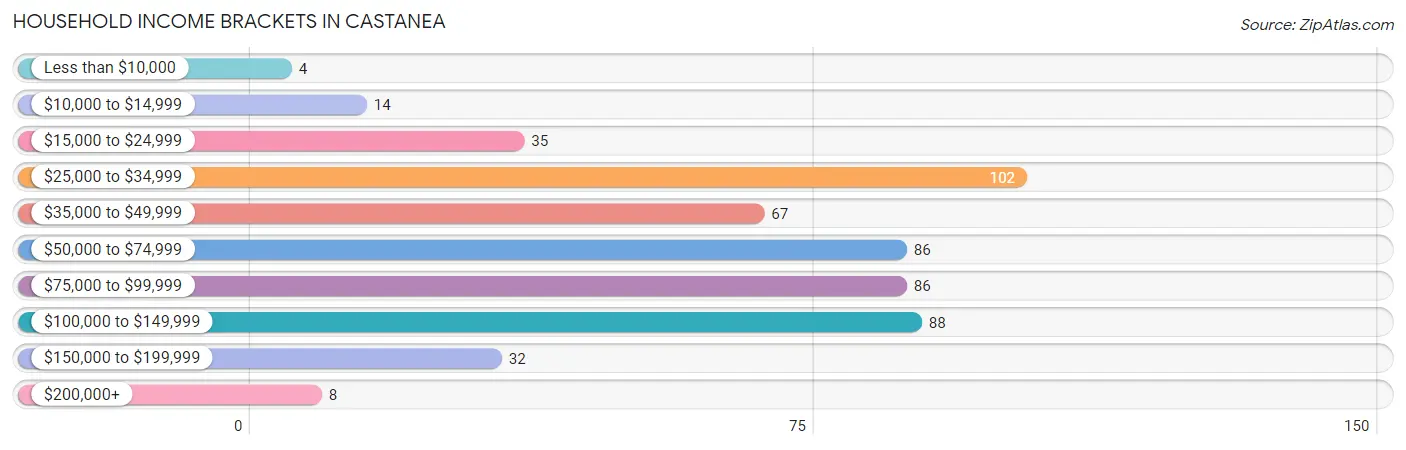
Household Income Brackets in Castanea
With 102 households falling in the category, the $25,000 to $34,999 income range is the most frequent in Castanea, accounting for 19.5% of all households. In contrast, only 4 households (0.8%) fall into the less than $10,000 income bracket, making it the least populous group.
| Income Bracket | # Households | % Households |
| Less than $10,000 | 4 | 0.8% |
| $10,000 to $14,999 | 14 | 2.7% |
| $15,000 to $24,999 | 35 | 6.7% |
| $25,000 to $34,999 | 102 | 19.5% |
| $35,000 to $49,999 | 67 | 12.8% |
| $50,000 to $74,999 | 86 | 16.5% |
| $75,000 to $99,999 | 86 | 16.5% |
| $100,000 to $149,999 | 88 | 16.9% |
| $150,000 to $199,999 | 32 | 6.1% |
| $200,000+ | 8 | 1.5% |
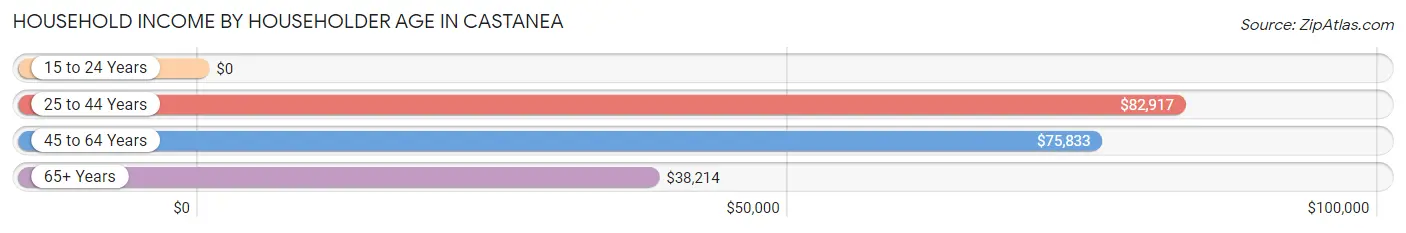
Household Income by Householder Age in Castanea
The median household income in Castanea is $57,778, with the highest median household income of $82,917 found in the 25 to 44 years age bracket for the primary householder. A total of 150 households (28.7%) fall into this category. Meanwhile, the 15 to 24 years age bracket for the primary householder has the lowest median household income of $0, with 30 households (5.8%) in this group.
| Income Bracket | # Households | Median Income |
| 15 to 24 Years | 30 (5.8%) | $0 |
| 25 to 44 Years | 150 (28.7%) | $82,917 |
| 45 to 64 Years | 168 (32.2%) | $75,833 |
| 65+ Years | 174 (33.3%) | $38,214 |
| Total | 522 (100.0%) | $57,778 |
Poverty in Castanea
Income Below Poverty by Sex and Age in Castanea
With 6.9% poverty level for males and 5.8% for females among the residents of Castanea, 18 to 24 year old males and 25 to 34 year old females are the most vulnerable to poverty, with 16 males (47.1%) and 17 females (35.4%) in their respective age groups living below the poverty level.
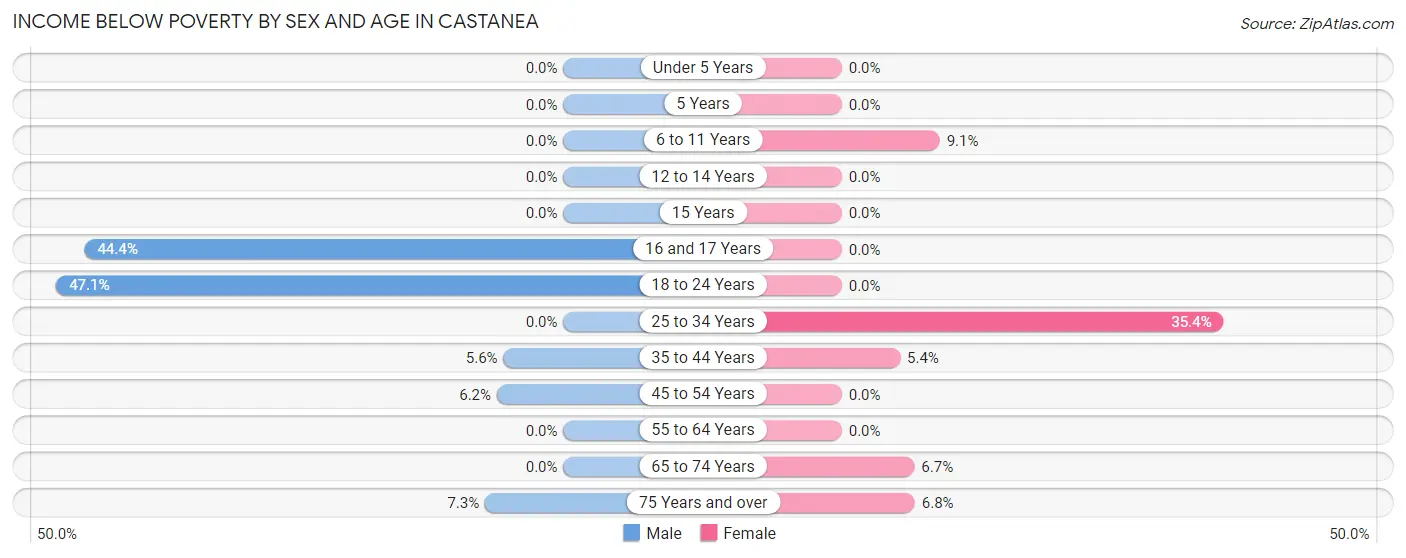
| Age Bracket | Male | Female |
| Under 5 Years | 0 (0.0%) | 0 (0.0%) |
| 5 Years | 0 (0.0%) | 0 (0.0%) |
| 6 to 11 Years | 0 (0.0%) | 4 (9.1%) |
| 12 to 14 Years | 0 (0.0%) | 0 (0.0%) |
| 15 Years | 0 (0.0%) | 0 (0.0%) |
| 16 and 17 Years | 8 (44.4%) | 0 (0.0%) |
| 18 to 24 Years | 16 (47.1%) | 0 (0.0%) |
| 25 to 34 Years | 0 (0.0%) | 17 (35.4%) |
| 35 to 44 Years | 4 (5.6%) | 4 (5.4%) |
| 45 to 54 Years | 5 (6.2%) | 0 (0.0%) |
| 55 to 64 Years | 0 (0.0%) | 0 (0.0%) |
| 65 to 74 Years | 0 (0.0%) | 6 (6.7%) |
| 75 Years and over | 4 (7.3%) | 4 (6.8%) |
| Total | 37 (6.9%) | 35 (5.8%) |
Income Above Poverty by Sex and Age in Castanea
According to the poverty statistics in Castanea, males aged under 5 years and females aged 12 to 14 years are the age groups that are most secure financially, with 100.0% of males and 100.0% of females in these age groups living above the poverty line.
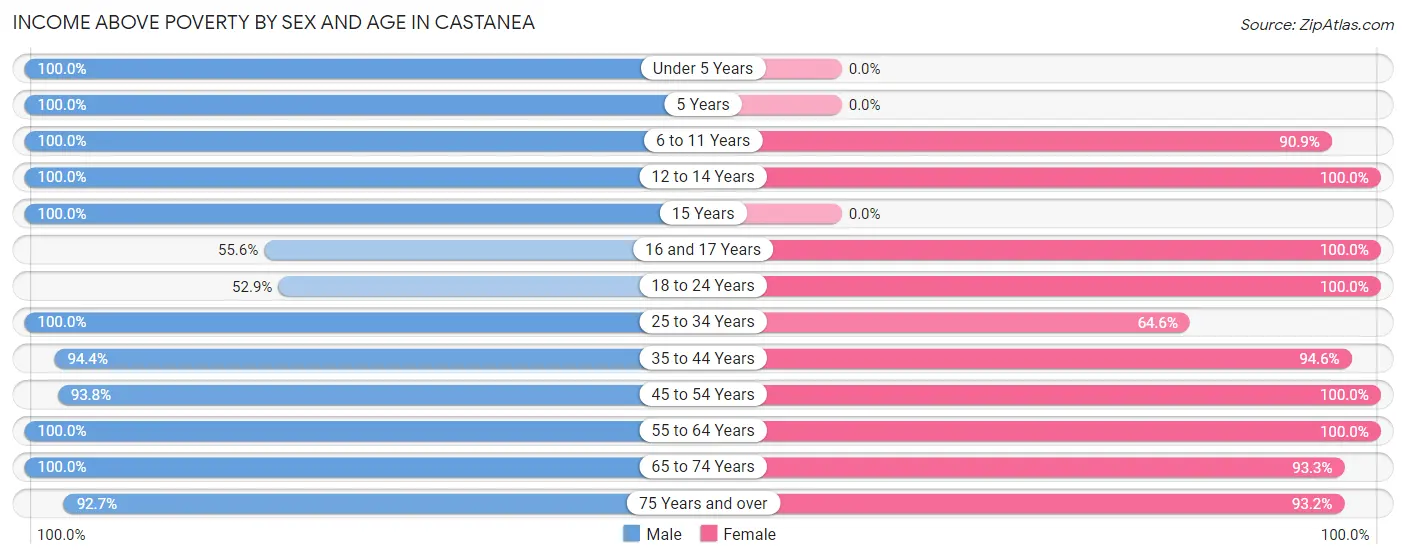
| Age Bracket | Male | Female |
| Under 5 Years | 28 (100.0%) | 0 (0.0%) |
| 5 Years | 7 (100.0%) | 0 (0.0%) |
| 6 to 11 Years | 29 (100.0%) | 40 (90.9%) |
| 12 to 14 Years | 16 (100.0%) | 8 (100.0%) |
| 15 Years | 5 (100.0%) | 0 (0.0%) |
| 16 and 17 Years | 10 (55.6%) | 31 (100.0%) |
| 18 to 24 Years | 18 (52.9%) | 88 (100.0%) |
| 25 to 34 Years | 70 (100.0%) | 31 (64.6%) |
| 35 to 44 Years | 68 (94.4%) | 70 (94.6%) |
| 45 to 54 Years | 76 (93.8%) | 60 (100.0%) |
| 55 to 64 Years | 57 (100.0%) | 101 (100.0%) |
| 65 to 74 Years | 63 (100.0%) | 83 (93.3%) |
| 75 Years and over | 51 (92.7%) | 55 (93.2%) |
| Total | 498 (93.1%) | 567 (94.2%) |
Income Below Poverty Among Married-Couple Families in Castanea
The poverty statistics for married-couple families in Castanea show that 3.6% or 8 of the total 220 families live below the poverty line. Families with 1 or 2 children have the highest poverty rate of 8.3%, comprising of 4 families. On the other hand, families with 3 or 4 children have the lowest poverty rate of 0.0%, which includes 0 families.
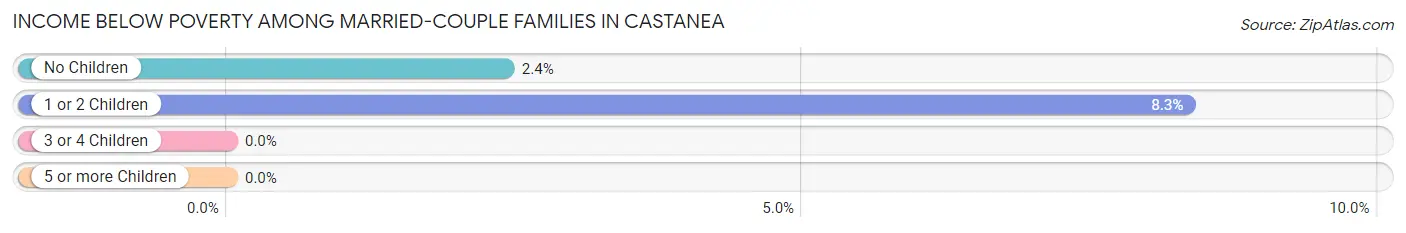
| Children | Above Poverty | Below Poverty |
| No Children | 162 (97.6%) | 4 (2.4%) |
| 1 or 2 Children | 44 (91.7%) | 4 (8.3%) |
| 3 or 4 Children | 6 (100.0%) | 0 (0.0%) |
| 5 or more Children | 0 (0.0%) | 0 (0.0%) |
| Total | 212 (96.4%) | 8 (3.6%) |
Income Below Poverty Among Single-Parent Households in Castanea
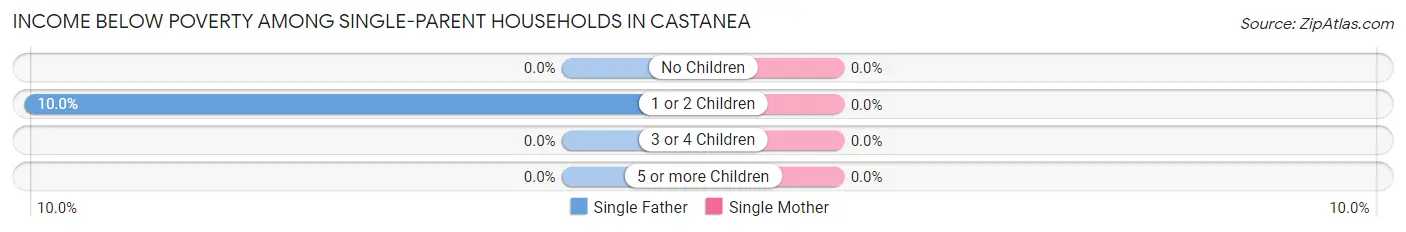
| Children | Single Father | Single Mother |
| No Children | 0 (0.0%) | 0 (0.0%) |
| 1 or 2 Children | 5 (10.0%) | 0 (0.0%) |
| 3 or 4 Children | 0 (0.0%) | 0 (0.0%) |
| 5 or more Children | 0 (0.0%) | 0 (0.0%) |
| Total | 5 (8.1%) | 0 (0.0%) |
Income Below Poverty Among Married-Couple vs Single-Parent Households in Castanea
The poverty data for Castanea shows that 8 of the married-couple family households (3.6%) and 5 of the single-parent households (5.9%) are living below the poverty level. Within the married-couple family households, those with 1 or 2 children have the highest poverty rate, with 4 households (8.3%) falling below the poverty line. Among the single-parent households, those with 1 or 2 children have the highest poverty rate, with 5 household (7.1%) living below poverty.
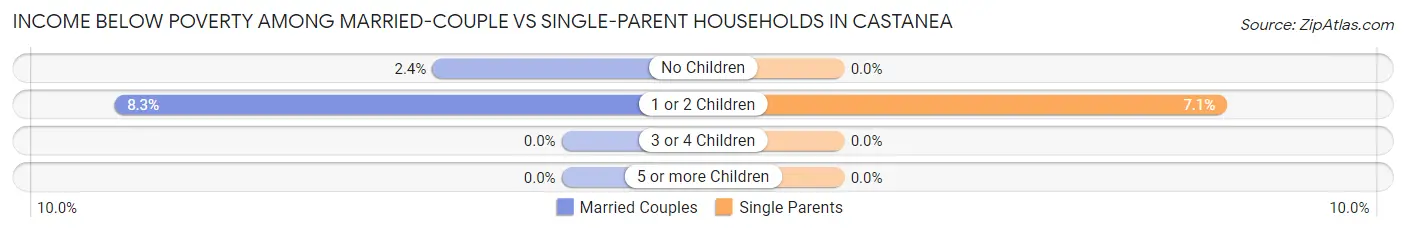
| Children | Married-Couple Families | Single-Parent Households |
| No Children | 4 (2.4%) | 0 (0.0%) |
| 1 or 2 Children | 4 (8.3%) | 5 (7.1%) |
| 3 or 4 Children | 0 (0.0%) | 0 (0.0%) |
| 5 or more Children | 0 (0.0%) | 0 (0.0%) |
| Total | 8 (3.6%) | 5 (5.9%) |
Employment Characteristics in Castanea
Employment by Class of Employer in Castanea
Among the 626 employed individuals in Castanea, private company employees (474 | 75.7%), not-for-profit organizations (78 | 12.5%), and state government employees (37 | 5.9%) make up the most common classes of employment.
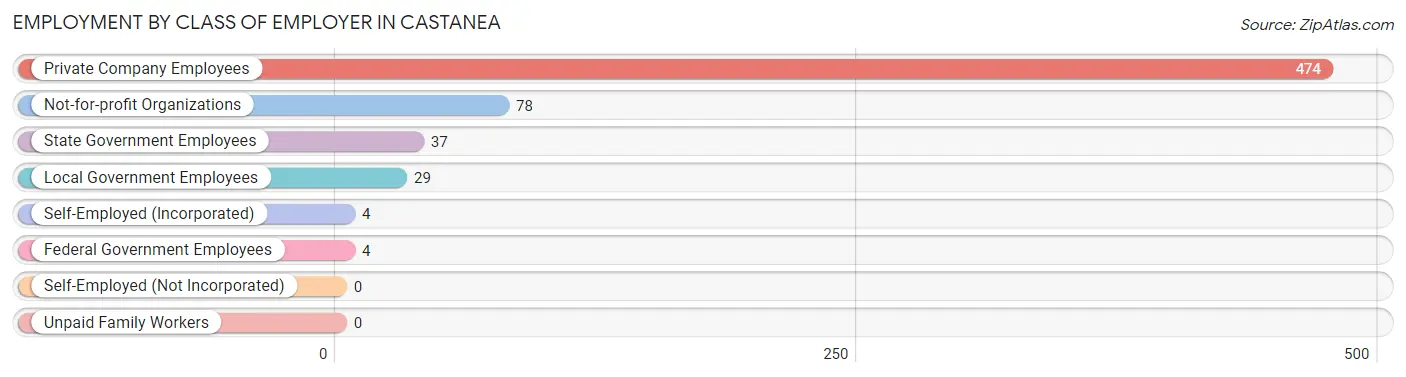
| Employer Class | # Employees | % Employees |
| Private Company Employees | 474 | 75.7% |
| Self-Employed (Incorporated) | 4 | 0.6% |
| Self-Employed (Not Incorporated) | 0 | 0.0% |
| Not-for-profit Organizations | 78 | 12.5% |
| Local Government Employees | 29 | 4.6% |
| State Government Employees | 37 | 5.9% |
| Federal Government Employees | 4 | 0.6% |
| Unpaid Family Workers | 0 | 0.0% |
| Total | 626 | 100.0% |
Employment Status by Age in Castanea
According to the labor force statistics for Castanea, out of the total population over 16 years of age (1,000), 66.6% or 666 individuals are in the labor force, with 2.6% or 17 of them unemployed. The age group with the highest labor force participation rate is 25 to 29 years, with 100.0% or 51 individuals in the labor force. Within the labor force, the 25 to 29 years age range has the highest percentage of unemployed individuals, with 11.8% or 6 of them being unemployed.
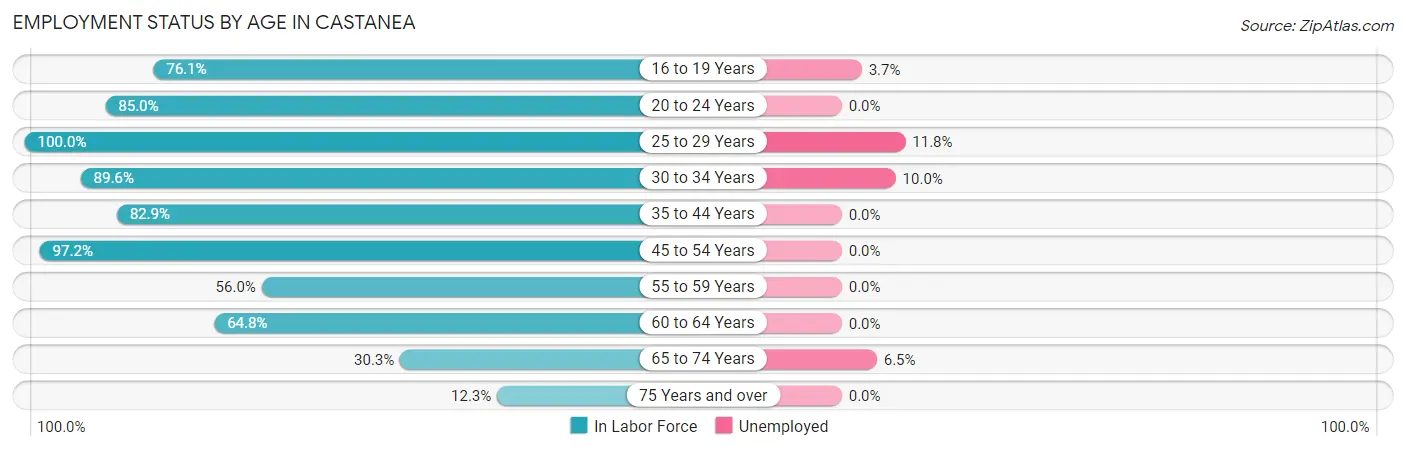
| Age Bracket | In Labor Force | Unemployed |
| 16 to 19 Years | 54 (76.1%) | 2 (3.7%) |
| 20 to 24 Years | 85 (85.0%) | 0 (0.0%) |
| 25 to 29 Years | 51 (100.0%) | 6 (11.8%) |
| 30 to 34 Years | 60 (89.6%) | 6 (10.0%) |
| 35 to 44 Years | 121 (82.9%) | 0 (0.0%) |
| 45 to 54 Years | 137 (97.2%) | 0 (0.0%) |
| 55 to 59 Years | 28 (56.0%) | 0 (0.0%) |
| 60 to 64 Years | 70 (64.8%) | 0 (0.0%) |
| 65 to 74 Years | 46 (30.3%) | 3 (6.5%) |
| 75 Years and over | 14 (12.3%) | 0 (0.0%) |
| Total | 666 (66.6%) | 17 (2.6%) |
Employment Status by Educational Attainment in Castanea
According to labor force statistics for Castanea, 82.9% of individuals (467) out of the total population between 25 and 64 years of age (563) are in the labor force, with 2.6% or 12 of them being unemployed. The group with the highest labor force participation rate are those with the educational attainment of bachelor's degree or higher, with 93.8% or 120 individuals in the labor force. Within the labor force, individuals with high school diploma education have the highest percentage of unemployment, with 5.9% or 12 of them being unemployed.
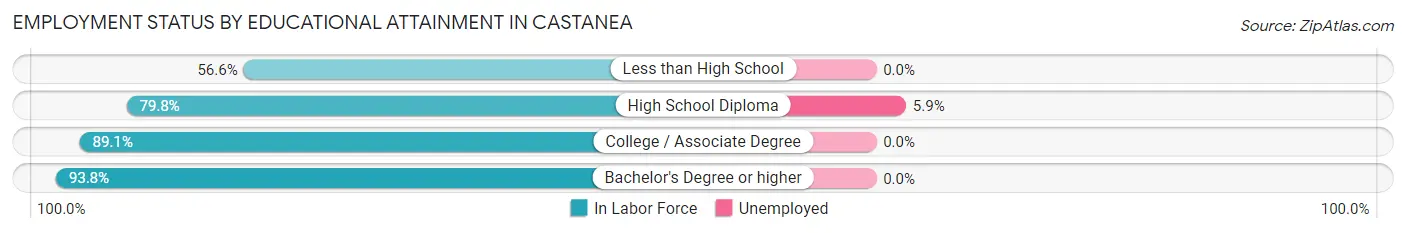
| Educational Attainment | In Labor Force | Unemployed |
| Less than High School | 30 (56.6%) | 0 (0.0%) |
| High School Diploma | 202 (79.8%) | 15 (5.9%) |
| College / Associate Degree | 115 (89.1%) | 0 (0.0%) |
| Bachelor's Degree or higher | 120 (93.8%) | 0 (0.0%) |
| Total | 467 (82.9%) | 15 (2.6%) |
Employment Occupations by Sex in Castanea
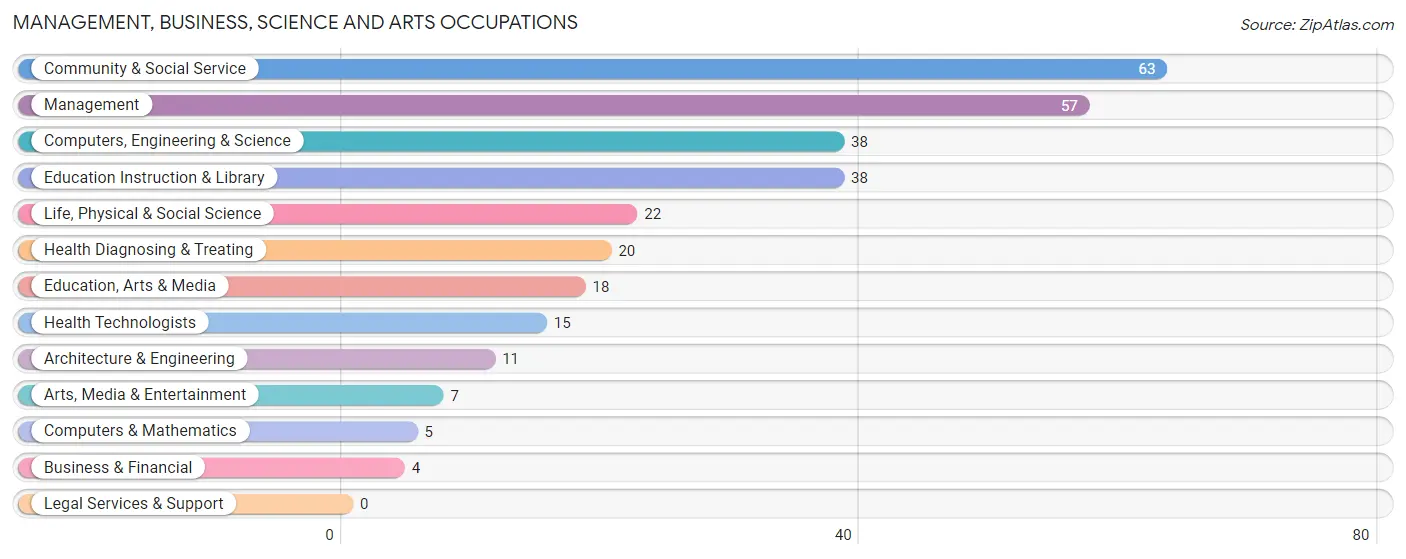
Management, Business, Science and Arts Occupations
The most common Management, Business, Science and Arts occupations in Castanea are Community & Social Service (63 | 9.7%), Management (57 | 8.8%), Computers, Engineering & Science (38 | 5.9%), Education Instruction & Library (38 | 5.9%), and Life, Physical & Social Science (22 | 3.4%).
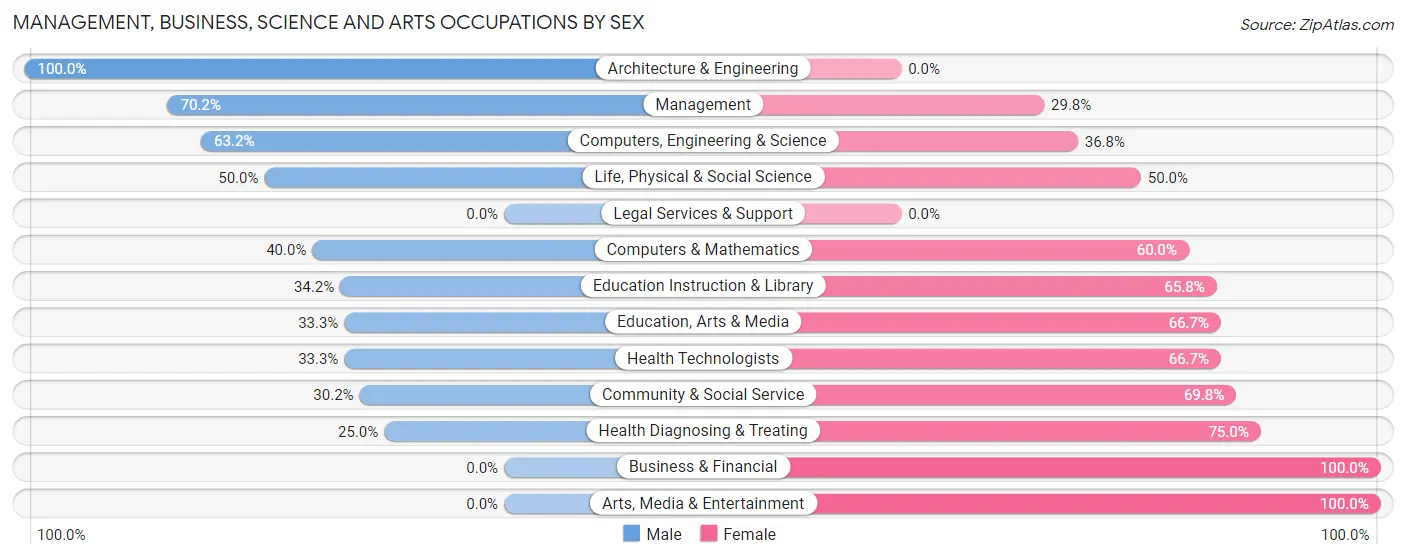
Management, Business, Science and Arts Occupations by Sex
Within the Management, Business, Science and Arts occupations in Castanea, the most male-oriented occupations are Architecture & Engineering (100.0%), Management (70.2%), and Computers, Engineering & Science (63.2%), while the most female-oriented occupations are Business & Financial (100.0%), Arts, Media & Entertainment (100.0%), and Health Diagnosing & Treating (75.0%).
| Occupation | Male | Female |
| Management | 40 (70.2%) | 17 (29.8%) |
| Business & Financial | 0 (0.0%) | 4 (100.0%) |
| Computers, Engineering & Science | 24 (63.2%) | 14 (36.8%) |
| Computers & Mathematics | 2 (40.0%) | 3 (60.0%) |
| Architecture & Engineering | 11 (100.0%) | 0 (0.0%) |
| Life, Physical & Social Science | 11 (50.0%) | 11 (50.0%) |
| Community & Social Service | 19 (30.2%) | 44 (69.8%) |
| Education, Arts & Media | 6 (33.3%) | 12 (66.7%) |
| Legal Services & Support | 0 (0.0%) | 0 (0.0%) |
| Education Instruction & Library | 13 (34.2%) | 25 (65.8%) |
| Arts, Media & Entertainment | 0 (0.0%) | 7 (100.0%) |
| Health Diagnosing & Treating | 5 (25.0%) | 15 (75.0%) |
| Health Technologists | 5 (33.3%) | 10 (66.7%) |
| Total (Category) | 88 (48.3%) | 94 (51.6%) |
| Total (Overall) | 308 (47.5%) | 341 (52.5%) |
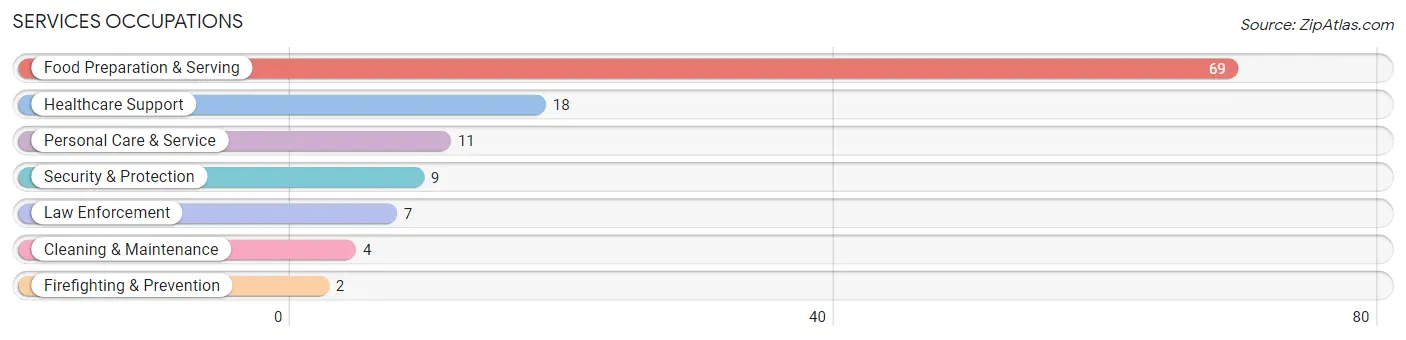
Services Occupations
The most common Services occupations in Castanea are Food Preparation & Serving (69 | 10.6%), Healthcare Support (18 | 2.8%), Personal Care & Service (11 | 1.7%), Security & Protection (9 | 1.4%), and Law Enforcement (7 | 1.1%).
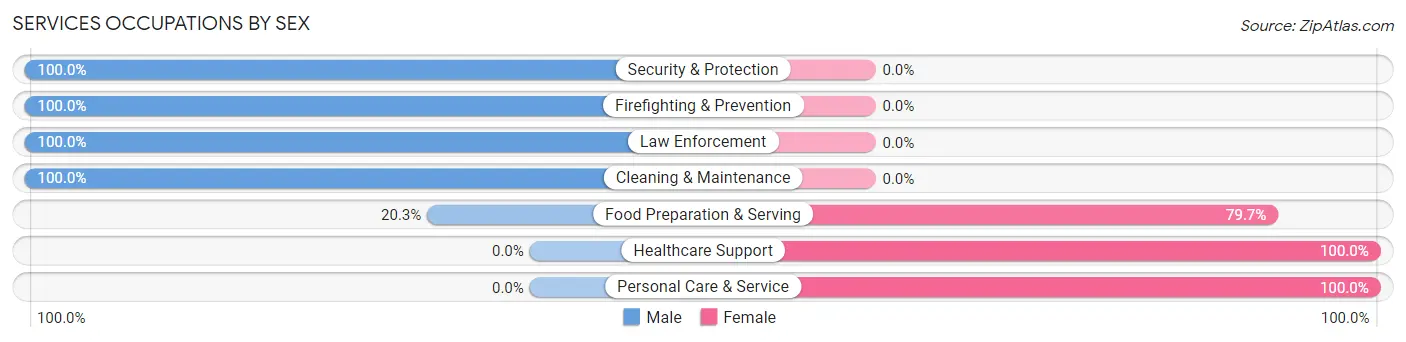
Services Occupations by Sex
Within the Services occupations in Castanea, the most male-oriented occupations are Security & Protection (100.0%), Firefighting & Prevention (100.0%), and Law Enforcement (100.0%), while the most female-oriented occupations are Healthcare Support (100.0%), Personal Care & Service (100.0%), and Food Preparation & Serving (79.7%).
| Occupation | Male | Female |
| Healthcare Support | 0 (0.0%) | 18 (100.0%) |
| Security & Protection | 9 (100.0%) | 0 (0.0%) |
| Firefighting & Prevention | 2 (100.0%) | 0 (0.0%) |
| Law Enforcement | 7 (100.0%) | 0 (0.0%) |
| Food Preparation & Serving | 14 (20.3%) | 55 (79.7%) |
| Cleaning & Maintenance | 4 (100.0%) | 0 (0.0%) |
| Personal Care & Service | 0 (0.0%) | 11 (100.0%) |
| Total (Category) | 27 (24.3%) | 84 (75.7%) |
| Total (Overall) | 308 (47.5%) | 341 (52.5%) |
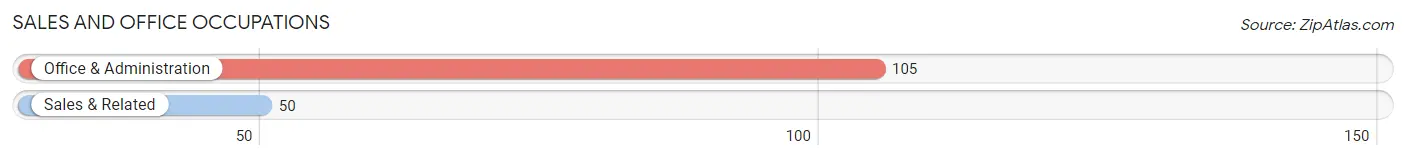
Sales and Office Occupations
The most common Sales and Office occupations in Castanea are Office & Administration (105 | 16.2%), and Sales & Related (50 | 7.7%).
Sales and Office Occupations by Sex
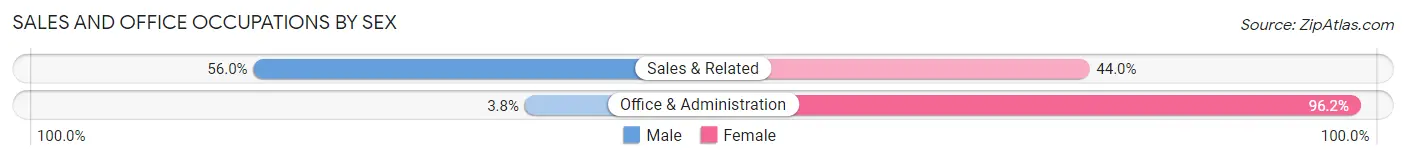
| Occupation | Male | Female |
| Sales & Related | 28 (56.0%) | 22 (44.0%) |
| Office & Administration | 4 (3.8%) | 101 (96.2%) |
| Total (Category) | 32 (20.6%) | 123 (79.3%) |
| Total (Overall) | 308 (47.5%) | 341 (52.5%) |
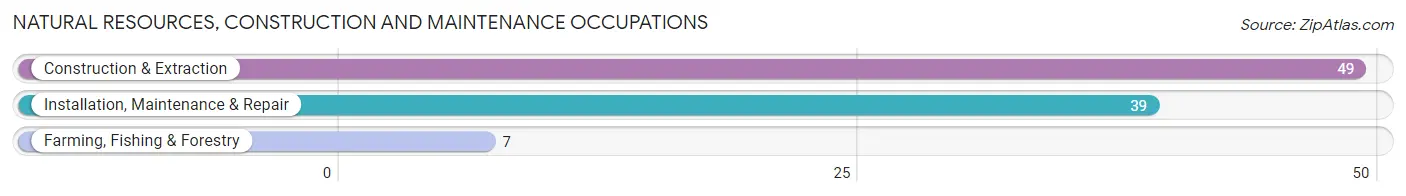
Natural Resources, Construction and Maintenance Occupations
The most common Natural Resources, Construction and Maintenance occupations in Castanea are Construction & Extraction (49 | 7.5%), Installation, Maintenance & Repair (39 | 6.0%), and Farming, Fishing & Forestry (7 | 1.1%).
Natural Resources, Construction and Maintenance Occupations by Sex
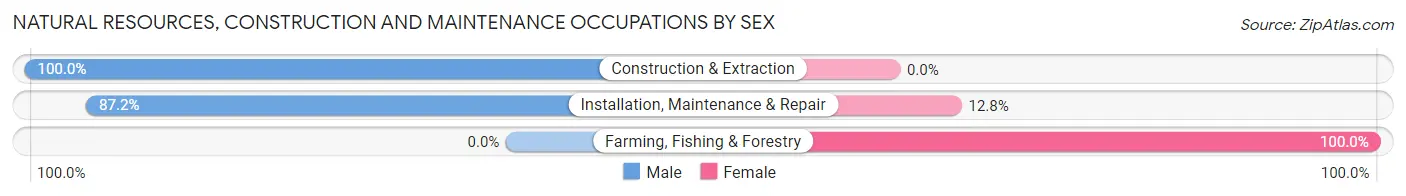
| Occupation | Male | Female |
| Farming, Fishing & Forestry | 0 (0.0%) | 7 (100.0%) |
| Construction & Extraction | 49 (100.0%) | 0 (0.0%) |
| Installation, Maintenance & Repair | 34 (87.2%) | 5 (12.8%) |
| Total (Category) | 83 (87.4%) | 12 (12.6%) |
| Total (Overall) | 308 (47.5%) | 341 (52.5%) |
Production, Transportation and Moving Occupations
The most common Production, Transportation and Moving occupations in Castanea are Production (38 | 5.9%), Transportation (37 | 5.7%), and Material Moving (31 | 4.8%).
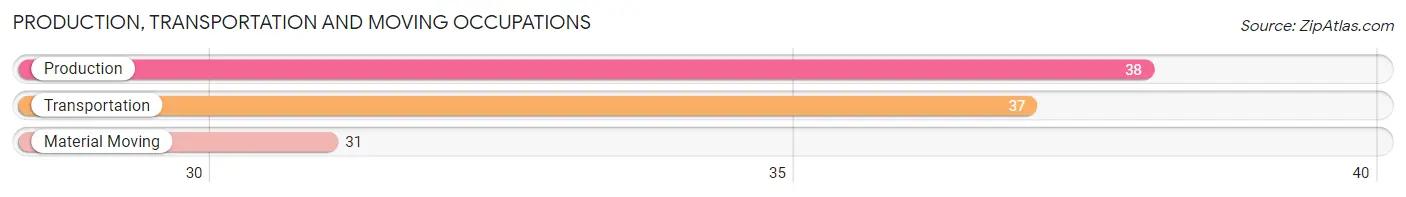
Production, Transportation and Moving Occupations by Sex
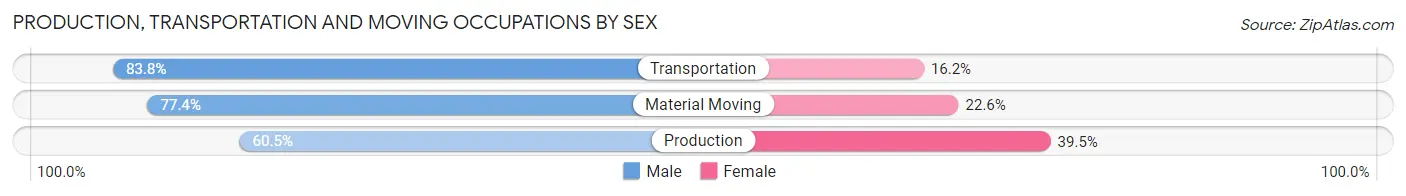
| Occupation | Male | Female |
| Production | 23 (60.5%) | 15 (39.5%) |
| Transportation | 31 (83.8%) | 6 (16.2%) |
| Material Moving | 24 (77.4%) | 7 (22.6%) |
| Total (Category) | 78 (73.6%) | 28 (26.4%) |
| Total (Overall) | 308 (47.5%) | 341 (52.5%) |
Employment Industries by Sex in Castanea
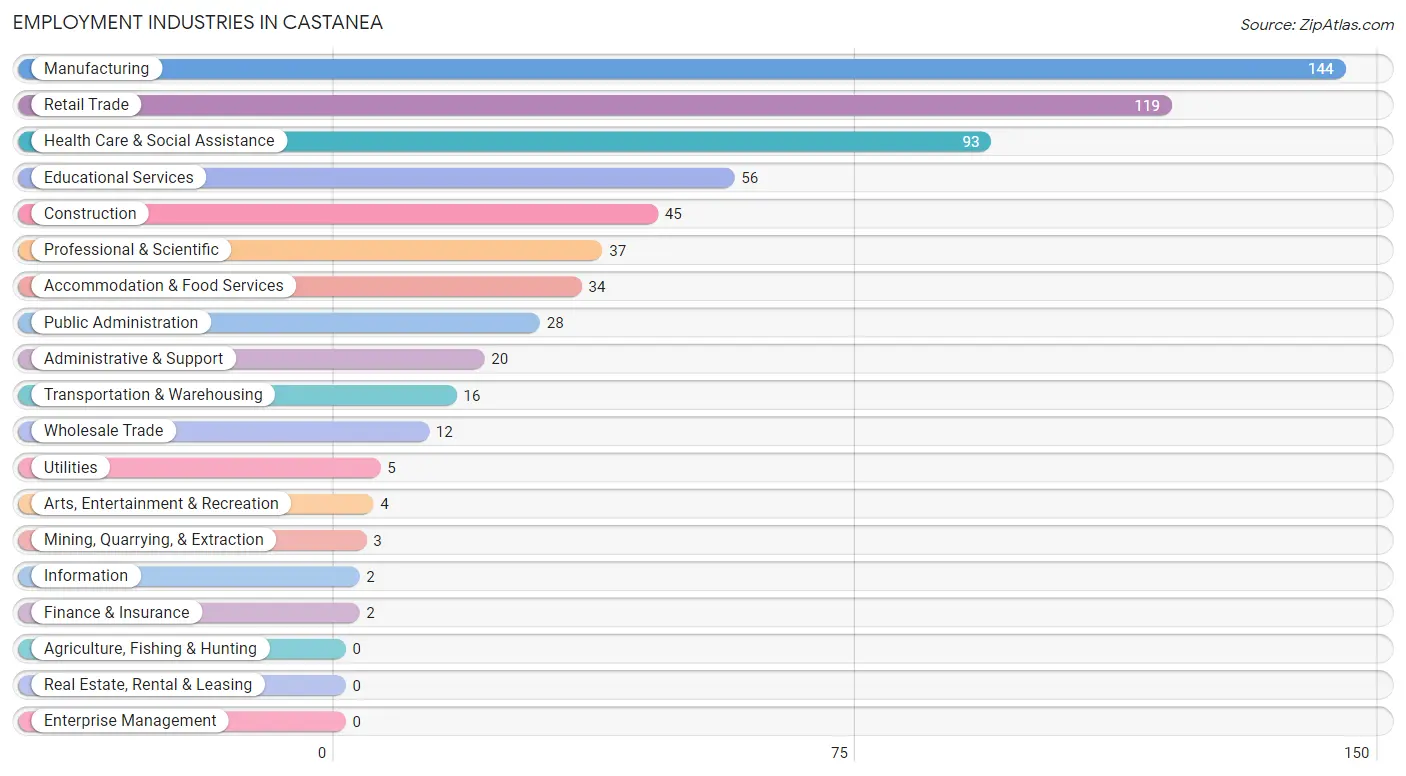
Employment Industries in Castanea
The major employment industries in Castanea include Manufacturing (144 | 22.2%), Retail Trade (119 | 18.3%), Health Care & Social Assistance (93 | 14.3%), Educational Services (56 | 8.6%), and Construction (45 | 6.9%).
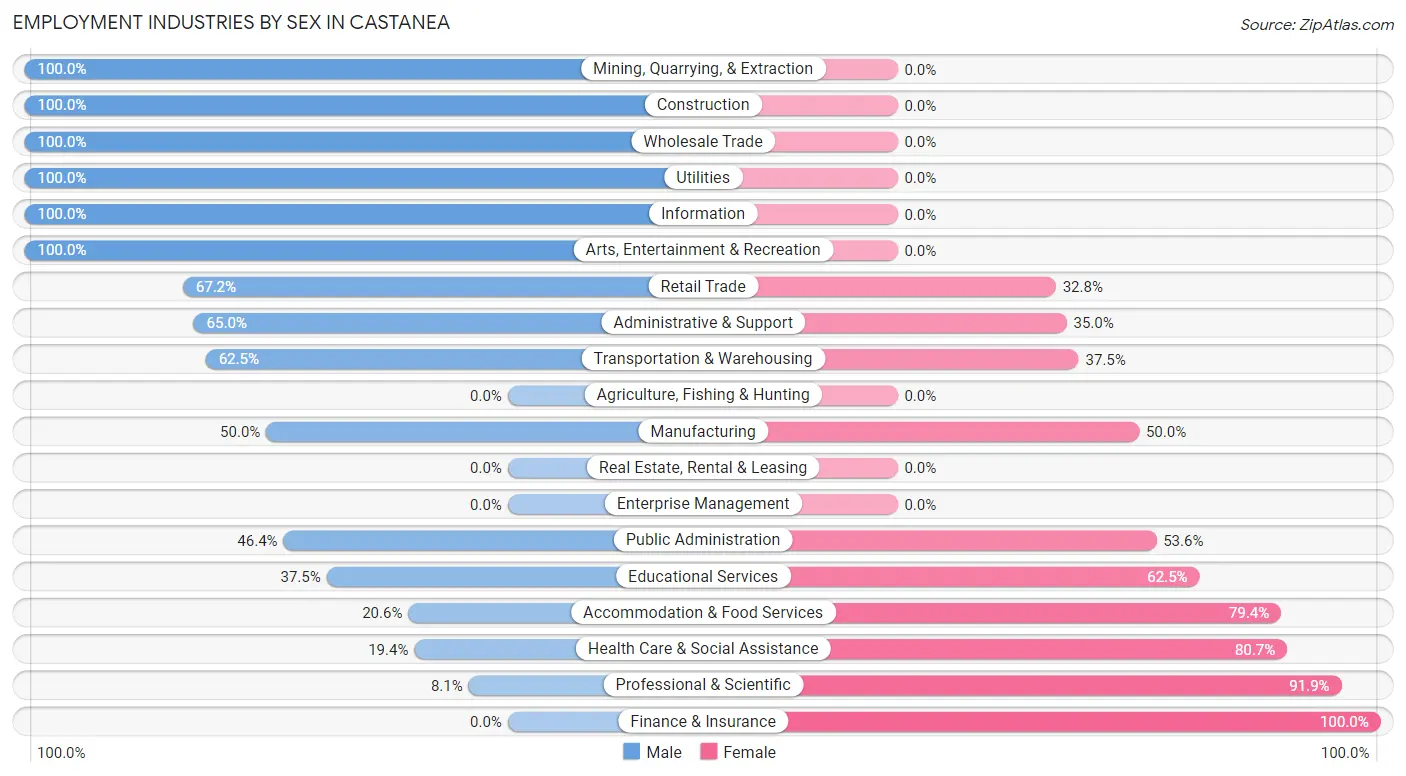
Employment Industries by Sex in Castanea
The Castanea industries that see more men than women are Mining, Quarrying, & Extraction (100.0%), Construction (100.0%), and Wholesale Trade (100.0%), whereas the industries that tend to have a higher number of women are Finance & Insurance (100.0%), Professional & Scientific (91.9%), and Health Care & Social Assistance (80.6%).
| Industry | Male | Female |
| Agriculture, Fishing & Hunting | 0 (0.0%) | 0 (0.0%) |
| Mining, Quarrying, & Extraction | 3 (100.0%) | 0 (0.0%) |
| Construction | 45 (100.0%) | 0 (0.0%) |
| Manufacturing | 72 (50.0%) | 72 (50.0%) |
| Wholesale Trade | 12 (100.0%) | 0 (0.0%) |
| Retail Trade | 80 (67.2%) | 39 (32.8%) |
| Transportation & Warehousing | 10 (62.5%) | 6 (37.5%) |
| Utilities | 5 (100.0%) | 0 (0.0%) |
| Information | 2 (100.0%) | 0 (0.0%) |
| Finance & Insurance | 0 (0.0%) | 2 (100.0%) |
| Real Estate, Rental & Leasing | 0 (0.0%) | 0 (0.0%) |
| Professional & Scientific | 3 (8.1%) | 34 (91.9%) |
| Enterprise Management | 0 (0.0%) | 0 (0.0%) |
| Administrative & Support | 13 (65.0%) | 7 (35.0%) |
| Educational Services | 21 (37.5%) | 35 (62.5%) |
| Health Care & Social Assistance | 18 (19.4%) | 75 (80.6%) |
| Arts, Entertainment & Recreation | 4 (100.0%) | 0 (0.0%) |
| Accommodation & Food Services | 7 (20.6%) | 27 (79.4%) |
| Public Administration | 13 (46.4%) | 15 (53.6%) |
| Total | 308 (47.5%) | 341 (52.5%) |
Education in Castanea
School Enrollment in Castanea
The most common levels of schooling among the 194 students in Castanea are high school (59 | 30.4%), elementary school (51 | 26.3%), and middle school (44 | 22.7%).
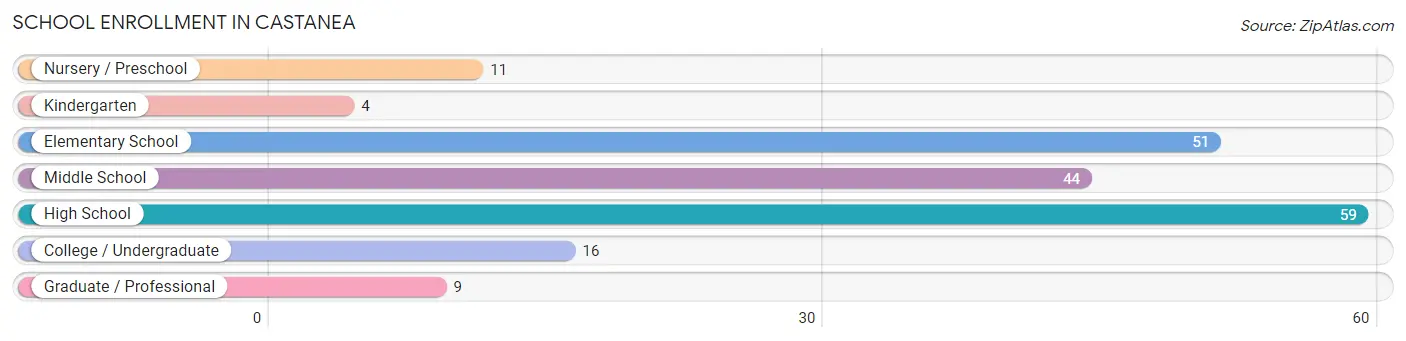
| School Level | # Students | % Students |
| Nursery / Preschool | 11 | 5.7% |
| Kindergarten | 4 | 2.1% |
| Elementary School | 51 | 26.3% |
| Middle School | 44 | 22.7% |
| High School | 59 | 30.4% |
| College / Undergraduate | 16 | 8.3% |
| Graduate / Professional | 9 | 4.6% |
| Total | 194 | 100.0% |
School Enrollment by Age by Funding Source in Castanea
Out of a total of 194 students who are enrolled in schools in Castanea, 30 (15.5%) attend a private institution, while the remaining 164 (84.5%) are enrolled in public schools. The age group of 35 years and over has the highest likelihood of being enrolled in private schools, with 5 (38.5% in the age bracket) enrolled. Conversely, the age group of 3 to 4 year olds has the lowest likelihood of being enrolled in a private school, with 8 (100.0% in the age bracket) attending a public institution.
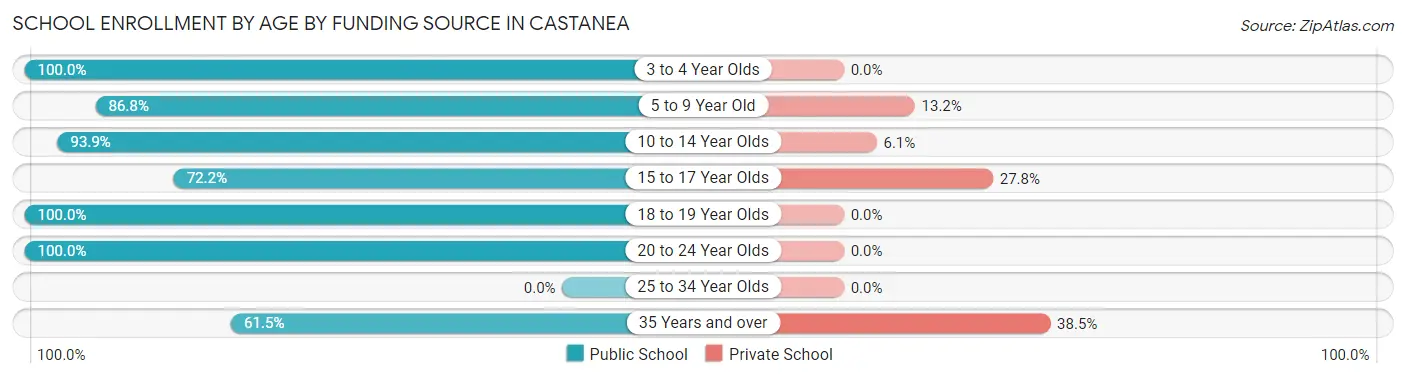
| Age Bracket | Public School | Private School |
| 3 to 4 Year Olds | 8 (100.0%) | 0 (0.0%) |
| 5 to 9 Year Old | 46 (86.8%) | 7 (13.2%) |
| 10 to 14 Year Olds | 46 (93.9%) | 3 (6.1%) |
| 15 to 17 Year Olds | 39 (72.2%) | 15 (27.8%) |
| 18 to 19 Year Olds | 13 (100.0%) | 0 (0.0%) |
| 20 to 24 Year Olds | 4 (100.0%) | 0 (0.0%) |
| 25 to 34 Year Olds | 0 (0.0%) | 0 (0.0%) |
| 35 Years and over | 8 (61.5%) | 5 (38.5%) |
| Total | 164 (84.5%) | 30 (15.5%) |
Educational Attainment by Field of Study in Castanea
Education (68 | 32.7%), science & technology (54 | 26.0%), literature & languages (15 | 7.2%), visual & performing arts (12 | 5.8%), and physical & health sciences (10 | 4.8%) are the most common fields of study among 208 individuals in Castanea who have obtained a bachelor's degree or higher.
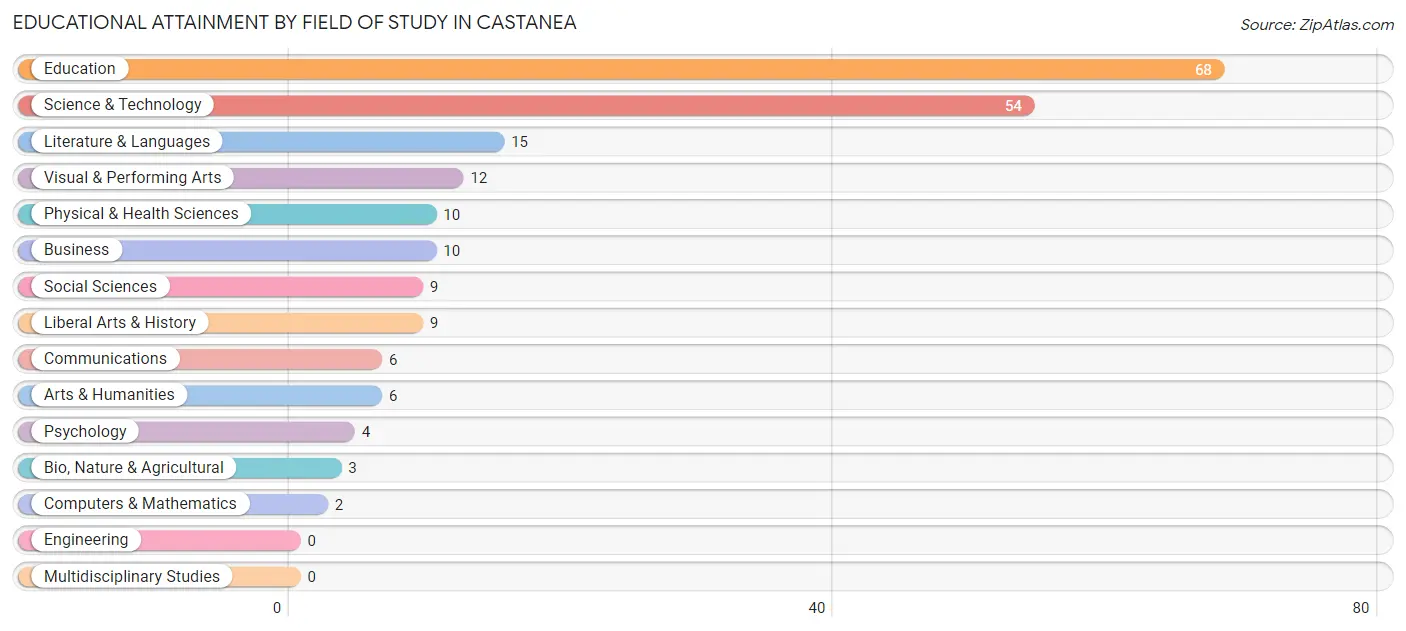
| Field of Study | # Graduates | % Graduates |
| Computers & Mathematics | 2 | 1.0% |
| Bio, Nature & Agricultural | 3 | 1.4% |
| Physical & Health Sciences | 10 | 4.8% |
| Psychology | 4 | 1.9% |
| Social Sciences | 9 | 4.3% |
| Engineering | 0 | 0.0% |
| Multidisciplinary Studies | 0 | 0.0% |
| Science & Technology | 54 | 26.0% |
| Business | 10 | 4.8% |
| Education | 68 | 32.7% |
| Literature & Languages | 15 | 7.2% |
| Liberal Arts & History | 9 | 4.3% |
| Visual & Performing Arts | 12 | 5.8% |
| Communications | 6 | 2.9% |
| Arts & Humanities | 6 | 2.9% |
| Total | 208 | 100.0% |
Transportation & Commute in Castanea
Vehicle Availability by Sex in Castanea
The most prevalent vehicle ownership categories in Castanea are males with 2 vehicles (147, accounting for 48.4%) and females with 2 vehicles (88, making up 45.7%).
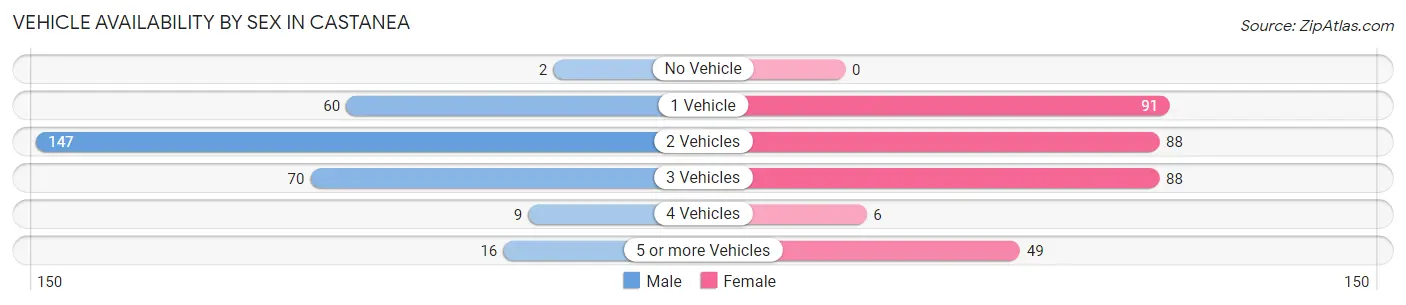
| Vehicles Available | Male | Female |
| No Vehicle | 2 (0.7%) | 0 (0.0%) |
| 1 Vehicle | 60 (19.7%) | 91 (28.3%) |
| 2 Vehicles | 147 (48.4%) | 88 (27.3%) |
| 3 Vehicles | 70 (23.0%) | 88 (27.3%) |
| 4 Vehicles | 9 (3.0%) | 6 (1.9%) |
| 5 or more Vehicles | 16 (5.3%) | 49 (15.2%) |
| Total | 304 (100.0%) | 322 (100.0%) |
Commute Time in Castanea
The most frequently occuring commute durations in Castanea are 5 to 9 minutes (183 commuters, 30.0%), 10 to 14 minutes (119 commuters, 19.5%), and 45 to 59 minutes (53 commuters, 8.7%).
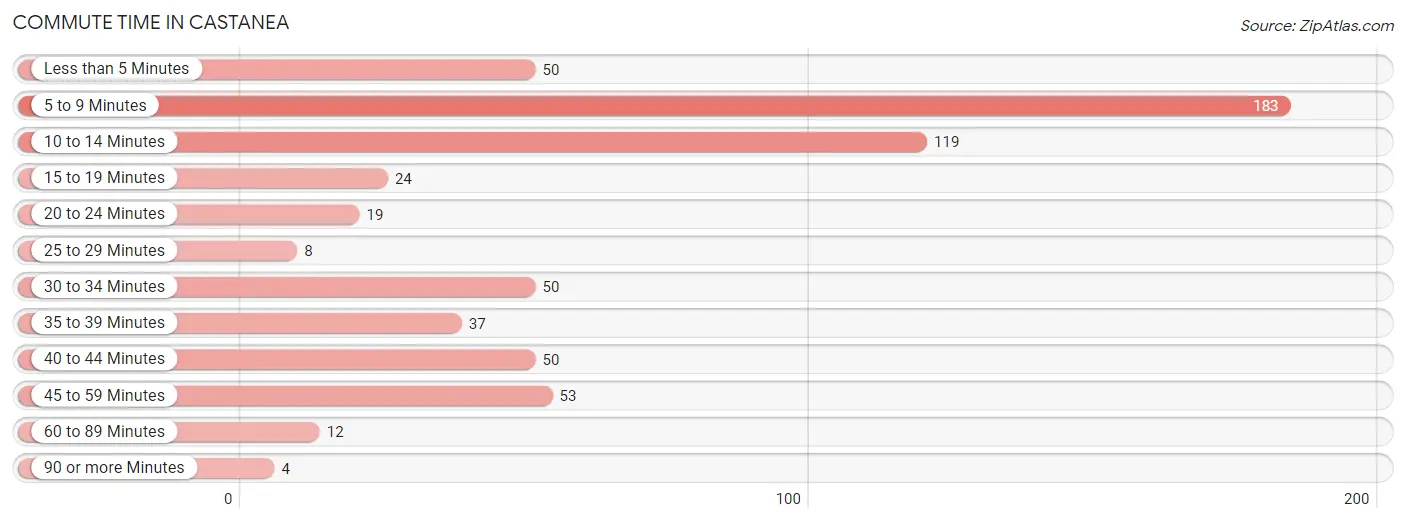
| Commute Time | # Commuters | % Commuters |
| Less than 5 Minutes | 50 | 8.2% |
| 5 to 9 Minutes | 183 | 30.0% |
| 10 to 14 Minutes | 119 | 19.5% |
| 15 to 19 Minutes | 24 | 3.9% |
| 20 to 24 Minutes | 19 | 3.1% |
| 25 to 29 Minutes | 8 | 1.3% |
| 30 to 34 Minutes | 50 | 8.2% |
| 35 to 39 Minutes | 37 | 6.1% |
| 40 to 44 Minutes | 50 | 8.2% |
| 45 to 59 Minutes | 53 | 8.7% |
| 60 to 89 Minutes | 12 | 2.0% |
| 90 or more Minutes | 4 | 0.7% |
Commute Time by Sex in Castanea
The most common commute times in Castanea are 5 to 9 minutes (96 commuters, 31.9%) for males and 5 to 9 minutes (87 commuters, 28.2%) for females.
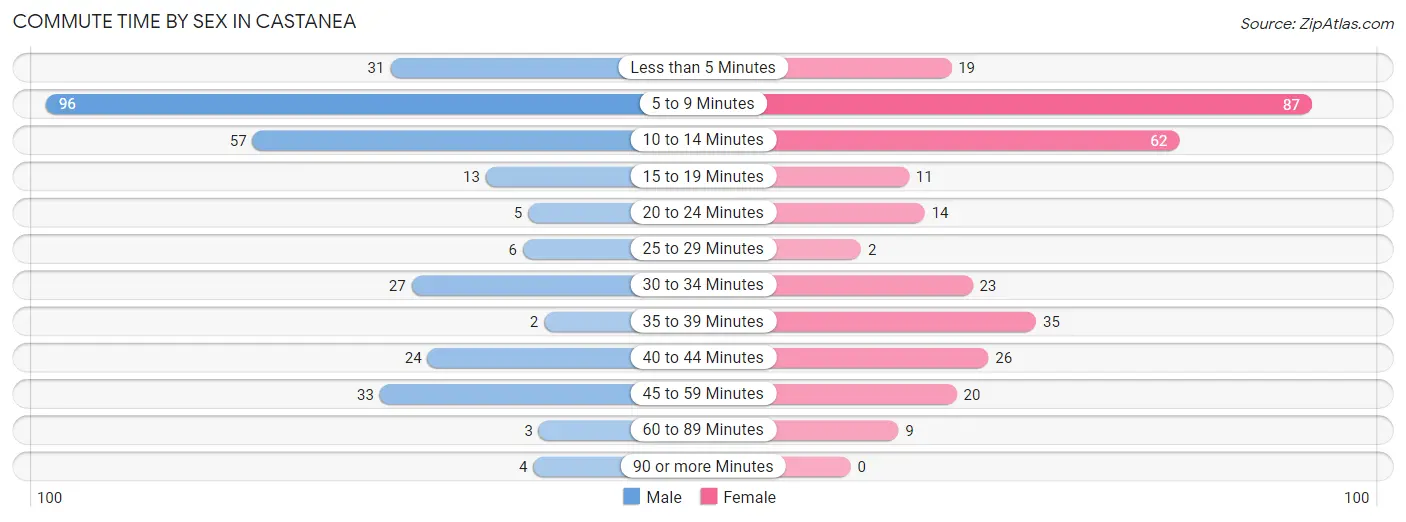
| Commute Time | Male | Female |
| Less than 5 Minutes | 31 (10.3%) | 19 (6.2%) |
| 5 to 9 Minutes | 96 (31.9%) | 87 (28.2%) |
| 10 to 14 Minutes | 57 (18.9%) | 62 (20.1%) |
| 15 to 19 Minutes | 13 (4.3%) | 11 (3.6%) |
| 20 to 24 Minutes | 5 (1.7%) | 14 (4.5%) |
| 25 to 29 Minutes | 6 (2.0%) | 2 (0.6%) |
| 30 to 34 Minutes | 27 (9.0%) | 23 (7.5%) |
| 35 to 39 Minutes | 2 (0.7%) | 35 (11.4%) |
| 40 to 44 Minutes | 24 (8.0%) | 26 (8.4%) |
| 45 to 59 Minutes | 33 (11.0%) | 20 (6.5%) |
| 60 to 89 Minutes | 3 (1.0%) | 9 (2.9%) |
| 90 or more Minutes | 4 (1.3%) | 0 (0.0%) |
Time of Departure to Work by Sex in Castanea
The most frequent times of departure to work in Castanea are 6:30 AM to 6:59 AM (75, 24.9%) for males and 6:30 AM to 6:59 AM (58, 18.8%) for females.
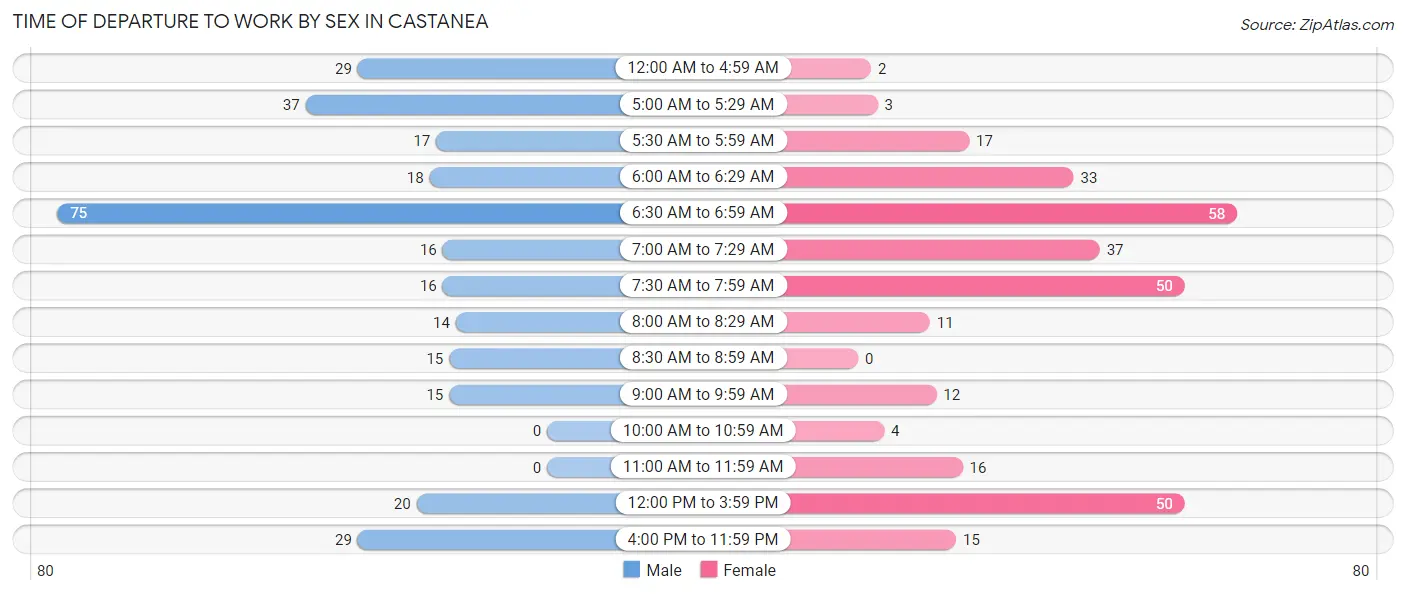
| Time of Departure | Male | Female |
| 12:00 AM to 4:59 AM | 29 (9.6%) | 2 (0.6%) |
| 5:00 AM to 5:29 AM | 37 (12.3%) | 3 (1.0%) |
| 5:30 AM to 5:59 AM | 17 (5.7%) | 17 (5.5%) |
| 6:00 AM to 6:29 AM | 18 (6.0%) | 33 (10.7%) |
| 6:30 AM to 6:59 AM | 75 (24.9%) | 58 (18.8%) |
| 7:00 AM to 7:29 AM | 16 (5.3%) | 37 (12.0%) |
| 7:30 AM to 7:59 AM | 16 (5.3%) | 50 (16.2%) |
| 8:00 AM to 8:29 AM | 14 (4.6%) | 11 (3.6%) |
| 8:30 AM to 8:59 AM | 15 (5.0%) | 0 (0.0%) |
| 9:00 AM to 9:59 AM | 15 (5.0%) | 12 (3.9%) |
| 10:00 AM to 10:59 AM | 0 (0.0%) | 4 (1.3%) |
| 11:00 AM to 11:59 AM | 0 (0.0%) | 16 (5.2%) |
| 12:00 PM to 3:59 PM | 20 (6.6%) | 50 (16.2%) |
| 4:00 PM to 11:59 PM | 29 (9.6%) | 15 (4.9%) |
| Total | 301 (100.0%) | 308 (100.0%) |
Housing Occupancy in Castanea
Occupancy by Ownership in Castanea
Of the total 522 dwellings in Castanea, owner-occupied units account for 402 (77.0%), while renter-occupied units make up 120 (23.0%).
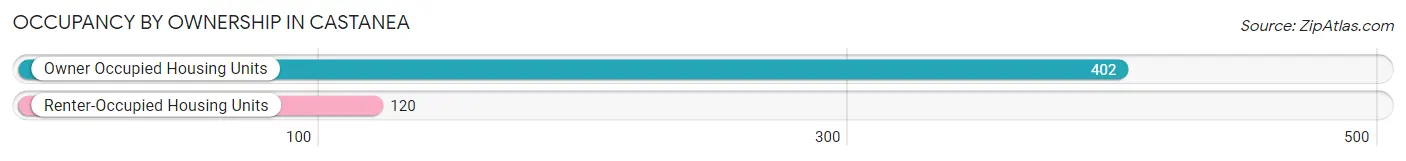
| Occupancy | # Housing Units | % Housing Units |
| Owner Occupied Housing Units | 402 | 77.0% |
| Renter-Occupied Housing Units | 120 | 23.0% |
| Total Occupied Housing Units | 522 | 100.0% |
Occupancy by Household Size in Castanea
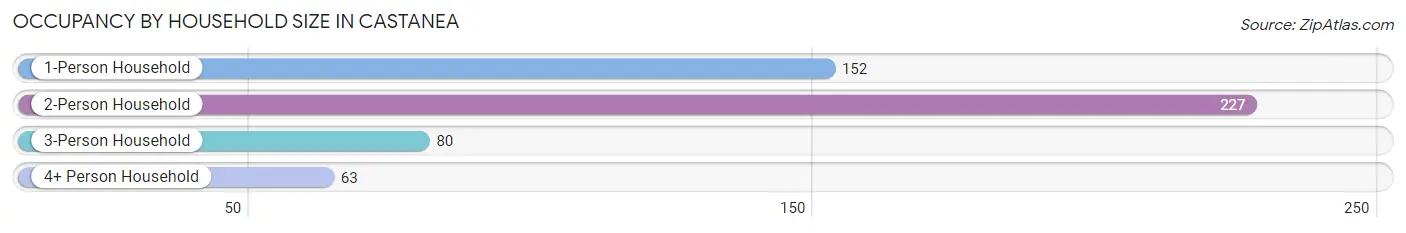
| Household Size | # Housing Units | % Housing Units |
| 1-Person Household | 152 | 29.1% |
| 2-Person Household | 227 | 43.5% |
| 3-Person Household | 80 | 15.3% |
| 4+ Person Household | 63 | 12.1% |
| Total Housing Units | 522 | 100.0% |
Occupancy by Ownership by Household Size in Castanea
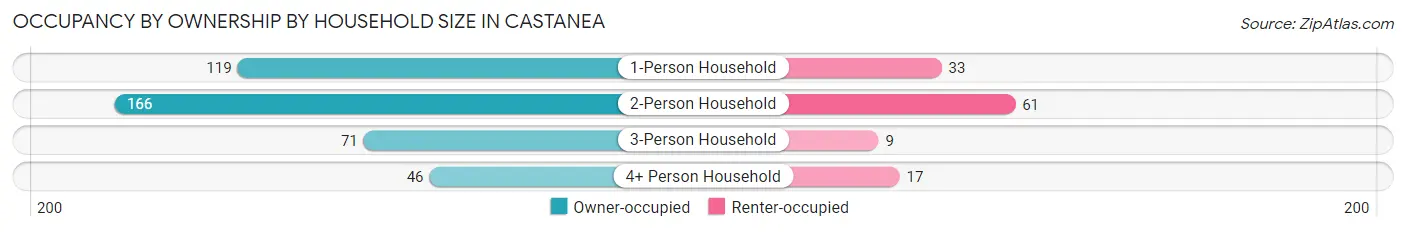
| Household Size | Owner-occupied | Renter-occupied |
| 1-Person Household | 119 (78.3%) | 33 (21.7%) |
| 2-Person Household | 166 (73.1%) | 61 (26.9%) |
| 3-Person Household | 71 (88.7%) | 9 (11.3%) |
| 4+ Person Household | 46 (73.0%) | 17 (27.0%) |
| Total Housing Units | 402 (77.0%) | 120 (23.0%) |
Occupancy by Educational Attainment in Castanea
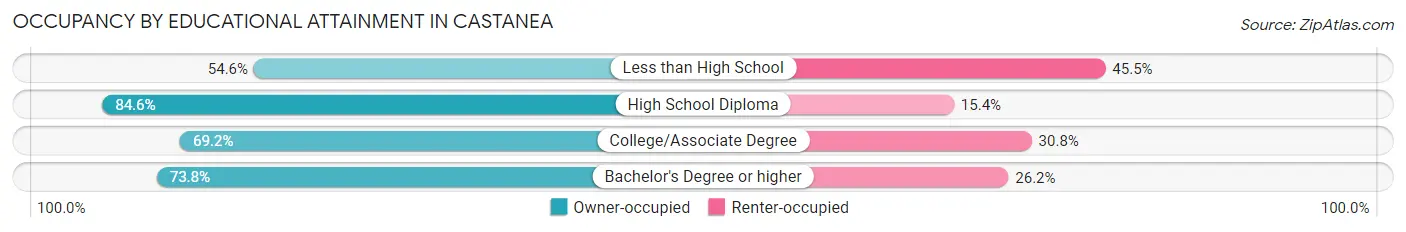
| Household Size | Owner-occupied | Renter-occupied |
| Less than High School | 18 (54.5%) | 15 (45.5%) |
| High School Diploma | 225 (84.6%) | 41 (15.4%) |
| College/Associate Degree | 83 (69.2%) | 37 (30.8%) |
| Bachelor's Degree or higher | 76 (73.8%) | 27 (26.2%) |
Occupancy by Age of Householder in Castanea
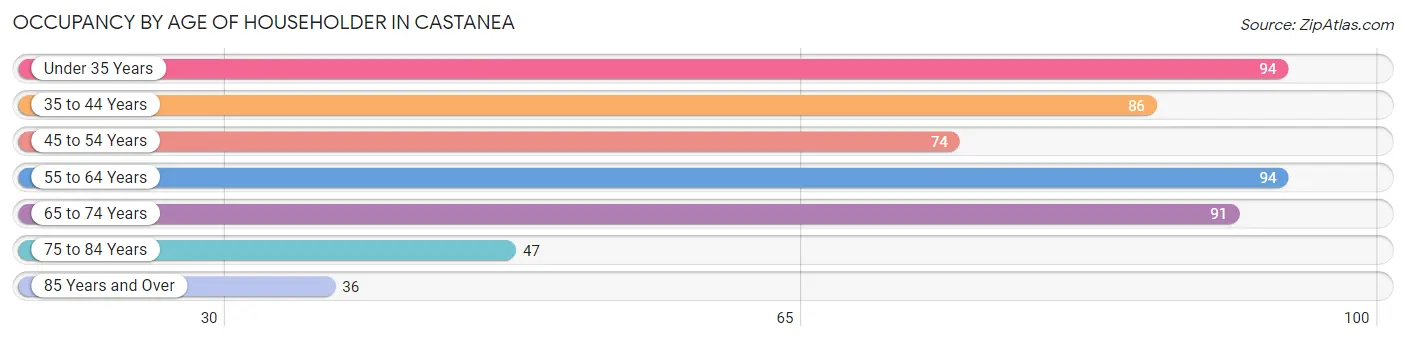
| Age Bracket | # Households | % Households |
| Under 35 Years | 94 | 18.0% |
| 35 to 44 Years | 86 | 16.5% |
| 45 to 54 Years | 74 | 14.2% |
| 55 to 64 Years | 94 | 18.0% |
| 65 to 74 Years | 91 | 17.4% |
| 75 to 84 Years | 47 | 9.0% |
| 85 Years and Over | 36 | 6.9% |
| Total | 522 | 100.0% |
Housing Finances in Castanea
Median Income by Occupancy in Castanea
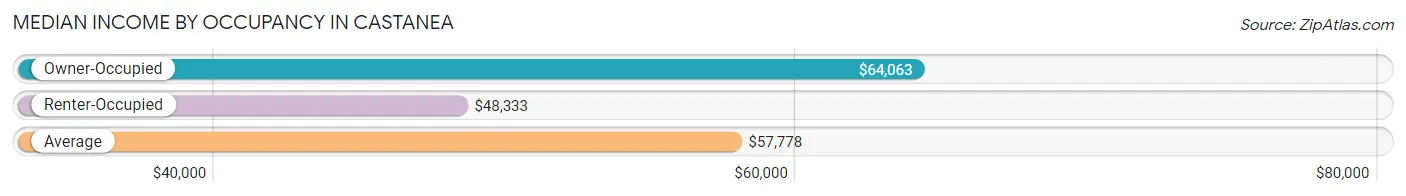
| Occupancy Type | # Households | Median Income |
| Owner-Occupied | 402 (77.0%) | $64,063 |
| Renter-Occupied | 120 (23.0%) | $48,333 |
| Average | 522 (100.0%) | $57,778 |
Occupancy by Householder Income Bracket in Castanea
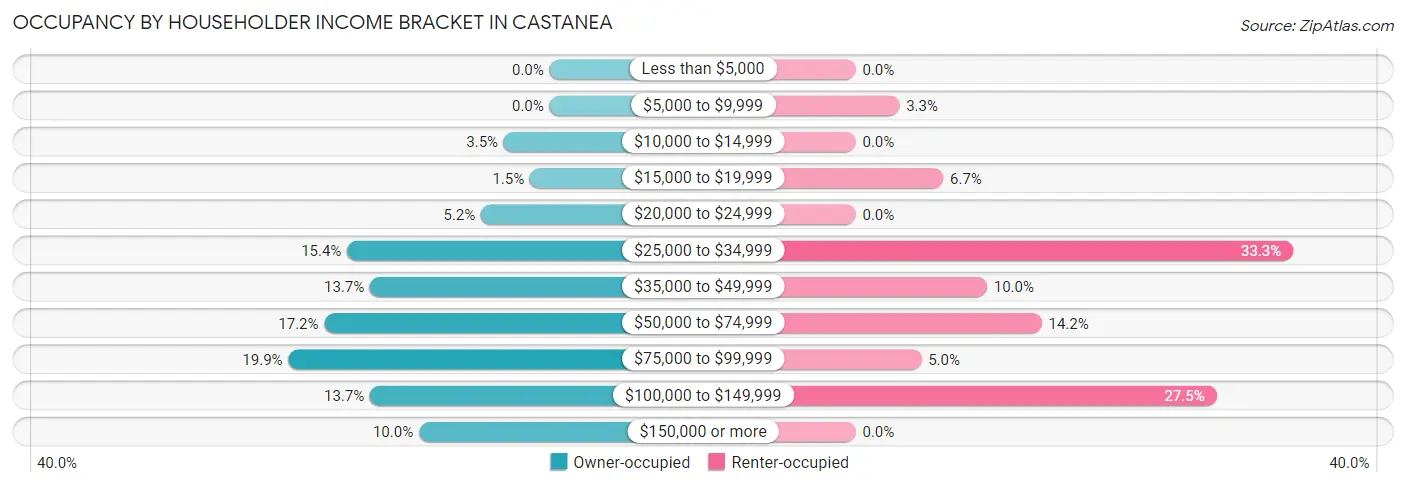
| Income Bracket | Owner-occupied | Renter-occupied |
| Less than $5,000 | 0 (0.0%) | 0 (0.0%) |
| $5,000 to $9,999 | 0 (0.0%) | 4 (3.3%) |
| $10,000 to $14,999 | 14 (3.5%) | 0 (0.0%) |
| $15,000 to $19,999 | 6 (1.5%) | 8 (6.7%) |
| $20,000 to $24,999 | 21 (5.2%) | 0 (0.0%) |
| $25,000 to $34,999 | 62 (15.4%) | 40 (33.3%) |
| $35,000 to $49,999 | 55 (13.7%) | 12 (10.0%) |
| $50,000 to $74,999 | 69 (17.2%) | 17 (14.2%) |
| $75,000 to $99,999 | 80 (19.9%) | 6 (5.0%) |
| $100,000 to $149,999 | 55 (13.7%) | 33 (27.5%) |
| $150,000 or more | 40 (10.0%) | 0 (0.0%) |
| Total | 402 (100.0%) | 120 (100.0%) |
Monthly Housing Cost Tiers in Castanea
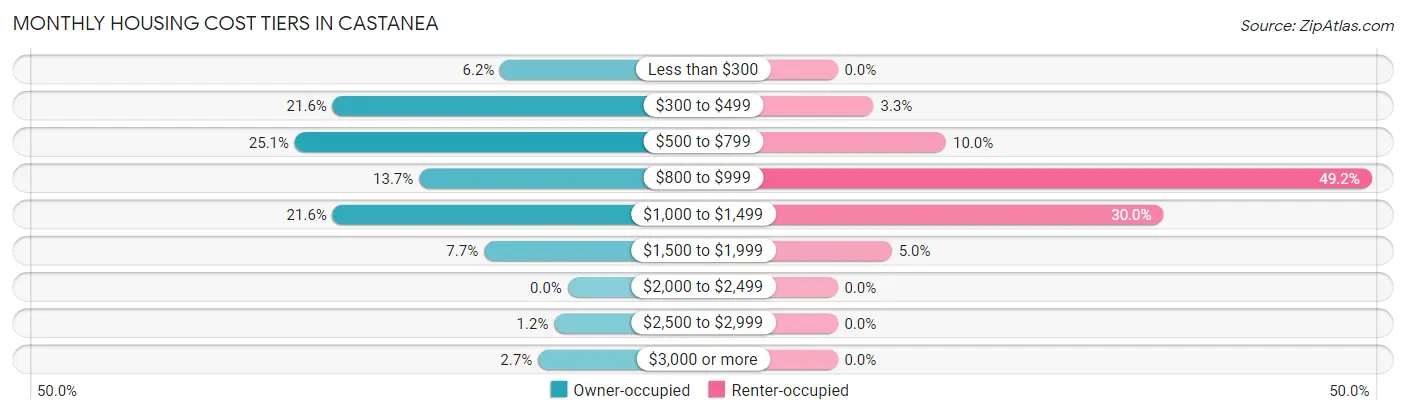
| Monthly Cost | Owner-occupied | Renter-occupied |
| Less than $300 | 25 (6.2%) | 0 (0.0%) |
| $300 to $499 | 87 (21.6%) | 4 (3.3%) |
| $500 to $799 | 101 (25.1%) | 12 (10.0%) |
| $800 to $999 | 55 (13.7%) | 59 (49.2%) |
| $1,000 to $1,499 | 87 (21.6%) | 36 (30.0%) |
| $1,500 to $1,999 | 31 (7.7%) | 6 (5.0%) |
| $2,000 to $2,499 | 0 (0.0%) | 0 (0.0%) |
| $2,500 to $2,999 | 5 (1.2%) | 0 (0.0%) |
| $3,000 or more | 11 (2.7%) | 0 (0.0%) |
| Total | 402 (100.0%) | 120 (100.0%) |
Physical Housing Characteristics in Castanea
Housing Structures in Castanea
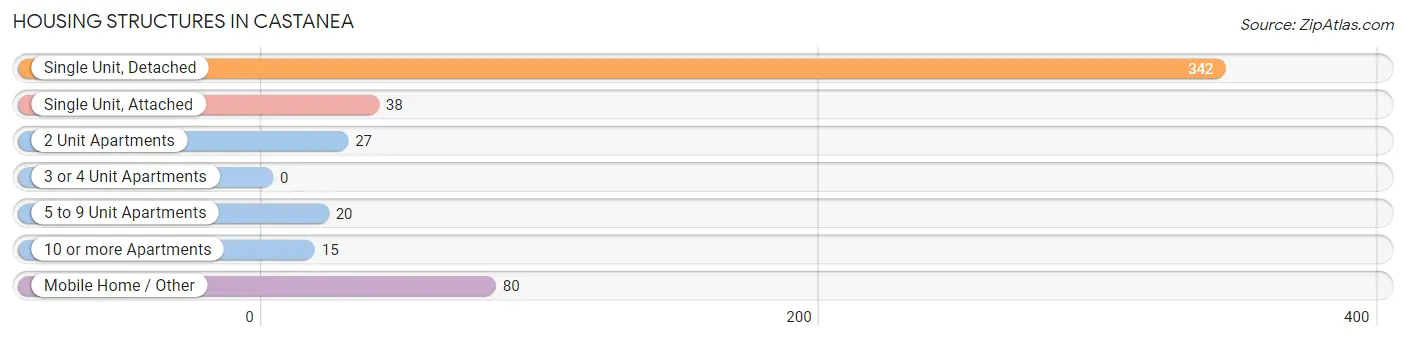
| Structure Type | # Housing Units | % Housing Units |
| Single Unit, Detached | 342 | 65.5% |
| Single Unit, Attached | 38 | 7.3% |
| 2 Unit Apartments | 27 | 5.2% |
| 3 or 4 Unit Apartments | 0 | 0.0% |
| 5 to 9 Unit Apartments | 20 | 3.8% |
| 10 or more Apartments | 15 | 2.9% |
| Mobile Home / Other | 80 | 15.3% |
| Total | 522 | 100.0% |
Housing Structures by Occupancy in Castanea
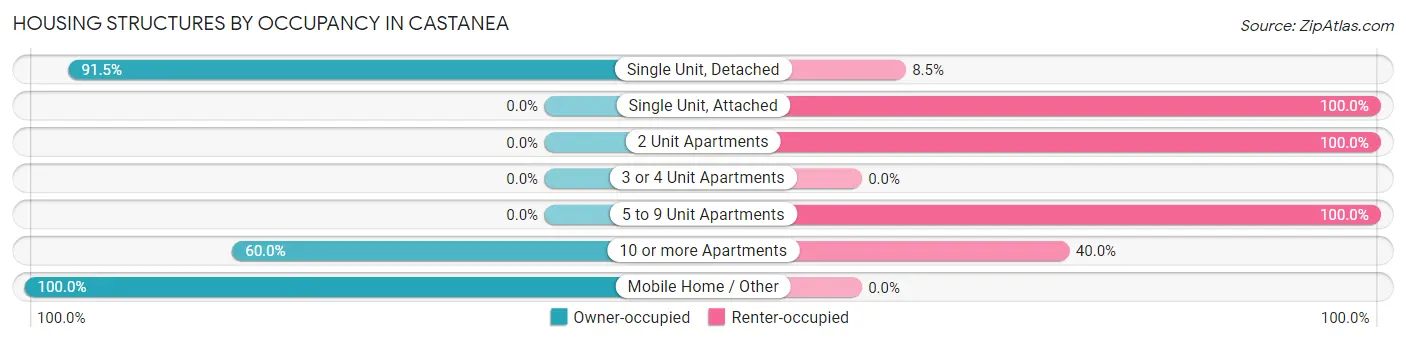
| Structure Type | Owner-occupied | Renter-occupied |
| Single Unit, Detached | 313 (91.5%) | 29 (8.5%) |
| Single Unit, Attached | 0 (0.0%) | 38 (100.0%) |
| 2 Unit Apartments | 0 (0.0%) | 27 (100.0%) |
| 3 or 4 Unit Apartments | 0 (0.0%) | 0 (0.0%) |
| 5 to 9 Unit Apartments | 0 (0.0%) | 20 (100.0%) |
| 10 or more Apartments | 9 (60.0%) | 6 (40.0%) |
| Mobile Home / Other | 80 (100.0%) | 0 (0.0%) |
| Total | 402 (77.0%) | 120 (23.0%) |
Housing Structures by Number of Rooms in Castanea
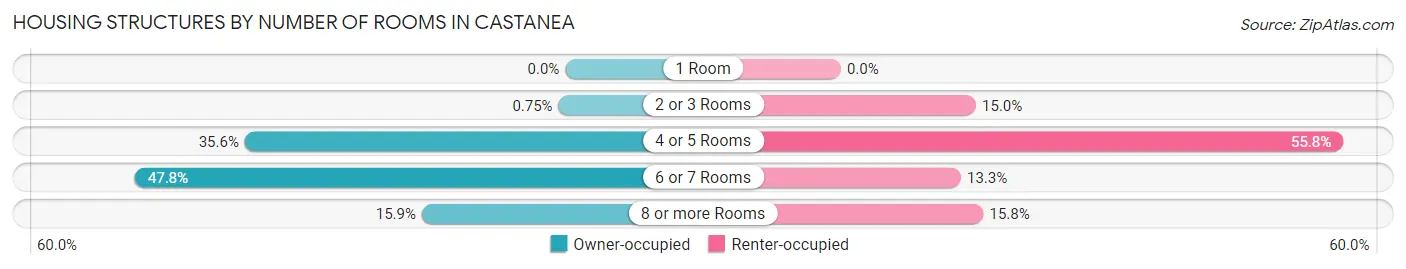
| Number of Rooms | Owner-occupied | Renter-occupied |
| 1 Room | 0 (0.0%) | 0 (0.0%) |
| 2 or 3 Rooms | 3 (0.7%) | 18 (15.0%) |
| 4 or 5 Rooms | 143 (35.6%) | 67 (55.8%) |
| 6 or 7 Rooms | 192 (47.8%) | 16 (13.3%) |
| 8 or more Rooms | 64 (15.9%) | 19 (15.8%) |
| Total | 402 (100.0%) | 120 (100.0%) |
Housing Structure by Heating Type in Castanea
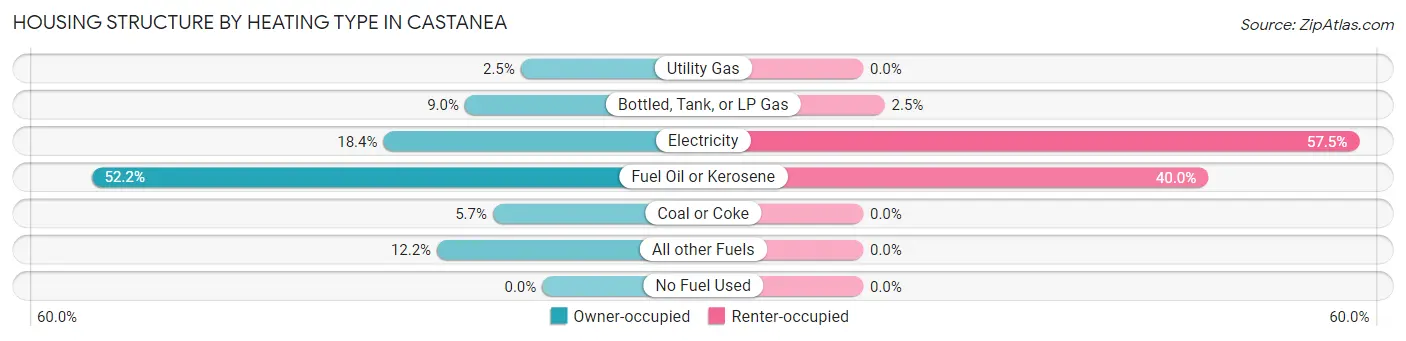
| Heating Type | Owner-occupied | Renter-occupied |
| Utility Gas | 10 (2.5%) | 0 (0.0%) |
| Bottled, Tank, or LP Gas | 36 (9.0%) | 3 (2.5%) |
| Electricity | 74 (18.4%) | 69 (57.5%) |
| Fuel Oil or Kerosene | 210 (52.2%) | 48 (40.0%) |
| Coal or Coke | 23 (5.7%) | 0 (0.0%) |
| All other Fuels | 49 (12.2%) | 0 (0.0%) |
| No Fuel Used | 0 (0.0%) | 0 (0.0%) |
| Total | 402 (100.0%) | 120 (100.0%) |
Household Vehicle Usage in Castanea
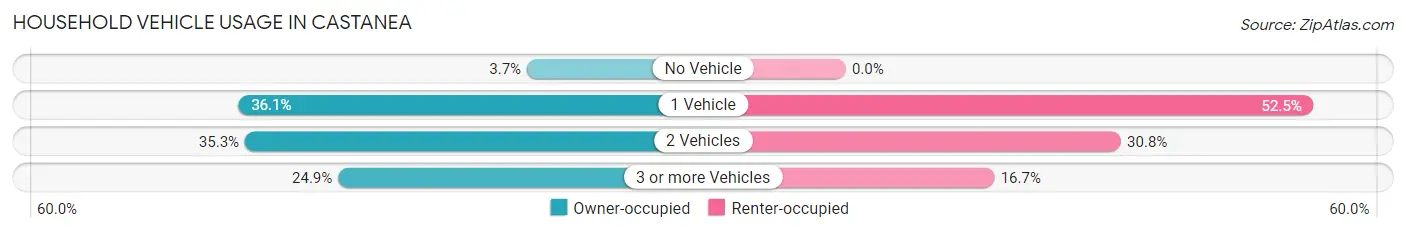
| Vehicles per Household | Owner-occupied | Renter-occupied |
| No Vehicle | 15 (3.7%) | 0 (0.0%) |
| 1 Vehicle | 145 (36.1%) | 63 (52.5%) |
| 2 Vehicles | 142 (35.3%) | 37 (30.8%) |
| 3 or more Vehicles | 100 (24.9%) | 20 (16.7%) |
| Total | 402 (100.0%) | 120 (100.0%) |
Real Estate & Mortgages in Castanea
Real Estate and Mortgage Overview in Castanea
| Characteristic | Without Mortgage | With Mortgage |
| Housing Units | 223 | 179 |
| Median Property Value | $97,300 | $167,000 |
| Median Household Income | $48,542 | $10 |
| Monthly Housing Costs | $506 | $11 |
| Real Estate Taxes | $1,381 | $0 |
Property Value by Mortgage Status in Castanea
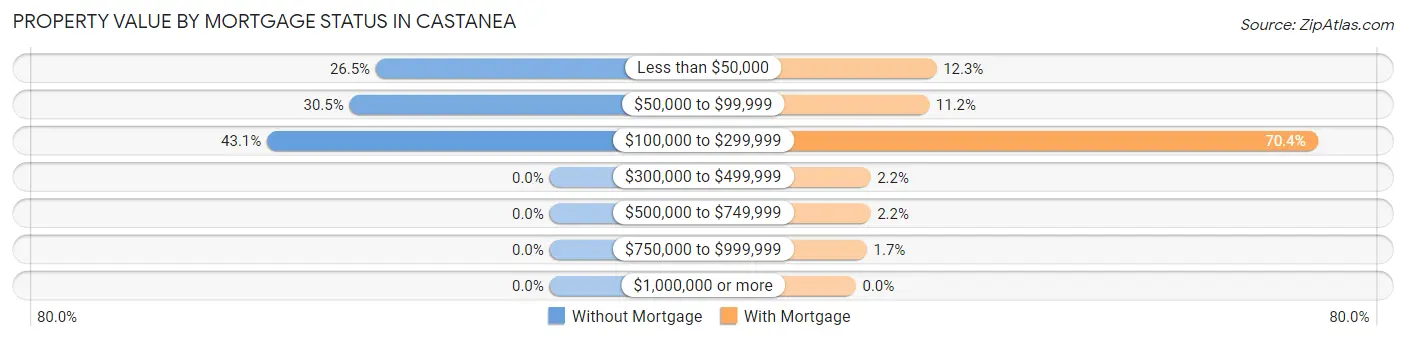
| Property Value | Without Mortgage | With Mortgage |
| Less than $50,000 | 59 (26.5%) | 22 (12.3%) |
| $50,000 to $99,999 | 68 (30.5%) | 20 (11.2%) |
| $100,000 to $299,999 | 96 (43.0%) | 126 (70.4%) |
| $300,000 to $499,999 | 0 (0.0%) | 4 (2.2%) |
| $500,000 to $749,999 | 0 (0.0%) | 4 (2.2%) |
| $750,000 to $999,999 | 0 (0.0%) | 3 (1.7%) |
| $1,000,000 or more | 0 (0.0%) | 0 (0.0%) |
| Total | 223 (100.0%) | 179 (100.0%) |
Household Income by Mortgage Status in Castanea
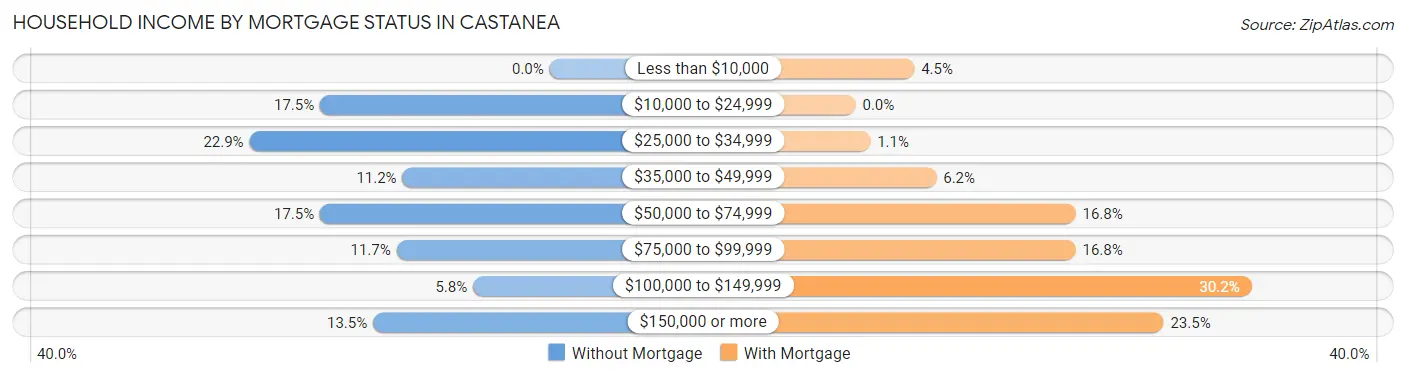
| Household Income | Without Mortgage | With Mortgage |
| Less than $10,000 | 0 (0.0%) | 8 (4.5%) |
| $10,000 to $24,999 | 39 (17.5%) | 0 (0.0%) |
| $25,000 to $34,999 | 51 (22.9%) | 2 (1.1%) |
| $35,000 to $49,999 | 25 (11.2%) | 11 (6.1%) |
| $50,000 to $74,999 | 39 (17.5%) | 30 (16.8%) |
| $75,000 to $99,999 | 26 (11.7%) | 30 (16.8%) |
| $100,000 to $149,999 | 13 (5.8%) | 54 (30.2%) |
| $150,000 or more | 30 (13.5%) | 42 (23.5%) |
| Total | 223 (100.0%) | 179 (100.0%) |
Property Value to Household Income Ratio in Castanea
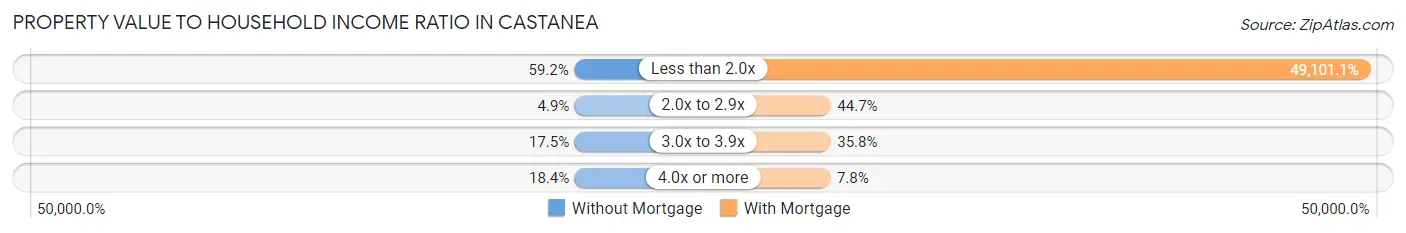
| Value-to-Income Ratio | Without Mortgage | With Mortgage |
| Less than 2.0x | 132 (59.2%) | 87,891 (49,101.1%) |
| 2.0x to 2.9x | 11 (4.9%) | 80 (44.7%) |
| 3.0x to 3.9x | 39 (17.5%) | 64 (35.7%) |
| 4.0x or more | 41 (18.4%) | 14 (7.8%) |
| Total | 223 (100.0%) | 179 (100.0%) |
Real Estate Taxes by Mortgage Status in Castanea
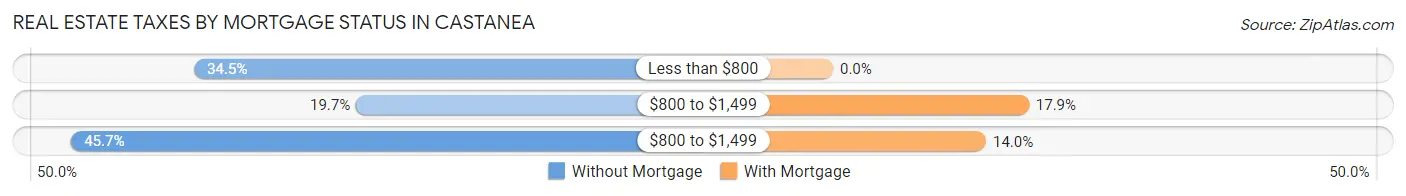
| Property Taxes | Without Mortgage | With Mortgage |
| Less than $800 | 77 (34.5%) | 0 (0.0%) |
| $800 to $1,499 | 44 (19.7%) | 32 (17.9%) |
| $800 to $1,499 | 102 (45.7%) | 25 (14.0%) |
| Total | 223 (100.0%) | 179 (100.0%) |
Health & Disability in Castanea
Health Insurance Coverage by Age in Castanea
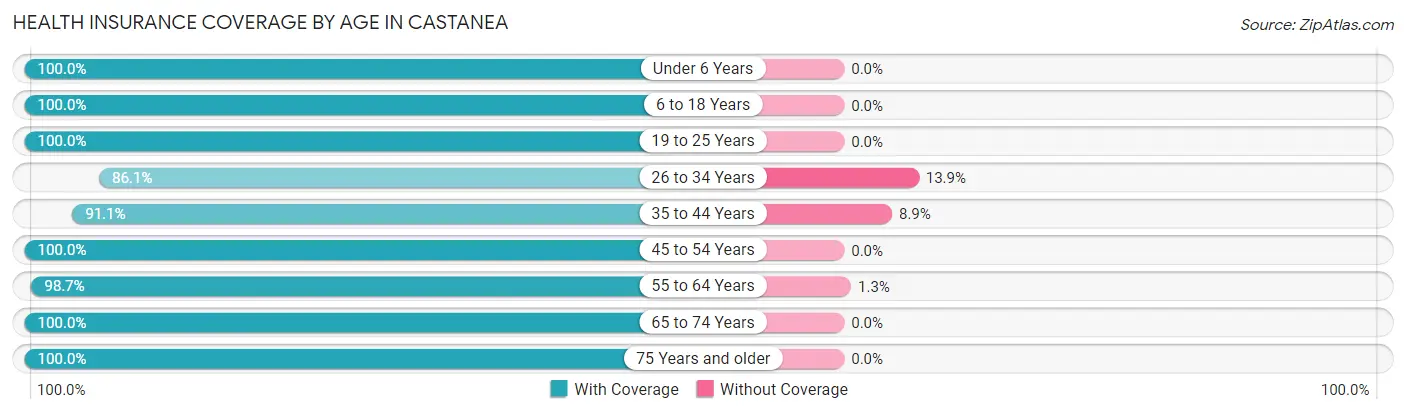
| Age Bracket | With Coverage | Without Coverage |
| Under 6 Years | 35 (100.0%) | 0 (0.0%) |
| 6 to 18 Years | 151 (100.0%) | 0 (0.0%) |
| 19 to 25 Years | 132 (100.0%) | 0 (0.0%) |
| 26 to 34 Years | 93 (86.1%) | 15 (13.9%) |
| 35 to 44 Years | 133 (91.1%) | 13 (8.9%) |
| 45 to 54 Years | 141 (100.0%) | 0 (0.0%) |
| 55 to 64 Years | 156 (98.7%) | 2 (1.3%) |
| 65 to 74 Years | 152 (100.0%) | 0 (0.0%) |
| 75 Years and older | 114 (100.0%) | 0 (0.0%) |
| Total | 1,107 (97.4%) | 30 (2.6%) |
Health Insurance Coverage by Citizenship Status in Castanea
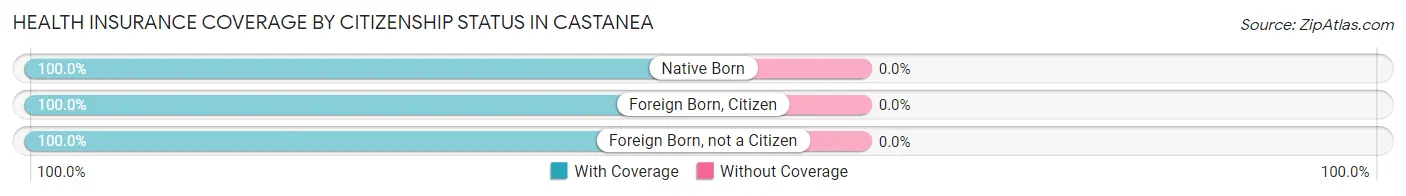
| Citizenship Status | With Coverage | Without Coverage |
| Native Born | 35 (100.0%) | 0 (0.0%) |
| Foreign Born, Citizen | 151 (100.0%) | 0 (0.0%) |
| Foreign Born, not a Citizen | 132 (100.0%) | 0 (0.0%) |
Health Insurance Coverage by Household Income in Castanea
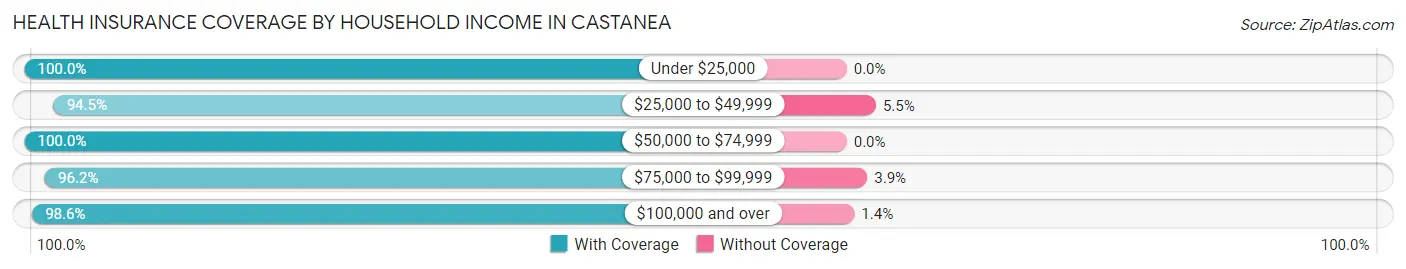
| Household Income | With Coverage | Without Coverage |
| Under $25,000 | 63 (100.0%) | 0 (0.0%) |
| $25,000 to $49,999 | 294 (94.5%) | 17 (5.5%) |
| $50,000 to $74,999 | 206 (100.0%) | 0 (0.0%) |
| $75,000 to $99,999 | 200 (96.2%) | 8 (3.8%) |
| $100,000 and over | 344 (98.6%) | 5 (1.4%) |
Public vs Private Health Insurance Coverage by Age in Castanea
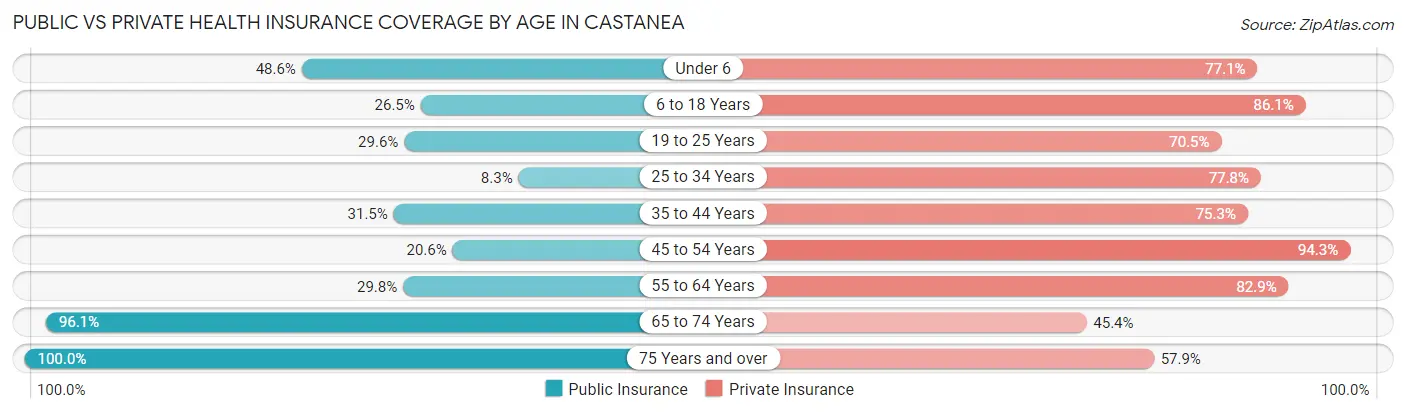
| Age Bracket | Public Insurance | Private Insurance |
| Under 6 | 17 (48.6%) | 27 (77.1%) |
| 6 to 18 Years | 40 (26.5%) | 130 (86.1%) |
| 19 to 25 Years | 39 (29.5%) | 93 (70.5%) |
| 25 to 34 Years | 9 (8.3%) | 84 (77.8%) |
| 35 to 44 Years | 46 (31.5%) | 110 (75.3%) |
| 45 to 54 Years | 29 (20.6%) | 133 (94.3%) |
| 55 to 64 Years | 47 (29.7%) | 131 (82.9%) |
| 65 to 74 Years | 146 (96.1%) | 69 (45.4%) |
| 75 Years and over | 114 (100.0%) | 66 (57.9%) |
| Total | 487 (42.8%) | 843 (74.1%) |
Disability Status by Sex by Age in Castanea
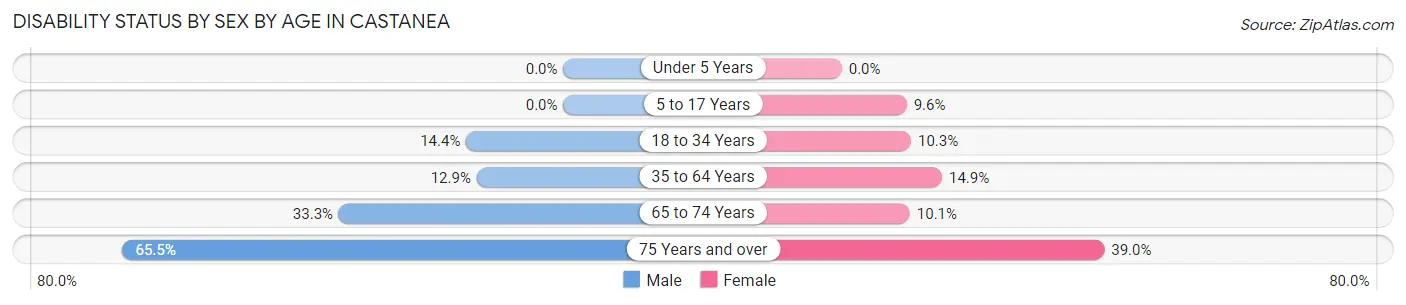
| Age Bracket | Male | Female |
| Under 5 Years | 0 (0.0%) | 0 (0.0%) |
| 5 to 17 Years | 0 (0.0%) | 8 (9.6%) |
| 18 to 34 Years | 15 (14.4%) | 14 (10.3%) |
| 35 to 64 Years | 27 (12.9%) | 35 (14.9%) |
| 65 to 74 Years | 21 (33.3%) | 9 (10.1%) |
| 75 Years and over | 36 (65.4%) | 23 (39.0%) |
Disability Class by Sex by Age in Castanea
Disability Class: Hearing Difficulty
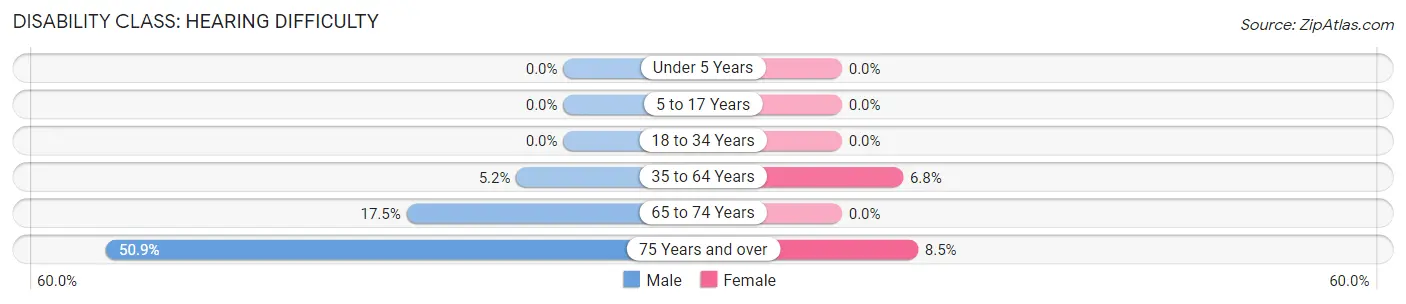
| Age Bracket | Male | Female |
| Under 5 Years | 0 (0.0%) | 0 (0.0%) |
| 5 to 17 Years | 0 (0.0%) | 0 (0.0%) |
| 18 to 34 Years | 0 (0.0%) | 0 (0.0%) |
| 35 to 64 Years | 11 (5.2%) | 16 (6.8%) |
| 65 to 74 Years | 11 (17.5%) | 0 (0.0%) |
| 75 Years and over | 28 (50.9%) | 5 (8.5%) |
Disability Class: Vision Difficulty
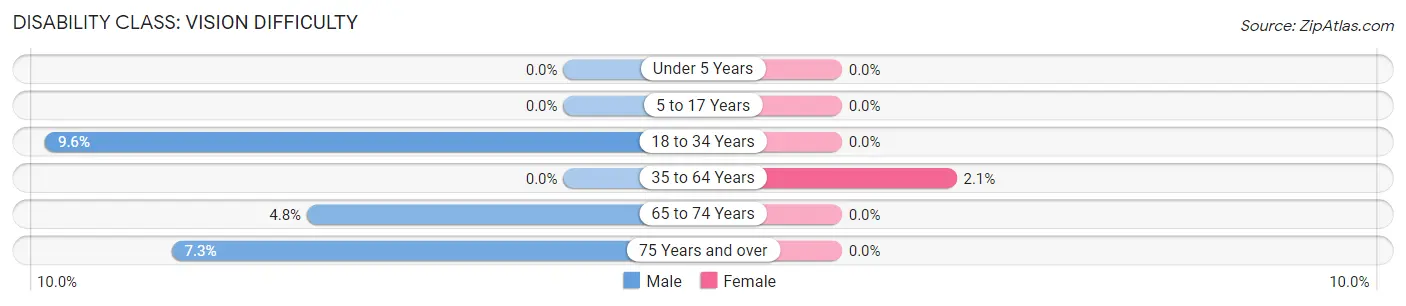
| Age Bracket | Male | Female |
| Under 5 Years | 0 (0.0%) | 0 (0.0%) |
| 5 to 17 Years | 0 (0.0%) | 0 (0.0%) |
| 18 to 34 Years | 10 (9.6%) | 0 (0.0%) |
| 35 to 64 Years | 0 (0.0%) | 5 (2.1%) |
| 65 to 74 Years | 3 (4.8%) | 0 (0.0%) |
| 75 Years and over | 4 (7.3%) | 0 (0.0%) |
Disability Class: Cognitive Difficulty
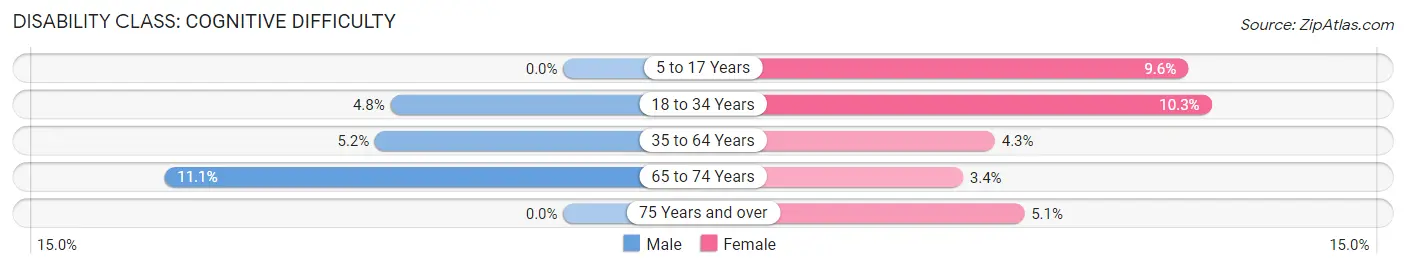
| Age Bracket | Male | Female |
| 5 to 17 Years | 0 (0.0%) | 8 (9.6%) |
| 18 to 34 Years | 5 (4.8%) | 14 (10.3%) |
| 35 to 64 Years | 11 (5.2%) | 10 (4.3%) |
| 65 to 74 Years | 7 (11.1%) | 3 (3.4%) |
| 75 Years and over | 0 (0.0%) | 3 (5.1%) |
Disability Class: Ambulatory Difficulty
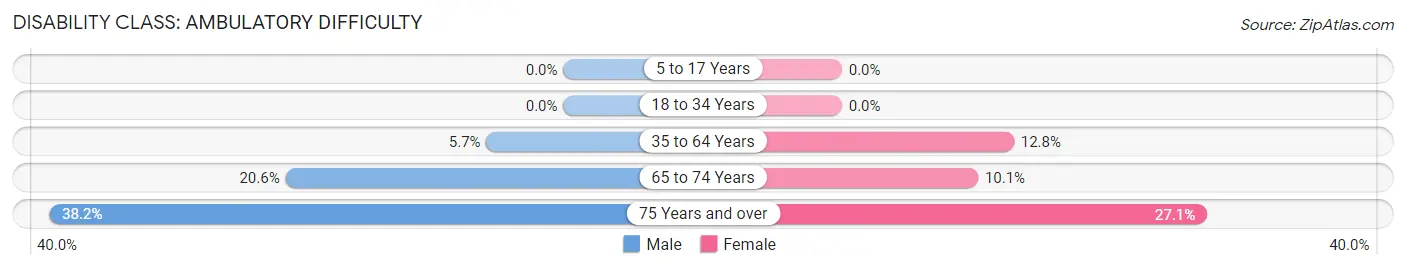
| Age Bracket | Male | Female |
| 5 to 17 Years | 0 (0.0%) | 0 (0.0%) |
| 18 to 34 Years | 0 (0.0%) | 0 (0.0%) |
| 35 to 64 Years | 12 (5.7%) | 30 (12.8%) |
| 65 to 74 Years | 13 (20.6%) | 9 (10.1%) |
| 75 Years and over | 21 (38.2%) | 16 (27.1%) |
Disability Class: Self-Care Difficulty
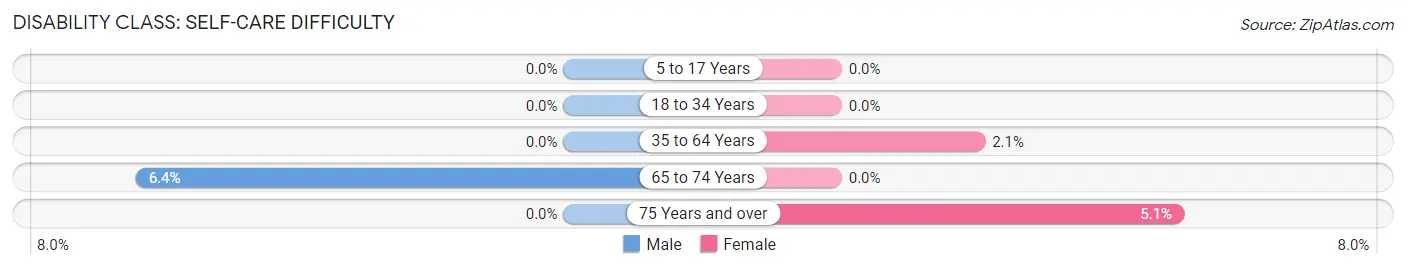
| Age Bracket | Male | Female |
| 5 to 17 Years | 0 (0.0%) | 0 (0.0%) |
| 18 to 34 Years | 0 (0.0%) | 0 (0.0%) |
| 35 to 64 Years | 0 (0.0%) | 5 (2.1%) |
| 65 to 74 Years | 4 (6.4%) | 0 (0.0%) |
| 75 Years and over | 0 (0.0%) | 3 (5.1%) |
Technology Access in Castanea
Computing Device Access in Castanea
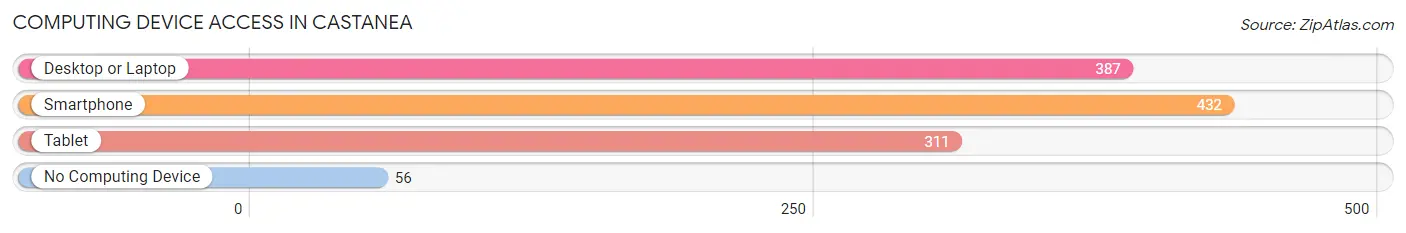
| Device Type | # Households | % Households |
| Desktop or Laptop | 387 | 74.1% |
| Smartphone | 432 | 82.8% |
| Tablet | 311 | 59.6% |
| No Computing Device | 56 | 10.7% |
| Total | 522 | 100.0% |
Internet Access in Castanea
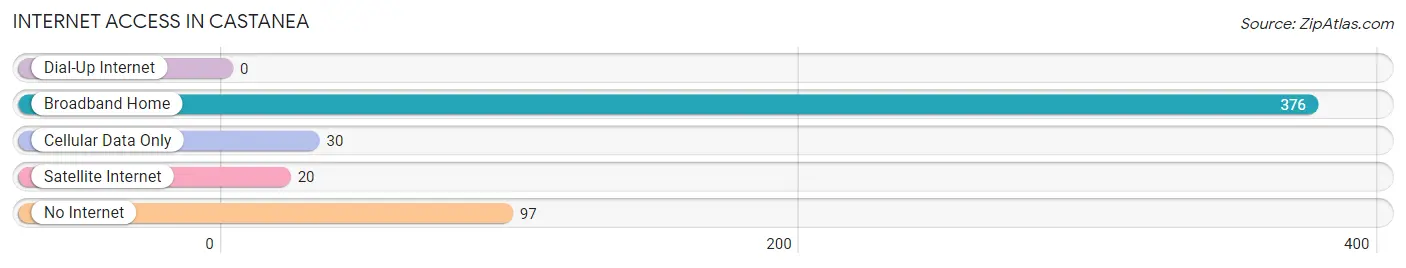
| Internet Type | # Households | % Households |
| Dial-Up Internet | 0 | 0.0% |
| Broadband Home | 376 | 72.0% |
| Cellular Data Only | 30 | 5.8% |
| Satellite Internet | 20 | 3.8% |
| No Internet | 97 | 18.6% |
| Total | 522 | 100.0% |
Castanea Summary
Castanea is a small borough located in Clinton County, Pennsylvania, United States. The population was 1,093 at the 2010 census. It is part of the Lock Haven, PA Micropolitan Statistical Area.
History
Castanea was first settled in 1790 by a group of German immigrants. The town was originally known as "Kastanienhain" or "Chestnut Grove" in German. The name was later changed to Castanea, which is the Latin word for chestnut. The town was officially incorporated in 1864.
Castanea was an important stop on the Pennsylvania Canal, which ran through the town from 1834 to 1877. The canal was used to transport goods and passengers between Philadelphia and Pittsburgh. The canal was eventually replaced by the Pennsylvania Railroad, which ran through Castanea until the late 1960s.
Geography
Castanea is located at 40°51'45" North, 77°20'45" West (40.8625, -77.3458). According to the United States Census Bureau, the borough has a total area of 0.6 square miles (1.6 km2), all of it land.
Economy
The economy of Castanea is largely based on agriculture and tourism. The town is home to several small farms, which produce a variety of crops, including corn, soybeans, and hay. The town is also home to several small businesses, including a grocery store, a hardware store, and a restaurant.
Tourism is an important part of the local economy. The town is home to several historic sites, including the Pennsylvania Canal, the Pennsylvania Railroad, and the Castanea Covered Bridge. The town also hosts several annual events, including the Castanea Harvest Festival and the Castanea Christmas Parade.
Demographics
As of the census of 2010, there were 1,093 people, 441 households, and 294 families residing in the borough. The population density was 1,817.5 people per square mile (700.3/km2). There were 471 housing units at an average density of 781.7 per square mile (301.7/km2). The racial makeup of the borough was 97.7% White, 0.2% African American, 0.2% Native American, 0.2% Asian, 0.2% from other races, and 1.7% from two or more races. Hispanic or Latino of any race were 0.7% of the population.
There were 441 households, out of which 28.2% had children under the age of 18 living with them, 51.6% were married couples living together, 9.3% had a female householder with no husband present, and 34.2% were non-families. 29.2% of all households were made up of individuals, and 14.3% had someone living alone who was 65 years of age or older. The average household size was 2.48 and the average family size was 3.06.
In the borough, the population was spread out, with 24.2% under the age of 18, 7.2% from 18 to 24, 27.2% from 25 to 44, 24.2% from 45 to 64, and 17.2% who were 65 years of age or older. The median age was 39 years. For every 100 females, there were 94.2 males. For every 100 females age 18 and over, there were 91.2 males.
The median income for a household in the borough was $35,000, and the median income for a family was $41,250. Males had a median income of $30,000 versus $21,250 for females. The per capita income for the borough was $17,845. About 8.2% of families and 10.2% of the population were below the poverty line, including 14.3% of those under age 18 and 8.2% of those age 65 or over.
Common Questions
What is the Total Population of Castanea?
Total Population of Castanea is 1,137.
What is the Total Male Population of Castanea?
Total Male Population of Castanea is 535.
What is the Total Female Population of Castanea?
Total Female Population of Castanea is 602.
What is the Ratio of Males per 100 Females in Castanea?
There are 88.87 Males per 100 Females in Castanea.
What is the Ratio of Females per 100 Males in Castanea?
There are 112.52 Females per 100 Males in Castanea.
What is the Median Population Age in Castanea?
Median Population Age in Castanea is 44.1 Years.
What is the Average Family Size in Castanea
Average Family Size in Castanea is 2.7 People.
What is the Average Household Size in Castanea
Average Household Size in Castanea is 2.2 People.
What is Per Capita Income in Castanea?
Per Capita income in Castanea is $35,655.
What is the Median Family Income in Castanea?
Median Family Income in Castanea is $71,719.
What is the Median Household income in Castanea?
Median Household Income in Castanea is $57,778.
What is Income or Wage Gap in Castanea?
Income or Wage Gap in Castanea is 38.2%.
Women in Castanea earn 61.8 cents for every dollar earned by a man.
What is Inequality or Gini Index in Castanea?
Inequality or Gini Index in Castanea is 0.37.
How Large is the Labor Force in Castanea?
There are 666 People in the Labor Forcein in Castanea.
What is the Percentage of People in the Labor Force in Castanea?
66.6% of People are in the Labor Force in Castanea.
What is the Unemployment Rate in Castanea?
Unemployment Rate in Castanea is 2.6%.