Mercer County, PA
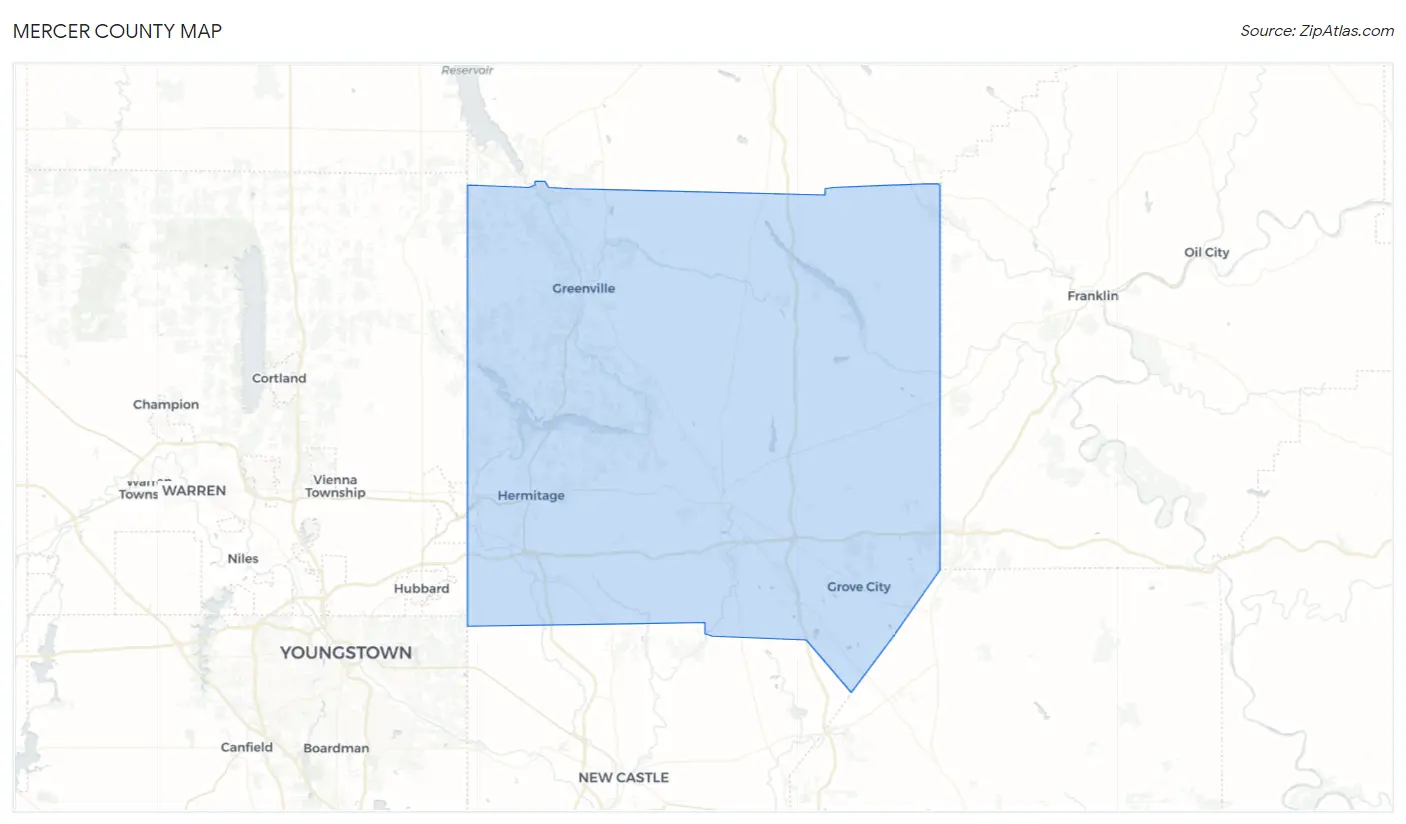
Mercer County Map
Mercer County Overview
110,600
TOTAL POPULATION
54,917
MALE POPULATION
55,683
FEMALE POPULATION
98.62
MALES / 100 FEMALES
101.39
FEMALES / 100 MALES
45.0
MEDIAN AGE
2.9
AVG FAMILY SIZE
2.3
AVG HOUSEHOLD SIZE
$32,081
PER CAPITA INCOME
$76,303
AVG FAMILY INCOME
$57,353
AVG HOUSEHOLD INCOME
35.1%
WAGE / INCOME GAP [ % ]
64.9¢/ $1
WAGE / INCOME GAP [ $ ]
$9,353
FAMILY INCOME DEFICIT
0.45
INEQUALITY / GINI INDEX
50,860
LABOR FORCE [ PEOPLE ]
55.0%
PERCENT IN LABOR FORCE
5.5%
UNEMPLOYMENT RATE
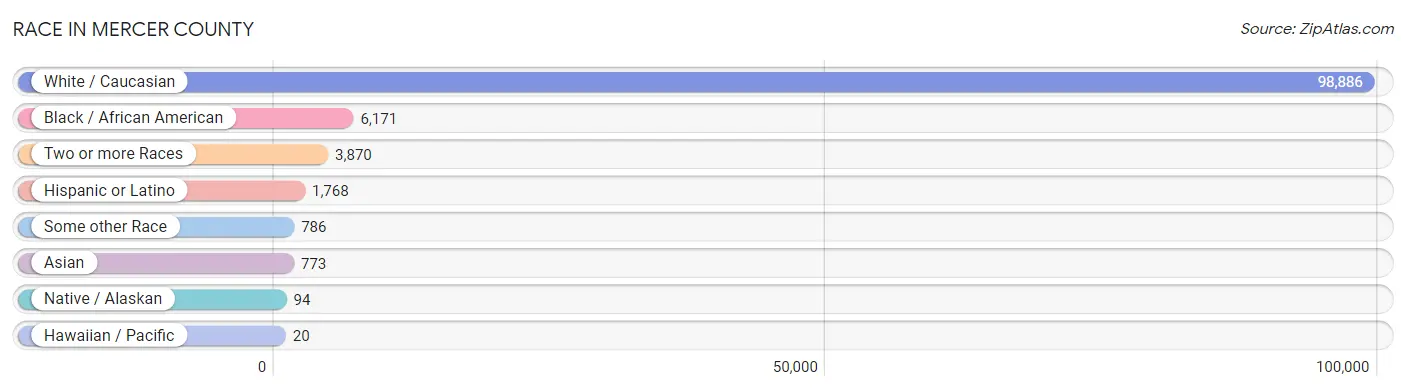
Race in Mercer County
The most populous races in Mercer County are White / Caucasian (98,886 | 89.4%), Black / African American (6,171 | 5.6%), and Two or more Races (3,870 | 3.5%).
| Race | # Population | % Population |
| Asian | 773 | 0.7% |
| Black / African American | 6,171 | 5.6% |
| Hawaiian / Pacific | 20 | 0.0% |
| Hispanic or Latino | 1,768 | 1.6% |
| Native / Alaskan | 94 | 0.1% |
| White / Caucasian | 98,886 | 89.4% |
| Two or more Races | 3,870 | 3.5% |
| Some other Race | 786 | 0.7% |
| Total | 110,600 | 100.0% |
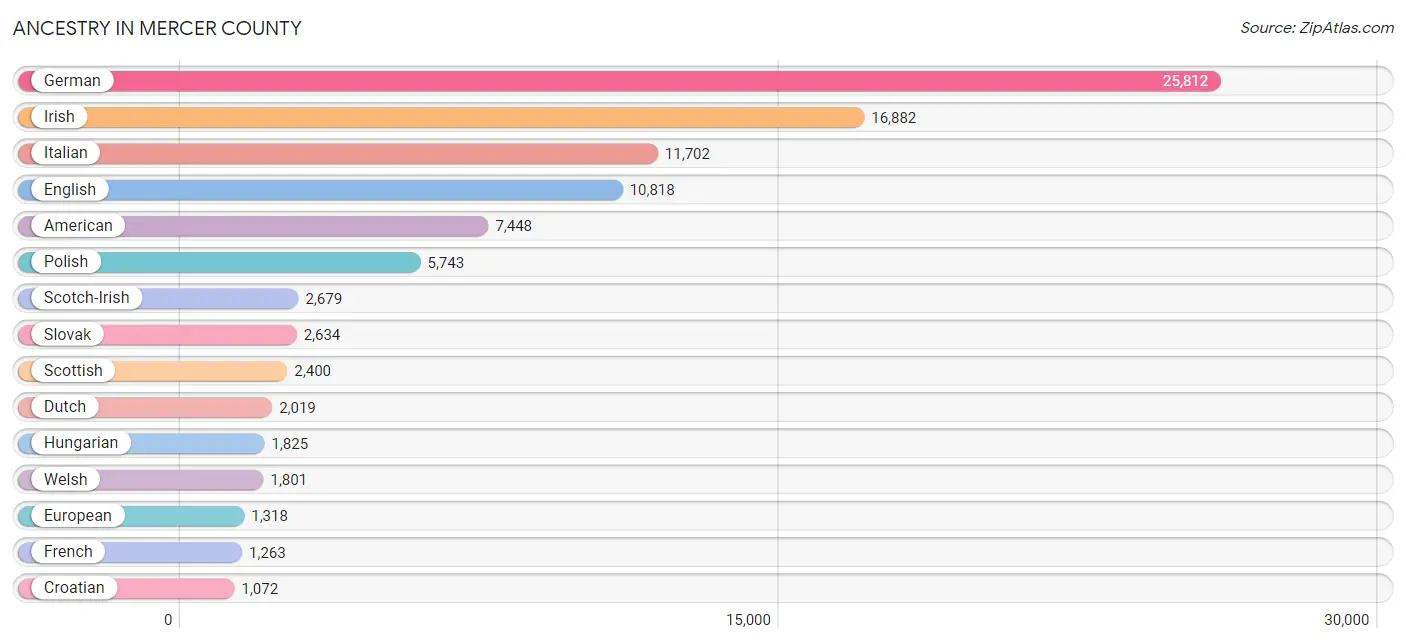
Ancestry in Mercer County
The most populous ancestries reported in Mercer County are German (25,812 | 23.3%), Irish (16,882 | 15.3%), Italian (11,702 | 10.6%), English (10,818 | 9.8%), and American (7,448 | 6.7%), together accounting for 65.7% of all Mercer County residents.
| Ancestry | # Population | % Population |
| African | 63 | 0.1% |
| American | 7,448 | 6.7% |
| Apache | 3 | 0.0% |
| Arab | 262 | 0.2% |
| Armenian | 16 | 0.0% |
| Australian | 10 | 0.0% |
| Austrian | 291 | 0.3% |
| Bangladeshi | 11 | 0.0% |
| Belgian | 111 | 0.1% |
| Bhutanese | 98 | 0.1% |
| Blackfeet | 59 | 0.1% |
| British | 412 | 0.4% |
| Bulgarian | 115 | 0.1% |
| Burmese | 79 | 0.1% |
| Canadian | 65 | 0.1% |
| Cape Verdean | 101 | 0.1% |
| Carpatho Rusyn | 46 | 0.0% |
| Celtic | 13 | 0.0% |
| Central American | 58 | 0.1% |
| Central American Indian | 23 | 0.0% |
| Cherokee | 46 | 0.0% |
| Chickasaw | 6 | 0.0% |
| Chippewa | 31 | 0.0% |
| Colombian | 11 | 0.0% |
| Costa Rican | 3 | 0.0% |
| Croatian | 1,072 | 1.0% |
| Cuban | 71 | 0.1% |
| Czech | 394 | 0.4% |
| Czechoslovakian | 127 | 0.1% |
| Danish | 65 | 0.1% |
| Delaware | 13 | 0.0% |
| Dominican | 171 | 0.2% |
| Dutch | 2,019 | 1.8% |
| Eastern European | 330 | 0.3% |
| Ecuadorian | 75 | 0.1% |
| Egyptian | 19 | 0.0% |
| English | 10,818 | 9.8% |
| Estonian | 2 | 0.0% |
| Ethiopian | 15 | 0.0% |
| European | 1,318 | 1.2% |
| Filipino | 8 | 0.0% |
| Finnish | 127 | 0.1% |
| French | 1,263 | 1.1% |
| French Canadian | 181 | 0.2% |
| German | 25,812 | 23.3% |
| Greek | 543 | 0.5% |
| Guatemalan | 45 | 0.0% |
| Guyanese | 6 | 0.0% |
| Haitian | 4 | 0.0% |
| Honduran | 8 | 0.0% |
| Hopi | 3 | 0.0% |
| Hungarian | 1,825 | 1.7% |
| Indian (Asian) | 265 | 0.2% |
| Iranian | 23 | 0.0% |
| Irish | 16,882 | 15.3% |
| Iroquois | 78 | 0.1% |
| Israeli | 7 | 0.0% |
| Italian | 11,702 | 10.6% |
| Jamaican | 45 | 0.0% |
| Korean | 473 | 0.4% |
| Laotian | 28 | 0.0% |
| Latvian | 31 | 0.0% |
| Lebanese | 123 | 0.1% |
| Liberian | 5 | 0.0% |
| Lithuanian | 196 | 0.2% |
| Mexican | 347 | 0.3% |
| Mexican American Indian | 10 | 0.0% |
| Moroccan | 3 | 0.0% |
| Native Hawaiian | 22 | 0.0% |
| Navajo | 2 | 0.0% |
| Nigerian | 18 | 0.0% |
| Northern European | 113 | 0.1% |
| Norwegian | 189 | 0.2% |
| Ottawa | 10 | 0.0% |
| Pakistani | 53 | 0.1% |
| Pennsylvania German | 624 | 0.6% |
| Peruvian | 2 | 0.0% |
| Polish | 5,743 | 5.2% |
| Portuguese | 24 | 0.0% |
| Puerto Rican | 708 | 0.6% |
| Romanian | 291 | 0.3% |
| Russian | 960 | 0.9% |
| Salvadoran | 2 | 0.0% |
| Samoan | 28 | 0.0% |
| Scandinavian | 117 | 0.1% |
| Scotch-Irish | 2,679 | 2.4% |
| Scottish | 2,400 | 2.2% |
| Senegalese | 4 | 0.0% |
| Serbian | 436 | 0.4% |
| Sioux | 64 | 0.1% |
| Slavic | 218 | 0.2% |
| Slovak | 2,634 | 2.4% |
| Slovene | 125 | 0.1% |
| South African | 7 | 0.0% |
| South American | 88 | 0.1% |
| Spaniard | 44 | 0.0% |
| Spanish | 131 | 0.1% |
| Sri Lankan | 47 | 0.0% |
| Subsaharan African | 211 | 0.2% |
| Swedish | 995 | 0.9% |
| Swiss | 515 | 0.5% |
| Syrian | 104 | 0.1% |
| Thai | 143 | 0.1% |
| Trinidadian and Tobagonian | 15 | 0.0% |
| Turkish | 12 | 0.0% |
| Ukrainian | 382 | 0.4% |
| Welsh | 1,801 | 1.6% |
| West Indian | 18 | 0.0% |
| Yugoslavian | 65 | 0.1% | View All 109 Rows |
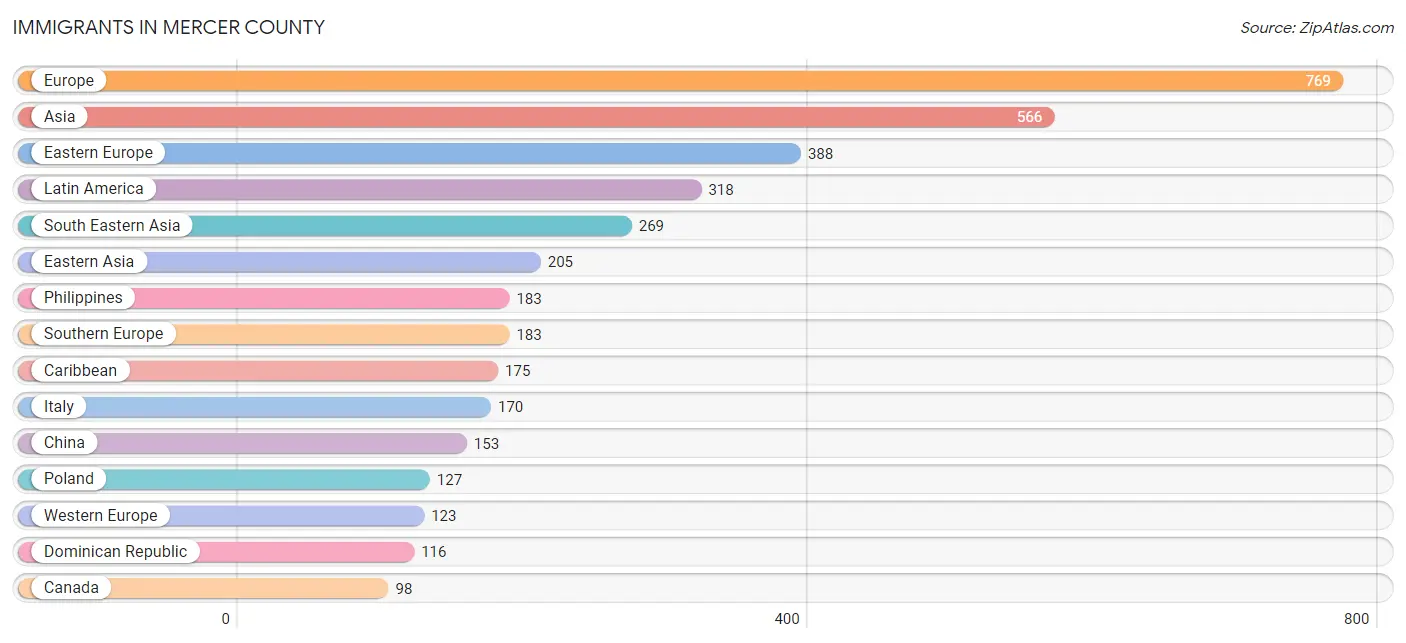
Immigrants in Mercer County
The most numerous immigrant groups reported in Mercer County came from Europe (769 | 0.7%), Asia (566 | 0.5%), Eastern Europe (388 | 0.4%), Latin America (318 | 0.3%), and South Eastern Asia (269 | 0.2%), together accounting for 2.1% of all Mercer County residents.
| Immigration Origin | # Population | % Population |
| Africa | 39 | 0.0% |
| Asia | 566 | 0.5% |
| Australia | 23 | 0.0% |
| Austria | 68 | 0.1% |
| Belgium | 12 | 0.0% |
| Bulgaria | 34 | 0.0% |
| Canada | 98 | 0.1% |
| Caribbean | 175 | 0.2% |
| Central America | 89 | 0.1% |
| China | 153 | 0.1% |
| Colombia | 4 | 0.0% |
| Costa Rica | 17 | 0.0% |
| Cuba | 34 | 0.0% |
| Czechoslovakia | 23 | 0.0% |
| Denmark | 10 | 0.0% |
| Dominican Republic | 116 | 0.1% |
| Eastern Africa | 4 | 0.0% |
| Eastern Asia | 205 | 0.2% |
| Eastern Europe | 388 | 0.4% |
| Ecuador | 48 | 0.0% |
| Egypt | 19 | 0.0% |
| England | 22 | 0.0% |
| Europe | 769 | 0.7% |
| Germany | 40 | 0.0% |
| Greece | 13 | 0.0% |
| Guatemala | 44 | 0.0% |
| Haiti | 6 | 0.0% |
| Hungary | 17 | 0.0% |
| India | 57 | 0.1% |
| Indonesia | 21 | 0.0% |
| Iran | 2 | 0.0% |
| Ireland | 16 | 0.0% |
| Italy | 170 | 0.2% |
| Jamaica | 4 | 0.0% |
| Japan | 8 | 0.0% |
| Korea | 44 | 0.0% |
| Latin America | 318 | 0.3% |
| Liberia | 5 | 0.0% |
| Mexico | 28 | 0.0% |
| Netherlands | 3 | 0.0% |
| Northern Africa | 19 | 0.0% |
| Northern Europe | 75 | 0.1% |
| Oceania | 23 | 0.0% |
| Pakistan | 16 | 0.0% |
| Peru | 2 | 0.0% |
| Philippines | 183 | 0.2% |
| Poland | 127 | 0.1% |
| Romania | 15 | 0.0% |
| Russia | 33 | 0.0% |
| Scotland | 2 | 0.0% |
| Senegal | 4 | 0.0% |
| South America | 54 | 0.1% |
| South Central Asia | 75 | 0.1% |
| South Eastern Asia | 269 | 0.2% |
| Southern Europe | 183 | 0.2% |
| Taiwan | 20 | 0.0% |
| Thailand | 26 | 0.0% |
| Trinidad and Tobago | 15 | 0.0% |
| Turkey | 12 | 0.0% |
| Vietnam | 39 | 0.0% |
| Western Africa | 9 | 0.0% |
| Western Asia | 17 | 0.0% |
| Western Europe | 123 | 0.1% | View All 63 Rows |
Sex and Age in Mercer County
Sex and Age in Mercer County
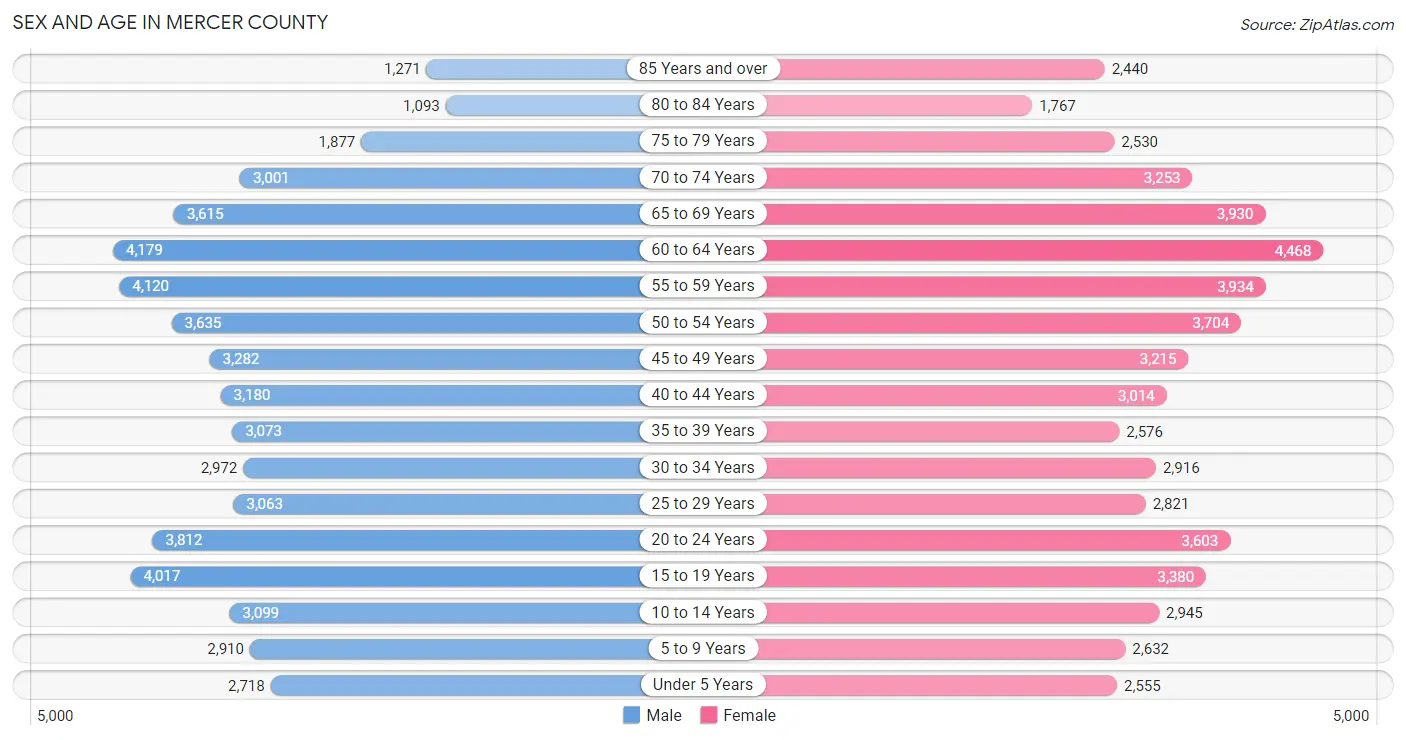
The most populous age groups in Mercer County are 60 to 64 Years (4,179 | 7.6%) for men and 60 to 64 Years (4,468 | 8.0%) for women.
| Age Bracket | Male | Female |
| Under 5 Years | 2,718 (5.0%) | 2,555 (4.6%) |
| 5 to 9 Years | 2,910 (5.3%) | 2,632 (4.7%) |
| 10 to 14 Years | 3,099 (5.6%) | 2,945 (5.3%) |
| 15 to 19 Years | 4,017 (7.3%) | 3,380 (6.1%) |
| 20 to 24 Years | 3,812 (6.9%) | 3,603 (6.5%) |
| 25 to 29 Years | 3,063 (5.6%) | 2,821 (5.1%) |
| 30 to 34 Years | 2,972 (5.4%) | 2,916 (5.2%) |
| 35 to 39 Years | 3,073 (5.6%) | 2,576 (4.6%) |
| 40 to 44 Years | 3,180 (5.8%) | 3,014 (5.4%) |
| 45 to 49 Years | 3,282 (6.0%) | 3,215 (5.8%) |
| 50 to 54 Years | 3,635 (6.6%) | 3,704 (6.7%) |
| 55 to 59 Years | 4,120 (7.5%) | 3,934 (7.1%) |
| 60 to 64 Years | 4,179 (7.6%) | 4,468 (8.0%) |
| 65 to 69 Years | 3,615 (6.6%) | 3,930 (7.1%) |
| 70 to 74 Years | 3,001 (5.5%) | 3,253 (5.8%) |
| 75 to 79 Years | 1,877 (3.4%) | 2,530 (4.5%) |
| 80 to 84 Years | 1,093 (2.0%) | 1,767 (3.2%) |
| 85 Years and over | 1,271 (2.3%) | 2,440 (4.4%) |
| Total | 54,917 (100.0%) | 55,683 (100.0%) |
Families and Households in Mercer County
Median Family Size in Mercer County
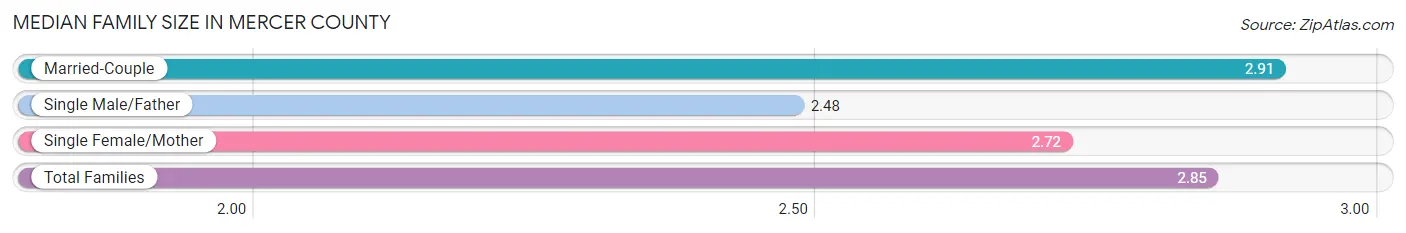
The median family size in Mercer County is 2.85 persons per family, with married-couple families (21,759 | 74.9%) accounting for the largest median family size of 2.91 persons per family. On the other hand, single male/father families (2,026 | 7.0%) represent the smallest median family size with 2.48 persons per family.
| Family Type | # Families | Family Size |
| Married-Couple | 21,759 (74.9%) | 2.91 |
| Single Male/Father | 2,026 (7.0%) | 2.48 |
| Single Female/Mother | 5,250 (18.1%) | 2.72 |
| Total Families | 29,035 (100.0%) | 2.85 |
Median Household Size in Mercer County
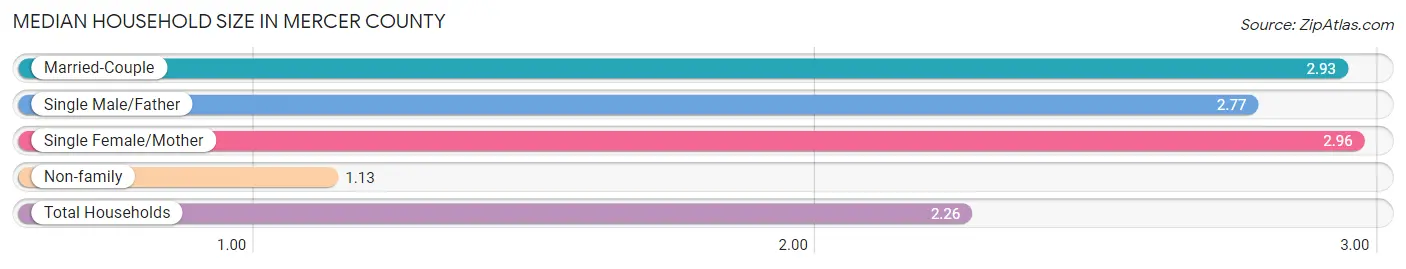
The median household size in Mercer County is 2.26 persons per household, with single female/mother households (5,250 | 11.4%) accounting for the largest median household size of 2.96 persons per household. non-family households (16,855 | 36.7%) represent the smallest median household size with 1.13 persons per household.
| Household Type | # Households | Household Size |
| Married-Couple | 21,759 (47.4%) | 2.93 |
| Single Male/Father | 2,026 (4.4%) | 2.77 |
| Single Female/Mother | 5,250 (11.4%) | 2.96 |
| Non-family | 16,855 (36.7%) | 1.13 |
| Total Households | 45,890 (100.0%) | 2.26 |
Household Size by Marriage Status in Mercer County
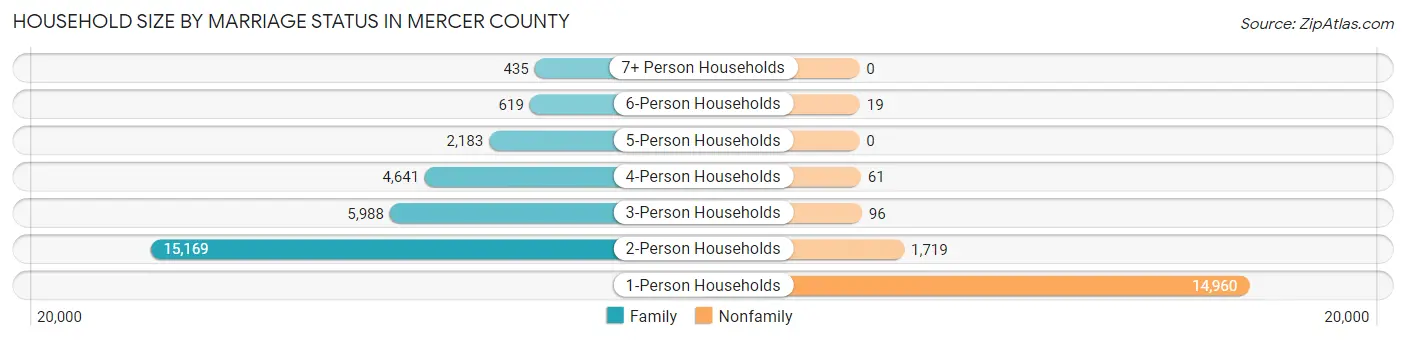
Out of a total of 45,890 households in Mercer County, 29,035 (63.3%) are family households, while 16,855 (36.7%) are nonfamily households. The most numerous type of family households are 2-person households, comprising 15,169, and the most common type of nonfamily households are 1-person households, comprising 14,960.
| Household Size | Family Households | Nonfamily Households |
| 1-Person Households | - | 14,960 (32.6%) |
| 2-Person Households | 15,169 (33.1%) | 1,719 (3.7%) |
| 3-Person Households | 5,988 (13.1%) | 96 (0.2%) |
| 4-Person Households | 4,641 (10.1%) | 61 (0.1%) |
| 5-Person Households | 2,183 (4.8%) | 0 (0.0%) |
| 6-Person Households | 619 (1.3%) | 19 (0.0%) |
| 7+ Person Households | 435 (0.9%) | 0 (0.0%) |
| Total | 29,035 (63.3%) | 16,855 (36.7%) |
Female Fertility in Mercer County
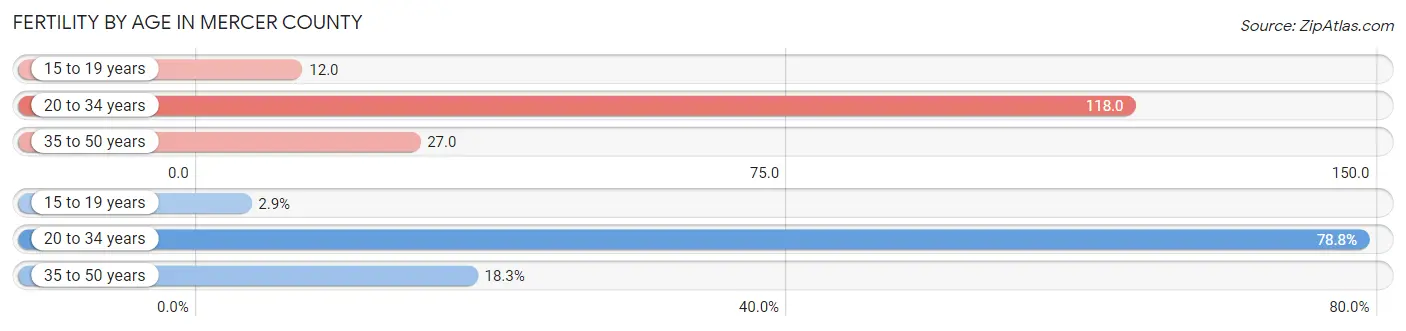
Fertility by Age in Mercer County
Average fertility rate in Mercer County is 63.0 births per 1,000 women. Women in the age bracket of 20 to 34 years have the highest fertility rate with 118.0 births per 1,000 women. Women in the age bracket of 20 to 34 years acount for 78.8% of all women with births.
| Age Bracket | Women with Births | Births / 1,000 Women |
| 15 to 19 years | 41 (2.9%) | 12.0 |
| 20 to 34 years | 1,098 (78.8%) | 118.0 |
| 35 to 50 years | 255 (18.3%) | 27.0 |
| Total | 1,394 (100.0%) | 63.0 |
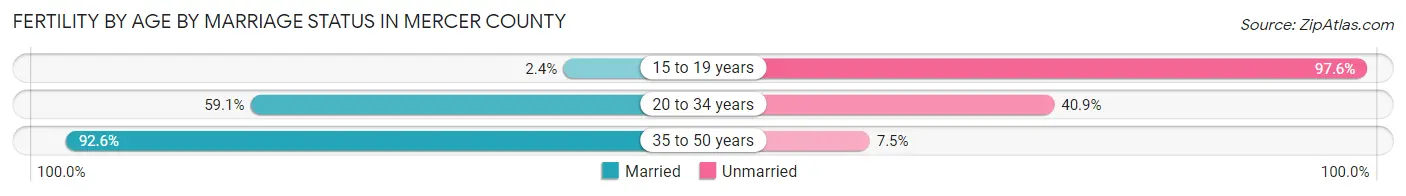
Fertility by Age by Marriage Status in Mercer County
63.6% of women with births (1,394) in Mercer County are married. The highest percentage of unmarried women with births falls into 15 to 19 years age bracket with 97.6% of them unmarried at the time of birth, while the lowest percentage of unmarried women with births belong to 35 to 50 years age bracket with 7.5% of them unmarried.
| Age Bracket | Married | Unmarried |
| 15 to 19 years | 1 (2.4%) | 40 (97.6%) |
| 20 to 34 years | 649 (59.1%) | 449 (40.9%) |
| 35 to 50 years | 236 (92.5%) | 19 (7.4%) |
| Total | 887 (63.6%) | 507 (36.4%) |
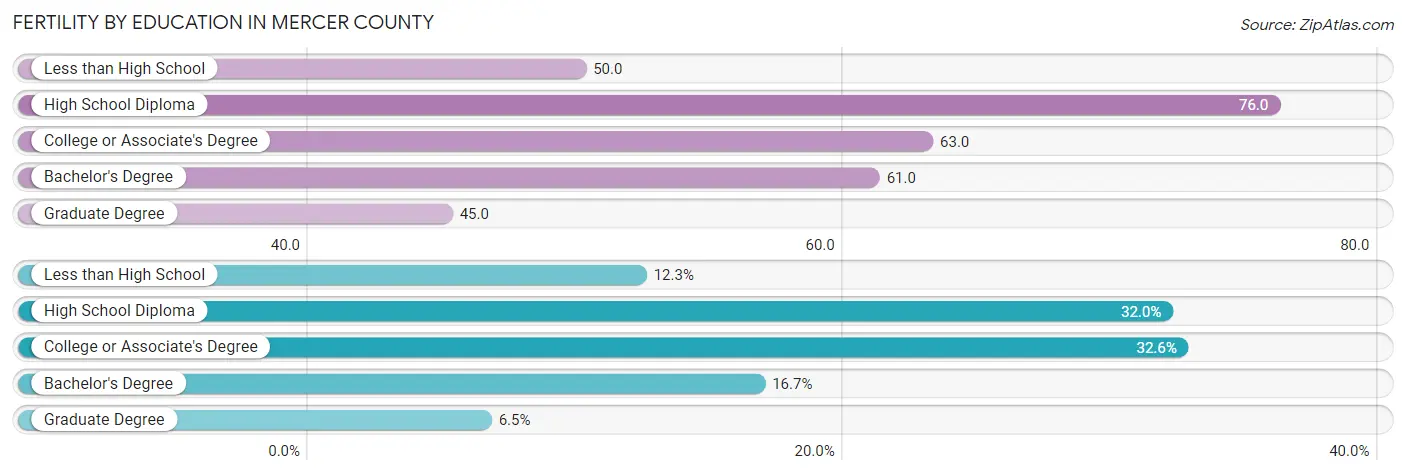
Fertility by Education in Mercer County
Average fertility rate in Mercer County is 63.0 births per 1,000 women. Women with the education attainment of high school diploma have the highest fertility rate of 76.0 births per 1,000 women, while women with the education attainment of graduate degree have the lowest fertility at 45.0 births per 1,000 women. Women with the education attainment of college or associate's degree represent 32.6% of all women with births.
| Educational Attainment | Women with Births | Births / 1,000 Women |
| Less than High School | 171 (12.3%) | 50.0 |
| High School Diploma | 446 (32.0%) | 76.0 |
| College or Associate's Degree | 454 (32.6%) | 63.0 |
| Bachelor's Degree | 233 (16.7%) | 61.0 |
| Graduate Degree | 90 (6.5%) | 45.0 |
| Total | 1,394 (100.0%) | 63.0 |
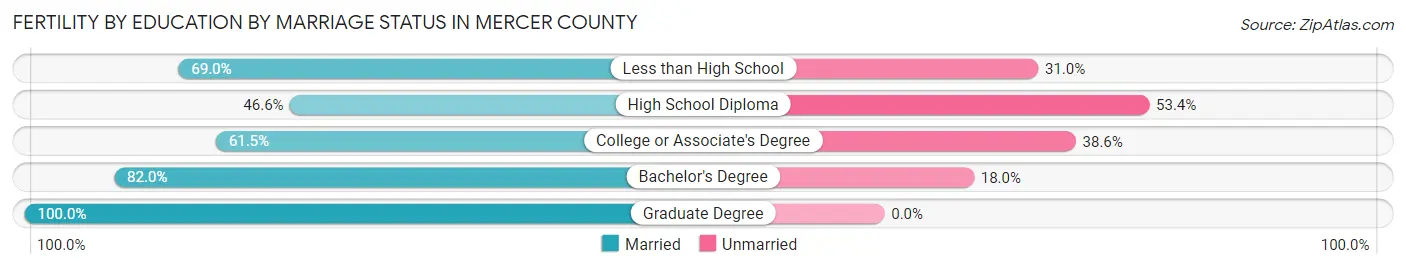
Fertility by Education by Marriage Status in Mercer County
36.4% of women with births in Mercer County are unmarried. Women with the educational attainment of graduate degree are most likely to be married with 100.0% of them married at childbirth, while women with the educational attainment of high school diploma are least likely to be married with 53.4% of them unmarried at childbirth.
| Educational Attainment | Married | Unmarried |
| Less than High School | 118 (69.0%) | 53 (31.0%) |
| High School Diploma | 208 (46.6%) | 238 (53.4%) |
| College or Associate's Degree | 279 (61.5%) | 175 (38.6%) |
| Bachelor's Degree | 191 (82.0%) | 42 (18.0%) |
| Graduate Degree | 90 (100.0%) | 0 (0.0%) |
| Total | 887 (63.6%) | 507 (36.4%) |
Income in Mercer County
Income Overview in Mercer County
Per Capita Income in Mercer County is $32,081, while median incomes of families and households are $76,303 and $57,353 respectively.
| Characteristic | Number | Measure |
| Per Capita Income | 110,600 | $32,081 |
| Median Family Income | 29,035 | $76,303 |
| Mean Family Income | 29,035 | $92,021 |
| Median Household Income | 45,890 | $57,353 |
| Mean Household Income | 45,890 | $75,590 |
| Income Deficit | 29,035 | $9,353 |
| Wage / Income Gap (%) | 110,600 | 35.14% |
| Wage / Income Gap ($) | 110,600 | 64.86¢ per $1 |
| Gini / Inequality Index | 110,600 | 0.45 |
Earnings by Sex in Mercer County
Average Earnings in Mercer County are $34,594, $43,482 for men and $28,203 for women, a difference of 35.1%.
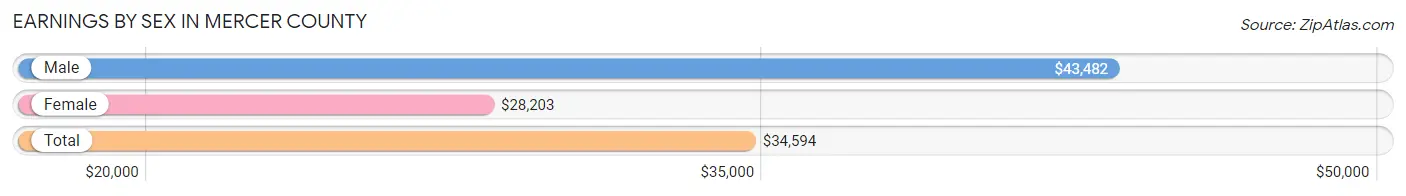
| Sex | Number | Average Earnings |
| Male | 28,703 (52.2%) | $43,482 |
| Female | 26,240 (47.8%) | $28,203 |
| Total | 54,943 (100.0%) | $34,594 |
Earnings by Sex by Income Bracket in Mercer County
The most common earnings brackets in Mercer County are $100,000+ for men (3,191 | 11.1%) and $25,000 to $29,999 for women (2,248 | 8.6%).
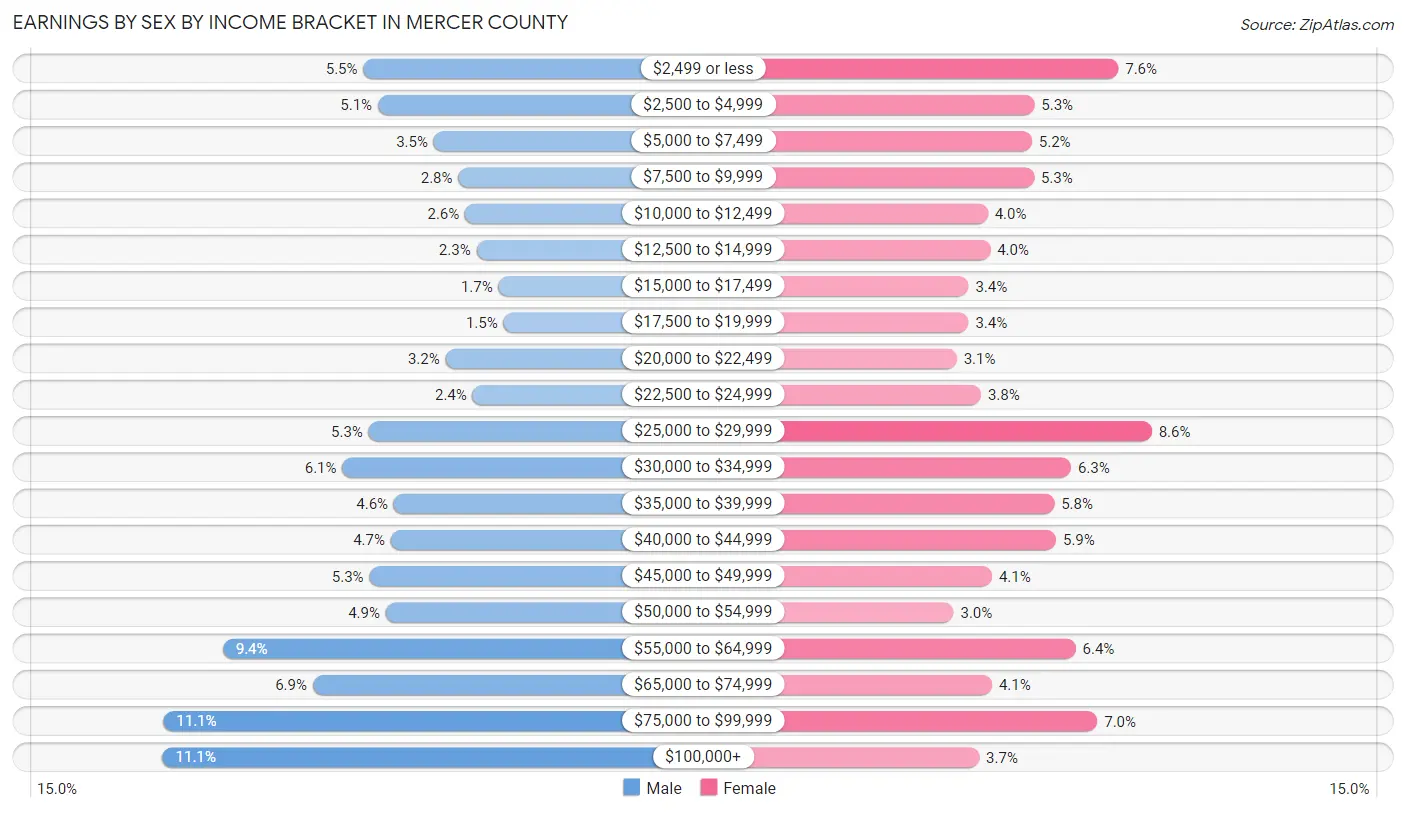
| Income | Male | Female |
| $2,499 or less | 1,574 (5.5%) | 2,003 (7.6%) |
| $2,500 to $4,999 | 1,454 (5.1%) | 1,383 (5.3%) |
| $5,000 to $7,499 | 1,004 (3.5%) | 1,364 (5.2%) |
| $7,500 to $9,999 | 807 (2.8%) | 1,379 (5.3%) |
| $10,000 to $12,499 | 751 (2.6%) | 1,038 (4.0%) |
| $12,500 to $14,999 | 661 (2.3%) | 1,058 (4.0%) |
| $15,000 to $17,499 | 483 (1.7%) | 898 (3.4%) |
| $17,500 to $19,999 | 441 (1.5%) | 897 (3.4%) |
| $20,000 to $22,499 | 909 (3.2%) | 812 (3.1%) |
| $22,500 to $24,999 | 691 (2.4%) | 989 (3.8%) |
| $25,000 to $29,999 | 1,529 (5.3%) | 2,248 (8.6%) |
| $30,000 to $34,999 | 1,743 (6.1%) | 1,654 (6.3%) |
| $35,000 to $39,999 | 1,327 (4.6%) | 1,531 (5.8%) |
| $40,000 to $44,999 | 1,351 (4.7%) | 1,544 (5.9%) |
| $45,000 to $49,999 | 1,523 (5.3%) | 1,071 (4.1%) |
| $50,000 to $54,999 | 1,393 (4.9%) | 788 (3.0%) |
| $55,000 to $64,999 | 2,706 (9.4%) | 1,687 (6.4%) |
| $65,000 to $74,999 | 1,980 (6.9%) | 1,071 (4.1%) |
| $75,000 to $99,999 | 3,185 (11.1%) | 1,848 (7.0%) |
| $100,000+ | 3,191 (11.1%) | 977 (3.7%) |
| Total | 28,703 (100.0%) | 26,240 (100.0%) |
Earnings by Sex by Educational Attainment in Mercer County
Average earnings in Mercer County are $50,805 for men and $33,478 for women, a difference of 34.1%. Men with an educational attainment of graduate degree enjoy the highest average annual earnings of $82,045, while those with less than high school education earn the least with $33,430. Women with an educational attainment of graduate degree earn the most with the average annual earnings of $67,432, while those with less than high school education have the smallest earnings of $13,510.
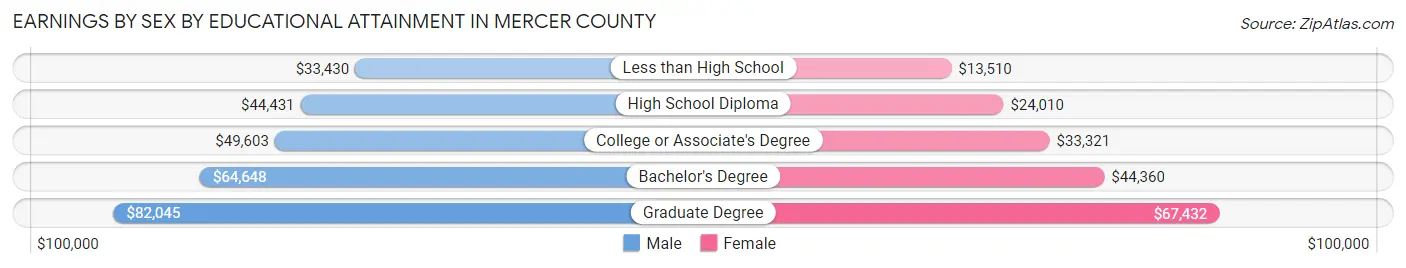
| Educational Attainment | Male Income | Female Income |
| Less than High School | $33,430 | $13,510 |
| High School Diploma | $44,431 | $24,010 |
| College or Associate's Degree | $49,603 | $33,321 |
| Bachelor's Degree | $64,648 | $44,360 |
| Graduate Degree | $82,045 | $67,432 |
| Total | $50,805 | $33,478 |
Family Income in Mercer County
Family Income Brackets in Mercer County
According to the Mercer County family income data, there are 6,097 families falling into the $100,000 to $149,999 income range, which is the most common income bracket and makes up 21.0% of all families. Conversely, the less than $10,000 income bracket is the least frequent group with only 871 families (3.0%) belonging to this category.
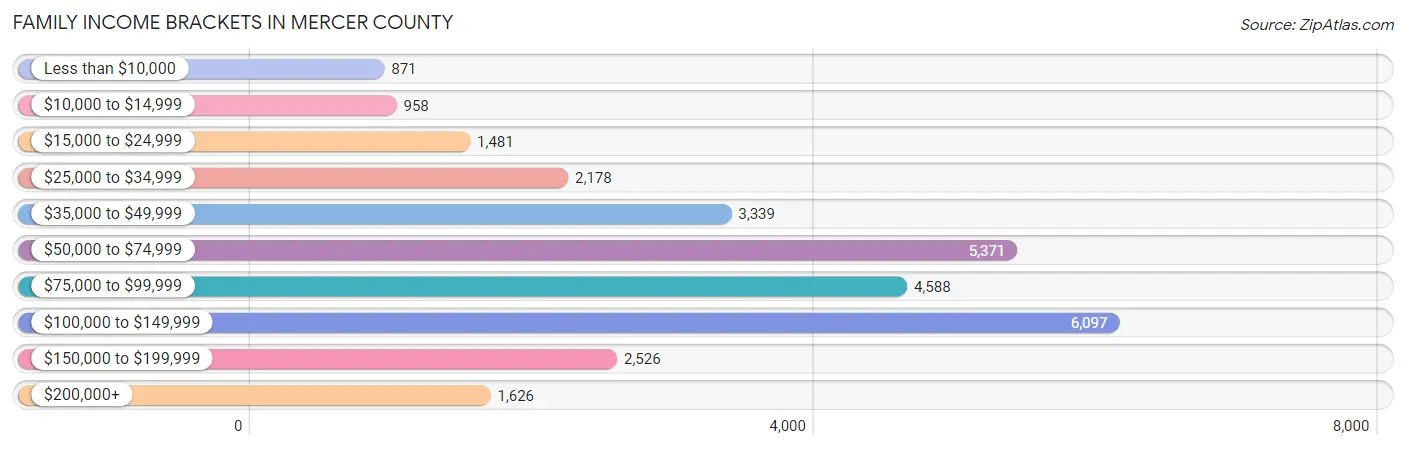
| Income Bracket | # Families | % Families |
| Less than $10,000 | 871 | 3.0% |
| $10,000 to $14,999 | 958 | 3.3% |
| $15,000 to $24,999 | 1,481 | 5.1% |
| $25,000 to $34,999 | 2,178 | 7.5% |
| $35,000 to $49,999 | 3,339 | 11.5% |
| $50,000 to $74,999 | 5,371 | 18.5% |
| $75,000 to $99,999 | 4,588 | 15.8% |
| $100,000 to $149,999 | 6,097 | 21.0% |
| $150,000 to $199,999 | 2,526 | 8.7% |
| $200,000+ | 1,626 | 5.6% |
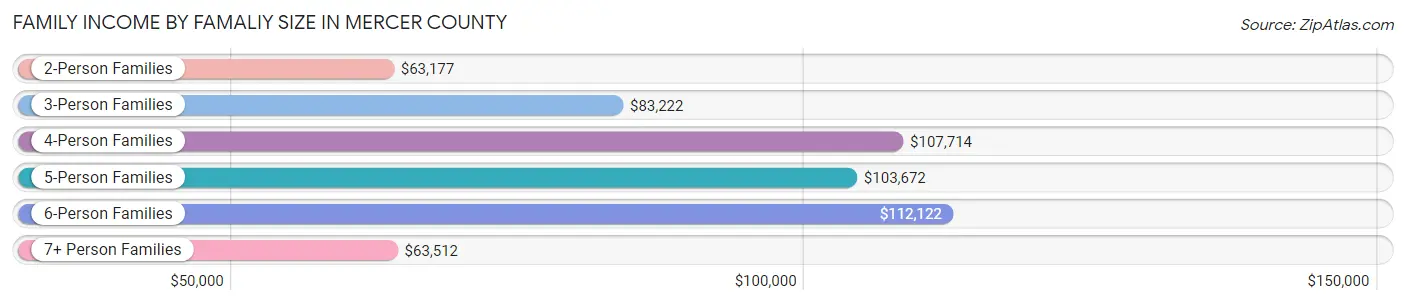
Family Income by Famaliy Size in Mercer County
6-person families (491 | 1.7%) account for the highest median family income in Mercer County with $112,122 per family, while 2-person families (16,100 | 55.4%) have the highest median income of $31,588 per family member.
| Income Bracket | # Families | Median Income |
| 2-Person Families | 16,100 (55.4%) | $63,177 |
| 3-Person Families | 5,498 (18.9%) | $83,222 |
| 4-Person Families | 4,668 (16.1%) | $107,714 |
| 5-Person Families | 1,895 (6.5%) | $103,672 |
| 6-Person Families | 491 (1.7%) | $112,122 |
| 7+ Person Families | 383 (1.3%) | $63,512 |
| Total | 29,035 (100.0%) | $76,303 |
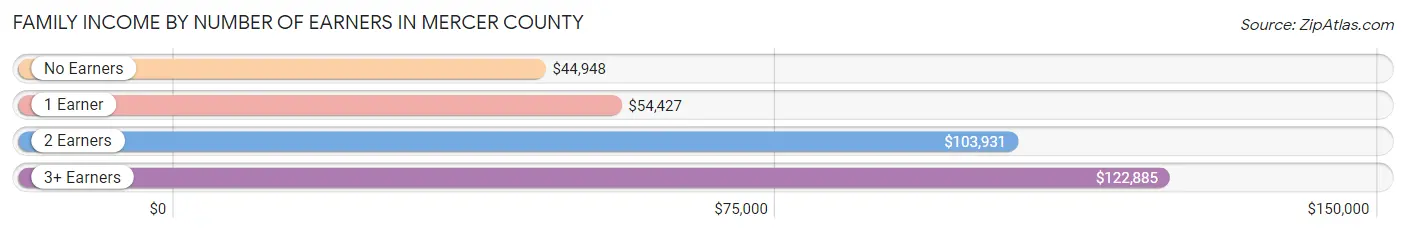
Family Income by Number of Earners in Mercer County
The median family income in Mercer County is $76,303, with families comprising 3+ earners (3,266) having the highest median family income of $122,885, while families with no earners (5,957) have the lowest median family income of $44,948, accounting for 11.3% and 20.5% of families, respectively.
| Number of Earners | # Families | Median Income |
| No Earners | 5,957 (20.5%) | $44,948 |
| 1 Earner | 9,369 (32.3%) | $54,427 |
| 2 Earners | 10,443 (36.0%) | $103,931 |
| 3+ Earners | 3,266 (11.3%) | $122,885 |
| Total | 29,035 (100.0%) | $76,303 |
Household Income in Mercer County
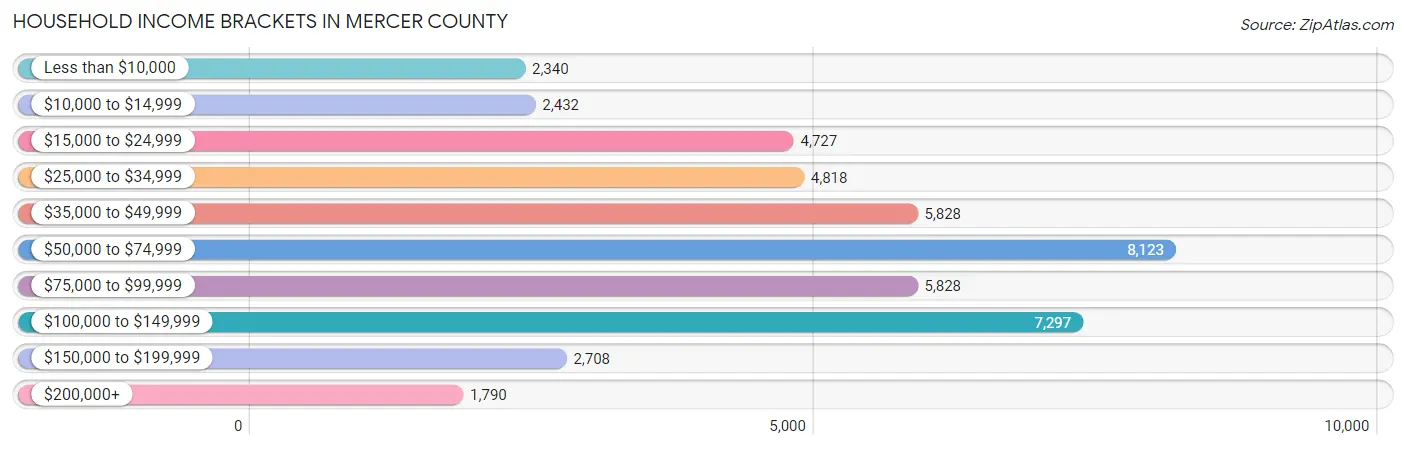
Household Income Brackets in Mercer County
With 8,123 households falling in the category, the $50,000 to $74,999 income range is the most frequent in Mercer County, accounting for 17.7% of all households. In contrast, only 1,790 households (3.9%) fall into the $200,000+ income bracket, making it the least populous group.
| Income Bracket | # Households | % Households |
| Less than $10,000 | 2,340 | 5.1% |
| $10,000 to $14,999 | 2,432 | 5.3% |
| $15,000 to $24,999 | 4,727 | 10.3% |
| $25,000 to $34,999 | 4,818 | 10.5% |
| $35,000 to $49,999 | 5,828 | 12.7% |
| $50,000 to $74,999 | 8,123 | 17.7% |
| $75,000 to $99,999 | 5,828 | 12.7% |
| $100,000 to $149,999 | 7,297 | 15.9% |
| $150,000 to $199,999 | 2,708 | 5.9% |
| $200,000+ | 1,790 | 3.9% |
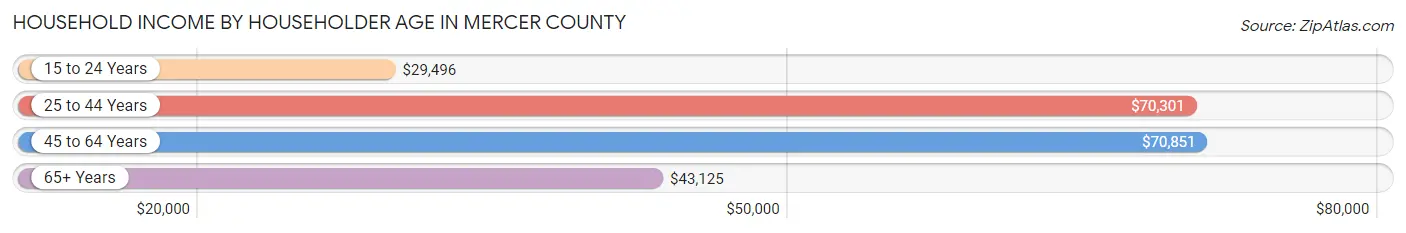
Household Income by Householder Age in Mercer County
The median household income in Mercer County is $57,353, with the highest median household income of $70,851 found in the 45 to 64 years age bracket for the primary householder. A total of 17,306 households (37.7%) fall into this category. Meanwhile, the 15 to 24 years age bracket for the primary householder has the lowest median household income of $29,496, with 1,270 households (2.8%) in this group.
| Income Bracket | # Households | Median Income |
| 15 to 24 Years | 1,270 (2.8%) | $29,496 |
| 25 to 44 Years | 11,643 (25.4%) | $70,301 |
| 45 to 64 Years | 17,306 (37.7%) | $70,851 |
| 65+ Years | 15,671 (34.2%) | $43,125 |
| Total | 45,890 (100.0%) | $57,353 |
Poverty in Mercer County
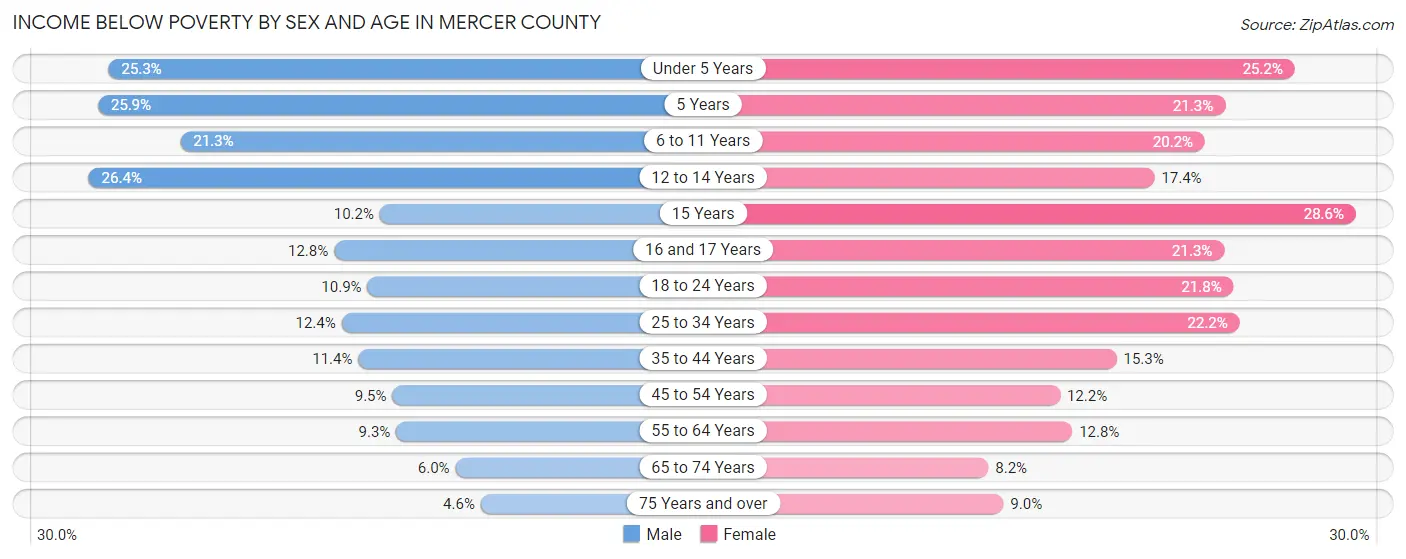
Income Below Poverty by Sex and Age in Mercer County
With 11.8% poverty level for males and 15.2% for females among the residents of Mercer County, 12 to 14 year old males and 15 year old females are the most vulnerable to poverty, with 482 males (26.4%) and 168 females (28.6%) in their respective age groups living below the poverty level.
| Age Bracket | Male | Female |
| Under 5 Years | 660 (25.3%) | 634 (25.2%) |
| 5 Years | 148 (25.9%) | 102 (21.3%) |
| 6 to 11 Years | 714 (21.3%) | 655 (20.2%) |
| 12 to 14 Years | 482 (26.4%) | 288 (17.4%) |
| 15 Years | 66 (10.2%) | 168 (28.6%) |
| 16 and 17 Years | 179 (12.8%) | 278 (21.3%) |
| 18 to 24 Years | 421 (10.9%) | 770 (21.8%) |
| 25 to 34 Years | 696 (12.3%) | 1,264 (22.2%) |
| 35 to 44 Years | 650 (11.4%) | 854 (15.3%) |
| 45 to 54 Years | 629 (9.5%) | 839 (12.1%) |
| 55 to 64 Years | 746 (9.3%) | 1,070 (12.8%) |
| 65 to 74 Years | 387 (6.0%) | 577 (8.2%) |
| 75 Years and over | 187 (4.6%) | 549 (9.0%) |
| Total | 5,965 (11.8%) | 8,048 (15.2%) |
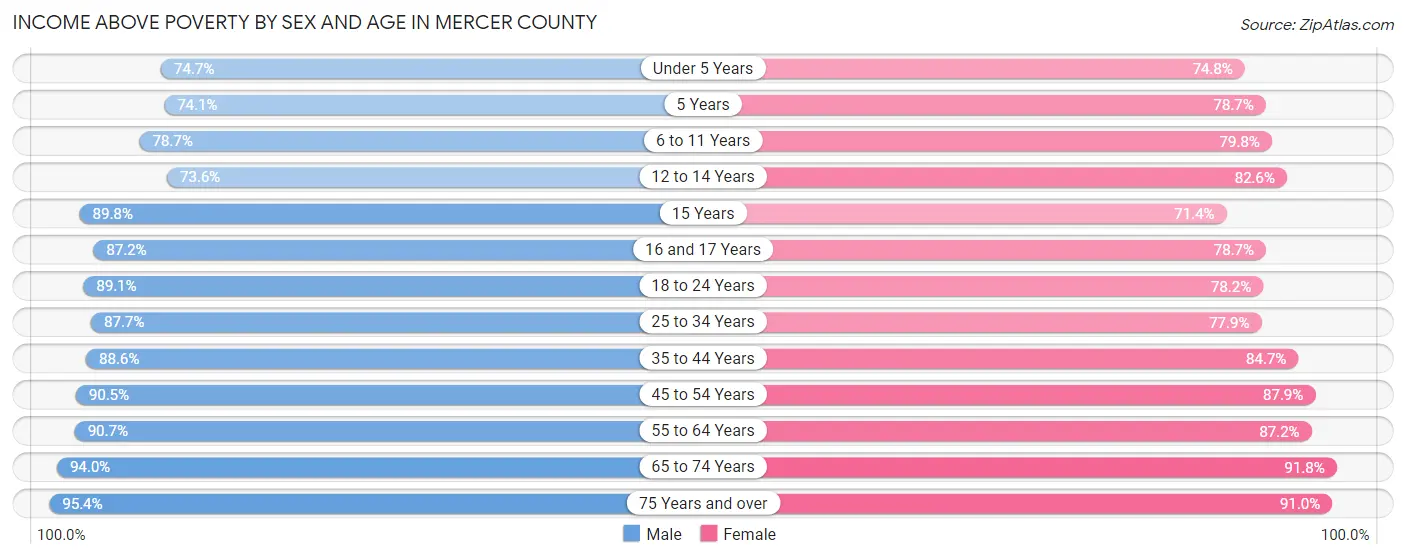
Income Above Poverty by Sex and Age in Mercer County
According to the poverty statistics in Mercer County, males aged 75 years and over and females aged 65 to 74 years are the age groups that are most secure financially, with 95.4% of males and 91.8% of females in these age groups living above the poverty line.
| Age Bracket | Male | Female |
| Under 5 Years | 1,946 (74.7%) | 1,880 (74.8%) |
| 5 Years | 423 (74.1%) | 376 (78.7%) |
| 6 to 11 Years | 2,633 (78.7%) | 2,585 (79.8%) |
| 12 to 14 Years | 1,342 (73.6%) | 1,366 (82.6%) |
| 15 Years | 580 (89.8%) | 419 (71.4%) |
| 16 and 17 Years | 1,223 (87.2%) | 1,028 (78.7%) |
| 18 to 24 Years | 3,437 (89.1%) | 2,761 (78.2%) |
| 25 to 34 Years | 4,941 (87.6%) | 4,443 (77.8%) |
| 35 to 44 Years | 5,043 (88.6%) | 4,729 (84.7%) |
| 45 to 54 Years | 5,980 (90.5%) | 6,067 (87.8%) |
| 55 to 64 Years | 7,270 (90.7%) | 7,273 (87.2%) |
| 65 to 74 Years | 6,049 (94.0%) | 6,497 (91.8%) |
| 75 Years and over | 3,875 (95.4%) | 5,549 (91.0%) |
| Total | 44,742 (88.2%) | 44,973 (84.8%) |
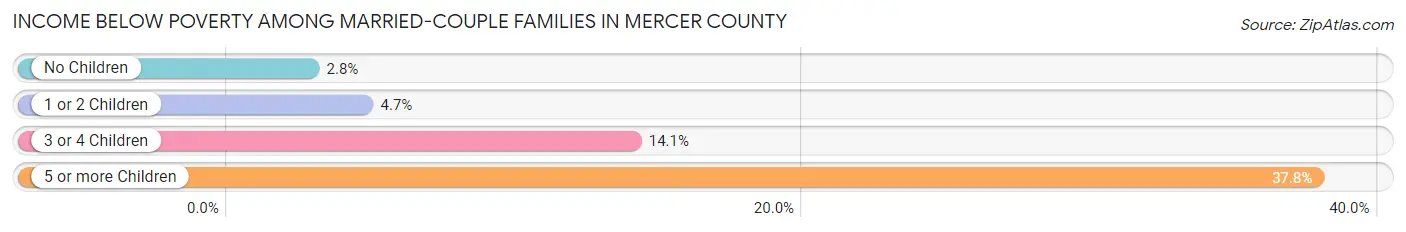
Income Below Poverty Among Married-Couple Families in Mercer County
The poverty statistics for married-couple families in Mercer County show that 4.4% or 968 of the total 21,759 families live below the poverty line. Families with 5 or more children have the highest poverty rate of 37.8%, comprising of 90 families. On the other hand, families with no children have the lowest poverty rate of 2.8%, which includes 414 families.
| Children | Above Poverty | Below Poverty |
| No Children | 14,174 (97.2%) | 414 (2.8%) |
| 1 or 2 Children | 5,210 (95.3%) | 258 (4.7%) |
| 3 or 4 Children | 1,259 (85.9%) | 206 (14.1%) |
| 5 or more Children | 148 (62.2%) | 90 (37.8%) |
| Total | 20,791 (95.6%) | 968 (4.4%) |
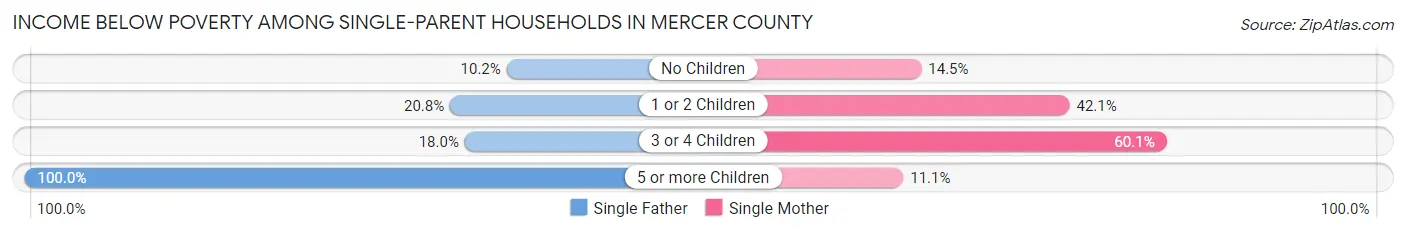
Income Below Poverty Among Single-Parent Households in Mercer County
According to the poverty data in Mercer County, 17.0% or 344 single-father households and 32.1% or 1,684 single-mother households are living below the poverty line. Among single-father households, those with 5 or more children have the highest poverty rate, with 18 households (100.0%) experiencing poverty. Likewise, among single-mother households, those with 3 or 4 children have the highest poverty rate, with 297 households (60.1%) falling below the poverty line.
| Children | Single Father | Single Mother |
| No Children | 85 (10.2%) | 319 (14.5%) |
| 1 or 2 Children | 221 (20.7%) | 1,066 (42.1%) |
| 3 or 4 Children | 20 (18.0%) | 297 (60.1%) |
| 5 or more Children | 18 (100.0%) | 2 (11.1%) |
| Total | 344 (17.0%) | 1,684 (32.1%) |
Income Below Poverty Among Married-Couple vs Single-Parent Households in Mercer County
The poverty data for Mercer County shows that 968 of the married-couple family households (4.4%) and 2,028 of the single-parent households (27.9%) are living below the poverty level. Within the married-couple family households, those with 5 or more children have the highest poverty rate, with 90 households (37.8%) falling below the poverty line. Among the single-parent households, those with 5 or more children have the highest poverty rate, with 20 household (55.6%) living below poverty.
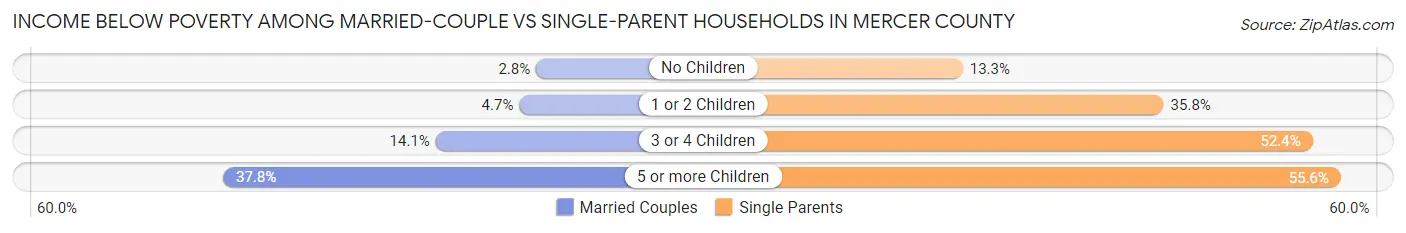
| Children | Married-Couple Families | Single-Parent Households |
| No Children | 414 (2.8%) | 404 (13.3%) |
| 1 or 2 Children | 258 (4.7%) | 1,287 (35.8%) |
| 3 or 4 Children | 206 (14.1%) | 317 (52.4%) |
| 5 or more Children | 90 (37.8%) | 20 (55.6%) |
| Total | 968 (4.4%) | 2,028 (27.9%) |
Employment Characteristics in Mercer County
Employment by Class of Employer in Mercer County
Among the 47,137 employed individuals in Mercer County, private company employees (32,659 | 69.3%), not-for-profit organizations (5,055 | 10.7%), and local government employees (2,810 | 6.0%) make up the most common classes of employment.
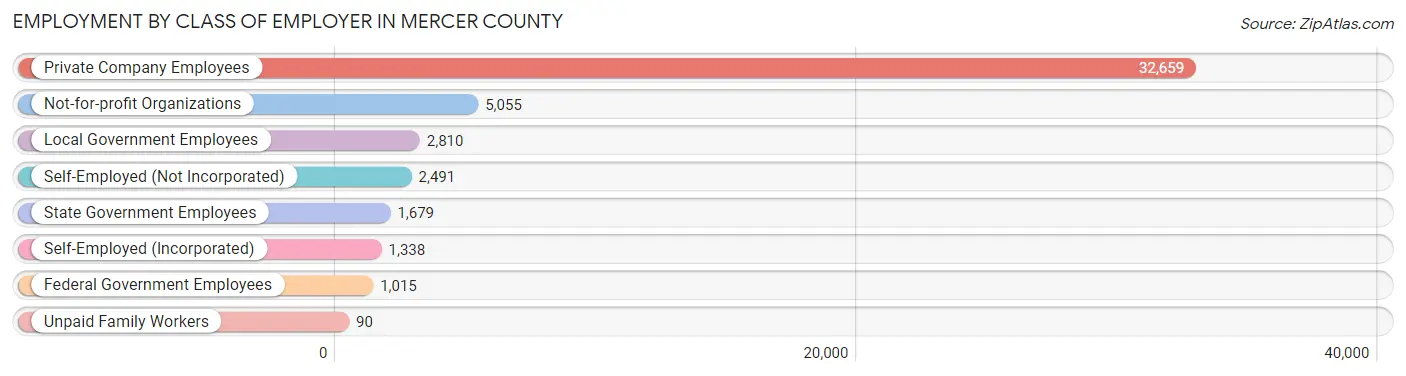
| Employer Class | # Employees | % Employees |
| Private Company Employees | 32,659 | 69.3% |
| Self-Employed (Incorporated) | 1,338 | 2.8% |
| Self-Employed (Not Incorporated) | 2,491 | 5.3% |
| Not-for-profit Organizations | 5,055 | 10.7% |
| Local Government Employees | 2,810 | 6.0% |
| State Government Employees | 1,679 | 3.6% |
| Federal Government Employees | 1,015 | 2.1% |
| Unpaid Family Workers | 90 | 0.2% |
| Total | 47,137 | 100.0% |
Employment Status by Age in Mercer County
According to the labor force statistics for Mercer County, out of the total population over 16 years of age (92,473), 55.0% or 50,860 individuals are in the labor force, with 5.5% or 2,797 of them unemployed. The age group with the highest labor force participation rate is 30 to 34 years, with 82.2% or 4,840 individuals in the labor force. Within the labor force, the 16 to 19 years age range has the highest percentage of unemployed individuals, with 15.6% or 389 of them being unemployed.
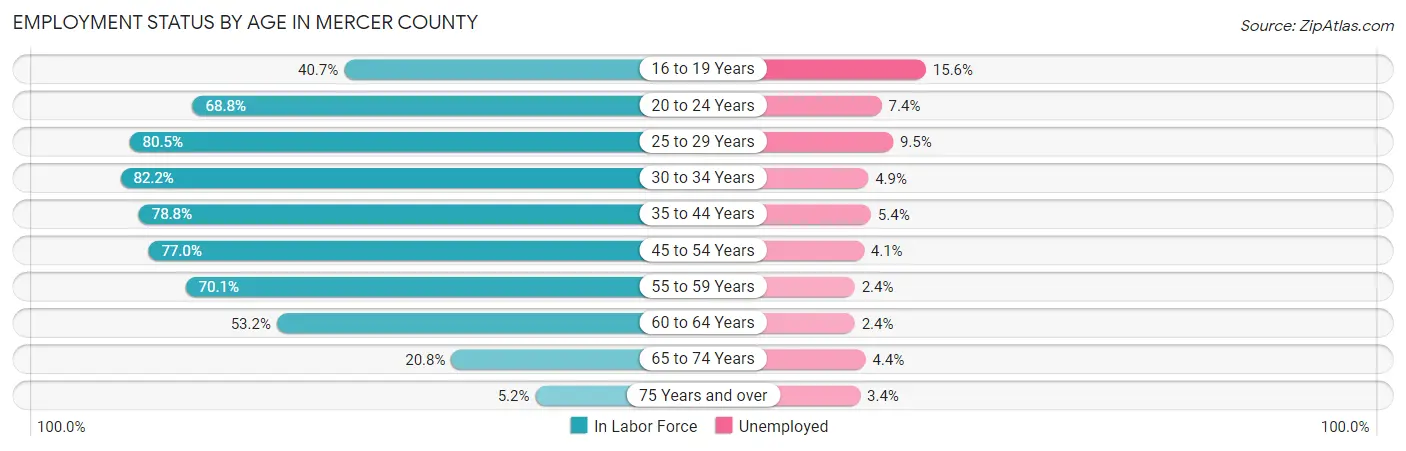
| Age Bracket | In Labor Force | Unemployed |
| 16 to 19 Years | 2,495 (40.7%) | 389 (15.6%) |
| 20 to 24 Years | 5,102 (68.8%) | 378 (7.4%) |
| 25 to 29 Years | 4,737 (80.5%) | 450 (9.5%) |
| 30 to 34 Years | 4,840 (82.2%) | 237 (4.9%) |
| 35 to 44 Years | 9,332 (78.8%) | 504 (5.4%) |
| 45 to 54 Years | 10,654 (77.0%) | 437 (4.1%) |
| 55 to 59 Years | 5,646 (70.1%) | 136 (2.4%) |
| 60 to 64 Years | 4,600 (53.2%) | 110 (2.4%) |
| 65 to 74 Years | 2,870 (20.8%) | 126 (4.4%) |
| 75 Years and over | 571 (5.2%) | 19 (3.4%) |
| Total | 50,860 (55.0%) | 2,797 (5.5%) |
Employment Status by Educational Attainment in Mercer County
According to labor force statistics for Mercer County, 73.5% of individuals (39,802) out of the total population between 25 and 64 years of age (54,152) are in the labor force, with 4.7% or 1,871 of them being unemployed. The group with the highest labor force participation rate are those with the educational attainment of bachelor's degree or higher, with 88.7% or 12,946 individuals in the labor force. Within the labor force, individuals with less than high school education have the highest percentage of unemployment, with 12.6% or 247 of them being unemployed.
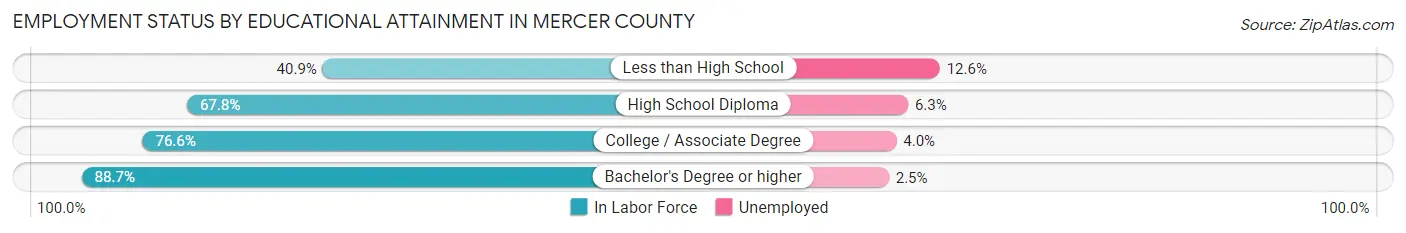
| Educational Attainment | In Labor Force | Unemployed |
| Less than High School | 1,958 (40.9%) | 603 (12.6%) |
| High School Diploma | 13,435 (67.8%) | 1,248 (6.3%) |
| College / Associate Degree | 11,455 (76.6%) | 598 (4.0%) |
| Bachelor's Degree or higher | 12,946 (88.7%) | 365 (2.5%) |
| Total | 39,802 (73.5%) | 2,545 (4.7%) |
Employment Occupations by Sex in Mercer County
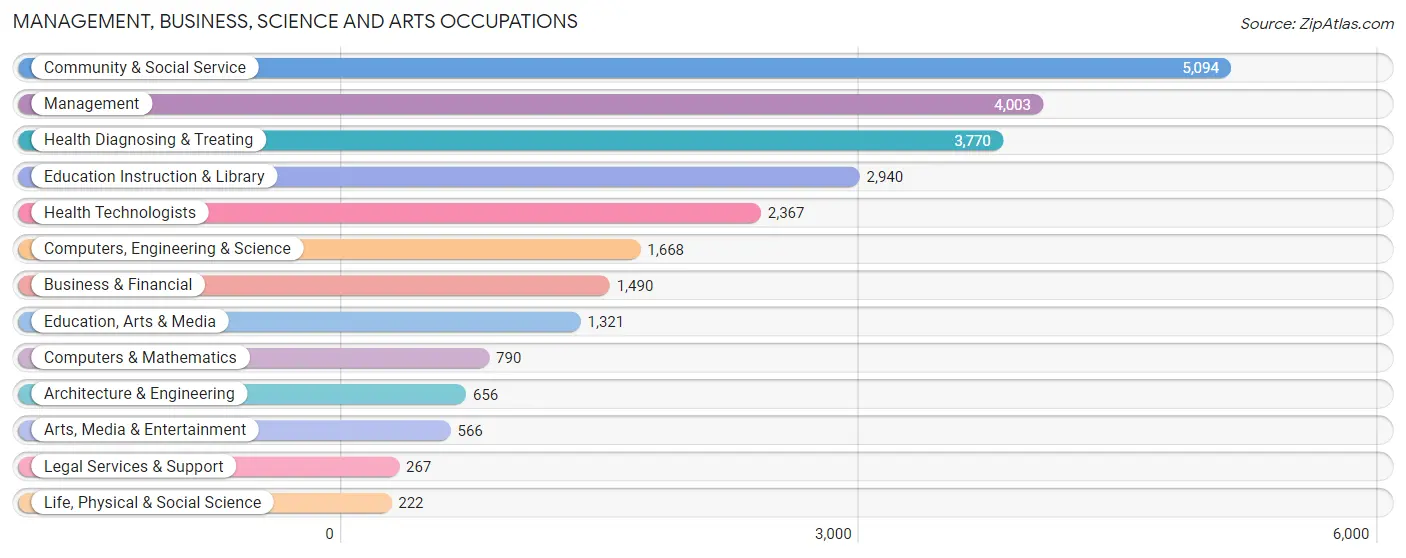
Management, Business, Science and Arts Occupations
The most common Management, Business, Science and Arts occupations in Mercer County are Community & Social Service (5,094 | 10.6%), Management (4,003 | 8.4%), Health Diagnosing & Treating (3,770 | 7.9%), Education Instruction & Library (2,940 | 6.1%), and Health Technologists (2,367 | 5.0%).
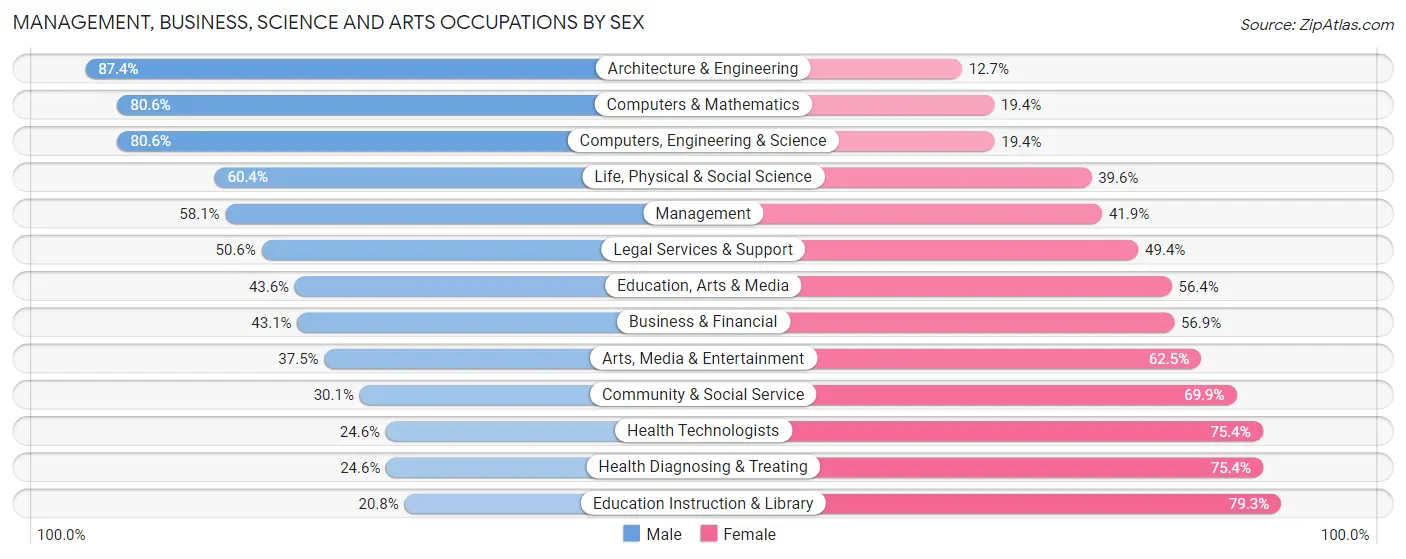
Management, Business, Science and Arts Occupations by Sex
Within the Management, Business, Science and Arts occupations in Mercer County, the most male-oriented occupations are Architecture & Engineering (87.4%), Computers & Mathematics (80.6%), and Computers, Engineering & Science (80.6%), while the most female-oriented occupations are Education Instruction & Library (79.2%), Health Diagnosing & Treating (75.4%), and Health Technologists (75.4%).
| Occupation | Male | Female |
| Management | 2,326 (58.1%) | 1,677 (41.9%) |
| Business & Financial | 642 (43.1%) | 848 (56.9%) |
| Computers, Engineering & Science | 1,344 (80.6%) | 324 (19.4%) |
| Computers & Mathematics | 637 (80.6%) | 153 (19.4%) |
| Architecture & Engineering | 573 (87.4%) | 83 (12.7%) |
| Life, Physical & Social Science | 134 (60.4%) | 88 (39.6%) |
| Community & Social Service | 1,533 (30.1%) | 3,561 (69.9%) |
| Education, Arts & Media | 576 (43.6%) | 745 (56.4%) |
| Legal Services & Support | 135 (50.6%) | 132 (49.4%) |
| Education Instruction & Library | 610 (20.7%) | 2,330 (79.2%) |
| Arts, Media & Entertainment | 212 (37.5%) | 354 (62.5%) |
| Health Diagnosing & Treating | 926 (24.6%) | 2,844 (75.4%) |
| Health Technologists | 583 (24.6%) | 1,784 (75.4%) |
| Total (Category) | 6,771 (42.2%) | 9,254 (57.8%) |
| Total (Overall) | 24,621 (51.4%) | 23,229 (48.5%) |
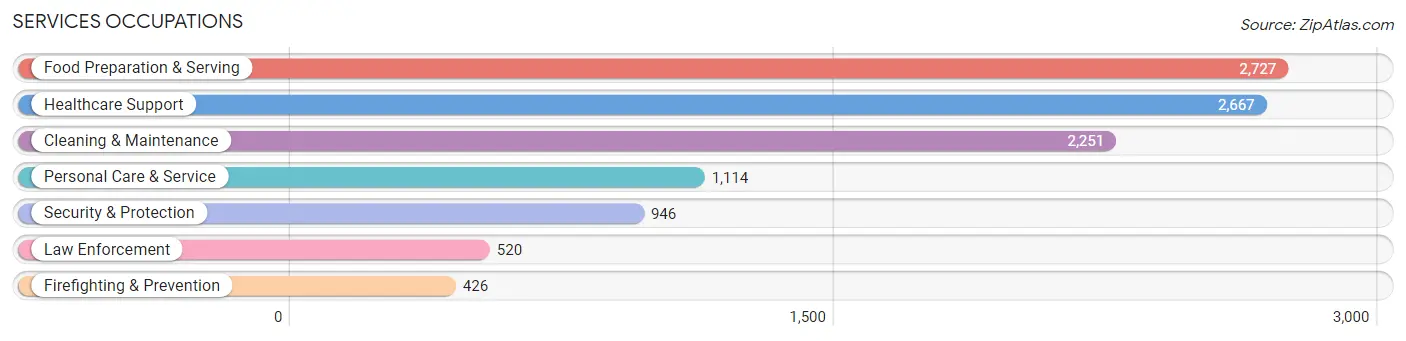
Services Occupations
The most common Services occupations in Mercer County are Food Preparation & Serving (2,727 | 5.7%), Healthcare Support (2,667 | 5.6%), Cleaning & Maintenance (2,251 | 4.7%), Personal Care & Service (1,114 | 2.3%), and Security & Protection (946 | 2.0%).
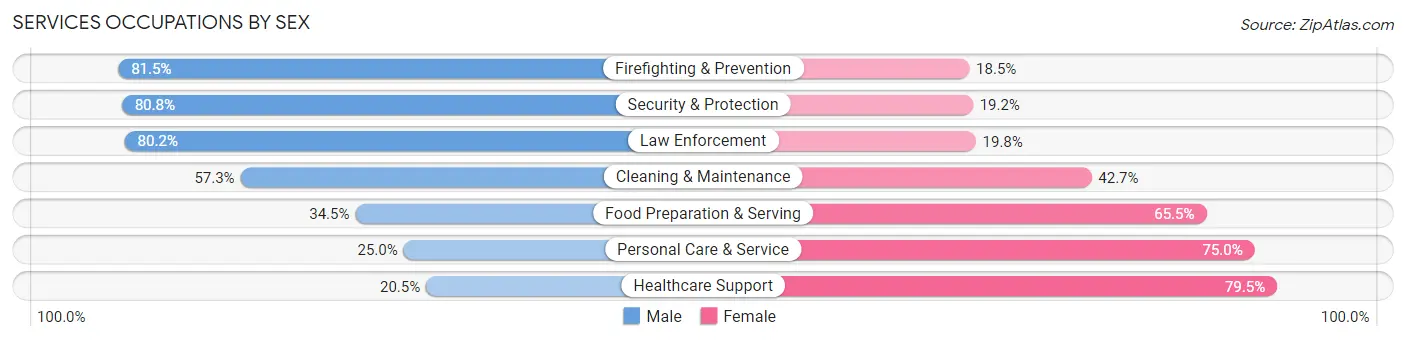
Services Occupations by Sex
Within the Services occupations in Mercer County, the most male-oriented occupations are Firefighting & Prevention (81.5%), Security & Protection (80.8%), and Law Enforcement (80.2%), while the most female-oriented occupations are Healthcare Support (79.5%), Personal Care & Service (75.0%), and Food Preparation & Serving (65.5%).
| Occupation | Male | Female |
| Healthcare Support | 547 (20.5%) | 2,120 (79.5%) |
| Security & Protection | 764 (80.8%) | 182 (19.2%) |
| Firefighting & Prevention | 347 (81.5%) | 79 (18.5%) |
| Law Enforcement | 417 (80.2%) | 103 (19.8%) |
| Food Preparation & Serving | 941 (34.5%) | 1,786 (65.5%) |
| Cleaning & Maintenance | 1,289 (57.3%) | 962 (42.7%) |
| Personal Care & Service | 278 (25.0%) | 836 (75.0%) |
| Total (Category) | 3,819 (39.4%) | 5,886 (60.7%) |
| Total (Overall) | 24,621 (51.4%) | 23,229 (48.5%) |
Sales and Office Occupations
The most common Sales and Office occupations in Mercer County are Office & Administration (5,470 | 11.4%), and Sales & Related (4,543 | 9.5%).

Sales and Office Occupations by Sex
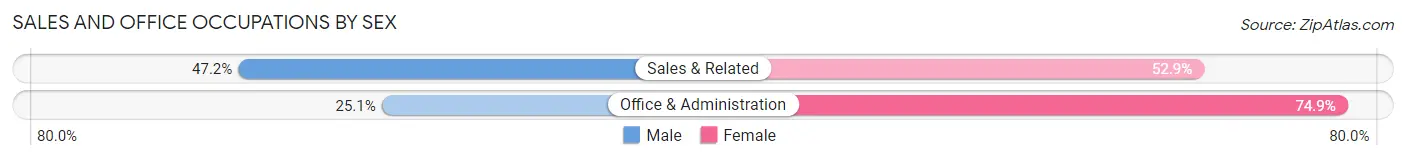
| Occupation | Male | Female |
| Sales & Related | 2,142 (47.1%) | 2,401 (52.8%) |
| Office & Administration | 1,372 (25.1%) | 4,098 (74.9%) |
| Total (Category) | 3,514 (35.1%) | 6,499 (64.9%) |
| Total (Overall) | 24,621 (51.4%) | 23,229 (48.5%) |
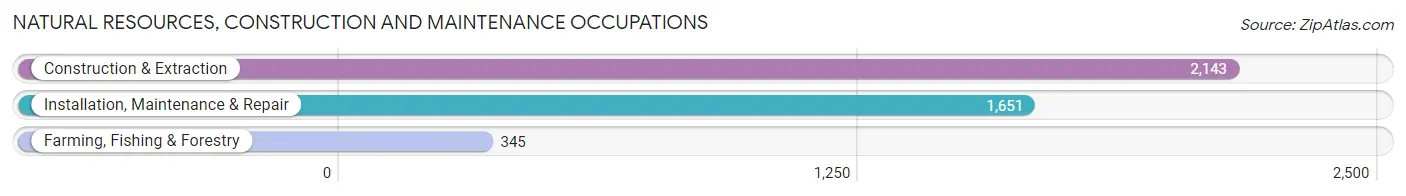
Natural Resources, Construction and Maintenance Occupations
The most common Natural Resources, Construction and Maintenance occupations in Mercer County are Construction & Extraction (2,143 | 4.5%), Installation, Maintenance & Repair (1,651 | 3.5%), and Farming, Fishing & Forestry (345 | 0.7%).
Natural Resources, Construction and Maintenance Occupations by Sex
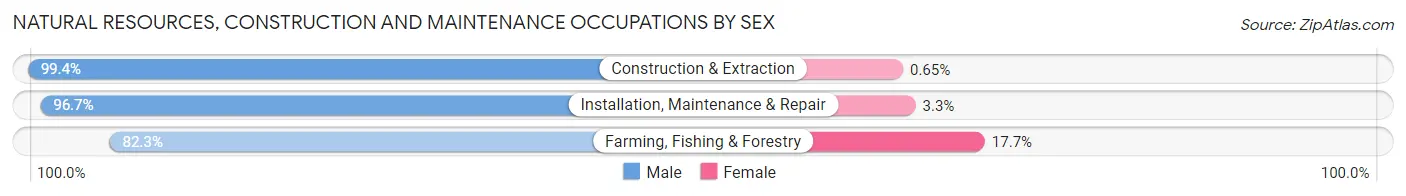
| Occupation | Male | Female |
| Farming, Fishing & Forestry | 284 (82.3%) | 61 (17.7%) |
| Construction & Extraction | 2,129 (99.4%) | 14 (0.6%) |
| Installation, Maintenance & Repair | 1,597 (96.7%) | 54 (3.3%) |
| Total (Category) | 4,010 (96.9%) | 129 (3.1%) |
| Total (Overall) | 24,621 (51.4%) | 23,229 (48.5%) |
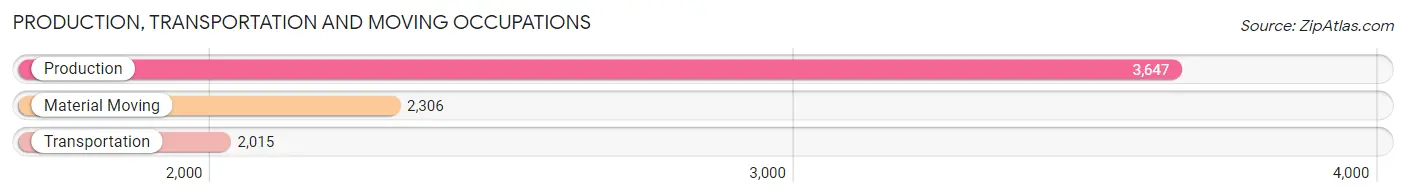
Production, Transportation and Moving Occupations
The most common Production, Transportation and Moving occupations in Mercer County are Production (3,647 | 7.6%), Material Moving (2,306 | 4.8%), and Transportation (2,015 | 4.2%).
Production, Transportation and Moving Occupations by Sex
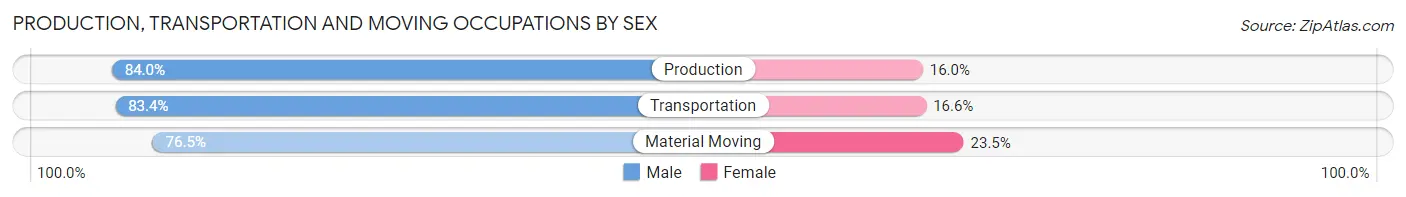
| Occupation | Male | Female |
| Production | 3,063 (84.0%) | 584 (16.0%) |
| Transportation | 1,680 (83.4%) | 335 (16.6%) |
| Material Moving | 1,764 (76.5%) | 542 (23.5%) |
| Total (Category) | 6,507 (81.7%) | 1,461 (18.3%) |
| Total (Overall) | 24,621 (51.4%) | 23,229 (48.5%) |
Employment Industries by Sex in Mercer County
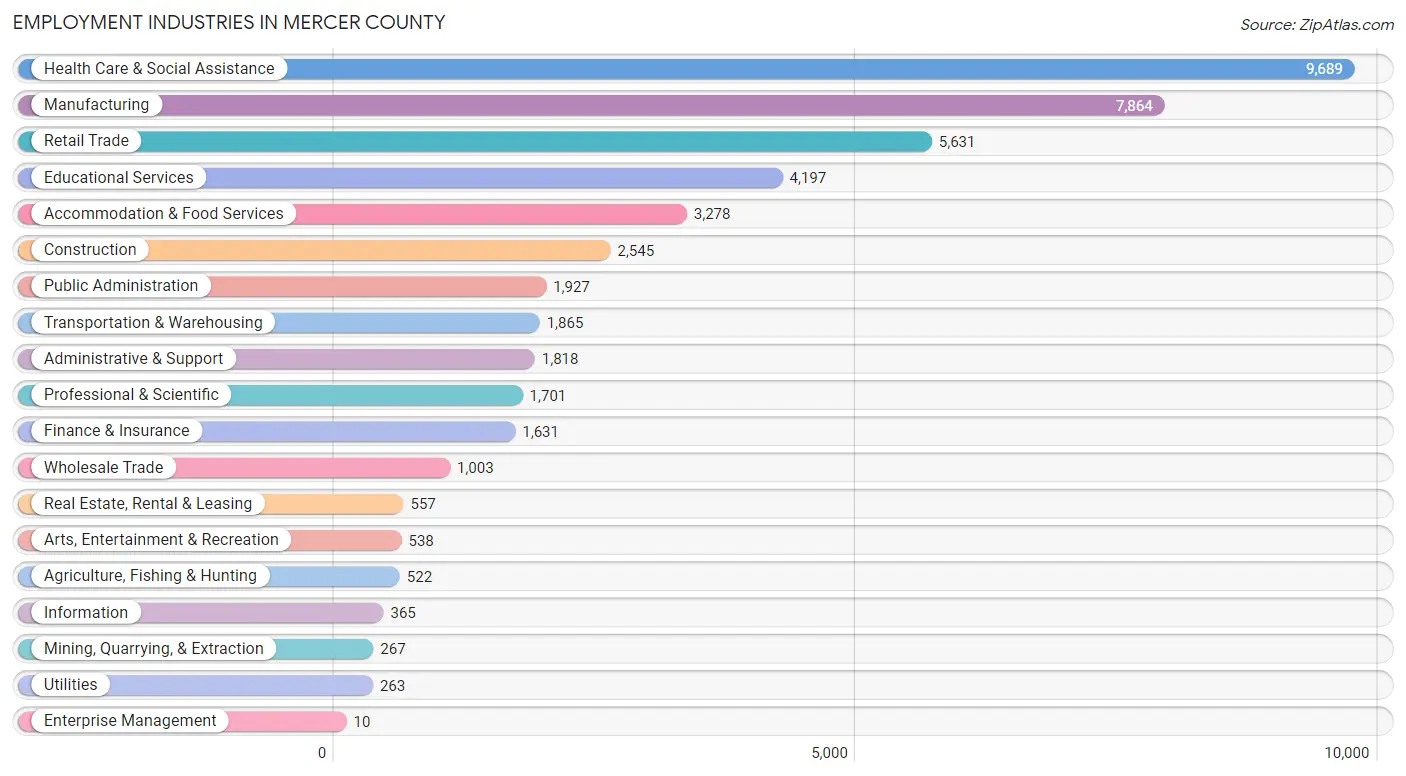
Employment Industries in Mercer County
The major employment industries in Mercer County include Health Care & Social Assistance (9,689 | 20.3%), Manufacturing (7,864 | 16.4%), Retail Trade (5,631 | 11.8%), Educational Services (4,197 | 8.8%), and Accommodation & Food Services (3,278 | 6.9%).
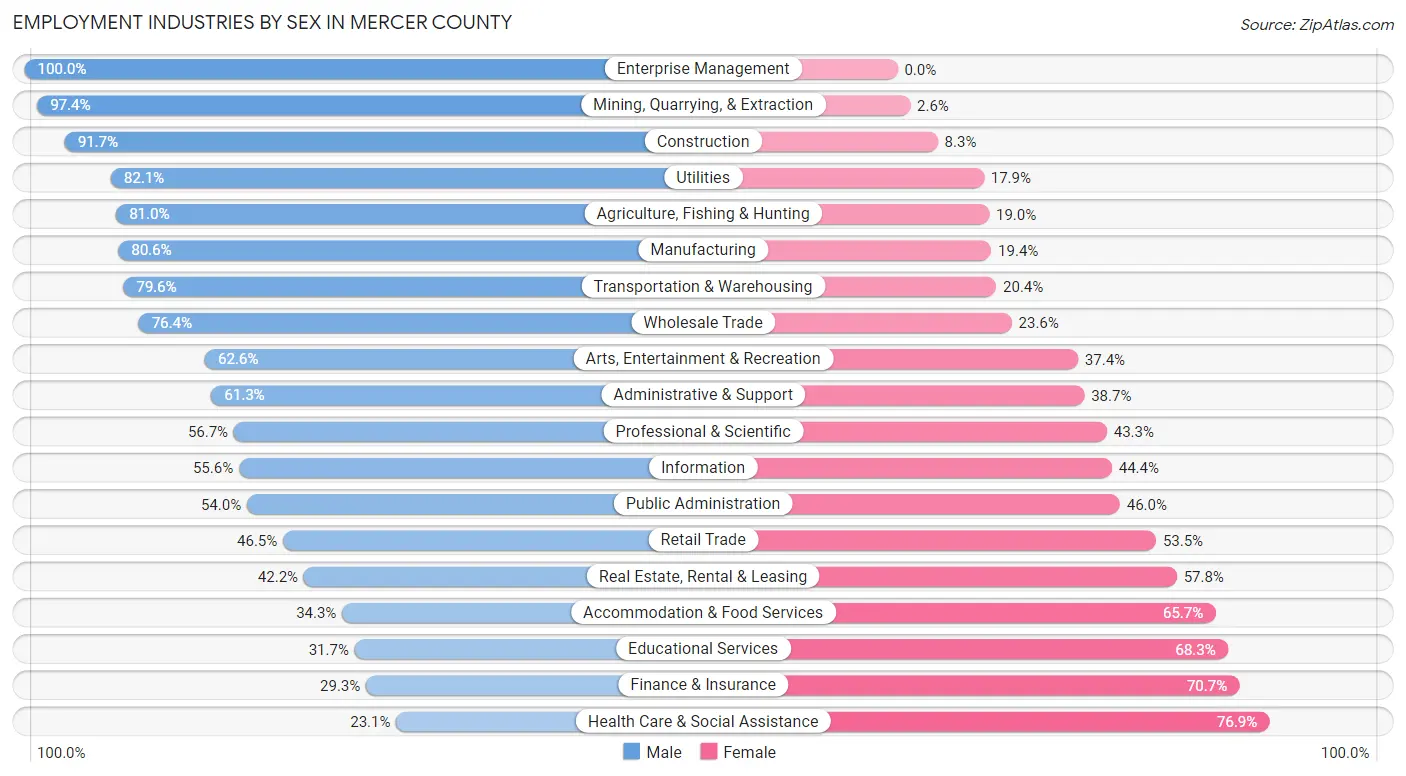
Employment Industries by Sex in Mercer County
The Mercer County industries that see more men than women are Enterprise Management (100.0%), Mining, Quarrying, & Extraction (97.4%), and Construction (91.7%), whereas the industries that tend to have a higher number of women are Health Care & Social Assistance (76.9%), Finance & Insurance (70.7%), and Educational Services (68.3%).
| Industry | Male | Female |
| Agriculture, Fishing & Hunting | 423 (81.0%) | 99 (19.0%) |
| Mining, Quarrying, & Extraction | 260 (97.4%) | 7 (2.6%) |
| Construction | 2,333 (91.7%) | 212 (8.3%) |
| Manufacturing | 6,338 (80.6%) | 1,526 (19.4%) |
| Wholesale Trade | 766 (76.4%) | 237 (23.6%) |
| Retail Trade | 2,618 (46.5%) | 3,013 (53.5%) |
| Transportation & Warehousing | 1,484 (79.6%) | 381 (20.4%) |
| Utilities | 216 (82.1%) | 47 (17.9%) |
| Information | 203 (55.6%) | 162 (44.4%) |
| Finance & Insurance | 478 (29.3%) | 1,153 (70.7%) |
| Real Estate, Rental & Leasing | 235 (42.2%) | 322 (57.8%) |
| Professional & Scientific | 964 (56.7%) | 737 (43.3%) |
| Enterprise Management | 10 (100.0%) | 0 (0.0%) |
| Administrative & Support | 1,115 (61.3%) | 703 (38.7%) |
| Educational Services | 1,329 (31.7%) | 2,868 (68.3%) |
| Health Care & Social Assistance | 2,235 (23.1%) | 7,454 (76.9%) |
| Arts, Entertainment & Recreation | 337 (62.6%) | 201 (37.4%) |
| Accommodation & Food Services | 1,123 (34.3%) | 2,155 (65.7%) |
| Public Administration | 1,040 (54.0%) | 887 (46.0%) |
| Total | 24,621 (51.4%) | 23,229 (48.5%) |
Education in Mercer County
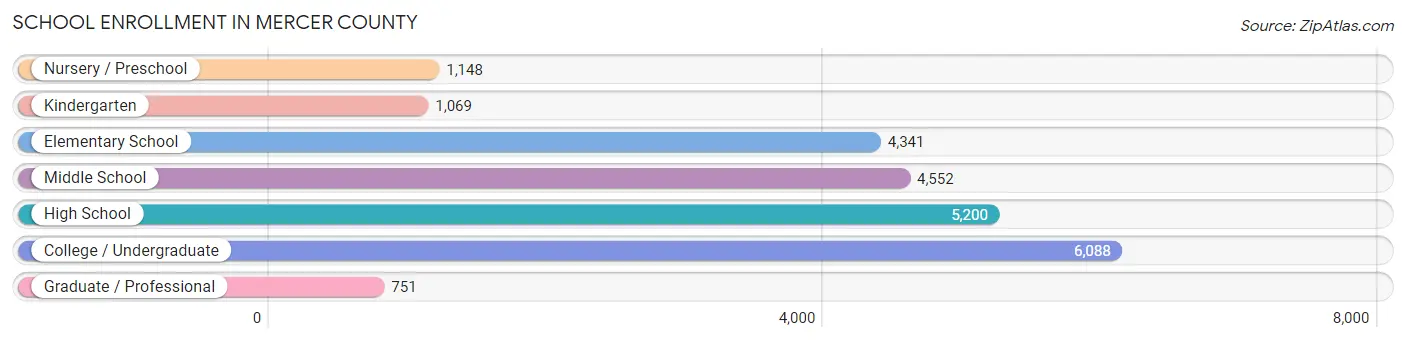
School Enrollment in Mercer County
The most common levels of schooling among the 23,149 students in Mercer County are college / undergraduate (6,088 | 26.3%), high school (5,200 | 22.5%), and middle school (4,552 | 19.7%).
| School Level | # Students | % Students |
| Nursery / Preschool | 1,148 | 5.0% |
| Kindergarten | 1,069 | 4.6% |
| Elementary School | 4,341 | 18.8% |
| Middle School | 4,552 | 19.7% |
| High School | 5,200 | 22.5% |
| College / Undergraduate | 6,088 | 26.3% |
| Graduate / Professional | 751 | 3.2% |
| Total | 23,149 | 100.0% |
School Enrollment by Age by Funding Source in Mercer County
Out of a total of 23,149 students who are enrolled in schools in Mercer County, 6,181 (26.7%) attend a private institution, while the remaining 16,968 (73.3%) are enrolled in public schools. The age group of 20 to 24 year olds has the highest likelihood of being enrolled in private schools, with 2,184 (64.0% in the age bracket) enrolled. Conversely, the age group of 15 to 17 year olds has the lowest likelihood of being enrolled in a private school, with 3,453 (88.4% in the age bracket) attending a public institution.
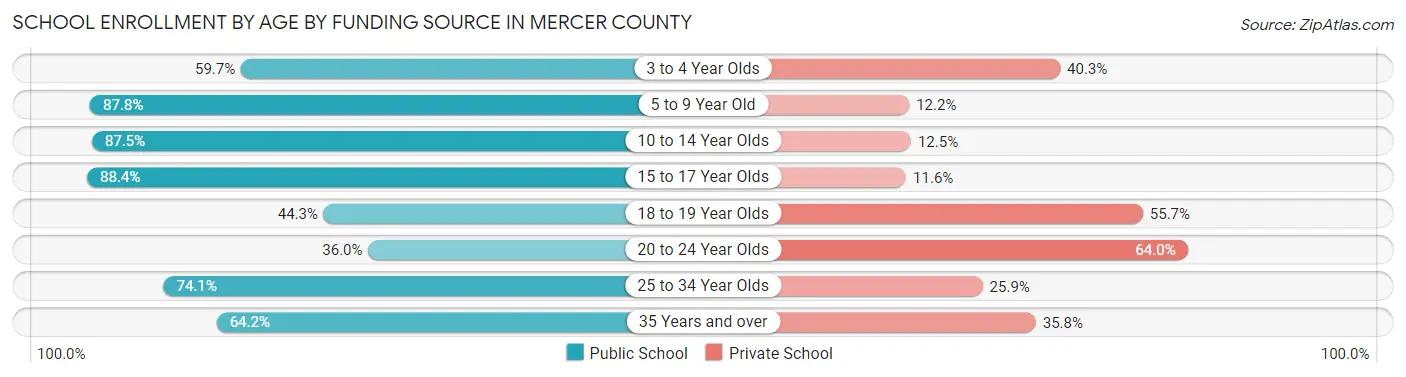
| Age Bracket | Public School | Private School |
| 3 to 4 Year Olds | 425 (59.7%) | 287 (40.3%) |
| 5 to 9 Year Old | 4,557 (87.8%) | 634 (12.2%) |
| 10 to 14 Year Olds | 5,058 (87.5%) | 725 (12.5%) |
| 15 to 17 Year Olds | 3,453 (88.4%) | 455 (11.6%) |
| 18 to 19 Year Olds | 1,085 (44.3%) | 1,366 (55.7%) |
| 20 to 24 Year Olds | 1,227 (36.0%) | 2,184 (64.0%) |
| 25 to 34 Year Olds | 621 (74.1%) | 217 (25.9%) |
| 35 Years and over | 549 (64.2%) | 306 (35.8%) |
| Total | 16,968 (73.3%) | 6,181 (26.7%) |
Educational Attainment by Field of Study in Mercer County
Education (4,288 | 20.6%), business (3,124 | 15.0%), science & technology (2,830 | 13.6%), arts & humanities (1,909 | 9.2%), and social sciences (1,443 | 6.9%) are the most common fields of study among 20,779 individuals in Mercer County who have obtained a bachelor's degree or higher.
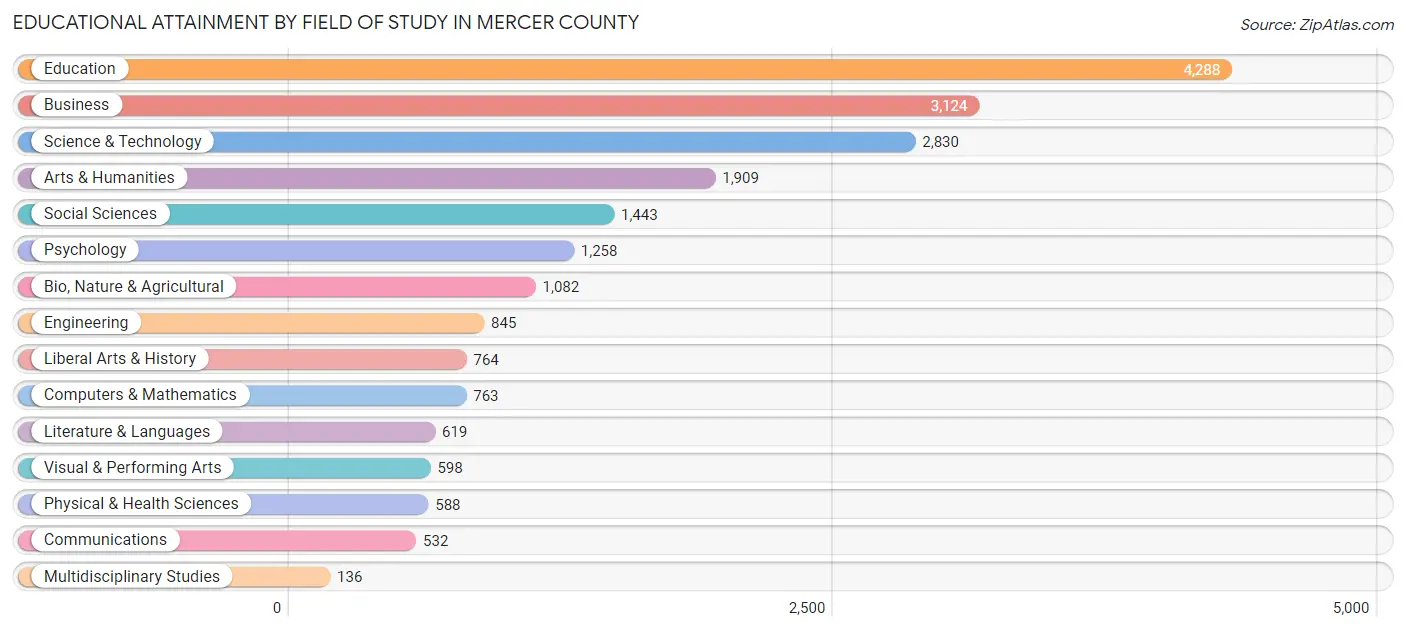
| Field of Study | # Graduates | % Graduates |
| Computers & Mathematics | 763 | 3.7% |
| Bio, Nature & Agricultural | 1,082 | 5.2% |
| Physical & Health Sciences | 588 | 2.8% |
| Psychology | 1,258 | 6.0% |
| Social Sciences | 1,443 | 6.9% |
| Engineering | 845 | 4.1% |
| Multidisciplinary Studies | 136 | 0.6% |
| Science & Technology | 2,830 | 13.6% |
| Business | 3,124 | 15.0% |
| Education | 4,288 | 20.6% |
| Literature & Languages | 619 | 3.0% |
| Liberal Arts & History | 764 | 3.7% |
| Visual & Performing Arts | 598 | 2.9% |
| Communications | 532 | 2.6% |
| Arts & Humanities | 1,909 | 9.2% |
| Total | 20,779 | 100.0% |
Transportation & Commute in Mercer County
Vehicle Availability by Sex in Mercer County
The most prevalent vehicle ownership categories in Mercer County are males with 2 vehicles (10,257, accounting for 43.3%) and females with 2 vehicles (9,670, making up 46.3%).
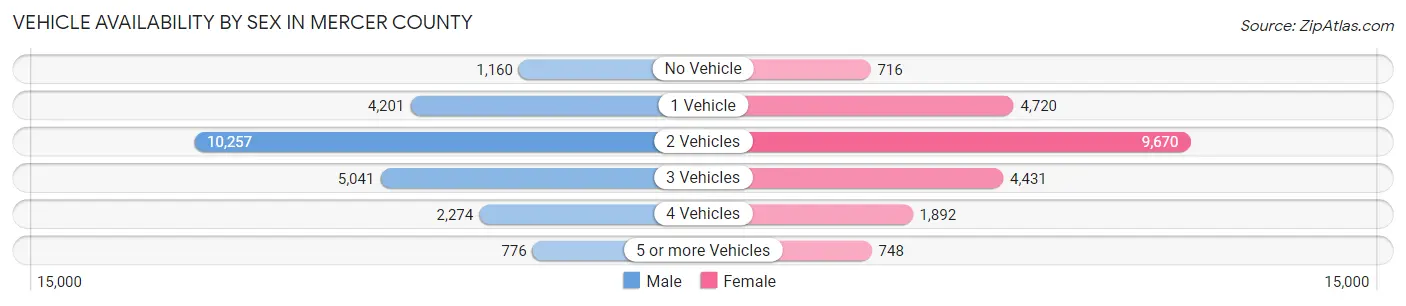
| Vehicles Available | Male | Female |
| No Vehicle | 1,160 (4.9%) | 716 (3.2%) |
| 1 Vehicle | 4,201 (17.7%) | 4,720 (21.3%) |
| 2 Vehicles | 10,257 (43.3%) | 9,670 (43.6%) |
| 3 Vehicles | 5,041 (21.3%) | 4,431 (20.0%) |
| 4 Vehicles | 2,274 (9.6%) | 1,892 (8.5%) |
| 5 or more Vehicles | 776 (3.3%) | 748 (3.4%) |
| Total | 23,709 (100.0%) | 22,177 (100.0%) |
Commute Time in Mercer County
The most frequently occuring commute durations in Mercer County are 10 to 14 minutes (8,205 commuters, 18.7%), 5 to 9 minutes (7,577 commuters, 17.2%), and 15 to 19 minutes (6,053 commuters, 13.8%).
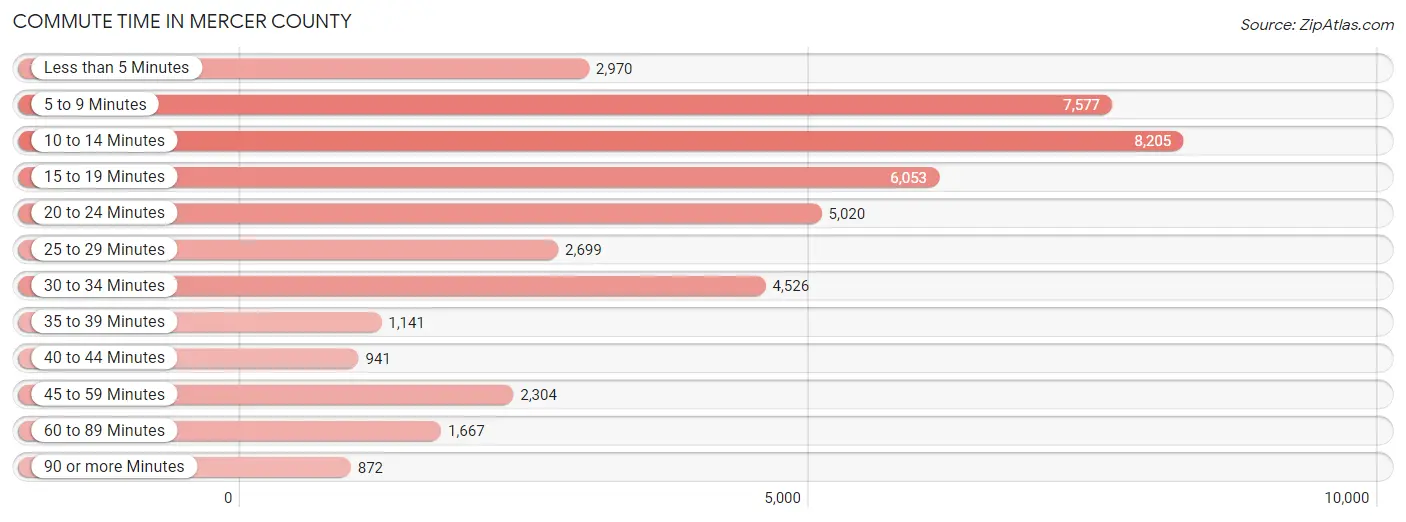
| Commute Time | # Commuters | % Commuters |
| Less than 5 Minutes | 2,970 | 6.8% |
| 5 to 9 Minutes | 7,577 | 17.2% |
| 10 to 14 Minutes | 8,205 | 18.7% |
| 15 to 19 Minutes | 6,053 | 13.8% |
| 20 to 24 Minutes | 5,020 | 11.4% |
| 25 to 29 Minutes | 2,699 | 6.1% |
| 30 to 34 Minutes | 4,526 | 10.3% |
| 35 to 39 Minutes | 1,141 | 2.6% |
| 40 to 44 Minutes | 941 | 2.1% |
| 45 to 59 Minutes | 2,304 | 5.2% |
| 60 to 89 Minutes | 1,667 | 3.8% |
| 90 or more Minutes | 872 | 2.0% |
Commute Time by Sex in Mercer County
The most common commute times in Mercer County are 10 to 14 minutes (3,700 commuters, 16.3%) for males and 10 to 14 minutes (4,505 commuters, 21.1%) for females.
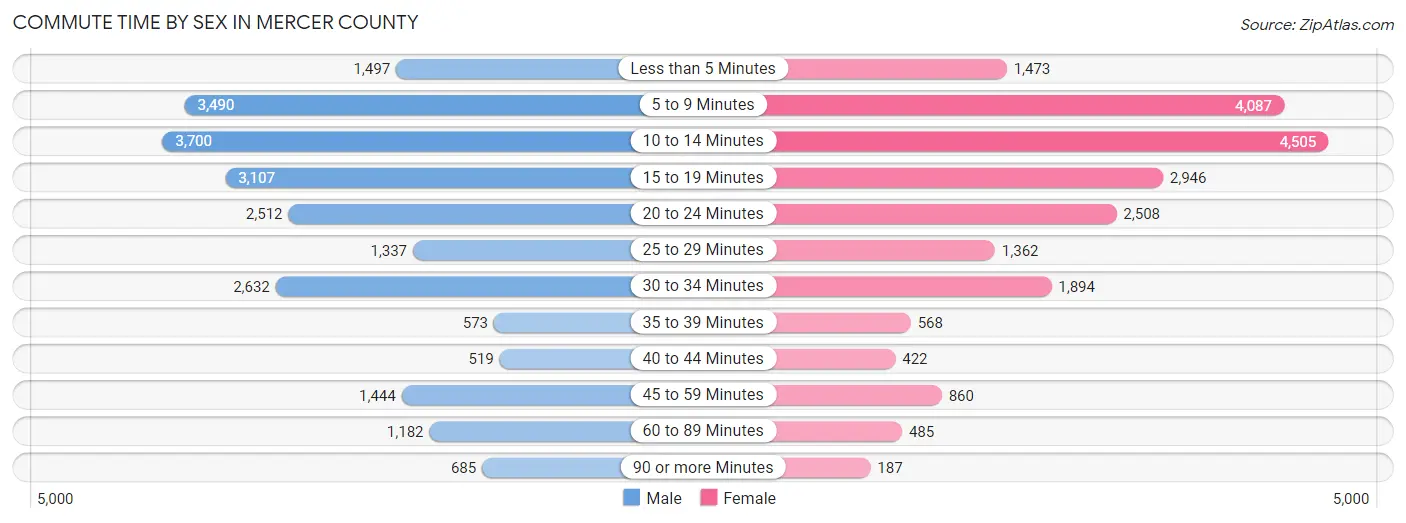
| Commute Time | Male | Female |
| Less than 5 Minutes | 1,497 (6.6%) | 1,473 (6.9%) |
| 5 to 9 Minutes | 3,490 (15.4%) | 4,087 (19.2%) |
| 10 to 14 Minutes | 3,700 (16.3%) | 4,505 (21.1%) |
| 15 to 19 Minutes | 3,107 (13.7%) | 2,946 (13.8%) |
| 20 to 24 Minutes | 2,512 (11.1%) | 2,508 (11.8%) |
| 25 to 29 Minutes | 1,337 (5.9%) | 1,362 (6.4%) |
| 30 to 34 Minutes | 2,632 (11.6%) | 1,894 (8.9%) |
| 35 to 39 Minutes | 573 (2.5%) | 568 (2.7%) |
| 40 to 44 Minutes | 519 (2.3%) | 422 (2.0%) |
| 45 to 59 Minutes | 1,444 (6.4%) | 860 (4.0%) |
| 60 to 89 Minutes | 1,182 (5.2%) | 485 (2.3%) |
| 90 or more Minutes | 685 (3.0%) | 187 (0.9%) |
Time of Departure to Work by Sex in Mercer County
The most frequent times of departure to work in Mercer County are 6:30 AM to 6:59 AM (2,852, 12.6%) for males and 7:30 AM to 7:59 AM (3,753, 17.6%) for females.
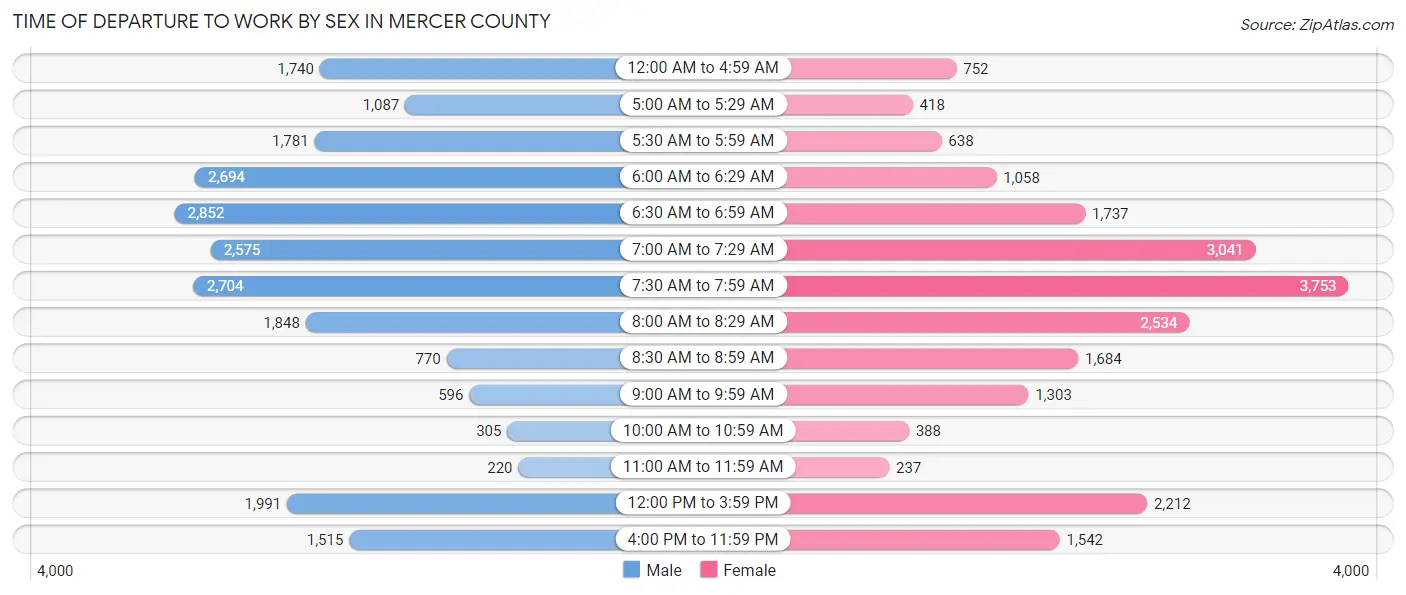
| Time of Departure | Male | Female |
| 12:00 AM to 4:59 AM | 1,740 (7.7%) | 752 (3.5%) |
| 5:00 AM to 5:29 AM | 1,087 (4.8%) | 418 (2.0%) |
| 5:30 AM to 5:59 AM | 1,781 (7.9%) | 638 (3.0%) |
| 6:00 AM to 6:29 AM | 2,694 (11.9%) | 1,058 (5.0%) |
| 6:30 AM to 6:59 AM | 2,852 (12.6%) | 1,737 (8.2%) |
| 7:00 AM to 7:29 AM | 2,575 (11.4%) | 3,041 (14.3%) |
| 7:30 AM to 7:59 AM | 2,704 (11.9%) | 3,753 (17.6%) |
| 8:00 AM to 8:29 AM | 1,848 (8.2%) | 2,534 (11.9%) |
| 8:30 AM to 8:59 AM | 770 (3.4%) | 1,684 (7.9%) |
| 9:00 AM to 9:59 AM | 596 (2.6%) | 1,303 (6.1%) |
| 10:00 AM to 10:59 AM | 305 (1.3%) | 388 (1.8%) |
| 11:00 AM to 11:59 AM | 220 (1.0%) | 237 (1.1%) |
| 12:00 PM to 3:59 PM | 1,991 (8.8%) | 2,212 (10.4%) |
| 4:00 PM to 11:59 PM | 1,515 (6.7%) | 1,542 (7.2%) |
| Total | 22,678 (100.0%) | 21,297 (100.0%) |
Housing Occupancy in Mercer County
Occupancy by Ownership in Mercer County
Of the total 45,890 dwellings in Mercer County, owner-occupied units account for 33,207 (72.4%), while renter-occupied units make up 12,683 (27.6%).
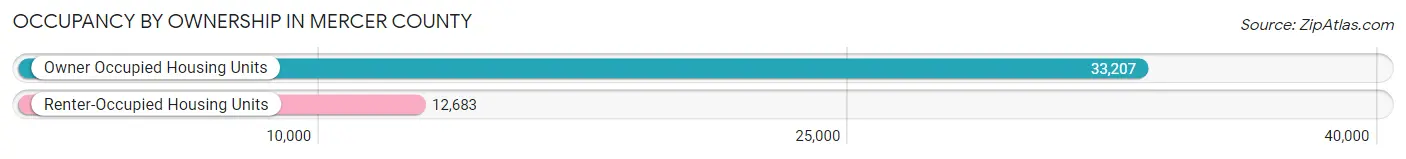
| Occupancy | # Housing Units | % Housing Units |
| Owner Occupied Housing Units | 33,207 | 72.4% |
| Renter-Occupied Housing Units | 12,683 | 27.6% |
| Total Occupied Housing Units | 45,890 | 100.0% |
Occupancy by Household Size in Mercer County
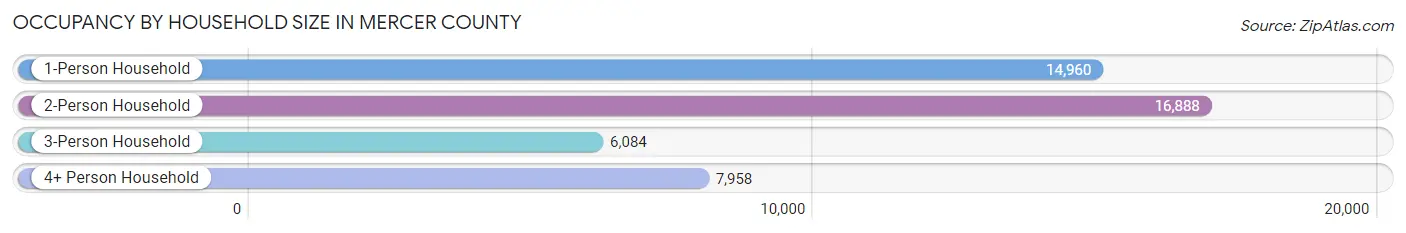
| Household Size | # Housing Units | % Housing Units |
| 1-Person Household | 14,960 | 32.6% |
| 2-Person Household | 16,888 | 36.8% |
| 3-Person Household | 6,084 | 13.3% |
| 4+ Person Household | 7,958 | 17.3% |
| Total Housing Units | 45,890 | 100.0% |
Occupancy by Ownership by Household Size in Mercer County
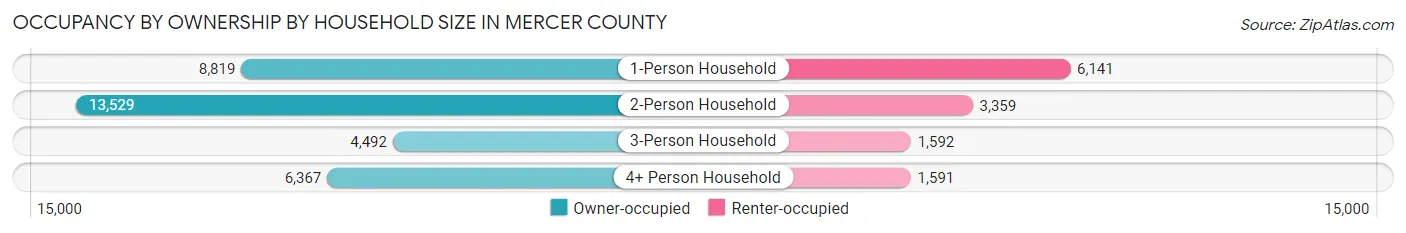
| Household Size | Owner-occupied | Renter-occupied |
| 1-Person Household | 8,819 (59.0%) | 6,141 (41.0%) |
| 2-Person Household | 13,529 (80.1%) | 3,359 (19.9%) |
| 3-Person Household | 4,492 (73.8%) | 1,592 (26.2%) |
| 4+ Person Household | 6,367 (80.0%) | 1,591 (20.0%) |
| Total Housing Units | 33,207 (72.4%) | 12,683 (27.6%) |
Occupancy by Educational Attainment in Mercer County
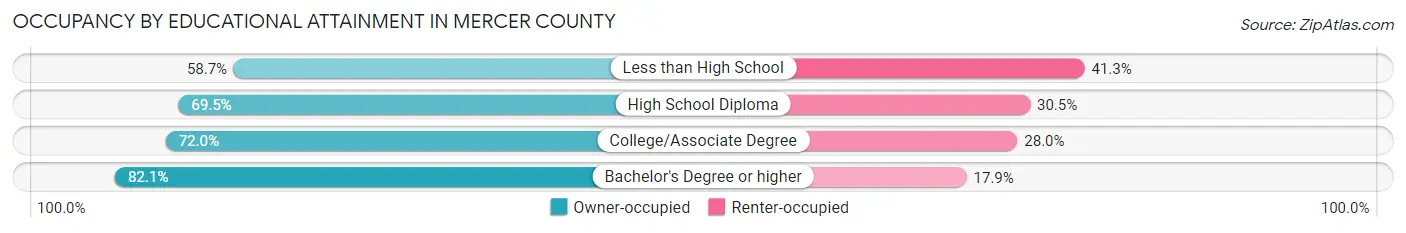
| Household Size | Owner-occupied | Renter-occupied |
| Less than High School | 2,390 (58.7%) | 1,682 (41.3%) |
| High School Diploma | 12,403 (69.5%) | 5,443 (30.5%) |
| College/Associate Degree | 9,010 (72.0%) | 3,503 (28.0%) |
| Bachelor's Degree or higher | 9,404 (82.1%) | 2,055 (17.9%) |
Occupancy by Age of Householder in Mercer County
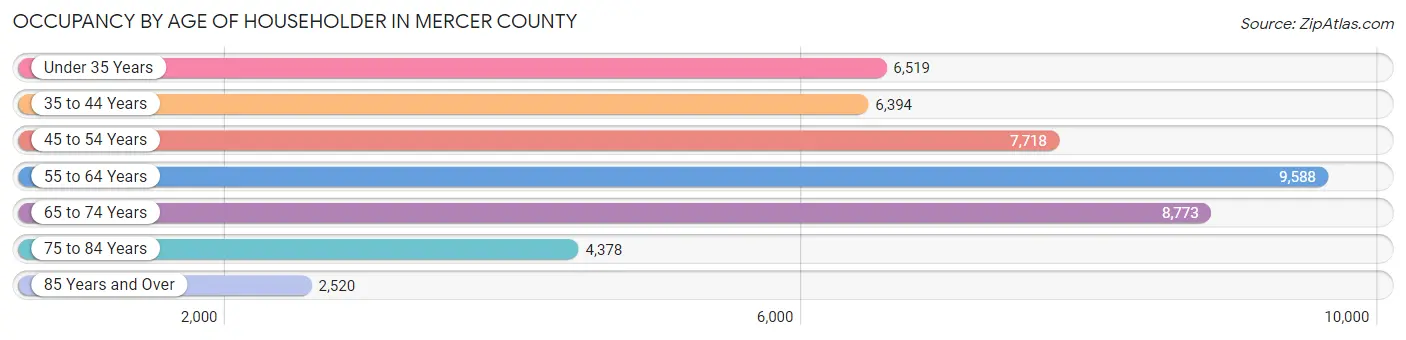
| Age Bracket | # Households | % Households |
| Under 35 Years | 6,519 | 14.2% |
| 35 to 44 Years | 6,394 | 13.9% |
| 45 to 54 Years | 7,718 | 16.8% |
| 55 to 64 Years | 9,588 | 20.9% |
| 65 to 74 Years | 8,773 | 19.1% |
| 75 to 84 Years | 4,378 | 9.5% |
| 85 Years and Over | 2,520 | 5.5% |
| Total | 45,890 | 100.0% |
Housing Finances in Mercer County
Median Income by Occupancy in Mercer County
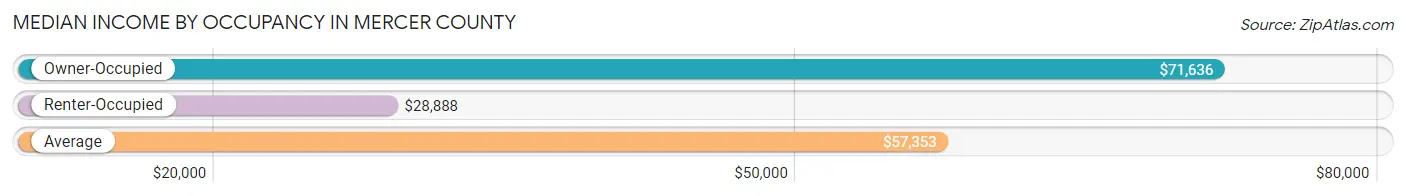
| Occupancy Type | # Households | Median Income |
| Owner-Occupied | 33,207 (72.4%) | $71,636 |
| Renter-Occupied | 12,683 (27.6%) | $28,888 |
| Average | 45,890 (100.0%) | $57,353 |
Occupancy by Householder Income Bracket in Mercer County
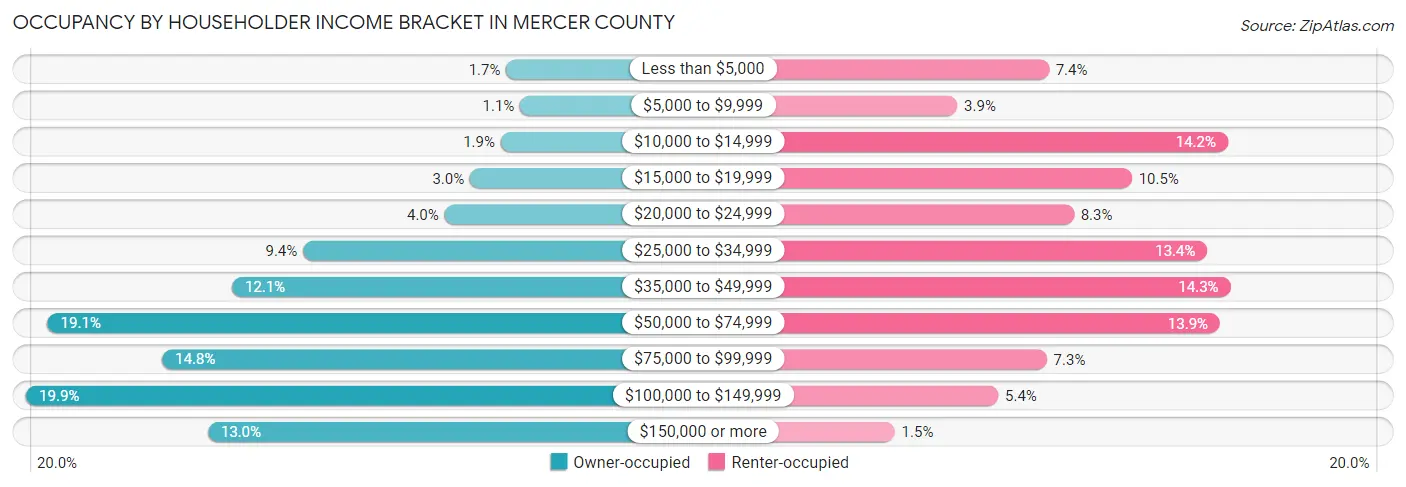
| Income Bracket | Owner-occupied | Renter-occupied |
| Less than $5,000 | 549 (1.7%) | 934 (7.4%) |
| $5,000 to $9,999 | 373 (1.1%) | 491 (3.9%) |
| $10,000 to $14,999 | 617 (1.9%) | 1,798 (14.2%) |
| $15,000 to $19,999 | 1,005 (3.0%) | 1,334 (10.5%) |
| $20,000 to $24,999 | 1,327 (4.0%) | 1,054 (8.3%) |
| $25,000 to $34,999 | 3,119 (9.4%) | 1,699 (13.4%) |
| $35,000 to $49,999 | 4,019 (12.1%) | 1,811 (14.3%) |
| $50,000 to $74,999 | 6,350 (19.1%) | 1,761 (13.9%) |
| $75,000 to $99,999 | 4,901 (14.8%) | 923 (7.3%) |
| $100,000 to $149,999 | 6,622 (19.9%) | 689 (5.4%) |
| $150,000 or more | 4,325 (13.0%) | 189 (1.5%) |
| Total | 33,207 (100.0%) | 12,683 (100.0%) |
Monthly Housing Cost Tiers in Mercer County
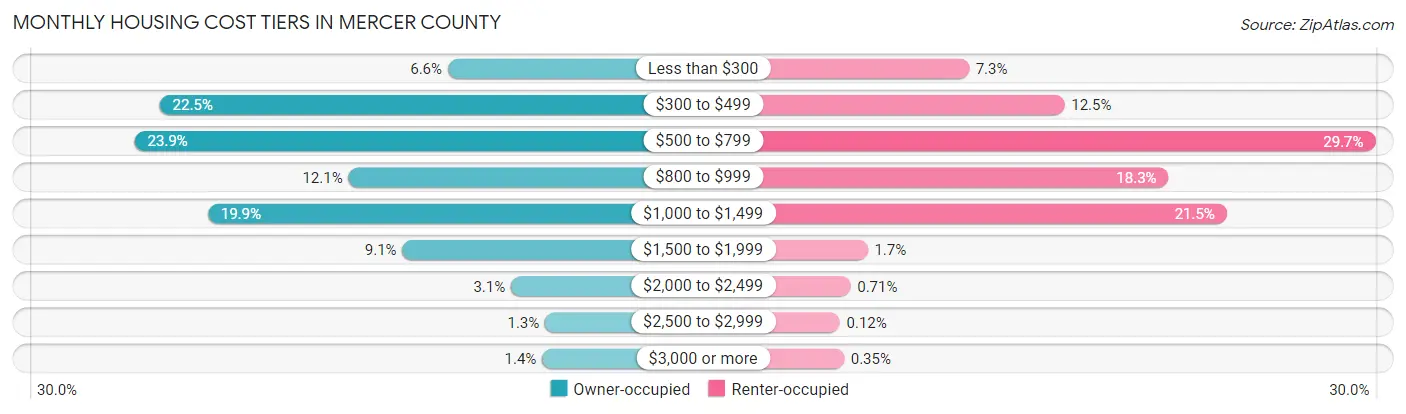
| Monthly Cost | Owner-occupied | Renter-occupied |
| Less than $300 | 2,199 (6.6%) | 920 (7.2%) |
| $300 to $499 | 7,486 (22.5%) | 1,589 (12.5%) |
| $500 to $799 | 7,945 (23.9%) | 3,768 (29.7%) |
| $800 to $999 | 4,021 (12.1%) | 2,319 (18.3%) |
| $1,000 to $1,499 | 6,602 (19.9%) | 2,727 (21.5%) |
| $1,500 to $1,999 | 3,031 (9.1%) | 211 (1.7%) |
| $2,000 to $2,499 | 1,041 (3.1%) | 90 (0.7%) |
| $2,500 to $2,999 | 415 (1.3%) | 15 (0.1%) |
| $3,000 or more | 467 (1.4%) | 45 (0.4%) |
| Total | 33,207 (100.0%) | 12,683 (100.0%) |
Physical Housing Characteristics in Mercer County
Housing Structures in Mercer County
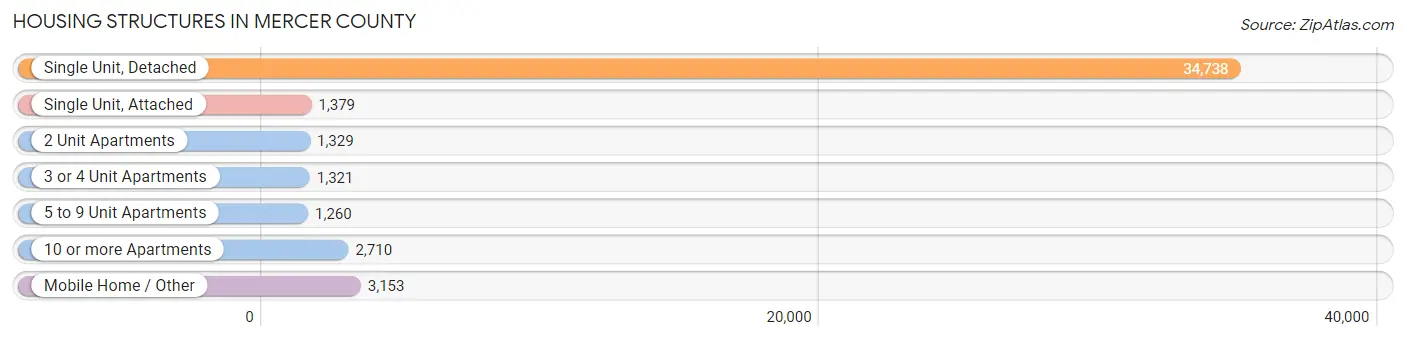
| Structure Type | # Housing Units | % Housing Units |
| Single Unit, Detached | 34,738 | 75.7% |
| Single Unit, Attached | 1,379 | 3.0% |
| 2 Unit Apartments | 1,329 | 2.9% |
| 3 or 4 Unit Apartments | 1,321 | 2.9% |
| 5 to 9 Unit Apartments | 1,260 | 2.8% |
| 10 or more Apartments | 2,710 | 5.9% |
| Mobile Home / Other | 3,153 | 6.9% |
| Total | 45,890 | 100.0% |
Housing Structures by Occupancy in Mercer County
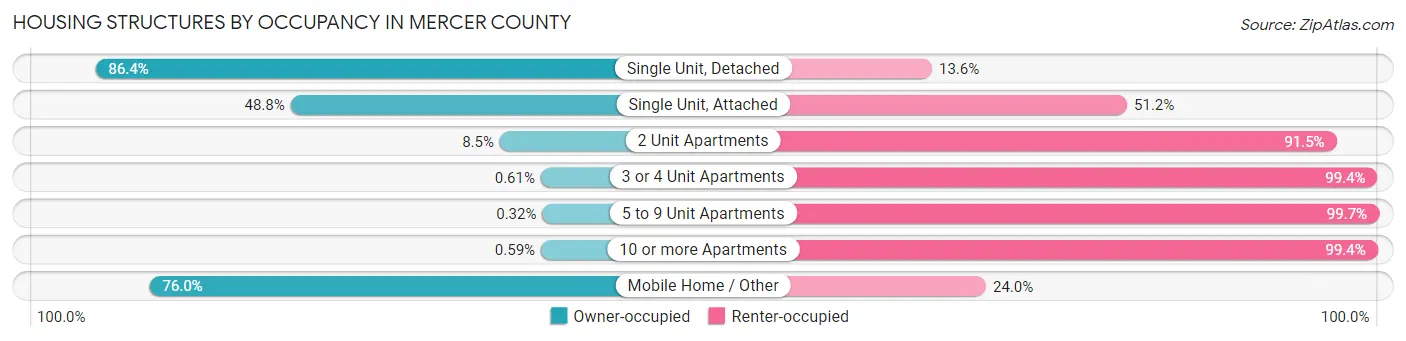
| Structure Type | Owner-occupied | Renter-occupied |
| Single Unit, Detached | 29,998 (86.4%) | 4,740 (13.6%) |
| Single Unit, Attached | 673 (48.8%) | 706 (51.2%) |
| 2 Unit Apartments | 113 (8.5%) | 1,216 (91.5%) |
| 3 or 4 Unit Apartments | 8 (0.6%) | 1,313 (99.4%) |
| 5 to 9 Unit Apartments | 4 (0.3%) | 1,256 (99.7%) |
| 10 or more Apartments | 16 (0.6%) | 2,694 (99.4%) |
| Mobile Home / Other | 2,395 (76.0%) | 758 (24.0%) |
| Total | 33,207 (72.4%) | 12,683 (27.6%) |
Housing Structures by Number of Rooms in Mercer County
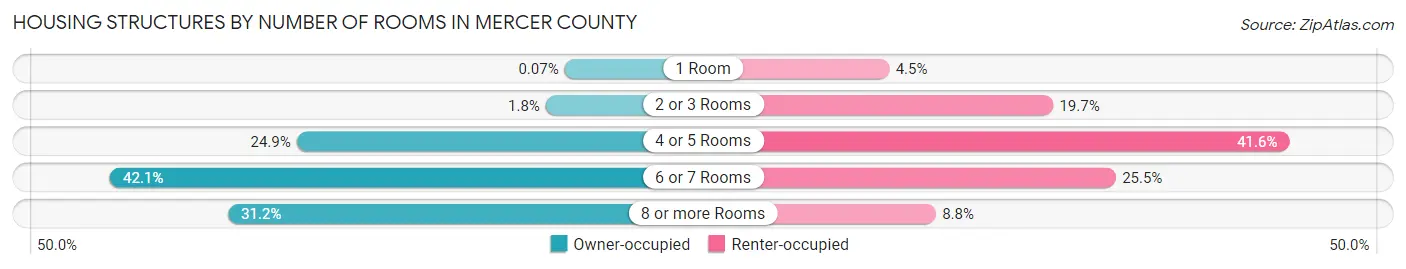
| Number of Rooms | Owner-occupied | Renter-occupied |
| 1 Room | 23 (0.1%) | 572 (4.5%) |
| 2 or 3 Rooms | 601 (1.8%) | 2,494 (19.7%) |
| 4 or 5 Rooms | 8,251 (24.8%) | 5,270 (41.5%) |
| 6 or 7 Rooms | 13,977 (42.1%) | 3,229 (25.5%) |
| 8 or more Rooms | 10,355 (31.2%) | 1,118 (8.8%) |
| Total | 33,207 (100.0%) | 12,683 (100.0%) |
Housing Structure by Heating Type in Mercer County
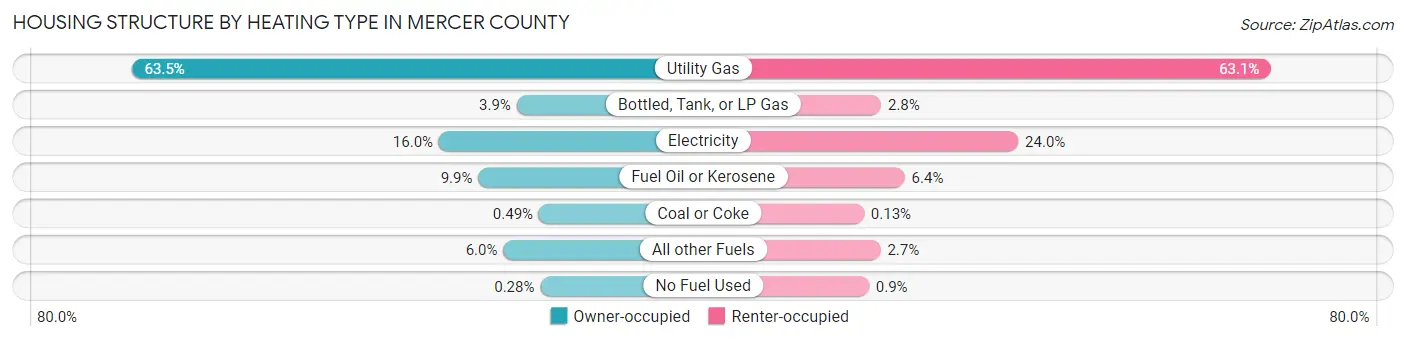
| Heating Type | Owner-occupied | Renter-occupied |
| Utility Gas | 21,080 (63.5%) | 8,002 (63.1%) |
| Bottled, Tank, or LP Gas | 1,304 (3.9%) | 352 (2.8%) |
| Electricity | 5,295 (16.0%) | 3,042 (24.0%) |
| Fuel Oil or Kerosene | 3,278 (9.9%) | 816 (6.4%) |
| Coal or Coke | 164 (0.5%) | 16 (0.1%) |
| All other Fuels | 1,994 (6.0%) | 341 (2.7%) |
| No Fuel Used | 92 (0.3%) | 114 (0.9%) |
| Total | 33,207 (100.0%) | 12,683 (100.0%) |
Household Vehicle Usage in Mercer County
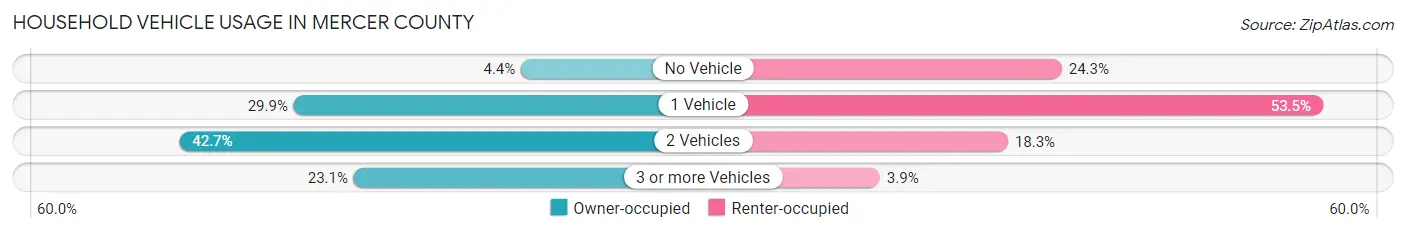
| Vehicles per Household | Owner-occupied | Renter-occupied |
| No Vehicle | 1,455 (4.4%) | 3,081 (24.3%) |
| 1 Vehicle | 9,911 (29.8%) | 6,789 (53.5%) |
| 2 Vehicles | 14,165 (42.7%) | 2,316 (18.3%) |
| 3 or more Vehicles | 7,676 (23.1%) | 497 (3.9%) |
| Total | 33,207 (100.0%) | 12,683 (100.0%) |
Real Estate & Mortgages in Mercer County
Real Estate and Mortgage Overview in Mercer County
| Characteristic | Without Mortgage | With Mortgage |
| Housing Units | 16,664 | 16,543 |
| Median Property Value | $134,000 | $156,300 |
| Median Household Income | $54,611 | $2,791 |
| Monthly Housing Costs | $474 | $448 |
| Real Estate Taxes | $1,772 | $139 |
Property Value by Mortgage Status in Mercer County
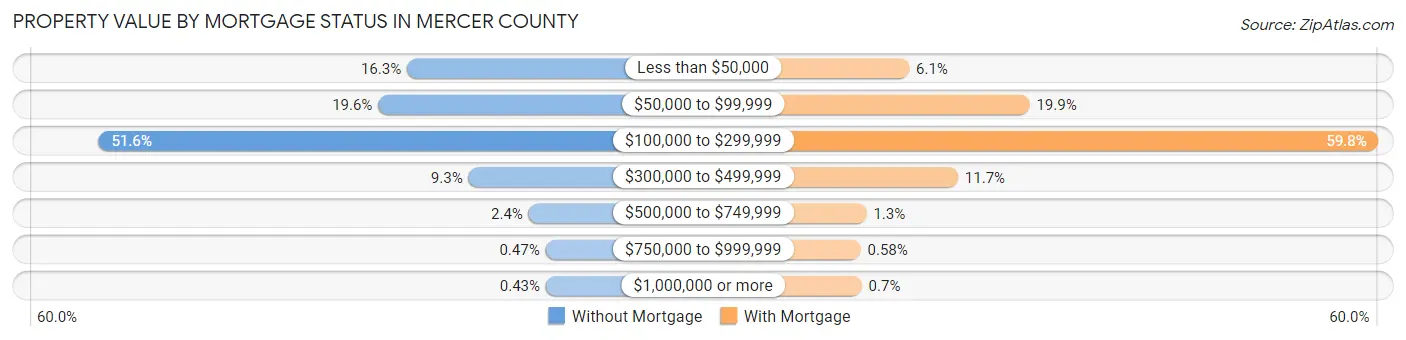
| Property Value | Without Mortgage | With Mortgage |
| Less than $50,000 | 2,716 (16.3%) | 1,012 (6.1%) |
| $50,000 to $99,999 | 3,264 (19.6%) | 3,289 (19.9%) |
| $100,000 to $299,999 | 8,590 (51.5%) | 9,888 (59.8%) |
| $300,000 to $499,999 | 1,544 (9.3%) | 1,936 (11.7%) |
| $500,000 to $749,999 | 399 (2.4%) | 206 (1.3%) |
| $750,000 to $999,999 | 79 (0.5%) | 96 (0.6%) |
| $1,000,000 or more | 72 (0.4%) | 116 (0.7%) |
| Total | 16,664 (100.0%) | 16,543 (100.0%) |
Household Income by Mortgage Status in Mercer County
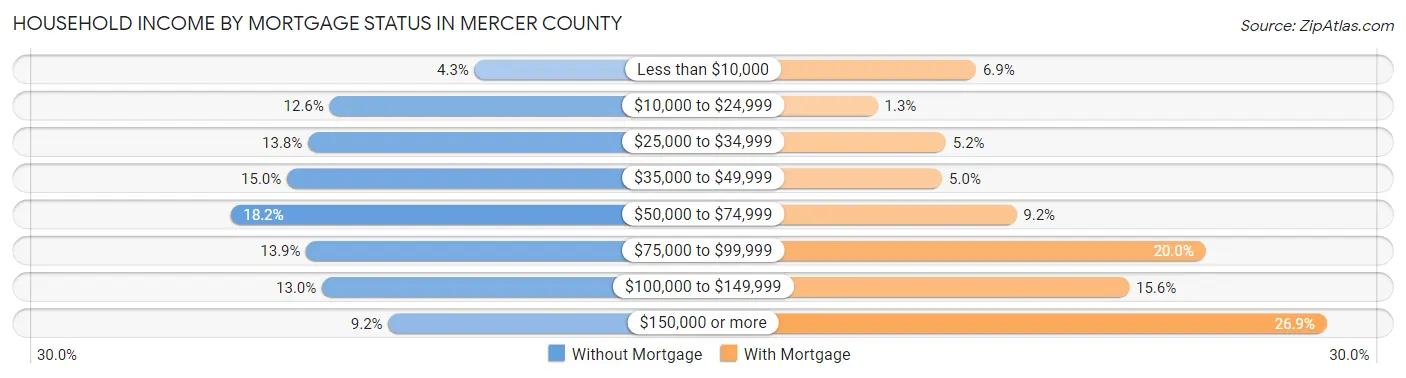
| Household Income | Without Mortgage | With Mortgage |
| Less than $10,000 | 714 (4.3%) | 1,138 (6.9%) |
| $10,000 to $24,999 | 2,095 (12.6%) | 208 (1.3%) |
| $25,000 to $34,999 | 2,300 (13.8%) | 854 (5.2%) |
| $35,000 to $49,999 | 2,499 (15.0%) | 819 (5.0%) |
| $50,000 to $74,999 | 3,039 (18.2%) | 1,520 (9.2%) |
| $75,000 to $99,999 | 2,316 (13.9%) | 3,311 (20.0%) |
| $100,000 to $149,999 | 2,167 (13.0%) | 2,585 (15.6%) |
| $150,000 or more | 1,534 (9.2%) | 4,455 (26.9%) |
| Total | 16,664 (100.0%) | 16,543 (100.0%) |
Property Value to Household Income Ratio in Mercer County
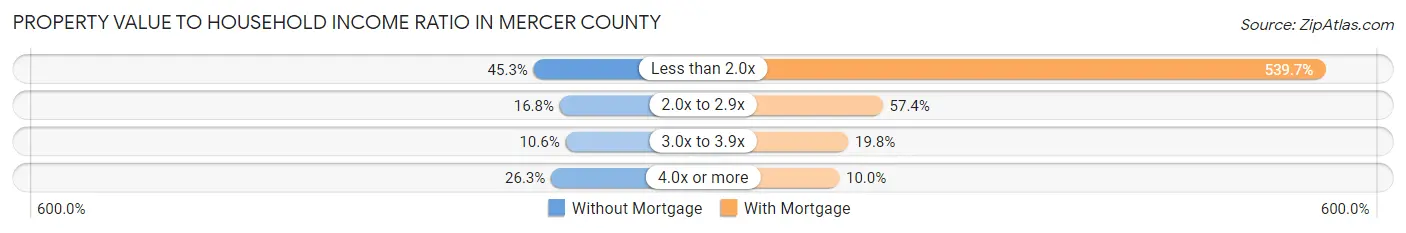
| Value-to-Income Ratio | Without Mortgage | With Mortgage |
| Less than 2.0x | 7,551 (45.3%) | 89,276 (539.7%) |
| 2.0x to 2.9x | 2,804 (16.8%) | 9,497 (57.4%) |
| 3.0x to 3.9x | 1,769 (10.6%) | 3,278 (19.8%) |
| 4.0x or more | 4,377 (26.3%) | 1,646 (10.0%) |
| Total | 16,664 (100.0%) | 16,543 (100.0%) |
Real Estate Taxes by Mortgage Status in Mercer County
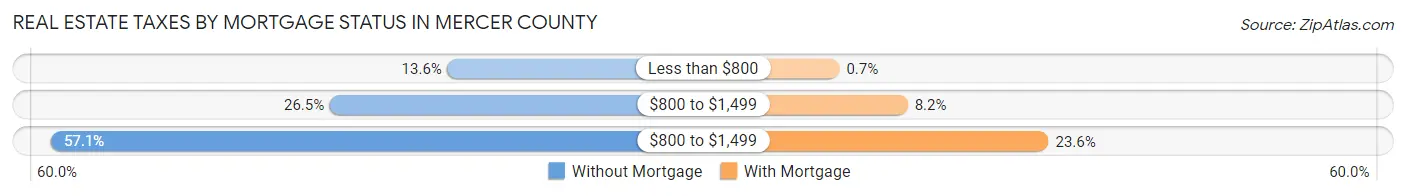
| Property Taxes | Without Mortgage | With Mortgage |
| Less than $800 | 2,273 (13.6%) | 115 (0.7%) |
| $800 to $1,499 | 4,421 (26.5%) | 1,354 (8.2%) |
| $800 to $1,499 | 9,517 (57.1%) | 3,908 (23.6%) |
| Total | 16,664 (100.0%) | 16,543 (100.0%) |
Health & Disability in Mercer County
Health Insurance Coverage by Age in Mercer County
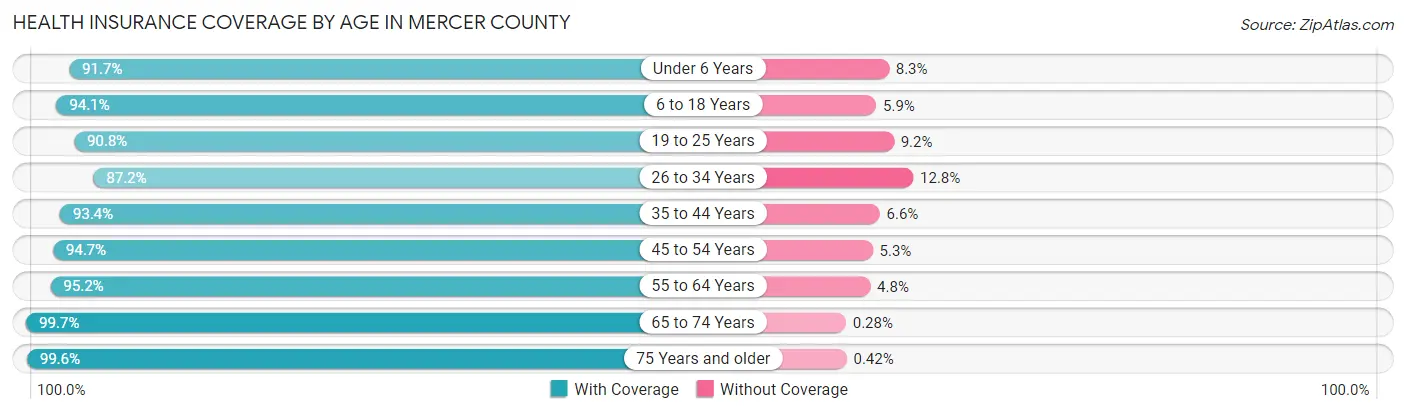
| Age Bracket | With Coverage | Without Coverage |
| Under 6 Years | 5,798 (91.7%) | 525 (8.3%) |
| 6 to 18 Years | 15,016 (94.1%) | 947 (5.9%) |
| 19 to 25 Years | 8,857 (90.8%) | 899 (9.2%) |
| 26 to 34 Years | 8,993 (87.2%) | 1,324 (12.8%) |
| 35 to 44 Years | 10,483 (93.4%) | 738 (6.6%) |
| 45 to 54 Years | 12,785 (94.7%) | 712 (5.3%) |
| 55 to 64 Years | 15,570 (95.2%) | 789 (4.8%) |
| 65 to 74 Years | 13,472 (99.7%) | 38 (0.3%) |
| 75 Years and older | 10,117 (99.6%) | 43 (0.4%) |
| Total | 101,091 (94.4%) | 6,015 (5.6%) |
Health Insurance Coverage by Citizenship Status in Mercer County
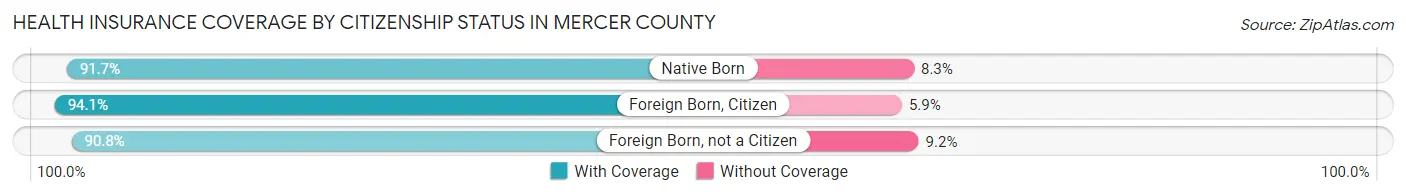
| Citizenship Status | With Coverage | Without Coverage |
| Native Born | 5,798 (91.7%) | 525 (8.3%) |
| Foreign Born, Citizen | 15,016 (94.1%) | 947 (5.9%) |
| Foreign Born, not a Citizen | 8,857 (90.8%) | 899 (9.2%) |
Health Insurance Coverage by Household Income in Mercer County
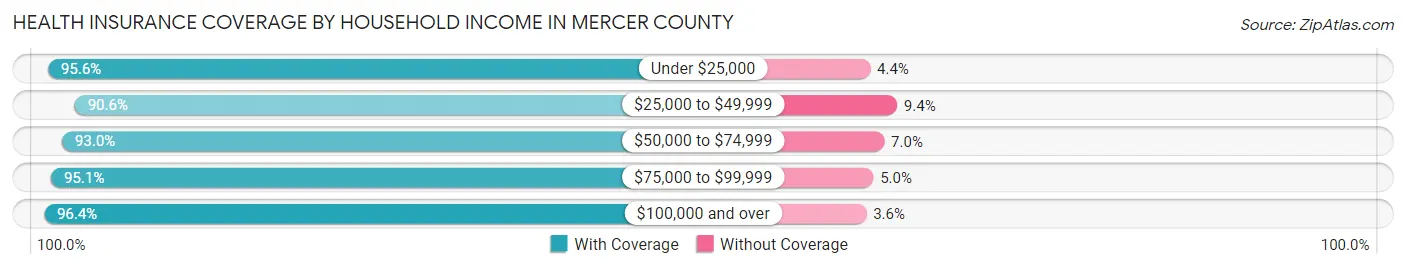
| Household Income | With Coverage | Without Coverage |
| Under $25,000 | 13,761 (95.6%) | 629 (4.4%) |
| $25,000 to $49,999 | 17,889 (90.6%) | 1,854 (9.4%) |
| $50,000 to $74,999 | 17,776 (93.0%) | 1,339 (7.0%) |
| $75,000 to $99,999 | 14,224 (95.1%) | 741 (5.0%) |
| $100,000 and over | 34,179 (96.4%) | 1,289 (3.6%) |
Public vs Private Health Insurance Coverage by Age in Mercer County
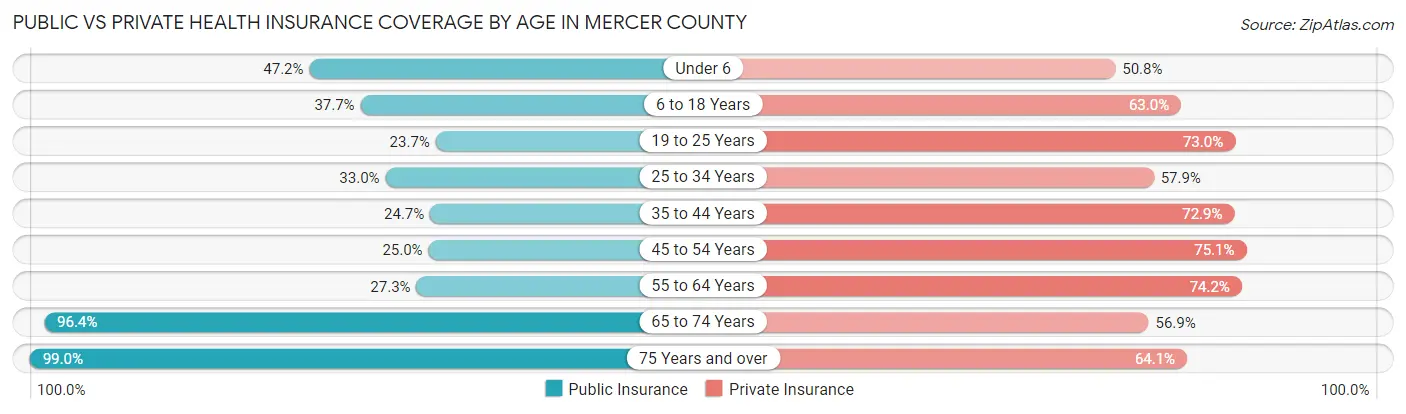
| Age Bracket | Public Insurance | Private Insurance |
| Under 6 | 2,981 (47.1%) | 3,210 (50.8%) |
| 6 to 18 Years | 6,012 (37.7%) | 10,048 (62.9%) |
| 19 to 25 Years | 2,312 (23.7%) | 7,119 (73.0%) |
| 25 to 34 Years | 3,408 (33.0%) | 5,972 (57.9%) |
| 35 to 44 Years | 2,775 (24.7%) | 8,174 (72.9%) |
| 45 to 54 Years | 3,380 (25.0%) | 10,135 (75.1%) |
| 55 to 64 Years | 4,463 (27.3%) | 12,142 (74.2%) |
| 65 to 74 Years | 13,019 (96.4%) | 7,693 (56.9%) |
| 75 Years and over | 10,062 (99.0%) | 6,509 (64.1%) |
| Total | 48,412 (45.2%) | 71,002 (66.3%) |
Disability Status by Sex by Age in Mercer County
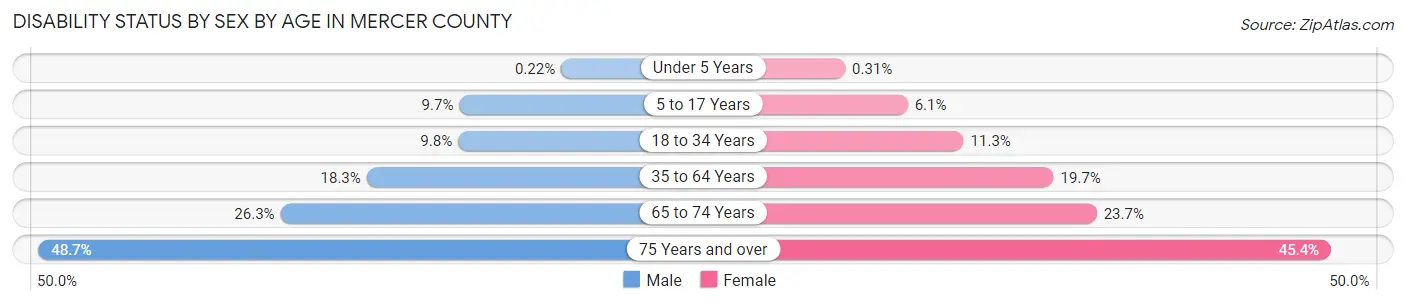
| Age Bracket | Male | Female |
| Under 5 Years | 6 (0.2%) | 8 (0.3%) |
| 5 to 17 Years | 759 (9.7%) | 458 (6.1%) |
| 18 to 34 Years | 1,082 (9.8%) | 1,211 (11.3%) |
| 35 to 64 Years | 3,700 (18.3%) | 4,091 (19.7%) |
| 65 to 74 Years | 1,690 (26.3%) | 1,674 (23.7%) |
| 75 Years and over | 1,979 (48.7%) | 2,768 (45.4%) |
Disability Class by Sex by Age in Mercer County
Disability Class: Hearing Difficulty
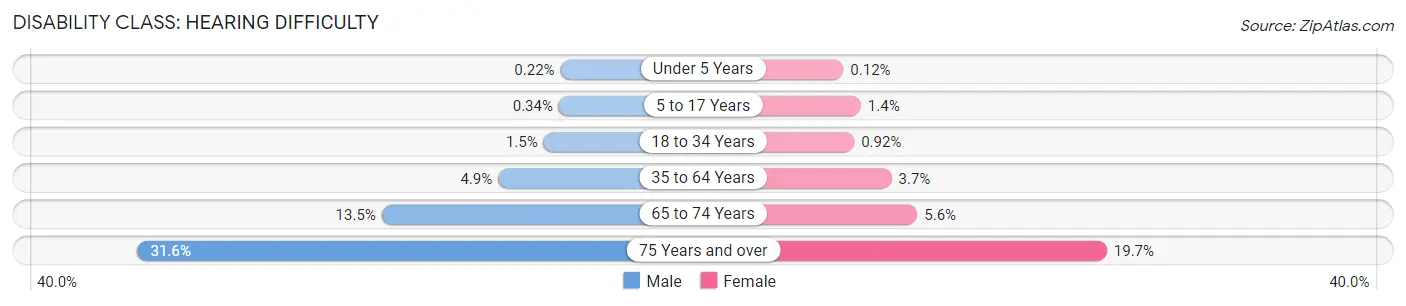
| Age Bracket | Male | Female |
| Under 5 Years | 6 (0.2%) | 3 (0.1%) |
| 5 to 17 Years | 27 (0.3%) | 106 (1.4%) |
| 18 to 34 Years | 163 (1.5%) | 99 (0.9%) |
| 35 to 64 Years | 983 (4.9%) | 769 (3.7%) |
| 65 to 74 Years | 868 (13.5%) | 397 (5.6%) |
| 75 Years and over | 1,284 (31.6%) | 1,200 (19.7%) |
Disability Class: Vision Difficulty
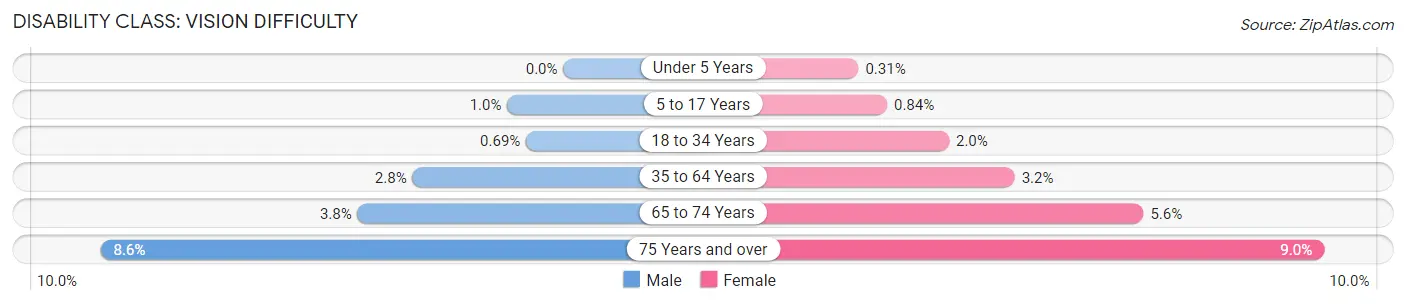
| Age Bracket | Male | Female |
| Under 5 Years | 0 (0.0%) | 8 (0.3%) |
| 5 to 17 Years | 82 (1.0%) | 63 (0.8%) |
| 18 to 34 Years | 76 (0.7%) | 213 (2.0%) |
| 35 to 64 Years | 567 (2.8%) | 667 (3.2%) |
| 65 to 74 Years | 246 (3.8%) | 396 (5.6%) |
| 75 Years and over | 349 (8.6%) | 546 (8.9%) |
Disability Class: Cognitive Difficulty
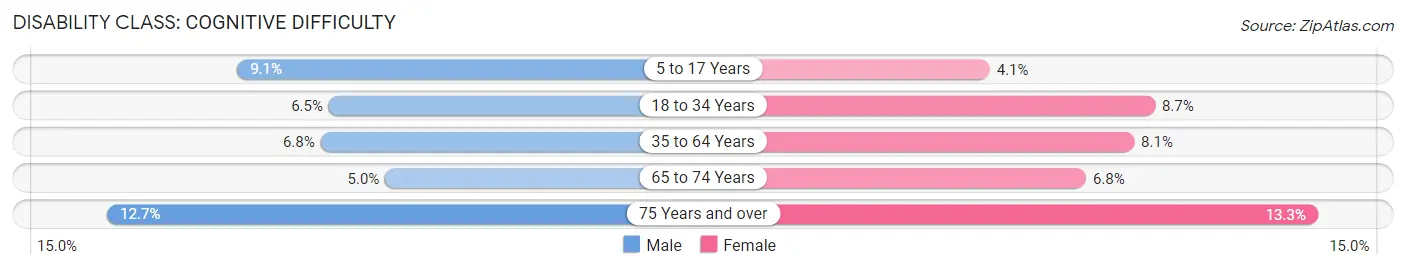
| Age Bracket | Male | Female |
| 5 to 17 Years | 713 (9.1%) | 308 (4.1%) |
| 18 to 34 Years | 723 (6.5%) | 934 (8.7%) |
| 35 to 64 Years | 1,369 (6.8%) | 1,694 (8.1%) |
| 65 to 74 Years | 319 (5.0%) | 481 (6.8%) |
| 75 Years and over | 516 (12.7%) | 808 (13.3%) |
Disability Class: Ambulatory Difficulty
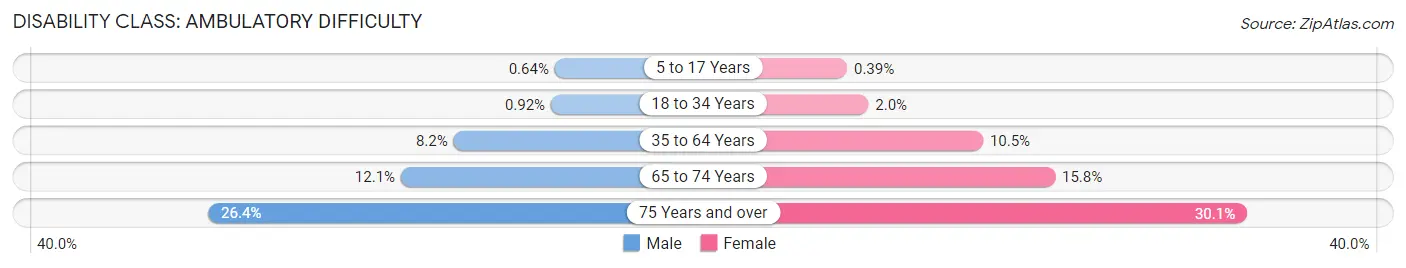
| Age Bracket | Male | Female |
| 5 to 17 Years | 50 (0.6%) | 29 (0.4%) |
| 18 to 34 Years | 102 (0.9%) | 211 (2.0%) |
| 35 to 64 Years | 1,651 (8.2%) | 2,181 (10.5%) |
| 65 to 74 Years | 776 (12.1%) | 1,120 (15.8%) |
| 75 Years and over | 1,071 (26.4%) | 1,834 (30.1%) |
Disability Class: Self-Care Difficulty
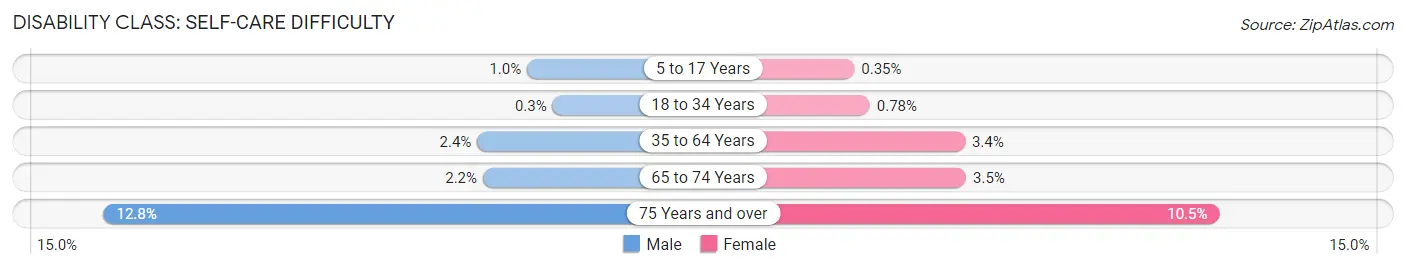
| Age Bracket | Male | Female |
| 5 to 17 Years | 79 (1.0%) | 26 (0.4%) |
| 18 to 34 Years | 33 (0.3%) | 84 (0.8%) |
| 35 to 64 Years | 486 (2.4%) | 714 (3.4%) |
| 65 to 74 Years | 144 (2.2%) | 245 (3.5%) |
| 75 Years and over | 520 (12.8%) | 641 (10.5%) |
Technology Access in Mercer County
Computing Device Access in Mercer County
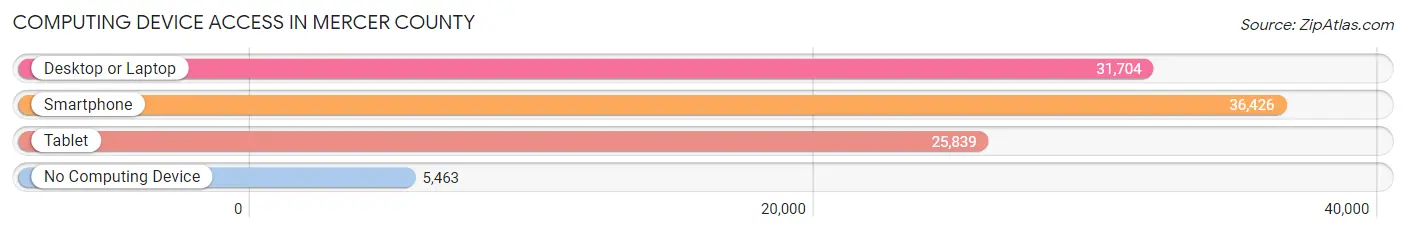
| Device Type | # Households | % Households |
| Desktop or Laptop | 31,704 | 69.1% |
| Smartphone | 36,426 | 79.4% |
| Tablet | 25,839 | 56.3% |
| No Computing Device | 5,463 | 11.9% |
| Total | 45,890 | 100.0% |
Internet Access in Mercer County
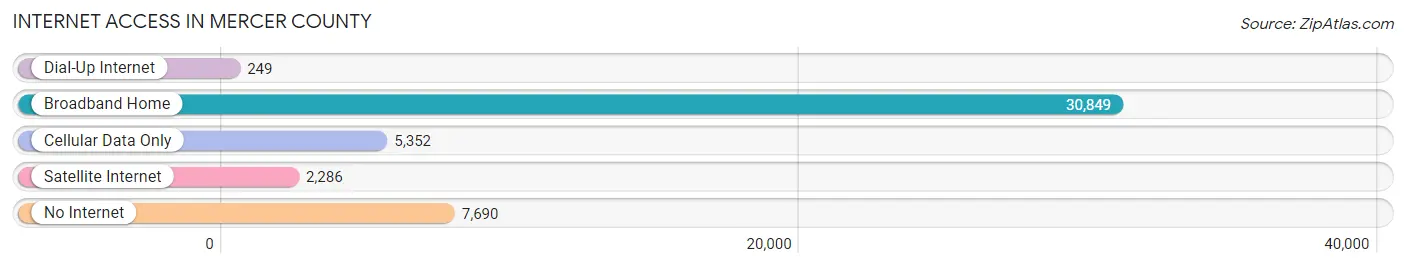
| Internet Type | # Households | % Households |
| Dial-Up Internet | 249 | 0.5% |
| Broadband Home | 30,849 | 67.2% |
| Cellular Data Only | 5,352 | 11.7% |
| Satellite Internet | 2,286 | 5.0% |
| No Internet | 7,690 | 16.8% |
| Total | 45,890 | 100.0% |
Mercer County Summary
Mercer County, Pennsylvania is located in the northwestern corner of the state and is part of the Pittsburgh metropolitan area. It is bordered by Lawrence County to the north, Butler County to the east, Beaver County to the south, and Crawford County to the west. The county seat is Mercer, and the largest city is Hermitage. The county was created in 1800 and named after Hugh Mercer, a general in the American Revolutionary War.
Geography
Mercer County covers an area of 683 square miles and is located in the glaciated Allegheny Plateau region of Pennsylvania. The county is mostly hilly and has many streams and rivers, including the Shenango River, Neshannock Creek, and Conneaut Creek. The highest point in the county is the summit of Mount Jackson, which has an elevation of 1,890 feet. The county is home to several state parks, including McConnells Mill State Park, Maurice K. Goddard State Park, and Pymatuning State Park.
Economy
The economy of Mercer County is largely based on manufacturing, with the largest employers being the Sharon Steel Corporation, the Sharon Regional Health System, and the Shenango Valley Mall. Other major employers include the Mercer County Courthouse, the Mercer County Airport, and the Mercer County Fairgrounds. Agriculture is also an important part of the economy, with the county producing corn, soybeans, hay, and wheat.
Demographics
As of the 2010 census, the population of Mercer County was 116,638, making it the 18th most populous county in Pennsylvania. The population density was 171.3 people per square mile. The racial makeup of the county was 95.2% White, 2.7% African American, 0.2% Native American, 0.6% Asian, 0.1% Pacific Islander, 0.4% from other races, and 0.9% from two or more races. Hispanic or Latino of any race were 1.3% of the population.
The median income for a household in the county was $41,945, and the median income for a family was $50,945. The per capita income for the county was $20,945. About 8.7% of families and 11.2% of the population were below the poverty line, including 15.2% of those under age 18 and 8.2% of those age 65 or over.
Conclusion
Mercer County, Pennsylvania is a rural county located in the northwestern corner of the state. It is home to several state parks and is largely dependent on manufacturing and agriculture for its economy. The population of the county is largely white, with a small percentage of African Americans, Native Americans, Asians, and other races. The median income for a household in the county is slightly below the state average, and there is a small percentage of people living below the poverty line.
Common Questions
What is the Total Population of Mercer County?
Total Population of Mercer County is 110,600.
What is the Total Male Population of Mercer County?
Total Male Population of Mercer County is 54,917.
What is the Total Female Population of Mercer County?
Total Female Population of Mercer County is 55,683.
What is the Ratio of Males per 100 Females in Mercer County?
There are 98.62 Males per 100 Females in Mercer County.
What is the Ratio of Females per 100 Males in Mercer County?
There are 101.39 Females per 100 Males in Mercer County.
What is the Median Population Age in Mercer County?
Median Population Age in Mercer County is 45.0 Years.
What is the Average Family Size in Mercer County
Average Family Size in Mercer County is 2.9 People.
What is the Average Household Size in Mercer County
Average Household Size in Mercer County is 2.3 People.
What is Per Capita Income in Mercer County?
Per Capita income in Mercer County is $32,081.
What is the Median Family Income in Mercer County?
Median Family Income in Mercer County is $76,303.
What is the Median Household income in Mercer County?
Median Household Income in Mercer County is $57,353.
What is Income or Wage Gap in Mercer County?
Income or Wage Gap in Mercer County is 35.1%.
Women in Mercer County earn 64.9 cents for every dollar earned by a man.
What is Family Income Deficit in Mercer County?
Family Income Deficit in Mercer County is $9,353.
Families that are below poverty line in Mercer County earn $9,353 less on average than the poverty threshold level.
What is Inequality or Gini Index in Mercer County?
Inequality or Gini Index in Mercer County is 0.45.
How Large is the Labor Force in Mercer County?
There are 50,860 People in the Labor Forcein in Mercer County.
What is the Percentage of People in the Labor Force in Mercer County?
55.0% of People are in the Labor Force in Mercer County.
What is the Unemployment Rate in Mercer County?
Unemployment Rate in Mercer County is 5.5%.