Lehigh County, PA
Lehigh County Map
Lehigh County Overview
374,110
TOTAL POPULATION
184,521
MALE POPULATION
189,589
FEMALE POPULATION
97.33
MALES / 100 FEMALES
102.75
FEMALES / 100 MALES
38.9
MEDIAN AGE
3.1
AVG FAMILY SIZE
2.6
AVG HOUSEHOLD SIZE
$39,856
PER CAPITA INCOME
$91,531
AVG FAMILY INCOME
$74,973
AVG HOUSEHOLD INCOME
31.8%
WAGE / INCOME GAP [ % ]
68.2¢/ $1
WAGE / INCOME GAP [ $ ]
$9,957
FAMILY INCOME DEFICIT
0.46
INEQUALITY / GINI INDEX
194,542
LABOR FORCE [ PEOPLE ]
64.9%
PERCENT IN LABOR FORCE
5.8%
UNEMPLOYMENT RATE
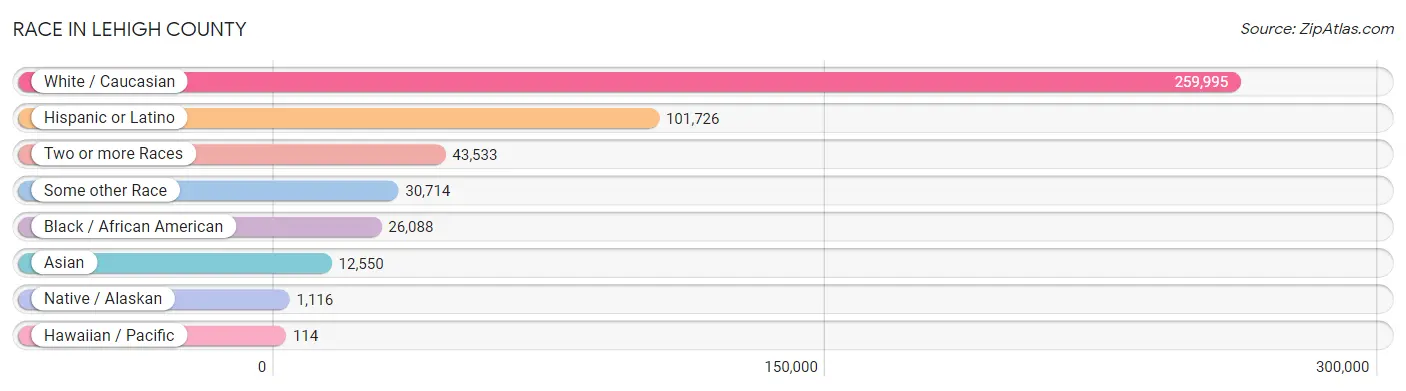
Race in Lehigh County
The most populous races in Lehigh County are White / Caucasian (259,995 | 69.5%), Hispanic or Latino (101,726 | 27.2%), and Two or more Races (43,533 | 11.6%).
| Race | # Population | % Population |
| Asian | 12,550 | 3.4% |
| Black / African American | 26,088 | 7.0% |
| Hawaiian / Pacific | 114 | 0.0% |
| Hispanic or Latino | 101,726 | 27.2% |
| Native / Alaskan | 1,116 | 0.3% |
| White / Caucasian | 259,995 | 69.5% |
| Two or more Races | 43,533 | 11.6% |
| Some other Race | 30,714 | 8.2% |
| Total | 374,110 | 100.0% |
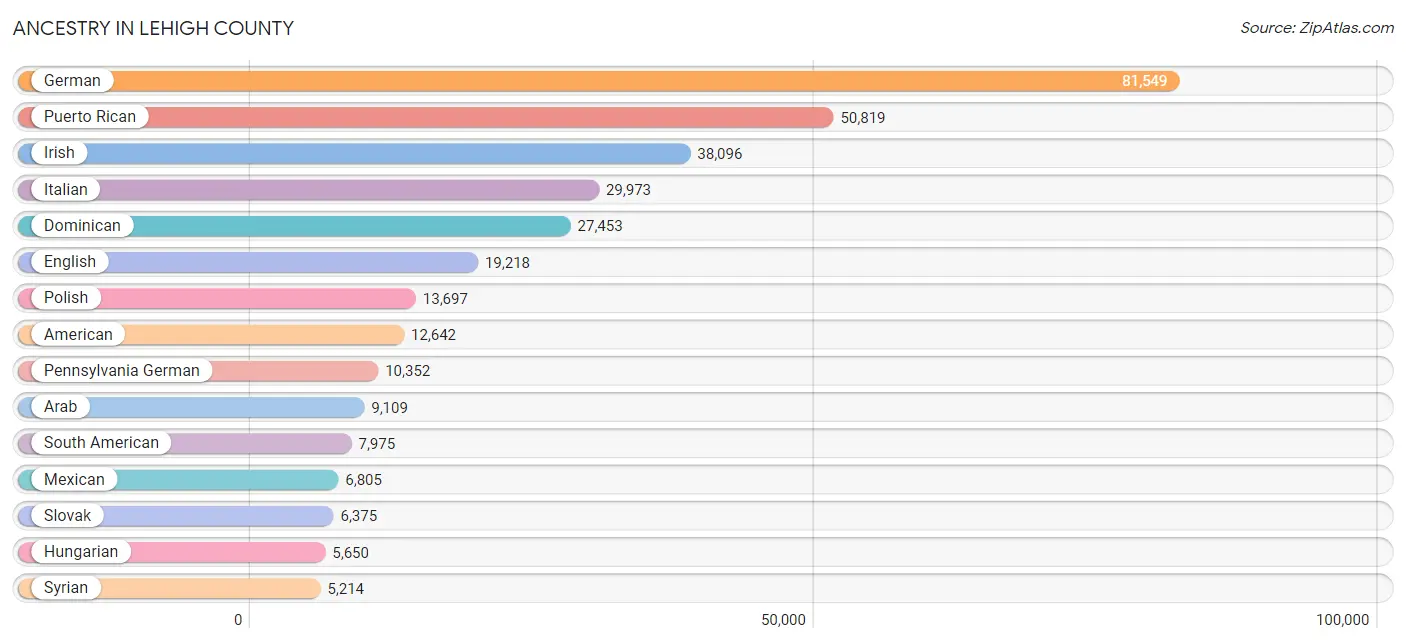
Ancestry in Lehigh County
The most populous ancestries reported in Lehigh County are German (81,549 | 21.8%), Puerto Rican (50,819 | 13.6%), Irish (38,096 | 10.2%), Italian (29,973 | 8.0%), and Dominican (27,453 | 7.3%), together accounting for 60.9% of all Lehigh County residents.
| Ancestry | # Population | % Population |
| Afghan | 75 | 0.0% |
| African | 1,114 | 0.3% |
| Alaskan Athabascan | 22 | 0.0% |
| Albanian | 67 | 0.0% |
| Alsatian | 47 | 0.0% |
| American | 12,642 | 3.4% |
| Apache | 4 | 0.0% |
| Arab | 9,109 | 2.4% |
| Argentinean | 277 | 0.1% |
| Armenian | 124 | 0.0% |
| Australian | 46 | 0.0% |
| Austrian | 4,177 | 1.1% |
| Barbadian | 89 | 0.0% |
| Basque | 33 | 0.0% |
| Belgian | 272 | 0.1% |
| Bhutanese | 830 | 0.2% |
| Blackfeet | 46 | 0.0% |
| Bolivian | 14 | 0.0% |
| Brazilian | 561 | 0.2% |
| British | 1,089 | 0.3% |
| British West Indian | 45 | 0.0% |
| Bulgarian | 16 | 0.0% |
| Burmese | 1,552 | 0.4% |
| Canadian | 358 | 0.1% |
| Carpatho Rusyn | 25 | 0.0% |
| Celtic | 93 | 0.0% |
| Central American | 3,795 | 1.0% |
| Central American Indian | 1,401 | 0.4% |
| Cherokee | 573 | 0.2% |
| Chickasaw | 7 | 0.0% |
| Chilean | 475 | 0.1% |
| Chippewa | 7 | 0.0% |
| Choctaw | 7 | 0.0% |
| Colombian | 2,372 | 0.6% |
| Costa Rican | 141 | 0.0% |
| Creek | 58 | 0.0% |
| Croatian | 188 | 0.1% |
| Crow | 13 | 0.0% |
| Cuban | 1,550 | 0.4% |
| Cypriot | 9 | 0.0% |
| Czech | 984 | 0.3% |
| Czechoslovakian | 805 | 0.2% |
| Danish | 562 | 0.2% |
| Delaware | 114 | 0.0% |
| Dominican | 27,453 | 7.3% |
| Dutch | 3,895 | 1.0% |
| Eastern European | 1,825 | 0.5% |
| Ecuadorian | 3,184 | 0.9% |
| Egyptian | 1,063 | 0.3% |
| English | 19,218 | 5.1% |
| Estonian | 13 | 0.0% |
| Ethiopian | 273 | 0.1% |
| European | 4,091 | 1.1% |
| Filipino | 9 | 0.0% |
| Finnish | 201 | 0.1% |
| French | 4,592 | 1.2% |
| French American Indian | 42 | 0.0% |
| French Canadian | 378 | 0.1% |
| German | 81,549 | 21.8% |
| Greek | 1,778 | 0.5% |
| Guamanian / Chamorro | 34 | 0.0% |
| Guatemalan | 778 | 0.2% |
| Guyanese | 110 | 0.0% |
| Haitian | 837 | 0.2% |
| Honduran | 1,436 | 0.4% |
| Hopi | 6 | 0.0% |
| Hungarian | 5,650 | 1.5% |
| Icelander | 20 | 0.0% |
| Indian (Asian) | 3,224 | 0.9% |
| Indonesian | 435 | 0.1% |
| Iranian | 52 | 0.0% |
| Iraqi | 185 | 0.1% |
| Irish | 38,096 | 10.2% |
| Iroquois | 63 | 0.0% |
| Israeli | 171 | 0.1% |
| Italian | 29,973 | 8.0% |
| Jamaican | 1,378 | 0.4% |
| Japanese | 545 | 0.2% |
| Jordanian | 165 | 0.0% |
| Kenyan | 454 | 0.1% |
| Kiowa | 3 | 0.0% |
| Korean | 840 | 0.2% |
| Latvian | 34 | 0.0% |
| Lebanese | 1,533 | 0.4% |
| Liberian | 48 | 0.0% |
| Lithuanian | 1,211 | 0.3% |
| Lumbee | 7 | 0.0% |
| Luxembourger | 11 | 0.0% |
| Macedonian | 20 | 0.0% |
| Malaysian | 18 | 0.0% |
| Mexican | 6,805 | 1.8% |
| Mexican American Indian | 68 | 0.0% |
| Mongolian | 117 | 0.0% |
| Moroccan | 204 | 0.1% |
| Native Hawaiian | 40 | 0.0% |
| Navajo | 75 | 0.0% |
| New Zealander | 28 | 0.0% |
| Nicaraguan | 199 | 0.1% |
| Nigerian | 274 | 0.1% |
| Northern European | 211 | 0.1% |
| Norwegian | 1,202 | 0.3% |
| Pakistani | 118 | 0.0% |
| Palestinian | 34 | 0.0% |
| Panamanian | 295 | 0.1% |
| Pennsylvania German | 10,352 | 2.8% |
| Peruvian | 748 | 0.2% |
| Pima | 12 | 0.0% |
| Polish | 13,697 | 3.7% |
| Portuguese | 606 | 0.2% |
| Puerto Rican | 50,819 | 13.6% |
| Romanian | 488 | 0.1% |
| Russian | 3,282 | 0.9% |
| Salvadoran | 877 | 0.2% |
| Samoan | 8 | 0.0% |
| Scandinavian | 482 | 0.1% |
| Scotch-Irish | 1,586 | 0.4% |
| Scottish | 3,466 | 0.9% |
| Senegalese | 79 | 0.0% |
| Serbian | 428 | 0.1% |
| Sierra Leonean | 1 | 0.0% |
| Sioux | 90 | 0.0% |
| Slavic | 281 | 0.1% |
| Slovak | 6,375 | 1.7% |
| Slovene | 197 | 0.1% |
| South American | 7,975 | 2.1% |
| South American Indian | 172 | 0.1% |
| Spaniard | 395 | 0.1% |
| Spanish | 622 | 0.2% |
| Spanish American | 18 | 0.0% |
| Sri Lankan | 1,219 | 0.3% |
| Subsaharan African | 2,936 | 0.8% |
| Sudanese | 116 | 0.0% |
| Swedish | 1,908 | 0.5% |
| Swiss | 833 | 0.2% |
| Syrian | 5,214 | 1.4% |
| Thai | 4,837 | 1.3% |
| Tlingit-Haida | 12 | 0.0% |
| Trinidadian and Tobagonian | 292 | 0.1% |
| Turkish | 161 | 0.0% |
| U.S. Virgin Islander | 126 | 0.0% |
| Ugandan | 80 | 0.0% |
| Ukrainian | 4,133 | 1.1% |
| Uruguayan | 103 | 0.0% |
| Venezuelan | 519 | 0.1% |
| Vietnamese | 25 | 0.0% |
| Welsh | 4,144 | 1.1% |
| West Indian | 556 | 0.2% |
| Yugoslavian | 166 | 0.0% | View All 148 Rows |
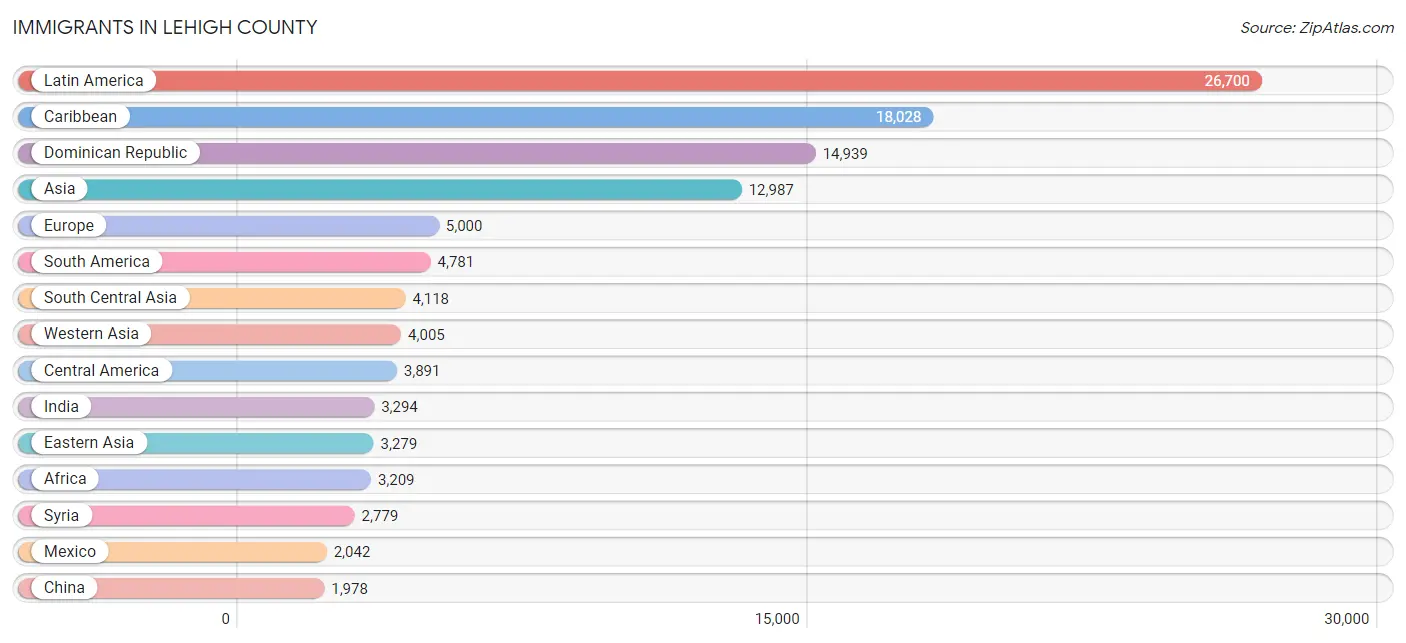
Immigrants in Lehigh County
The most numerous immigrant groups reported in Lehigh County came from Latin America (26,700 | 7.1%), Caribbean (18,028 | 4.8%), Dominican Republic (14,939 | 4.0%), Asia (12,987 | 3.5%), and Europe (5,000 | 1.3%), together accounting for 20.8% of all Lehigh County residents.
| Immigration Origin | # Population | % Population |
| Afghanistan | 31 | 0.0% |
| Africa | 3,209 | 0.9% |
| Argentina | 138 | 0.0% |
| Armenia | 9 | 0.0% |
| Asia | 12,987 | 3.5% |
| Australia | 83 | 0.0% |
| Austria | 52 | 0.0% |
| Bangladesh | 19 | 0.0% |
| Barbados | 104 | 0.0% |
| Belarus | 60 | 0.0% |
| Belgium | 30 | 0.0% |
| Bosnia and Herzegovina | 69 | 0.0% |
| Brazil | 378 | 0.1% |
| Bulgaria | 34 | 0.0% |
| Cambodia | 331 | 0.1% |
| Cameroon | 126 | 0.0% |
| Canada | 284 | 0.1% |
| Caribbean | 18,028 | 4.8% |
| Central America | 3,891 | 1.0% |
| Chile | 251 | 0.1% |
| China | 1,978 | 0.5% |
| Colombia | 1,141 | 0.3% |
| Congo | 16 | 0.0% |
| Costa Rica | 35 | 0.0% |
| Croatia | 55 | 0.0% |
| Cuba | 367 | 0.1% |
| Czechoslovakia | 85 | 0.0% |
| Denmark | 149 | 0.0% |
| Dominica | 820 | 0.2% |
| Dominican Republic | 14,939 | 4.0% |
| Eastern Africa | 1,453 | 0.4% |
| Eastern Asia | 3,279 | 0.9% |
| Eastern Europe | 1,697 | 0.4% |
| Ecuador | 1,805 | 0.5% |
| Egypt | 606 | 0.2% |
| El Salvador | 412 | 0.1% |
| England | 381 | 0.1% |
| Eritrea | 127 | 0.0% |
| Europe | 5,000 | 1.3% |
| France | 468 | 0.1% |
| Germany | 501 | 0.1% |
| Ghana | 45 | 0.0% |
| Greece | 355 | 0.1% |
| Grenada | 28 | 0.0% |
| Guatemala | 296 | 0.1% |
| Guyana | 107 | 0.0% |
| Haiti | 650 | 0.2% |
| Honduras | 867 | 0.2% |
| Hong Kong | 47 | 0.0% |
| Hungary | 110 | 0.0% |
| India | 3,294 | 0.9% |
| Indonesia | 7 | 0.0% |
| Iran | 94 | 0.0% |
| Iraq | 34 | 0.0% |
| Ireland | 26 | 0.0% |
| Israel | 120 | 0.0% |
| Italy | 485 | 0.1% |
| Jamaica | 890 | 0.2% |
| Japan | 307 | 0.1% |
| Jordan | 146 | 0.0% |
| Kenya | 1,077 | 0.3% |
| Korea | 994 | 0.3% |
| Kuwait | 33 | 0.0% |
| Laos | 9 | 0.0% |
| Latin America | 26,700 | 7.1% |
| Lebanon | 360 | 0.1% |
| Liberia | 81 | 0.0% |
| Lithuania | 23 | 0.0% |
| Malaysia | 146 | 0.0% |
| Mexico | 2,042 | 0.5% |
| Middle Africa | 218 | 0.1% |
| Moldova | 97 | 0.0% |
| Morocco | 136 | 0.0% |
| Nepal | 42 | 0.0% |
| Netherlands | 94 | 0.0% |
| Nicaragua | 38 | 0.0% |
| Nigeria | 268 | 0.1% |
| North Macedonia | 16 | 0.0% |
| Northern Africa | 827 | 0.2% |
| Northern Europe | 1,138 | 0.3% |
| Norway | 8 | 0.0% |
| Oceania | 106 | 0.0% |
| Pakistan | 638 | 0.2% |
| Panama | 201 | 0.1% |
| Peru | 429 | 0.1% |
| Philippines | 417 | 0.1% |
| Poland | 284 | 0.1% |
| Portugal | 136 | 0.0% |
| Romania | 305 | 0.1% |
| Russia | 235 | 0.1% |
| Saudi Arabia | 265 | 0.1% |
| Scotland | 18 | 0.0% |
| Senegal | 46 | 0.0% |
| Serbia | 178 | 0.1% |
| Sierra Leone | 9 | 0.0% |
| South Africa | 6 | 0.0% |
| South America | 4,781 | 1.3% |
| South Central Asia | 4,118 | 1.1% |
| South Eastern Asia | 1,563 | 0.4% |
| Southern Europe | 984 | 0.3% |
| Spain | 8 | 0.0% |
| St. Vincent and the Grenadines | 22 | 0.0% |
| Sudan | 76 | 0.0% |
| Sweden | 63 | 0.0% |
| Switzerland | 20 | 0.0% |
| Syria | 2,779 | 0.7% |
| Taiwan | 88 | 0.0% |
| Thailand | 33 | 0.0% |
| Trinidad and Tobago | 130 | 0.0% |
| Turkey | 139 | 0.0% |
| Uganda | 99 | 0.0% |
| Ukraine | 85 | 0.0% |
| Uruguay | 33 | 0.0% |
| Venezuela | 485 | 0.1% |
| Vietnam | 579 | 0.2% |
| West Indies | 14 | 0.0% |
| Western Africa | 638 | 0.2% |
| Western Asia | 4,005 | 1.1% |
| Western Europe | 1,165 | 0.3% |
| Zaire | 76 | 0.0% | View All 120 Rows |
Sex and Age in Lehigh County
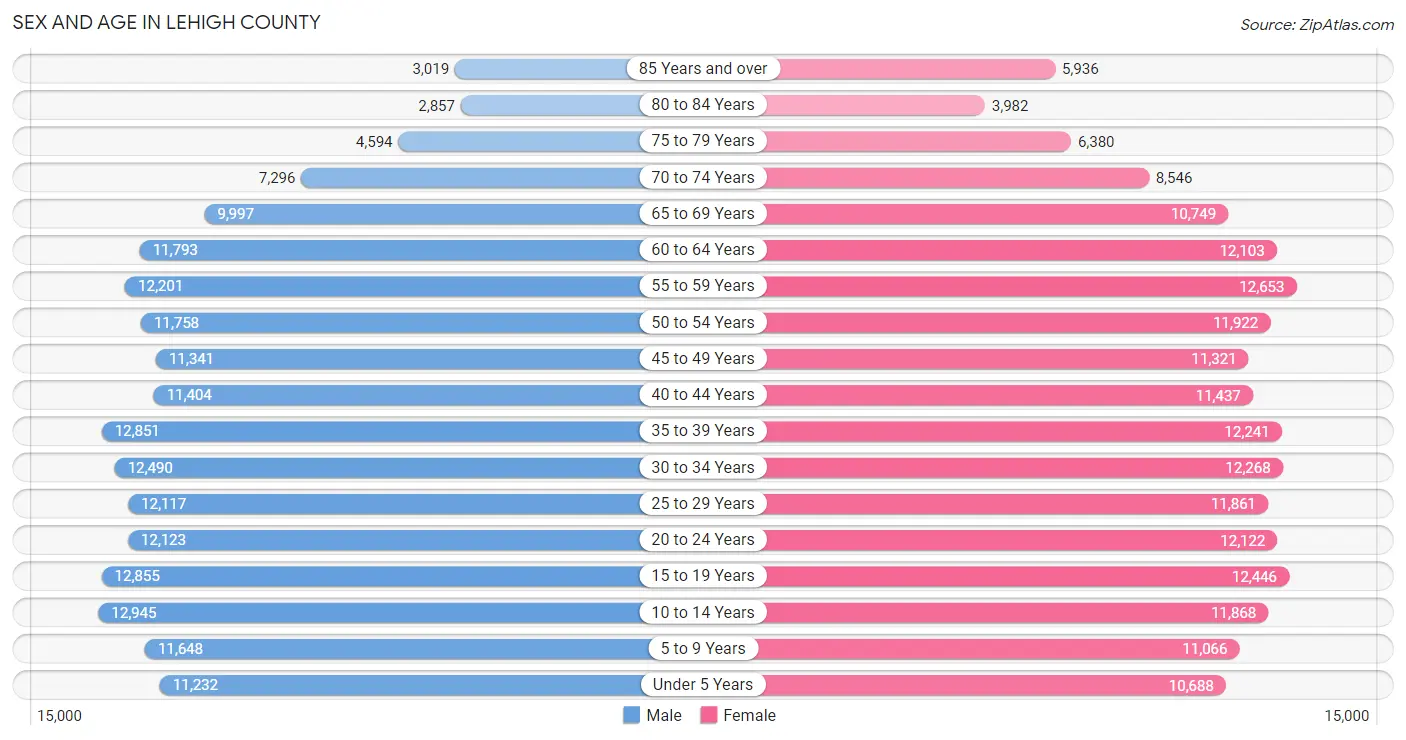
Sex and Age in Lehigh County
The most populous age groups in Lehigh County are 10 to 14 Years (12,945 | 7.0%) for men and 55 to 59 Years (12,653 | 6.7%) for women.
| Age Bracket | Male | Female |
| Under 5 Years | 11,232 (6.1%) | 10,688 (5.6%) |
| 5 to 9 Years | 11,648 (6.3%) | 11,066 (5.8%) |
| 10 to 14 Years | 12,945 (7.0%) | 11,868 (6.3%) |
| 15 to 19 Years | 12,855 (7.0%) | 12,446 (6.6%) |
| 20 to 24 Years | 12,123 (6.6%) | 12,122 (6.4%) |
| 25 to 29 Years | 12,117 (6.6%) | 11,861 (6.3%) |
| 30 to 34 Years | 12,490 (6.8%) | 12,268 (6.5%) |
| 35 to 39 Years | 12,851 (7.0%) | 12,241 (6.5%) |
| 40 to 44 Years | 11,404 (6.2%) | 11,437 (6.0%) |
| 45 to 49 Years | 11,341 (6.1%) | 11,321 (6.0%) |
| 50 to 54 Years | 11,758 (6.4%) | 11,922 (6.3%) |
| 55 to 59 Years | 12,201 (6.6%) | 12,653 (6.7%) |
| 60 to 64 Years | 11,793 (6.4%) | 12,103 (6.4%) |
| 65 to 69 Years | 9,997 (5.4%) | 10,749 (5.7%) |
| 70 to 74 Years | 7,296 (4.0%) | 8,546 (4.5%) |
| 75 to 79 Years | 4,594 (2.5%) | 6,380 (3.4%) |
| 80 to 84 Years | 2,857 (1.5%) | 3,982 (2.1%) |
| 85 Years and over | 3,019 (1.6%) | 5,936 (3.1%) |
| Total | 184,521 (100.0%) | 189,589 (100.0%) |
Families and Households in Lehigh County
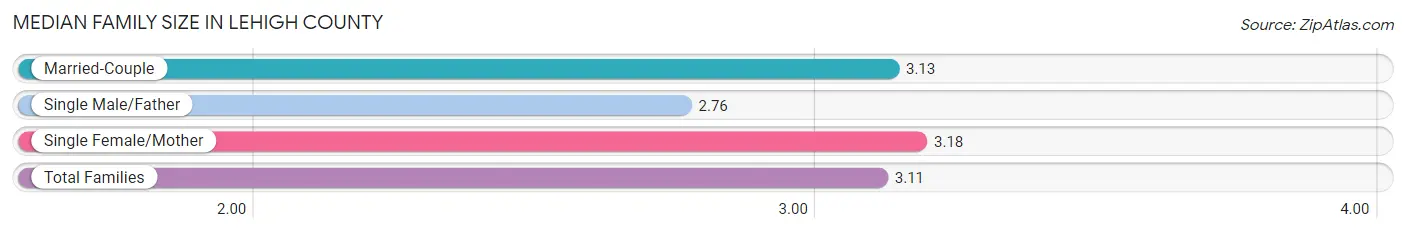
Median Family Size in Lehigh County
The median family size in Lehigh County is 3.11 persons per family, with single female/mother families (19,249 | 20.0%) accounting for the largest median family size of 3.18 persons per family. On the other hand, single male/father families (7,944 | 8.3%) represent the smallest median family size with 2.76 persons per family.
| Family Type | # Families | Family Size |
| Married-Couple | 68,971 (71.7%) | 3.13 |
| Single Male/Father | 7,944 (8.3%) | 2.76 |
| Single Female/Mother | 19,249 (20.0%) | 3.18 |
| Total Families | 96,164 (100.0%) | 3.11 |
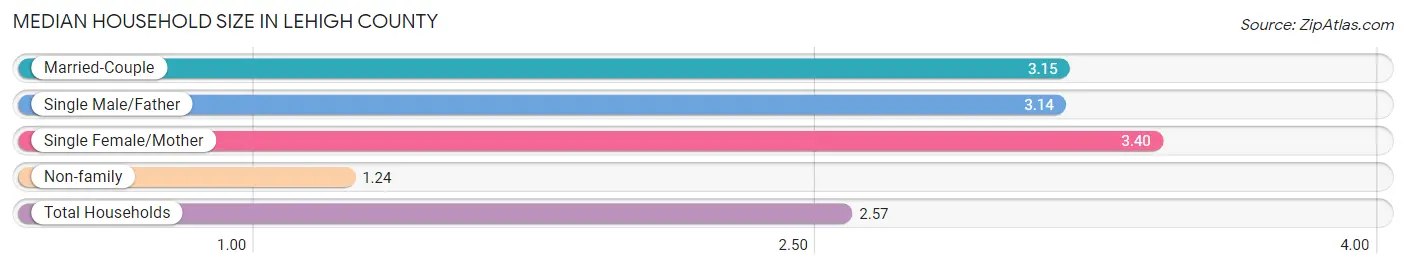
Median Household Size in Lehigh County
The median household size in Lehigh County is 2.57 persons per household, with single female/mother households (19,249 | 13.5%) accounting for the largest median household size of 3.4 persons per household. non-family households (45,996 | 32.4%) represent the smallest median household size with 1.24 persons per household.
| Household Type | # Households | Household Size |
| Married-Couple | 68,971 (48.5%) | 3.15 |
| Single Male/Father | 7,944 (5.6%) | 3.14 |
| Single Female/Mother | 19,249 (13.5%) | 3.40 |
| Non-family | 45,996 (32.4%) | 1.24 |
| Total Households | 142,160 (100.0%) | 2.57 |
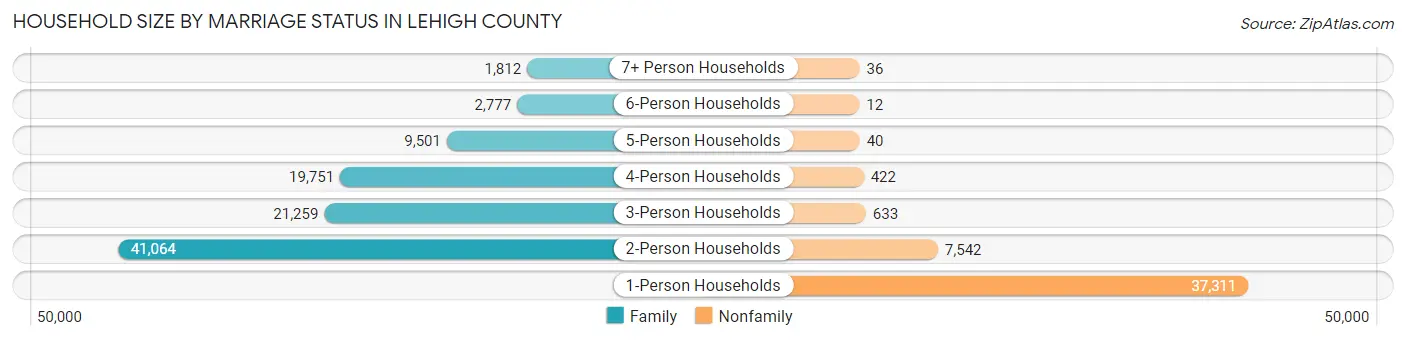
Household Size by Marriage Status in Lehigh County
Out of a total of 142,160 households in Lehigh County, 96,164 (67.6%) are family households, while 45,996 (32.4%) are nonfamily households. The most numerous type of family households are 2-person households, comprising 41,064, and the most common type of nonfamily households are 1-person households, comprising 37,311.
| Household Size | Family Households | Nonfamily Households |
| 1-Person Households | - | 37,311 (26.3%) |
| 2-Person Households | 41,064 (28.9%) | 7,542 (5.3%) |
| 3-Person Households | 21,259 (14.9%) | 633 (0.4%) |
| 4-Person Households | 19,751 (13.9%) | 422 (0.3%) |
| 5-Person Households | 9,501 (6.7%) | 40 (0.0%) |
| 6-Person Households | 2,777 (1.9%) | 12 (0.0%) |
| 7+ Person Households | 1,812 (1.3%) | 36 (0.0%) |
| Total | 96,164 (67.6%) | 45,996 (32.4%) |
Female Fertility in Lehigh County
Fertility by Age in Lehigh County
Average fertility rate in Lehigh County is 49.0 births per 1,000 women. Women in the age bracket of 20 to 34 years have the highest fertility rate with 93.0 births per 1,000 women. Women in the age bracket of 20 to 34 years acount for 79.4% of all women with births.
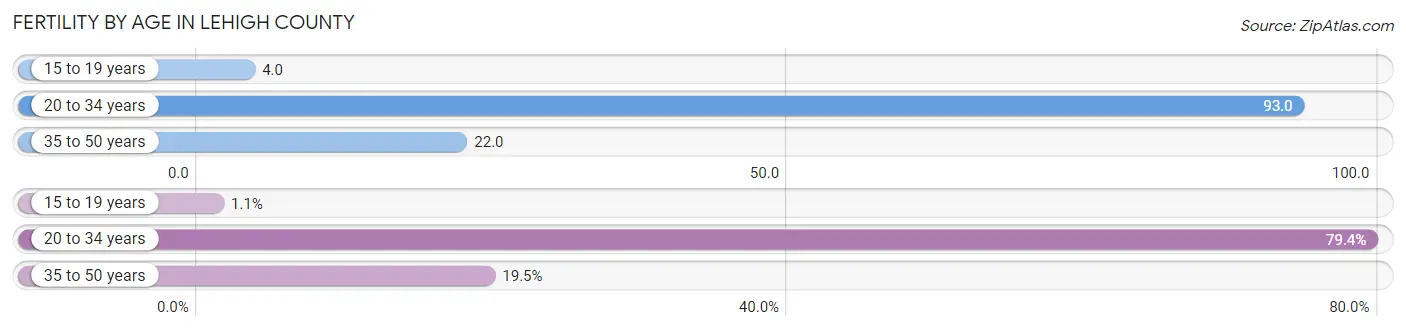
| Age Bracket | Women with Births | Births / 1,000 Women |
| 15 to 19 years | 46 (1.1%) | 4.0 |
| 20 to 34 years | 3,355 (79.4%) | 93.0 |
| 35 to 50 years | 824 (19.5%) | 22.0 |
| Total | 4,225 (100.0%) | 49.0 |
Fertility by Age by Marriage Status in Lehigh County
56.2% of women with births (4,225) in Lehigh County are married. The highest percentage of unmarried women with births falls into 15 to 19 years age bracket with 100.0% of them unmarried at the time of birth, while the lowest percentage of unmarried women with births belong to 35 to 50 years age bracket with 26.9% of them unmarried.
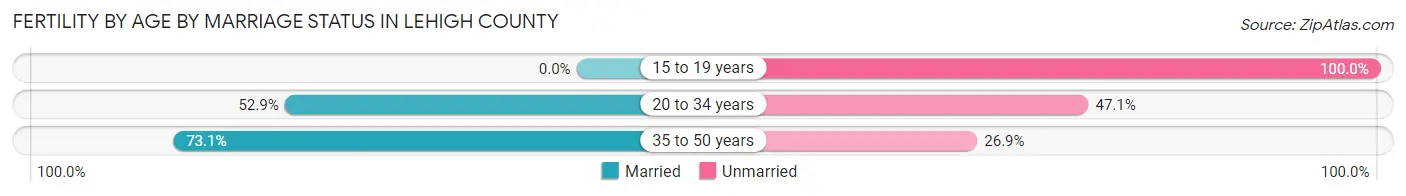
| Age Bracket | Married | Unmarried |
| 15 to 19 years | 0 (0.0%) | 46 (100.0%) |
| 20 to 34 years | 1,775 (52.9%) | 1,580 (47.1%) |
| 35 to 50 years | 602 (73.1%) | 222 (26.9%) |
| Total | 2,374 (56.2%) | 1,851 (43.8%) |
Fertility by Education in Lehigh County
Average fertility rate in Lehigh County is 49.0 births per 1,000 women. Women with the education attainment of graduate degree have the highest fertility rate of 73.0 births per 1,000 women, while women with the education attainment of less than high school have the lowest fertility at 19.0 births per 1,000 women. Women with the education attainment of high school diploma represent 30.6% of all women with births.
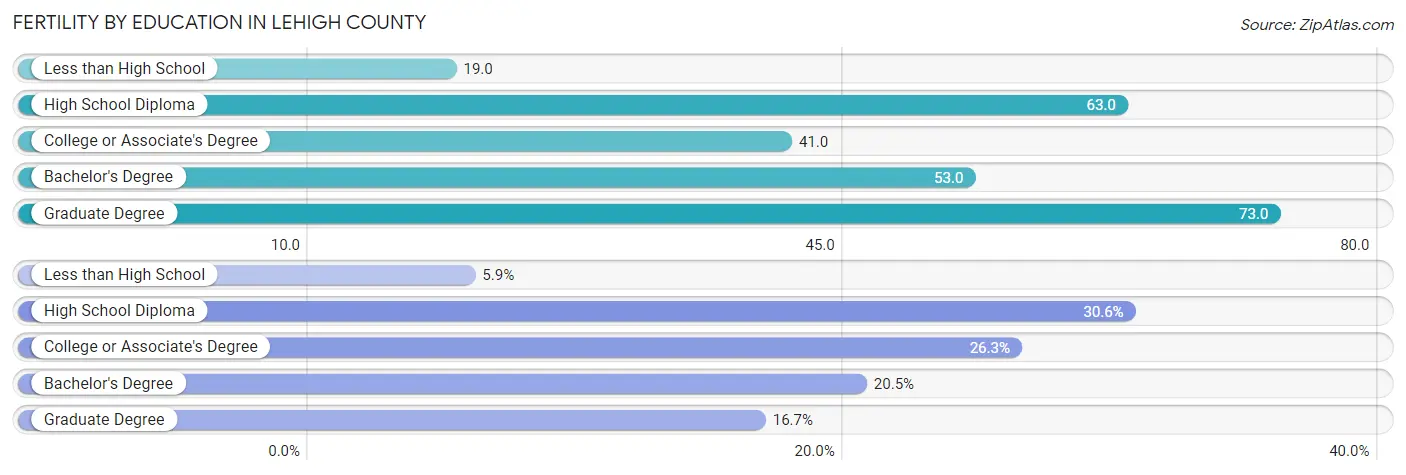
| Educational Attainment | Women with Births | Births / 1,000 Women |
| Less than High School | 247 (5.9%) | 19.0 |
| High School Diploma | 1,292 (30.6%) | 63.0 |
| College or Associate's Degree | 1,112 (26.3%) | 41.0 |
| Bachelor's Degree | 867 (20.5%) | 53.0 |
| Graduate Degree | 707 (16.7%) | 73.0 |
| Total | 4,225 (100.0%) | 49.0 |
Fertility by Education by Marriage Status in Lehigh County
43.8% of women with births in Lehigh County are unmarried. Women with the educational attainment of bachelor's degree are most likely to be married with 91.1% of them married at childbirth, while women with the educational attainment of less than high school are least likely to be married with 90.7% of them unmarried at childbirth.
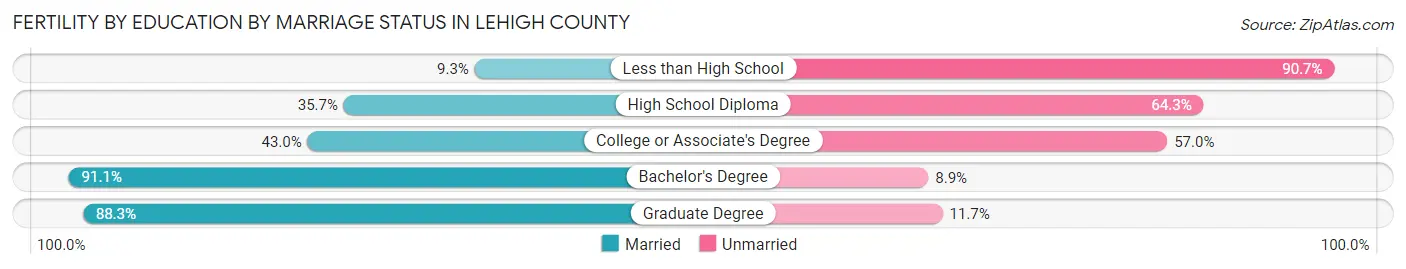
| Educational Attainment | Married | Unmarried |
| Less than High School | 23 (9.3%) | 224 (90.7%) |
| High School Diploma | 461 (35.7%) | 831 (64.3%) |
| College or Associate's Degree | 478 (43.0%) | 634 (57.0%) |
| Bachelor's Degree | 790 (91.1%) | 77 (8.9%) |
| Graduate Degree | 624 (88.3%) | 83 (11.7%) |
| Total | 2,374 (56.2%) | 1,851 (43.8%) |
Income in Lehigh County
Income Overview in Lehigh County
Per Capita Income in Lehigh County is $39,856, while median incomes of families and households are $91,531 and $74,973 respectively.
| Characteristic | Number | Measure |
| Per Capita Income | 374,110 | $39,856 |
| Median Family Income | 96,164 | $91,531 |
| Mean Family Income | 96,164 | $120,602 |
| Median Household Income | 142,160 | $74,973 |
| Mean Household Income | 142,160 | $102,938 |
| Income Deficit | 96,164 | $9,957 |
| Wage / Income Gap (%) | 374,110 | 31.79% |
| Wage / Income Gap ($) | 374,110 | 68.21¢ per $1 |
| Gini / Inequality Index | 374,110 | 0.46 |
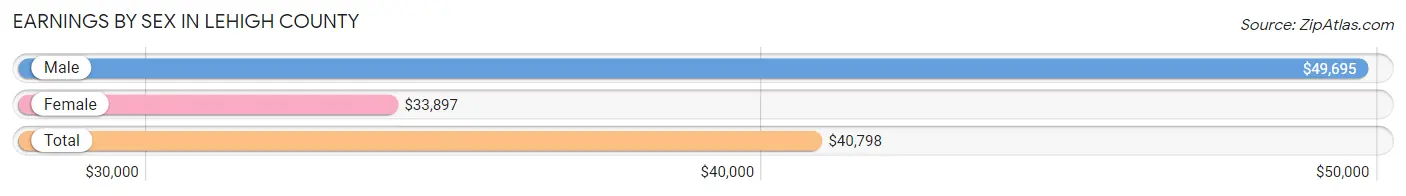
Earnings by Sex in Lehigh County
Average Earnings in Lehigh County are $40,798, $49,695 for men and $33,897 for women, a difference of 31.8%.
| Sex | Number | Average Earnings |
| Male | 105,956 (52.3%) | $49,695 |
| Female | 96,507 (47.7%) | $33,897 |
| Total | 202,463 (100.0%) | $40,798 |
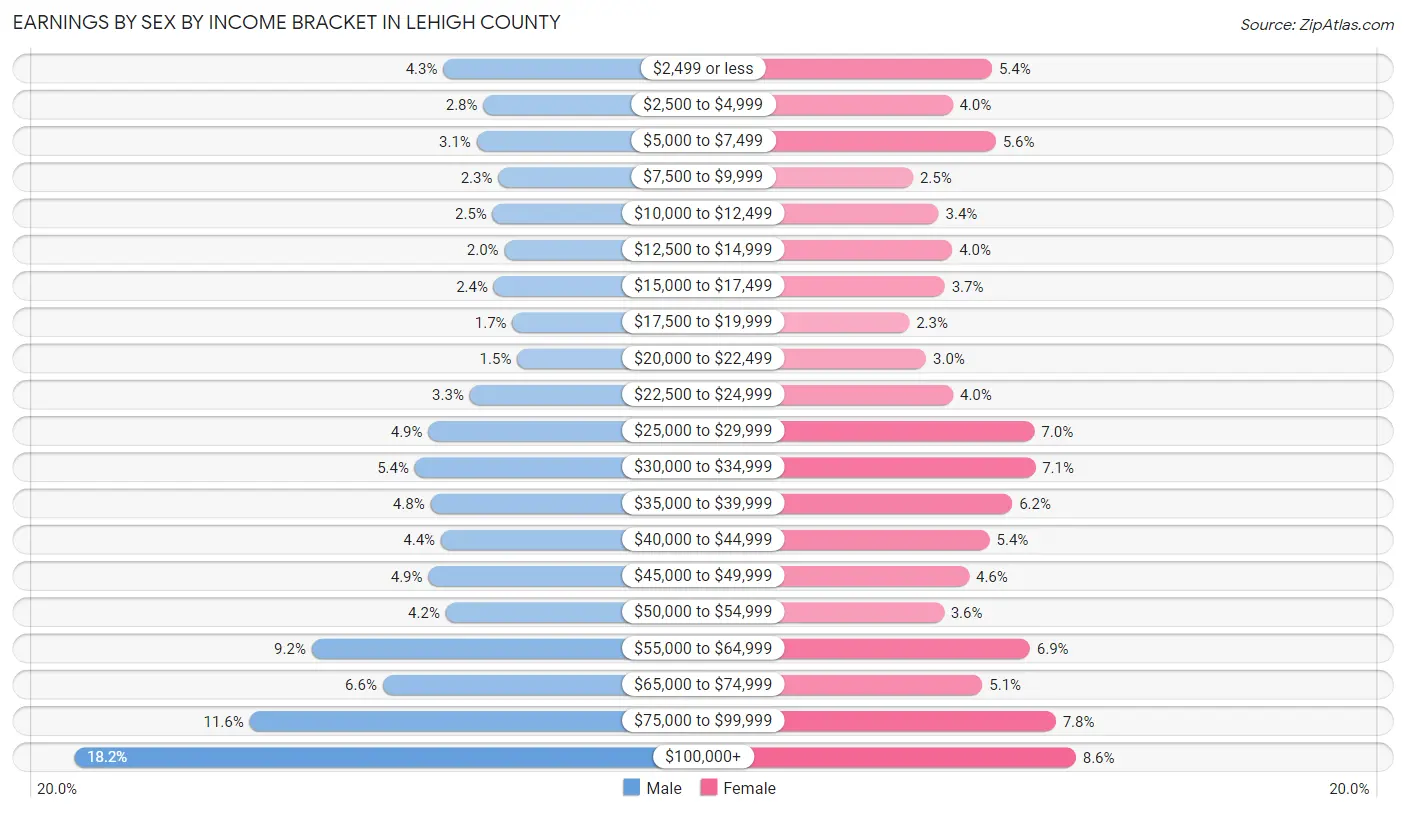
Earnings by Sex by Income Bracket in Lehigh County
The most common earnings brackets in Lehigh County are $100,000+ for men (19,231 | 18.1%) and $100,000+ for women (8,276 | 8.6%).
| Income | Male | Female |
| $2,499 or less | 4,571 (4.3%) | 5,253 (5.4%) |
| $2,500 to $4,999 | 2,982 (2.8%) | 3,822 (4.0%) |
| $5,000 to $7,499 | 3,246 (3.1%) | 5,385 (5.6%) |
| $7,500 to $9,999 | 2,388 (2.2%) | 2,392 (2.5%) |
| $10,000 to $12,499 | 2,605 (2.5%) | 3,321 (3.4%) |
| $12,500 to $14,999 | 2,136 (2.0%) | 3,808 (4.0%) |
| $15,000 to $17,499 | 2,566 (2.4%) | 3,539 (3.7%) |
| $17,500 to $19,999 | 1,822 (1.7%) | 2,258 (2.3%) |
| $20,000 to $22,499 | 1,629 (1.5%) | 2,862 (3.0%) |
| $22,500 to $24,999 | 3,522 (3.3%) | 3,837 (4.0%) |
| $25,000 to $29,999 | 5,155 (4.9%) | 6,788 (7.0%) |
| $30,000 to $34,999 | 5,701 (5.4%) | 6,811 (7.1%) |
| $35,000 to $39,999 | 5,079 (4.8%) | 5,982 (6.2%) |
| $40,000 to $44,999 | 4,667 (4.4%) | 5,164 (5.3%) |
| $45,000 to $49,999 | 5,165 (4.9%) | 4,423 (4.6%) |
| $50,000 to $54,999 | 4,475 (4.2%) | 3,500 (3.6%) |
| $55,000 to $64,999 | 9,786 (9.2%) | 6,625 (6.9%) |
| $65,000 to $74,999 | 6,976 (6.6%) | 4,904 (5.1%) |
| $75,000 to $99,999 | 12,254 (11.6%) | 7,557 (7.8%) |
| $100,000+ | 19,231 (18.1%) | 8,276 (8.6%) |
| Total | 105,956 (100.0%) | 96,507 (100.0%) |
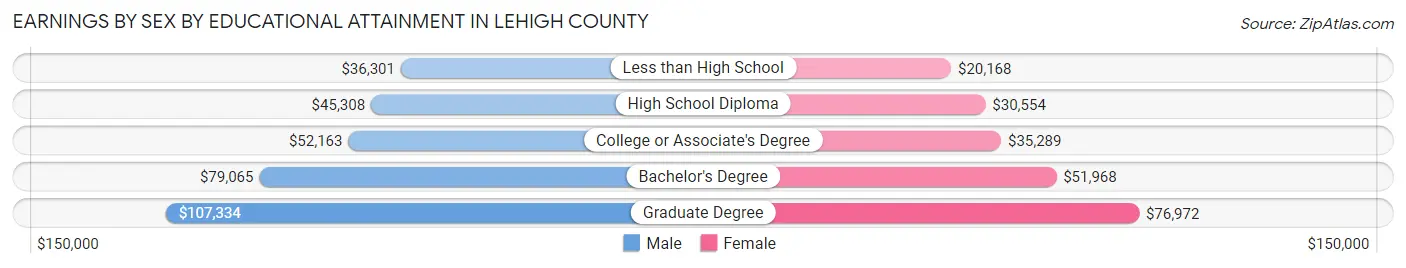
Earnings by Sex by Educational Attainment in Lehigh County
Average earnings in Lehigh County are $56,995 for men and $39,086 for women, a difference of 31.4%. Men with an educational attainment of graduate degree enjoy the highest average annual earnings of $107,334, while those with less than high school education earn the least with $36,301. Women with an educational attainment of graduate degree earn the most with the average annual earnings of $76,972, while those with less than high school education have the smallest earnings of $20,168.
| Educational Attainment | Male Income | Female Income |
| Less than High School | $36,301 | $20,168 |
| High School Diploma | $45,308 | $30,554 |
| College or Associate's Degree | $52,163 | $35,289 |
| Bachelor's Degree | $79,065 | $51,968 |
| Graduate Degree | $107,334 | $76,972 |
| Total | $56,995 | $39,086 |
Family Income in Lehigh County
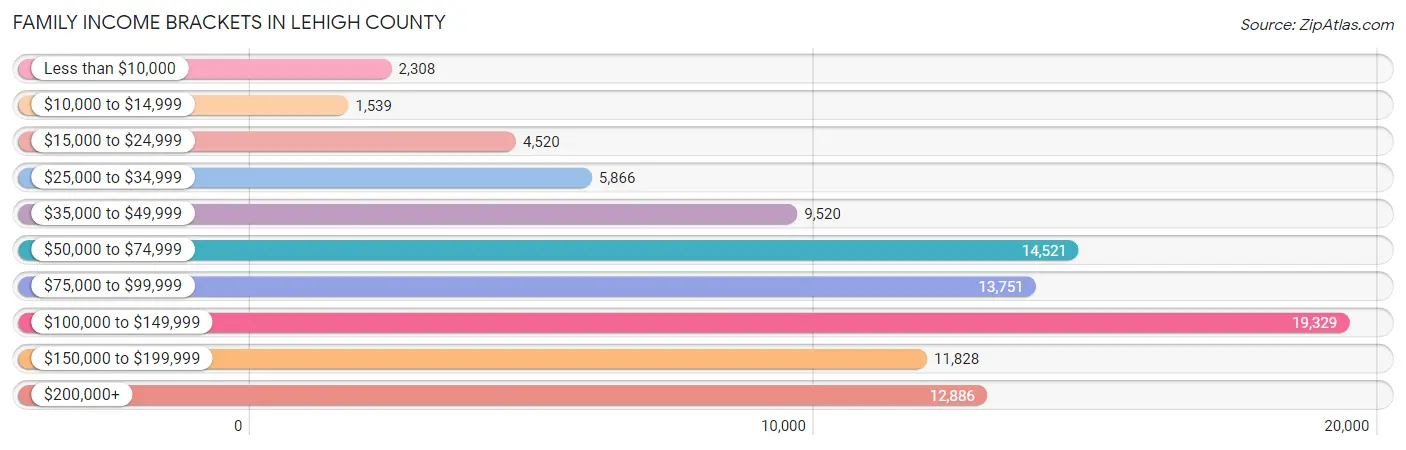
Family Income Brackets in Lehigh County
According to the Lehigh County family income data, there are 19,329 families falling into the $100,000 to $149,999 income range, which is the most common income bracket and makes up 20.1% of all families. Conversely, the $10,000 to $14,999 income bracket is the least frequent group with only 1,539 families (1.6%) belonging to this category.
| Income Bracket | # Families | % Families |
| Less than $10,000 | 2,308 | 2.4% |
| $10,000 to $14,999 | 1,539 | 1.6% |
| $15,000 to $24,999 | 4,520 | 4.7% |
| $25,000 to $34,999 | 5,866 | 6.1% |
| $35,000 to $49,999 | 9,520 | 9.9% |
| $50,000 to $74,999 | 14,521 | 15.1% |
| $75,000 to $99,999 | 13,751 | 14.3% |
| $100,000 to $149,999 | 19,329 | 20.1% |
| $150,000 to $199,999 | 11,828 | 12.3% |
| $200,000+ | 12,886 | 13.4% |
Family Income by Famaliy Size in Lehigh County
4-person families (18,522 | 19.3%) account for the highest median family income in Lehigh County with $115,149 per family, while 2-person families (44,265 | 46.0%) have the highest median income of $40,462 per family member.
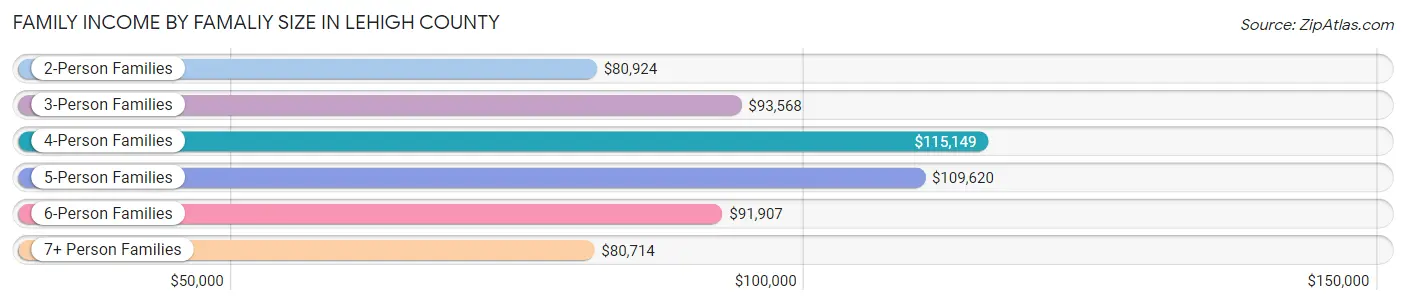
| Income Bracket | # Families | Median Income |
| 2-Person Families | 44,265 (46.0%) | $80,924 |
| 3-Person Families | 20,800 (21.6%) | $93,568 |
| 4-Person Families | 18,522 (19.3%) | $115,149 |
| 5-Person Families | 8,542 (8.9%) | $109,620 |
| 6-Person Families | 2,587 (2.7%) | $91,907 |
| 7+ Person Families | 1,448 (1.5%) | $80,714 |
| Total | 96,164 (100.0%) | $91,531 |
Family Income by Number of Earners in Lehigh County
The median family income in Lehigh County is $91,531, with families comprising 3+ earners (12,681) having the highest median family income of $139,137, while families with no earners (13,506) have the lowest median family income of $51,111, accounting for 13.2% and 14.0% of families, respectively.
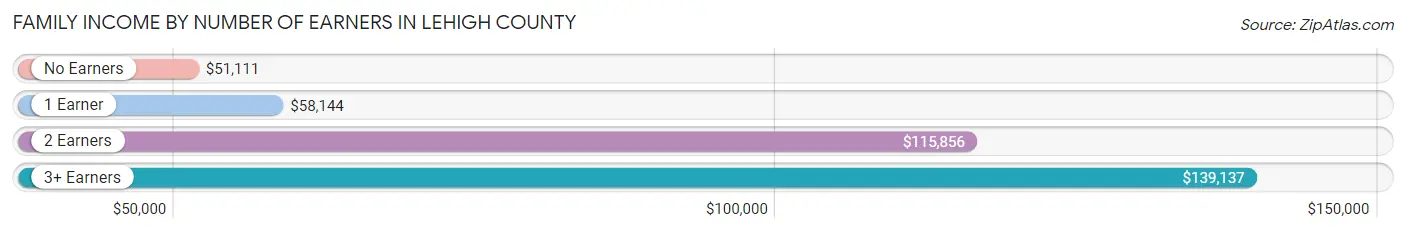
| Number of Earners | # Families | Median Income |
| No Earners | 13,506 (14.0%) | $51,111 |
| 1 Earner | 27,984 (29.1%) | $58,144 |
| 2 Earners | 41,993 (43.7%) | $115,856 |
| 3+ Earners | 12,681 (13.2%) | $139,137 |
| Total | 96,164 (100.0%) | $91,531 |
Household Income in Lehigh County
Household Income Brackets in Lehigh County
With 24,025 households falling in the category, the $50,000 to $74,999 income range is the most frequent in Lehigh County, accounting for 16.9% of all households. In contrast, only 4,691 households (3.3%) fall into the $10,000 to $14,999 income bracket, making it the least populous group.
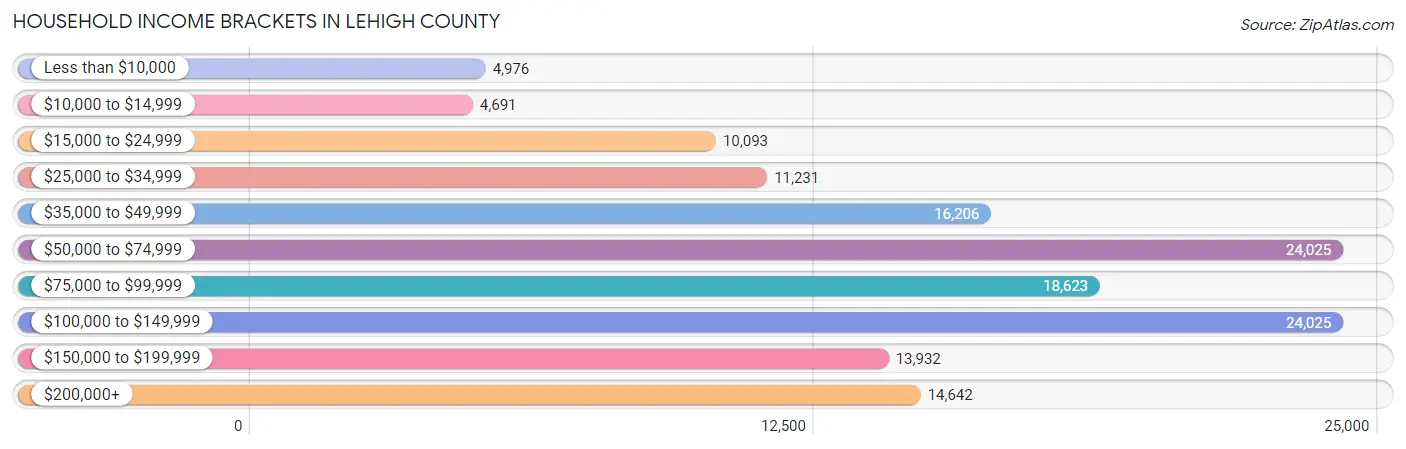
| Income Bracket | # Households | % Households |
| Less than $10,000 | 4,976 | 3.5% |
| $10,000 to $14,999 | 4,691 | 3.3% |
| $15,000 to $24,999 | 10,093 | 7.1% |
| $25,000 to $34,999 | 11,231 | 7.9% |
| $35,000 to $49,999 | 16,206 | 11.4% |
| $50,000 to $74,999 | 24,025 | 16.9% |
| $75,000 to $99,999 | 18,623 | 13.1% |
| $100,000 to $149,999 | 24,025 | 16.9% |
| $150,000 to $199,999 | 13,932 | 9.8% |
| $200,000+ | 14,642 | 10.3% |
Household Income by Householder Age in Lehigh County
The median household income in Lehigh County is $74,973, with the highest median household income of $93,496 found in the 45 to 64 years age bracket for the primary householder. A total of 54,280 households (38.2%) fall into this category. Meanwhile, the 15 to 24 years age bracket for the primary householder has the lowest median household income of $39,096, with 4,104 households (2.9%) in this group.
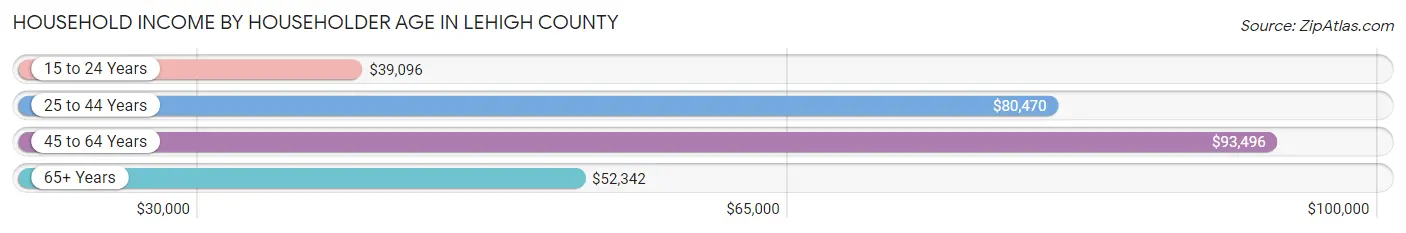
| Income Bracket | # Households | Median Income |
| 15 to 24 Years | 4,104 (2.9%) | $39,096 |
| 25 to 44 Years | 46,021 (32.4%) | $80,470 |
| 45 to 64 Years | 54,280 (38.2%) | $93,496 |
| 65+ Years | 37,755 (26.6%) | $52,342 |
| Total | 142,160 (100.0%) | $74,973 |
Poverty in Lehigh County
Income Below Poverty by Sex and Age in Lehigh County
With 11.3% poverty level for males and 12.6% for females among the residents of Lehigh County, 15 year old males and 5 year old females are the most vulnerable to poverty, with 665 males (27.8%) and 577 females (24.2%) in their respective age groups living below the poverty level.
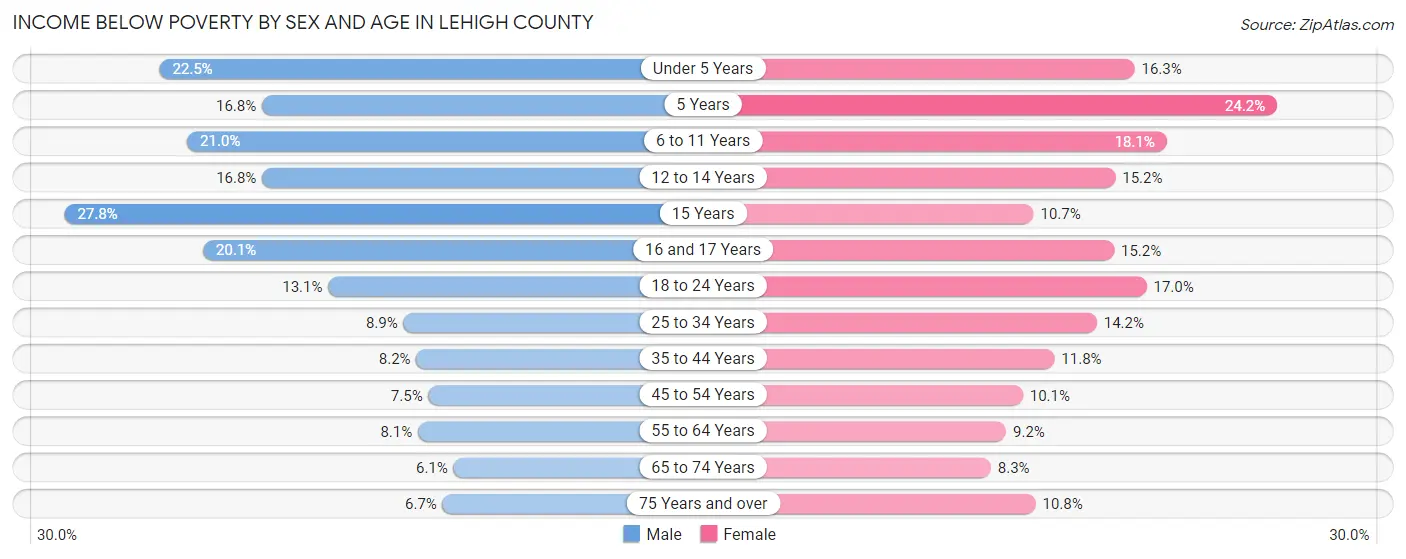
| Age Bracket | Male | Female |
| Under 5 Years | 2,512 (22.5%) | 1,716 (16.3%) |
| 5 Years | 367 (16.8%) | 577 (24.2%) |
| 6 to 11 Years | 2,876 (20.9%) | 2,396 (18.1%) |
| 12 to 14 Years | 1,381 (16.8%) | 1,075 (15.2%) |
| 15 Years | 665 (27.8%) | 267 (10.7%) |
| 16 and 17 Years | 1,076 (20.1%) | 724 (15.2%) |
| 18 to 24 Years | 2,025 (13.1%) | 2,492 (17.0%) |
| 25 to 34 Years | 2,157 (8.9%) | 3,407 (14.2%) |
| 35 to 44 Years | 1,962 (8.2%) | 2,798 (11.8%) |
| 45 to 54 Years | 1,725 (7.5%) | 2,341 (10.1%) |
| 55 to 64 Years | 1,926 (8.1%) | 2,249 (9.1%) |
| 65 to 74 Years | 1,047 (6.1%) | 1,571 (8.3%) |
| 75 Years and over | 669 (6.7%) | 1,586 (10.8%) |
| Total | 20,388 (11.3%) | 23,199 (12.6%) |
Income Above Poverty by Sex and Age in Lehigh County
According to the poverty statistics in Lehigh County, males aged 65 to 74 years and females aged 65 to 74 years are the age groups that are most secure financially, with 93.9% of males and 91.7% of females in these age groups living above the poverty line.
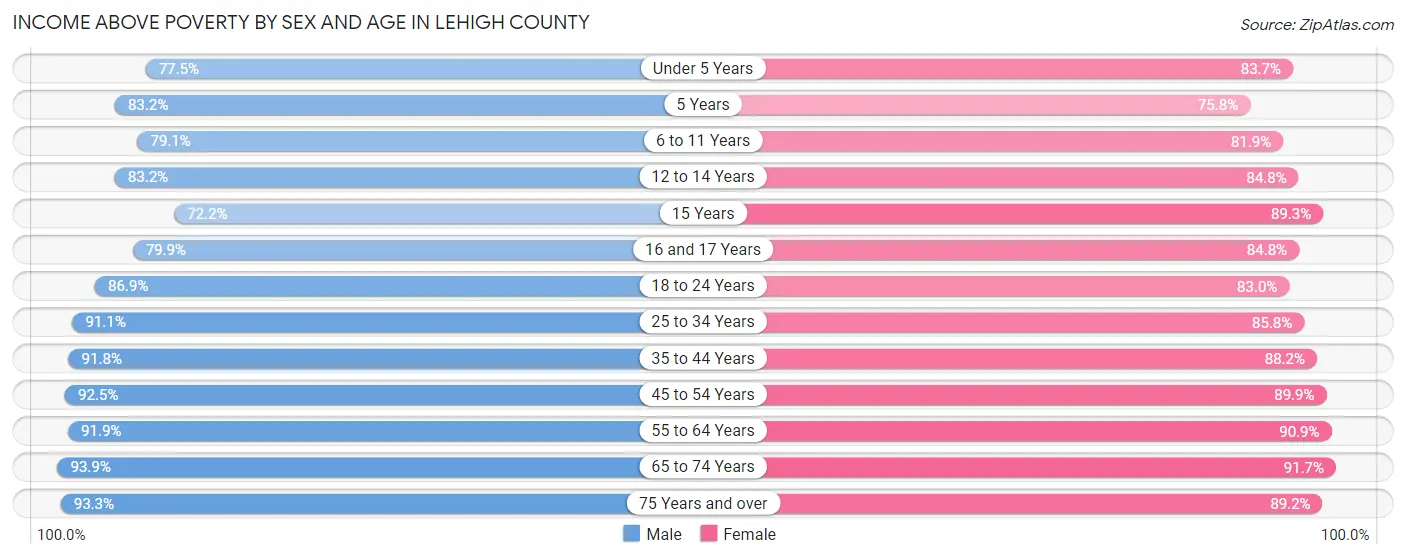
| Age Bracket | Male | Female |
| Under 5 Years | 8,655 (77.5%) | 8,809 (83.7%) |
| 5 Years | 1,820 (83.2%) | 1,803 (75.8%) |
| 6 to 11 Years | 10,855 (79.0%) | 10,850 (81.9%) |
| 12 to 14 Years | 6,856 (83.2%) | 5,983 (84.8%) |
| 15 Years | 1,729 (72.2%) | 2,232 (89.3%) |
| 16 and 17 Years | 4,284 (79.9%) | 4,052 (84.8%) |
| 18 to 24 Years | 13,443 (86.9%) | 12,195 (83.0%) |
| 25 to 34 Years | 22,069 (91.1%) | 20,593 (85.8%) |
| 35 to 44 Years | 22,011 (91.8%) | 20,832 (88.2%) |
| 45 to 54 Years | 21,255 (92.5%) | 20,880 (89.9%) |
| 55 to 64 Years | 21,889 (91.9%) | 22,331 (90.8%) |
| 65 to 74 Years | 16,075 (93.9%) | 17,357 (91.7%) |
| 75 Years and over | 9,286 (93.3%) | 13,116 (89.2%) |
| Total | 160,227 (88.7%) | 161,033 (87.4%) |
Income Below Poverty Among Married-Couple Families in Lehigh County
The poverty statistics for married-couple families in Lehigh County show that 4.2% or 2,916 of the total 68,971 families live below the poverty line. Families with 5 or more children have the highest poverty rate of 36.2%, comprising of 133 families. On the other hand, families with no children have the lowest poverty rate of 2.8%, which includes 1,110 families.
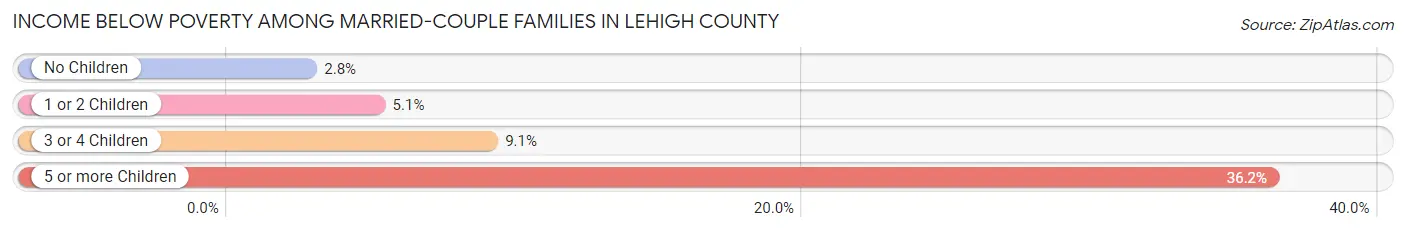
| Children | Above Poverty | Below Poverty |
| No Children | 39,132 (97.2%) | 1,110 (2.8%) |
| 1 or 2 Children | 21,692 (94.9%) | 1,175 (5.1%) |
| 3 or 4 Children | 4,997 (90.9%) | 498 (9.1%) |
| 5 or more Children | 234 (63.8%) | 133 (36.2%) |
| Total | 66,055 (95.8%) | 2,916 (4.2%) |
Income Below Poverty Among Single-Parent Households in Lehigh County
According to the poverty data in Lehigh County, 9.2% or 728 single-father households and 23.4% or 4,509 single-mother households are living below the poverty line. Among single-father households, those with 5 or more children have the highest poverty rate, with 23 households (79.3%) experiencing poverty. Likewise, among single-mother households, those with 5 or more children have the highest poverty rate, with 318 households (90.3%) falling below the poverty line.
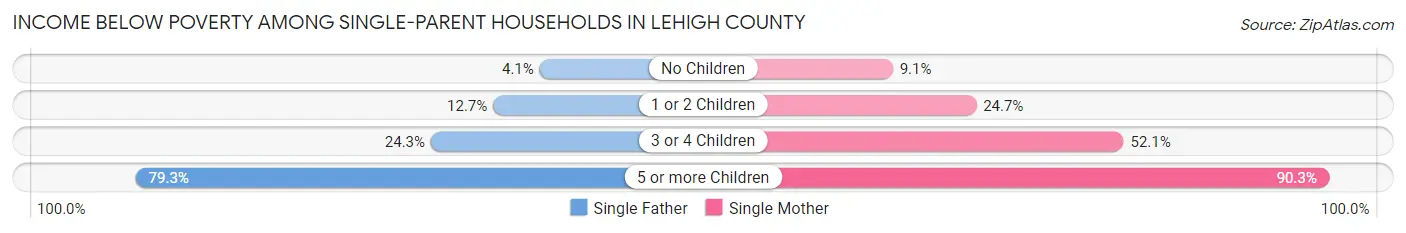
| Children | Single Father | Single Mother |
| No Children | 165 (4.1%) | 637 (9.1%) |
| 1 or 2 Children | 440 (12.7%) | 2,394 (24.7%) |
| 3 or 4 Children | 100 (24.3%) | 1,160 (52.1%) |
| 5 or more Children | 23 (79.3%) | 318 (90.3%) |
| Total | 728 (9.2%) | 4,509 (23.4%) |
Income Below Poverty Among Married-Couple vs Single-Parent Households in Lehigh County
The poverty data for Lehigh County shows that 2,916 of the married-couple family households (4.2%) and 5,237 of the single-parent households (19.3%) are living below the poverty level. Within the married-couple family households, those with 5 or more children have the highest poverty rate, with 133 households (36.2%) falling below the poverty line. Among the single-parent households, those with 5 or more children have the highest poverty rate, with 341 household (89.5%) living below poverty.
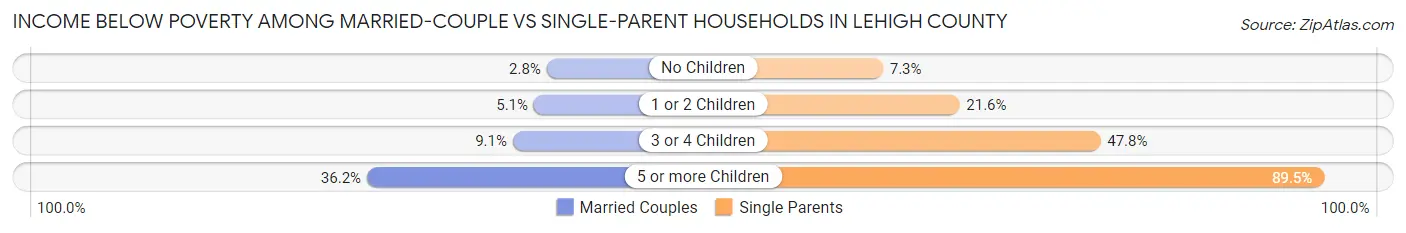
| Children | Married-Couple Families | Single-Parent Households |
| No Children | 1,110 (2.8%) | 802 (7.3%) |
| 1 or 2 Children | 1,175 (5.1%) | 2,834 (21.5%) |
| 3 or 4 Children | 498 (9.1%) | 1,260 (47.8%) |
| 5 or more Children | 133 (36.2%) | 341 (89.5%) |
| Total | 2,916 (4.2%) | 5,237 (19.3%) |
Employment Characteristics in Lehigh County
Employment by Class of Employer in Lehigh County
Among the 180,104 employed individuals in Lehigh County, private company employees (130,361 | 72.4%), not-for-profit organizations (22,527 | 12.5%), and local government employees (10,222 | 5.7%) make up the most common classes of employment.
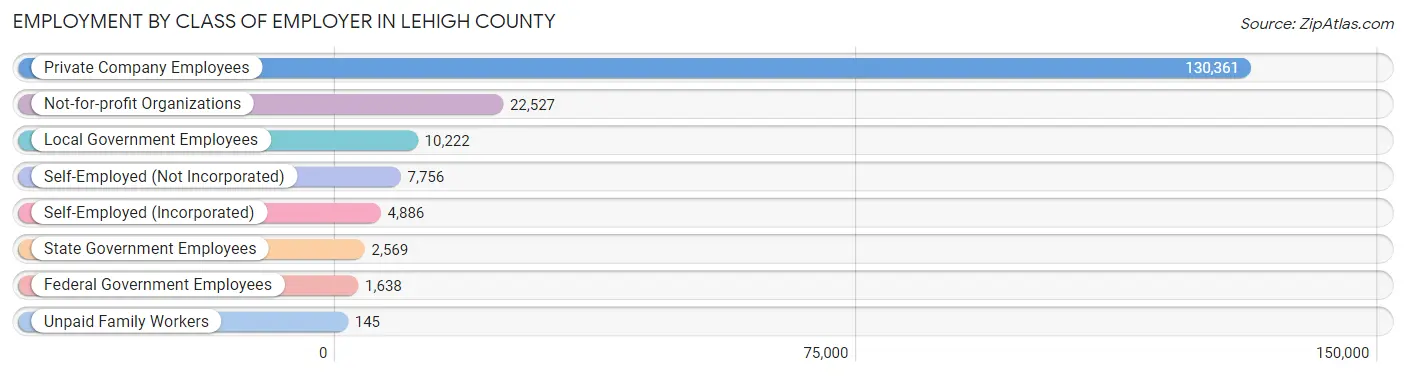
| Employer Class | # Employees | % Employees |
| Private Company Employees | 130,361 | 72.4% |
| Self-Employed (Incorporated) | 4,886 | 2.7% |
| Self-Employed (Not Incorporated) | 7,756 | 4.3% |
| Not-for-profit Organizations | 22,527 | 12.5% |
| Local Government Employees | 10,222 | 5.7% |
| State Government Employees | 2,569 | 1.4% |
| Federal Government Employees | 1,638 | 0.9% |
| Unpaid Family Workers | 145 | 0.1% |
| Total | 180,104 | 100.0% |
Employment Status by Age in Lehigh County
According to the labor force statistics for Lehigh County, out of the total population over 16 years of age (299,756), 64.9% or 194,542 individuals are in the labor force, with 5.8% or 11,283 of them unemployed. The age group with the highest labor force participation rate is 25 to 29 years, with 87.2% or 20,909 individuals in the labor force. Within the labor force, the 16 to 19 years age range has the highest percentage of unemployed individuals, with 16.0% or 1,416 of them being unemployed.
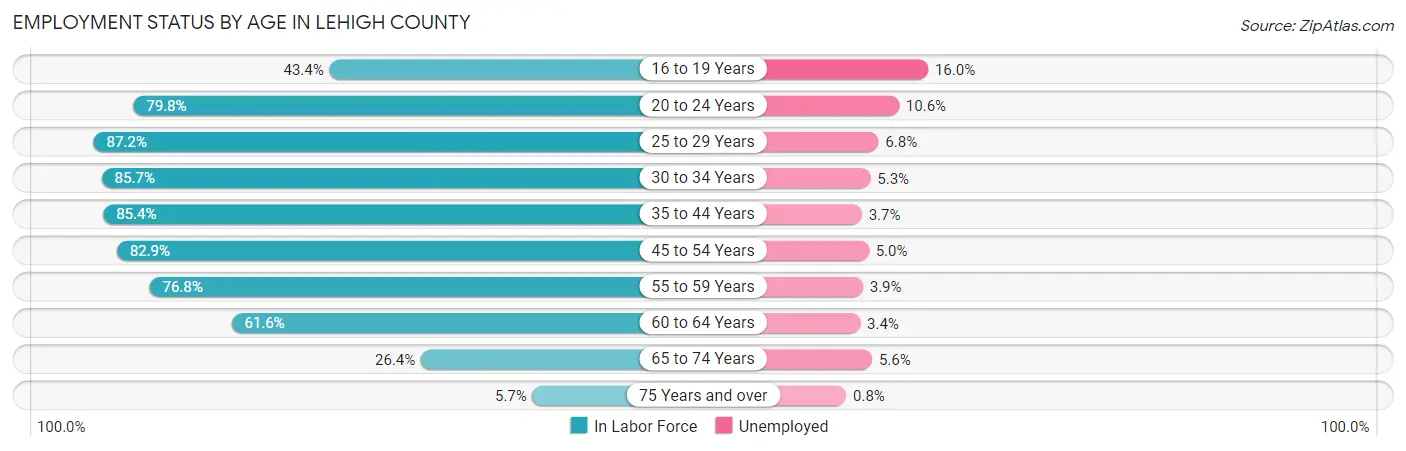
| Age Bracket | In Labor Force | Unemployed |
| 16 to 19 Years | 8,851 (43.4%) | 1,416 (16.0%) |
| 20 to 24 Years | 19,348 (79.8%) | 2,051 (10.6%) |
| 25 to 29 Years | 20,909 (87.2%) | 1,422 (6.8%) |
| 30 to 34 Years | 21,218 (85.7%) | 1,125 (5.3%) |
| 35 to 44 Years | 40,935 (85.4%) | 1,515 (3.7%) |
| 45 to 54 Years | 38,418 (82.9%) | 1,921 (5.0%) |
| 55 to 59 Years | 19,088 (76.8%) | 744 (3.9%) |
| 60 to 64 Years | 14,720 (61.6%) | 500 (3.4%) |
| 65 to 74 Years | 9,659 (26.4%) | 541 (5.6%) |
| 75 Years and over | 1,526 (5.7%) | 12 (0.8%) |
| Total | 194,542 (64.9%) | 11,283 (5.8%) |
Employment Status by Educational Attainment in Lehigh County
According to labor force statistics for Lehigh County, 81.0% of individuals (155,326) out of the total population between 25 and 64 years of age (191,761) are in the labor force, with 4.7% or 7,300 of them being unemployed. The group with the highest labor force participation rate are those with the educational attainment of bachelor's degree or higher, with 88.0% or 57,684 individuals in the labor force. Within the labor force, individuals with less than high school education have the highest percentage of unemployment, with 10.2% or 1,001 of them being unemployed.
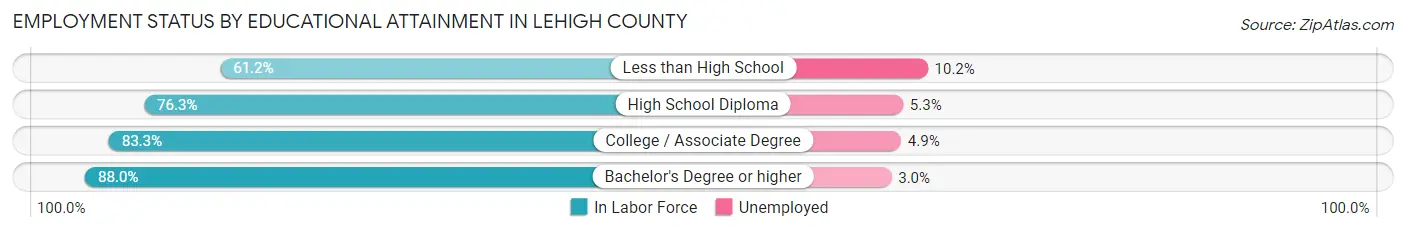
| Educational Attainment | In Labor Force | Unemployed |
| Less than High School | 9,816 (61.2%) | 1,636 (10.2%) |
| High School Diploma | 44,182 (76.3%) | 3,069 (5.3%) |
| College / Associate Degree | 43,538 (83.3%) | 2,561 (4.9%) |
| Bachelor's Degree or higher | 57,684 (88.0%) | 1,966 (3.0%) |
| Total | 155,326 (81.0%) | 9,013 (4.7%) |
Employment Occupations by Sex in Lehigh County
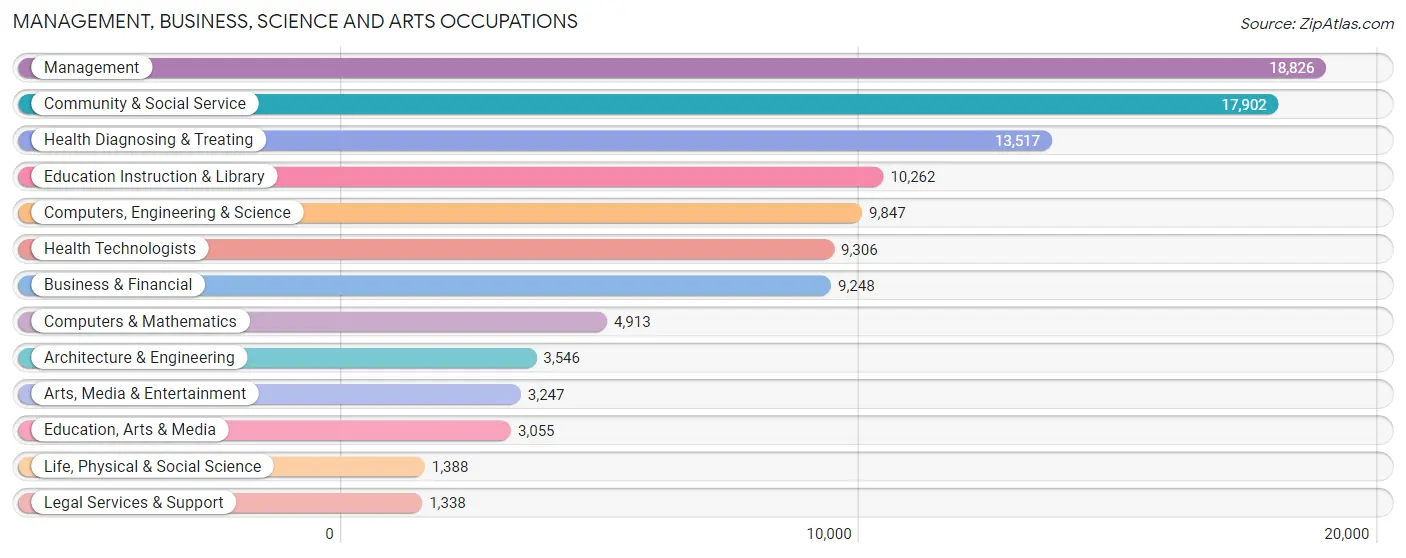
Management, Business, Science and Arts Occupations
The most common Management, Business, Science and Arts occupations in Lehigh County are Management (18,826 | 10.3%), Community & Social Service (17,902 | 9.8%), Health Diagnosing & Treating (13,517 | 7.4%), Education Instruction & Library (10,262 | 5.6%), and Computers, Engineering & Science (9,847 | 5.4%).
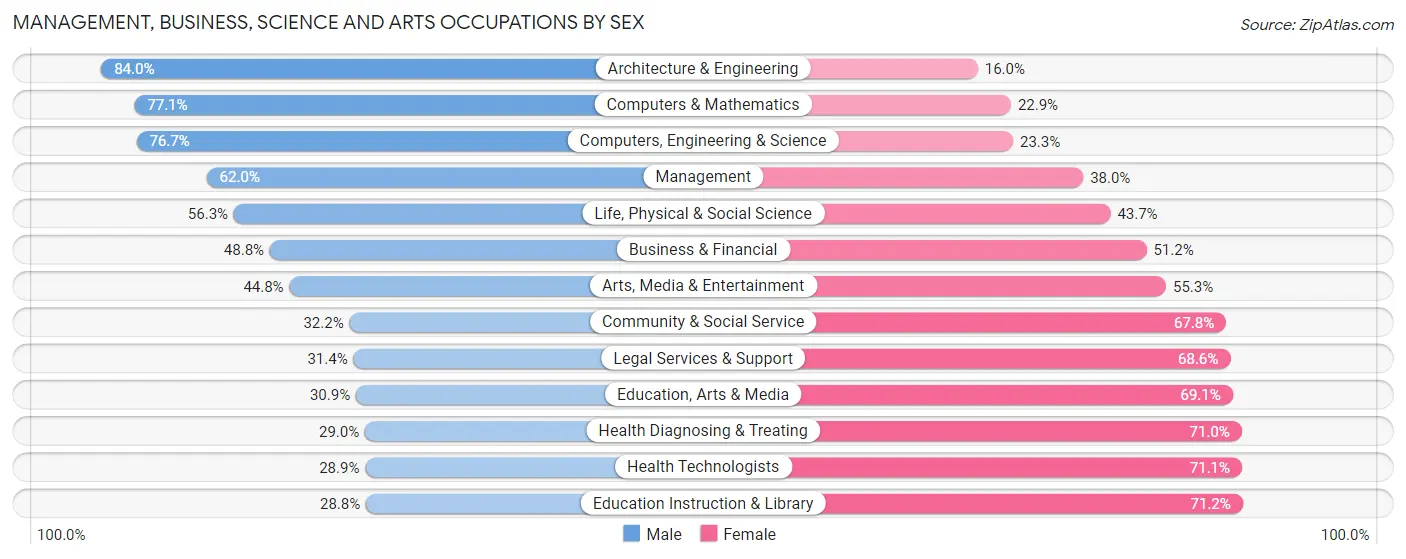
Management, Business, Science and Arts Occupations by Sex
Within the Management, Business, Science and Arts occupations in Lehigh County, the most male-oriented occupations are Architecture & Engineering (84.0%), Computers & Mathematics (77.1%), and Computers, Engineering & Science (76.7%), while the most female-oriented occupations are Education Instruction & Library (71.2%), Health Technologists (71.1%), and Health Diagnosing & Treating (71.0%).
| Occupation | Male | Female |
| Management | 11,678 (62.0%) | 7,148 (38.0%) |
| Business & Financial | 4,516 (48.8%) | 4,732 (51.2%) |
| Computers, Engineering & Science | 7,549 (76.7%) | 2,298 (23.3%) |
| Computers & Mathematics | 3,788 (77.1%) | 1,125 (22.9%) |
| Architecture & Engineering | 2,979 (84.0%) | 567 (16.0%) |
| Life, Physical & Social Science | 782 (56.3%) | 606 (43.7%) |
| Community & Social Service | 5,769 (32.2%) | 12,133 (67.8%) |
| Education, Arts & Media | 943 (30.9%) | 2,112 (69.1%) |
| Legal Services & Support | 420 (31.4%) | 918 (68.6%) |
| Education Instruction & Library | 2,953 (28.8%) | 7,309 (71.2%) |
| Arts, Media & Entertainment | 1,453 (44.8%) | 1,794 (55.2%) |
| Health Diagnosing & Treating | 3,917 (29.0%) | 9,600 (71.0%) |
| Health Technologists | 2,693 (28.9%) | 6,613 (71.1%) |
| Total (Category) | 33,429 (48.2%) | 35,911 (51.8%) |
| Total (Overall) | 96,896 (52.8%) | 86,469 (47.2%) |
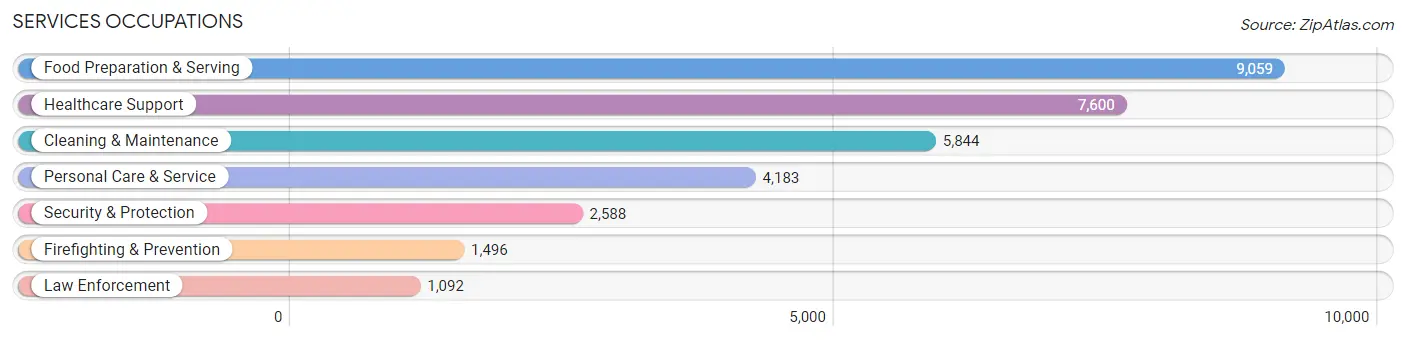
Services Occupations
The most common Services occupations in Lehigh County are Food Preparation & Serving (9,059 | 4.9%), Healthcare Support (7,600 | 4.1%), Cleaning & Maintenance (5,844 | 3.2%), Personal Care & Service (4,183 | 2.3%), and Security & Protection (2,588 | 1.4%).
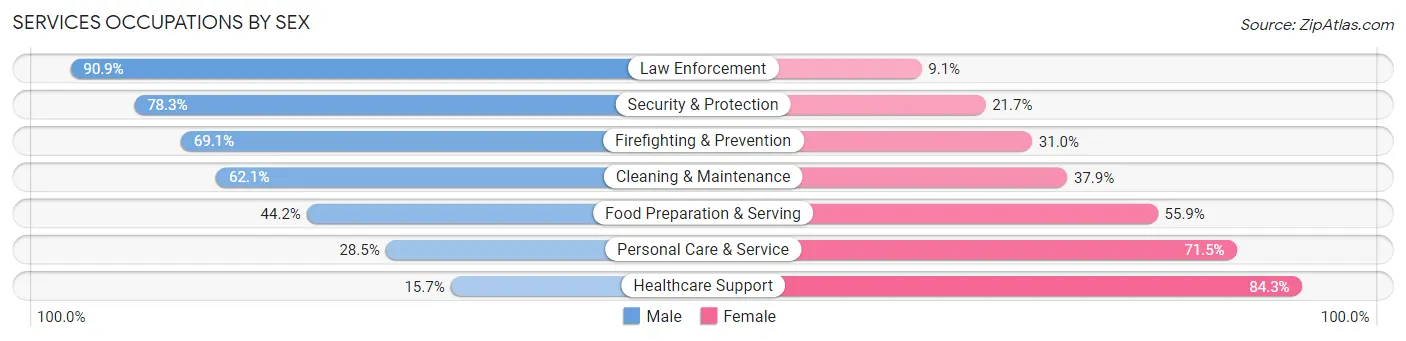
Services Occupations by Sex
Within the Services occupations in Lehigh County, the most male-oriented occupations are Law Enforcement (90.9%), Security & Protection (78.3%), and Firefighting & Prevention (69.1%), while the most female-oriented occupations are Healthcare Support (84.3%), Personal Care & Service (71.5%), and Food Preparation & Serving (55.8%).
| Occupation | Male | Female |
| Healthcare Support | 1,191 (15.7%) | 6,409 (84.3%) |
| Security & Protection | 2,026 (78.3%) | 562 (21.7%) |
| Firefighting & Prevention | 1,033 (69.1%) | 463 (30.9%) |
| Law Enforcement | 993 (90.9%) | 99 (9.1%) |
| Food Preparation & Serving | 4,000 (44.2%) | 5,059 (55.8%) |
| Cleaning & Maintenance | 3,628 (62.1%) | 2,216 (37.9%) |
| Personal Care & Service | 1,194 (28.5%) | 2,989 (71.5%) |
| Total (Category) | 12,039 (41.1%) | 17,235 (58.9%) |
| Total (Overall) | 96,896 (52.8%) | 86,469 (47.2%) |
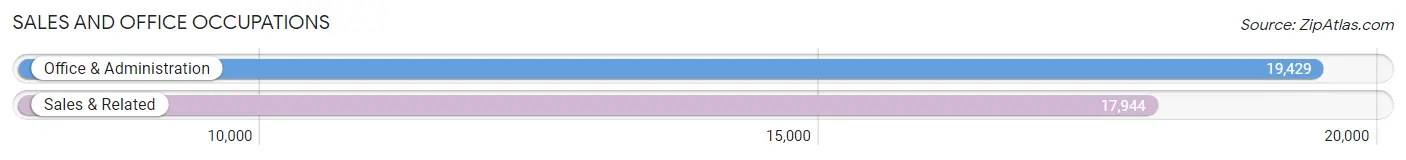
Sales and Office Occupations
The most common Sales and Office occupations in Lehigh County are Office & Administration (19,429 | 10.6%), and Sales & Related (17,944 | 9.8%).
Sales and Office Occupations by Sex
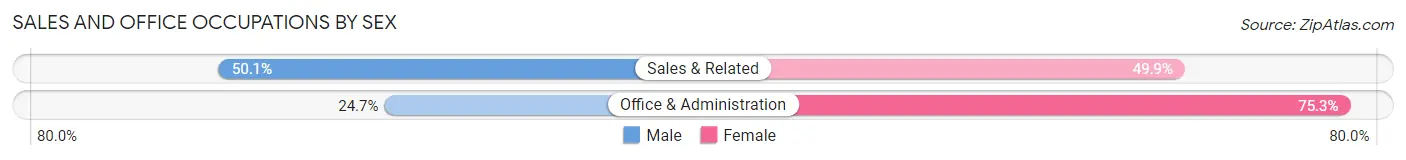
| Occupation | Male | Female |
| Sales & Related | 8,991 (50.1%) | 8,953 (49.9%) |
| Office & Administration | 4,791 (24.7%) | 14,638 (75.3%) |
| Total (Category) | 13,782 (36.9%) | 23,591 (63.1%) |
| Total (Overall) | 96,896 (52.8%) | 86,469 (47.2%) |
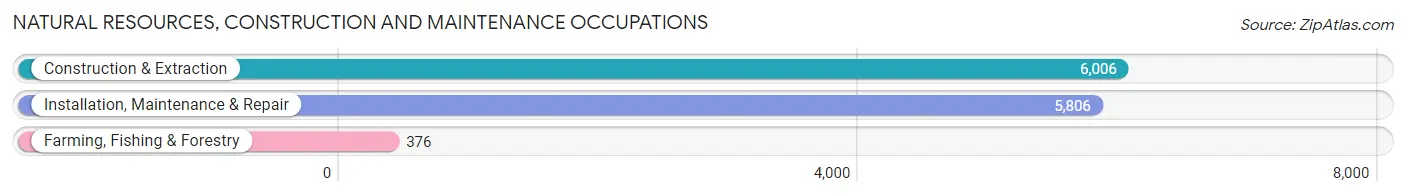
Natural Resources, Construction and Maintenance Occupations
The most common Natural Resources, Construction and Maintenance occupations in Lehigh County are Construction & Extraction (6,006 | 3.3%), Installation, Maintenance & Repair (5,806 | 3.2%), and Farming, Fishing & Forestry (376 | 0.2%).
Natural Resources, Construction and Maintenance Occupations by Sex
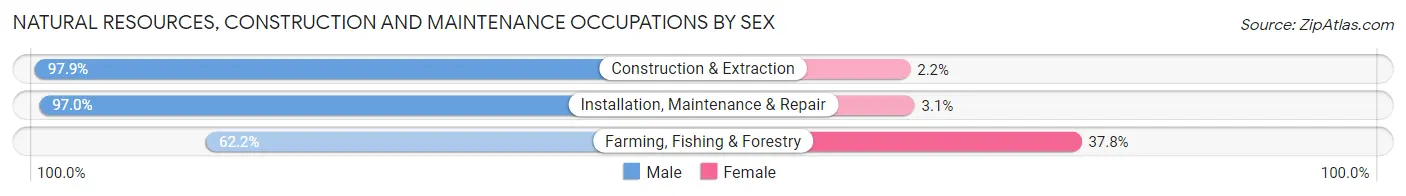
| Occupation | Male | Female |
| Farming, Fishing & Forestry | 234 (62.2%) | 142 (37.8%) |
| Construction & Extraction | 5,877 (97.9%) | 129 (2.1%) |
| Installation, Maintenance & Repair | 5,629 (97.0%) | 177 (3.0%) |
| Total (Category) | 11,740 (96.3%) | 448 (3.7%) |
| Total (Overall) | 96,896 (52.8%) | 86,469 (47.2%) |
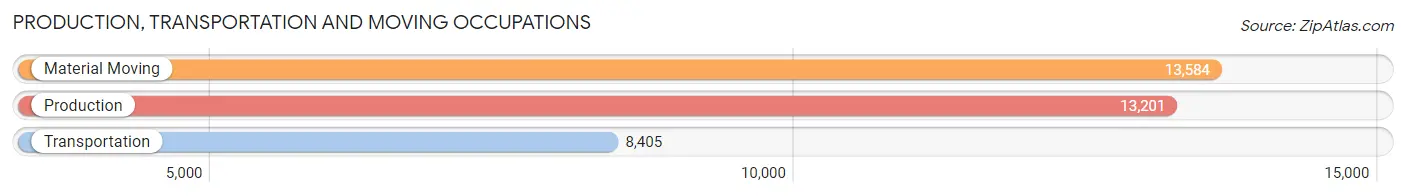
Production, Transportation and Moving Occupations
The most common Production, Transportation and Moving occupations in Lehigh County are Material Moving (13,584 | 7.4%), Production (13,201 | 7.2%), and Transportation (8,405 | 4.6%).
Production, Transportation and Moving Occupations by Sex
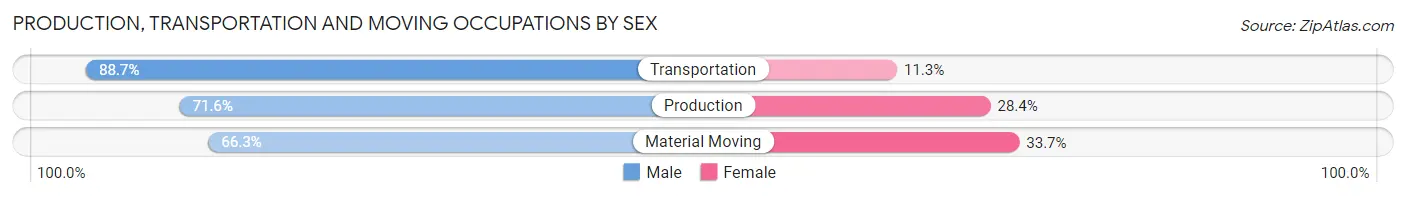
| Occupation | Male | Female |
| Production | 9,447 (71.6%) | 3,754 (28.4%) |
| Transportation | 7,457 (88.7%) | 948 (11.3%) |
| Material Moving | 9,002 (66.3%) | 4,582 (33.7%) |
| Total (Category) | 25,906 (73.6%) | 9,284 (26.4%) |
| Total (Overall) | 96,896 (52.8%) | 86,469 (47.2%) |
Employment Industries by Sex in Lehigh County
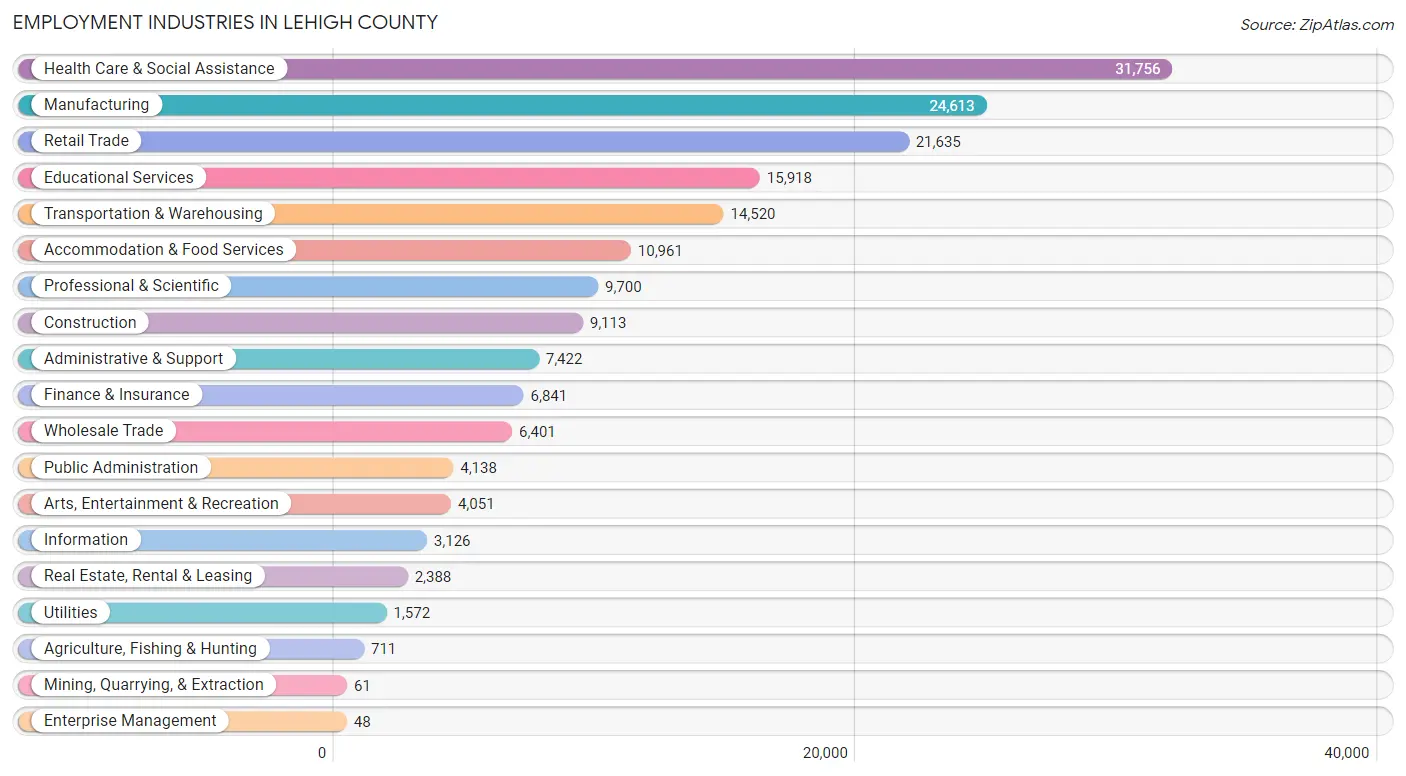
Employment Industries in Lehigh County
The major employment industries in Lehigh County include Health Care & Social Assistance (31,756 | 17.3%), Manufacturing (24,613 | 13.4%), Retail Trade (21,635 | 11.8%), Educational Services (15,918 | 8.7%), and Transportation & Warehousing (14,520 | 7.9%).
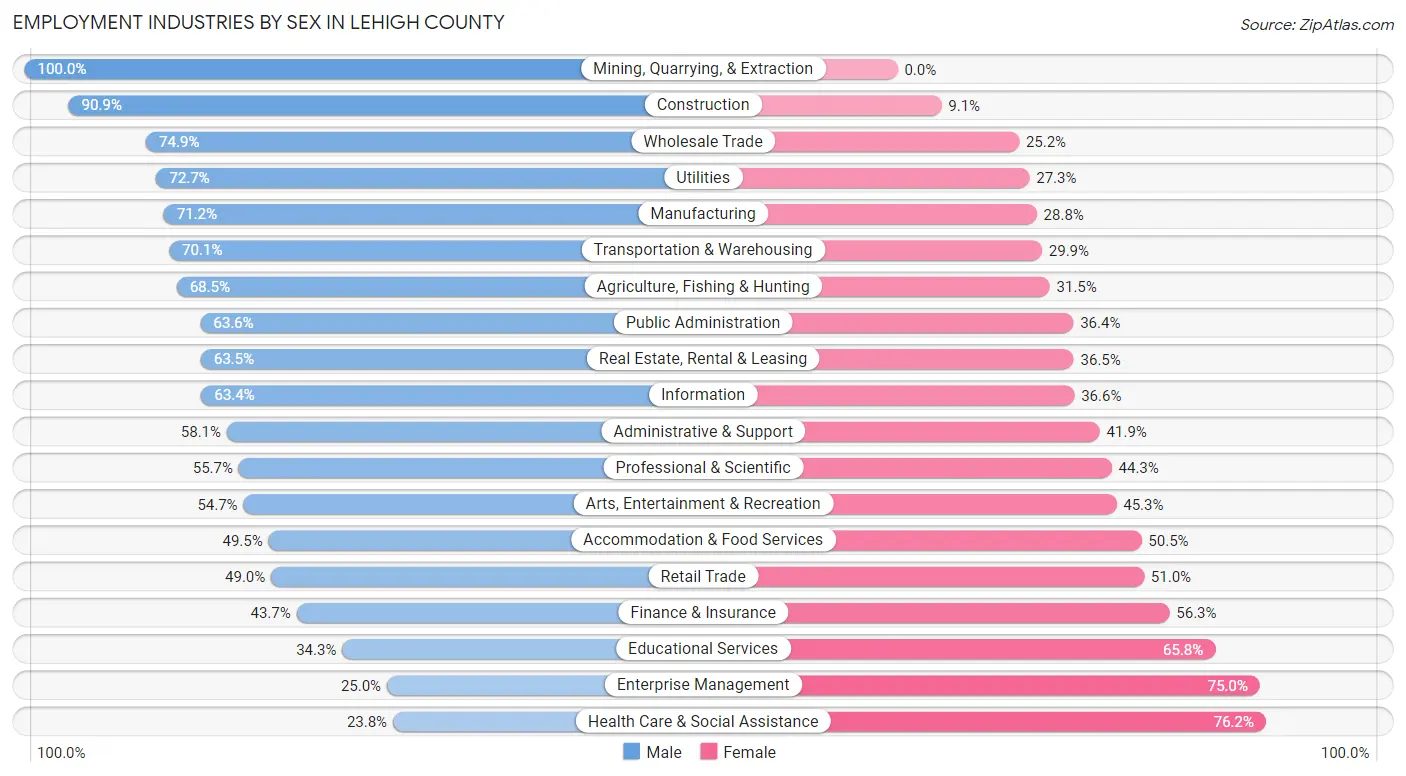
Employment Industries by Sex in Lehigh County
The Lehigh County industries that see more men than women are Mining, Quarrying, & Extraction (100.0%), Construction (90.9%), and Wholesale Trade (74.9%), whereas the industries that tend to have a higher number of women are Health Care & Social Assistance (76.2%), Enterprise Management (75.0%), and Educational Services (65.7%).
| Industry | Male | Female |
| Agriculture, Fishing & Hunting | 487 (68.5%) | 224 (31.5%) |
| Mining, Quarrying, & Extraction | 61 (100.0%) | 0 (0.0%) |
| Construction | 8,284 (90.9%) | 829 (9.1%) |
| Manufacturing | 17,519 (71.2%) | 7,094 (28.8%) |
| Wholesale Trade | 4,791 (74.9%) | 1,610 (25.2%) |
| Retail Trade | 10,597 (49.0%) | 11,038 (51.0%) |
| Transportation & Warehousing | 10,179 (70.1%) | 4,341 (29.9%) |
| Utilities | 1,143 (72.7%) | 429 (27.3%) |
| Information | 1,982 (63.4%) | 1,144 (36.6%) |
| Finance & Insurance | 2,990 (43.7%) | 3,851 (56.3%) |
| Real Estate, Rental & Leasing | 1,517 (63.5%) | 871 (36.5%) |
| Professional & Scientific | 5,400 (55.7%) | 4,300 (44.3%) |
| Enterprise Management | 12 (25.0%) | 36 (75.0%) |
| Administrative & Support | 4,315 (58.1%) | 3,107 (41.9%) |
| Educational Services | 5,452 (34.3%) | 10,466 (65.7%) |
| Health Care & Social Assistance | 7,544 (23.8%) | 24,212 (76.2%) |
| Arts, Entertainment & Recreation | 2,216 (54.7%) | 1,835 (45.3%) |
| Accommodation & Food Services | 5,426 (49.5%) | 5,535 (50.5%) |
| Public Administration | 2,632 (63.6%) | 1,506 (36.4%) |
| Total | 96,896 (52.8%) | 86,469 (47.2%) |
Education in Lehigh County
School Enrollment in Lehigh County
The most common levels of schooling among the 87,318 students in Lehigh County are high school (20,285 | 23.2%), middle school (19,803 | 22.7%), and elementary school (17,476 | 20.0%).
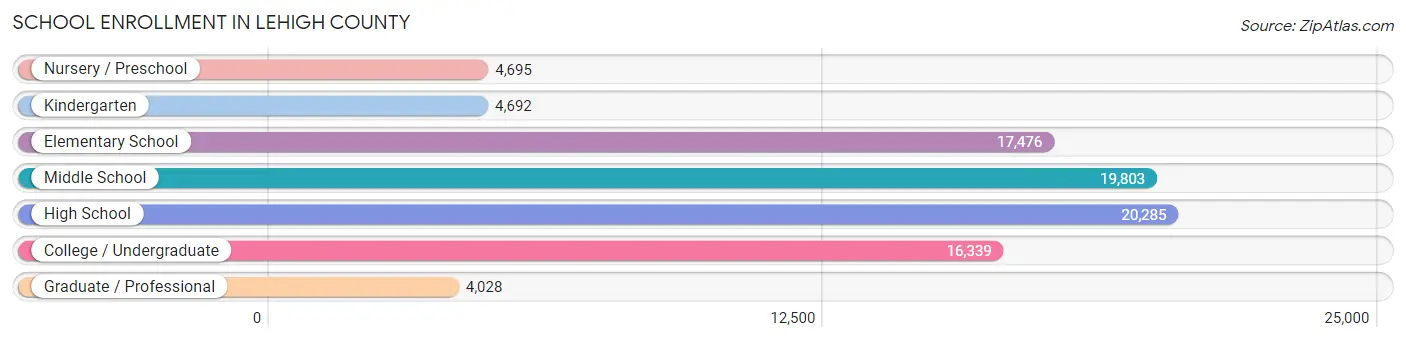
| School Level | # Students | % Students |
| Nursery / Preschool | 4,695 | 5.4% |
| Kindergarten | 4,692 | 5.4% |
| Elementary School | 17,476 | 20.0% |
| Middle School | 19,803 | 22.7% |
| High School | 20,285 | 23.2% |
| College / Undergraduate | 16,339 | 18.7% |
| Graduate / Professional | 4,028 | 4.6% |
| Total | 87,318 | 100.0% |
School Enrollment by Age by Funding Source in Lehigh County
Out of a total of 87,318 students who are enrolled in schools in Lehigh County, 16,503 (18.9%) attend a private institution, while the remaining 70,815 (81.1%) are enrolled in public schools. The age group of 3 to 4 year olds has the highest likelihood of being enrolled in private schools, with 1,650 (45.7% in the age bracket) enrolled. Conversely, the age group of 15 to 17 year olds has the lowest likelihood of being enrolled in a private school, with 13,726 (93.9% in the age bracket) attending a public institution.
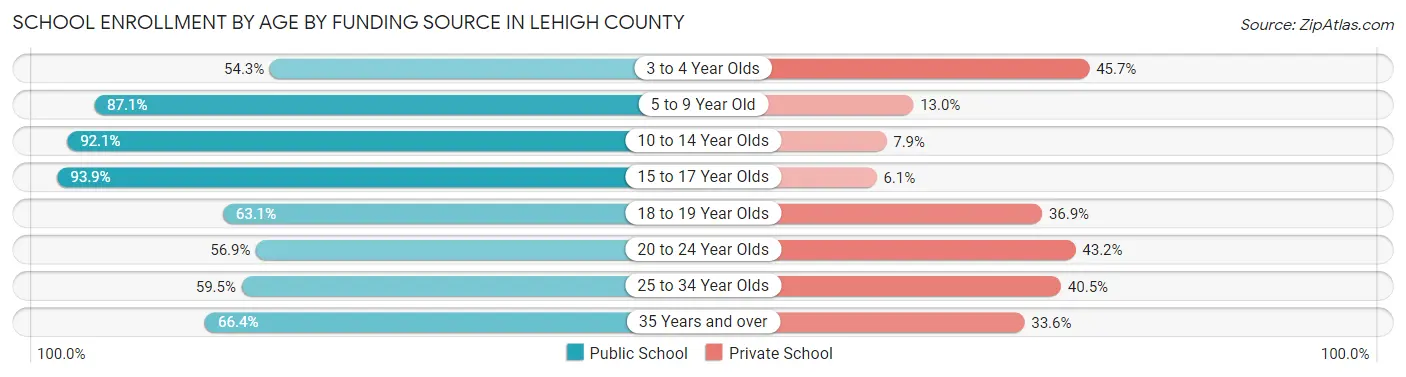
| Age Bracket | Public School | Private School |
| 3 to 4 Year Olds | 1,958 (54.3%) | 1,650 (45.7%) |
| 5 to 9 Year Old | 18,509 (87.1%) | 2,754 (13.0%) |
| 10 to 14 Year Olds | 22,276 (92.1%) | 1,921 (7.9%) |
| 15 to 17 Year Olds | 13,726 (93.9%) | 893 (6.1%) |
| 18 to 19 Year Olds | 4,776 (63.1%) | 2,797 (36.9%) |
| 20 to 24 Year Olds | 4,786 (56.9%) | 3,633 (43.1%) |
| 25 to 34 Year Olds | 2,509 (59.5%) | 1,705 (40.5%) |
| 35 Years and over | 2,273 (66.4%) | 1,152 (33.6%) |
| Total | 70,815 (81.1%) | 16,503 (18.9%) |
Educational Attainment by Field of Study in Lehigh County
Business (16,854 | 19.0%), education (11,735 | 13.2%), science & technology (10,421 | 11.7%), engineering (8,356 | 9.4%), and bio, nature & agricultural (6,477 | 7.3%) are the most common fields of study among 88,691 individuals in Lehigh County who have obtained a bachelor's degree or higher.
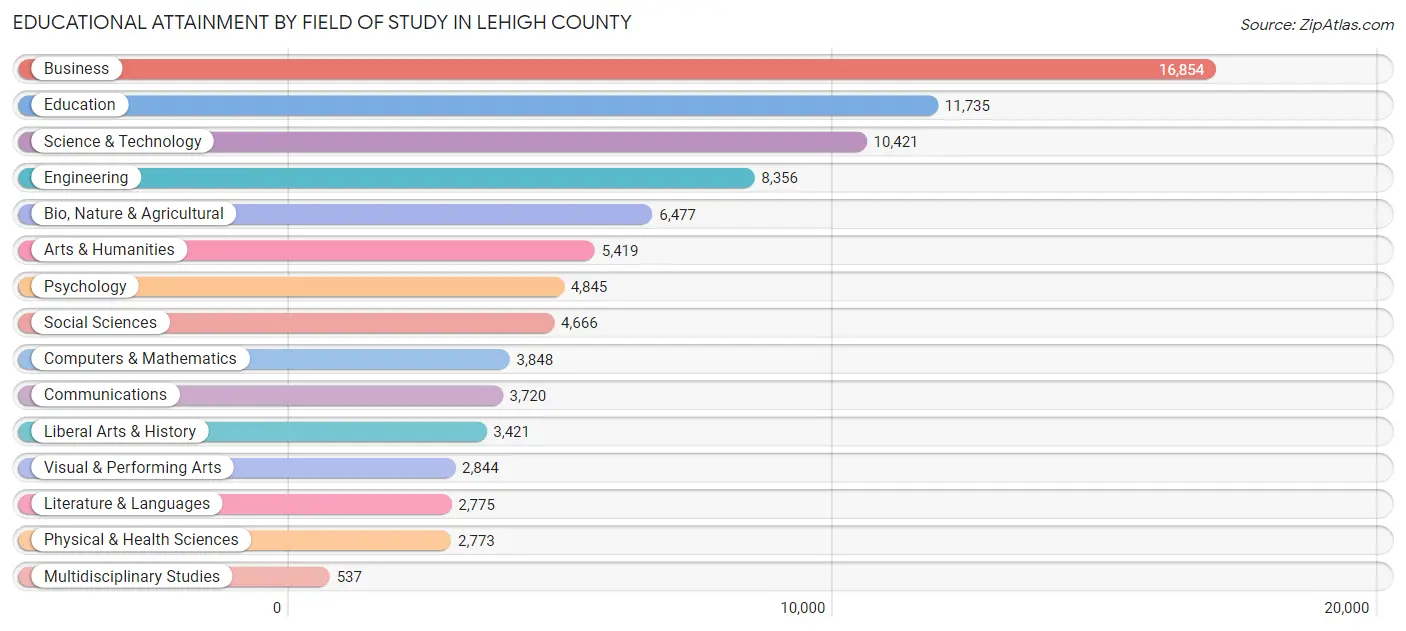
| Field of Study | # Graduates | % Graduates |
| Computers & Mathematics | 3,848 | 4.3% |
| Bio, Nature & Agricultural | 6,477 | 7.3% |
| Physical & Health Sciences | 2,773 | 3.1% |
| Psychology | 4,845 | 5.5% |
| Social Sciences | 4,666 | 5.3% |
| Engineering | 8,356 | 9.4% |
| Multidisciplinary Studies | 537 | 0.6% |
| Science & Technology | 10,421 | 11.7% |
| Business | 16,854 | 19.0% |
| Education | 11,735 | 13.2% |
| Literature & Languages | 2,775 | 3.1% |
| Liberal Arts & History | 3,421 | 3.9% |
| Visual & Performing Arts | 2,844 | 3.2% |
| Communications | 3,720 | 4.2% |
| Arts & Humanities | 5,419 | 6.1% |
| Total | 88,691 | 100.0% |
Transportation & Commute in Lehigh County
Vehicle Availability by Sex in Lehigh County
The most prevalent vehicle ownership categories in Lehigh County are males with 2 vehicles (41,005, accounting for 43.3%) and females with 2 vehicles (33,192, making up 49.3%).
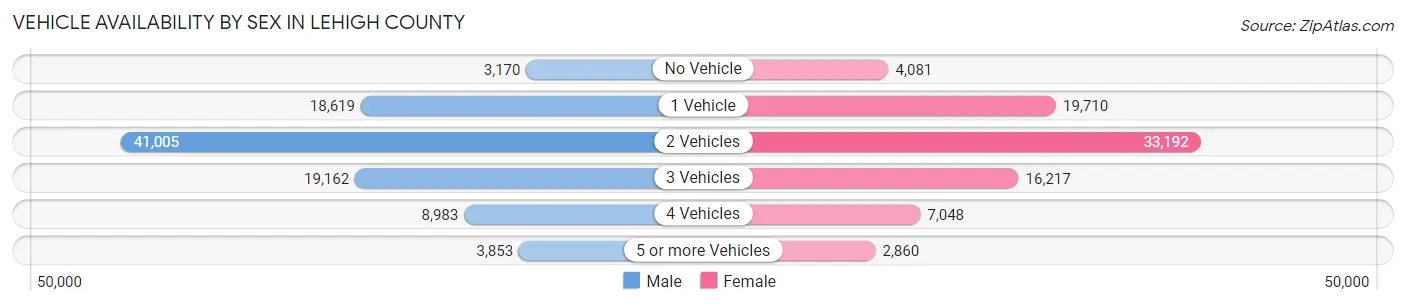
| Vehicles Available | Male | Female |
| No Vehicle | 3,170 (3.3%) | 4,081 (4.9%) |
| 1 Vehicle | 18,619 (19.6%) | 19,710 (23.7%) |
| 2 Vehicles | 41,005 (43.3%) | 33,192 (39.9%) |
| 3 Vehicles | 19,162 (20.2%) | 16,217 (19.5%) |
| 4 Vehicles | 8,983 (9.5%) | 7,048 (8.5%) |
| 5 or more Vehicles | 3,853 (4.1%) | 2,860 (3.4%) |
| Total | 94,792 (100.0%) | 83,108 (100.0%) |
Commute Time in Lehigh County
The most frequently occuring commute durations in Lehigh County are 20 to 24 minutes (31,177 commuters, 19.3%), 15 to 19 minutes (29,086 commuters, 18.0%), and 10 to 14 minutes (22,495 commuters, 14.0%).
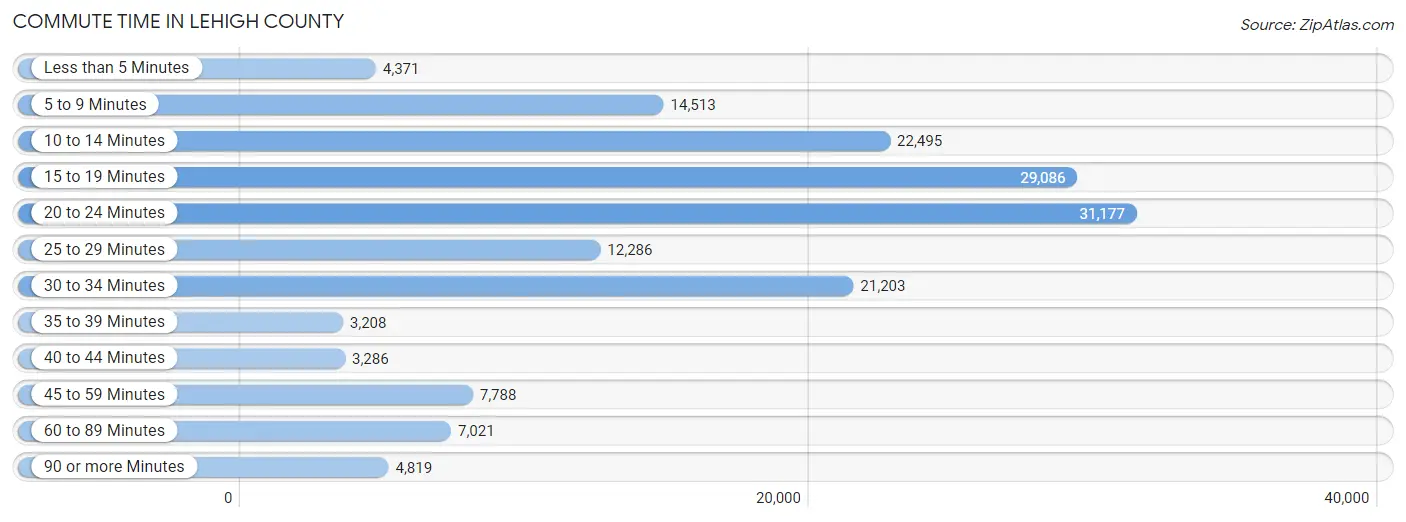
| Commute Time | # Commuters | % Commuters |
| Less than 5 Minutes | 4,371 | 2.7% |
| 5 to 9 Minutes | 14,513 | 9.0% |
| 10 to 14 Minutes | 22,495 | 14.0% |
| 15 to 19 Minutes | 29,086 | 18.0% |
| 20 to 24 Minutes | 31,177 | 19.3% |
| 25 to 29 Minutes | 12,286 | 7.6% |
| 30 to 34 Minutes | 21,203 | 13.2% |
| 35 to 39 Minutes | 3,208 | 2.0% |
| 40 to 44 Minutes | 3,286 | 2.0% |
| 45 to 59 Minutes | 7,788 | 4.8% |
| 60 to 89 Minutes | 7,021 | 4.3% |
| 90 or more Minutes | 4,819 | 3.0% |
Commute Time by Sex in Lehigh County
The most common commute times in Lehigh County are 20 to 24 minutes (15,764 commuters, 18.2%) for males and 20 to 24 minutes (15,413 commuters, 20.6%) for females.
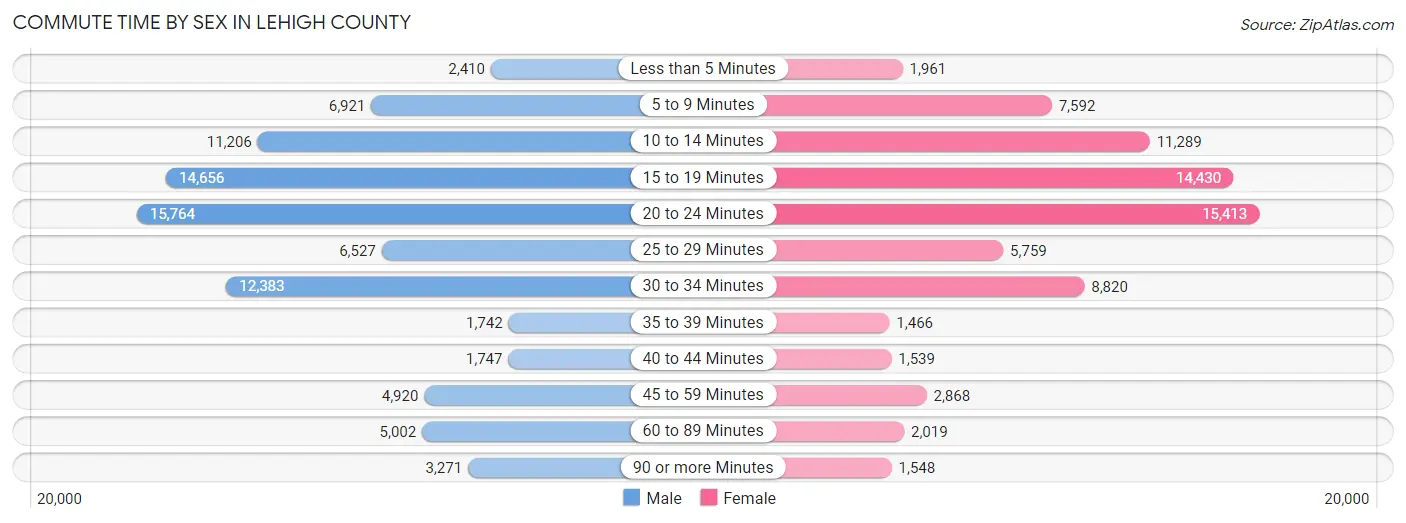
| Commute Time | Male | Female |
| Less than 5 Minutes | 2,410 (2.8%) | 1,961 (2.6%) |
| 5 to 9 Minutes | 6,921 (8.0%) | 7,592 (10.2%) |
| 10 to 14 Minutes | 11,206 (13.0%) | 11,289 (15.1%) |
| 15 to 19 Minutes | 14,656 (16.9%) | 14,430 (19.3%) |
| 20 to 24 Minutes | 15,764 (18.2%) | 15,413 (20.6%) |
| 25 to 29 Minutes | 6,527 (7.5%) | 5,759 (7.7%) |
| 30 to 34 Minutes | 12,383 (14.3%) | 8,820 (11.8%) |
| 35 to 39 Minutes | 1,742 (2.0%) | 1,466 (2.0%) |
| 40 to 44 Minutes | 1,747 (2.0%) | 1,539 (2.1%) |
| 45 to 59 Minutes | 4,920 (5.7%) | 2,868 (3.8%) |
| 60 to 89 Minutes | 5,002 (5.8%) | 2,019 (2.7%) |
| 90 or more Minutes | 3,271 (3.8%) | 1,548 (2.1%) |
Time of Departure to Work by Sex in Lehigh County
The most frequent times of departure to work in Lehigh County are 7:00 AM to 7:29 AM (10,108, 11.7%) for males and 7:00 AM to 7:29 AM (9,681, 13.0%) for females.
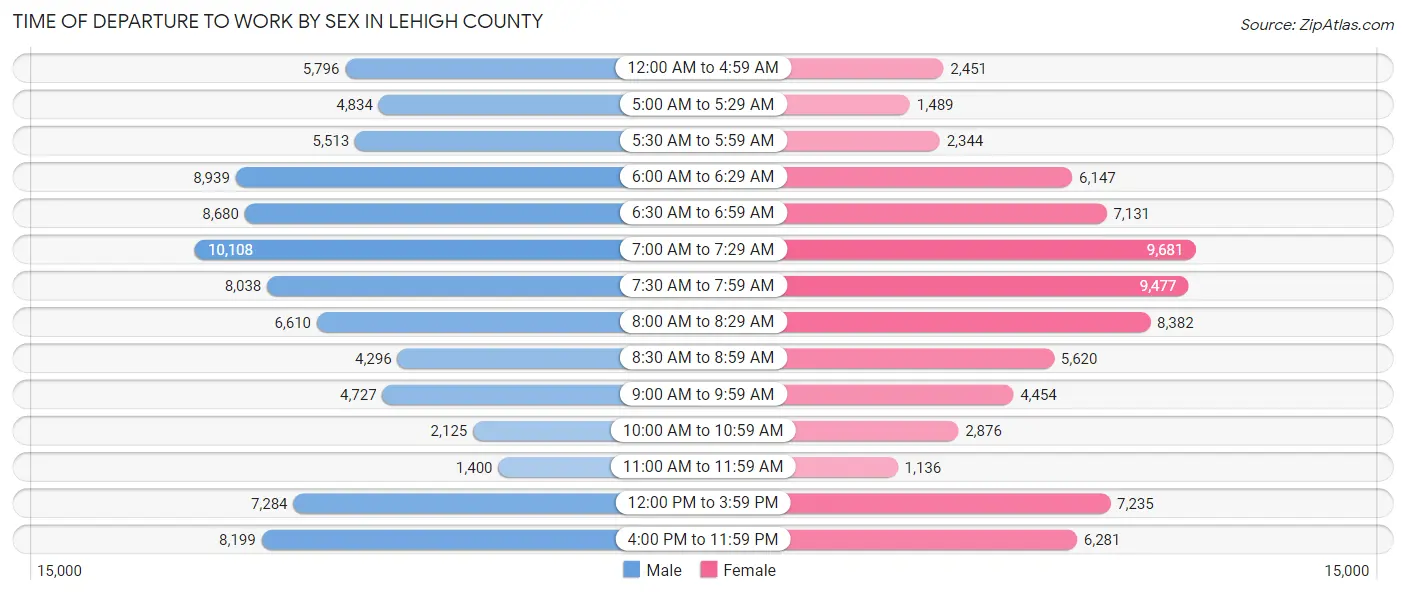
| Time of Departure | Male | Female |
| 12:00 AM to 4:59 AM | 5,796 (6.7%) | 2,451 (3.3%) |
| 5:00 AM to 5:29 AM | 4,834 (5.6%) | 1,489 (2.0%) |
| 5:30 AM to 5:59 AM | 5,513 (6.4%) | 2,344 (3.1%) |
| 6:00 AM to 6:29 AM | 8,939 (10.3%) | 6,147 (8.2%) |
| 6:30 AM to 6:59 AM | 8,680 (10.0%) | 7,131 (9.6%) |
| 7:00 AM to 7:29 AM | 10,108 (11.7%) | 9,681 (13.0%) |
| 7:30 AM to 7:59 AM | 8,038 (9.3%) | 9,477 (12.7%) |
| 8:00 AM to 8:29 AM | 6,610 (7.6%) | 8,382 (11.2%) |
| 8:30 AM to 8:59 AM | 4,296 (5.0%) | 5,620 (7.5%) |
| 9:00 AM to 9:59 AM | 4,727 (5.5%) | 4,454 (6.0%) |
| 10:00 AM to 10:59 AM | 2,125 (2.5%) | 2,876 (3.8%) |
| 11:00 AM to 11:59 AM | 1,400 (1.6%) | 1,136 (1.5%) |
| 12:00 PM to 3:59 PM | 7,284 (8.4%) | 7,235 (9.7%) |
| 4:00 PM to 11:59 PM | 8,199 (9.5%) | 6,281 (8.4%) |
| Total | 86,549 (100.0%) | 74,704 (100.0%) |
Housing Occupancy in Lehigh County
Occupancy by Ownership in Lehigh County
Of the total 142,160 dwellings in Lehigh County, owner-occupied units account for 92,474 (65.0%), while renter-occupied units make up 49,686 (34.9%).
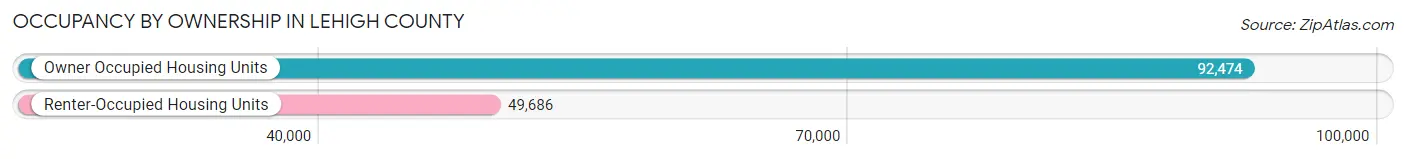
| Occupancy | # Housing Units | % Housing Units |
| Owner Occupied Housing Units | 92,474 | 65.0% |
| Renter-Occupied Housing Units | 49,686 | 34.9% |
| Total Occupied Housing Units | 142,160 | 100.0% |
Occupancy by Household Size in Lehigh County
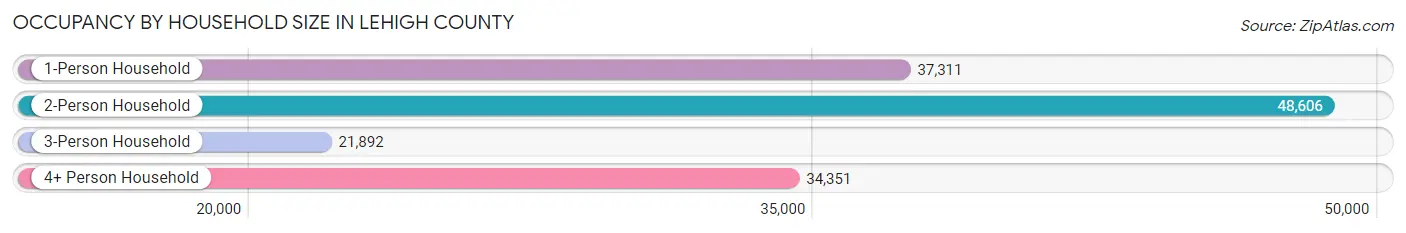
| Household Size | # Housing Units | % Housing Units |
| 1-Person Household | 37,311 | 26.3% |
| 2-Person Household | 48,606 | 34.2% |
| 3-Person Household | 21,892 | 15.4% |
| 4+ Person Household | 34,351 | 24.2% |
| Total Housing Units | 142,160 | 100.0% |
Occupancy by Ownership by Household Size in Lehigh County
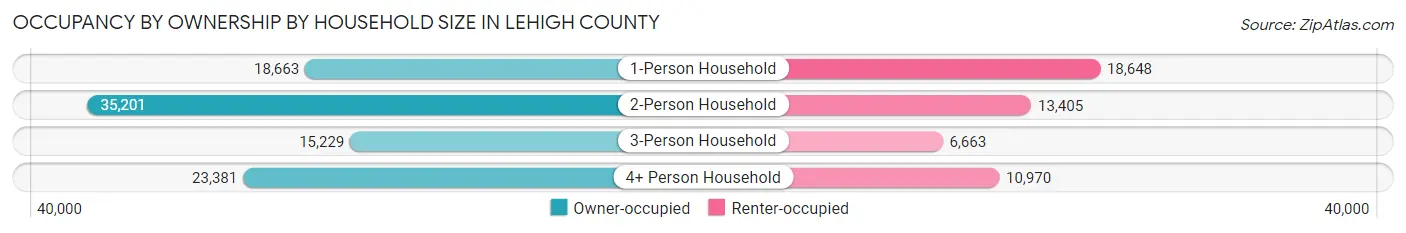
| Household Size | Owner-occupied | Renter-occupied |
| 1-Person Household | 18,663 (50.0%) | 18,648 (50.0%) |
| 2-Person Household | 35,201 (72.4%) | 13,405 (27.6%) |
| 3-Person Household | 15,229 (69.6%) | 6,663 (30.4%) |
| 4+ Person Household | 23,381 (68.1%) | 10,970 (31.9%) |
| Total Housing Units | 92,474 (65.0%) | 49,686 (34.9%) |
Occupancy by Educational Attainment in Lehigh County
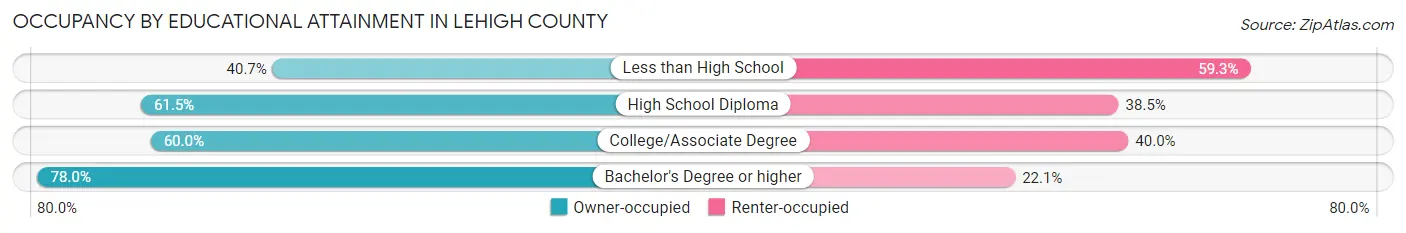
| Household Size | Owner-occupied | Renter-occupied |
| Less than High School | 4,866 (40.7%) | 7,101 (59.3%) |
| High School Diploma | 25,953 (61.5%) | 16,219 (38.5%) |
| College/Associate Degree | 23,235 (60.0%) | 15,498 (40.0%) |
| Bachelor's Degree or higher | 38,420 (77.9%) | 10,868 (22.1%) |
Occupancy by Age of Householder in Lehigh County
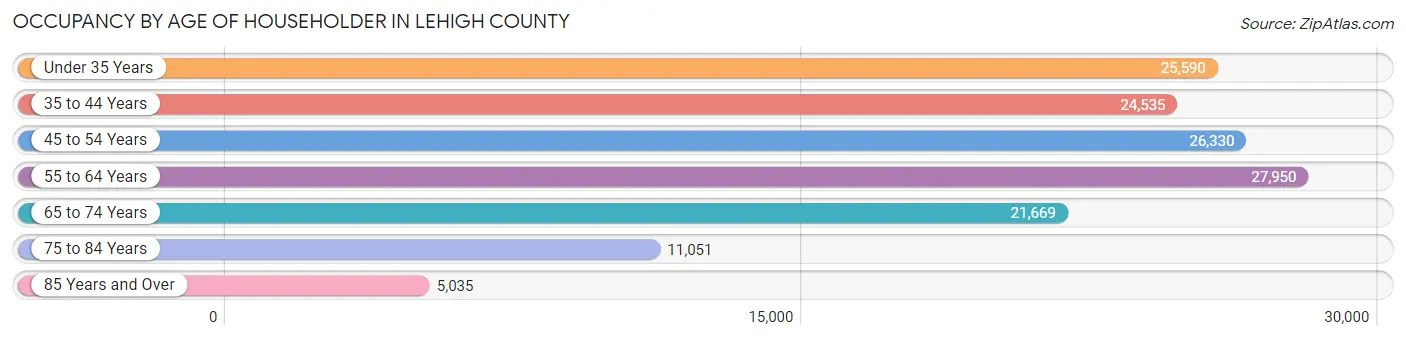
| Age Bracket | # Households | % Households |
| Under 35 Years | 25,590 | 18.0% |
| 35 to 44 Years | 24,535 | 17.3% |
| 45 to 54 Years | 26,330 | 18.5% |
| 55 to 64 Years | 27,950 | 19.7% |
| 65 to 74 Years | 21,669 | 15.2% |
| 75 to 84 Years | 11,051 | 7.8% |
| 85 Years and Over | 5,035 | 3.5% |
| Total | 142,160 | 100.0% |
Housing Finances in Lehigh County
Median Income by Occupancy in Lehigh County
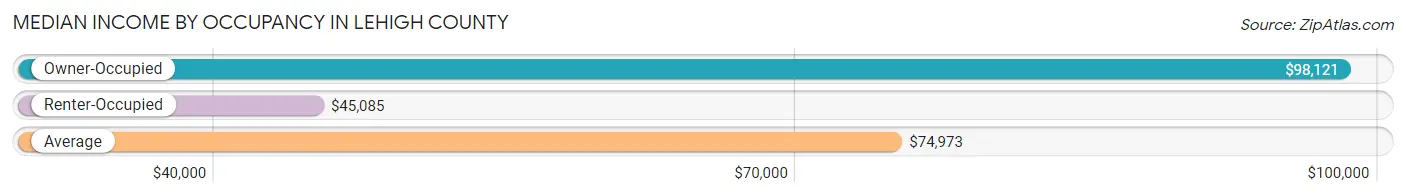
| Occupancy Type | # Households | Median Income |
| Owner-Occupied | 92,474 (65.0%) | $98,121 |
| Renter-Occupied | 49,686 (34.9%) | $45,085 |
| Average | 142,160 (100.0%) | $74,973 |
Occupancy by Householder Income Bracket in Lehigh County
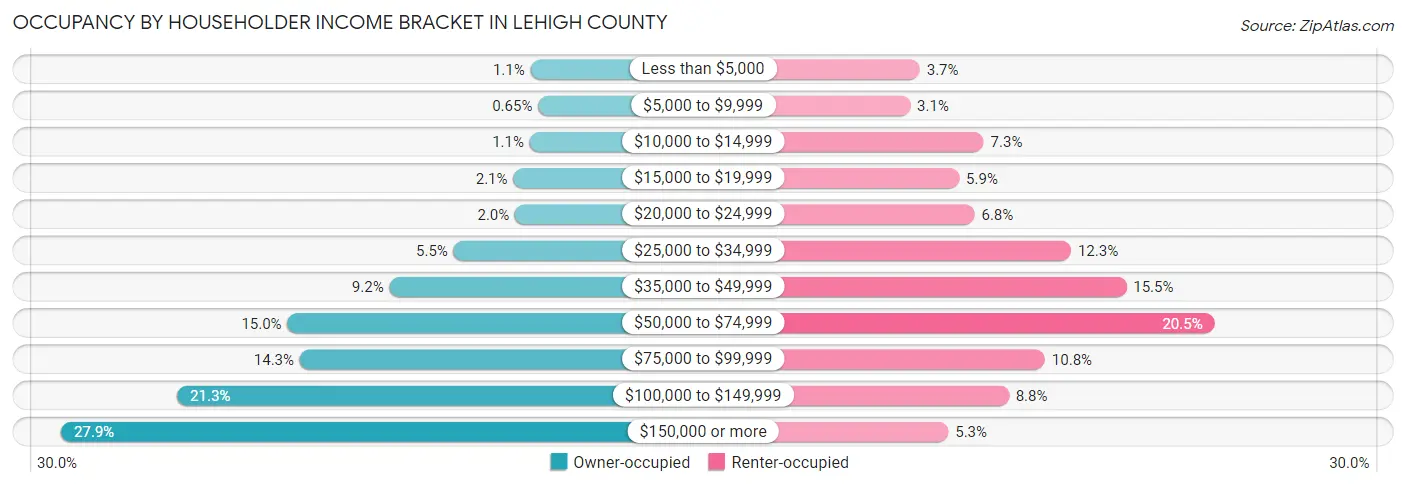
| Income Bracket | Owner-occupied | Renter-occupied |
| Less than $5,000 | 1,005 (1.1%) | 1,825 (3.7%) |
| $5,000 to $9,999 | 603 (0.6%) | 1,549 (3.1%) |
| $10,000 to $14,999 | 1,048 (1.1%) | 3,637 (7.3%) |
| $15,000 to $19,999 | 1,918 (2.1%) | 2,941 (5.9%) |
| $20,000 to $24,999 | 1,818 (2.0%) | 3,378 (6.8%) |
| $25,000 to $34,999 | 5,067 (5.5%) | 6,118 (12.3%) |
| $35,000 to $49,999 | 8,463 (9.1%) | 7,686 (15.5%) |
| $50,000 to $74,999 | 13,855 (15.0%) | 10,193 (20.5%) |
| $75,000 to $99,999 | 13,193 (14.3%) | 5,377 (10.8%) |
| $100,000 to $149,999 | 19,683 (21.3%) | 4,348 (8.7%) |
| $150,000 or more | 25,821 (27.9%) | 2,634 (5.3%) |
| Total | 92,474 (100.0%) | 49,686 (100.0%) |
Monthly Housing Cost Tiers in Lehigh County
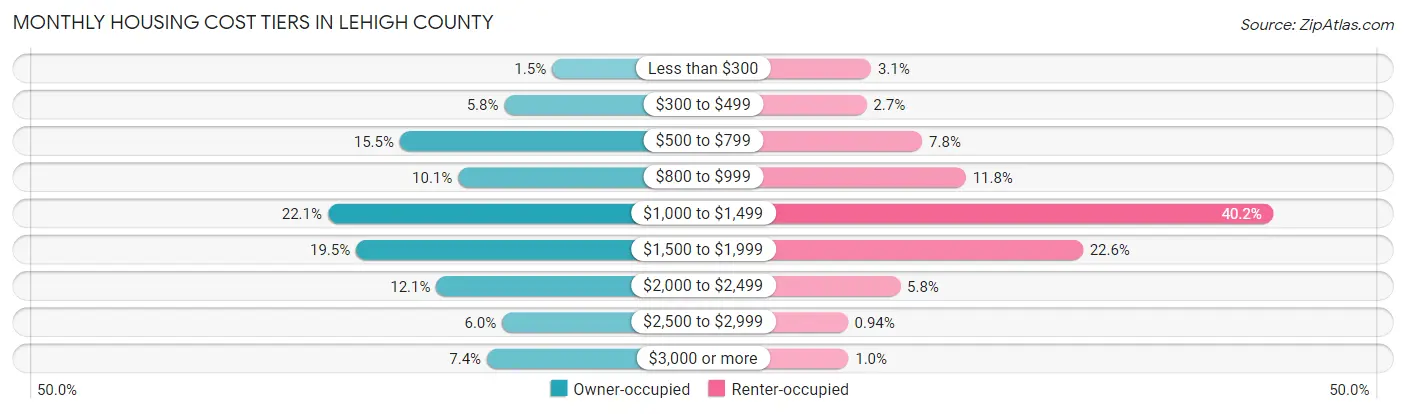
| Monthly Cost | Owner-occupied | Renter-occupied |
| Less than $300 | 1,337 (1.5%) | 1,537 (3.1%) |
| $300 to $499 | 5,403 (5.8%) | 1,328 (2.7%) |
| $500 to $799 | 14,293 (15.5%) | 3,877 (7.8%) |
| $800 to $999 | 9,335 (10.1%) | 5,868 (11.8%) |
| $1,000 to $1,499 | 20,431 (22.1%) | 19,956 (40.2%) |
| $1,500 to $1,999 | 18,020 (19.5%) | 11,220 (22.6%) |
| $2,000 to $2,499 | 11,188 (12.1%) | 2,865 (5.8%) |
| $2,500 to $2,999 | 5,587 (6.0%) | 465 (0.9%) |
| $3,000 or more | 6,880 (7.4%) | 495 (1.0%) |
| Total | 92,474 (100.0%) | 49,686 (100.0%) |
Physical Housing Characteristics in Lehigh County
Housing Structures in Lehigh County
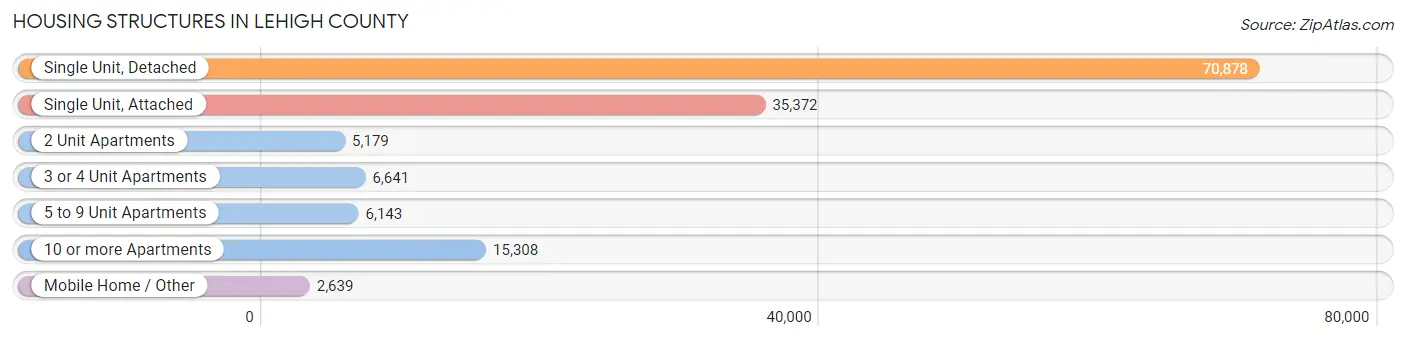
| Structure Type | # Housing Units | % Housing Units |
| Single Unit, Detached | 70,878 | 49.9% |
| Single Unit, Attached | 35,372 | 24.9% |
| 2 Unit Apartments | 5,179 | 3.6% |
| 3 or 4 Unit Apartments | 6,641 | 4.7% |
| 5 to 9 Unit Apartments | 6,143 | 4.3% |
| 10 or more Apartments | 15,308 | 10.8% |
| Mobile Home / Other | 2,639 | 1.9% |
| Total | 142,160 | 100.0% |
Housing Structures by Occupancy in Lehigh County
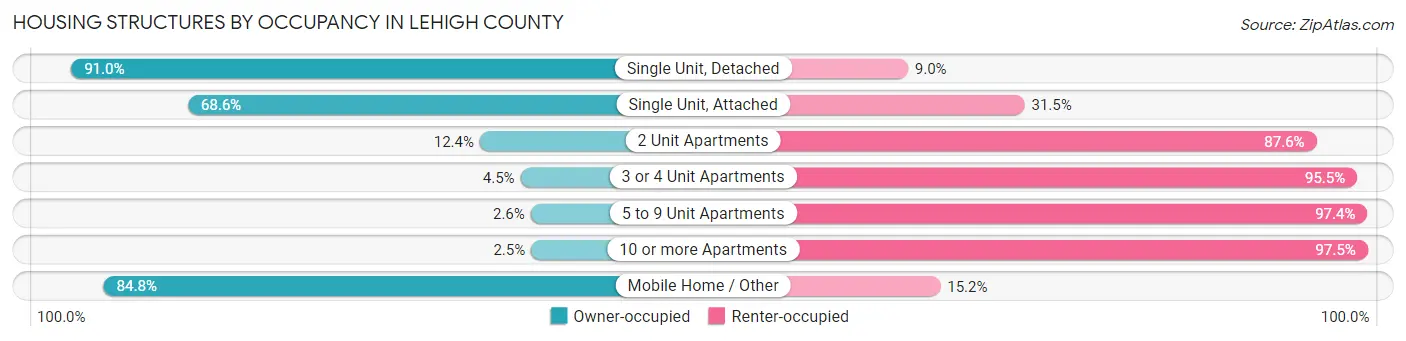
| Structure Type | Owner-occupied | Renter-occupied |
| Single Unit, Detached | 64,509 (91.0%) | 6,369 (9.0%) |
| Single Unit, Attached | 24,248 (68.5%) | 11,124 (31.5%) |
| 2 Unit Apartments | 640 (12.4%) | 4,539 (87.6%) |
| 3 or 4 Unit Apartments | 301 (4.5%) | 6,340 (95.5%) |
| 5 to 9 Unit Apartments | 158 (2.6%) | 5,985 (97.4%) |
| 10 or more Apartments | 381 (2.5%) | 14,927 (97.5%) |
| Mobile Home / Other | 2,237 (84.8%) | 402 (15.2%) |
| Total | 92,474 (65.0%) | 49,686 (34.9%) |
Housing Structures by Number of Rooms in Lehigh County
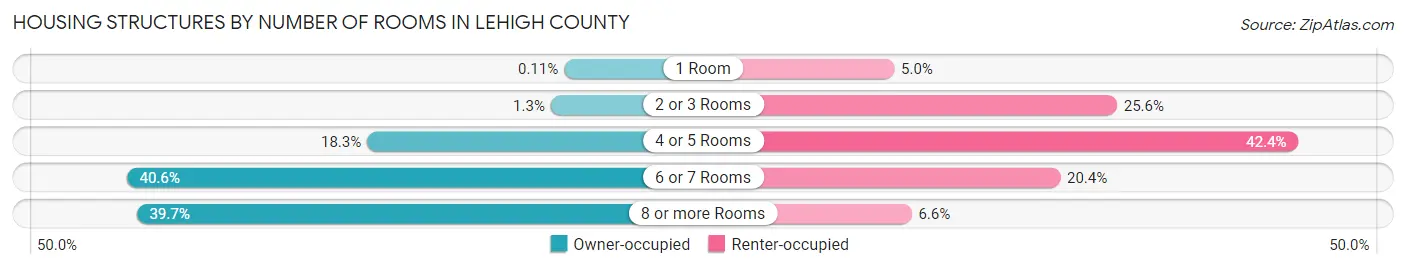
| Number of Rooms | Owner-occupied | Renter-occupied |
| 1 Room | 103 (0.1%) | 2,487 (5.0%) |
| 2 or 3 Rooms | 1,240 (1.3%) | 12,725 (25.6%) |
| 4 or 5 Rooms | 16,952 (18.3%) | 21,068 (42.4%) |
| 6 or 7 Rooms | 37,514 (40.6%) | 10,118 (20.4%) |
| 8 or more Rooms | 36,665 (39.7%) | 3,288 (6.6%) |
| Total | 92,474 (100.0%) | 49,686 (100.0%) |
Housing Structure by Heating Type in Lehigh County
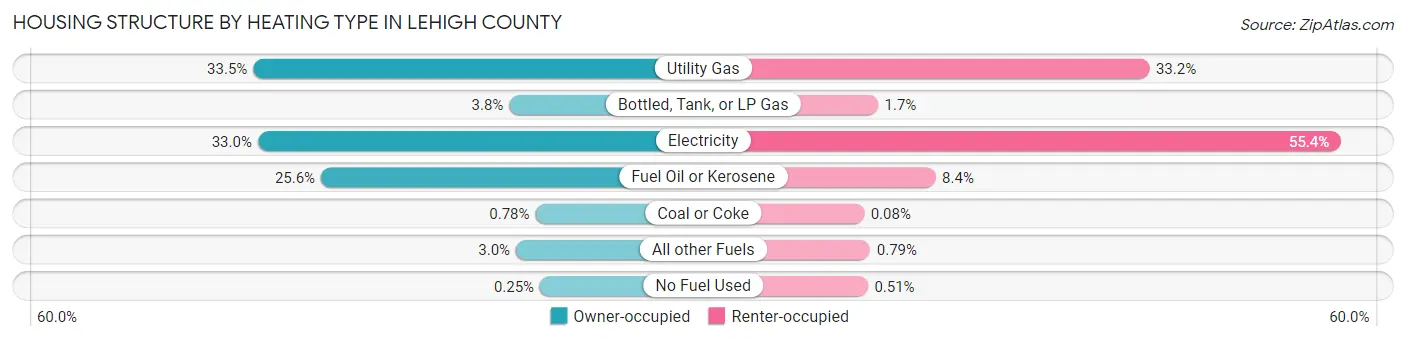
| Heating Type | Owner-occupied | Renter-occupied |
| Utility Gas | 30,980 (33.5%) | 16,472 (33.2%) |
| Bottled, Tank, or LP Gas | 3,534 (3.8%) | 838 (1.7%) |
| Electricity | 30,490 (33.0%) | 27,534 (55.4%) |
| Fuel Oil or Kerosene | 23,714 (25.6%) | 4,155 (8.4%) |
| Coal or Coke | 722 (0.8%) | 40 (0.1%) |
| All other Fuels | 2,800 (3.0%) | 392 (0.8%) |
| No Fuel Used | 234 (0.3%) | 255 (0.5%) |
| Total | 92,474 (100.0%) | 49,686 (100.0%) |
Household Vehicle Usage in Lehigh County
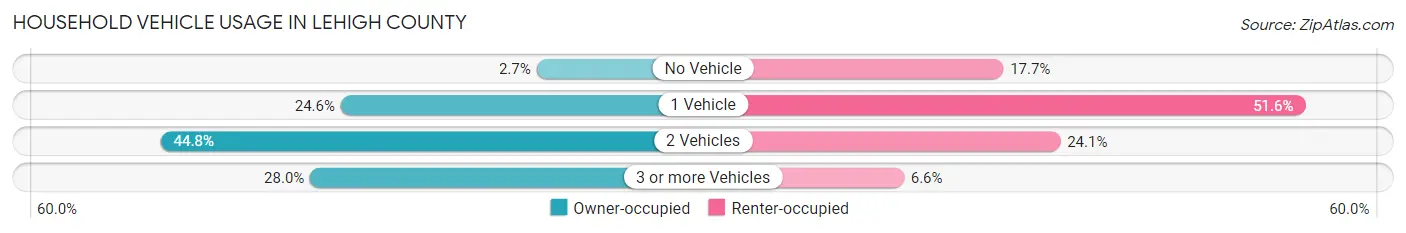
| Vehicles per Household | Owner-occupied | Renter-occupied |
| No Vehicle | 2,455 (2.6%) | 8,810 (17.7%) |
| 1 Vehicle | 22,726 (24.6%) | 25,617 (51.6%) |
| 2 Vehicles | 41,395 (44.8%) | 11,983 (24.1%) |
| 3 or more Vehicles | 25,898 (28.0%) | 3,276 (6.6%) |
| Total | 92,474 (100.0%) | 49,686 (100.0%) |
Real Estate & Mortgages in Lehigh County
Real Estate and Mortgage Overview in Lehigh County
| Characteristic | Without Mortgage | With Mortgage |
| Housing Units | 32,742 | 59,732 |
| Median Property Value | $243,200 | $261,400 |
| Median Household Income | $70,173 | $19,782 |
| Monthly Housing Costs | $731 | $6,754 |
| Real Estate Taxes | $4,336 | $566 |
Property Value by Mortgage Status in Lehigh County
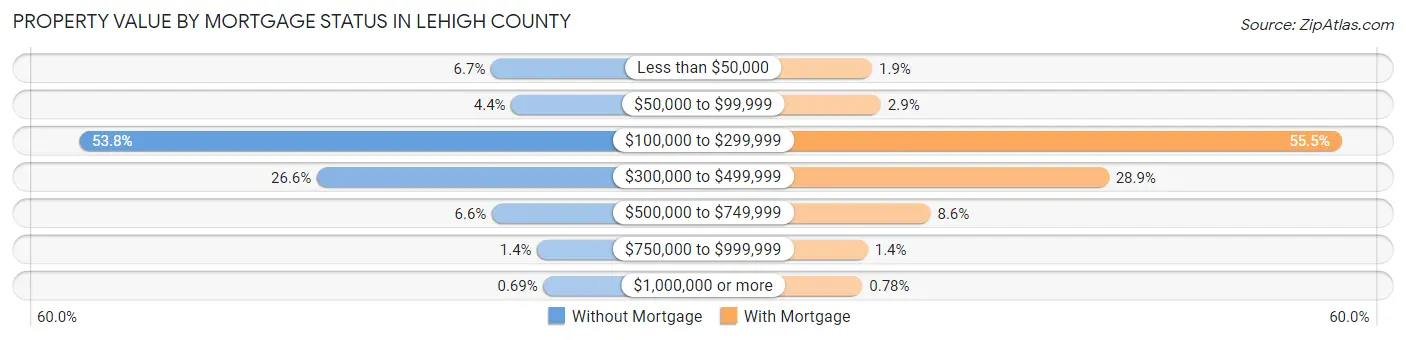
| Property Value | Without Mortgage | With Mortgage |
| Less than $50,000 | 2,184 (6.7%) | 1,131 (1.9%) |
| $50,000 to $99,999 | 1,427 (4.4%) | 1,730 (2.9%) |
| $100,000 to $299,999 | 17,603 (53.8%) | 33,172 (55.5%) |
| $300,000 to $499,999 | 8,700 (26.6%) | 17,279 (28.9%) |
| $500,000 to $749,999 | 2,148 (6.6%) | 5,120 (8.6%) |
| $750,000 to $999,999 | 455 (1.4%) | 836 (1.4%) |
| $1,000,000 or more | 225 (0.7%) | 464 (0.8%) |
| Total | 32,742 (100.0%) | 59,732 (100.0%) |
Household Income by Mortgage Status in Lehigh County
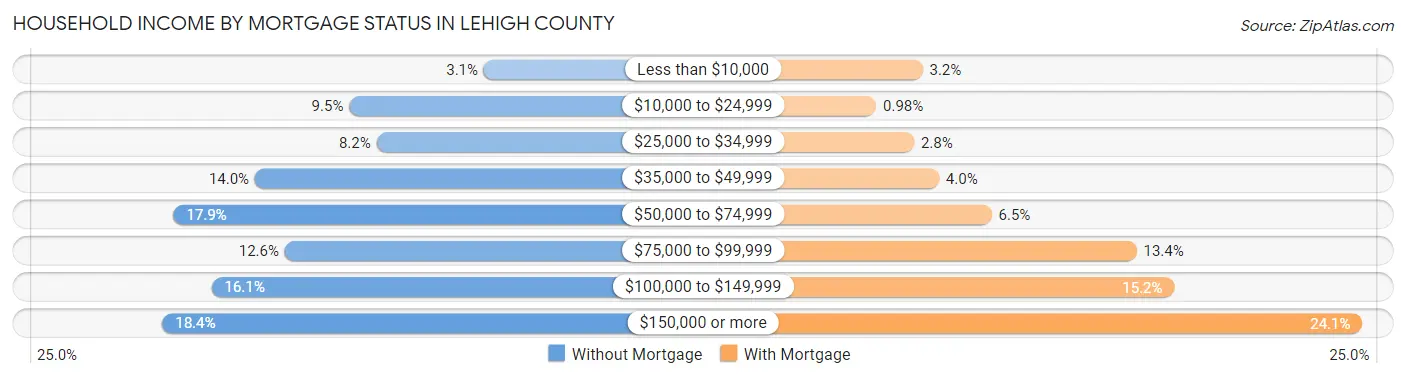
| Household Income | Without Mortgage | With Mortgage |
| Less than $10,000 | 1,024 (3.1%) | 1,907 (3.2%) |
| $10,000 to $24,999 | 3,125 (9.5%) | 584 (1.0%) |
| $25,000 to $34,999 | 2,698 (8.2%) | 1,659 (2.8%) |
| $35,000 to $49,999 | 4,594 (14.0%) | 2,369 (4.0%) |
| $50,000 to $74,999 | 5,864 (17.9%) | 3,869 (6.5%) |
| $75,000 to $99,999 | 4,128 (12.6%) | 7,991 (13.4%) |
| $100,000 to $149,999 | 5,270 (16.1%) | 9,065 (15.2%) |
| $150,000 or more | 6,039 (18.4%) | 14,413 (24.1%) |
| Total | 32,742 (100.0%) | 59,732 (100.0%) |
Property Value to Household Income Ratio in Lehigh County
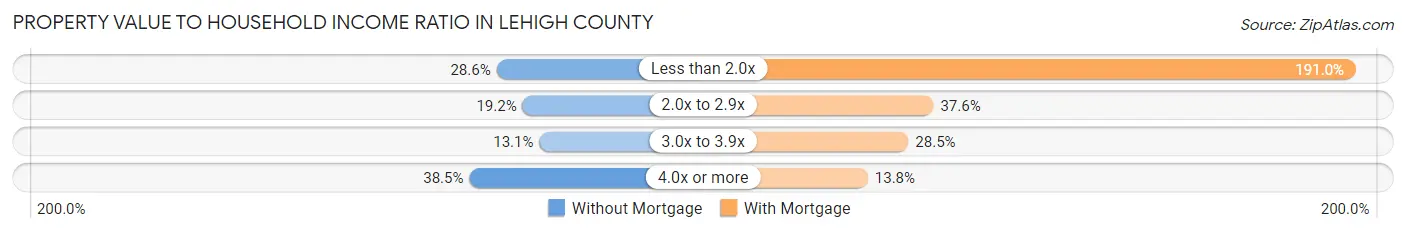
| Value-to-Income Ratio | Without Mortgage | With Mortgage |
| Less than 2.0x | 9,361 (28.6%) | 114,114 (191.0%) |
| 2.0x to 2.9x | 6,274 (19.2%) | 22,471 (37.6%) |
| 3.0x to 3.9x | 4,273 (13.1%) | 17,022 (28.5%) |
| 4.0x or more | 12,595 (38.5%) | 8,235 (13.8%) |
| Total | 32,742 (100.0%) | 59,732 (100.0%) |
Real Estate Taxes by Mortgage Status in Lehigh County
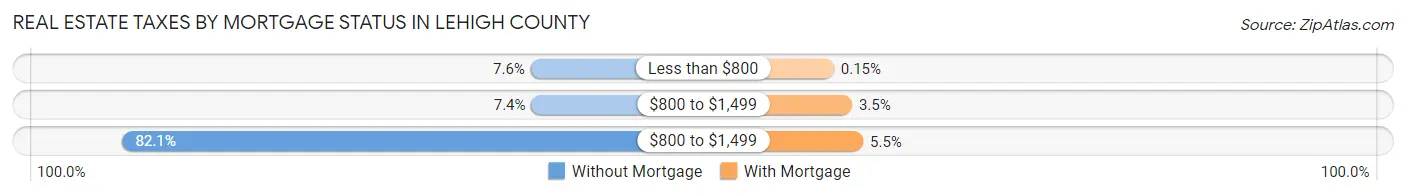
| Property Taxes | Without Mortgage | With Mortgage |
| Less than $800 | 2,479 (7.6%) | 89 (0.2%) |
| $800 to $1,499 | 2,436 (7.4%) | 2,067 (3.5%) |
| $800 to $1,499 | 26,889 (82.1%) | 3,279 (5.5%) |
| Total | 32,742 (100.0%) | 59,732 (100.0%) |
Health & Disability in Lehigh County
Health Insurance Coverage by Age in Lehigh County
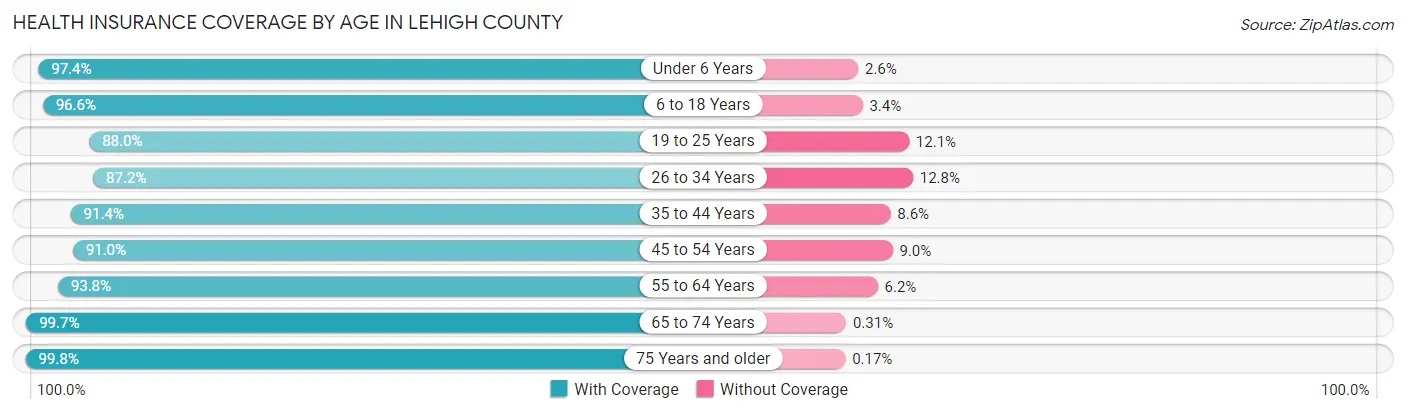
| Age Bracket | With Coverage | Without Coverage |
| Under 6 Years | 25,876 (97.4%) | 679 (2.6%) |
| 6 to 18 Years | 60,790 (96.6%) | 2,124 (3.4%) |
| 19 to 25 Years | 29,598 (87.9%) | 4,056 (12.0%) |
| 26 to 34 Years | 38,172 (87.2%) | 5,594 (12.8%) |
| 35 to 44 Years | 43,496 (91.4%) | 4,090 (8.6%) |
| 45 to 54 Years | 42,043 (91.0%) | 4,155 (9.0%) |
| 55 to 64 Years | 45,383 (93.8%) | 3,004 (6.2%) |
| 65 to 74 Years | 35,938 (99.7%) | 112 (0.3%) |
| 75 Years and older | 24,616 (99.8%) | 41 (0.2%) |
| Total | 345,912 (93.5%) | 23,855 (6.5%) |
Health Insurance Coverage by Citizenship Status in Lehigh County
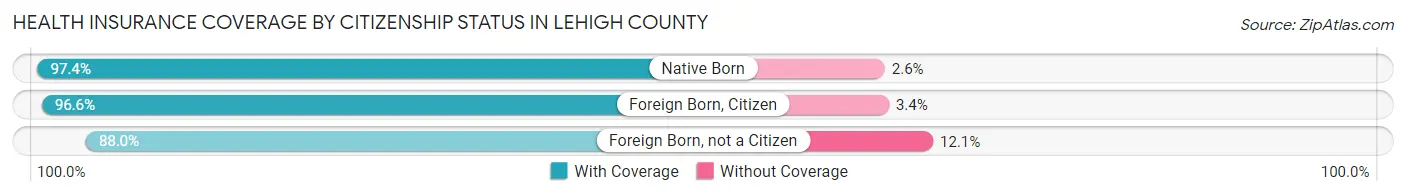
| Citizenship Status | With Coverage | Without Coverage |
| Native Born | 25,876 (97.4%) | 679 (2.6%) |
| Foreign Born, Citizen | 60,790 (96.6%) | 2,124 (3.4%) |
| Foreign Born, not a Citizen | 29,598 (87.9%) | 4,056 (12.0%) |
Health Insurance Coverage by Household Income in Lehigh County
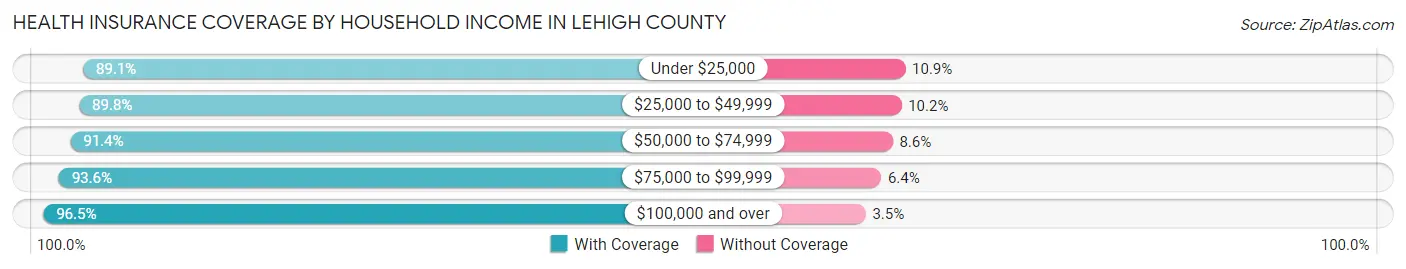
| Household Income | With Coverage | Without Coverage |
| Under $25,000 | 32,152 (89.1%) | 3,945 (10.9%) |
| $25,000 to $49,999 | 52,231 (89.8%) | 5,934 (10.2%) |
| $50,000 to $74,999 | 53,947 (91.4%) | 5,052 (8.6%) |
| $75,000 to $99,999 | 47,118 (93.6%) | 3,222 (6.4%) |
| $100,000 and over | 155,557 (96.5%) | 5,645 (3.5%) |
Public vs Private Health Insurance Coverage by Age in Lehigh County
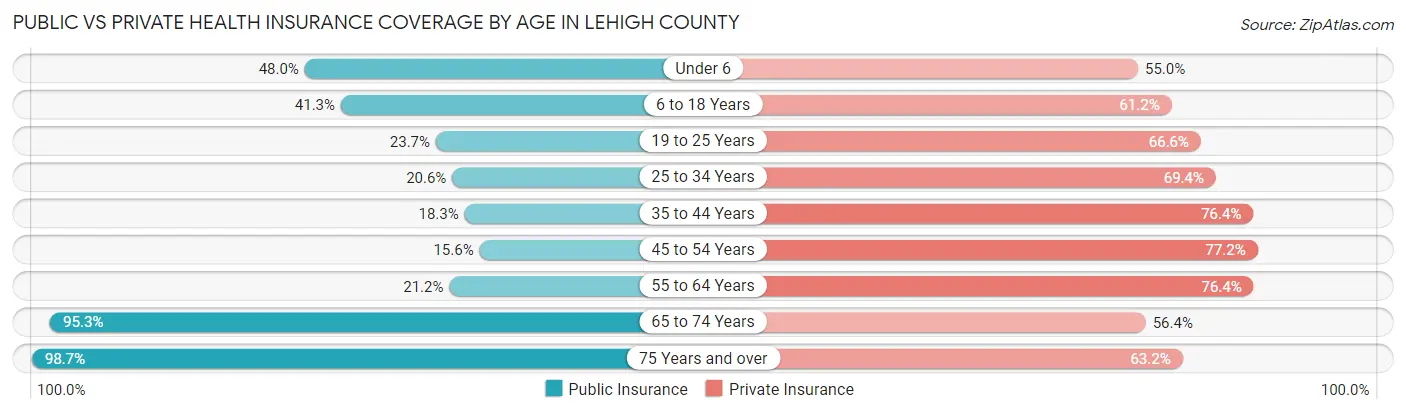
| Age Bracket | Public Insurance | Private Insurance |
| Under 6 | 12,749 (48.0%) | 14,602 (55.0%) |
| 6 to 18 Years | 25,985 (41.3%) | 38,498 (61.2%) |
| 19 to 25 Years | 7,962 (23.7%) | 22,426 (66.6%) |
| 25 to 34 Years | 9,028 (20.6%) | 30,378 (69.4%) |
| 35 to 44 Years | 8,729 (18.3%) | 36,338 (76.4%) |
| 45 to 54 Years | 7,192 (15.6%) | 35,648 (77.2%) |
| 55 to 64 Years | 10,243 (21.2%) | 36,985 (76.4%) |
| 65 to 74 Years | 34,336 (95.3%) | 20,341 (56.4%) |
| 75 Years and over | 24,326 (98.7%) | 15,591 (63.2%) |
| Total | 140,550 (38.0%) | 250,807 (67.8%) |
Disability Status by Sex by Age in Lehigh County
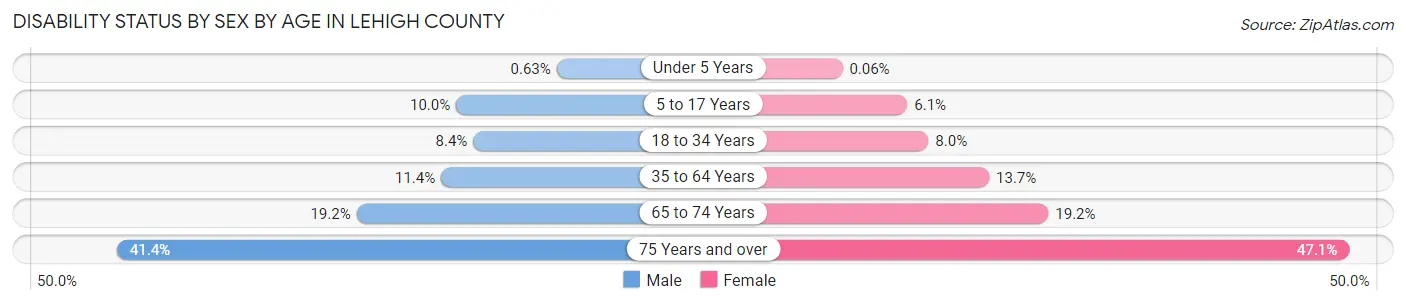
| Age Bracket | Male | Female |
| Under 5 Years | 71 (0.6%) | 6 (0.1%) |
| 5 to 17 Years | 3,219 (10.0%) | 1,834 (6.1%) |
| 18 to 34 Years | 3,443 (8.4%) | 3,323 (8.0%) |
| 35 to 64 Years | 8,028 (11.4%) | 9,759 (13.7%) |
| 65 to 74 Years | 3,287 (19.2%) | 3,629 (19.2%) |
| 75 Years and over | 4,124 (41.4%) | 6,921 (47.1%) |
Disability Class by Sex by Age in Lehigh County
Disability Class: Hearing Difficulty
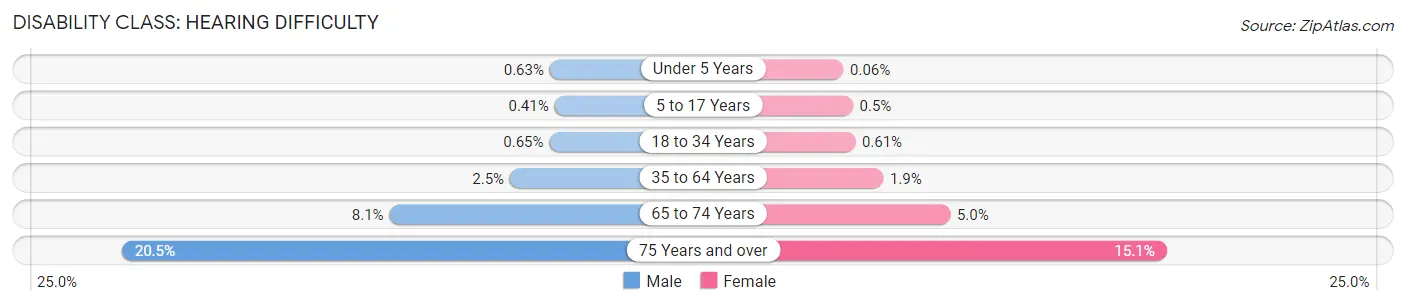
| Age Bracket | Male | Female |
| Under 5 Years | 71 (0.6%) | 6 (0.1%) |
| 5 to 17 Years | 131 (0.4%) | 151 (0.5%) |
| 18 to 34 Years | 267 (0.6%) | 253 (0.6%) |
| 35 to 64 Years | 1,754 (2.5%) | 1,362 (1.9%) |
| 65 to 74 Years | 1,382 (8.1%) | 951 (5.0%) |
| 75 Years and over | 2,040 (20.5%) | 2,216 (15.1%) |
Disability Class: Vision Difficulty
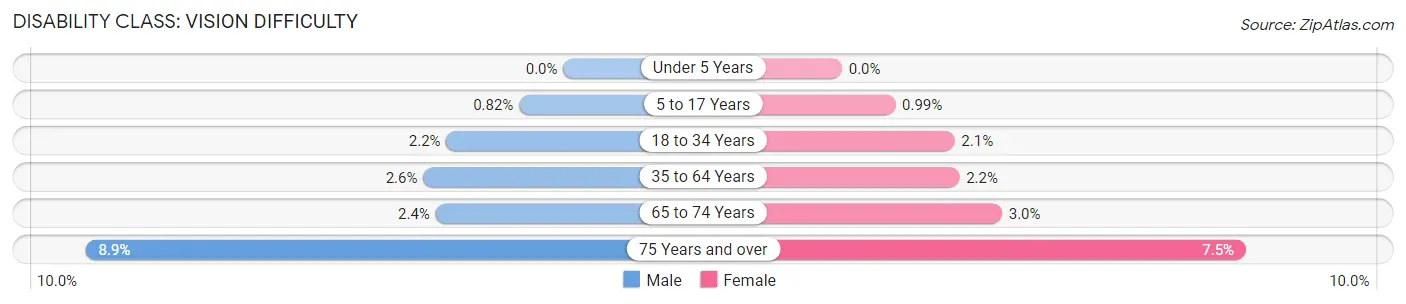
| Age Bracket | Male | Female |
| Under 5 Years | 0 (0.0%) | 0 (0.0%) |
| 5 to 17 Years | 265 (0.8%) | 298 (1.0%) |
| 18 to 34 Years | 891 (2.2%) | 865 (2.1%) |
| 35 to 64 Years | 1,839 (2.6%) | 1,554 (2.2%) |
| 65 to 74 Years | 406 (2.4%) | 563 (3.0%) |
| 75 Years and over | 883 (8.9%) | 1,103 (7.5%) |
Disability Class: Cognitive Difficulty
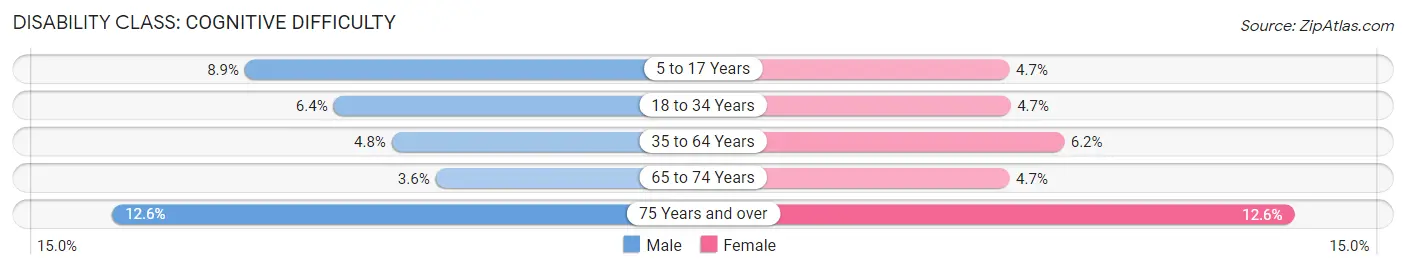
| Age Bracket | Male | Female |
| 5 to 17 Years | 2,867 (8.9%) | 1,408 (4.7%) |
| 18 to 34 Years | 2,635 (6.4%) | 1,938 (4.7%) |
| 35 to 64 Years | 3,385 (4.8%) | 4,410 (6.2%) |
| 65 to 74 Years | 610 (3.6%) | 882 (4.7%) |
| 75 Years and over | 1,250 (12.6%) | 1,852 (12.6%) |
Disability Class: Ambulatory Difficulty
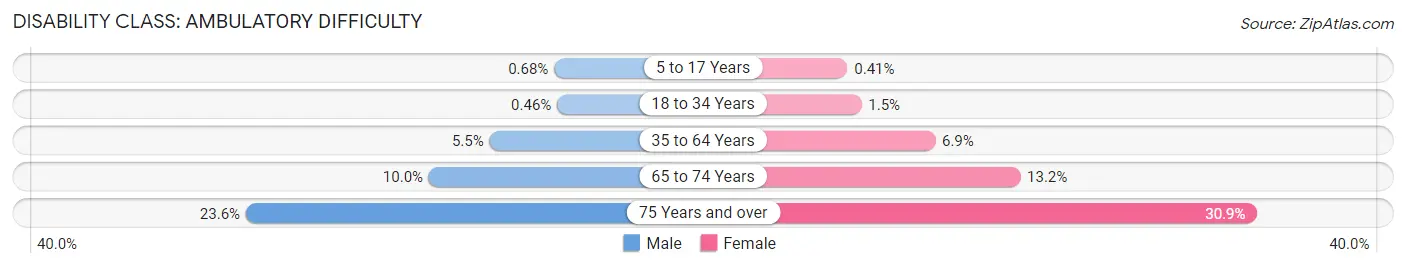
| Age Bracket | Male | Female |
| 5 to 17 Years | 221 (0.7%) | 125 (0.4%) |
| 18 to 34 Years | 191 (0.5%) | 601 (1.5%) |
| 35 to 64 Years | 3,875 (5.5%) | 4,939 (6.9%) |
| 65 to 74 Years | 1,709 (10.0%) | 2,507 (13.2%) |
| 75 Years and over | 2,346 (23.6%) | 4,535 (30.8%) |
Disability Class: Self-Care Difficulty
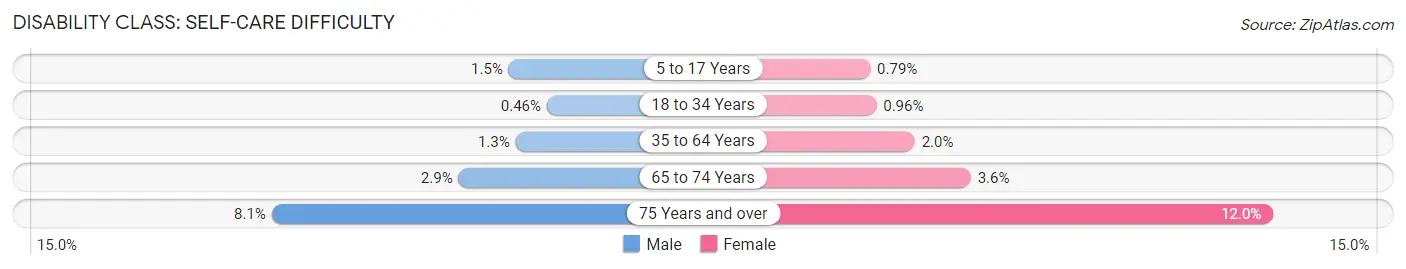
| Age Bracket | Male | Female |
| 5 to 17 Years | 490 (1.5%) | 237 (0.8%) |
| 18 to 34 Years | 189 (0.5%) | 398 (1.0%) |
| 35 to 64 Years | 944 (1.3%) | 1,449 (2.0%) |
| 65 to 74 Years | 500 (2.9%) | 680 (3.6%) |
| 75 Years and over | 808 (8.1%) | 1,766 (12.0%) |
Technology Access in Lehigh County
Computing Device Access in Lehigh County
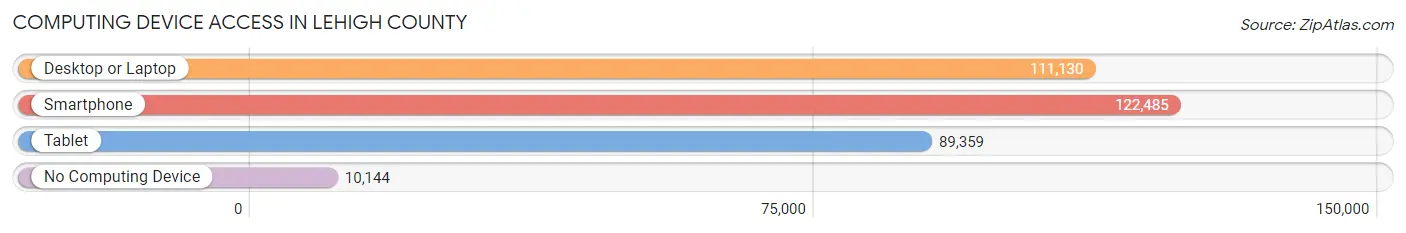
| Device Type | # Households | % Households |
| Desktop or Laptop | 111,130 | 78.2% |
| Smartphone | 122,485 | 86.2% |
| Tablet | 89,359 | 62.9% |
| No Computing Device | 10,144 | 7.1% |
| Total | 142,160 | 100.0% |
Internet Access in Lehigh County
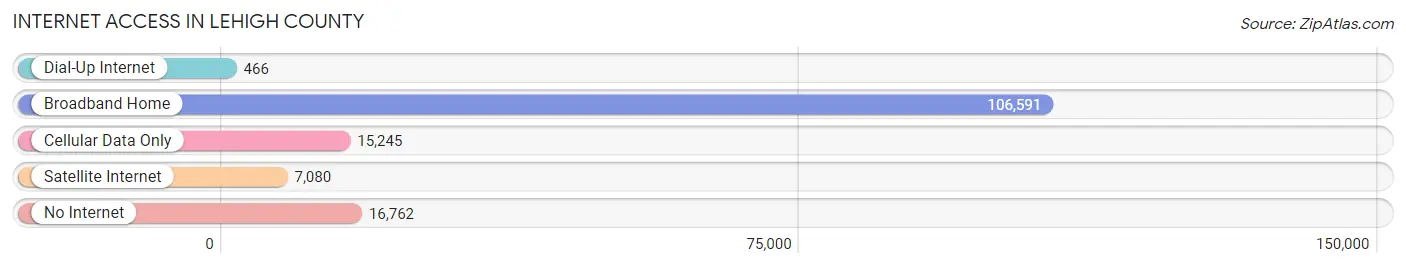
| Internet Type | # Households | % Households |
| Dial-Up Internet | 466 | 0.3% |
| Broadband Home | 106,591 | 75.0% |
| Cellular Data Only | 15,245 | 10.7% |
| Satellite Internet | 7,080 | 5.0% |
| No Internet | 16,762 | 11.8% |
| Total | 142,160 | 100.0% |
Lehigh County Summary
Lehigh County is located in the eastern part of Pennsylvania, in the Lehigh Valley region. It is bordered by Northampton County to the north, Berks County to the west, Montgomery County to the south, and Carbon County to the east. The county seat is Allentown, the third-largest city in Pennsylvania. Lehigh County is part of the Allentown-Bethlehem-Easton, PA-NJ Metropolitan Statistical Area.
Geography
Lehigh County covers an area of 348 square miles, making it the fourth-largest county in Pennsylvania. The county is located in the Lehigh Valley region of the state, which is part of the Great Appalachian Valley. The Lehigh River runs through the county, and is joined by several other rivers and streams, including the Jordan Creek, Little Lehigh Creek, and Saucon Creek. The county is mostly hilly, with the highest point being South Mountain, which has an elevation of 1,065 feet.
The county is home to several parks and recreation areas, including the Lehigh Valley Zoo, the Lehigh Parkway, and the Trexler Nature Preserve. The county also has several golf courses, including the Allentown Municipal Golf Course and the Lehigh Country Club.
Demographics
As of the 2010 census, Lehigh County had a population of 349,497, making it the fourth-most populous county in Pennsylvania. The population density was 1,037 people per square mile. The racial makeup of the county was 81.3% White, 8.2% African American, 0.3% Native American, 4.2% Asian, 0.1% Pacific Islander, 3.7% from other races, and 2.3% from two or more races. Hispanic or Latino of any race were 8.7% of the population.
The median household income in Lehigh County was $60,945, and the median family income was $72,945. The per capita income was $30,945. About 6.2% of the population was below the poverty line.
Economy
Lehigh County has a diverse economy, with a mix of manufacturing, services, and retail. The county is home to several major employers, including Air Products and Chemicals, Crayola, and Lehigh Valley Health Network. The county is also home to several colleges and universities, including Lehigh University, Moravian College, and DeSales University.
The county is home to several major shopping centers, including the Lehigh Valley Mall, the Promenade Shops at Saucon Valley, and the South Mall. The county is also home to several major tourist attractions, including Dorney Park & Wildwater Kingdom, the Crayola Experience, and the Da Vinci Science Center.
Lehigh County is served by several major highways, including Interstate 78, Interstate 476, and U.S. Route 22. The county is also served by the Lehigh Valley International Airport, which is located in Hanover Township. The county is served by several public transportation systems, including the Lehigh and Northampton Transportation Authority (LANTA) and the Lehigh Valley Railroad.
Conclusion
Lehigh County is a diverse and vibrant county located in the eastern part of Pennsylvania. The county is home to several major employers, shopping centers, and tourist attractions, and is served by several major highways and public transportation systems. The county has a diverse economy, with a mix of manufacturing, services, and retail, and a population of 349,497 as of the 2010 census.
Common Questions
What is the Total Population of Lehigh County?
Total Population of Lehigh County is 374,110.
What is the Total Male Population of Lehigh County?
Total Male Population of Lehigh County is 184,521.
What is the Total Female Population of Lehigh County?
Total Female Population of Lehigh County is 189,589.
What is the Ratio of Males per 100 Females in Lehigh County?
There are 97.33 Males per 100 Females in Lehigh County.
What is the Ratio of Females per 100 Males in Lehigh County?
There are 102.75 Females per 100 Males in Lehigh County.
What is the Median Population Age in Lehigh County?
Median Population Age in Lehigh County is 38.9 Years.
What is the Average Family Size in Lehigh County
Average Family Size in Lehigh County is 3.1 People.
What is the Average Household Size in Lehigh County
Average Household Size in Lehigh County is 2.6 People.
What is Per Capita Income in Lehigh County?
Per Capita income in Lehigh County is $39,856.
What is the Median Family Income in Lehigh County?
Median Family Income in Lehigh County is $91,531.
What is the Median Household income in Lehigh County?
Median Household Income in Lehigh County is $74,973.
What is Income or Wage Gap in Lehigh County?
Income or Wage Gap in Lehigh County is 31.8%.
Women in Lehigh County earn 68.2 cents for every dollar earned by a man.
What is Family Income Deficit in Lehigh County?
Family Income Deficit in Lehigh County is $9,957.
Families that are below poverty line in Lehigh County earn $9,957 less on average than the poverty threshold level.
What is Inequality or Gini Index in Lehigh County?
Inequality or Gini Index in Lehigh County is 0.46.
How Large is the Labor Force in Lehigh County?
There are 194,542 People in the Labor Forcein in Lehigh County.
What is the Percentage of People in the Labor Force in Lehigh County?
64.9% of People are in the Labor Force in Lehigh County.
What is the Unemployment Rate in Lehigh County?
Unemployment Rate in Lehigh County is 5.8%.