Brackenridge borough, PA
Brackenridge borough Overview
3,214
TOTAL POPULATION
1,414
MALE POPULATION
1,800
FEMALE POPULATION
78.56
MALES / 100 FEMALES
127.30
FEMALES / 100 MALES
47.9
MEDIAN AGE
2.5
AVG FAMILY SIZE
2.0
AVG HOUSEHOLD SIZE
$28,054
PER CAPITA INCOME
$59,688
AVG FAMILY INCOME
$49,388
AVG HOUSEHOLD INCOME
13.3%
WAGE / INCOME GAP [ % ]
86.7¢/ $1
WAGE / INCOME GAP [ $ ]
0.36
INEQUALITY / GINI INDEX
1,636
LABOR FORCE [ PEOPLE ]
58.5%
PERCENT IN LABOR FORCE
1.5%
UNEMPLOYMENT RATE
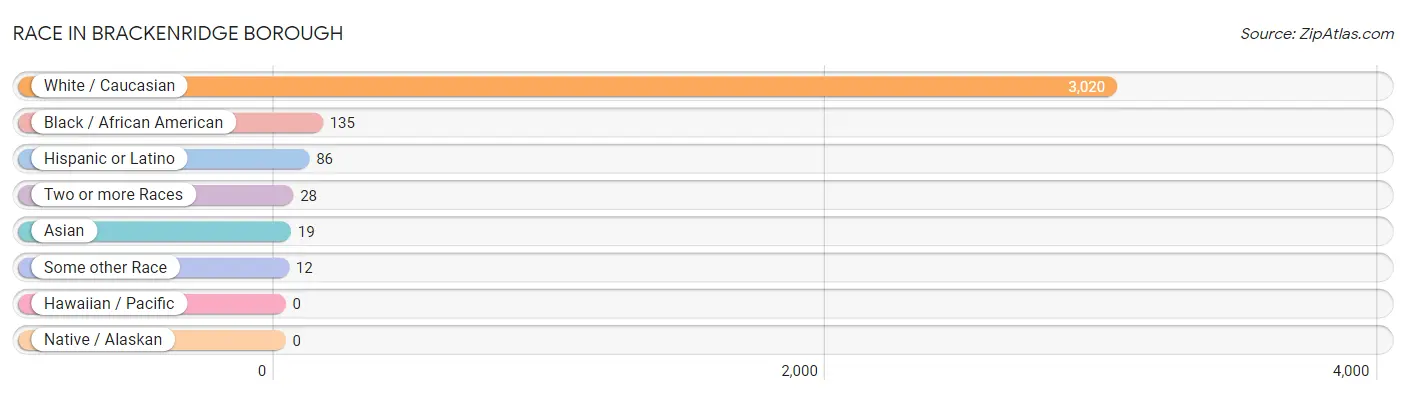
Race in Brackenridge borough
The most populous races in Brackenridge borough are White / Caucasian (3,020 | 94.0%), Black / African American (135 | 4.2%), and Hispanic or Latino (86 | 2.7%).
| Race | # Population | % Population |
| Asian | 19 | 0.6% |
| Black / African American | 135 | 4.2% |
| Hawaiian / Pacific | 0 | 0.0% |
| Hispanic or Latino | 86 | 2.7% |
| Native / Alaskan | 0 | 0.0% |
| White / Caucasian | 3,020 | 94.0% |
| Two or more Races | 28 | 0.9% |
| Some other Race | 12 | 0.4% |
| Total | 3,214 | 100.0% |
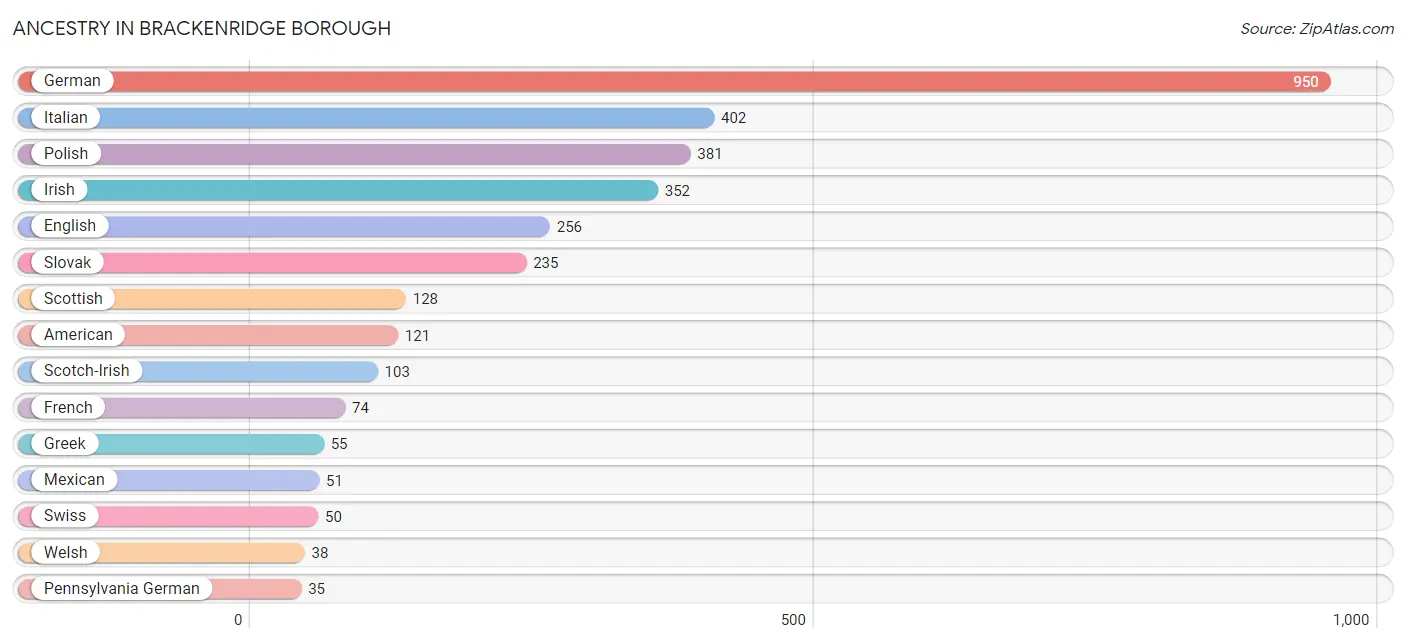
Ancestry in Brackenridge borough
The most populous ancestries reported in Brackenridge borough are German (950 | 29.6%), Italian (402 | 12.5%), Polish (381 | 11.8%), Irish (352 | 11.0%), and English (256 | 8.0%), together accounting for 72.8% of all Brackenridge borough residents.
| Ancestry | # Population | % Population |
| American | 121 | 3.8% |
| Arab | 19 | 0.6% |
| Belgian | 25 | 0.8% |
| Croatian | 6 | 0.2% |
| Czechoslovakian | 30 | 0.9% |
| Dutch | 5 | 0.2% |
| Eastern European | 23 | 0.7% |
| English | 256 | 8.0% |
| European | 34 | 1.1% |
| French | 74 | 2.3% |
| German | 950 | 29.6% |
| Greek | 55 | 1.7% |
| Hungarian | 25 | 0.8% |
| Irish | 352 | 11.0% |
| Italian | 402 | 12.5% |
| Korean | 19 | 0.6% |
| Lithuanian | 11 | 0.3% |
| Lumbee | 12 | 0.4% |
| Mexican | 51 | 1.6% |
| Nigerian | 12 | 0.4% |
| Pennsylvania German | 35 | 1.1% |
| Polish | 381 | 11.8% |
| Puerto Rican | 35 | 1.1% |
| Scotch-Irish | 103 | 3.2% |
| Scottish | 128 | 4.0% |
| Serbian | 11 | 0.3% |
| Slovak | 235 | 7.3% |
| Subsaharan African | 12 | 0.4% |
| Swiss | 50 | 1.6% |
| Syrian | 19 | 0.6% |
| Welsh | 38 | 1.2% | View All 31 Rows |
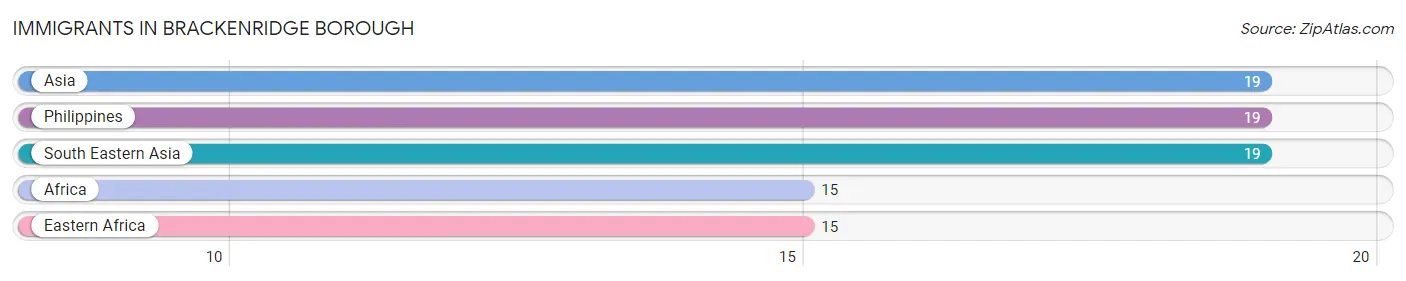
Immigrants in Brackenridge borough
The most numerous immigrant groups reported in Brackenridge borough came from Asia (19 | 0.6%), Philippines (19 | 0.6%), South Eastern Asia (19 | 0.6%), Africa (15 | 0.5%), and Eastern Africa (15 | 0.5%), together accounting for 2.7% of all Brackenridge borough residents.
| Immigration Origin | # Population | % Population |
| Africa | 15 | 0.5% |
| Asia | 19 | 0.6% |
| Eastern Africa | 15 | 0.5% |
| Philippines | 19 | 0.6% |
| South Eastern Asia | 19 | 0.6% | View All 5 Rows |
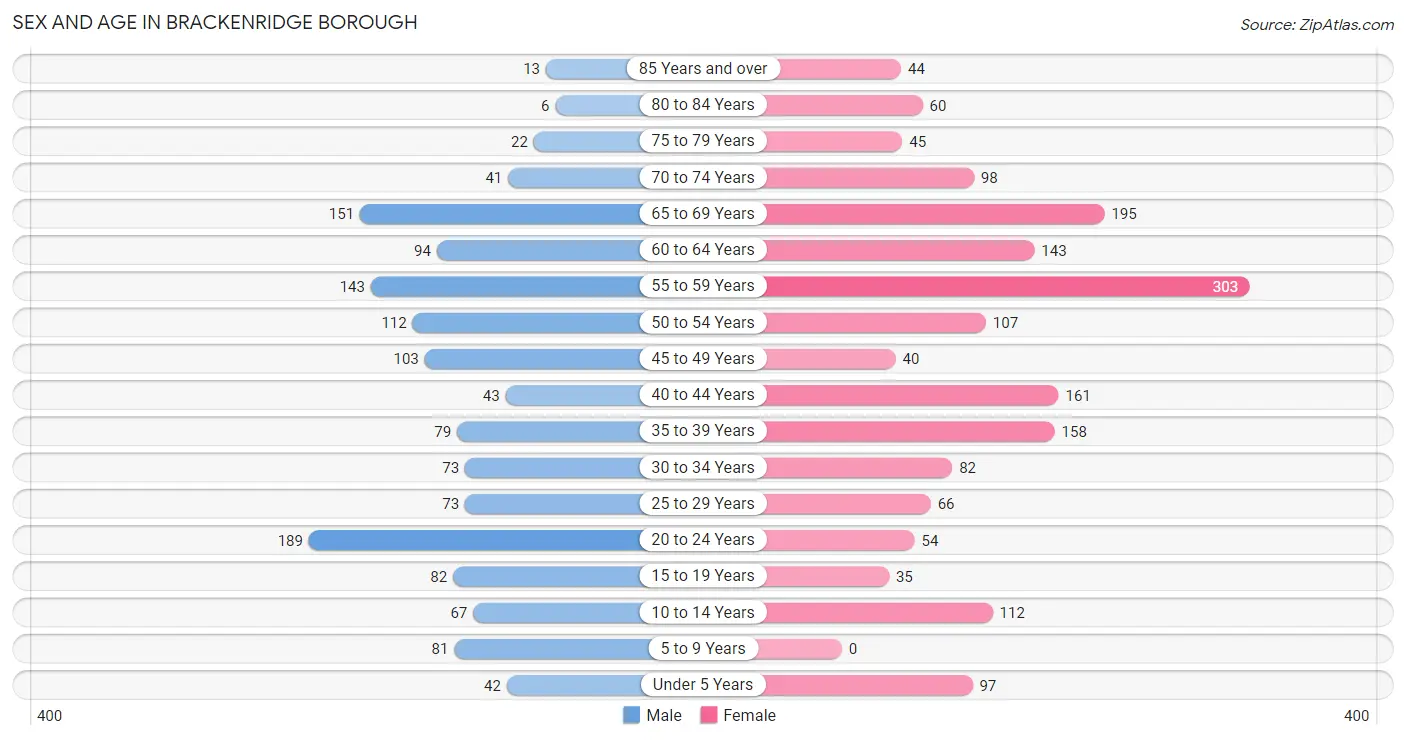
Sex and Age in Brackenridge borough
Sex and Age in Brackenridge borough
The most populous age groups in Brackenridge borough are 20 to 24 Years (189 | 13.4%) for men and 55 to 59 Years (303 | 16.8%) for women.
| Age Bracket | Male | Female |
| Under 5 Years | 42 (3.0%) | 97 (5.4%) |
| 5 to 9 Years | 81 (5.7%) | 0 (0.0%) |
| 10 to 14 Years | 67 (4.7%) | 112 (6.2%) |
| 15 to 19 Years | 82 (5.8%) | 35 (1.9%) |
| 20 to 24 Years | 189 (13.4%) | 54 (3.0%) |
| 25 to 29 Years | 73 (5.2%) | 66 (3.7%) |
| 30 to 34 Years | 73 (5.2%) | 82 (4.6%) |
| 35 to 39 Years | 79 (5.6%) | 158 (8.8%) |
| 40 to 44 Years | 43 (3.0%) | 161 (8.9%) |
| 45 to 49 Years | 103 (7.3%) | 40 (2.2%) |
| 50 to 54 Years | 112 (7.9%) | 107 (5.9%) |
| 55 to 59 Years | 143 (10.1%) | 303 (16.8%) |
| 60 to 64 Years | 94 (6.7%) | 143 (7.9%) |
| 65 to 69 Years | 151 (10.7%) | 195 (10.8%) |
| 70 to 74 Years | 41 (2.9%) | 98 (5.4%) |
| 75 to 79 Years | 22 (1.6%) | 45 (2.5%) |
| 80 to 84 Years | 6 (0.4%) | 60 (3.3%) |
| 85 Years and over | 13 (0.9%) | 44 (2.4%) |
| Total | 1,414 (100.0%) | 1,800 (100.0%) |
Families and Households in Brackenridge borough
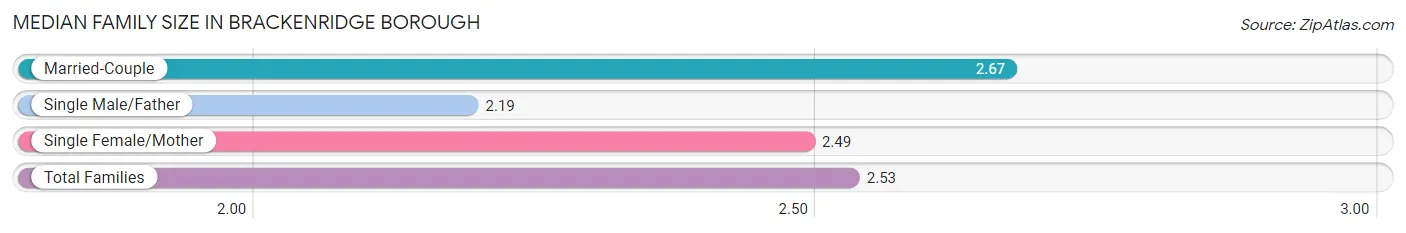
Median Family Size in Brackenridge borough
The median family size in Brackenridge borough is 2.53 persons per family, with married-couple families (373 | 44.1%) accounting for the largest median family size of 2.67 persons per family. On the other hand, single male/father families (129 | 15.2%) represent the smallest median family size with 2.19 persons per family.
| Family Type | # Families | Family Size |
| Married-Couple | 373 (44.1%) | 2.67 |
| Single Male/Father | 129 (15.2%) | 2.19 |
| Single Female/Mother | 344 (40.7%) | 2.49 |
| Total Families | 846 (100.0%) | 2.53 |
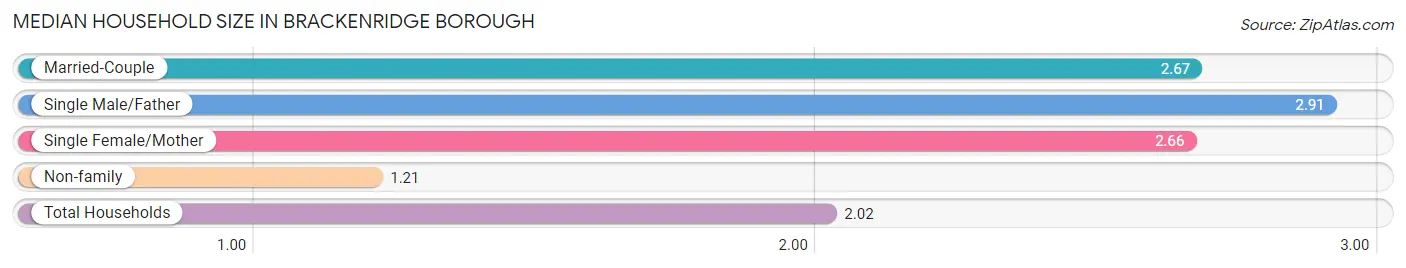
Median Household Size in Brackenridge borough
The median household size in Brackenridge borough is 2.02 persons per household, with single male/father households (129 | 8.3%) accounting for the largest median household size of 2.91 persons per household. non-family households (705 | 45.5%) represent the smallest median household size with 1.21 persons per household.
| Household Type | # Households | Household Size |
| Married-Couple | 373 (24.0%) | 2.67 |
| Single Male/Father | 129 (8.3%) | 2.91 |
| Single Female/Mother | 344 (22.2%) | 2.66 |
| Non-family | 705 (45.5%) | 1.21 |
| Total Households | 1,551 (100.0%) | 2.02 |
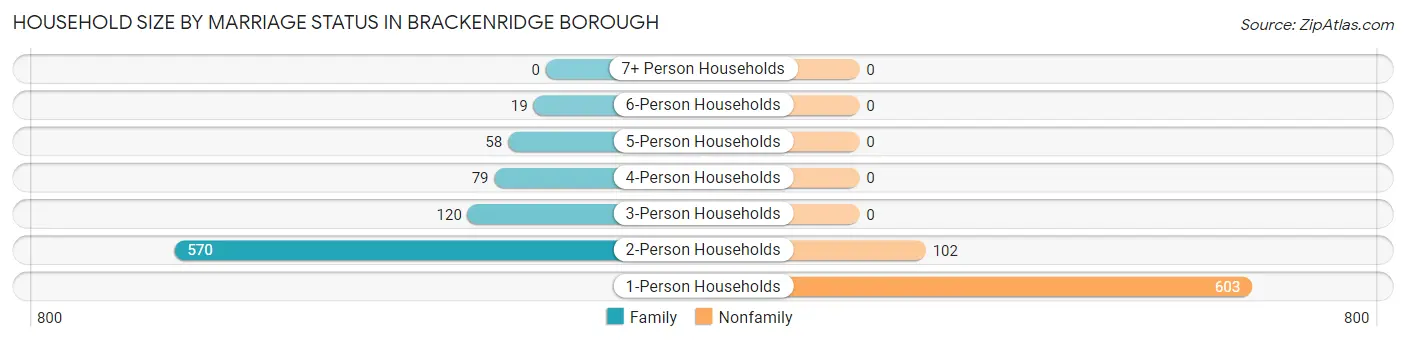
Household Size by Marriage Status in Brackenridge borough
Out of a total of 1,551 households in Brackenridge borough, 846 (54.5%) are family households, while 705 (45.5%) are nonfamily households. The most numerous type of family households are 2-person households, comprising 570, and the most common type of nonfamily households are 1-person households, comprising 603.
| Household Size | Family Households | Nonfamily Households |
| 1-Person Households | - | 603 (38.9%) |
| 2-Person Households | 570 (36.7%) | 102 (6.6%) |
| 3-Person Households | 120 (7.7%) | 0 (0.0%) |
| 4-Person Households | 79 (5.1%) | 0 (0.0%) |
| 5-Person Households | 58 (3.7%) | 0 (0.0%) |
| 6-Person Households | 19 (1.2%) | 0 (0.0%) |
| 7+ Person Households | 0 (0.0%) | 0 (0.0%) |
| Total | 846 (54.5%) | 705 (45.5%) |
Female Fertility in Brackenridge borough
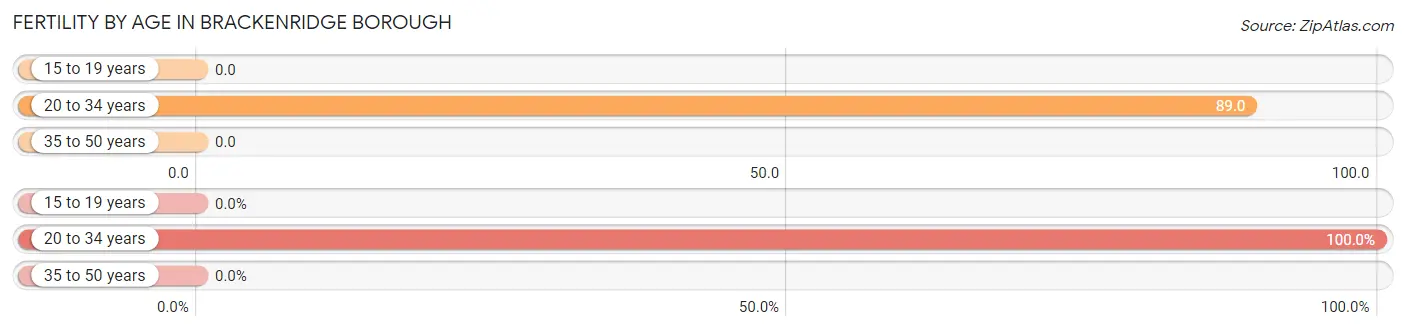
Fertility by Age in Brackenridge borough
Average fertility rate in Brackenridge borough is 30.0 births per 1,000 women. Women in the age bracket of 20 to 34 years have the highest fertility rate with 89.0 births per 1,000 women. Women in the age bracket of 20 to 34 years acount for 100.0% of all women with births.
| Age Bracket | Women with Births | Births / 1,000 Women |
| 15 to 19 years | 0 (0.0%) | 0.0 |
| 20 to 34 years | 18 (100.0%) | 89.0 |
| 35 to 50 years | 0 (0.0%) | 0.0 |
| Total | 18 (100.0%) | 30.0 |
Fertility by Age by Marriage Status in Brackenridge borough
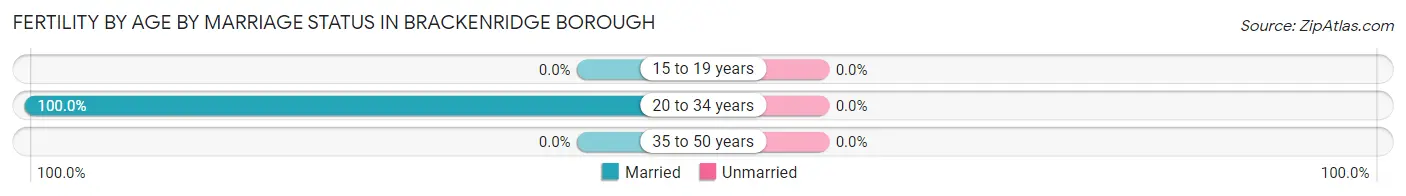
| Age Bracket | Married | Unmarried |
| 15 to 19 years | 0 (0.0%) | 0 (0.0%) |
| 20 to 34 years | 18 (100.0%) | 0 (0.0%) |
| 35 to 50 years | 0 (0.0%) | 0 (0.0%) |
| Total | 18 (100.0%) | 0 (0.0%) |
Fertility by Education in Brackenridge borough
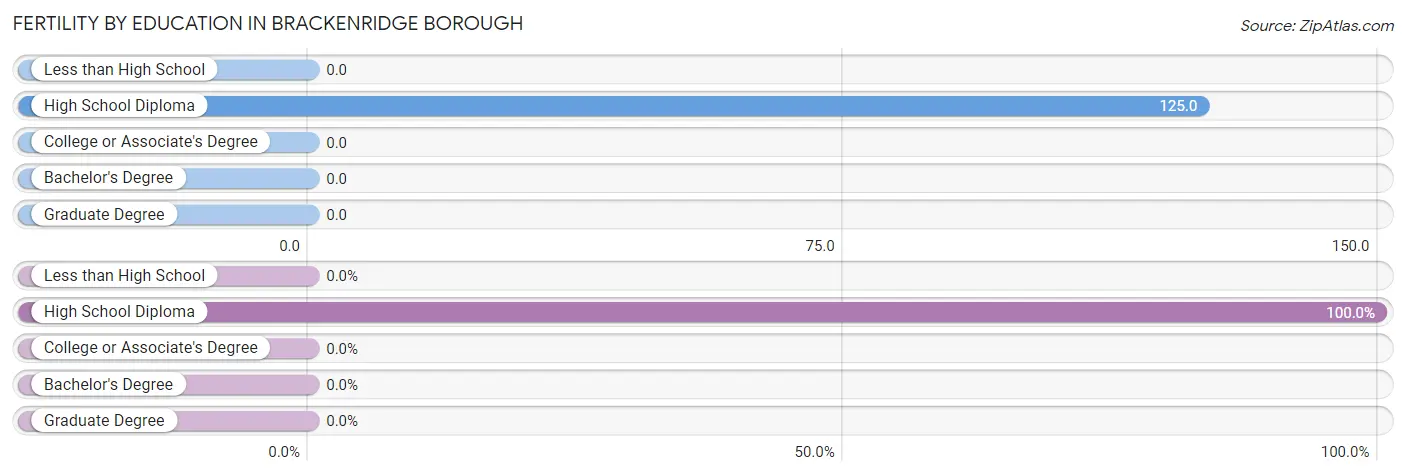
| Educational Attainment | Women with Births | Births / 1,000 Women |
| Less than High School | 0 (0.0%) | 0.0 |
| High School Diploma | 18 (100.0%) | 125.0 |
| College or Associate's Degree | 0 (0.0%) | 0.0 |
| Bachelor's Degree | 0 (0.0%) | 0.0 |
| Graduate Degree | 0 (0.0%) | 0.0 |
| Total | 18 (100.0%) | 30.0 |
Fertility by Education by Marriage Status in Brackenridge borough
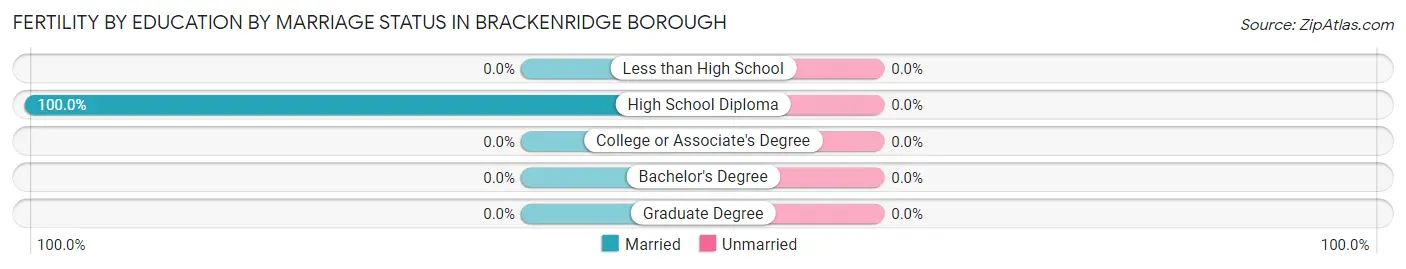
| Educational Attainment | Married | Unmarried |
| Less than High School | 0 (0.0%) | 0 (0.0%) |
| High School Diploma | 18 (100.0%) | 0 (0.0%) |
| College or Associate's Degree | 0 (0.0%) | 0 (0.0%) |
| Bachelor's Degree | 0 (0.0%) | 0 (0.0%) |
| Graduate Degree | 0 (0.0%) | 0 (0.0%) |
| Total | 18 (100.0%) | 0 (0.0%) |
Income in Brackenridge borough
Income Overview in Brackenridge borough
Per Capita Income in Brackenridge borough is $28,054, while median incomes of families and households are $59,688 and $49,388 respectively.
| Characteristic | Number | Measure |
| Per Capita Income | 3,214 | $28,054 |
| Median Family Income | 846 | $59,688 |
| Mean Family Income | 846 | $65,623 |
| Median Household Income | 1,551 | $49,388 |
| Mean Household Income | 1,551 | $55,506 |
| Income Deficit | 846 | $0 |
| Wage / Income Gap (%) | 3,214 | 13.31% |
| Wage / Income Gap ($) | 3,214 | 86.69¢ per $1 |
| Gini / Inequality Index | 3,214 | 0.36 |
Earnings by Sex in Brackenridge borough
Average Earnings in Brackenridge borough are $34,936, $39,592 for men and $34,324 for women, a difference of 13.3%.
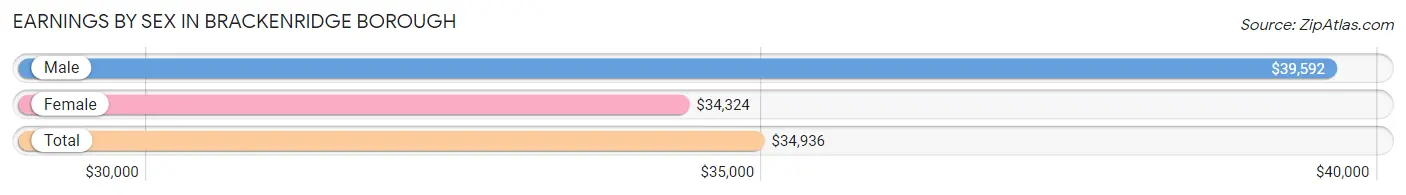
| Sex | Number | Average Earnings |
| Male | 896 (53.1%) | $39,592 |
| Female | 792 (46.9%) | $34,324 |
| Total | 1,688 (100.0%) | $34,936 |
Earnings by Sex by Income Bracket in Brackenridge borough
The most common earnings brackets in Brackenridge borough are $2,499 or less for men (135 | 15.1%) and $30,000 to $34,999 for women (309 | 39.0%).
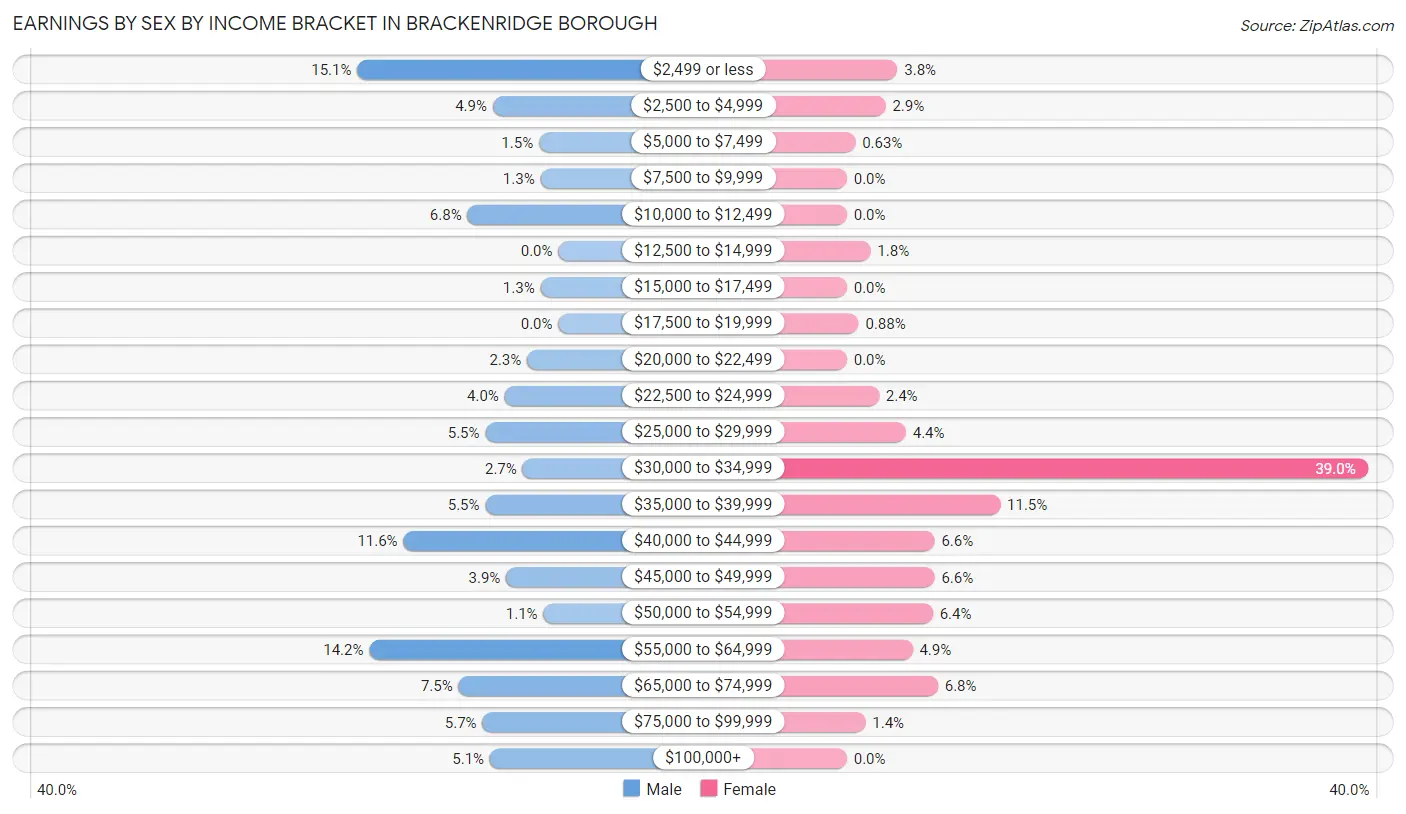
| Income | Male | Female |
| $2,499 or less | 135 (15.1%) | 30 (3.8%) |
| $2,500 to $4,999 | 44 (4.9%) | 23 (2.9%) |
| $5,000 to $7,499 | 13 (1.5%) | 5 (0.6%) |
| $7,500 to $9,999 | 12 (1.3%) | 0 (0.0%) |
| $10,000 to $12,499 | 61 (6.8%) | 0 (0.0%) |
| $12,500 to $14,999 | 0 (0.0%) | 14 (1.8%) |
| $15,000 to $17,499 | 12 (1.3%) | 0 (0.0%) |
| $17,500 to $19,999 | 0 (0.0%) | 7 (0.9%) |
| $20,000 to $22,499 | 21 (2.3%) | 0 (0.0%) |
| $22,500 to $24,999 | 36 (4.0%) | 19 (2.4%) |
| $25,000 to $29,999 | 49 (5.5%) | 35 (4.4%) |
| $30,000 to $34,999 | 24 (2.7%) | 309 (39.0%) |
| $35,000 to $39,999 | 49 (5.5%) | 91 (11.5%) |
| $40,000 to $44,999 | 104 (11.6%) | 52 (6.6%) |
| $45,000 to $49,999 | 35 (3.9%) | 52 (6.6%) |
| $50,000 to $54,999 | 10 (1.1%) | 51 (6.4%) |
| $55,000 to $64,999 | 127 (14.2%) | 39 (4.9%) |
| $65,000 to $74,999 | 67 (7.5%) | 54 (6.8%) |
| $75,000 to $99,999 | 51 (5.7%) | 11 (1.4%) |
| $100,000+ | 46 (5.1%) | 0 (0.0%) |
| Total | 896 (100.0%) | 792 (100.0%) |
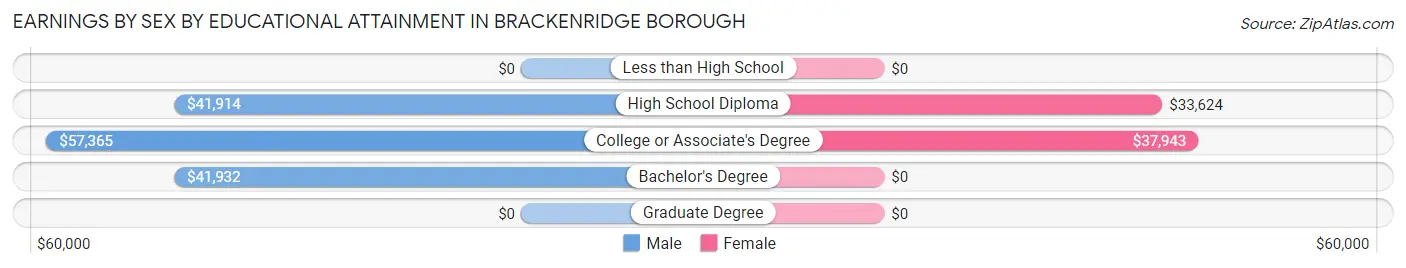
Earnings by Sex by Educational Attainment in Brackenridge borough
Average earnings in Brackenridge borough are $45,789 for men and $34,654 for women, a difference of 24.3%. Men with an educational attainment of college or associate's degree enjoy the highest average annual earnings of $57,365, while those with high school diploma education earn the least with $41,914. Women with an educational attainment of college or associate's degree earn the most with the average annual earnings of $37,943, while those with high school diploma education have the smallest earnings of $33,624.
| Educational Attainment | Male Income | Female Income |
| Less than High School | - | - |
| High School Diploma | $41,914 | $33,624 |
| College or Associate's Degree | $57,365 | $37,943 |
| Bachelor's Degree | $41,932 | $0 |
| Graduate Degree | - | - |
| Total | $45,789 | $34,654 |
Family Income in Brackenridge borough
Family Income Brackets in Brackenridge borough
According to the Brackenridge borough family income data, there are 294 families falling into the $50,000 to $74,999 income range, which is the most common income bracket and makes up 34.7% of all families. Conversely, the $150,000 to $199,999 income bracket is the least frequent group with only 10 families (1.2%) belonging to this category.
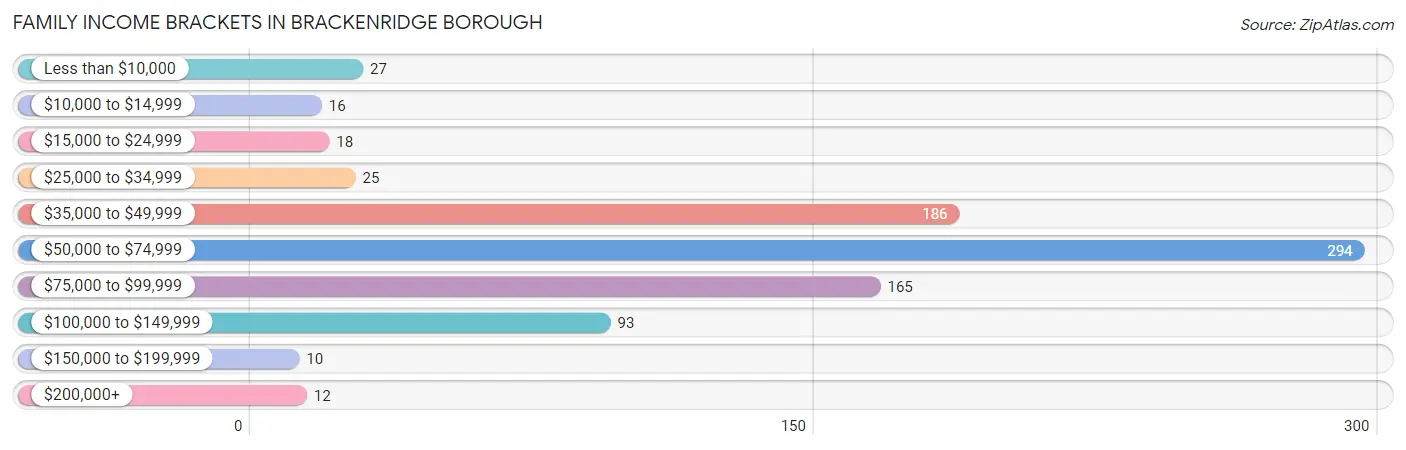
| Income Bracket | # Families | % Families |
| Less than $10,000 | 27 | 3.2% |
| $10,000 to $14,999 | 16 | 1.9% |
| $15,000 to $24,999 | 18 | 2.1% |
| $25,000 to $34,999 | 25 | 3.0% |
| $35,000 to $49,999 | 186 | 22.0% |
| $50,000 to $74,999 | 294 | 34.8% |
| $75,000 to $99,999 | 165 | 19.5% |
| $100,000 to $149,999 | 93 | 11.0% |
| $150,000 to $199,999 | 10 | 1.2% |
| $200,000+ | 12 | 1.4% |
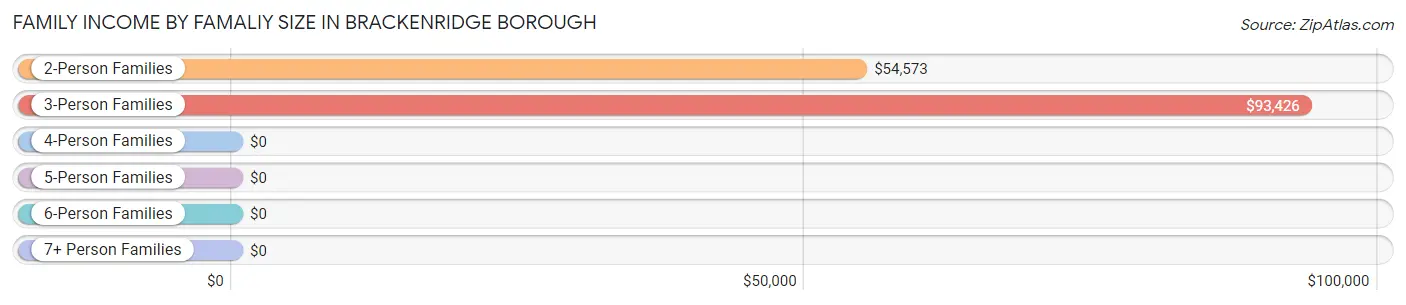
Family Income by Famaliy Size in Brackenridge borough
3-person families (108 | 12.8%) account for the highest median family income in Brackenridge borough with $93,426 per family, while 3-person families (108 | 12.8%) have the highest median income of $31,142 per family member.
| Income Bracket | # Families | Median Income |
| 2-Person Families | 636 (75.2%) | $54,573 |
| 3-Person Families | 108 (12.8%) | $93,426 |
| 4-Person Families | 48 (5.7%) | $0 |
| 5-Person Families | 35 (4.1%) | $0 |
| 6-Person Families | 19 (2.2%) | $0 |
| 7+ Person Families | 0 (0.0%) | $0 |
| Total | 846 (100.0%) | $59,688 |
Family Income by Number of Earners in Brackenridge borough
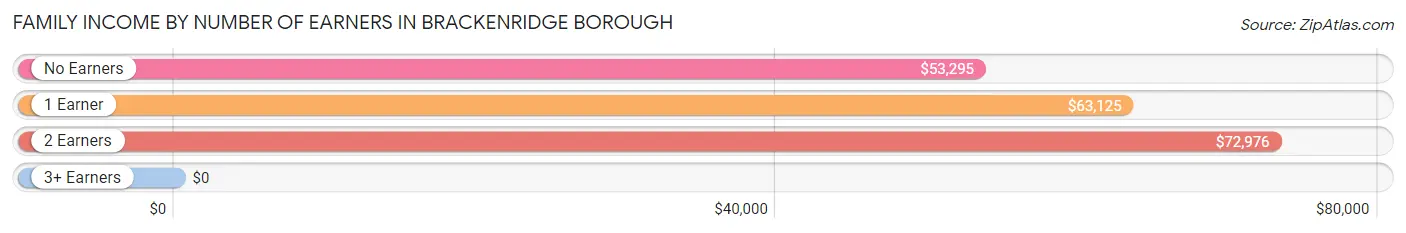
| Number of Earners | # Families | Median Income |
| No Earners | 155 (18.3%) | $53,295 |
| 1 Earner | 341 (40.3%) | $63,125 |
| 2 Earners | 346 (40.9%) | $72,976 |
| 3+ Earners | 4 (0.5%) | $0 |
| Total | 846 (100.0%) | $59,688 |
Household Income in Brackenridge borough
Household Income Brackets in Brackenridge borough
With 330 households falling in the category, the $50,000 to $74,999 income range is the most frequent in Brackenridge borough, accounting for 21.3% of all households. In contrast, only 9 households (0.6%) fall into the $150,000 to $199,999 income bracket, making it the least populous group.
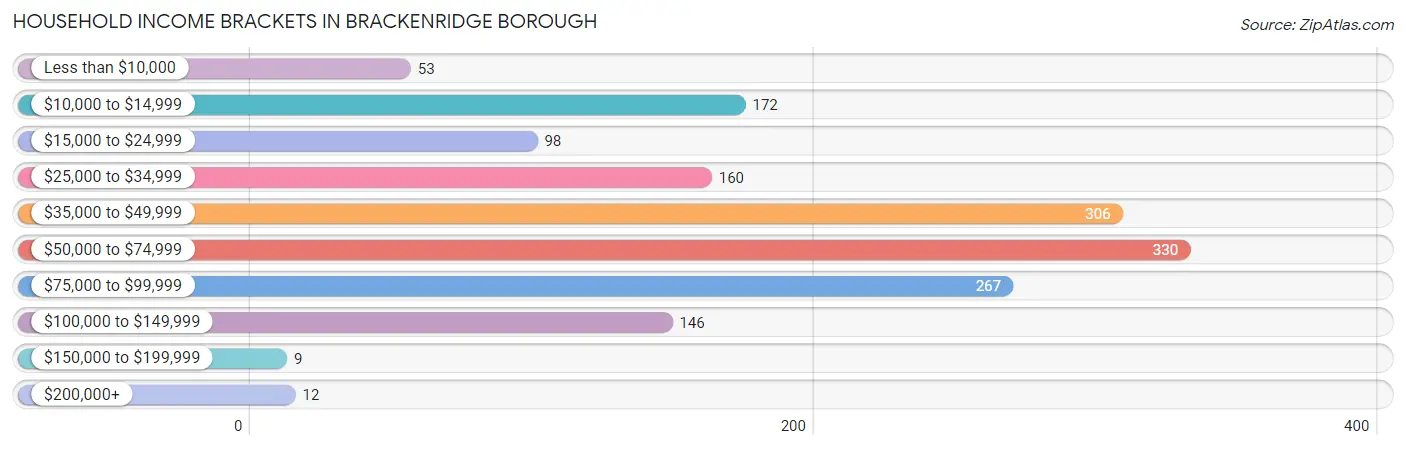
| Income Bracket | # Households | % Households |
| Less than $10,000 | 53 | 3.4% |
| $10,000 to $14,999 | 172 | 11.1% |
| $15,000 to $24,999 | 98 | 6.3% |
| $25,000 to $34,999 | 160 | 10.3% |
| $35,000 to $49,999 | 306 | 19.7% |
| $50,000 to $74,999 | 330 | 21.3% |
| $75,000 to $99,999 | 267 | 17.2% |
| $100,000 to $149,999 | 146 | 9.4% |
| $150,000 to $199,999 | 9 | 0.6% |
| $200,000+ | 12 | 0.8% |
Household Income by Householder Age in Brackenridge borough
The median household income in Brackenridge borough is $49,388, with the highest median household income of $74,375 found in the 25 to 44 years age bracket for the primary householder. A total of 323 households (20.8%) fall into this category. Meanwhile, the 15 to 24 years age bracket for the primary householder has the lowest median household income of $31,667, with 30 households (1.9%) in this group.
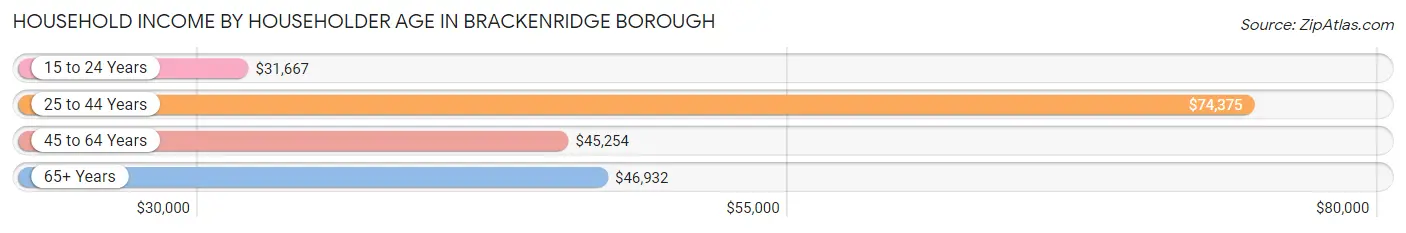
| Income Bracket | # Households | Median Income |
| 15 to 24 Years | 30 (1.9%) | $31,667 |
| 25 to 44 Years | 323 (20.8%) | $74,375 |
| 45 to 64 Years | 749 (48.3%) | $45,254 |
| 65+ Years | 449 (28.9%) | $46,932 |
| Total | 1,551 (100.0%) | $49,388 |
Poverty in Brackenridge borough
Income Below Poverty by Sex and Age in Brackenridge borough
With 8.2% poverty level for males and 12.2% for females among the residents of Brackenridge borough, 55 to 64 year old males and 55 to 64 year old females are the most vulnerable to poverty, with 60 males (25.3%) and 108 females (25.5%) in their respective age groups living below the poverty level.
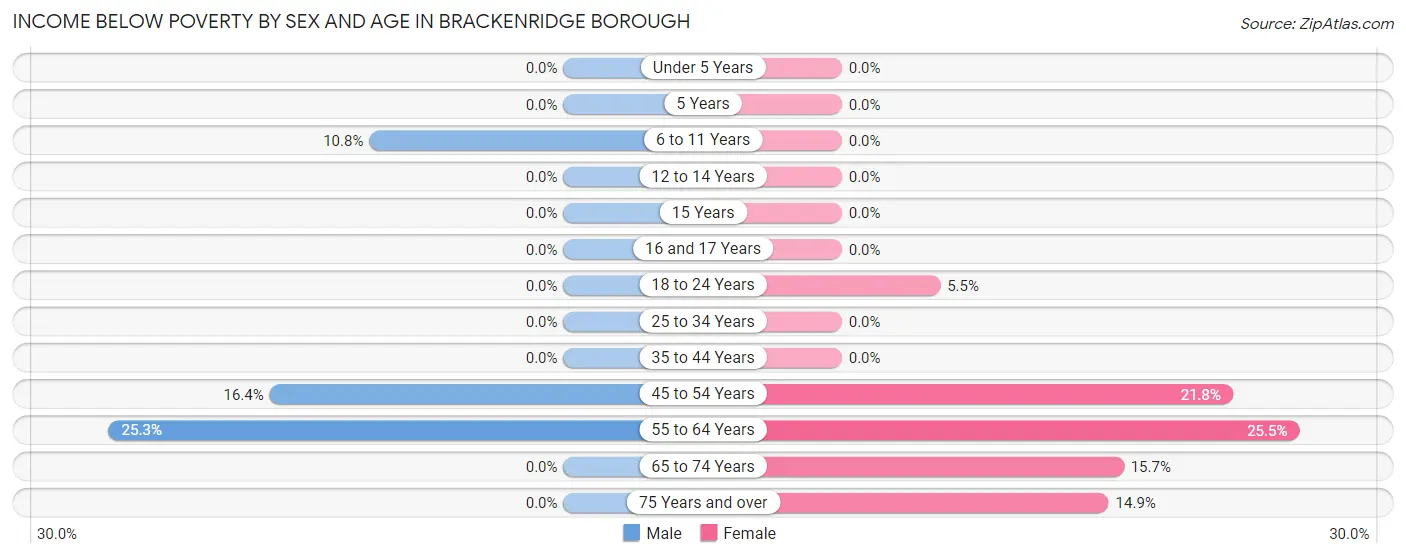
| Age Bracket | Male | Female |
| Under 5 Years | 0 (0.0%) | 0 (0.0%) |
| 5 Years | 0 (0.0%) | 0 (0.0%) |
| 6 to 11 Years | 16 (10.8%) | 0 (0.0%) |
| 12 to 14 Years | 0 (0.0%) | 0 (0.0%) |
| 15 Years | 0 (0.0%) | 0 (0.0%) |
| 16 and 17 Years | 0 (0.0%) | 0 (0.0%) |
| 18 to 24 Years | 0 (0.0%) | 4 (5.5%) |
| 25 to 34 Years | 0 (0.0%) | 0 (0.0%) |
| 35 to 44 Years | 0 (0.0%) | 0 (0.0%) |
| 45 to 54 Years | 35 (16.4%) | 32 (21.8%) |
| 55 to 64 Years | 60 (25.3%) | 108 (25.5%) |
| 65 to 74 Years | 0 (0.0%) | 46 (15.7%) |
| 75 Years and over | 0 (0.0%) | 22 (14.9%) |
| Total | 111 (8.2%) | 212 (12.2%) |
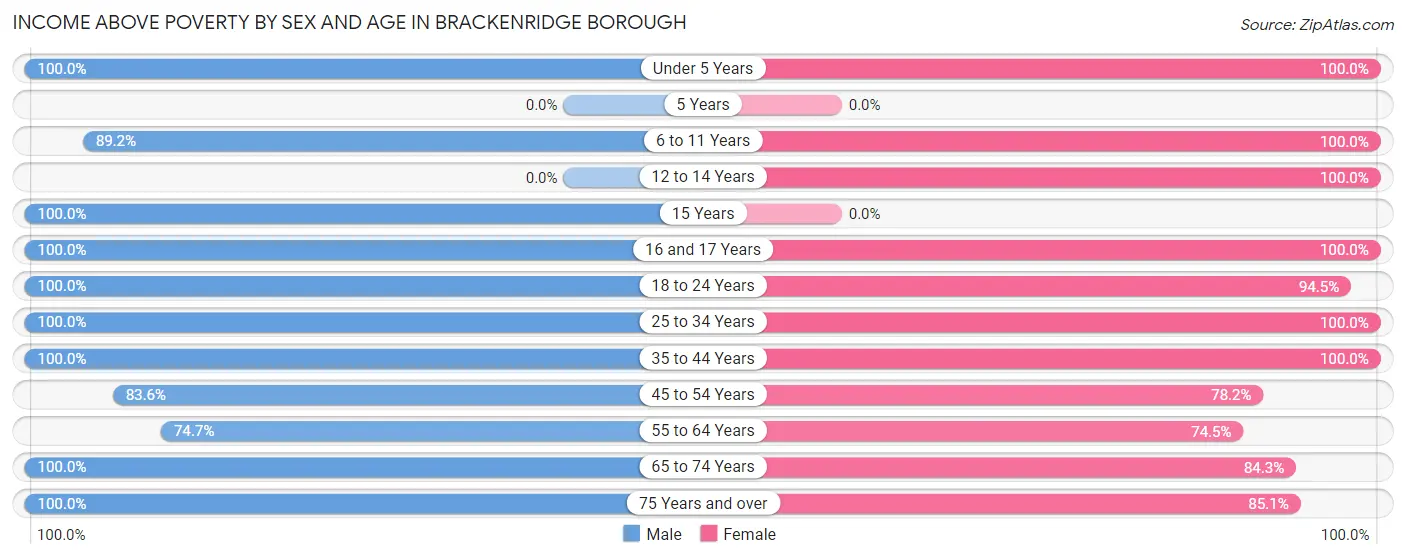
Income Above Poverty by Sex and Age in Brackenridge borough
According to the poverty statistics in Brackenridge borough, males aged under 5 years and females aged under 5 years are the age groups that are most secure financially, with 100.0% of males and 100.0% of females in these age groups living above the poverty line.
| Age Bracket | Male | Female |
| Under 5 Years | 42 (100.0%) | 97 (100.0%) |
| 5 Years | 0 (0.0%) | 0 (0.0%) |
| 6 to 11 Years | 132 (89.2%) | 15 (100.0%) |
| 12 to 14 Years | 0 (0.0%) | 56 (100.0%) |
| 15 Years | 19 (100.0%) | 0 (0.0%) |
| 16 and 17 Years | 16 (100.0%) | 16 (100.0%) |
| 18 to 24 Years | 236 (100.0%) | 69 (94.5%) |
| 25 to 34 Years | 146 (100.0%) | 148 (100.0%) |
| 35 to 44 Years | 122 (100.0%) | 319 (100.0%) |
| 45 to 54 Years | 179 (83.6%) | 115 (78.2%) |
| 55 to 64 Years | 177 (74.7%) | 316 (74.5%) |
| 65 to 74 Years | 160 (100.0%) | 247 (84.3%) |
| 75 Years and over | 20 (100.0%) | 126 (85.1%) |
| Total | 1,249 (91.8%) | 1,524 (87.8%) |
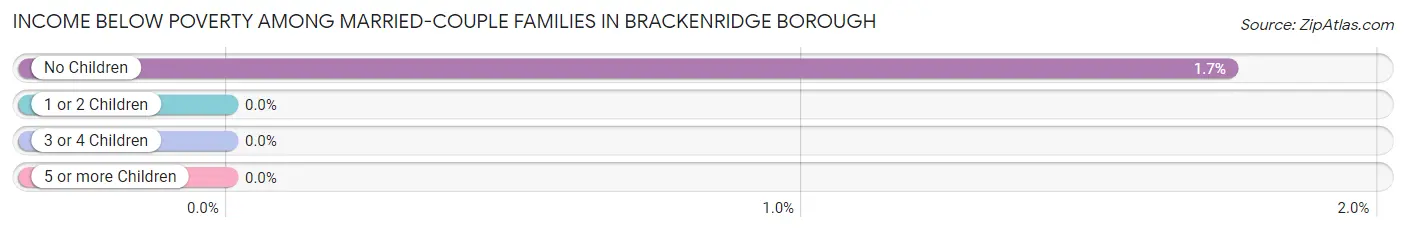
Income Below Poverty Among Married-Couple Families in Brackenridge borough
The poverty statistics for married-couple families in Brackenridge borough show that 1.3% or 5 of the total 373 families live below the poverty line. Families with no children have the highest poverty rate of 1.7%, comprising of 5 families. On the other hand, families with 1 or 2 children have the lowest poverty rate of 0.0%, which includes 0 families.
| Children | Above Poverty | Below Poverty |
| No Children | 283 (98.3%) | 5 (1.7%) |
| 1 or 2 Children | 31 (100.0%) | 0 (0.0%) |
| 3 or 4 Children | 54 (100.0%) | 0 (0.0%) |
| 5 or more Children | 0 (0.0%) | 0 (0.0%) |
| Total | 368 (98.7%) | 5 (1.3%) |
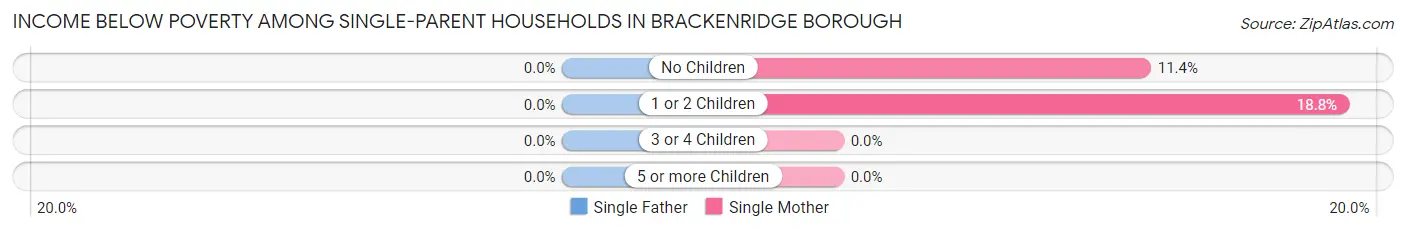
Income Below Poverty Among Single-Parent Households in Brackenridge borough
| Children | Single Father | Single Mother |
| No Children | 0 (0.0%) | 27 (11.4%) |
| 1 or 2 Children | 0 (0.0%) | 16 (18.8%) |
| 3 or 4 Children | 0 (0.0%) | 0 (0.0%) |
| 5 or more Children | 0 (0.0%) | 0 (0.0%) |
| Total | 0 (0.0%) | 43 (12.5%) |
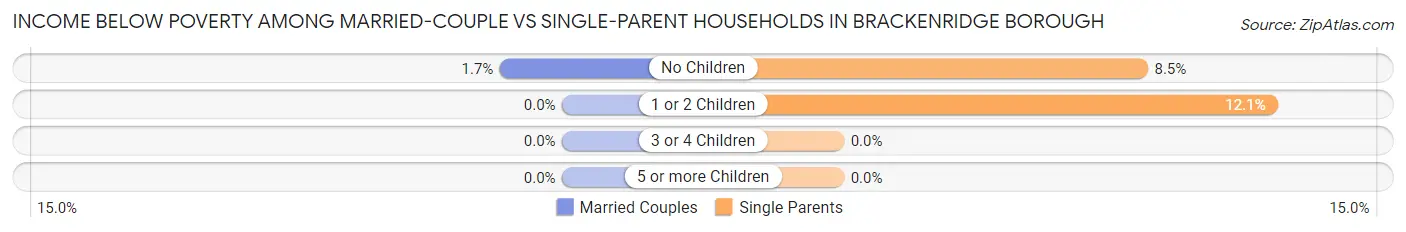
Income Below Poverty Among Married-Couple vs Single-Parent Households in Brackenridge borough
The poverty data for Brackenridge borough shows that 5 of the married-couple family households (1.3%) and 43 of the single-parent households (9.1%) are living below the poverty level. Within the married-couple family households, those with no children have the highest poverty rate, with 5 households (1.7%) falling below the poverty line. Among the single-parent households, those with 1 or 2 children have the highest poverty rate, with 16 household (12.1%) living below poverty.
| Children | Married-Couple Families | Single-Parent Households |
| No Children | 5 (1.7%) | 27 (8.5%) |
| 1 or 2 Children | 0 (0.0%) | 16 (12.1%) |
| 3 or 4 Children | 0 (0.0%) | 0 (0.0%) |
| 5 or more Children | 0 (0.0%) | 0 (0.0%) |
| Total | 5 (1.3%) | 43 (9.1%) |
Employment Characteristics in Brackenridge borough
Employment by Class of Employer in Brackenridge borough
Among the 1,576 employed individuals in Brackenridge borough, private company employees (1,343 | 85.2%), local government employees (104 | 6.6%), and not-for-profit organizations (67 | 4.3%) make up the most common classes of employment.
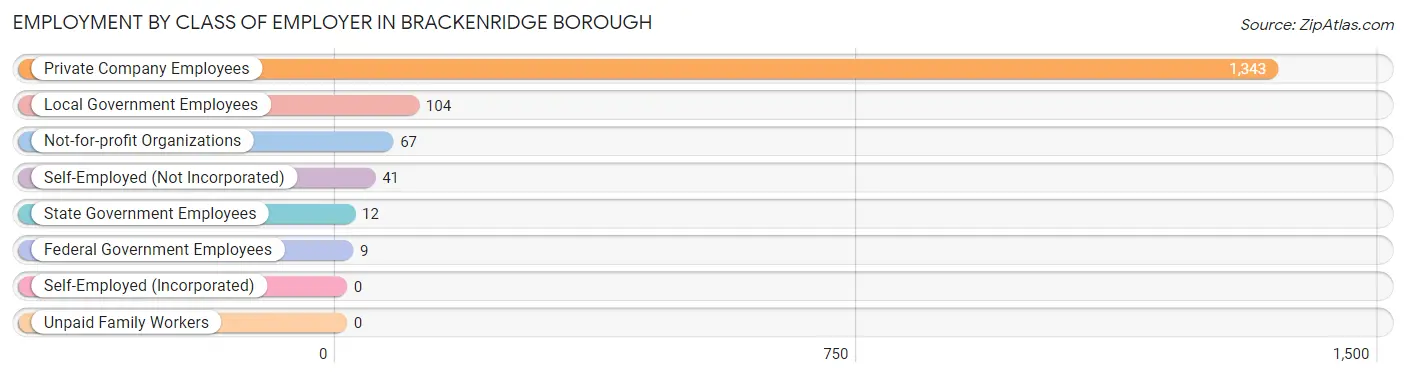
| Employer Class | # Employees | % Employees |
| Private Company Employees | 1,343 | 85.2% |
| Self-Employed (Incorporated) | 0 | 0.0% |
| Self-Employed (Not Incorporated) | 41 | 2.6% |
| Not-for-profit Organizations | 67 | 4.3% |
| Local Government Employees | 104 | 6.6% |
| State Government Employees | 12 | 0.8% |
| Federal Government Employees | 9 | 0.6% |
| Unpaid Family Workers | 0 | 0.0% |
| Total | 1,576 | 100.0% |
Employment Status by Age in Brackenridge borough
According to the labor force statistics for Brackenridge borough, out of the total population over 16 years of age (2,796), 58.5% or 1,636 individuals are in the labor force, with 1.5% or 25 of them unemployed. The age group with the highest labor force participation rate is 35 to 44 years, with 90.0% or 397 individuals in the labor force. Within the labor force, the 65 to 74 years age range has the highest percentage of unemployed individuals, with 12.8% or 14 of them being unemployed.
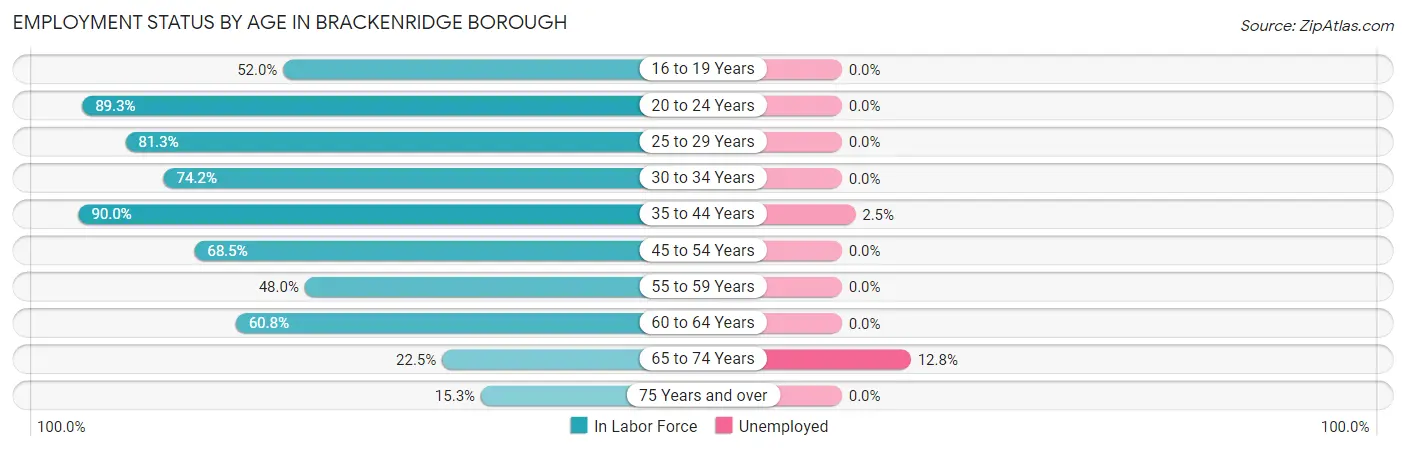
| Age Bracket | In Labor Force | Unemployed |
| 16 to 19 Years | 51 (52.0%) | 0 (0.0%) |
| 20 to 24 Years | 217 (89.3%) | 0 (0.0%) |
| 25 to 29 Years | 113 (81.3%) | 0 (0.0%) |
| 30 to 34 Years | 115 (74.2%) | 0 (0.0%) |
| 35 to 44 Years | 397 (90.0%) | 10 (2.5%) |
| 45 to 54 Years | 248 (68.5%) | 0 (0.0%) |
| 55 to 59 Years | 214 (48.0%) | 0 (0.0%) |
| 60 to 64 Years | 144 (60.8%) | 0 (0.0%) |
| 65 to 74 Years | 109 (22.5%) | 14 (12.8%) |
| 75 Years and over | 29 (15.3%) | 0 (0.0%) |
| Total | 1,636 (58.5%) | 25 (1.5%) |
Employment Status by Educational Attainment in Brackenridge borough
According to labor force statistics for Brackenridge borough, 69.2% of individuals (1,232) out of the total population between 25 and 64 years of age (1,780) are in the labor force, with 0.8% or 10 of them being unemployed. The group with the highest labor force participation rate are those with the educational attainment of bachelor's degree or higher, with 83.1% or 266 individuals in the labor force. Within the labor force, individuals with bachelor's degree or higher education have the highest percentage of unemployment, with 3.8% or 10 of them being unemployed.
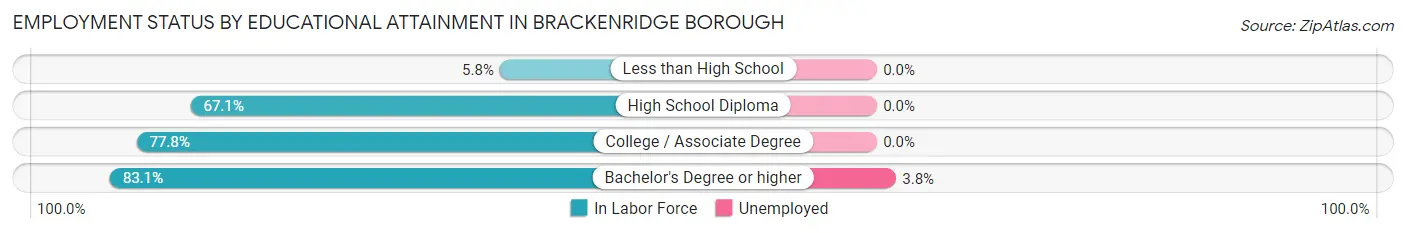
| Educational Attainment | In Labor Force | Unemployed |
| Less than High School | 8 (5.8%) | 0 (0.0%) |
| High School Diploma | 450 (67.1%) | 0 (0.0%) |
| College / Associate Degree | 507 (77.8%) | 0 (0.0%) |
| Bachelor's Degree or higher | 266 (83.1%) | 12 (3.8%) |
| Total | 1,232 (69.2%) | 14 (0.8%) |
Employment Occupations by Sex in Brackenridge borough
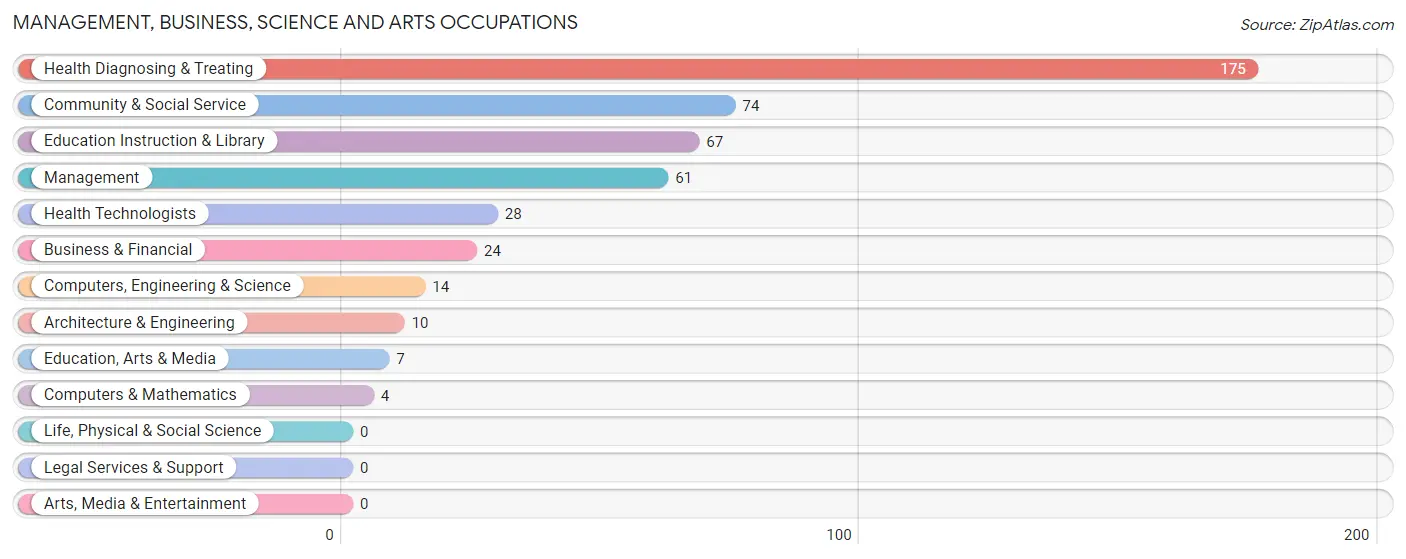
Management, Business, Science and Arts Occupations
The most common Management, Business, Science and Arts occupations in Brackenridge borough are Health Diagnosing & Treating (175 | 10.8%), Community & Social Service (74 | 4.6%), Education Instruction & Library (67 | 4.2%), Management (61 | 3.8%), and Health Technologists (28 | 1.7%).
Management, Business, Science and Arts Occupations by Sex
Within the Management, Business, Science and Arts occupations in Brackenridge borough, the most male-oriented occupations are Business & Financial (100.0%), Computers, Engineering & Science (100.0%), and Computers & Mathematics (100.0%), while the most female-oriented occupations are Education, Arts & Media (100.0%), Health Technologists (100.0%), and Management (82.0%).
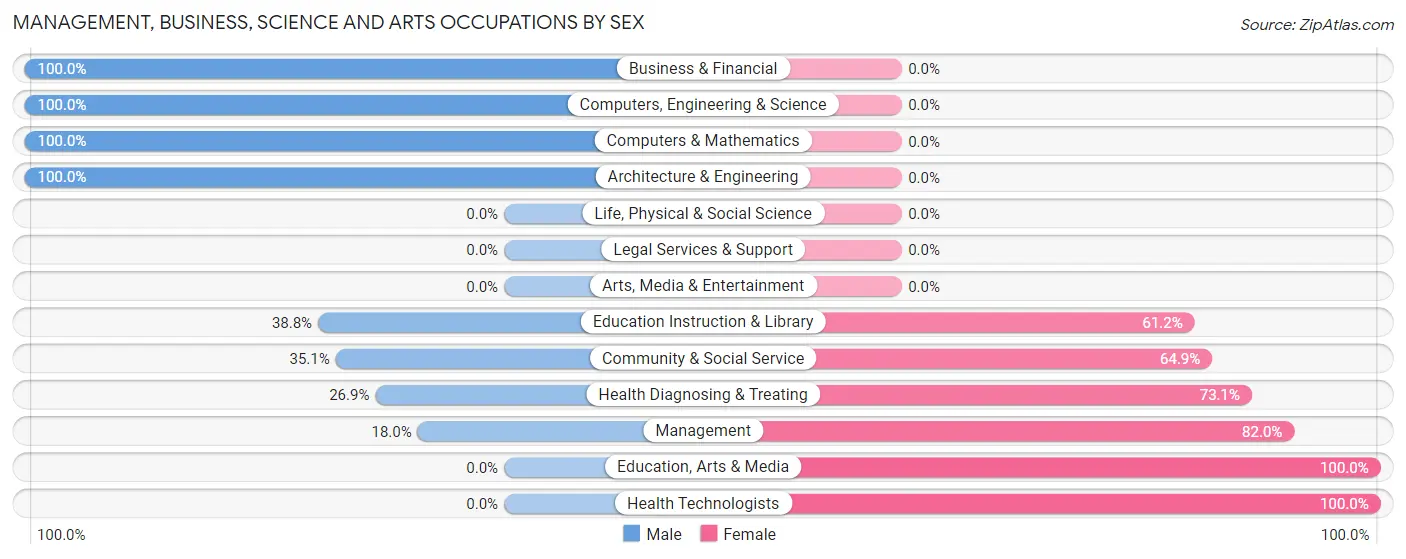
| Occupation | Male | Female |
| Management | 11 (18.0%) | 50 (82.0%) |
| Business & Financial | 24 (100.0%) | 0 (0.0%) |
| Computers, Engineering & Science | 14 (100.0%) | 0 (0.0%) |
| Computers & Mathematics | 4 (100.0%) | 0 (0.0%) |
| Architecture & Engineering | 10 (100.0%) | 0 (0.0%) |
| Life, Physical & Social Science | 0 (0.0%) | 0 (0.0%) |
| Community & Social Service | 26 (35.1%) | 48 (64.9%) |
| Education, Arts & Media | 0 (0.0%) | 7 (100.0%) |
| Legal Services & Support | 0 (0.0%) | 0 (0.0%) |
| Education Instruction & Library | 26 (38.8%) | 41 (61.2%) |
| Arts, Media & Entertainment | 0 (0.0%) | 0 (0.0%) |
| Health Diagnosing & Treating | 47 (26.9%) | 128 (73.1%) |
| Health Technologists | 0 (0.0%) | 28 (100.0%) |
| Total (Category) | 122 (35.1%) | 226 (64.9%) |
| Total (Overall) | 829 (51.4%) | 784 (48.6%) |
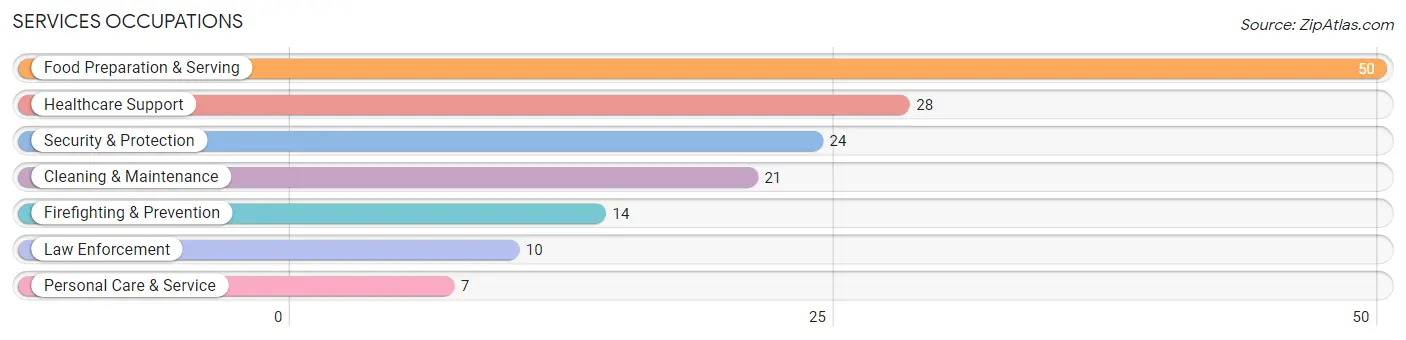
Services Occupations
The most common Services occupations in Brackenridge borough are Food Preparation & Serving (50 | 3.1%), Healthcare Support (28 | 1.7%), Security & Protection (24 | 1.5%), Cleaning & Maintenance (21 | 1.3%), and Firefighting & Prevention (14 | 0.9%).
Services Occupations by Sex
Within the Services occupations in Brackenridge borough, the most male-oriented occupations are Law Enforcement (100.0%), Security & Protection (83.3%), and Food Preparation & Serving (82.0%), while the most female-oriented occupations are Personal Care & Service (100.0%), Healthcare Support (57.1%), and Cleaning & Maintenance (42.9%).
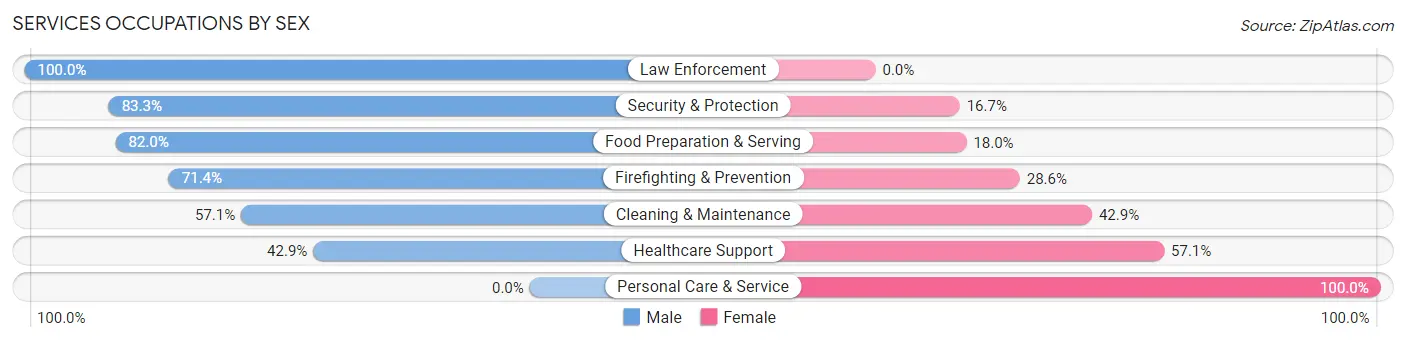
| Occupation | Male | Female |
| Healthcare Support | 12 (42.9%) | 16 (57.1%) |
| Security & Protection | 20 (83.3%) | 4 (16.7%) |
| Firefighting & Prevention | 10 (71.4%) | 4 (28.6%) |
| Law Enforcement | 10 (100.0%) | 0 (0.0%) |
| Food Preparation & Serving | 41 (82.0%) | 9 (18.0%) |
| Cleaning & Maintenance | 12 (57.1%) | 9 (42.9%) |
| Personal Care & Service | 0 (0.0%) | 7 (100.0%) |
| Total (Category) | 85 (65.4%) | 45 (34.6%) |
| Total (Overall) | 829 (51.4%) | 784 (48.6%) |
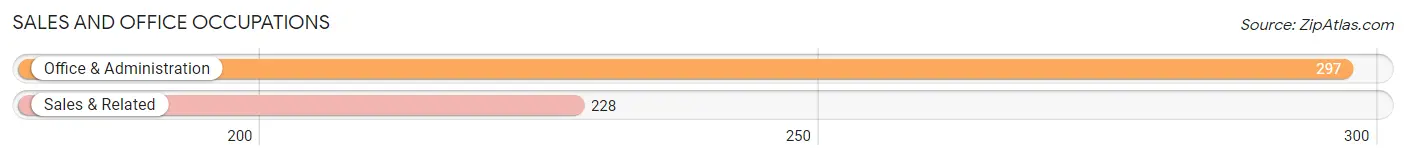
Sales and Office Occupations
The most common Sales and Office occupations in Brackenridge borough are Office & Administration (297 | 18.4%), and Sales & Related (228 | 14.1%).
Sales and Office Occupations by Sex

| Occupation | Male | Female |
| Sales & Related | 137 (60.1%) | 91 (39.9%) |
| Office & Administration | 34 (11.5%) | 263 (88.5%) |
| Total (Category) | 171 (32.6%) | 354 (67.4%) |
| Total (Overall) | 829 (51.4%) | 784 (48.6%) |
Natural Resources, Construction and Maintenance Occupations
The most common Natural Resources, Construction and Maintenance occupations in Brackenridge borough are Construction & Extraction (162 | 10.0%), and Installation, Maintenance & Repair (81 | 5.0%).
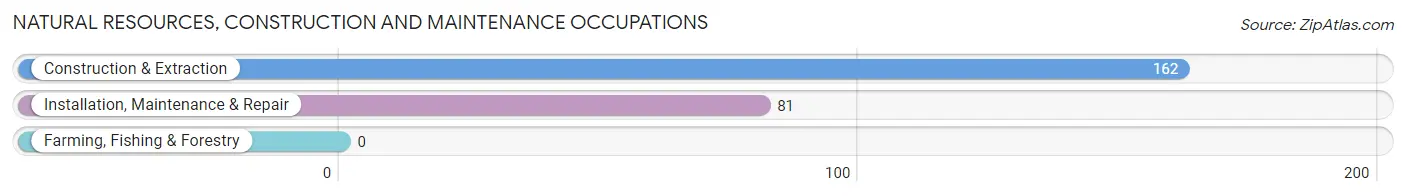
Natural Resources, Construction and Maintenance Occupations by Sex

| Occupation | Male | Female |
| Farming, Fishing & Forestry | 0 (0.0%) | 0 (0.0%) |
| Construction & Extraction | 162 (100.0%) | 0 (0.0%) |
| Installation, Maintenance & Repair | 81 (100.0%) | 0 (0.0%) |
| Total (Category) | 243 (100.0%) | 0 (0.0%) |
| Total (Overall) | 829 (51.4%) | 784 (48.6%) |
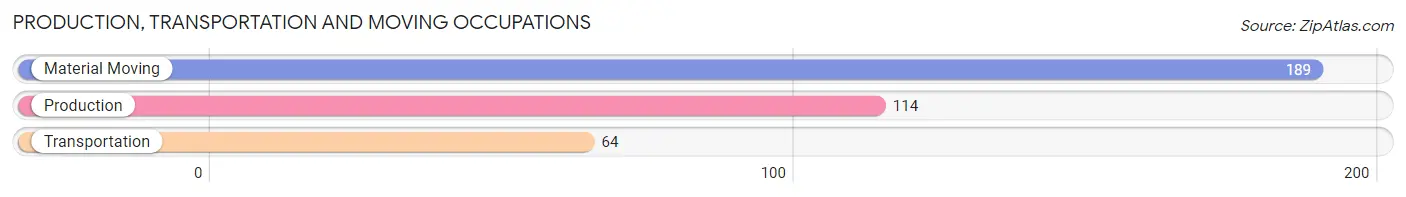
Production, Transportation and Moving Occupations
The most common Production, Transportation and Moving occupations in Brackenridge borough are Material Moving (189 | 11.7%), Production (114 | 7.1%), and Transportation (64 | 4.0%).
Production, Transportation and Moving Occupations by Sex
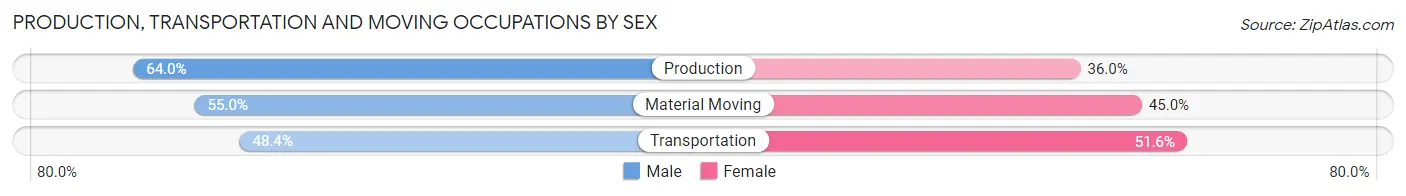
| Occupation | Male | Female |
| Production | 73 (64.0%) | 41 (36.0%) |
| Transportation | 31 (48.4%) | 33 (51.6%) |
| Material Moving | 104 (55.0%) | 85 (45.0%) |
| Total (Category) | 208 (56.7%) | 159 (43.3%) |
| Total (Overall) | 829 (51.4%) | 784 (48.6%) |
Employment Industries by Sex in Brackenridge borough
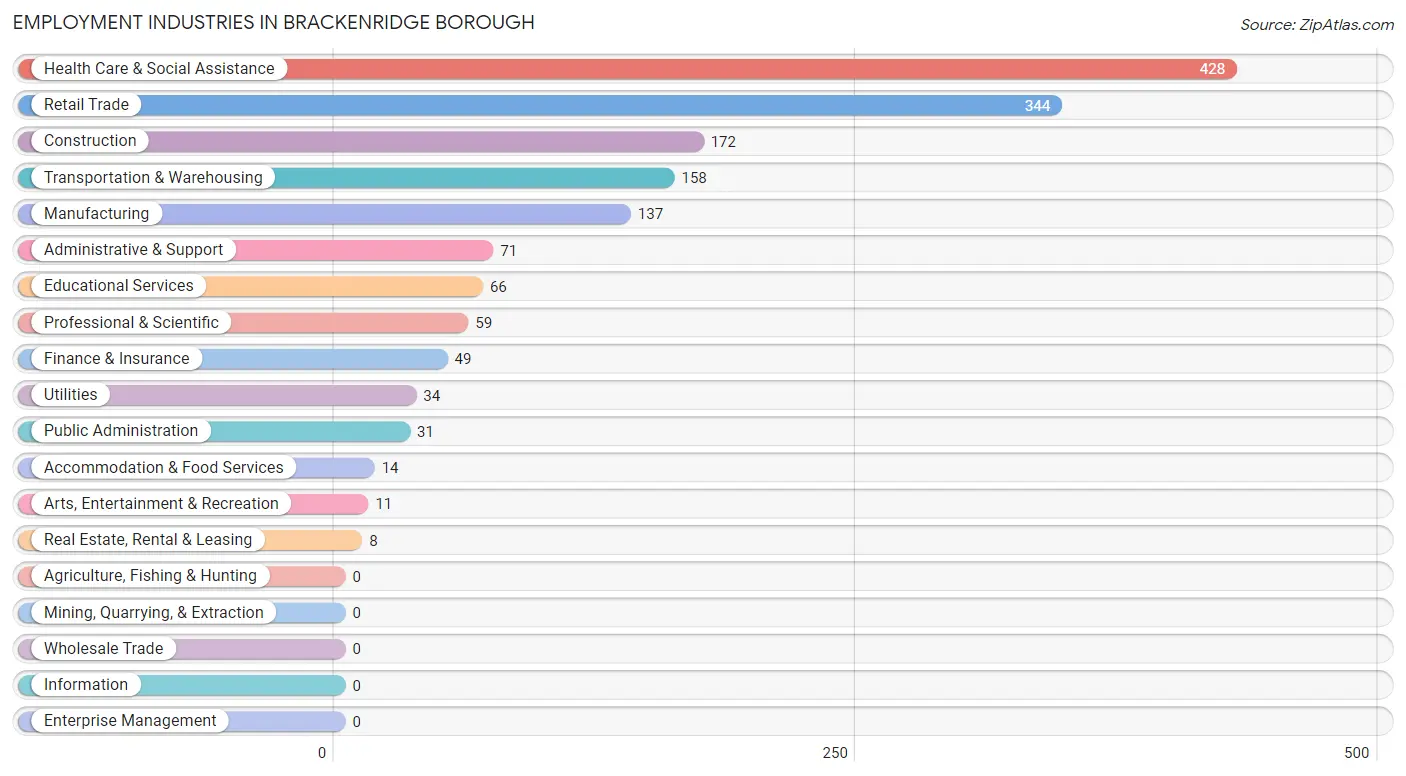
Employment Industries in Brackenridge borough
The major employment industries in Brackenridge borough include Health Care & Social Assistance (428 | 26.5%), Retail Trade (344 | 21.3%), Construction (172 | 10.7%), Transportation & Warehousing (158 | 9.8%), and Manufacturing (137 | 8.5%).
Employment Industries by Sex in Brackenridge borough
The Brackenridge borough industries that see more men than women are Construction (100.0%), Utilities (100.0%), and Real Estate, Rental & Leasing (100.0%), whereas the industries that tend to have a higher number of women are Arts, Entertainment & Recreation (100.0%), Health Care & Social Assistance (82.5%), and Transportation & Warehousing (74.7%).
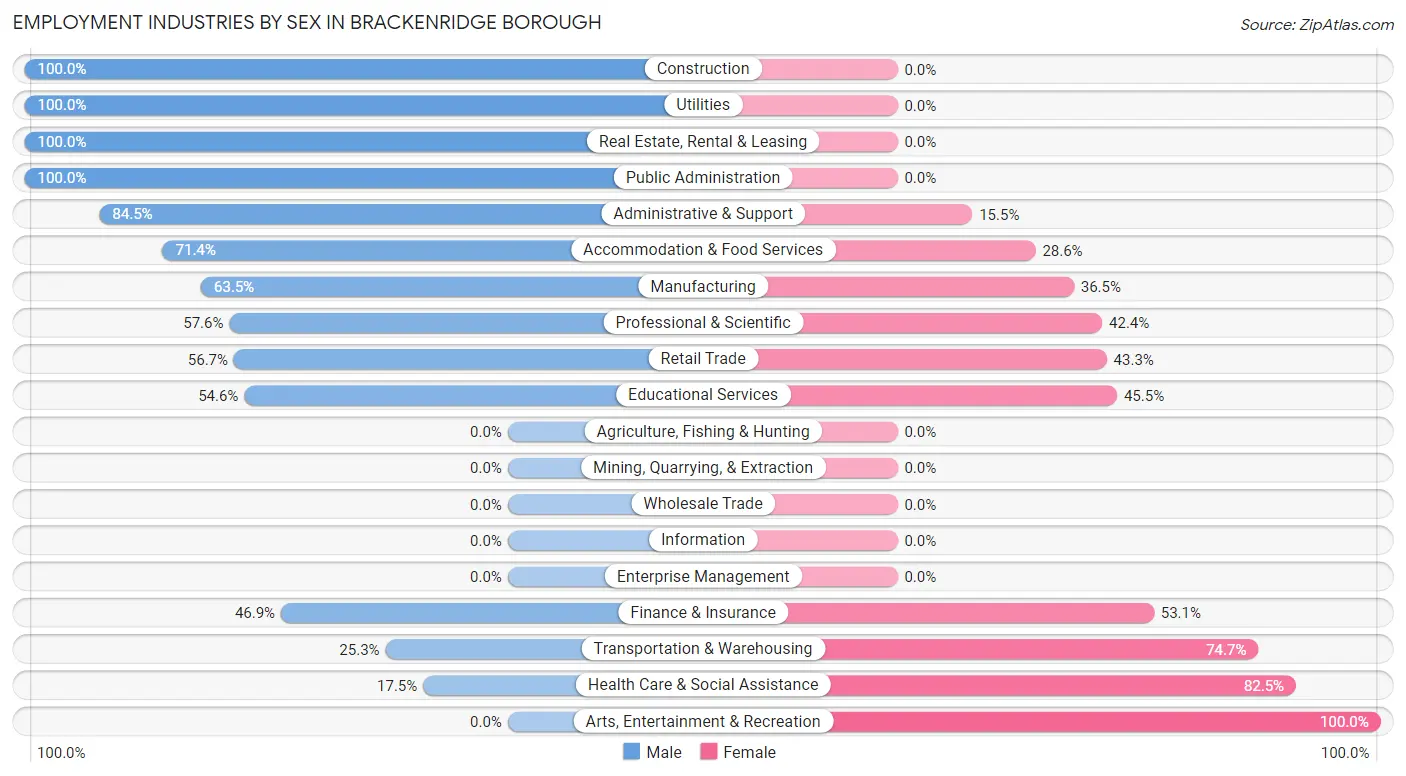
| Industry | Male | Female |
| Agriculture, Fishing & Hunting | 0 (0.0%) | 0 (0.0%) |
| Mining, Quarrying, & Extraction | 0 (0.0%) | 0 (0.0%) |
| Construction | 172 (100.0%) | 0 (0.0%) |
| Manufacturing | 87 (63.5%) | 50 (36.5%) |
| Wholesale Trade | 0 (0.0%) | 0 (0.0%) |
| Retail Trade | 195 (56.7%) | 149 (43.3%) |
| Transportation & Warehousing | 40 (25.3%) | 118 (74.7%) |
| Utilities | 34 (100.0%) | 0 (0.0%) |
| Information | 0 (0.0%) | 0 (0.0%) |
| Finance & Insurance | 23 (46.9%) | 26 (53.1%) |
| Real Estate, Rental & Leasing | 8 (100.0%) | 0 (0.0%) |
| Professional & Scientific | 34 (57.6%) | 25 (42.4%) |
| Enterprise Management | 0 (0.0%) | 0 (0.0%) |
| Administrative & Support | 60 (84.5%) | 11 (15.5%) |
| Educational Services | 36 (54.5%) | 30 (45.5%) |
| Health Care & Social Assistance | 75 (17.5%) | 353 (82.5%) |
| Arts, Entertainment & Recreation | 0 (0.0%) | 11 (100.0%) |
| Accommodation & Food Services | 10 (71.4%) | 4 (28.6%) |
| Public Administration | 31 (100.0%) | 0 (0.0%) |
| Total | 829 (51.4%) | 784 (48.6%) |
Education in Brackenridge borough
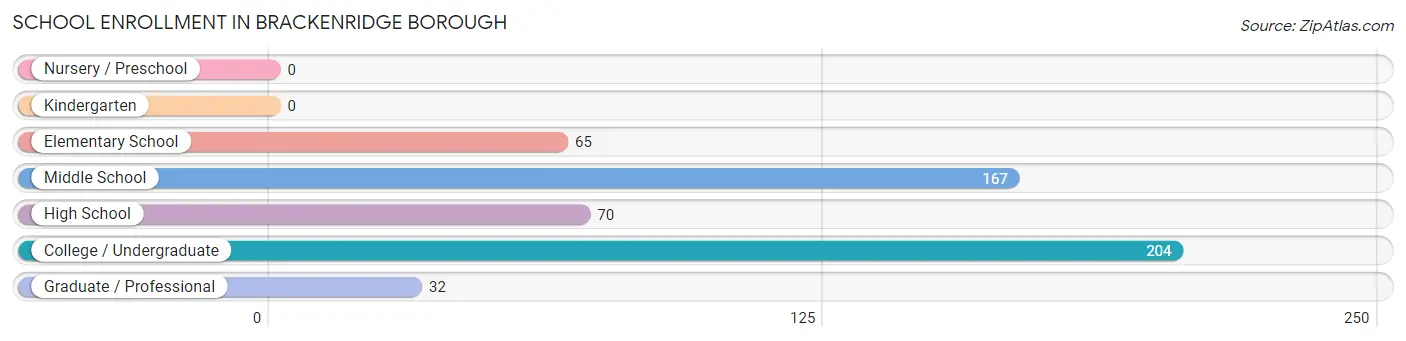
School Enrollment in Brackenridge borough
The most common levels of schooling among the 538 students in Brackenridge borough are college / undergraduate (204 | 37.9%), middle school (167 | 31.0%), and high school (70 | 13.0%).
| School Level | # Students | % Students |
| Nursery / Preschool | 0 | 0.0% |
| Kindergarten | 0 | 0.0% |
| Elementary School | 65 | 12.1% |
| Middle School | 167 | 31.0% |
| High School | 70 | 13.0% |
| College / Undergraduate | 204 | 37.9% |
| Graduate / Professional | 32 | 5.9% |
| Total | 538 | 100.0% |
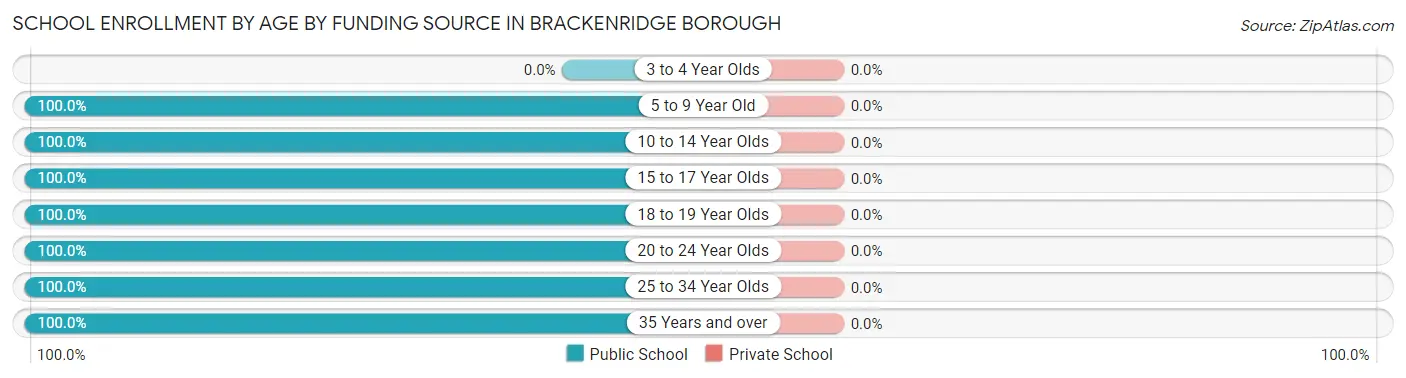
School Enrollment by Age by Funding Source in Brackenridge borough
| Age Bracket | Public School | Private School |
| 3 to 4 Year Olds | 0 (0.0%) | 0 (0.0%) |
| 5 to 9 Year Old | 65 (100.0%) | 0 (0.0%) |
| 10 to 14 Year Olds | 167 (100.0%) | 0 (0.0%) |
| 15 to 17 Year Olds | 51 (100.0%) | 0 (0.0%) |
| 18 to 19 Year Olds | 19 (100.0%) | 0 (0.0%) |
| 20 to 24 Year Olds | 138 (100.0%) | 0 (0.0%) |
| 25 to 34 Year Olds | 69 (100.0%) | 0 (0.0%) |
| 35 Years and over | 29 (100.0%) | 0 (0.0%) |
| Total | 538 (100.0%) | 0 (0.0%) |
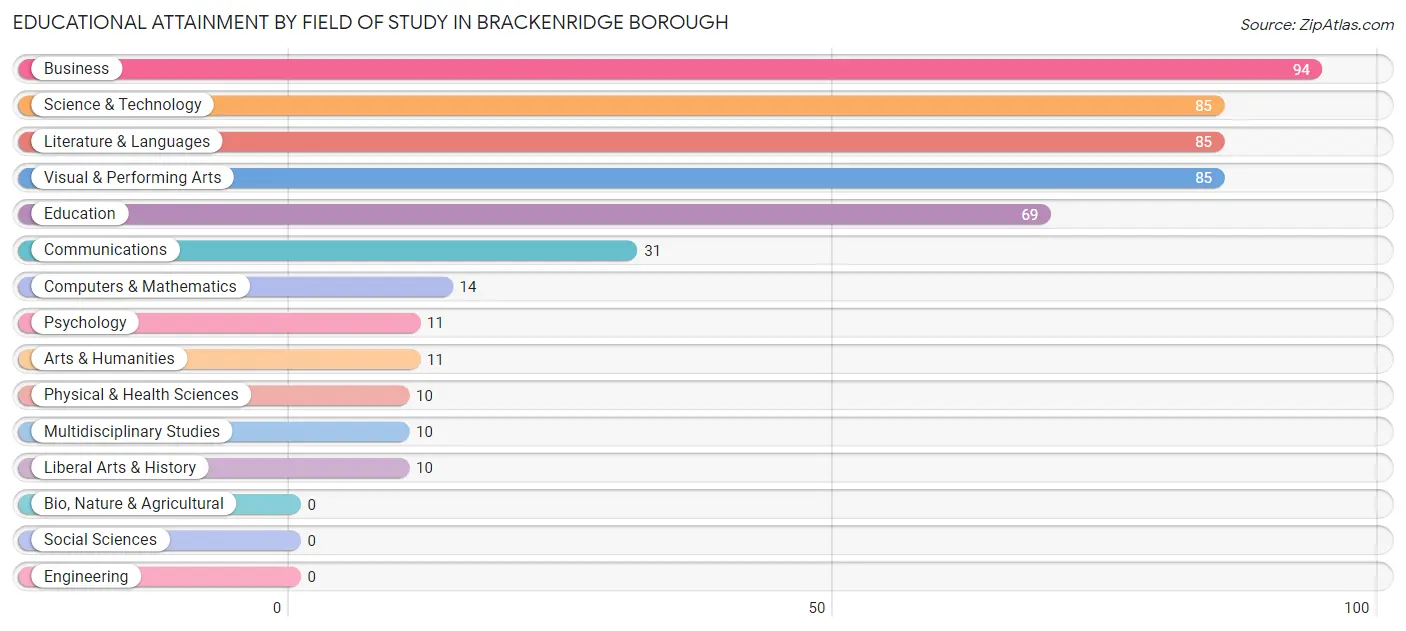
Educational Attainment by Field of Study in Brackenridge borough
Business (94 | 18.2%), science & technology (85 | 16.5%), literature & languages (85 | 16.5%), visual & performing arts (85 | 16.5%), and education (69 | 13.4%) are the most common fields of study among 515 individuals in Brackenridge borough who have obtained a bachelor's degree or higher.
| Field of Study | # Graduates | % Graduates |
| Computers & Mathematics | 14 | 2.7% |
| Bio, Nature & Agricultural | 0 | 0.0% |
| Physical & Health Sciences | 10 | 1.9% |
| Psychology | 11 | 2.1% |
| Social Sciences | 0 | 0.0% |
| Engineering | 0 | 0.0% |
| Multidisciplinary Studies | 10 | 1.9% |
| Science & Technology | 85 | 16.5% |
| Business | 94 | 18.2% |
| Education | 69 | 13.4% |
| Literature & Languages | 85 | 16.5% |
| Liberal Arts & History | 10 | 1.9% |
| Visual & Performing Arts | 85 | 16.5% |
| Communications | 31 | 6.0% |
| Arts & Humanities | 11 | 2.1% |
| Total | 515 | 100.0% |
Transportation & Commute in Brackenridge borough
Vehicle Availability by Sex in Brackenridge borough
The most prevalent vehicle ownership categories in Brackenridge borough are males with 2 vehicles (356, accounting for 43.6%) and females with 2 vehicles (367, making up 46.9%).
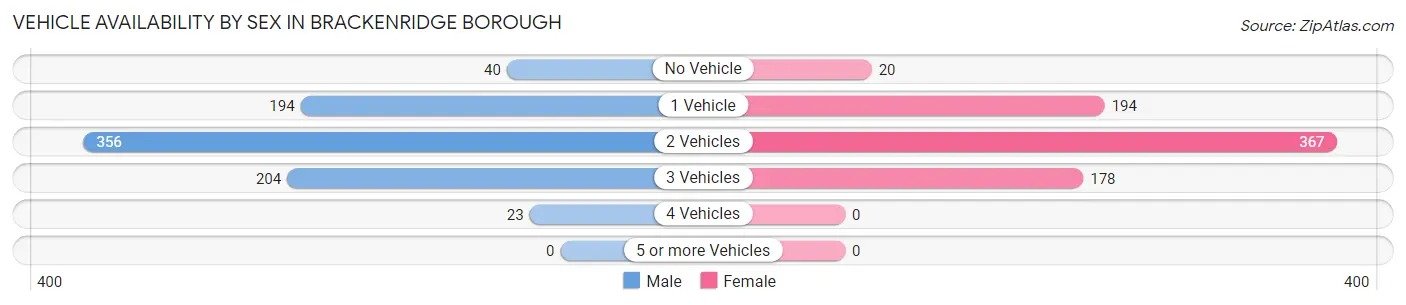
| Vehicles Available | Male | Female |
| No Vehicle | 40 (4.9%) | 20 (2.6%) |
| 1 Vehicle | 194 (23.7%) | 194 (25.6%) |
| 2 Vehicles | 356 (43.6%) | 367 (48.3%) |
| 3 Vehicles | 204 (25.0%) | 178 (23.4%) |
| 4 Vehicles | 23 (2.8%) | 0 (0.0%) |
| 5 or more Vehicles | 0 (0.0%) | 0 (0.0%) |
| Total | 817 (100.0%) | 759 (100.0%) |
Commute Time in Brackenridge borough
The most frequently occuring commute durations in Brackenridge borough are 30 to 34 minutes (294 commuters, 20.2%), 5 to 9 minutes (182 commuters, 12.5%), and less than 5 minutes (163 commuters, 11.2%).
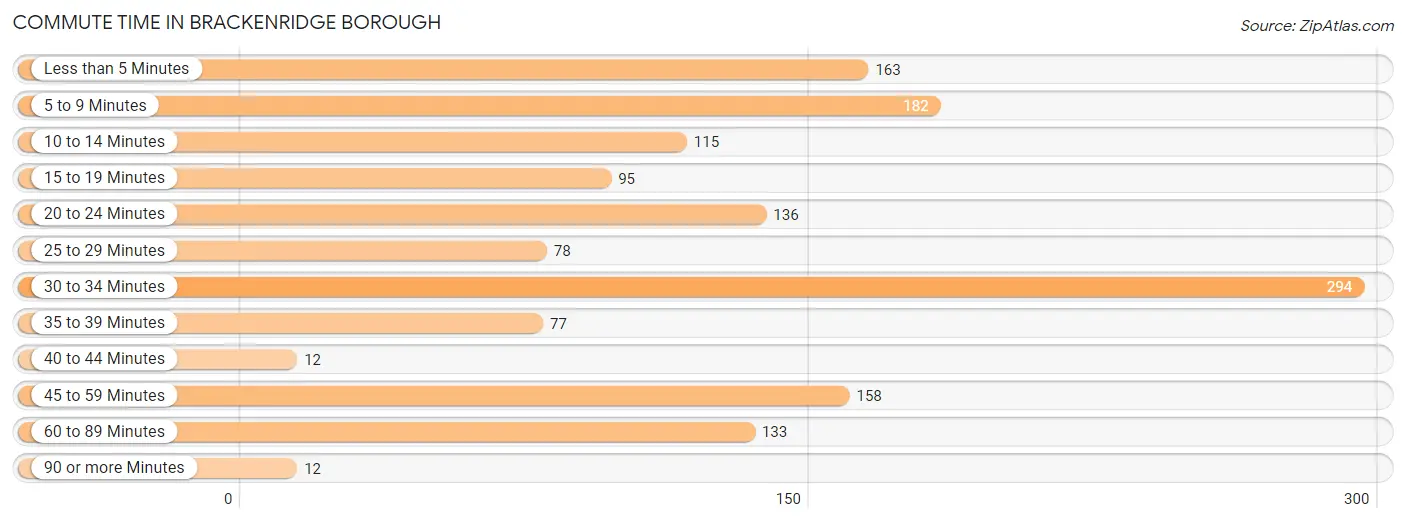
| Commute Time | # Commuters | % Commuters |
| Less than 5 Minutes | 163 | 11.2% |
| 5 to 9 Minutes | 182 | 12.5% |
| 10 to 14 Minutes | 115 | 7.9% |
| 15 to 19 Minutes | 95 | 6.5% |
| 20 to 24 Minutes | 136 | 9.3% |
| 25 to 29 Minutes | 78 | 5.4% |
| 30 to 34 Minutes | 294 | 20.2% |
| 35 to 39 Minutes | 77 | 5.3% |
| 40 to 44 Minutes | 12 | 0.8% |
| 45 to 59 Minutes | 158 | 10.9% |
| 60 to 89 Minutes | 133 | 9.1% |
| 90 or more Minutes | 12 | 0.8% |
Commute Time by Sex in Brackenridge borough
The most common commute times in Brackenridge borough are 30 to 34 minutes (200 commuters, 26.2%) for males and less than 5 minutes (154 commuters, 22.3%) for females.
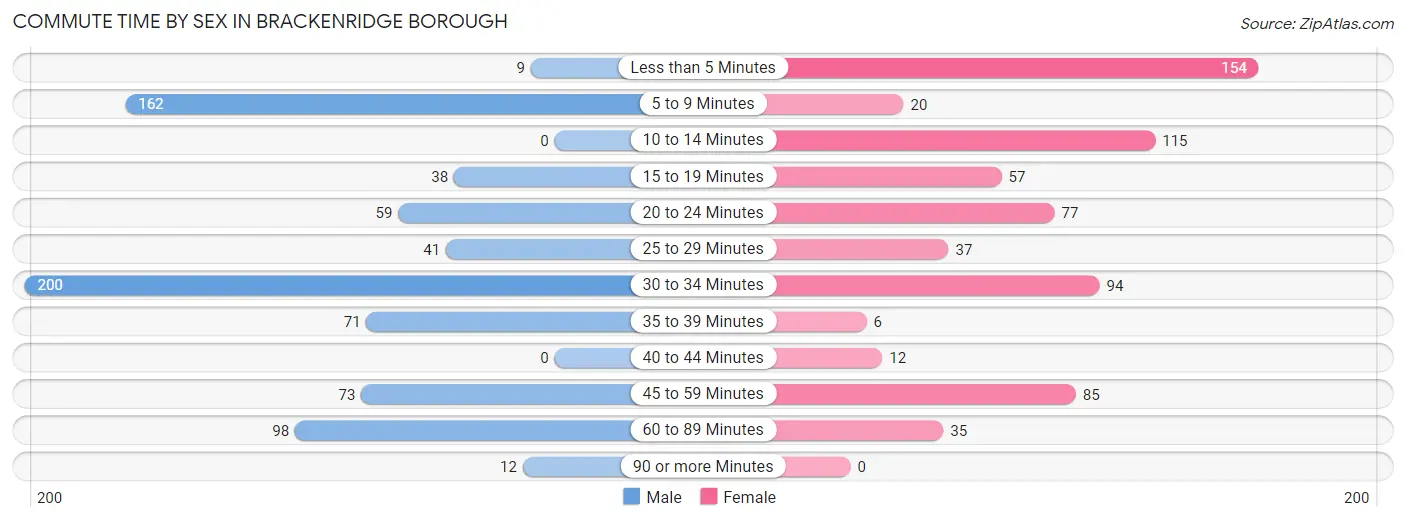
| Commute Time | Male | Female |
| Less than 5 Minutes | 9 (1.2%) | 154 (22.3%) |
| 5 to 9 Minutes | 162 (21.2%) | 20 (2.9%) |
| 10 to 14 Minutes | 0 (0.0%) | 115 (16.6%) |
| 15 to 19 Minutes | 38 (5.0%) | 57 (8.2%) |
| 20 to 24 Minutes | 59 (7.7%) | 77 (11.1%) |
| 25 to 29 Minutes | 41 (5.4%) | 37 (5.3%) |
| 30 to 34 Minutes | 200 (26.2%) | 94 (13.6%) |
| 35 to 39 Minutes | 71 (9.3%) | 6 (0.9%) |
| 40 to 44 Minutes | 0 (0.0%) | 12 (1.7%) |
| 45 to 59 Minutes | 73 (9.6%) | 85 (12.3%) |
| 60 to 89 Minutes | 98 (12.8%) | 35 (5.1%) |
| 90 or more Minutes | 12 (1.6%) | 0 (0.0%) |
Time of Departure to Work by Sex in Brackenridge borough
The most frequent times of departure to work in Brackenridge borough are 12:00 PM to 3:59 PM (147, 19.3%) for males and 7:00 AM to 7:29 AM (233, 33.7%) for females.
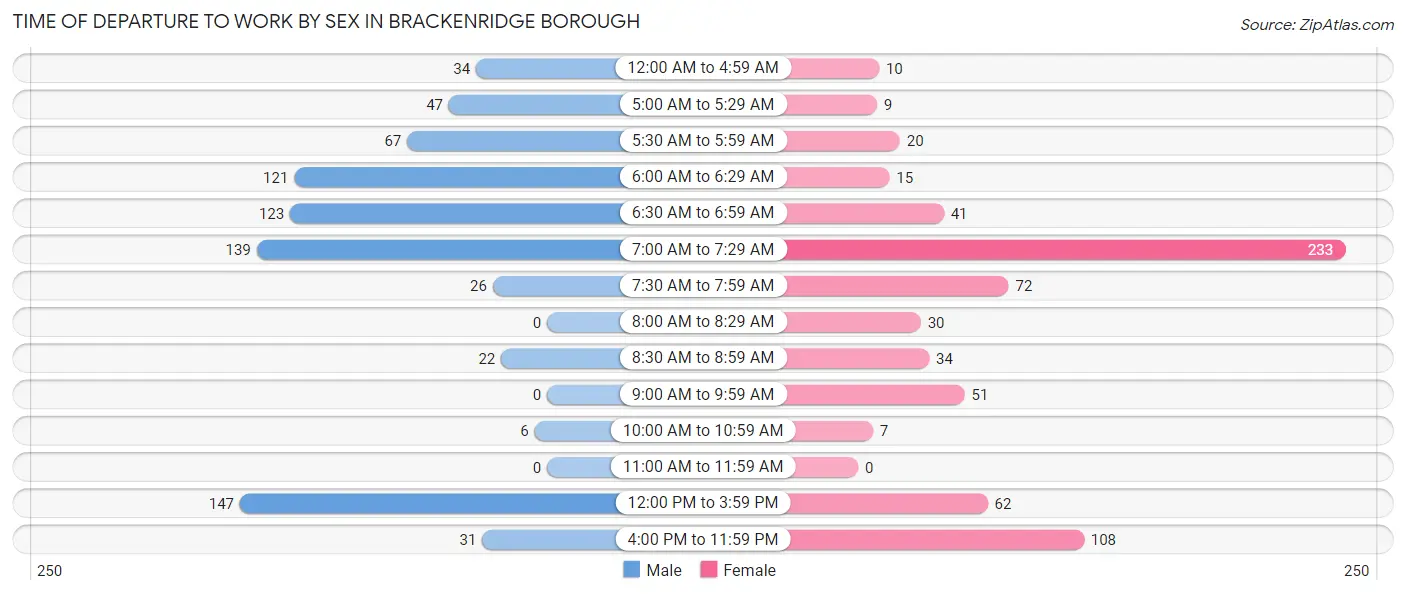
| Time of Departure | Male | Female |
| 12:00 AM to 4:59 AM | 34 (4.5%) | 10 (1.5%) |
| 5:00 AM to 5:29 AM | 47 (6.2%) | 9 (1.3%) |
| 5:30 AM to 5:59 AM | 67 (8.8%) | 20 (2.9%) |
| 6:00 AM to 6:29 AM | 121 (15.9%) | 15 (2.2%) |
| 6:30 AM to 6:59 AM | 123 (16.1%) | 41 (5.9%) |
| 7:00 AM to 7:29 AM | 139 (18.2%) | 233 (33.7%) |
| 7:30 AM to 7:59 AM | 26 (3.4%) | 72 (10.4%) |
| 8:00 AM to 8:29 AM | 0 (0.0%) | 30 (4.3%) |
| 8:30 AM to 8:59 AM | 22 (2.9%) | 34 (4.9%) |
| 9:00 AM to 9:59 AM | 0 (0.0%) | 51 (7.4%) |
| 10:00 AM to 10:59 AM | 6 (0.8%) | 7 (1.0%) |
| 11:00 AM to 11:59 AM | 0 (0.0%) | 0 (0.0%) |
| 12:00 PM to 3:59 PM | 147 (19.3%) | 62 (9.0%) |
| 4:00 PM to 11:59 PM | 31 (4.1%) | 108 (15.6%) |
| Total | 763 (100.0%) | 692 (100.0%) |
Housing Occupancy in Brackenridge borough
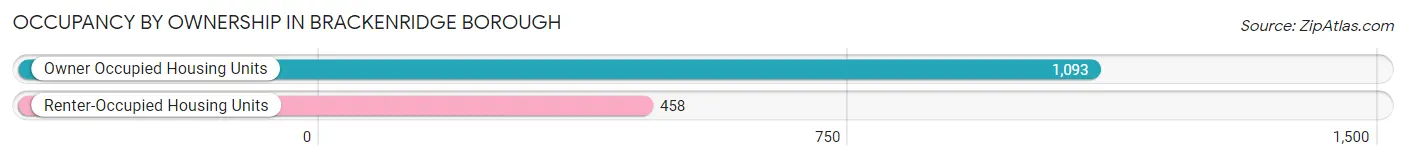
Occupancy by Ownership in Brackenridge borough
Of the total 1,551 dwellings in Brackenridge borough, owner-occupied units account for 1,093 (70.5%), while renter-occupied units make up 458 (29.5%).
| Occupancy | # Housing Units | % Housing Units |
| Owner Occupied Housing Units | 1,093 | 70.5% |
| Renter-Occupied Housing Units | 458 | 29.5% |
| Total Occupied Housing Units | 1,551 | 100.0% |
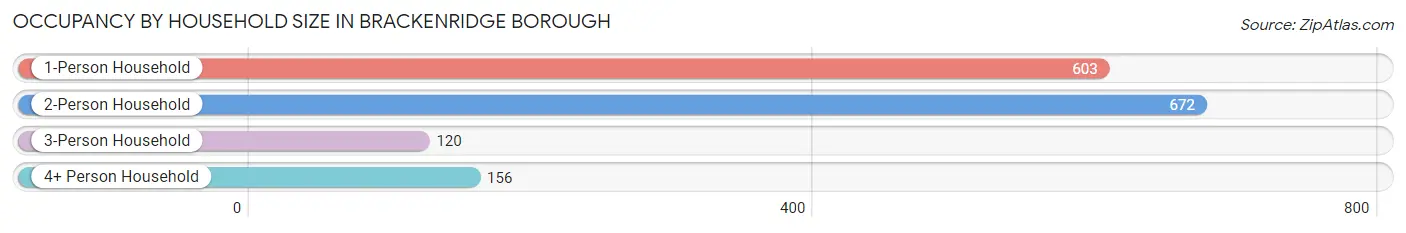
Occupancy by Household Size in Brackenridge borough
| Household Size | # Housing Units | % Housing Units |
| 1-Person Household | 603 | 38.9% |
| 2-Person Household | 672 | 43.3% |
| 3-Person Household | 120 | 7.7% |
| 4+ Person Household | 156 | 10.1% |
| Total Housing Units | 1,551 | 100.0% |
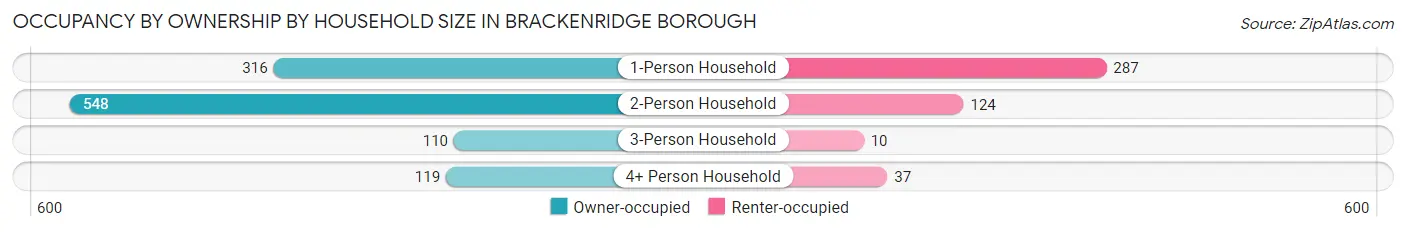
Occupancy by Ownership by Household Size in Brackenridge borough
| Household Size | Owner-occupied | Renter-occupied |
| 1-Person Household | 316 (52.4%) | 287 (47.6%) |
| 2-Person Household | 548 (81.6%) | 124 (18.4%) |
| 3-Person Household | 110 (91.7%) | 10 (8.3%) |
| 4+ Person Household | 119 (76.3%) | 37 (23.7%) |
| Total Housing Units | 1,093 (70.5%) | 458 (29.5%) |
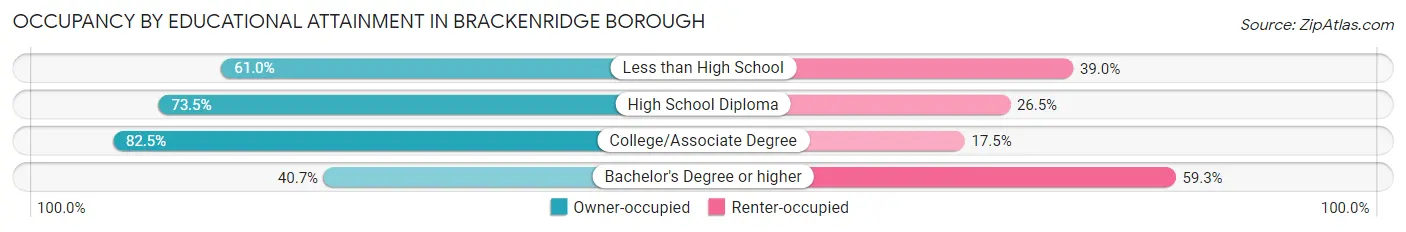
Occupancy by Educational Attainment in Brackenridge borough
| Household Size | Owner-occupied | Renter-occupied |
| Less than High School | 75 (61.0%) | 48 (39.0%) |
| High School Diploma | 482 (73.5%) | 174 (26.5%) |
| College/Associate Degree | 438 (82.5%) | 93 (17.5%) |
| Bachelor's Degree or higher | 98 (40.7%) | 143 (59.3%) |
Occupancy by Age of Householder in Brackenridge borough
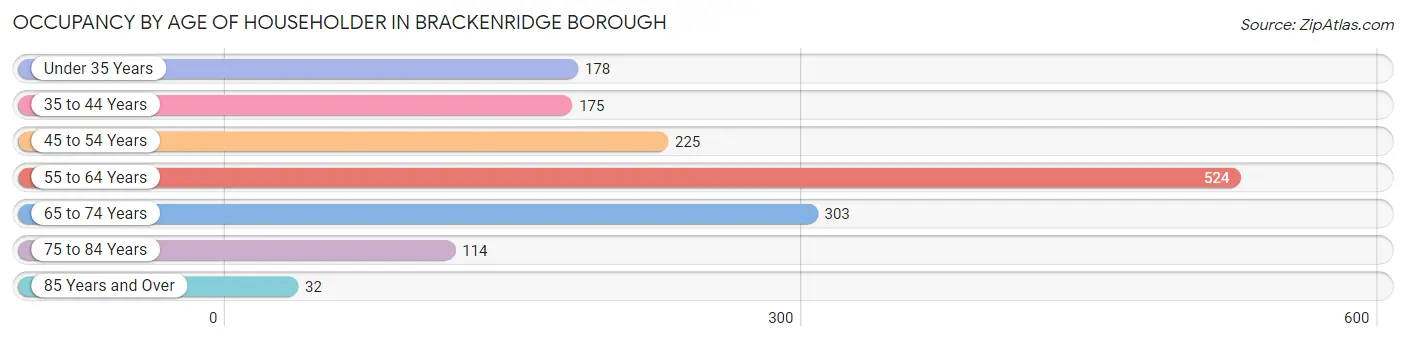
| Age Bracket | # Households | % Households |
| Under 35 Years | 178 | 11.5% |
| 35 to 44 Years | 175 | 11.3% |
| 45 to 54 Years | 225 | 14.5% |
| 55 to 64 Years | 524 | 33.8% |
| 65 to 74 Years | 303 | 19.5% |
| 75 to 84 Years | 114 | 7.3% |
| 85 Years and Over | 32 | 2.1% |
| Total | 1,551 | 100.0% |
Housing Finances in Brackenridge borough
Median Income by Occupancy in Brackenridge borough
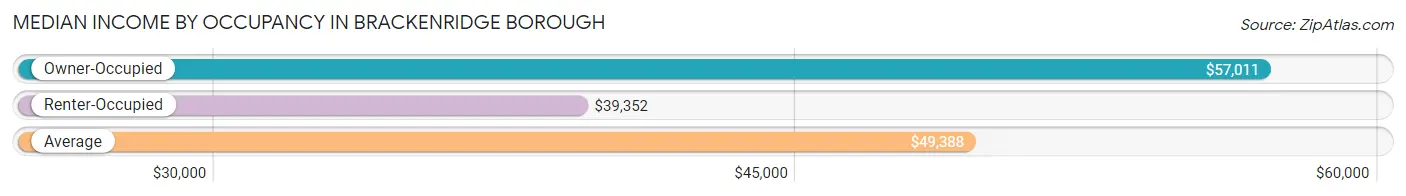
| Occupancy Type | # Households | Median Income |
| Owner-Occupied | 1,093 (70.5%) | $57,011 |
| Renter-Occupied | 458 (29.5%) | $39,352 |
| Average | 1,551 (100.0%) | $49,388 |
Occupancy by Householder Income Bracket in Brackenridge borough
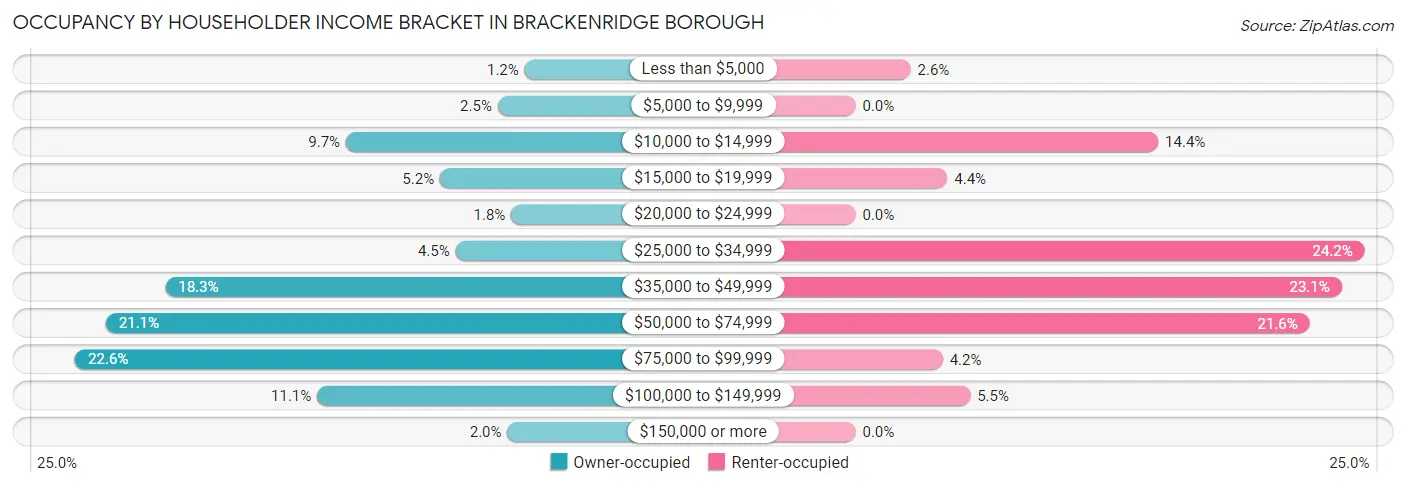
| Income Bracket | Owner-occupied | Renter-occupied |
| Less than $5,000 | 13 (1.2%) | 12 (2.6%) |
| $5,000 to $9,999 | 27 (2.5%) | 0 (0.0%) |
| $10,000 to $14,999 | 106 (9.7%) | 66 (14.4%) |
| $15,000 to $19,999 | 57 (5.2%) | 20 (4.4%) |
| $20,000 to $24,999 | 20 (1.8%) | 0 (0.0%) |
| $25,000 to $34,999 | 49 (4.5%) | 111 (24.2%) |
| $35,000 to $49,999 | 200 (18.3%) | 106 (23.1%) |
| $50,000 to $74,999 | 231 (21.1%) | 99 (21.6%) |
| $75,000 to $99,999 | 247 (22.6%) | 19 (4.2%) |
| $100,000 to $149,999 | 121 (11.1%) | 25 (5.5%) |
| $150,000 or more | 22 (2.0%) | 0 (0.0%) |
| Total | 1,093 (100.0%) | 458 (100.0%) |
Monthly Housing Cost Tiers in Brackenridge borough
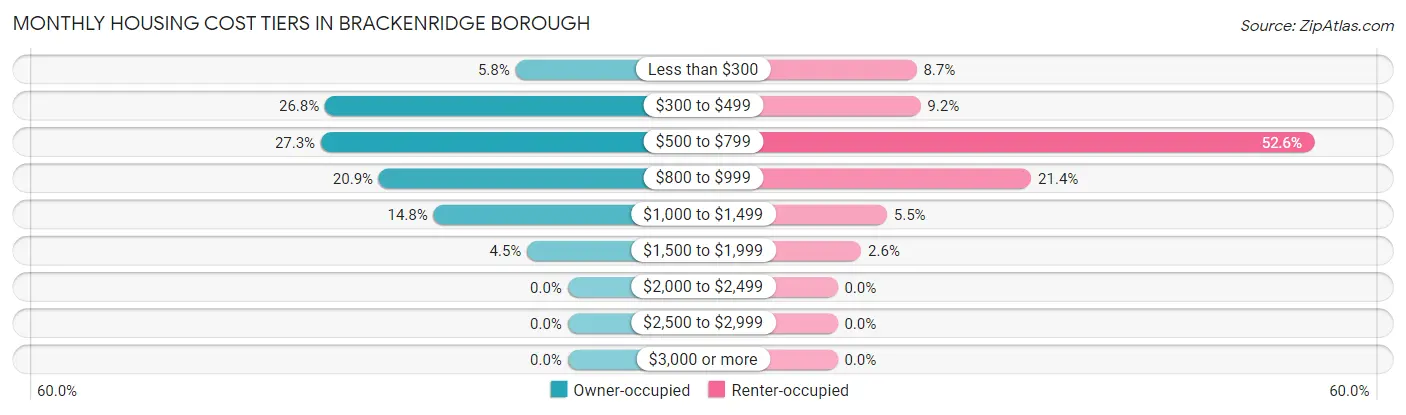
| Monthly Cost | Owner-occupied | Renter-occupied |
| Less than $300 | 63 (5.8%) | 40 (8.7%) |
| $300 to $499 | 293 (26.8%) | 42 (9.2%) |
| $500 to $799 | 298 (27.3%) | 241 (52.6%) |
| $800 to $999 | 228 (20.9%) | 98 (21.4%) |
| $1,000 to $1,499 | 162 (14.8%) | 25 (5.5%) |
| $1,500 to $1,999 | 49 (4.5%) | 12 (2.6%) |
| $2,000 to $2,499 | 0 (0.0%) | 0 (0.0%) |
| $2,500 to $2,999 | 0 (0.0%) | 0 (0.0%) |
| $3,000 or more | 0 (0.0%) | 0 (0.0%) |
| Total | 1,093 (100.0%) | 458 (100.0%) |
Physical Housing Characteristics in Brackenridge borough
Housing Structures in Brackenridge borough
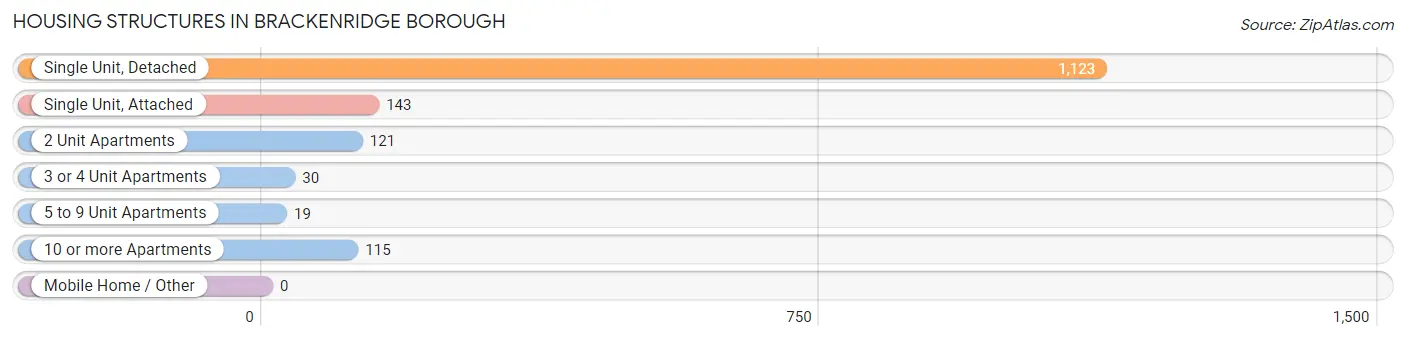
| Structure Type | # Housing Units | % Housing Units |
| Single Unit, Detached | 1,123 | 72.4% |
| Single Unit, Attached | 143 | 9.2% |
| 2 Unit Apartments | 121 | 7.8% |
| 3 or 4 Unit Apartments | 30 | 1.9% |
| 5 to 9 Unit Apartments | 19 | 1.2% |
| 10 or more Apartments | 115 | 7.4% |
| Mobile Home / Other | 0 | 0.0% |
| Total | 1,551 | 100.0% |
Housing Structures by Occupancy in Brackenridge borough
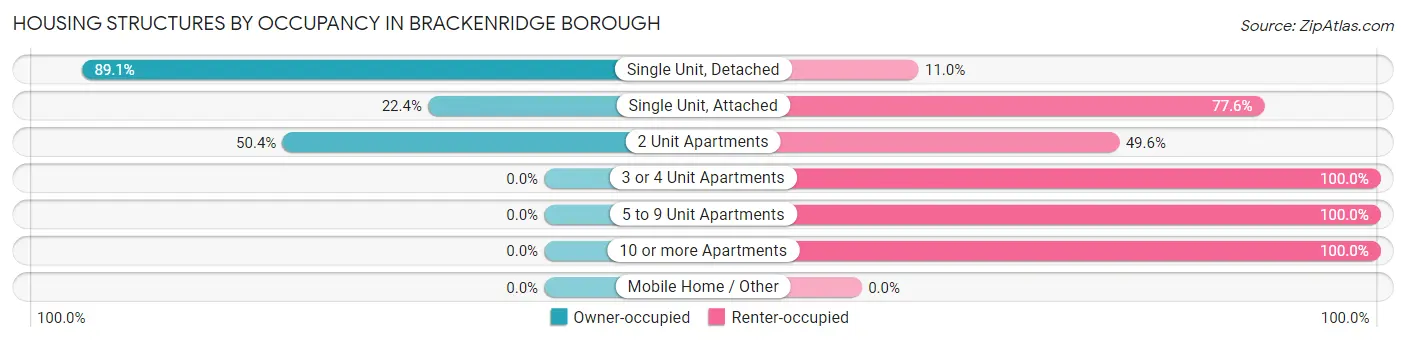
| Structure Type | Owner-occupied | Renter-occupied |
| Single Unit, Detached | 1,000 (89.0%) | 123 (11.0%) |
| Single Unit, Attached | 32 (22.4%) | 111 (77.6%) |
| 2 Unit Apartments | 61 (50.4%) | 60 (49.6%) |
| 3 or 4 Unit Apartments | 0 (0.0%) | 30 (100.0%) |
| 5 to 9 Unit Apartments | 0 (0.0%) | 19 (100.0%) |
| 10 or more Apartments | 0 (0.0%) | 115 (100.0%) |
| Mobile Home / Other | 0 (0.0%) | 0 (0.0%) |
| Total | 1,093 (70.5%) | 458 (29.5%) |
Housing Structures by Number of Rooms in Brackenridge borough
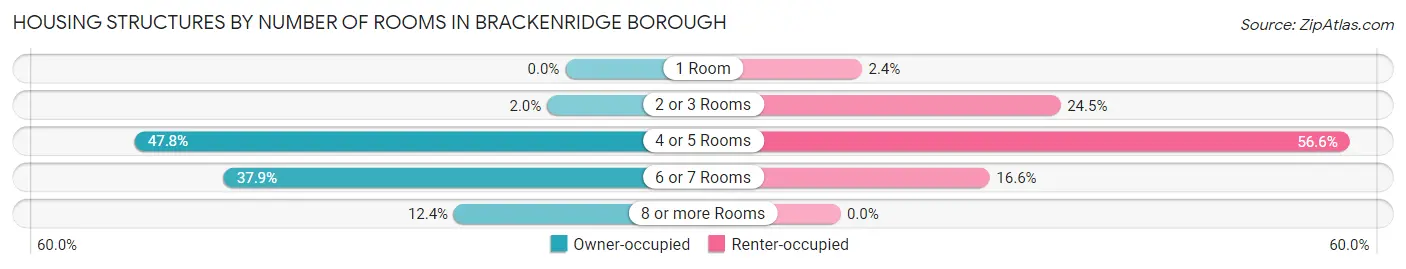
| Number of Rooms | Owner-occupied | Renter-occupied |
| 1 Room | 0 (0.0%) | 11 (2.4%) |
| 2 or 3 Rooms | 22 (2.0%) | 112 (24.4%) |
| 4 or 5 Rooms | 522 (47.8%) | 259 (56.6%) |
| 6 or 7 Rooms | 414 (37.9%) | 76 (16.6%) |
| 8 or more Rooms | 135 (12.3%) | 0 (0.0%) |
| Total | 1,093 (100.0%) | 458 (100.0%) |
Housing Structure by Heating Type in Brackenridge borough
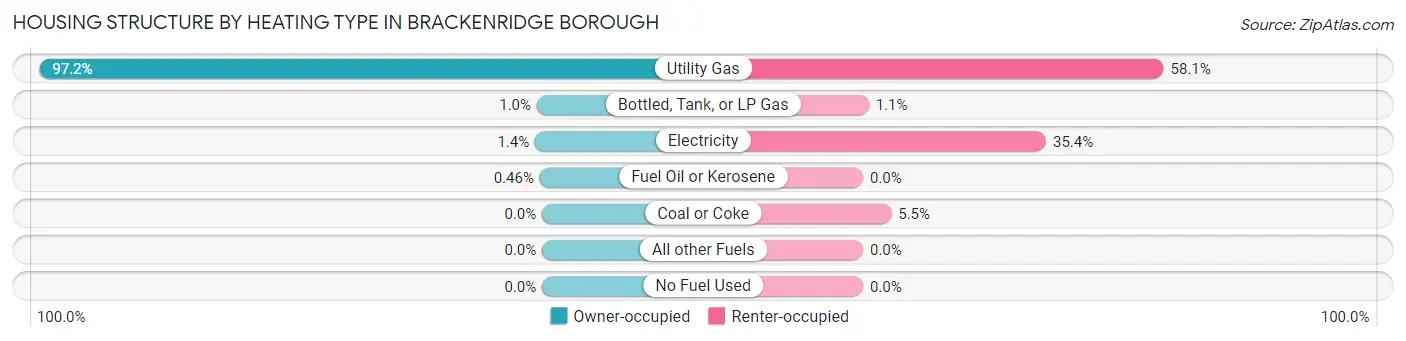
| Heating Type | Owner-occupied | Renter-occupied |
| Utility Gas | 1,062 (97.2%) | 266 (58.1%) |
| Bottled, Tank, or LP Gas | 11 (1.0%) | 5 (1.1%) |
| Electricity | 15 (1.4%) | 162 (35.4%) |
| Fuel Oil or Kerosene | 5 (0.5%) | 0 (0.0%) |
| Coal or Coke | 0 (0.0%) | 25 (5.5%) |
| All other Fuels | 0 (0.0%) | 0 (0.0%) |
| No Fuel Used | 0 (0.0%) | 0 (0.0%) |
| Total | 1,093 (100.0%) | 458 (100.0%) |
Household Vehicle Usage in Brackenridge borough
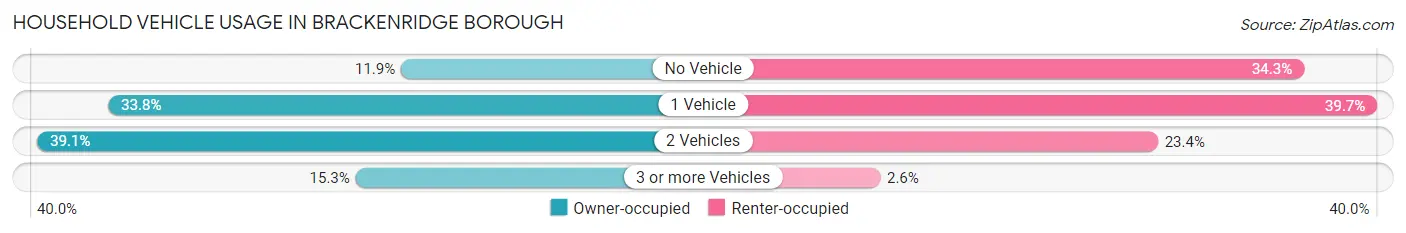
| Vehicles per Household | Owner-occupied | Renter-occupied |
| No Vehicle | 130 (11.9%) | 157 (34.3%) |
| 1 Vehicle | 369 (33.8%) | 182 (39.7%) |
| 2 Vehicles | 427 (39.1%) | 107 (23.4%) |
| 3 or more Vehicles | 167 (15.3%) | 12 (2.6%) |
| Total | 1,093 (100.0%) | 458 (100.0%) |
Real Estate & Mortgages in Brackenridge borough
Real Estate and Mortgage Overview in Brackenridge borough
| Characteristic | Without Mortgage | With Mortgage |
| Housing Units | 517 | 576 |
| Median Property Value | $87,400 | $78,200 |
| Median Household Income | $52,539 | $12 |
| Monthly Housing Costs | $460 | $0 |
| Real Estate Taxes | $1,821 | $11 |
Property Value by Mortgage Status in Brackenridge borough
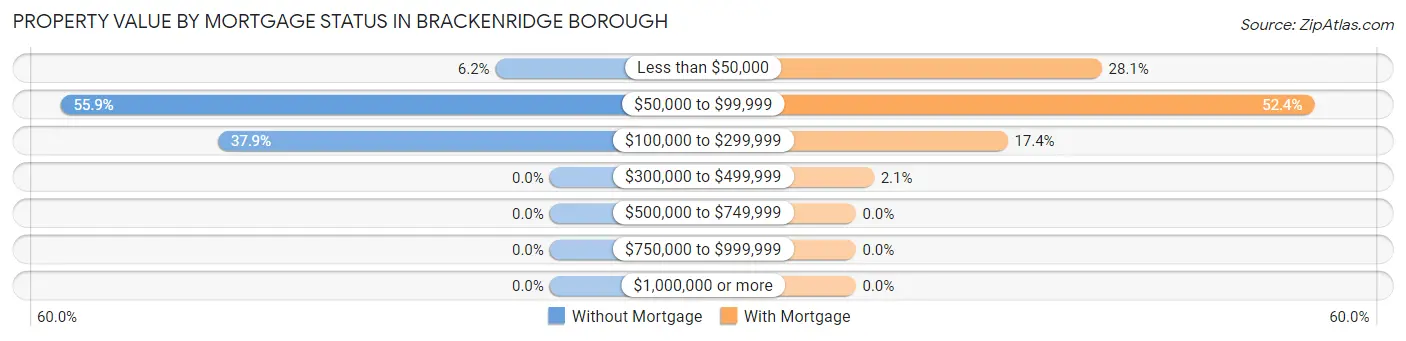
| Property Value | Without Mortgage | With Mortgage |
| Less than $50,000 | 32 (6.2%) | 162 (28.1%) |
| $50,000 to $99,999 | 289 (55.9%) | 302 (52.4%) |
| $100,000 to $299,999 | 196 (37.9%) | 100 (17.4%) |
| $300,000 to $499,999 | 0 (0.0%) | 12 (2.1%) |
| $500,000 to $749,999 | 0 (0.0%) | 0 (0.0%) |
| $750,000 to $999,999 | 0 (0.0%) | 0 (0.0%) |
| $1,000,000 or more | 0 (0.0%) | 0 (0.0%) |
| Total | 517 (100.0%) | 576 (100.0%) |
Household Income by Mortgage Status in Brackenridge borough
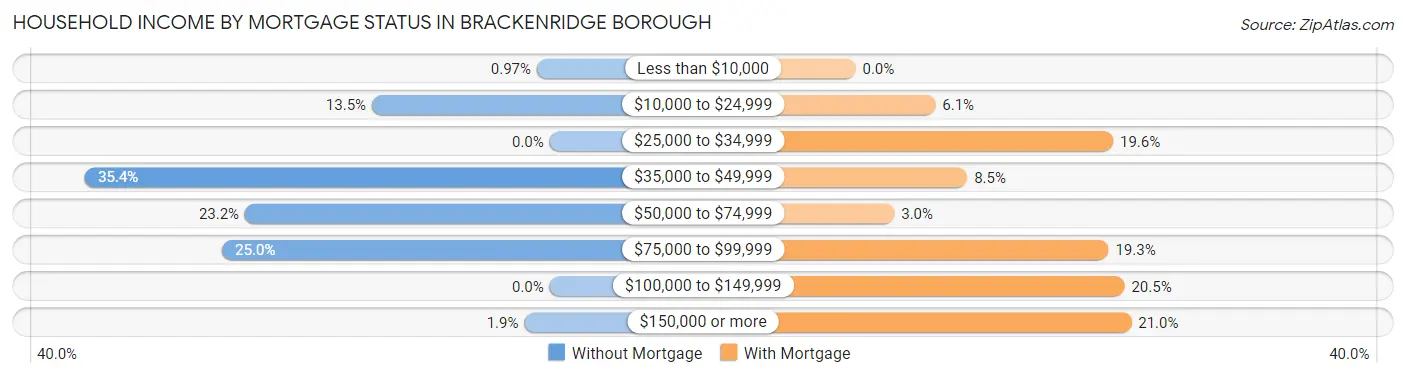
| Household Income | Without Mortgage | With Mortgage |
| Less than $10,000 | 5 (1.0%) | 0 (0.0%) |
| $10,000 to $24,999 | 70 (13.5%) | 35 (6.1%) |
| $25,000 to $34,999 | 0 (0.0%) | 113 (19.6%) |
| $35,000 to $49,999 | 183 (35.4%) | 49 (8.5%) |
| $50,000 to $74,999 | 120 (23.2%) | 17 (2.9%) |
| $75,000 to $99,999 | 129 (24.9%) | 111 (19.3%) |
| $100,000 to $149,999 | 0 (0.0%) | 118 (20.5%) |
| $150,000 or more | 10 (1.9%) | 121 (21.0%) |
| Total | 517 (100.0%) | 576 (100.0%) |
Property Value to Household Income Ratio in Brackenridge borough

| Value-to-Income Ratio | Without Mortgage | With Mortgage |
| Less than 2.0x | 218 (42.2%) | 71,181 (12,357.8%) |
| 2.0x to 2.9x | 150 (29.0%) | 374 (64.9%) |
| 3.0x to 3.9x | 63 (12.2%) | 65 (11.3%) |
| 4.0x or more | 81 (15.7%) | 0 (0.0%) |
| Total | 517 (100.0%) | 576 (100.0%) |
Real Estate Taxes by Mortgage Status in Brackenridge borough
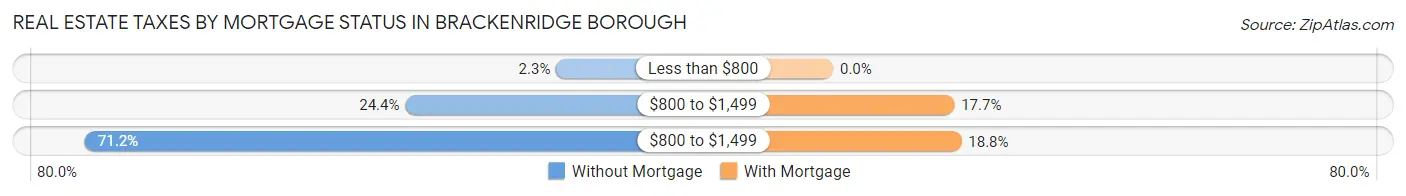
| Property Taxes | Without Mortgage | With Mortgage |
| Less than $800 | 12 (2.3%) | 0 (0.0%) |
| $800 to $1,499 | 126 (24.4%) | 102 (17.7%) |
| $800 to $1,499 | 368 (71.2%) | 108 (18.8%) |
| Total | 517 (100.0%) | 576 (100.0%) |
Health & Disability in Brackenridge borough
Health Insurance Coverage by Age in Brackenridge borough
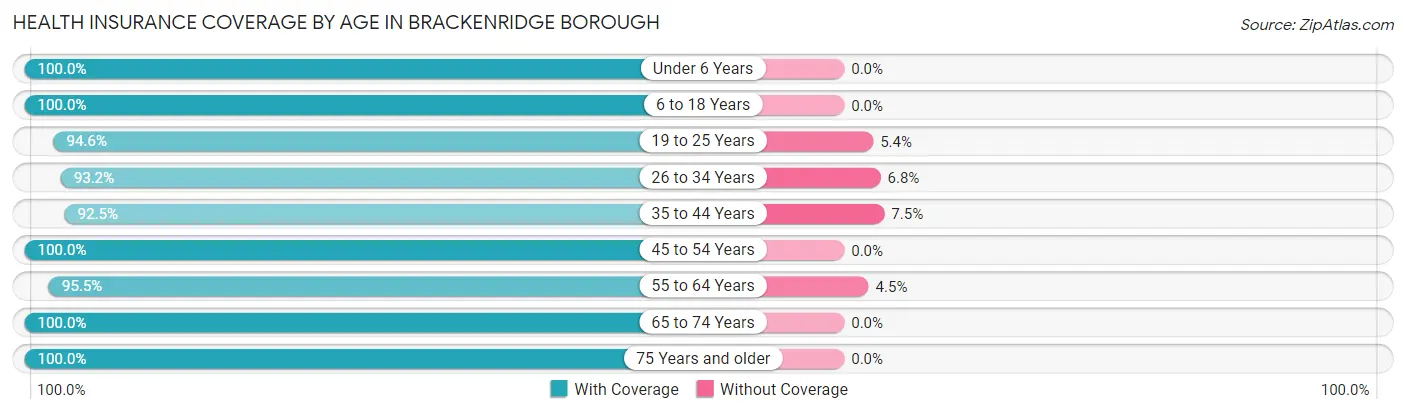
| Age Bracket | With Coverage | Without Coverage |
| Under 6 Years | 139 (100.0%) | 0 (0.0%) |
| 6 to 18 Years | 311 (100.0%) | 0 (0.0%) |
| 19 to 25 Years | 333 (94.6%) | 19 (5.4%) |
| 26 to 34 Years | 234 (93.2%) | 17 (6.8%) |
| 35 to 44 Years | 408 (92.5%) | 33 (7.5%) |
| 45 to 54 Years | 361 (100.0%) | 0 (0.0%) |
| 55 to 64 Years | 631 (95.5%) | 30 (4.5%) |
| 65 to 74 Years | 453 (100.0%) | 0 (0.0%) |
| 75 Years and older | 168 (100.0%) | 0 (0.0%) |
| Total | 3,038 (96.8%) | 99 (3.2%) |
Health Insurance Coverage by Citizenship Status in Brackenridge borough
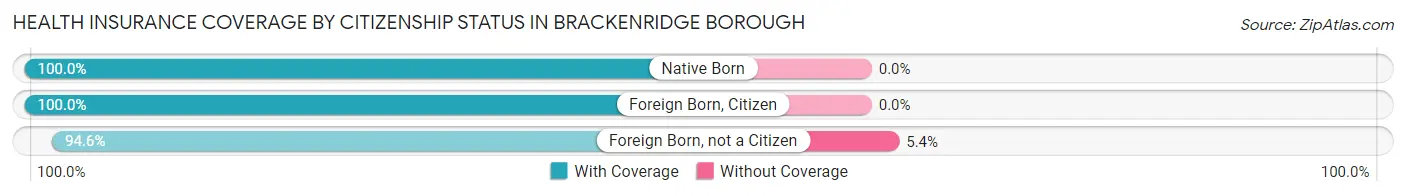
| Citizenship Status | With Coverage | Without Coverage |
| Native Born | 139 (100.0%) | 0 (0.0%) |
| Foreign Born, Citizen | 311 (100.0%) | 0 (0.0%) |
| Foreign Born, not a Citizen | 333 (94.6%) | 19 (5.4%) |
Health Insurance Coverage by Household Income in Brackenridge borough
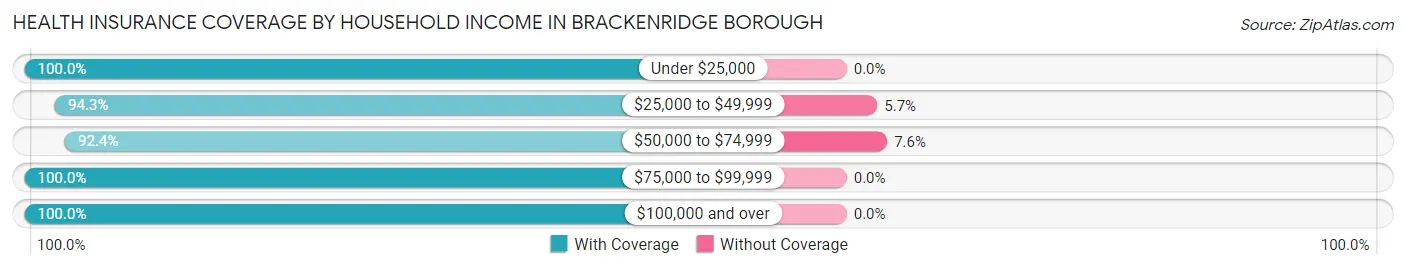
| Household Income | With Coverage | Without Coverage |
| Under $25,000 | 378 (100.0%) | 0 (0.0%) |
| $25,000 to $49,999 | 807 (94.3%) | 49 (5.7%) |
| $50,000 to $74,999 | 610 (92.4%) | 50 (7.6%) |
| $75,000 to $99,999 | 708 (100.0%) | 0 (0.0%) |
| $100,000 and over | 535 (100.0%) | 0 (0.0%) |
Public vs Private Health Insurance Coverage by Age in Brackenridge borough
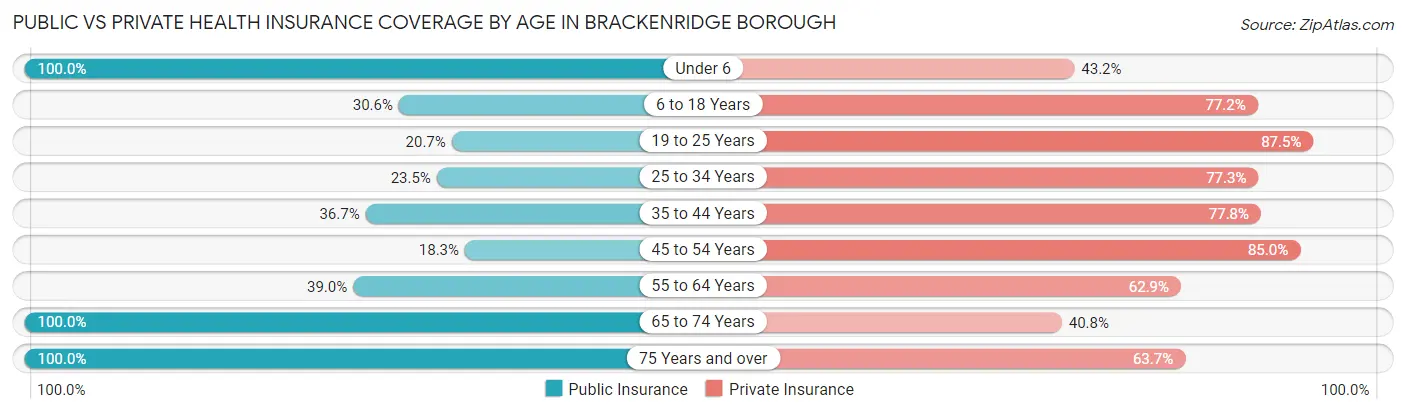
| Age Bracket | Public Insurance | Private Insurance |
| Under 6 | 139 (100.0%) | 60 (43.2%) |
| 6 to 18 Years | 95 (30.5%) | 240 (77.2%) |
| 19 to 25 Years | 73 (20.7%) | 308 (87.5%) |
| 25 to 34 Years | 59 (23.5%) | 194 (77.3%) |
| 35 to 44 Years | 162 (36.7%) | 343 (77.8%) |
| 45 to 54 Years | 66 (18.3%) | 307 (85.0%) |
| 55 to 64 Years | 258 (39.0%) | 416 (62.9%) |
| 65 to 74 Years | 453 (100.0%) | 185 (40.8%) |
| 75 Years and over | 168 (100.0%) | 107 (63.7%) |
| Total | 1,473 (47.0%) | 2,160 (68.9%) |
Disability Status by Sex by Age in Brackenridge borough
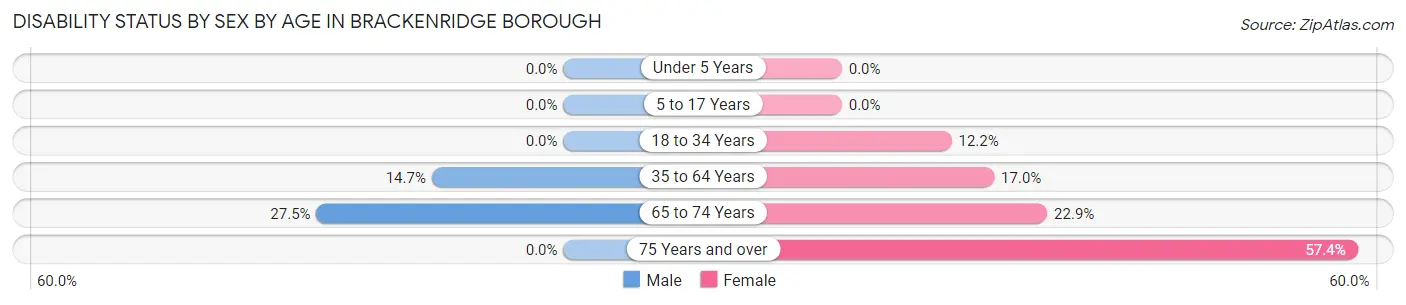
| Age Bracket | Male | Female |
| Under 5 Years | 0 (0.0%) | 0 (0.0%) |
| 5 to 17 Years | 0 (0.0%) | 0 (0.0%) |
| 18 to 34 Years | 0 (0.0%) | 27 (12.2%) |
| 35 to 64 Years | 84 (14.7%) | 151 (17.0%) |
| 65 to 74 Years | 44 (27.5%) | 67 (22.9%) |
| 75 Years and over | 0 (0.0%) | 85 (57.4%) |
Disability Class by Sex by Age in Brackenridge borough
Disability Class: Hearing Difficulty
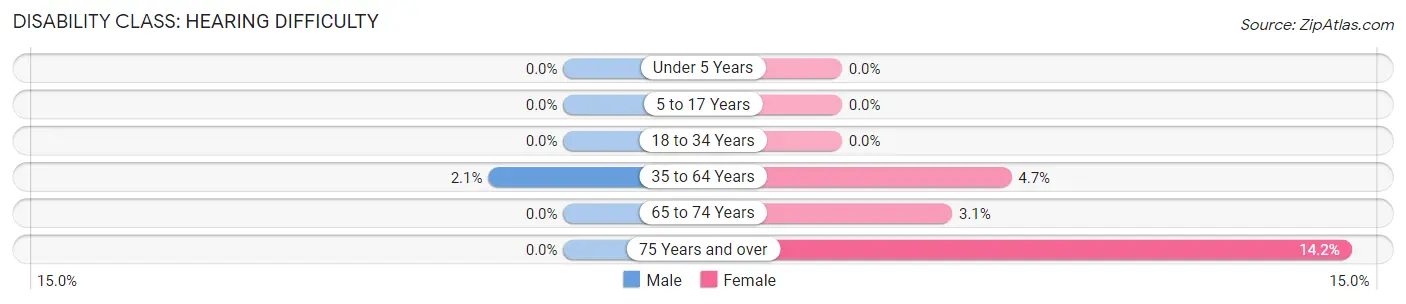
| Age Bracket | Male | Female |
| Under 5 Years | 0 (0.0%) | 0 (0.0%) |
| 5 to 17 Years | 0 (0.0%) | 0 (0.0%) |
| 18 to 34 Years | 0 (0.0%) | 0 (0.0%) |
| 35 to 64 Years | 12 (2.1%) | 42 (4.7%) |
| 65 to 74 Years | 0 (0.0%) | 9 (3.1%) |
| 75 Years and over | 0 (0.0%) | 21 (14.2%) |
Disability Class: Vision Difficulty
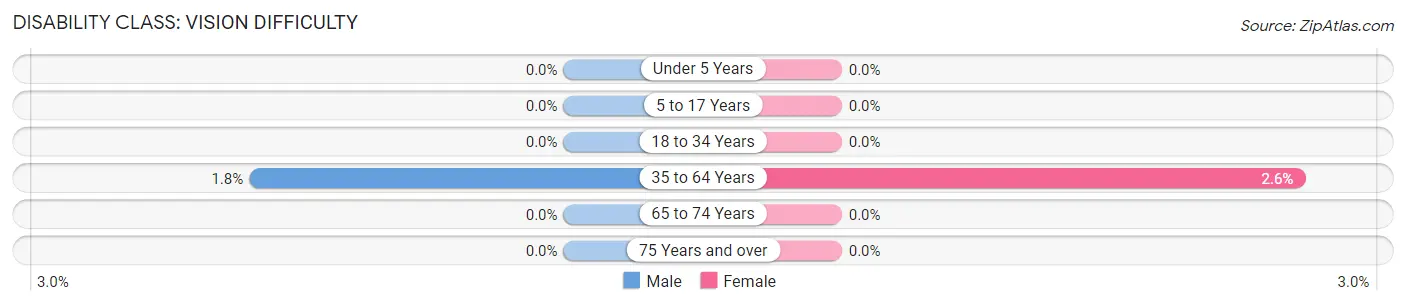
| Age Bracket | Male | Female |
| Under 5 Years | 0 (0.0%) | 0 (0.0%) |
| 5 to 17 Years | 0 (0.0%) | 0 (0.0%) |
| 18 to 34 Years | 0 (0.0%) | 0 (0.0%) |
| 35 to 64 Years | 10 (1.8%) | 23 (2.6%) |
| 65 to 74 Years | 0 (0.0%) | 0 (0.0%) |
| 75 Years and over | 0 (0.0%) | 0 (0.0%) |
Disability Class: Cognitive Difficulty
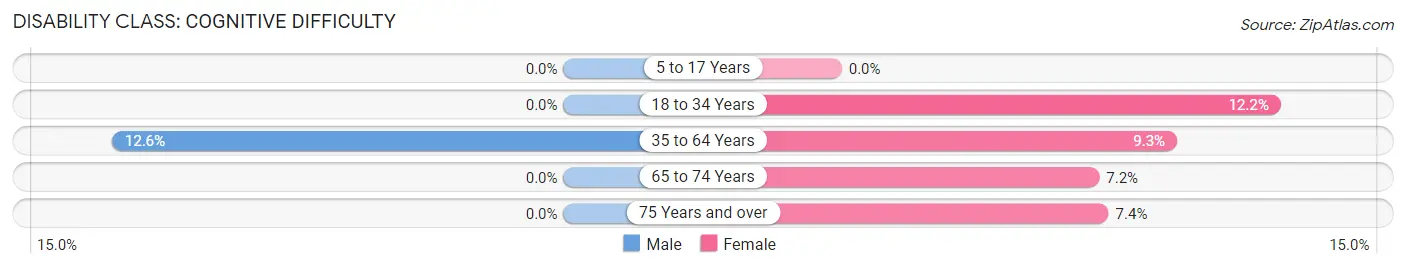
| Age Bracket | Male | Female |
| 5 to 17 Years | 0 (0.0%) | 0 (0.0%) |
| 18 to 34 Years | 0 (0.0%) | 27 (12.2%) |
| 35 to 64 Years | 72 (12.6%) | 83 (9.3%) |
| 65 to 74 Years | 0 (0.0%) | 21 (7.2%) |
| 75 Years and over | 0 (0.0%) | 11 (7.4%) |
Disability Class: Ambulatory Difficulty
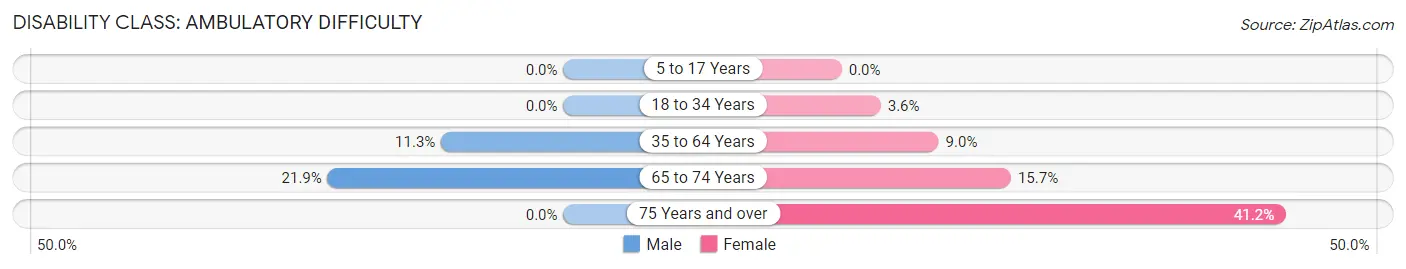
| Age Bracket | Male | Female |
| 5 to 17 Years | 0 (0.0%) | 0 (0.0%) |
| 18 to 34 Years | 0 (0.0%) | 8 (3.6%) |
| 35 to 64 Years | 65 (11.3%) | 80 (9.0%) |
| 65 to 74 Years | 35 (21.9%) | 46 (15.7%) |
| 75 Years and over | 0 (0.0%) | 61 (41.2%) |
Disability Class: Self-Care Difficulty
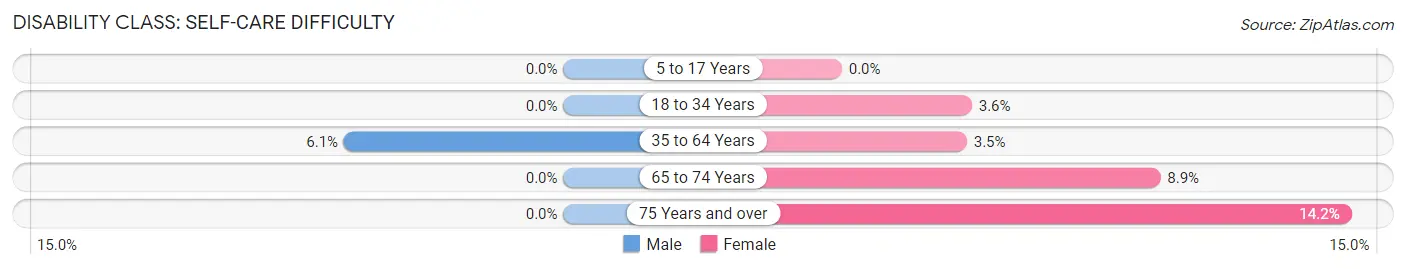
| Age Bracket | Male | Female |
| 5 to 17 Years | 0 (0.0%) | 0 (0.0%) |
| 18 to 34 Years | 0 (0.0%) | 8 (3.6%) |
| 35 to 64 Years | 35 (6.1%) | 31 (3.5%) |
| 65 to 74 Years | 0 (0.0%) | 26 (8.9%) |
| 75 Years and over | 0 (0.0%) | 21 (14.2%) |
Technology Access in Brackenridge borough
Computing Device Access in Brackenridge borough
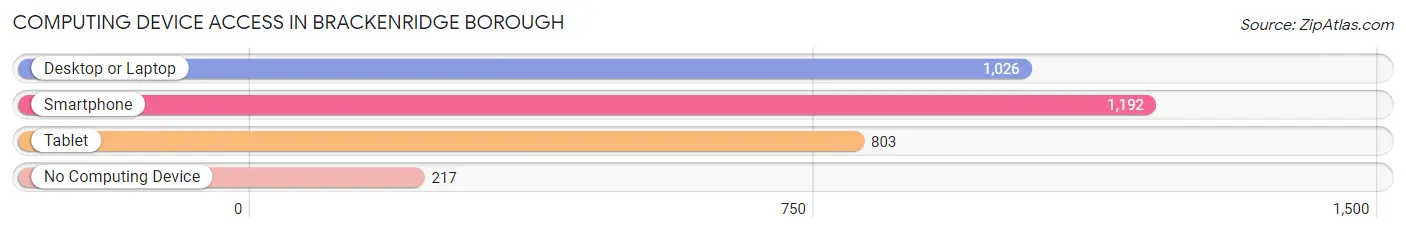
| Device Type | # Households | % Households |
| Desktop or Laptop | 1,026 | 66.1% |
| Smartphone | 1,192 | 76.8% |
| Tablet | 803 | 51.8% |
| No Computing Device | 217 | 14.0% |
| Total | 1,551 | 100.0% |
Internet Access in Brackenridge borough
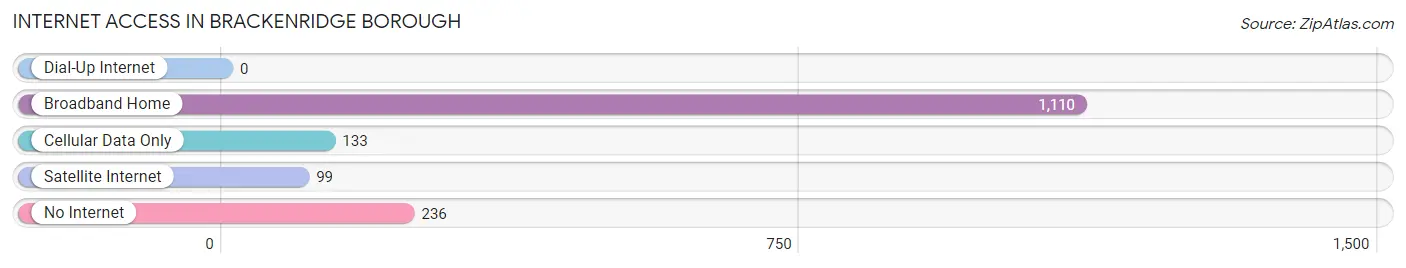
| Internet Type | # Households | % Households |
| Dial-Up Internet | 0 | 0.0% |
| Broadband Home | 1,110 | 71.6% |
| Cellular Data Only | 133 | 8.6% |
| Satellite Internet | 99 | 6.4% |
| No Internet | 236 | 15.2% |
| Total | 1,551 | 100.0% |
Brackenridge borough Summary
Brackenridge Borough is a small borough located in Allegheny County, Pennsylvania. It is situated along the Allegheny River, just north of the city of Pittsburgh. The borough was incorporated in 1891 and has a population of approximately 3,000 people.
History
The area that is now Brackenridge Borough was originally inhabited by Native Americans, including the Lenape and Iroquois tribes. The first European settlers arrived in the area in the late 1700s, and the area was known as “Brackenridge” after the family of William Brackenridge, who owned a large tract of land in the area. The area was officially incorporated as a borough in 1891.
In the early 1900s, the borough was a thriving industrial center, with several steel mills and other factories located in the area. The borough was also home to a large number of immigrants, including Italians, Poles, and Slovaks. The borough was also home to a large number of African Americans, who were employed in the steel mills and other factories.
The borough experienced a decline in the mid-1900s, as the steel industry declined and many of the factories closed. The population of the borough also declined, as many of the residents moved away in search of better job opportunities.
Geography
Brackenridge Borough is located in Allegheny County, Pennsylvania, along the Allegheny River. The borough is bordered by the city of Pittsburgh to the south, Tarentum to the east, and Harrison Township to the north. The borough covers an area of approximately 1.2 square miles, and has a population of approximately 3,000 people.
The borough is located in a hilly region, with the Allegheny River running through the center of the borough. The borough is home to several parks, including the Brackenridge Park, which features a playground, picnic area, and walking trails.
Economy
The economy of Brackenridge Borough is largely based on manufacturing and retail. The borough is home to several factories and warehouses, as well as a number of retail stores. The borough is also home to a number of small businesses, including restaurants, bars, and other service-oriented businesses.
The borough is also home to a number of educational institutions, including the Brackenridge High School and the Brackenridge Community College. The borough is also home to a number of churches, including the First Presbyterian Church and the St. Mary’s Catholic Church.
Demographics
As of the 2010 census, the population of Brackenridge Borough was 3,039. The racial makeup of the borough was 94.3% White, 2.2% African American, 0.3% Native American, 0.7% Asian, 0.1% Pacific Islander, and 2.4% from other races. Hispanic or Latino of any race were 1.7% of the population.
The median household income in the borough was $37,917, and the median family income was $45,938. The per capita income in the borough was $19,945. About 11.3% of the population was below the poverty line.
Brackenridge Borough is a small borough with a rich history and a diverse population. The borough is home to a number of factories and retail stores, as well as a number of educational institutions and churches. The borough is also home to a number of parks and recreational areas, making it a great place to live and work.
Common Questions
What is the Total Population of Brackenridge borough?
Total Population of Brackenridge borough is 3,214.
What is the Total Male Population of Brackenridge borough?
Total Male Population of Brackenridge borough is 1,414.
What is the Total Female Population of Brackenridge borough?
Total Female Population of Brackenridge borough is 1,800.
What is the Ratio of Males per 100 Females in Brackenridge borough?
There are 78.56 Males per 100 Females in Brackenridge borough.
What is the Ratio of Females per 100 Males in Brackenridge borough?
There are 127.30 Females per 100 Males in Brackenridge borough.
What is the Median Population Age in Brackenridge borough?
Median Population Age in Brackenridge borough is 47.9 Years.
What is the Average Family Size in Brackenridge borough
Average Family Size in Brackenridge borough is 2.5 People.
What is the Average Household Size in Brackenridge borough
Average Household Size in Brackenridge borough is 2.0 People.
What is Per Capita Income in Brackenridge borough?
Per Capita income in Brackenridge borough is $28,054.
What is the Median Family Income in Brackenridge borough?
Median Family Income in Brackenridge borough is $59,688.
What is the Median Household income in Brackenridge borough?
Median Household Income in Brackenridge borough is $49,388.
What is Income or Wage Gap in Brackenridge borough?
Income or Wage Gap in Brackenridge borough is 13.3%.
Women in Brackenridge borough earn 86.7 cents for every dollar earned by a man.
What is Inequality or Gini Index in Brackenridge borough?
Inequality or Gini Index in Brackenridge borough is 0.36.
How Large is the Labor Force in Brackenridge borough?
There are 1,636 People in the Labor Forcein in Brackenridge borough.
What is the Percentage of People in the Labor Force in Brackenridge borough?
58.5% of People are in the Labor Force in Brackenridge borough.
What is the Unemployment Rate in Brackenridge borough?
Unemployment Rate in Brackenridge borough is 1.5%.