Boyertown borough, PA
Boyertown borough Overview
4,244
TOTAL POPULATION
2,077
MALE POPULATION
2,167
FEMALE POPULATION
95.85
MALES / 100 FEMALES
104.33
FEMALES / 100 MALES
38.3
MEDIAN AGE
2.9
AVG FAMILY SIZE
2.0
AVG HOUSEHOLD SIZE
$35,047
PER CAPITA INCOME
$80,296
AVG FAMILY INCOME
$52,717
AVG HOUSEHOLD INCOME
42.9%
WAGE / INCOME GAP [ % ]
57.1¢/ $1
WAGE / INCOME GAP [ $ ]
0.41
INEQUALITY / GINI INDEX
2,206
LABOR FORCE [ PEOPLE ]
63.0%
PERCENT IN LABOR FORCE
4.2%
UNEMPLOYMENT RATE
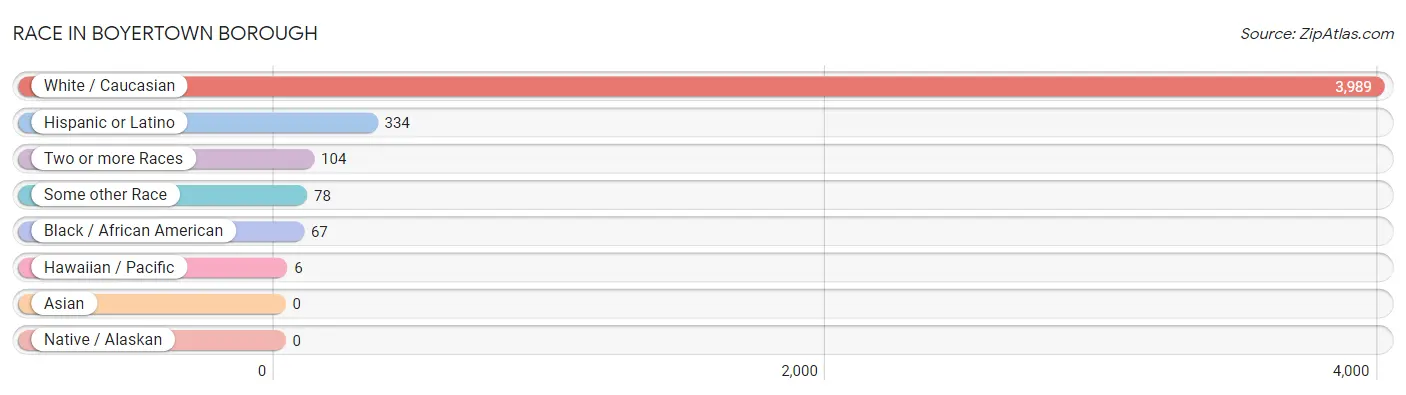
Race in Boyertown borough
The most populous races in Boyertown borough are White / Caucasian (3,989 | 94.0%), Hispanic or Latino (334 | 7.9%), and Two or more Races (104 | 2.5%).
| Race | # Population | % Population |
| Asian | 0 | 0.0% |
| Black / African American | 67 | 1.6% |
| Hawaiian / Pacific | 6 | 0.1% |
| Hispanic or Latino | 334 | 7.9% |
| Native / Alaskan | 0 | 0.0% |
| White / Caucasian | 3,989 | 94.0% |
| Two or more Races | 104 | 2.5% |
| Some other Race | 78 | 1.8% |
| Total | 4,244 | 100.0% |
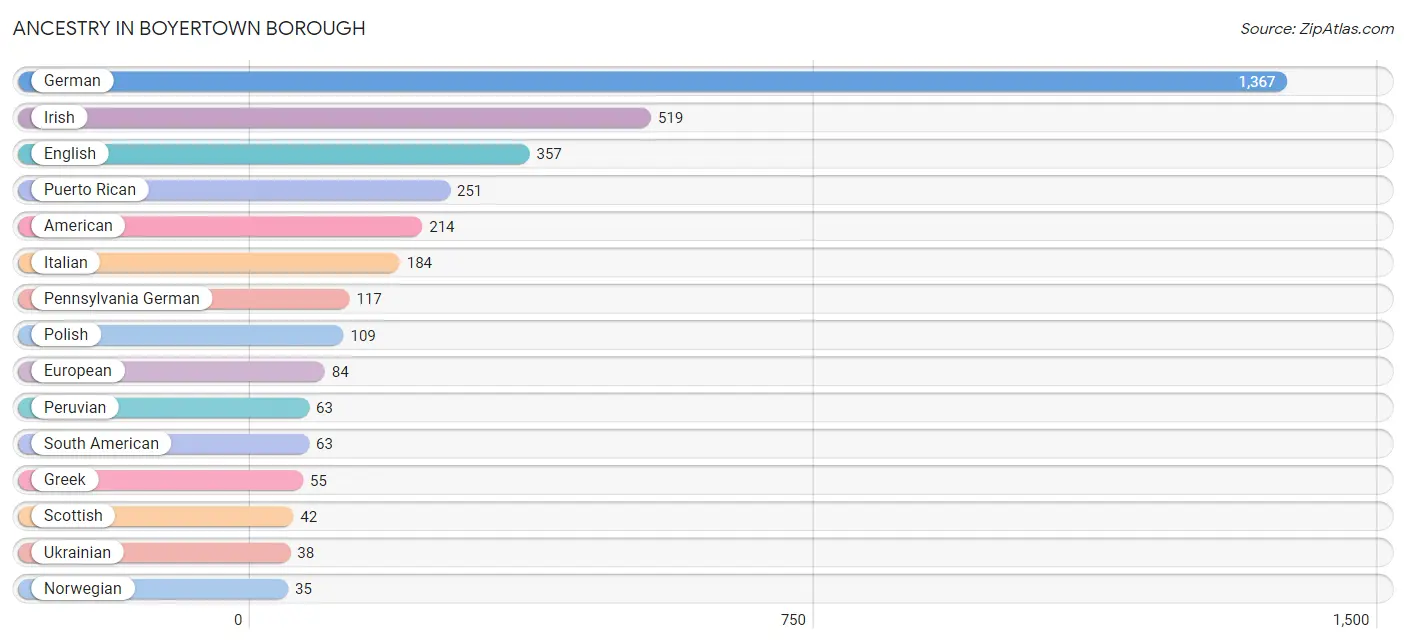
Ancestry in Boyertown borough
The most populous ancestries reported in Boyertown borough are German (1,367 | 32.2%), Irish (519 | 12.2%), English (357 | 8.4%), Puerto Rican (251 | 5.9%), and American (214 | 5.0%), together accounting for 63.8% of all Boyertown borough residents.
| Ancestry | # Population | % Population |
| American | 214 | 5.0% |
| Austrian | 13 | 0.3% |
| Czechoslovakian | 18 | 0.4% |
| Delaware | 3 | 0.1% |
| Dutch | 8 | 0.2% |
| Eastern European | 24 | 0.6% |
| English | 357 | 8.4% |
| European | 84 | 2.0% |
| French | 27 | 0.6% |
| German | 1,367 | 32.2% |
| Greek | 55 | 1.3% |
| Hungarian | 17 | 0.4% |
| Irish | 519 | 12.2% |
| Italian | 184 | 4.3% |
| Lithuanian | 28 | 0.7% |
| Mexican | 20 | 0.5% |
| Native Hawaiian | 6 | 0.1% |
| Norwegian | 35 | 0.8% |
| Pennsylvania German | 117 | 2.8% |
| Peruvian | 63 | 1.5% |
| Polish | 109 | 2.6% |
| Puerto Rican | 251 | 5.9% |
| Scotch-Irish | 7 | 0.2% |
| Scottish | 42 | 1.0% |
| Slovak | 8 | 0.2% |
| South American | 63 | 1.5% |
| Swedish | 23 | 0.5% |
| Swiss | 10 | 0.2% |
| Ukrainian | 38 | 0.9% |
| Welsh | 17 | 0.4% | View All 30 Rows |
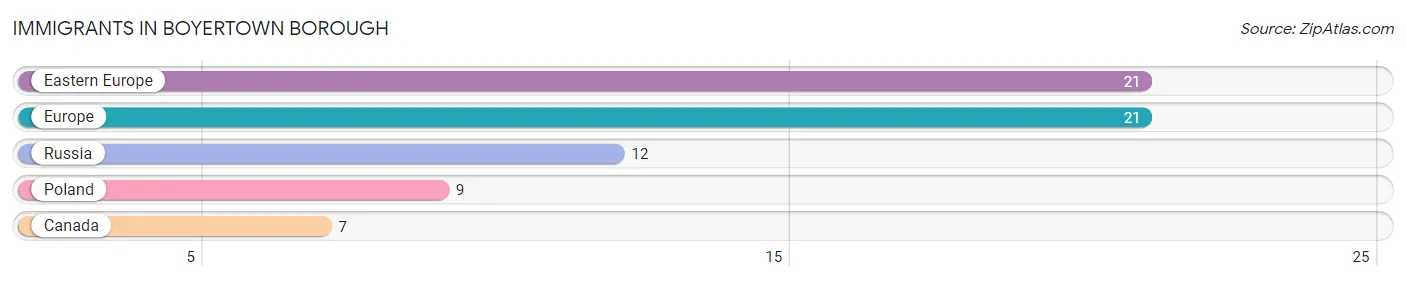
Immigrants in Boyertown borough
The most numerous immigrant groups reported in Boyertown borough came from Eastern Europe (21 | 0.5%), Europe (21 | 0.5%), Russia (12 | 0.3%), Poland (9 | 0.2%), and Canada (7 | 0.2%), together accounting for 1.6% of all Boyertown borough residents.
| Immigration Origin | # Population | % Population |
| Canada | 7 | 0.2% |
| Eastern Europe | 21 | 0.5% |
| Europe | 21 | 0.5% |
| Poland | 9 | 0.2% |
| Russia | 12 | 0.3% | View All 5 Rows |
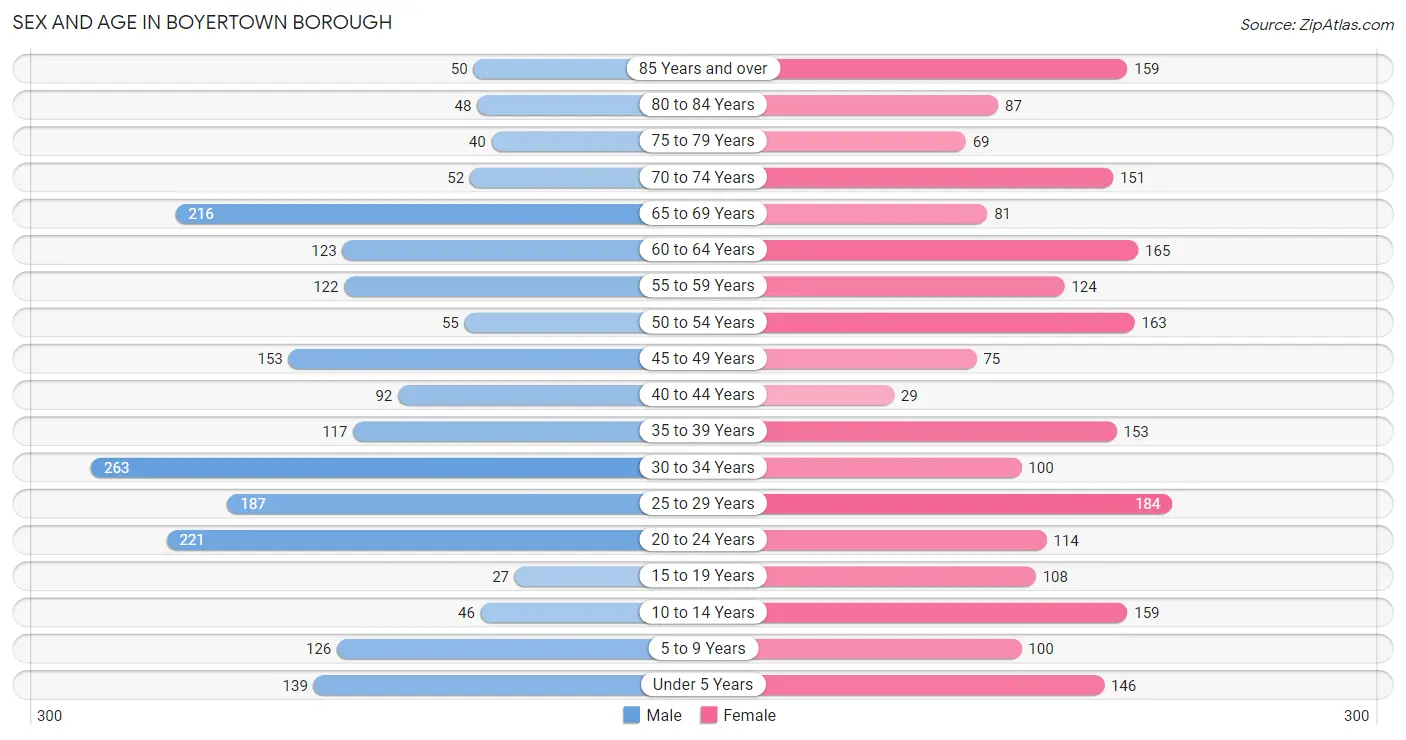
Sex and Age in Boyertown borough
Sex and Age in Boyertown borough
The most populous age groups in Boyertown borough are 30 to 34 Years (263 | 12.7%) for men and 25 to 29 Years (184 | 8.5%) for women.
| Age Bracket | Male | Female |
| Under 5 Years | 139 (6.7%) | 146 (6.7%) |
| 5 to 9 Years | 126 (6.1%) | 100 (4.6%) |
| 10 to 14 Years | 46 (2.2%) | 159 (7.3%) |
| 15 to 19 Years | 27 (1.3%) | 108 (5.0%) |
| 20 to 24 Years | 221 (10.6%) | 114 (5.3%) |
| 25 to 29 Years | 187 (9.0%) | 184 (8.5%) |
| 30 to 34 Years | 263 (12.7%) | 100 (4.6%) |
| 35 to 39 Years | 117 (5.6%) | 153 (7.1%) |
| 40 to 44 Years | 92 (4.4%) | 29 (1.3%) |
| 45 to 49 Years | 153 (7.4%) | 75 (3.5%) |
| 50 to 54 Years | 55 (2.6%) | 163 (7.5%) |
| 55 to 59 Years | 122 (5.9%) | 124 (5.7%) |
| 60 to 64 Years | 123 (5.9%) | 165 (7.6%) |
| 65 to 69 Years | 216 (10.4%) | 81 (3.7%) |
| 70 to 74 Years | 52 (2.5%) | 151 (7.0%) |
| 75 to 79 Years | 40 (1.9%) | 69 (3.2%) |
| 80 to 84 Years | 48 (2.3%) | 87 (4.0%) |
| 85 Years and over | 50 (2.4%) | 159 (7.3%) |
| Total | 2,077 (100.0%) | 2,167 (100.0%) |
Families and Households in Boyertown borough
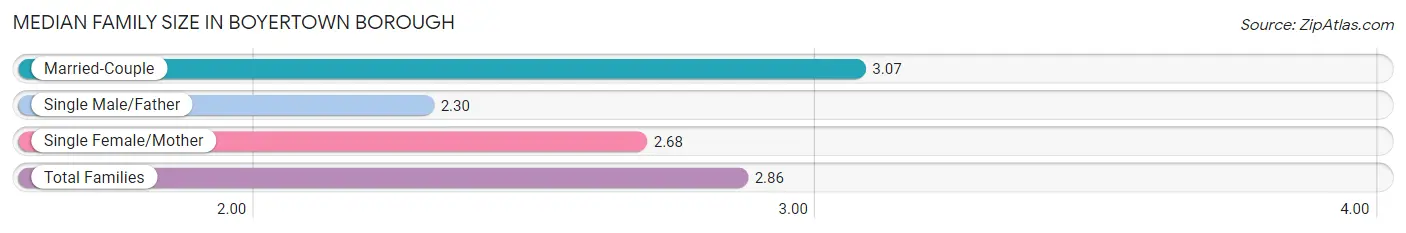
Median Family Size in Boyertown borough
The median family size in Boyertown borough is 2.86 persons per family, with married-couple families (622 | 62.3%) accounting for the largest median family size of 3.07 persons per family. On the other hand, single male/father families (157 | 15.7%) represent the smallest median family size with 2.30 persons per family.
| Family Type | # Families | Family Size |
| Married-Couple | 622 (62.3%) | 3.07 |
| Single Male/Father | 157 (15.7%) | 2.30 |
| Single Female/Mother | 220 (22.0%) | 2.68 |
| Total Families | 999 (100.0%) | 2.86 |
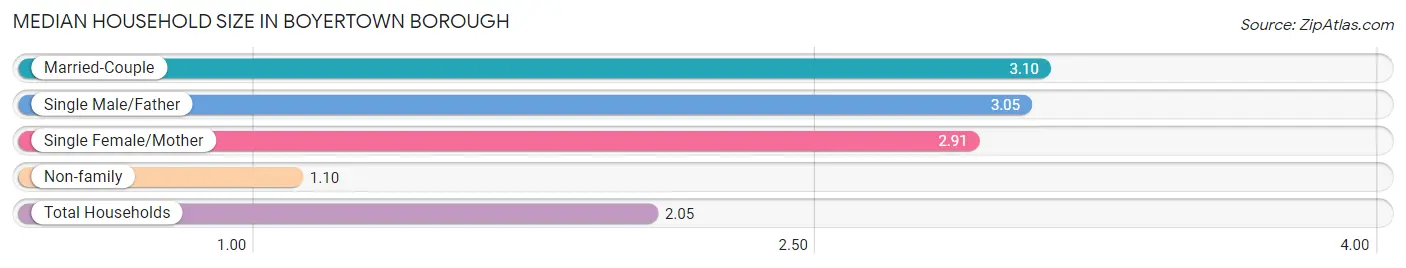
Median Household Size in Boyertown borough
The median household size in Boyertown borough is 2.05 persons per household, with married-couple households (622 | 30.2%) accounting for the largest median household size of 3.1 persons per household. non-family households (1,063 | 51.5%) represent the smallest median household size with 1.10 persons per household.
| Household Type | # Households | Household Size |
| Married-Couple | 622 (30.2%) | 3.10 |
| Single Male/Father | 157 (7.6%) | 3.05 |
| Single Female/Mother | 220 (10.7%) | 2.91 |
| Non-family | 1,063 (51.5%) | 1.10 |
| Total Households | 2,062 (100.0%) | 2.05 |
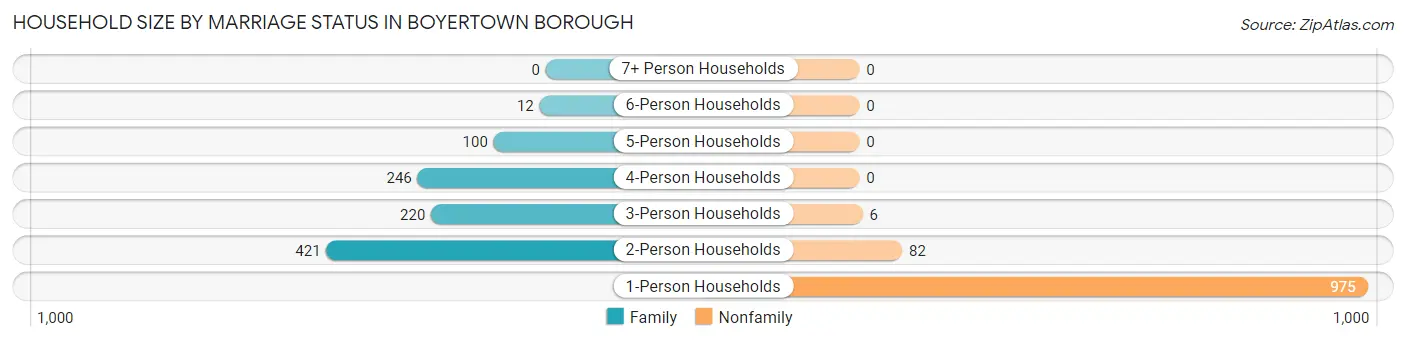
Household Size by Marriage Status in Boyertown borough
Out of a total of 2,062 households in Boyertown borough, 999 (48.4%) are family households, while 1,063 (51.5%) are nonfamily households. The most numerous type of family households are 2-person households, comprising 421, and the most common type of nonfamily households are 1-person households, comprising 975.
| Household Size | Family Households | Nonfamily Households |
| 1-Person Households | - | 975 (47.3%) |
| 2-Person Households | 421 (20.4%) | 82 (4.0%) |
| 3-Person Households | 220 (10.7%) | 6 (0.3%) |
| 4-Person Households | 246 (11.9%) | 0 (0.0%) |
| 5-Person Households | 100 (4.9%) | 0 (0.0%) |
| 6-Person Households | 12 (0.6%) | 0 (0.0%) |
| 7+ Person Households | 0 (0.0%) | 0 (0.0%) |
| Total | 999 (48.4%) | 1,063 (51.5%) |
Female Fertility in Boyertown borough
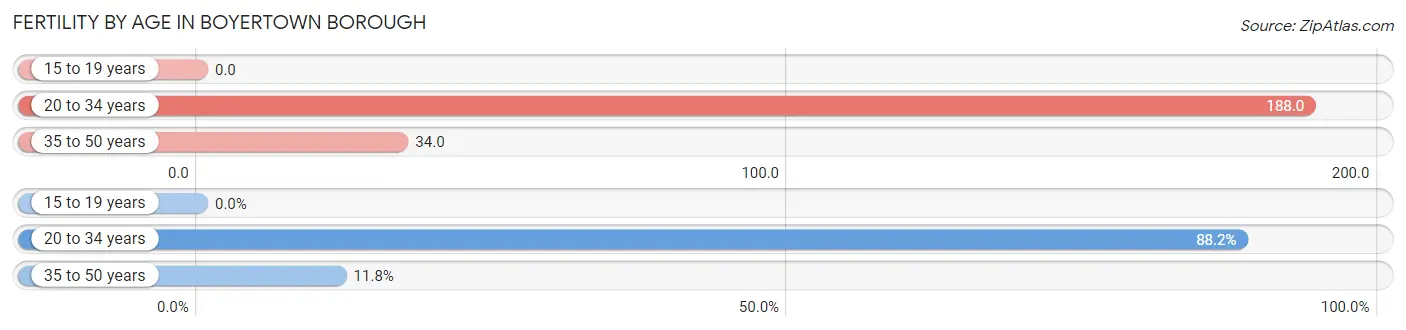
Fertility by Age in Boyertown borough
Average fertility rate in Boyertown borough is 106.0 births per 1,000 women. Women in the age bracket of 20 to 34 years have the highest fertility rate with 188.0 births per 1,000 women. Women in the age bracket of 20 to 34 years acount for 88.2% of all women with births.
| Age Bracket | Women with Births | Births / 1,000 Women |
| 15 to 19 years | 0 (0.0%) | 0.0 |
| 20 to 34 years | 75 (88.2%) | 188.0 |
| 35 to 50 years | 10 (11.8%) | 34.0 |
| Total | 85 (100.0%) | 106.0 |
Fertility by Age by Marriage Status in Boyertown borough
78.8% of women with births (85) in Boyertown borough are married. The highest percentage of unmarried women with births falls into 20 to 34 years age bracket with 24.0% of them unmarried at the time of birth, while the lowest percentage of unmarried women with births belong to 35 to 50 years age bracket with 0.0% of them unmarried.
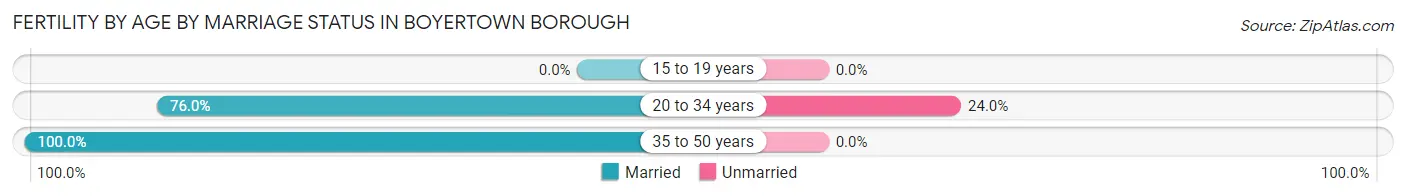
| Age Bracket | Married | Unmarried |
| 15 to 19 years | 0 (0.0%) | 0 (0.0%) |
| 20 to 34 years | 57 (76.0%) | 18 (24.0%) |
| 35 to 50 years | 10 (100.0%) | 0 (0.0%) |
| Total | 67 (78.8%) | 18 (21.2%) |
Fertility by Education in Boyertown borough
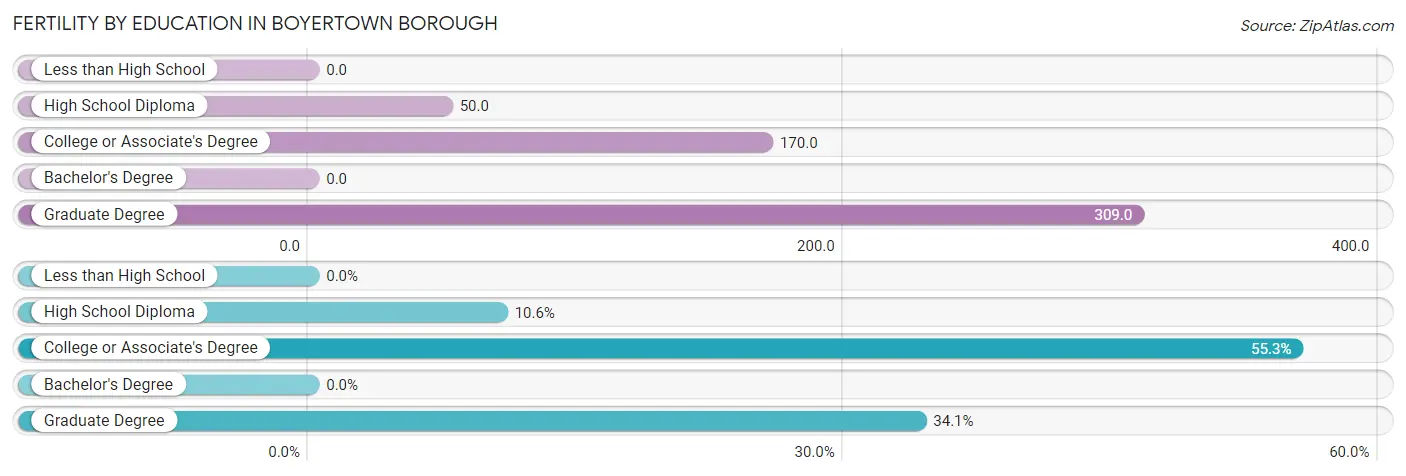
| Educational Attainment | Women with Births | Births / 1,000 Women |
| Less than High School | 0 (0.0%) | 0.0 |
| High School Diploma | 9 (10.6%) | 50.0 |
| College or Associate's Degree | 47 (55.3%) | 170.0 |
| Bachelor's Degree | 0 (0.0%) | 0.0 |
| Graduate Degree | 29 (34.1%) | 309.0 |
| Total | 85 (100.0%) | 106.0 |
Fertility by Education by Marriage Status in Boyertown borough
21.2% of women with births in Boyertown borough are unmarried. Women with the educational attainment of graduate degree are most likely to be married with 100.0% of them married at childbirth, while women with the educational attainment of high school diploma are least likely to be married with 100.0% of them unmarried at childbirth.
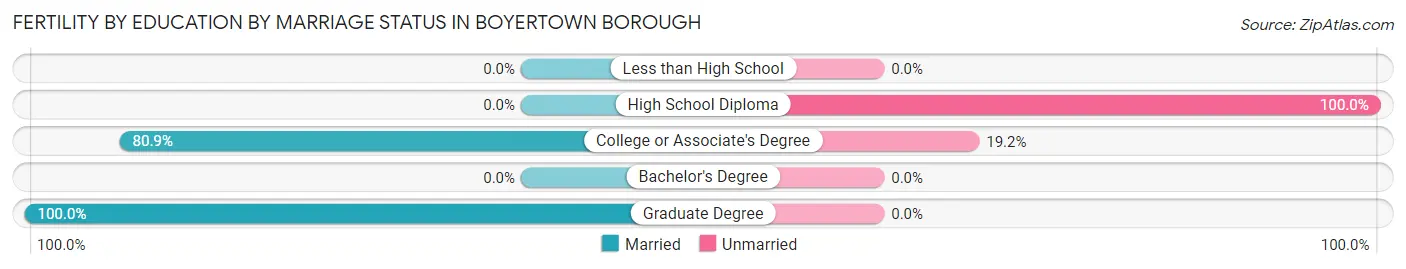
| Educational Attainment | Married | Unmarried |
| Less than High School | 0 (0.0%) | 0 (0.0%) |
| High School Diploma | 0 (0.0%) | 9 (100.0%) |
| College or Associate's Degree | 38 (80.8%) | 9 (19.2%) |
| Bachelor's Degree | 0 (0.0%) | 0 (0.0%) |
| Graduate Degree | 29 (100.0%) | 0 (0.0%) |
| Total | 67 (78.8%) | 18 (21.2%) |
Income in Boyertown borough
Income Overview in Boyertown borough
Per Capita Income in Boyertown borough is $35,047, while median incomes of families and households are $80,296 and $52,717 respectively.
| Characteristic | Number | Measure |
| Per Capita Income | 4,244 | $35,047 |
| Median Family Income | 999 | $80,296 |
| Mean Family Income | 999 | $98,947 |
| Median Household Income | 2,062 | $52,717 |
| Mean Household Income | 2,062 | $72,843 |
| Income Deficit | 999 | $0 |
| Wage / Income Gap (%) | 4,244 | 42.91% |
| Wage / Income Gap ($) | 4,244 | 57.09¢ per $1 |
| Gini / Inequality Index | 4,244 | 0.41 |
Earnings by Sex in Boyertown borough
Average Earnings in Boyertown borough are $44,250, $51,004 for men and $29,118 for women, a difference of 42.9%.
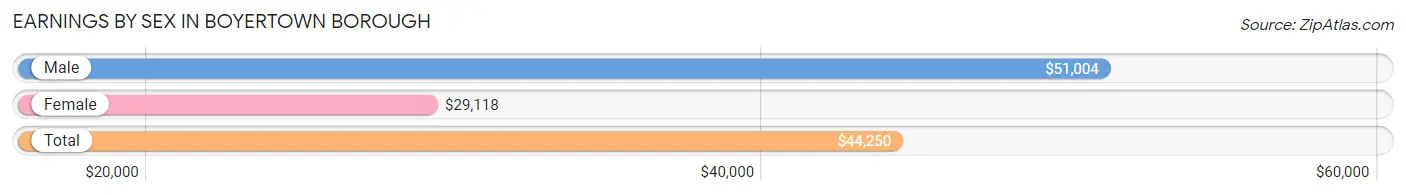
| Sex | Number | Average Earnings |
| Male | 1,294 (55.6%) | $51,004 |
| Female | 1,034 (44.4%) | $29,118 |
| Total | 2,328 (100.0%) | $44,250 |
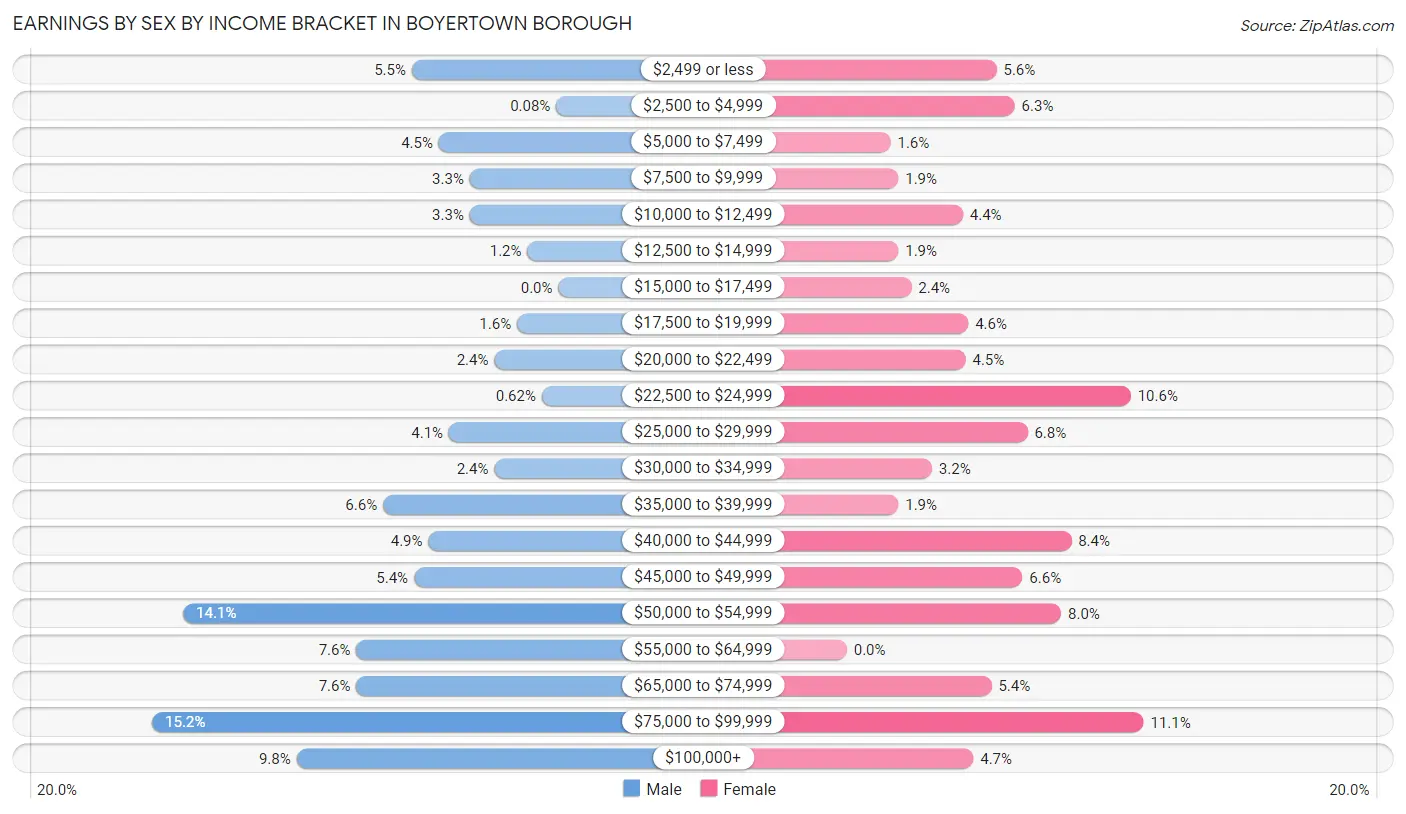
Earnings by Sex by Income Bracket in Boyertown borough
The most common earnings brackets in Boyertown borough are $75,000 to $99,999 for men (197 | 15.2%) and $75,000 to $99,999 for women (115 | 11.1%).
| Income | Male | Female |
| $2,499 or less | 71 (5.5%) | 58 (5.6%) |
| $2,500 to $4,999 | 1 (0.1%) | 65 (6.3%) |
| $5,000 to $7,499 | 58 (4.5%) | 17 (1.6%) |
| $7,500 to $9,999 | 43 (3.3%) | 20 (1.9%) |
| $10,000 to $12,499 | 43 (3.3%) | 45 (4.3%) |
| $12,500 to $14,999 | 15 (1.2%) | 20 (1.9%) |
| $15,000 to $17,499 | 0 (0.0%) | 25 (2.4%) |
| $17,500 to $19,999 | 20 (1.5%) | 47 (4.5%) |
| $20,000 to $22,499 | 31 (2.4%) | 46 (4.4%) |
| $22,500 to $24,999 | 8 (0.6%) | 110 (10.6%) |
| $25,000 to $29,999 | 53 (4.1%) | 70 (6.8%) |
| $30,000 to $34,999 | 31 (2.4%) | 33 (3.2%) |
| $35,000 to $39,999 | 85 (6.6%) | 20 (1.9%) |
| $40,000 to $44,999 | 63 (4.9%) | 87 (8.4%) |
| $45,000 to $49,999 | 70 (5.4%) | 68 (6.6%) |
| $50,000 to $54,999 | 182 (14.1%) | 83 (8.0%) |
| $55,000 to $64,999 | 98 (7.6%) | 0 (0.0%) |
| $65,000 to $74,999 | 98 (7.6%) | 56 (5.4%) |
| $75,000 to $99,999 | 197 (15.2%) | 115 (11.1%) |
| $100,000+ | 127 (9.8%) | 49 (4.7%) |
| Total | 1,294 (100.0%) | 1,034 (100.0%) |
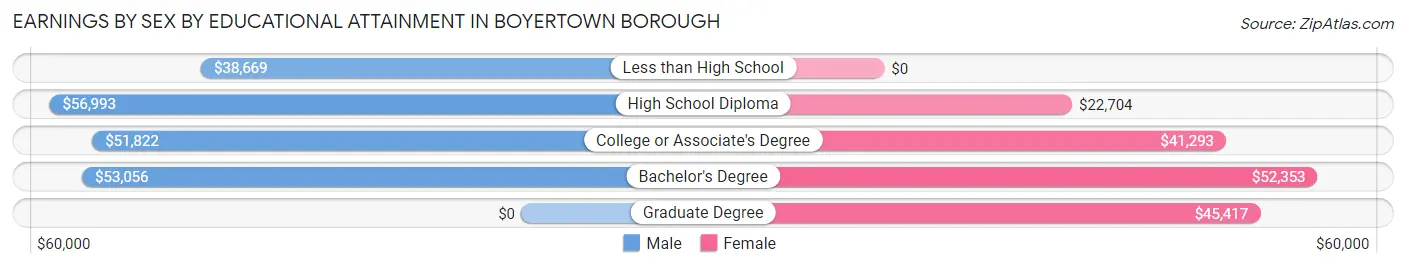
Earnings by Sex by Educational Attainment in Boyertown borough
Average earnings in Boyertown borough are $52,500 for men and $41,067 for women, a difference of 21.8%. Men with an educational attainment of high school diploma enjoy the highest average annual earnings of $56,993, while those with less than high school education earn the least with $38,669. Women with an educational attainment of bachelor's degree earn the most with the average annual earnings of $52,353, while those with high school diploma education have the smallest earnings of $22,704.
| Educational Attainment | Male Income | Female Income |
| Less than High School | $38,669 | $0 |
| High School Diploma | $56,993 | $22,704 |
| College or Associate's Degree | $51,822 | $41,293 |
| Bachelor's Degree | $53,056 | $52,353 |
| Graduate Degree | - | - |
| Total | $52,500 | $41,067 |
Family Income in Boyertown borough
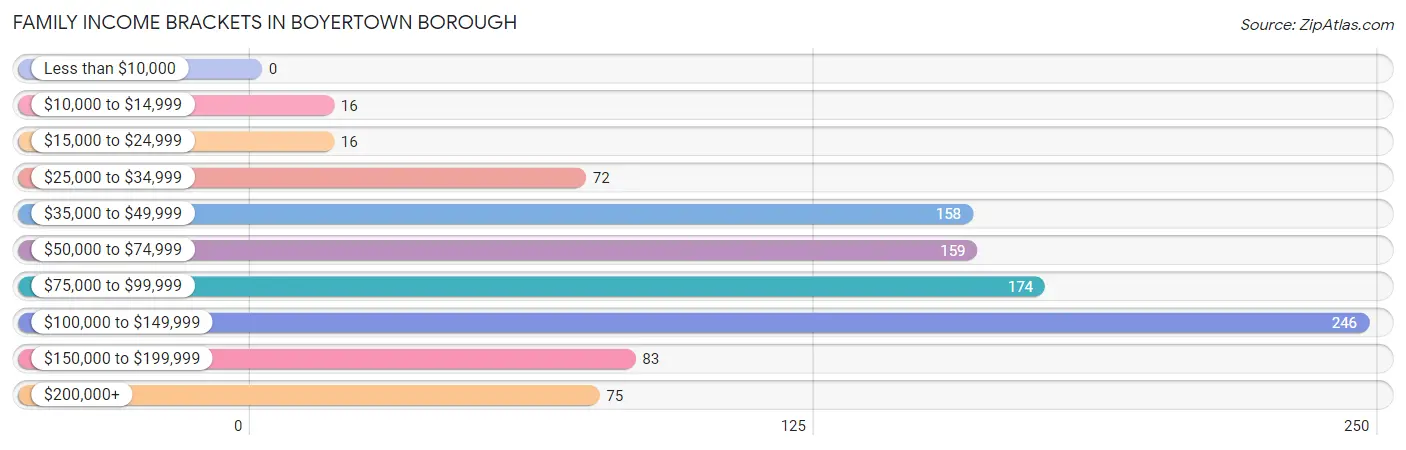
Family Income Brackets in Boyertown borough
According to the Boyertown borough family income data, there are 246 families falling into the $100,000 to $149,999 income range, which is the most common income bracket and makes up 24.6% of all families.
| Income Bracket | # Families | % Families |
| Less than $10,000 | 0 | 0.0% |
| $10,000 to $14,999 | 16 | 1.6% |
| $15,000 to $24,999 | 16 | 1.6% |
| $25,000 to $34,999 | 72 | 7.2% |
| $35,000 to $49,999 | 158 | 15.8% |
| $50,000 to $74,999 | 159 | 15.9% |
| $75,000 to $99,999 | 174 | 17.4% |
| $100,000 to $149,999 | 246 | 24.6% |
| $150,000 to $199,999 | 83 | 8.3% |
| $200,000+ | 75 | 7.5% |
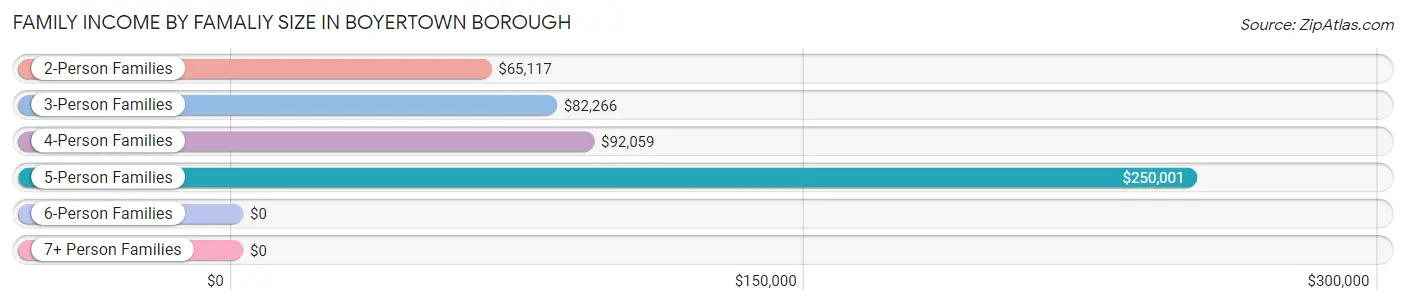
Family Income by Famaliy Size in Boyertown borough
5-person families (91 | 9.1%) account for the highest median family income in Boyertown borough with $250,001 per family, while 5-person families (91 | 9.1%) have the highest median income of $50,000 per family member.
| Income Bracket | # Families | Median Income |
| 2-Person Families | 515 (51.5%) | $65,117 |
| 3-Person Families | 225 (22.5%) | $82,266 |
| 4-Person Families | 156 (15.6%) | $92,059 |
| 5-Person Families | 91 (9.1%) | $250,001 |
| 6-Person Families | 12 (1.2%) | $0 |
| 7+ Person Families | 0 (0.0%) | $0 |
| Total | 999 (100.0%) | $80,296 |
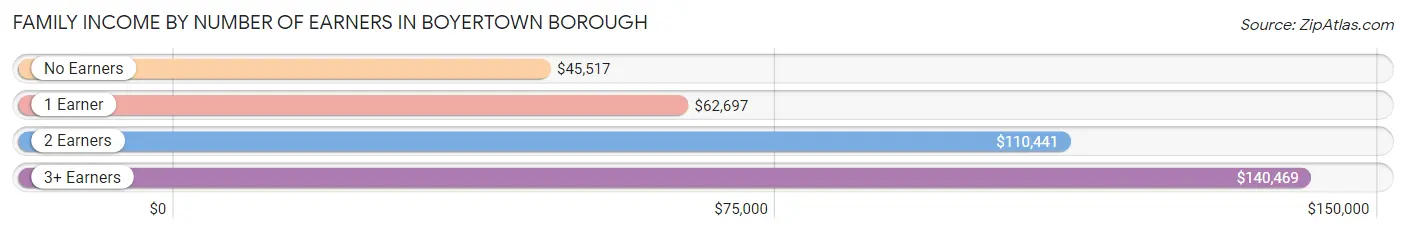
Family Income by Number of Earners in Boyertown borough
The median family income in Boyertown borough is $80,296, with families comprising 3+ earners (128) having the highest median family income of $140,469, while families with no earners (146) have the lowest median family income of $45,517, accounting for 12.8% and 14.6% of families, respectively.
| Number of Earners | # Families | Median Income |
| No Earners | 146 (14.6%) | $45,517 |
| 1 Earner | 299 (29.9%) | $62,697 |
| 2 Earners | 426 (42.6%) | $110,441 |
| 3+ Earners | 128 (12.8%) | $140,469 |
| Total | 999 (100.0%) | $80,296 |
Household Income in Boyertown borough
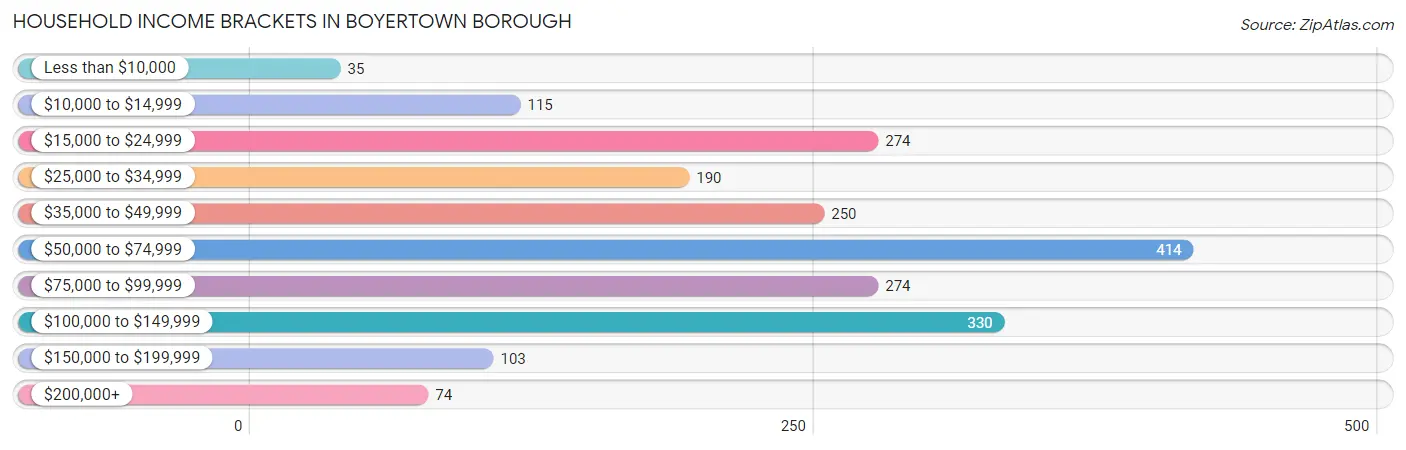
Household Income Brackets in Boyertown borough
With 414 households falling in the category, the $50,000 to $74,999 income range is the most frequent in Boyertown borough, accounting for 20.1% of all households. In contrast, only 35 households (1.7%) fall into the less than $10,000 income bracket, making it the least populous group.
| Income Bracket | # Households | % Households |
| Less than $10,000 | 35 | 1.7% |
| $10,000 to $14,999 | 115 | 5.6% |
| $15,000 to $24,999 | 274 | 13.3% |
| $25,000 to $34,999 | 190 | 9.2% |
| $35,000 to $49,999 | 250 | 12.1% |
| $50,000 to $74,999 | 414 | 20.1% |
| $75,000 to $99,999 | 274 | 13.3% |
| $100,000 to $149,999 | 330 | 16.0% |
| $150,000 to $199,999 | 103 | 5.0% |
| $200,000+ | 74 | 3.6% |
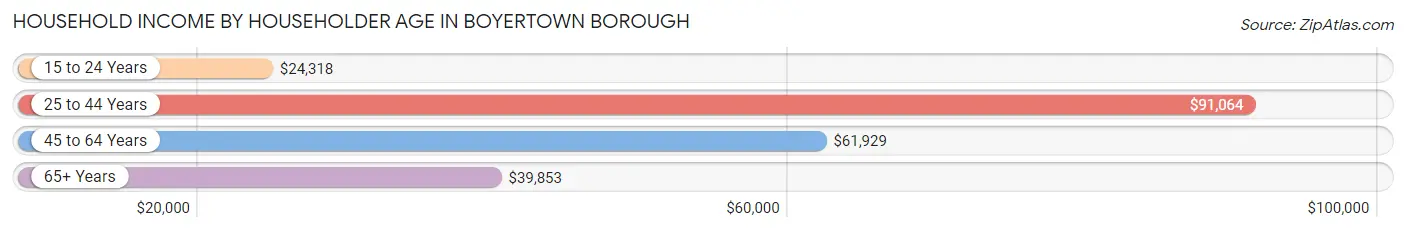
Household Income by Householder Age in Boyertown borough
The median household income in Boyertown borough is $52,717, with the highest median household income of $91,064 found in the 25 to 44 years age bracket for the primary householder. A total of 540 households (26.2%) fall into this category. Meanwhile, the 15 to 24 years age bracket for the primary householder has the lowest median household income of $24,318, with 92 households (4.5%) in this group.
| Income Bracket | # Households | Median Income |
| 15 to 24 Years | 92 (4.5%) | $24,318 |
| 25 to 44 Years | 540 (26.2%) | $91,064 |
| 45 to 64 Years | 636 (30.8%) | $61,929 |
| 65+ Years | 794 (38.5%) | $39,853 |
| Total | 2,062 (100.0%) | $52,717 |
Poverty in Boyertown borough
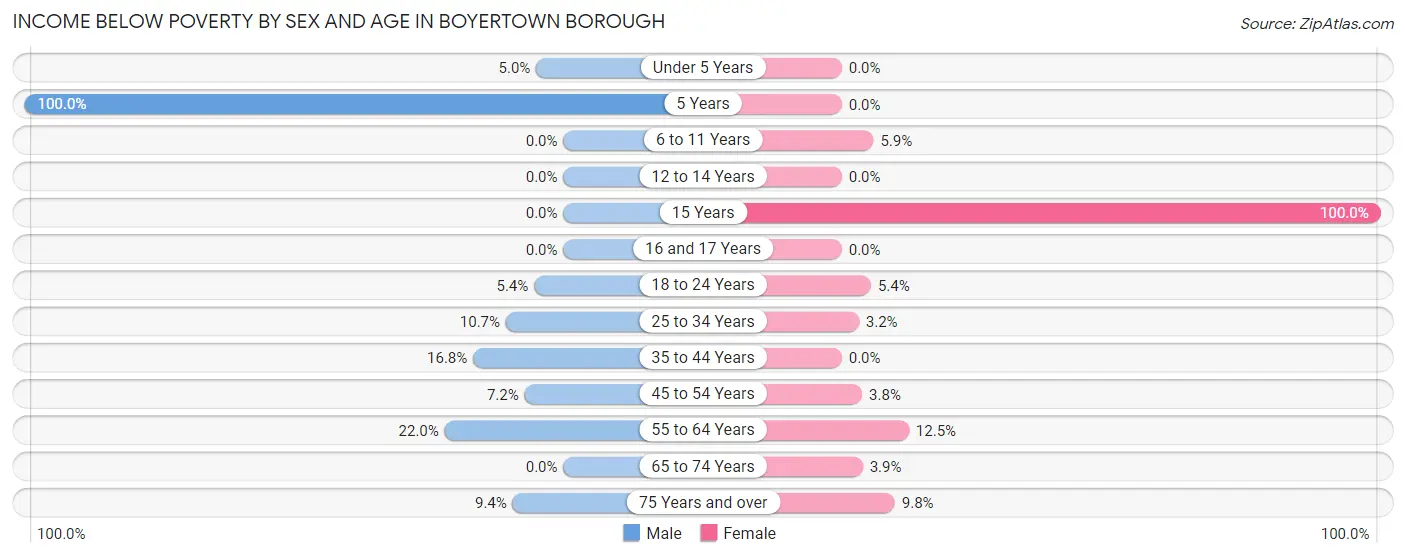
Income Below Poverty by Sex and Age in Boyertown borough
With 9.2% poverty level for males and 5.5% for females among the residents of Boyertown borough, 5 year old males and 15 year old females are the most vulnerable to poverty, with 8 males (100.0%) and 8 females (100.0%) in their respective age groups living below the poverty level.
| Age Bracket | Male | Female |
| Under 5 Years | 7 (5.0%) | 0 (0.0%) |
| 5 Years | 8 (100.0%) | 0 (0.0%) |
| 6 to 11 Years | 0 (0.0%) | 8 (5.9%) |
| 12 to 14 Years | 0 (0.0%) | 0 (0.0%) |
| 15 Years | 0 (0.0%) | 8 (100.0%) |
| 16 and 17 Years | 0 (0.0%) | 0 (0.0%) |
| 18 to 24 Years | 12 (5.4%) | 9 (5.4%) |
| 25 to 34 Years | 48 (10.7%) | 9 (3.2%) |
| 35 to 44 Years | 35 (16.8%) | 0 (0.0%) |
| 45 to 54 Years | 15 (7.2%) | 9 (3.8%) |
| 55 to 64 Years | 54 (22.0%) | 36 (12.5%) |
| 65 to 74 Years | 0 (0.0%) | 9 (3.9%) |
| 75 Years and over | 13 (9.4%) | 31 (9.8%) |
| Total | 192 (9.2%) | 119 (5.5%) |
Income Above Poverty by Sex and Age in Boyertown borough
According to the poverty statistics in Boyertown borough, males aged 6 to 11 years and females aged under 5 years are the age groups that are most secure financially, with 100.0% of males and 100.0% of females in these age groups living above the poverty line.
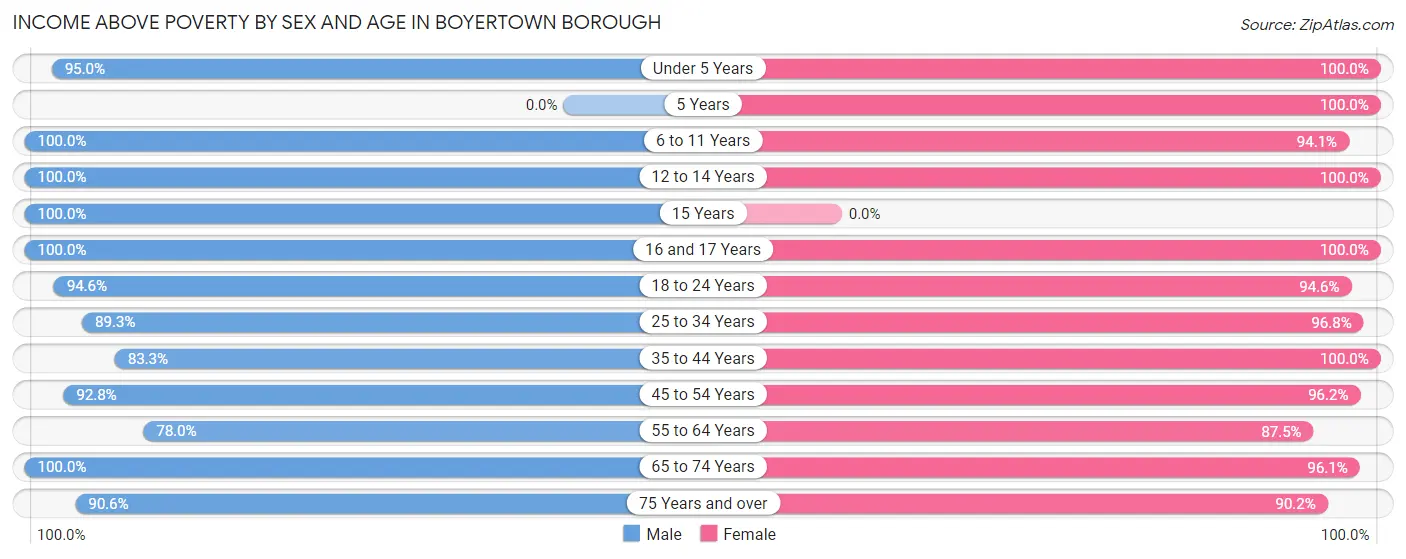
| Age Bracket | Male | Female |
| Under 5 Years | 132 (95.0%) | 146 (100.0%) |
| 5 Years | 0 (0.0%) | 24 (100.0%) |
| 6 to 11 Years | 126 (100.0%) | 128 (94.1%) |
| 12 to 14 Years | 38 (100.0%) | 99 (100.0%) |
| 15 Years | 18 (100.0%) | 0 (0.0%) |
| 16 and 17 Years | 9 (100.0%) | 48 (100.0%) |
| 18 to 24 Years | 209 (94.6%) | 157 (94.6%) |
| 25 to 34 Years | 402 (89.3%) | 275 (96.8%) |
| 35 to 44 Years | 174 (83.3%) | 182 (100.0%) |
| 45 to 54 Years | 193 (92.8%) | 229 (96.2%) |
| 55 to 64 Years | 191 (78.0%) | 253 (87.5%) |
| 65 to 74 Years | 268 (100.0%) | 223 (96.1%) |
| 75 Years and over | 125 (90.6%) | 284 (90.2%) |
| Total | 1,885 (90.8%) | 2,048 (94.5%) |
Income Below Poverty Among Married-Couple Families in Boyertown borough
The poverty statistics for married-couple families in Boyertown borough show that 2.2% or 14 of the total 622 families live below the poverty line. Families with no children have the highest poverty rate of 4.0%, comprising of 14 families. On the other hand, families with 1 or 2 children have the lowest poverty rate of 0.0%, which includes 0 families.
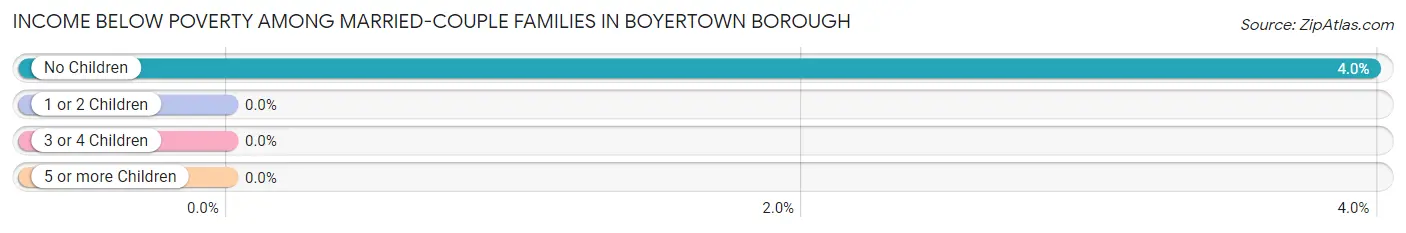
| Children | Above Poverty | Below Poverty |
| No Children | 338 (96.0%) | 14 (4.0%) |
| 1 or 2 Children | 187 (100.0%) | 0 (0.0%) |
| 3 or 4 Children | 83 (100.0%) | 0 (0.0%) |
| 5 or more Children | 0 (0.0%) | 0 (0.0%) |
| Total | 608 (97.8%) | 14 (2.2%) |
Income Below Poverty Among Single-Parent Households in Boyertown borough
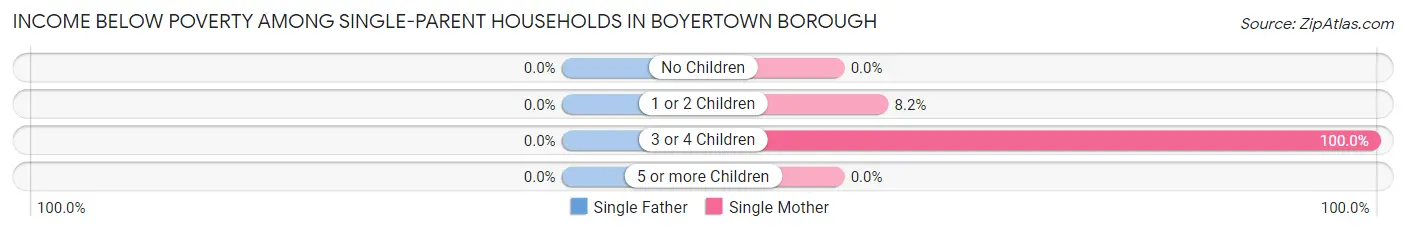
| Children | Single Father | Single Mother |
| No Children | 0 (0.0%) | 0 (0.0%) |
| 1 or 2 Children | 0 (0.0%) | 9 (8.2%) |
| 3 or 4 Children | 0 (0.0%) | 9 (100.0%) |
| 5 or more Children | 0 (0.0%) | 0 (0.0%) |
| Total | 0 (0.0%) | 18 (8.2%) |
Income Below Poverty Among Married-Couple vs Single-Parent Households in Boyertown borough
The poverty data for Boyertown borough shows that 14 of the married-couple family households (2.2%) and 18 of the single-parent households (4.8%) are living below the poverty level. Within the married-couple family households, those with no children have the highest poverty rate, with 14 households (4.0%) falling below the poverty line. Among the single-parent households, those with 3 or 4 children have the highest poverty rate, with 9 household (100.0%) living below poverty.
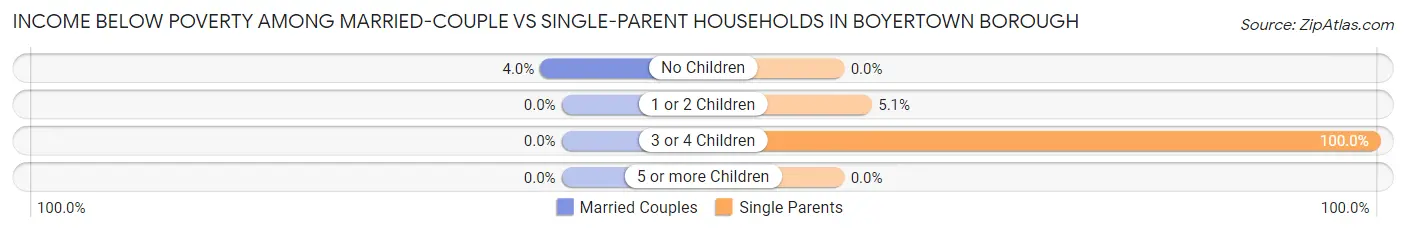
| Children | Married-Couple Families | Single-Parent Households |
| No Children | 14 (4.0%) | 0 (0.0%) |
| 1 or 2 Children | 0 (0.0%) | 9 (5.1%) |
| 3 or 4 Children | 0 (0.0%) | 9 (100.0%) |
| 5 or more Children | 0 (0.0%) | 0 (0.0%) |
| Total | 14 (2.2%) | 18 (4.8%) |
Employment Characteristics in Boyertown borough
Employment by Class of Employer in Boyertown borough
Among the 2,090 employed individuals in Boyertown borough, private company employees (1,625 | 77.7%), not-for-profit organizations (132 | 6.3%), and local government employees (92 | 4.4%) make up the most common classes of employment.
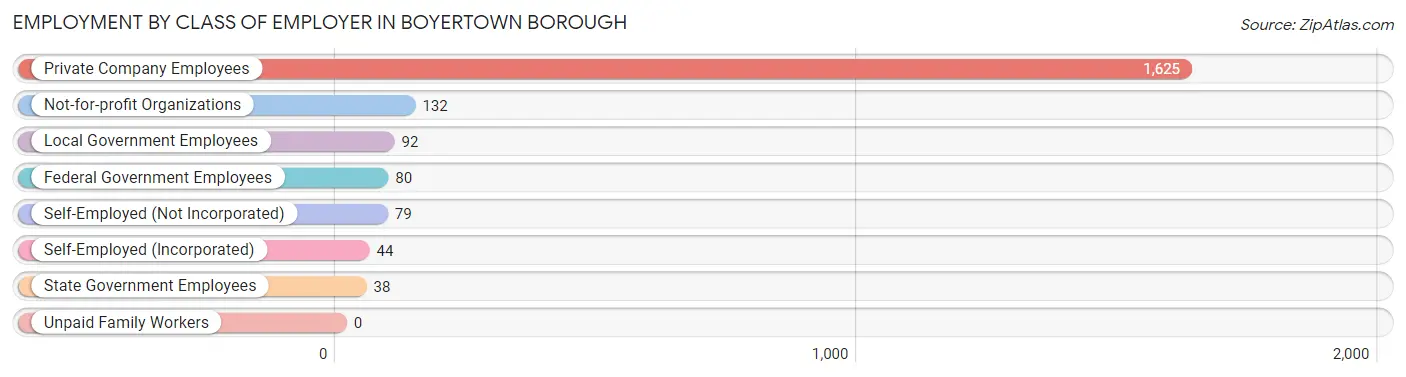
| Employer Class | # Employees | % Employees |
| Private Company Employees | 1,625 | 77.7% |
| Self-Employed (Incorporated) | 44 | 2.1% |
| Self-Employed (Not Incorporated) | 79 | 3.8% |
| Not-for-profit Organizations | 132 | 6.3% |
| Local Government Employees | 92 | 4.4% |
| State Government Employees | 38 | 1.8% |
| Federal Government Employees | 80 | 3.8% |
| Unpaid Family Workers | 0 | 0.0% |
| Total | 2,090 | 100.0% |
Employment Status by Age in Boyertown borough
According to the labor force statistics for Boyertown borough, out of the total population over 16 years of age (3,502), 63.0% or 2,206 individuals are in the labor force, with 4.2% or 93 of them unemployed. The age group with the highest labor force participation rate is 45 to 54 years, with 96.6% or 431 individuals in the labor force. Within the labor force, the 20 to 24 years age range has the highest percentage of unemployed individuals, with 16.9% or 33 of them being unemployed.
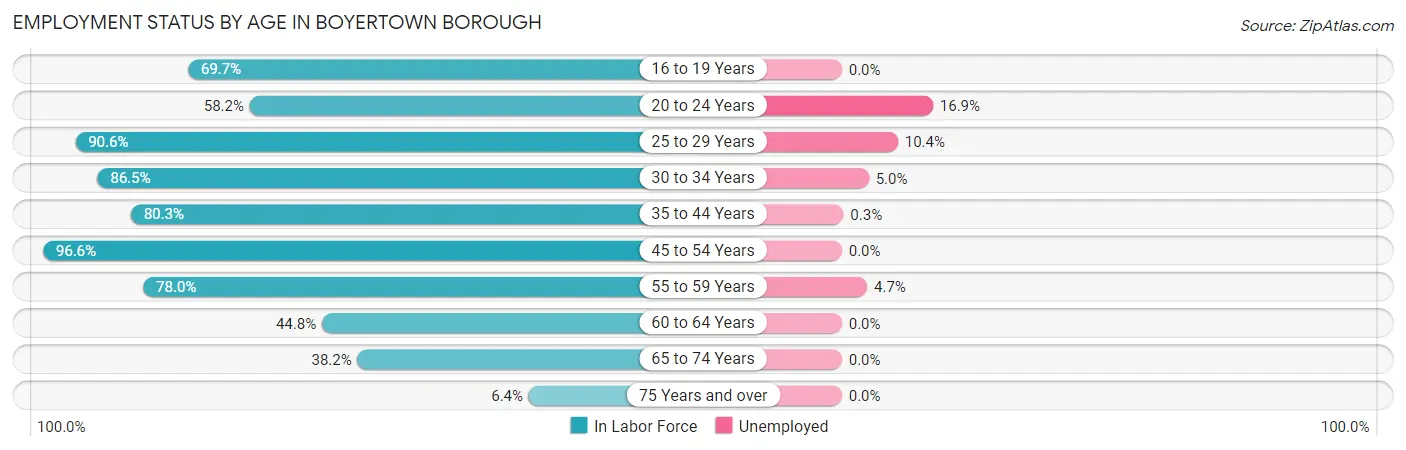
| Age Bracket | In Labor Force | Unemployed |
| 16 to 19 Years | 76 (69.7%) | 0 (0.0%) |
| 20 to 24 Years | 195 (58.2%) | 33 (16.9%) |
| 25 to 29 Years | 336 (90.6%) | 35 (10.4%) |
| 30 to 34 Years | 314 (86.5%) | 16 (5.0%) |
| 35 to 44 Years | 314 (80.3%) | 1 (0.3%) |
| 45 to 54 Years | 431 (96.6%) | 0 (0.0%) |
| 55 to 59 Years | 192 (78.0%) | 9 (4.7%) |
| 60 to 64 Years | 129 (44.8%) | 0 (0.0%) |
| 65 to 74 Years | 191 (38.2%) | 0 (0.0%) |
| 75 Years and over | 29 (6.4%) | 0 (0.0%) |
| Total | 2,206 (63.0%) | 93 (4.2%) |
Employment Status by Educational Attainment in Boyertown borough
According to labor force statistics for Boyertown borough, 81.5% of individuals (1,716) out of the total population between 25 and 64 years of age (2,105) are in the labor force, with 3.5% or 60 of them being unemployed. The group with the highest labor force participation rate are those with the educational attainment of bachelor's degree or higher, with 89.0% or 397 individuals in the labor force. Within the labor force, individuals with college / associate degree education have the highest percentage of unemployment, with 8.4% or 49 of them being unemployed.
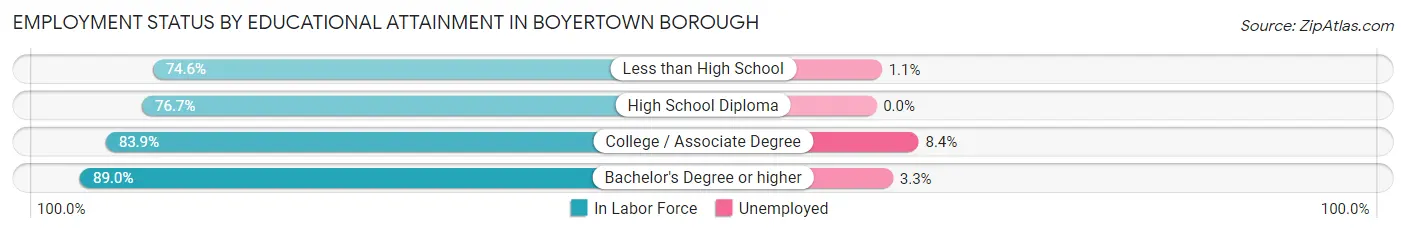
| Educational Attainment | In Labor Force | Unemployed |
| Less than High School | 94 (74.6%) | 1 (1.1%) |
| High School Diploma | 647 (76.7%) | 0 (0.0%) |
| College / Associate Degree | 578 (83.9%) | 58 (8.4%) |
| Bachelor's Degree or higher | 397 (89.0%) | 15 (3.3%) |
| Total | 1,716 (81.5%) | 74 (3.5%) |
Employment Occupations by Sex in Boyertown borough
Management, Business, Science and Arts Occupations
The most common Management, Business, Science and Arts occupations in Boyertown borough are Community & Social Service (131 | 6.4%), Management (110 | 5.3%), Computers, Engineering & Science (100 | 4.9%), Business & Financial (87 | 4.2%), and Education Instruction & Library (83 | 4.0%).
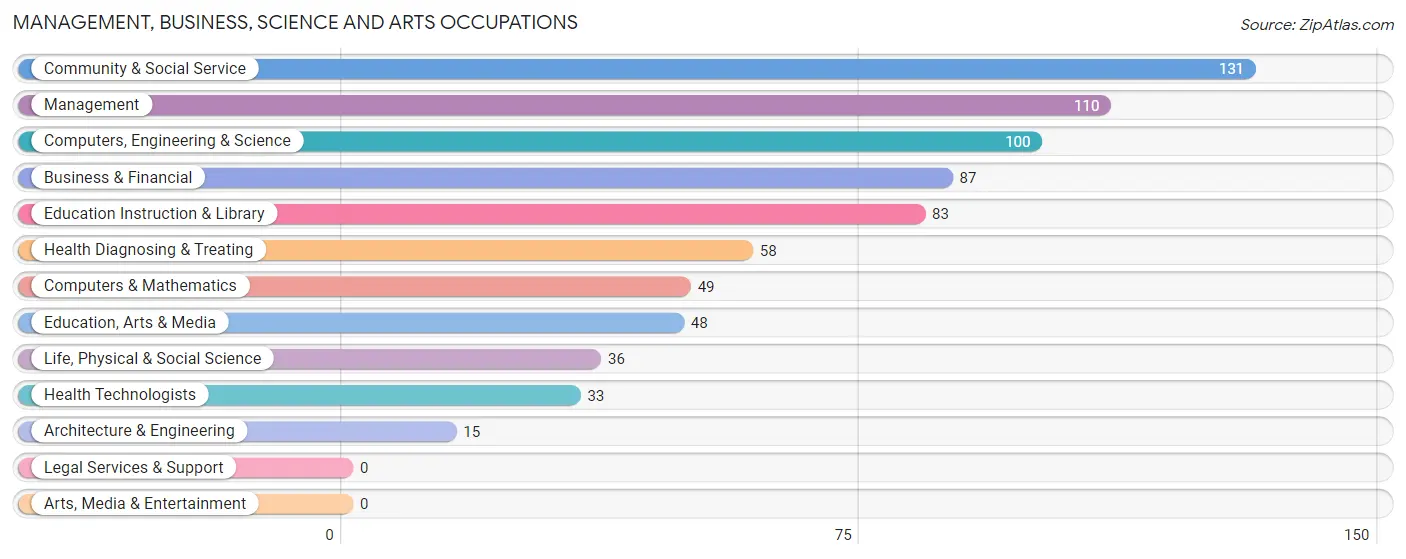
Management, Business, Science and Arts Occupations by Sex
Within the Management, Business, Science and Arts occupations in Boyertown borough, the most male-oriented occupations are Computers & Mathematics (100.0%), Computers, Engineering & Science (67.0%), and Education, Arts & Media (45.8%), while the most female-oriented occupations are Health Diagnosing & Treating (100.0%), Health Technologists (100.0%), and Business & Financial (81.6%).
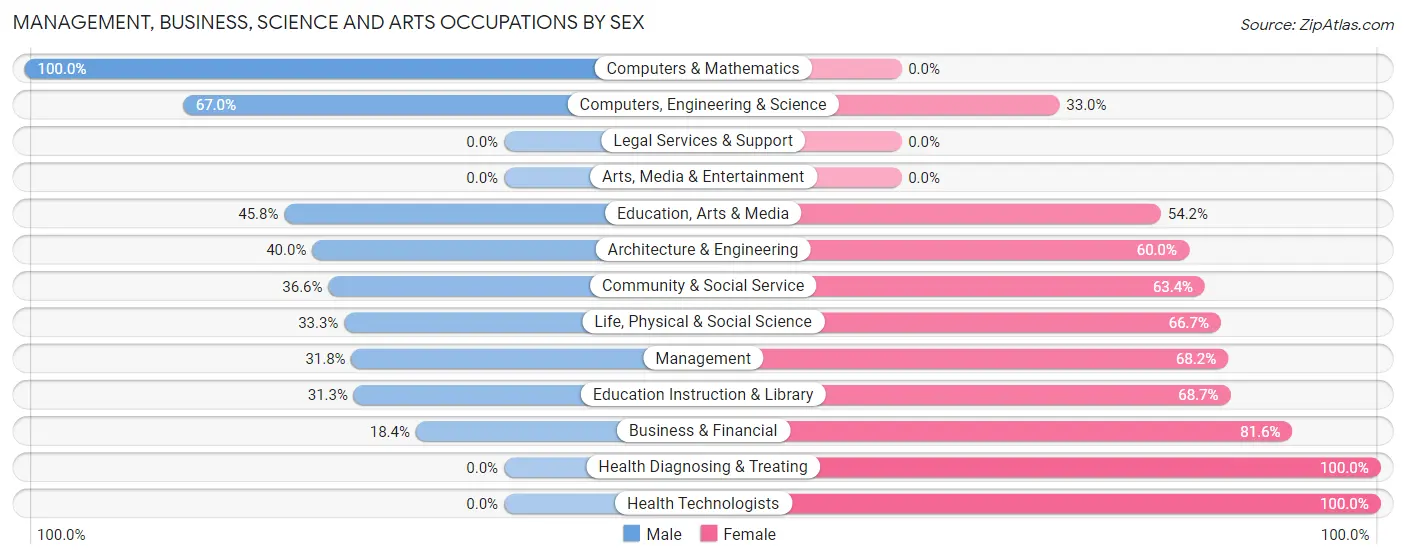
| Occupation | Male | Female |
| Management | 35 (31.8%) | 75 (68.2%) |
| Business & Financial | 16 (18.4%) | 71 (81.6%) |
| Computers, Engineering & Science | 67 (67.0%) | 33 (33.0%) |
| Computers & Mathematics | 49 (100.0%) | 0 (0.0%) |
| Architecture & Engineering | 6 (40.0%) | 9 (60.0%) |
| Life, Physical & Social Science | 12 (33.3%) | 24 (66.7%) |
| Community & Social Service | 48 (36.6%) | 83 (63.4%) |
| Education, Arts & Media | 22 (45.8%) | 26 (54.2%) |
| Legal Services & Support | 0 (0.0%) | 0 (0.0%) |
| Education Instruction & Library | 26 (31.3%) | 57 (68.7%) |
| Arts, Media & Entertainment | 0 (0.0%) | 0 (0.0%) |
| Health Diagnosing & Treating | 0 (0.0%) | 58 (100.0%) |
| Health Technologists | 0 (0.0%) | 33 (100.0%) |
| Total (Category) | 166 (34.2%) | 320 (65.8%) |
| Total (Overall) | 1,111 (53.8%) | 952 (46.2%) |
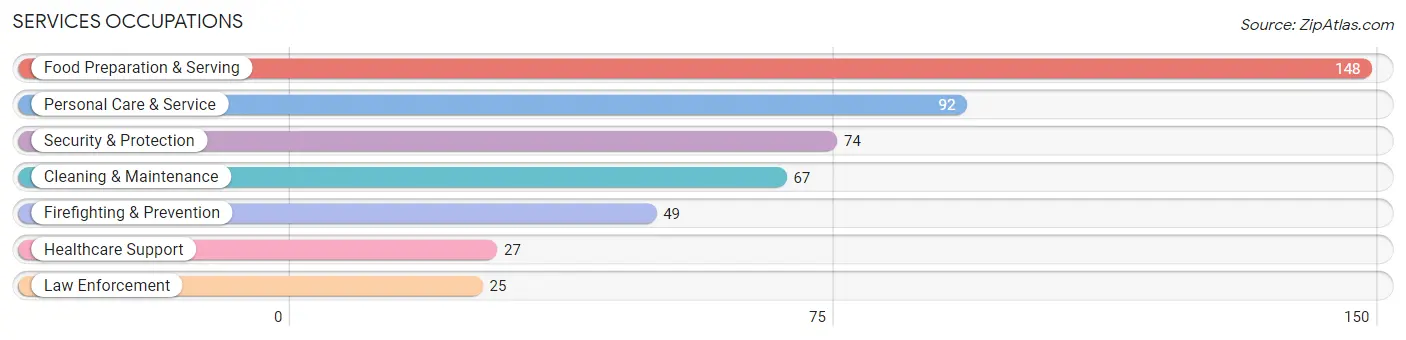
Services Occupations
The most common Services occupations in Boyertown borough are Food Preparation & Serving (148 | 7.2%), Personal Care & Service (92 | 4.5%), Security & Protection (74 | 3.6%), Cleaning & Maintenance (67 | 3.3%), and Firefighting & Prevention (49 | 2.4%).
Services Occupations by Sex
Within the Services occupations in Boyertown borough, the most male-oriented occupations are Security & Protection (100.0%), Firefighting & Prevention (100.0%), and Law Enforcement (100.0%), while the most female-oriented occupations are Healthcare Support (100.0%), Personal Care & Service (100.0%), and Food Preparation & Serving (55.4%).
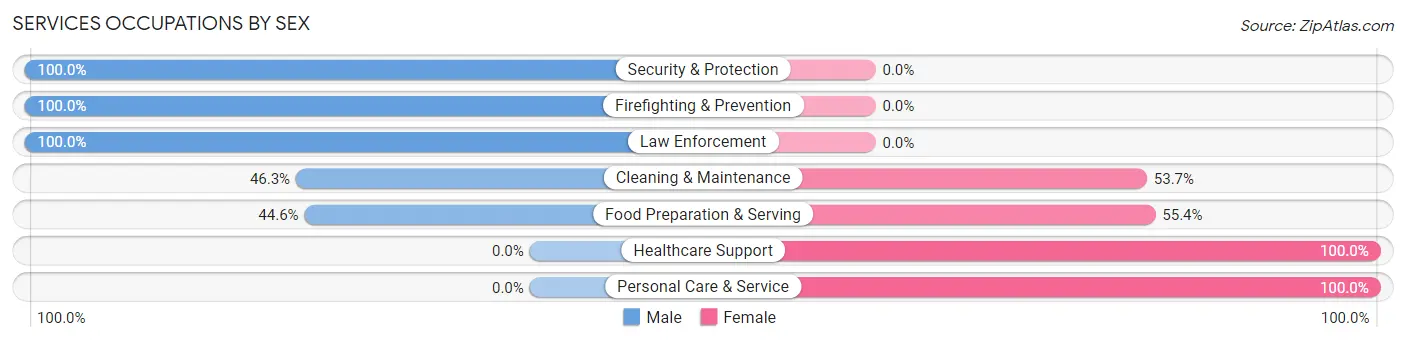
| Occupation | Male | Female |
| Healthcare Support | 0 (0.0%) | 27 (100.0%) |
| Security & Protection | 74 (100.0%) | 0 (0.0%) |
| Firefighting & Prevention | 49 (100.0%) | 0 (0.0%) |
| Law Enforcement | 25 (100.0%) | 0 (0.0%) |
| Food Preparation & Serving | 66 (44.6%) | 82 (55.4%) |
| Cleaning & Maintenance | 31 (46.3%) | 36 (53.7%) |
| Personal Care & Service | 0 (0.0%) | 92 (100.0%) |
| Total (Category) | 171 (41.9%) | 237 (58.1%) |
| Total (Overall) | 1,111 (53.8%) | 952 (46.2%) |
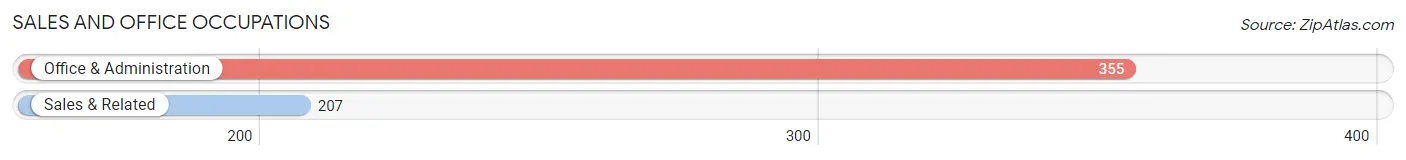
Sales and Office Occupations
The most common Sales and Office occupations in Boyertown borough are Office & Administration (355 | 17.2%), and Sales & Related (207 | 10.0%).
Sales and Office Occupations by Sex
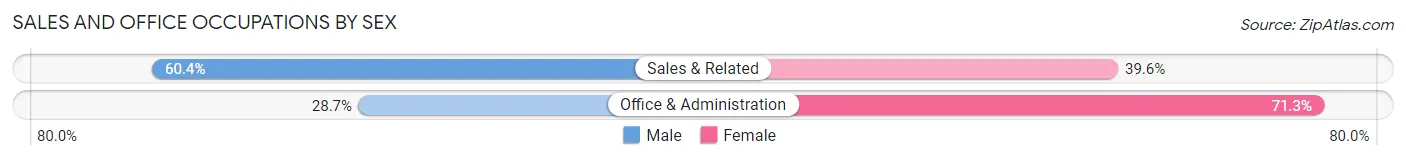
| Occupation | Male | Female |
| Sales & Related | 125 (60.4%) | 82 (39.6%) |
| Office & Administration | 102 (28.7%) | 253 (71.3%) |
| Total (Category) | 227 (40.4%) | 335 (59.6%) |
| Total (Overall) | 1,111 (53.8%) | 952 (46.2%) |
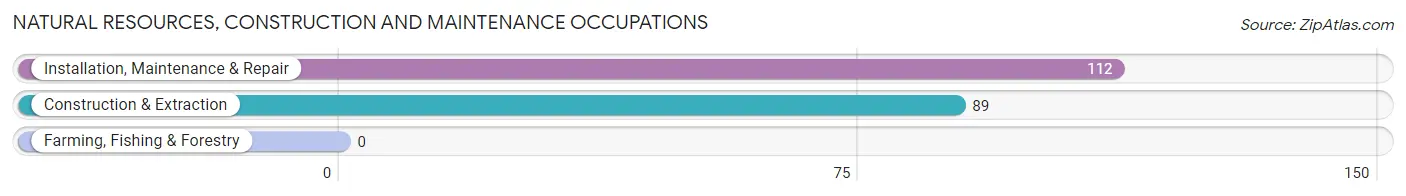
Natural Resources, Construction and Maintenance Occupations
The most common Natural Resources, Construction and Maintenance occupations in Boyertown borough are Installation, Maintenance & Repair (112 | 5.4%), and Construction & Extraction (89 | 4.3%).
Natural Resources, Construction and Maintenance Occupations by Sex
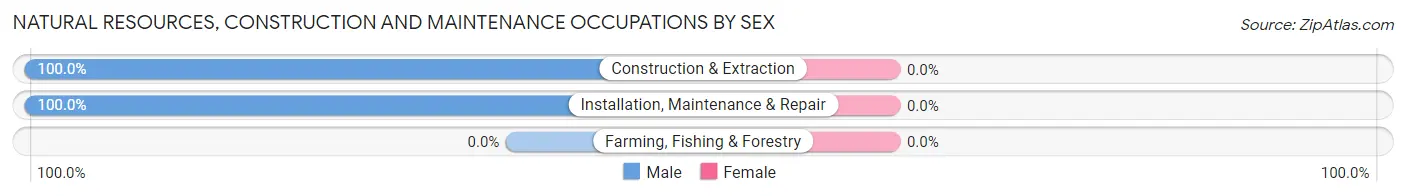
| Occupation | Male | Female |
| Farming, Fishing & Forestry | 0 (0.0%) | 0 (0.0%) |
| Construction & Extraction | 89 (100.0%) | 0 (0.0%) |
| Installation, Maintenance & Repair | 112 (100.0%) | 0 (0.0%) |
| Total (Category) | 201 (100.0%) | 0 (0.0%) |
| Total (Overall) | 1,111 (53.8%) | 952 (46.2%) |
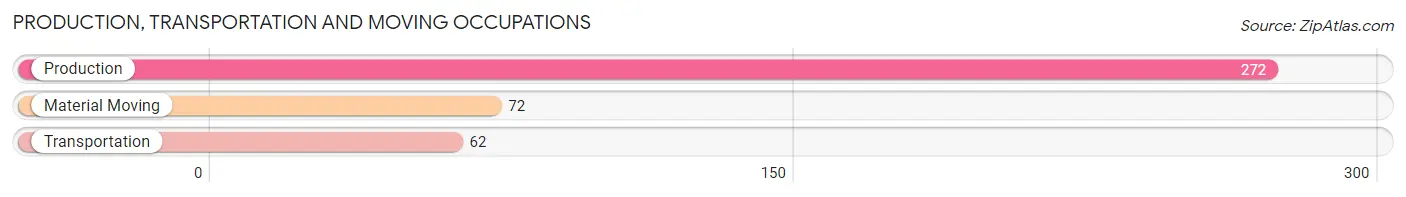
Production, Transportation and Moving Occupations
The most common Production, Transportation and Moving occupations in Boyertown borough are Production (272 | 13.2%), Material Moving (72 | 3.5%), and Transportation (62 | 3.0%).
Production, Transportation and Moving Occupations by Sex
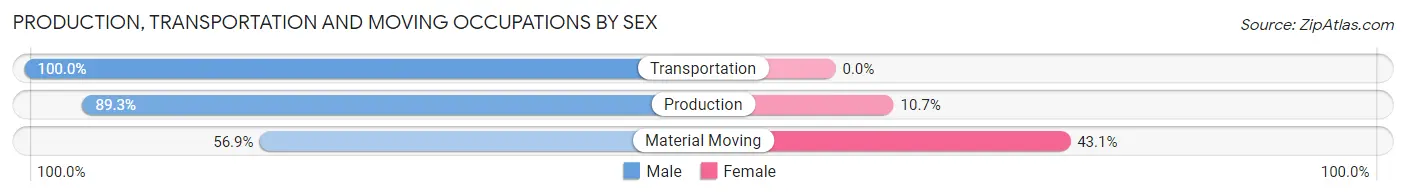
| Occupation | Male | Female |
| Production | 243 (89.3%) | 29 (10.7%) |
| Transportation | 62 (100.0%) | 0 (0.0%) |
| Material Moving | 41 (56.9%) | 31 (43.1%) |
| Total (Category) | 346 (85.2%) | 60 (14.8%) |
| Total (Overall) | 1,111 (53.8%) | 952 (46.2%) |
Employment Industries by Sex in Boyertown borough
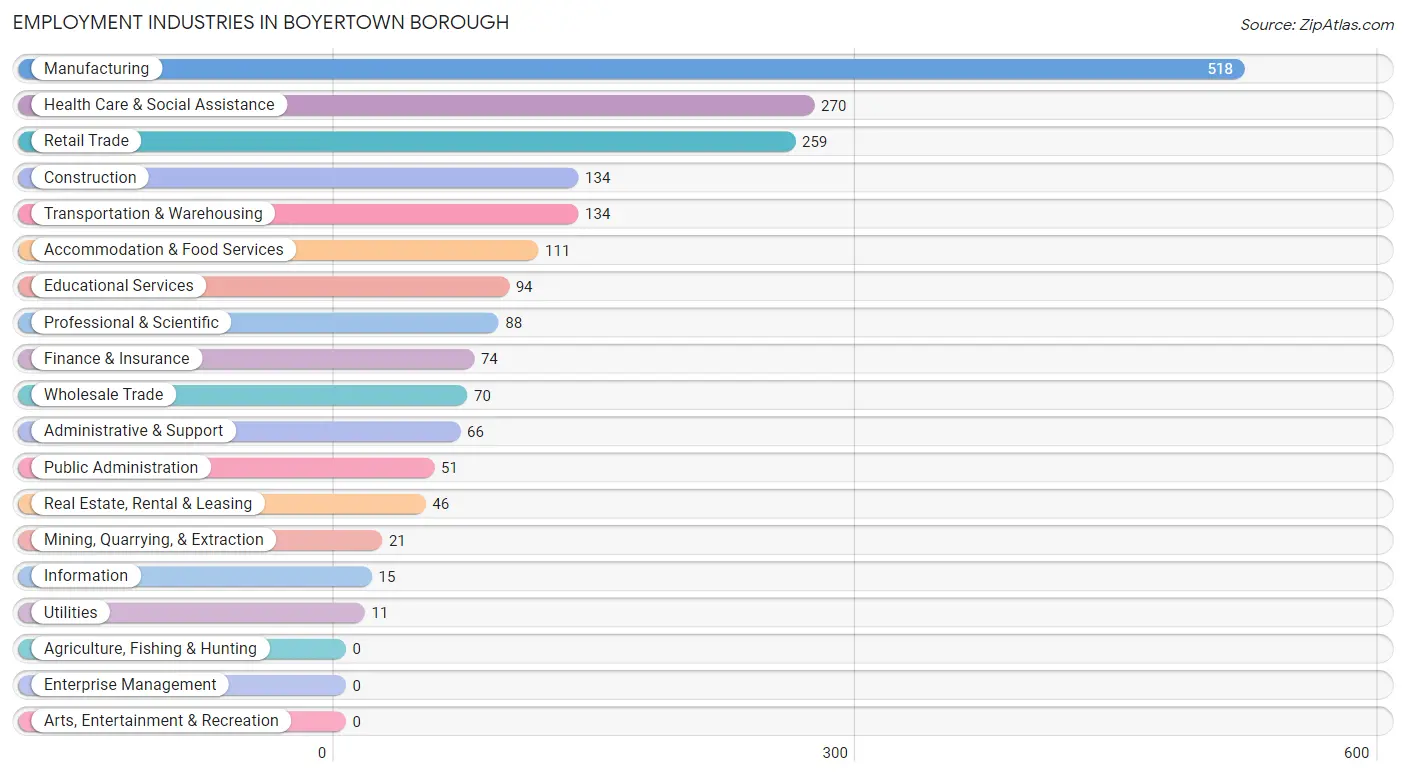
Employment Industries in Boyertown borough
The major employment industries in Boyertown borough include Manufacturing (518 | 25.1%), Health Care & Social Assistance (270 | 13.1%), Retail Trade (259 | 12.6%), Construction (134 | 6.5%), and Transportation & Warehousing (134 | 6.5%).
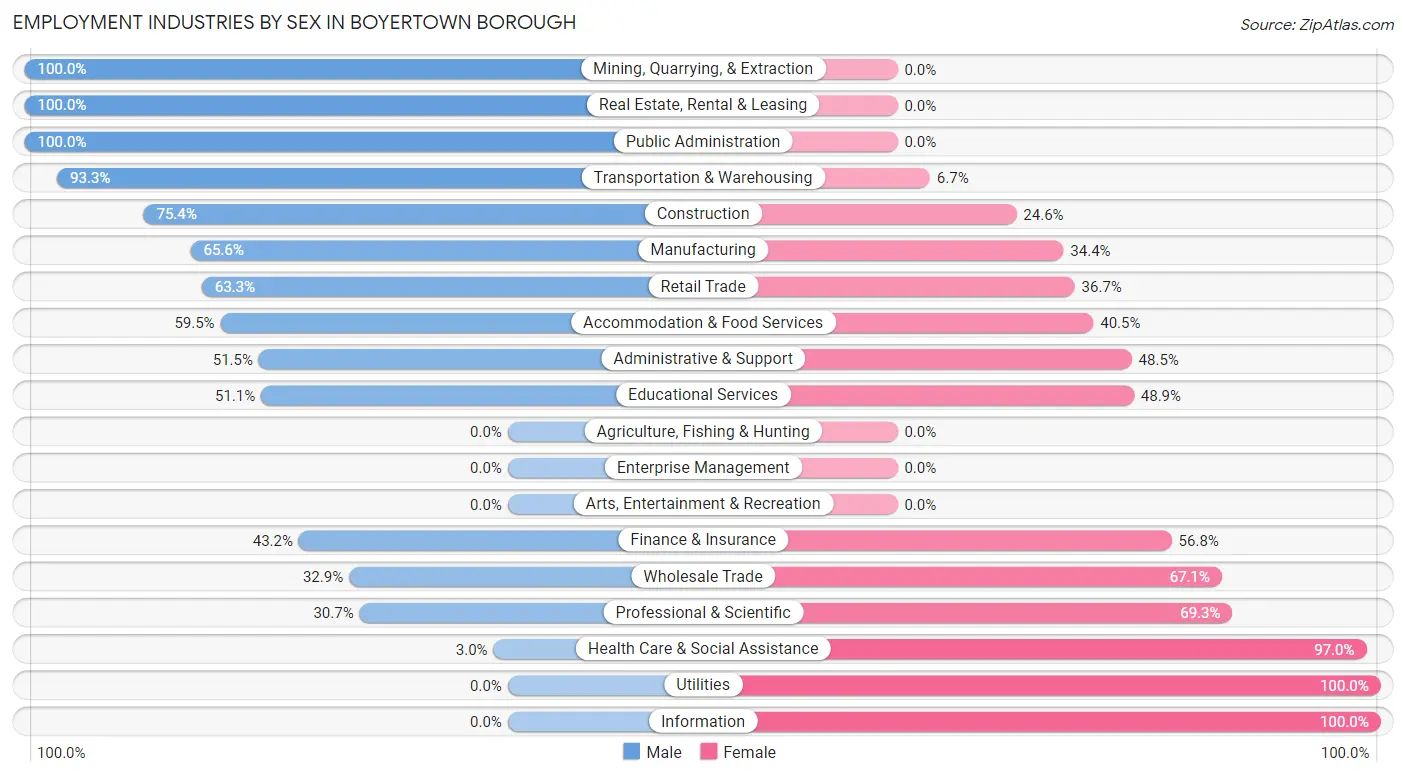
Employment Industries by Sex in Boyertown borough
The Boyertown borough industries that see more men than women are Mining, Quarrying, & Extraction (100.0%), Real Estate, Rental & Leasing (100.0%), and Public Administration (100.0%), whereas the industries that tend to have a higher number of women are Utilities (100.0%), Information (100.0%), and Health Care & Social Assistance (97.0%).
| Industry | Male | Female |
| Agriculture, Fishing & Hunting | 0 (0.0%) | 0 (0.0%) |
| Mining, Quarrying, & Extraction | 21 (100.0%) | 0 (0.0%) |
| Construction | 101 (75.4%) | 33 (24.6%) |
| Manufacturing | 340 (65.6%) | 178 (34.4%) |
| Wholesale Trade | 23 (32.9%) | 47 (67.1%) |
| Retail Trade | 164 (63.3%) | 95 (36.7%) |
| Transportation & Warehousing | 125 (93.3%) | 9 (6.7%) |
| Utilities | 0 (0.0%) | 11 (100.0%) |
| Information | 0 (0.0%) | 15 (100.0%) |
| Finance & Insurance | 32 (43.2%) | 42 (56.8%) |
| Real Estate, Rental & Leasing | 46 (100.0%) | 0 (0.0%) |
| Professional & Scientific | 27 (30.7%) | 61 (69.3%) |
| Enterprise Management | 0 (0.0%) | 0 (0.0%) |
| Administrative & Support | 34 (51.5%) | 32 (48.5%) |
| Educational Services | 48 (51.1%) | 46 (48.9%) |
| Health Care & Social Assistance | 8 (3.0%) | 262 (97.0%) |
| Arts, Entertainment & Recreation | 0 (0.0%) | 0 (0.0%) |
| Accommodation & Food Services | 66 (59.5%) | 45 (40.5%) |
| Public Administration | 51 (100.0%) | 0 (0.0%) |
| Total | 1,111 (53.8%) | 952 (46.2%) |
Education in Boyertown borough
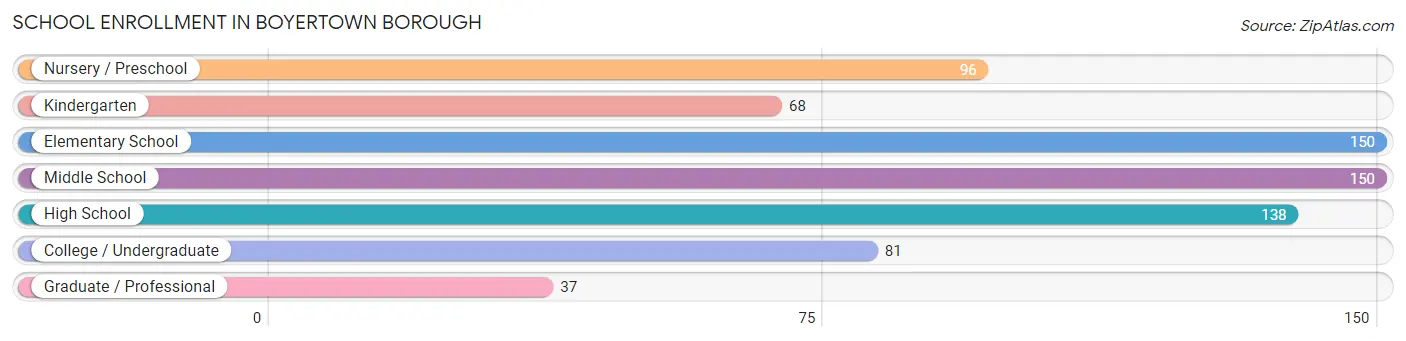
School Enrollment in Boyertown borough
The most common levels of schooling among the 720 students in Boyertown borough are elementary school (150 | 20.8%), middle school (150 | 20.8%), and high school (138 | 19.2%).
| School Level | # Students | % Students |
| Nursery / Preschool | 96 | 13.3% |
| Kindergarten | 68 | 9.4% |
| Elementary School | 150 | 20.8% |
| Middle School | 150 | 20.8% |
| High School | 138 | 19.2% |
| College / Undergraduate | 81 | 11.3% |
| Graduate / Professional | 37 | 5.1% |
| Total | 720 | 100.0% |
School Enrollment by Age by Funding Source in Boyertown borough
Out of a total of 720 students who are enrolled in schools in Boyertown borough, 221 (30.7%) attend a private institution, while the remaining 499 (69.3%) are enrolled in public schools. The age group of 25 to 34 year olds has the highest likelihood of being enrolled in private schools, with 15 (100.0% in the age bracket) enrolled. Conversely, the age group of 18 to 19 year olds has the lowest likelihood of being enrolled in a private school, with 21 (100.0% in the age bracket) attending a public institution.
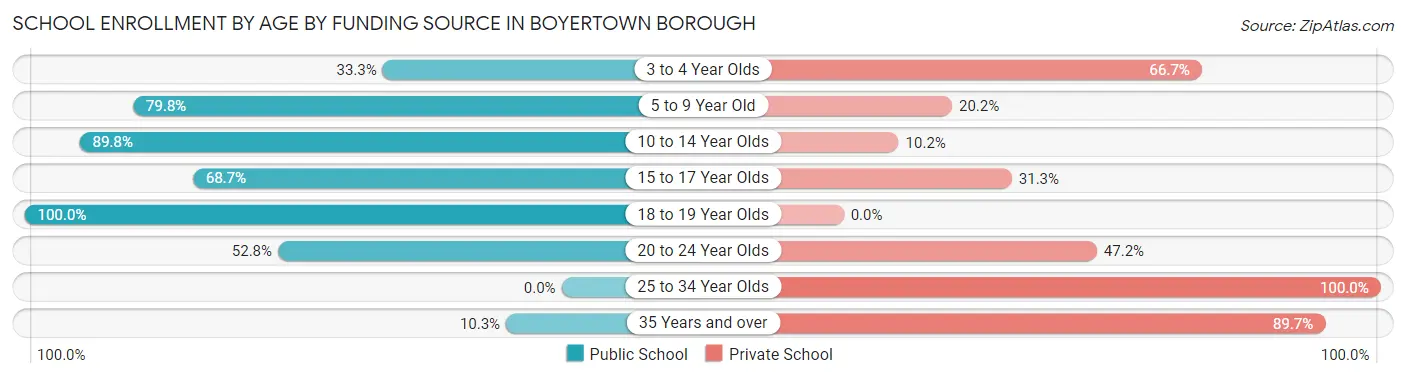
| Age Bracket | Public School | Private School |
| 3 to 4 Year Olds | 32 (33.3%) | 64 (66.7%) |
| 5 to 9 Year Old | 174 (79.8%) | 44 (20.2%) |
| 10 to 14 Year Olds | 184 (89.8%) | 21 (10.2%) |
| 15 to 17 Year Olds | 57 (68.7%) | 26 (31.3%) |
| 18 to 19 Year Olds | 21 (100.0%) | 0 (0.0%) |
| 20 to 24 Year Olds | 28 (52.8%) | 25 (47.2%) |
| 25 to 34 Year Olds | 0 (0.0%) | 15 (100.0%) |
| 35 Years and over | 3 (10.3%) | 26 (89.7%) |
| Total | 499 (69.3%) | 221 (30.7%) |
Educational Attainment by Field of Study in Boyertown borough
Psychology (117 | 20.3%), business (99 | 17.2%), education (92 | 16.0%), arts & humanities (61 | 10.6%), and social sciences (47 | 8.2%) are the most common fields of study among 575 individuals in Boyertown borough who have obtained a bachelor's degree or higher.
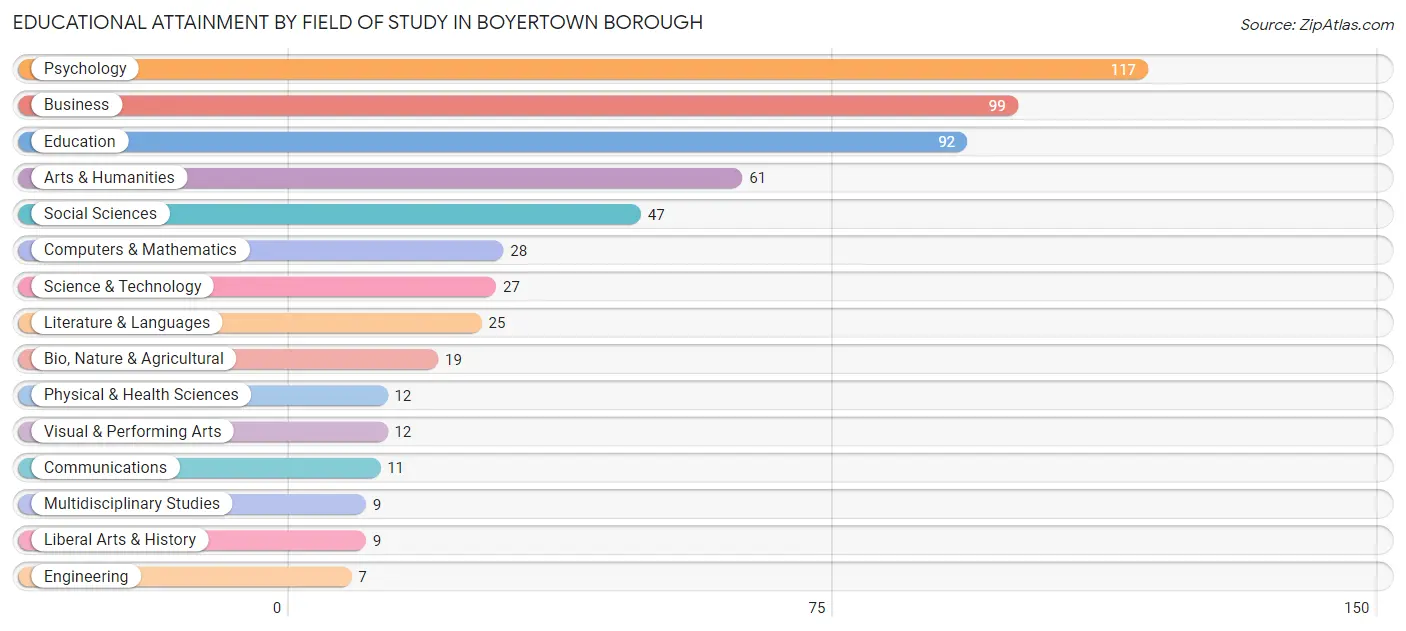
| Field of Study | # Graduates | % Graduates |
| Computers & Mathematics | 28 | 4.9% |
| Bio, Nature & Agricultural | 19 | 3.3% |
| Physical & Health Sciences | 12 | 2.1% |
| Psychology | 117 | 20.3% |
| Social Sciences | 47 | 8.2% |
| Engineering | 7 | 1.2% |
| Multidisciplinary Studies | 9 | 1.6% |
| Science & Technology | 27 | 4.7% |
| Business | 99 | 17.2% |
| Education | 92 | 16.0% |
| Literature & Languages | 25 | 4.3% |
| Liberal Arts & History | 9 | 1.6% |
| Visual & Performing Arts | 12 | 2.1% |
| Communications | 11 | 1.9% |
| Arts & Humanities | 61 | 10.6% |
| Total | 575 | 100.0% |
Transportation & Commute in Boyertown borough
Vehicle Availability by Sex in Boyertown borough
The most prevalent vehicle ownership categories in Boyertown borough are males with 2 vehicles (487, accounting for 41.8%) and females with 2 vehicles (373, making up 52.6%).
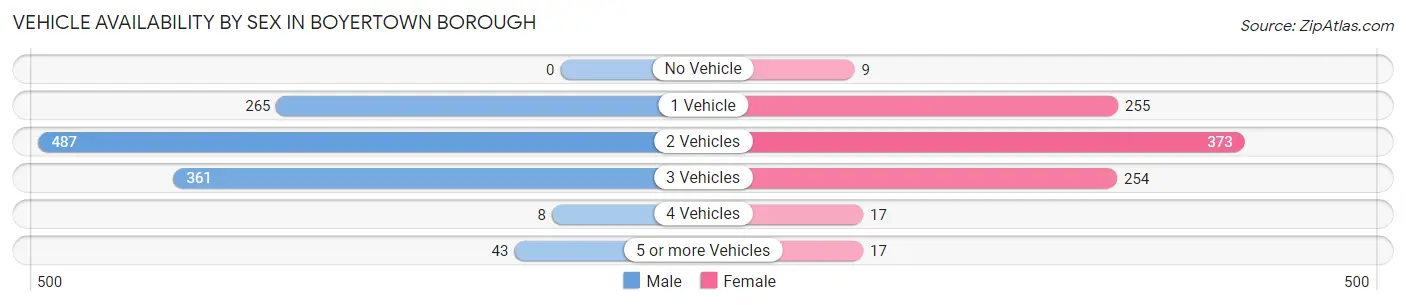
| Vehicles Available | Male | Female |
| No Vehicle | 0 (0.0%) | 9 (1.0%) |
| 1 Vehicle | 265 (22.8%) | 255 (27.6%) |
| 2 Vehicles | 487 (41.8%) | 373 (40.3%) |
| 3 Vehicles | 361 (31.0%) | 254 (27.5%) |
| 4 Vehicles | 8 (0.7%) | 17 (1.8%) |
| 5 or more Vehicles | 43 (3.7%) | 17 (1.8%) |
| Total | 1,164 (100.0%) | 925 (100.0%) |
Commute Time in Boyertown borough
The most frequently occuring commute durations in Boyertown borough are 30 to 34 minutes (362 commuters, 18.8%), 45 to 59 minutes (349 commuters, 18.1%), and 5 to 9 minutes (250 commuters, 13.0%).
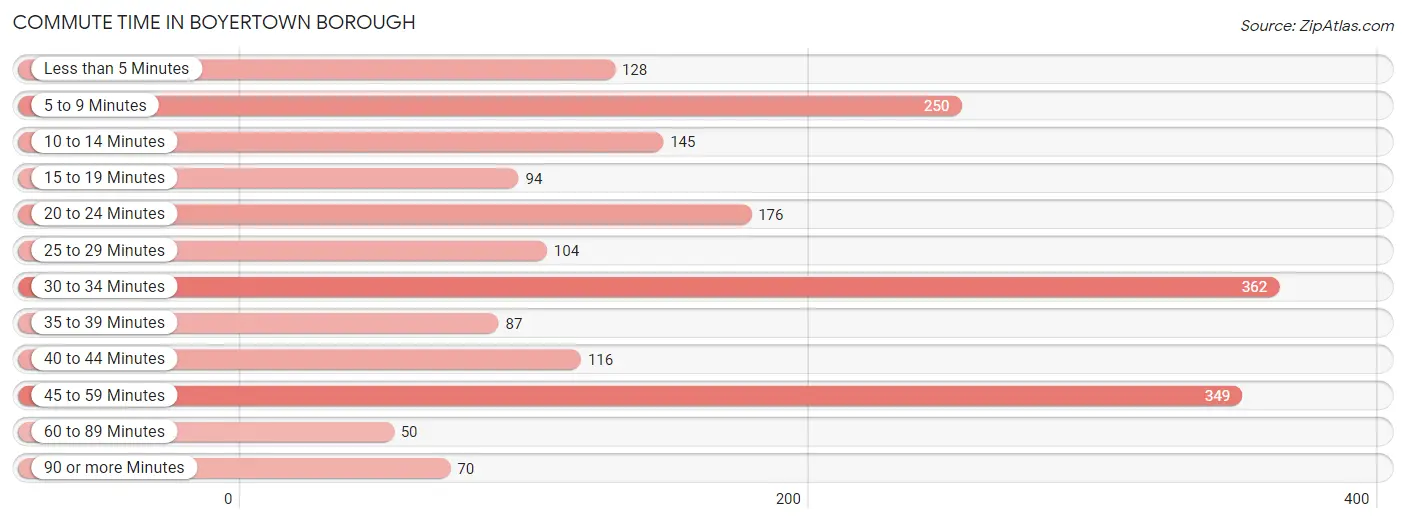
| Commute Time | # Commuters | % Commuters |
| Less than 5 Minutes | 128 | 6.6% |
| 5 to 9 Minutes | 250 | 13.0% |
| 10 to 14 Minutes | 145 | 7.5% |
| 15 to 19 Minutes | 94 | 4.9% |
| 20 to 24 Minutes | 176 | 9.1% |
| 25 to 29 Minutes | 104 | 5.4% |
| 30 to 34 Minutes | 362 | 18.8% |
| 35 to 39 Minutes | 87 | 4.5% |
| 40 to 44 Minutes | 116 | 6.0% |
| 45 to 59 Minutes | 349 | 18.1% |
| 60 to 89 Minutes | 50 | 2.6% |
| 90 or more Minutes | 70 | 3.6% |
Commute Time by Sex in Boyertown borough
The most common commute times in Boyertown borough are 30 to 34 minutes (274 commuters, 25.6%) for males and 45 to 59 minutes (209 commuters, 24.2%) for females.
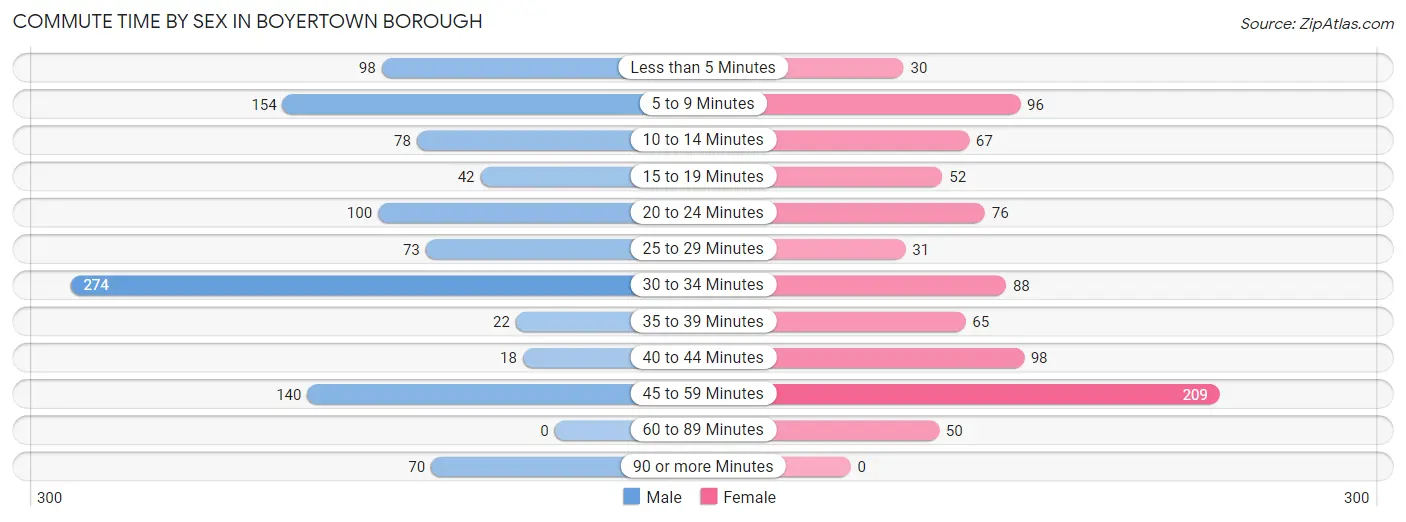
| Commute Time | Male | Female |
| Less than 5 Minutes | 98 (9.2%) | 30 (3.5%) |
| 5 to 9 Minutes | 154 (14.4%) | 96 (11.1%) |
| 10 to 14 Minutes | 78 (7.3%) | 67 (7.8%) |
| 15 to 19 Minutes | 42 (3.9%) | 52 (6.0%) |
| 20 to 24 Minutes | 100 (9.3%) | 76 (8.8%) |
| 25 to 29 Minutes | 73 (6.8%) | 31 (3.6%) |
| 30 to 34 Minutes | 274 (25.6%) | 88 (10.2%) |
| 35 to 39 Minutes | 22 (2.1%) | 65 (7.5%) |
| 40 to 44 Minutes | 18 (1.7%) | 98 (11.4%) |
| 45 to 59 Minutes | 140 (13.1%) | 209 (24.2%) |
| 60 to 89 Minutes | 0 (0.0%) | 50 (5.8%) |
| 90 or more Minutes | 70 (6.6%) | 0 (0.0%) |
Time of Departure to Work by Sex in Boyertown borough
The most frequent times of departure to work in Boyertown borough are 12:00 PM to 3:59 PM (267, 25.0%) for males and 7:30 AM to 7:59 AM (219, 25.4%) for females.
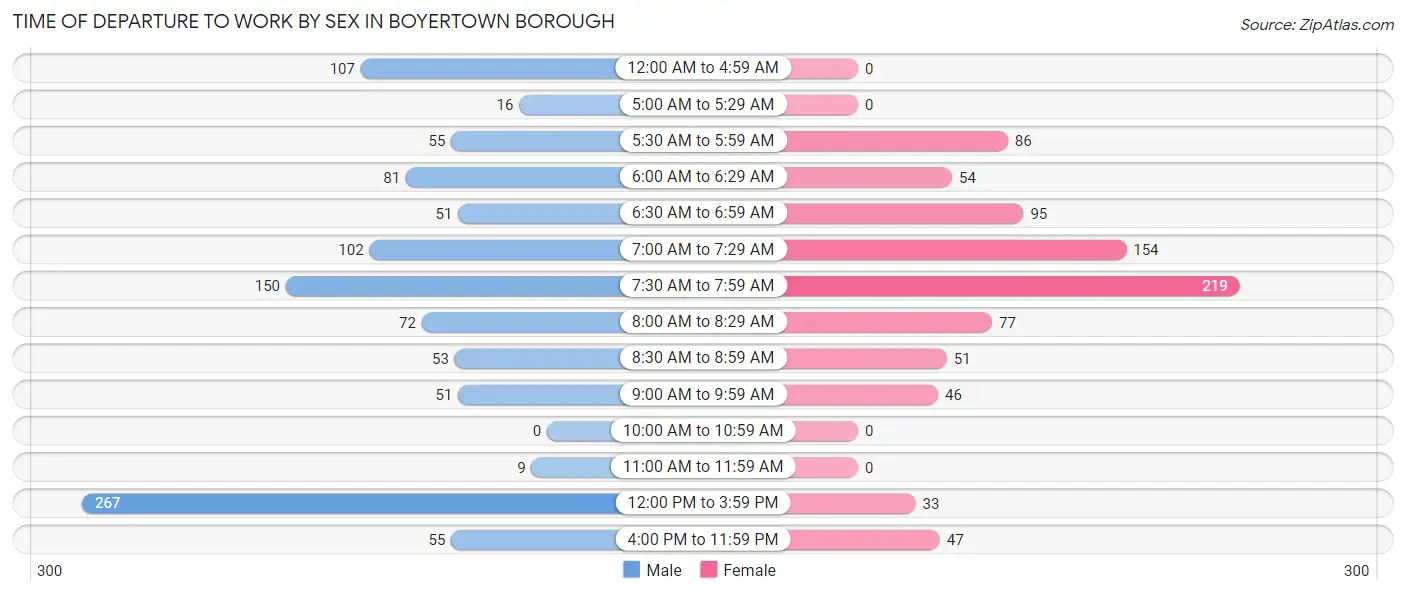
| Time of Departure | Male | Female |
| 12:00 AM to 4:59 AM | 107 (10.0%) | 0 (0.0%) |
| 5:00 AM to 5:29 AM | 16 (1.5%) | 0 (0.0%) |
| 5:30 AM to 5:59 AM | 55 (5.1%) | 86 (10.0%) |
| 6:00 AM to 6:29 AM | 81 (7.6%) | 54 (6.3%) |
| 6:30 AM to 6:59 AM | 51 (4.8%) | 95 (11.0%) |
| 7:00 AM to 7:29 AM | 102 (9.5%) | 154 (17.9%) |
| 7:30 AM to 7:59 AM | 150 (14.0%) | 219 (25.4%) |
| 8:00 AM to 8:29 AM | 72 (6.7%) | 77 (8.9%) |
| 8:30 AM to 8:59 AM | 53 (5.0%) | 51 (5.9%) |
| 9:00 AM to 9:59 AM | 51 (4.8%) | 46 (5.3%) |
| 10:00 AM to 10:59 AM | 0 (0.0%) | 0 (0.0%) |
| 11:00 AM to 11:59 AM | 9 (0.8%) | 0 (0.0%) |
| 12:00 PM to 3:59 PM | 267 (25.0%) | 33 (3.8%) |
| 4:00 PM to 11:59 PM | 55 (5.1%) | 47 (5.4%) |
| Total | 1,069 (100.0%) | 862 (100.0%) |
Housing Occupancy in Boyertown borough
Occupancy by Ownership in Boyertown borough
Of the total 2,062 dwellings in Boyertown borough, owner-occupied units account for 854 (41.4%), while renter-occupied units make up 1,208 (58.6%).
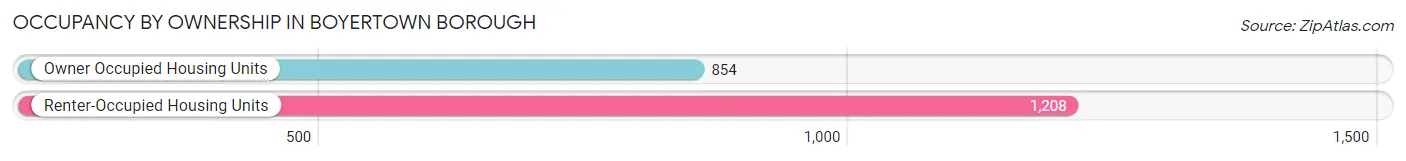
| Occupancy | # Housing Units | % Housing Units |
| Owner Occupied Housing Units | 854 | 41.4% |
| Renter-Occupied Housing Units | 1,208 | 58.6% |
| Total Occupied Housing Units | 2,062 | 100.0% |
Occupancy by Household Size in Boyertown borough
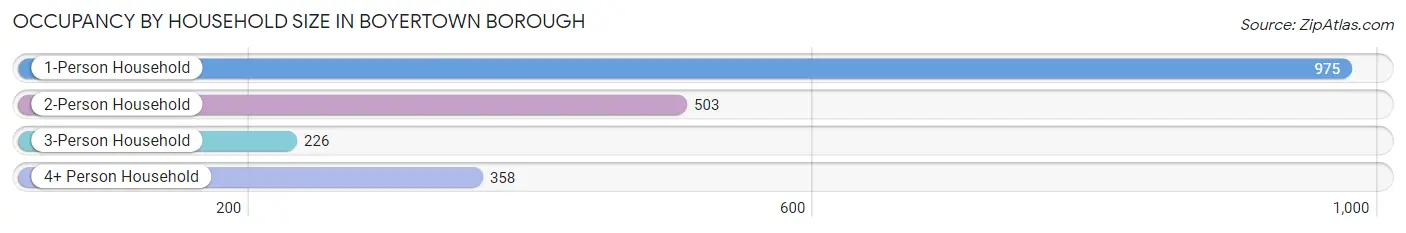
| Household Size | # Housing Units | % Housing Units |
| 1-Person Household | 975 | 47.3% |
| 2-Person Household | 503 | 24.4% |
| 3-Person Household | 226 | 11.0% |
| 4+ Person Household | 358 | 17.4% |
| Total Housing Units | 2,062 | 100.0% |
Occupancy by Ownership by Household Size in Boyertown borough
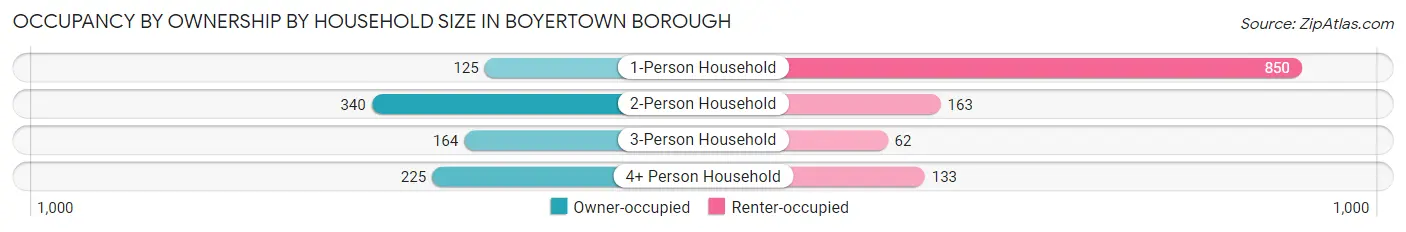
| Household Size | Owner-occupied | Renter-occupied |
| 1-Person Household | 125 (12.8%) | 850 (87.2%) |
| 2-Person Household | 340 (67.6%) | 163 (32.4%) |
| 3-Person Household | 164 (72.6%) | 62 (27.4%) |
| 4+ Person Household | 225 (62.8%) | 133 (37.1%) |
| Total Housing Units | 854 (41.4%) | 1,208 (58.6%) |
Occupancy by Educational Attainment in Boyertown borough
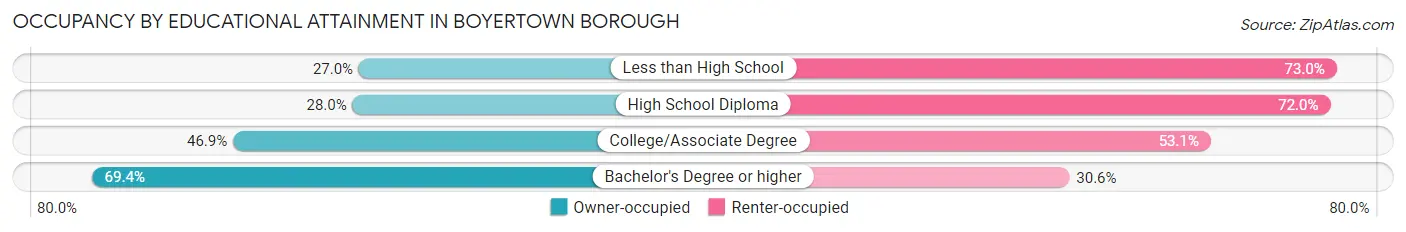
| Household Size | Owner-occupied | Renter-occupied |
| Less than High School | 41 (27.0%) | 111 (73.0%) |
| High School Diploma | 242 (28.0%) | 623 (72.0%) |
| College/Associate Degree | 322 (46.9%) | 364 (53.1%) |
| Bachelor's Degree or higher | 249 (69.4%) | 110 (30.6%) |
Occupancy by Age of Householder in Boyertown borough
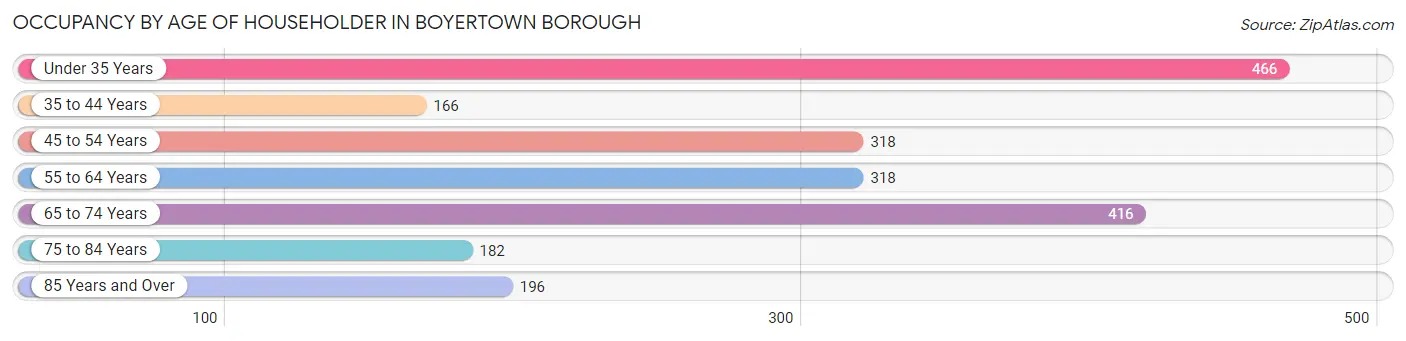
| Age Bracket | # Households | % Households |
| Under 35 Years | 466 | 22.6% |
| 35 to 44 Years | 166 | 8.1% |
| 45 to 54 Years | 318 | 15.4% |
| 55 to 64 Years | 318 | 15.4% |
| 65 to 74 Years | 416 | 20.2% |
| 75 to 84 Years | 182 | 8.8% |
| 85 Years and Over | 196 | 9.5% |
| Total | 2,062 | 100.0% |
Housing Finances in Boyertown borough
Median Income by Occupancy in Boyertown borough
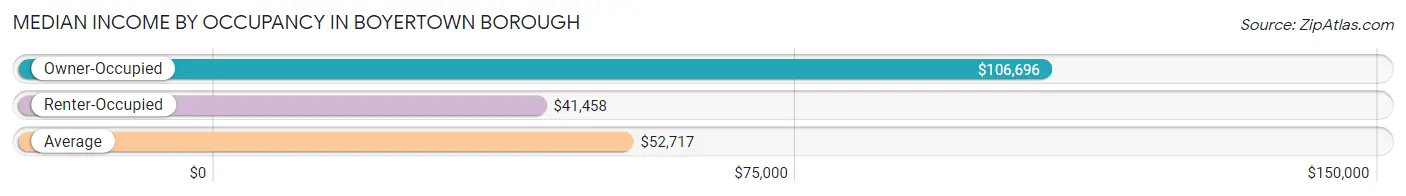
| Occupancy Type | # Households | Median Income |
| Owner-Occupied | 854 (41.4%) | $106,696 |
| Renter-Occupied | 1,208 (58.6%) | $41,458 |
| Average | 2,062 (100.0%) | $52,717 |
Occupancy by Householder Income Bracket in Boyertown borough
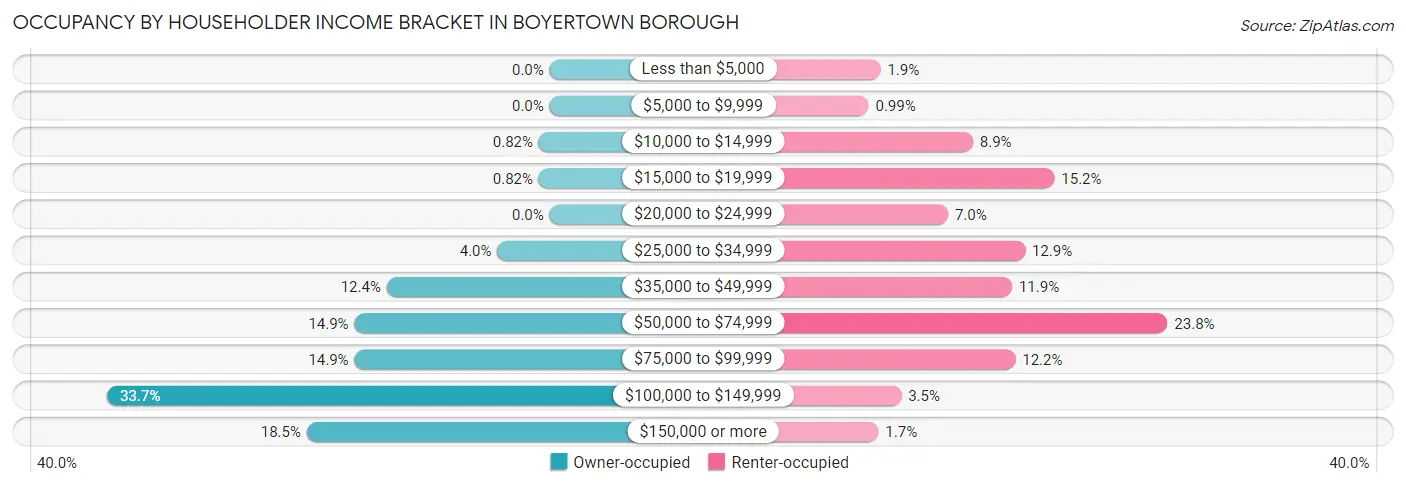
| Income Bracket | Owner-occupied | Renter-occupied |
| Less than $5,000 | 0 (0.0%) | 23 (1.9%) |
| $5,000 to $9,999 | 0 (0.0%) | 12 (1.0%) |
| $10,000 to $14,999 | 7 (0.8%) | 108 (8.9%) |
| $15,000 to $19,999 | 7 (0.8%) | 183 (15.1%) |
| $20,000 to $24,999 | 0 (0.0%) | 85 (7.0%) |
| $25,000 to $34,999 | 34 (4.0%) | 156 (12.9%) |
| $35,000 to $49,999 | 106 (12.4%) | 144 (11.9%) |
| $50,000 to $74,999 | 127 (14.9%) | 287 (23.8%) |
| $75,000 to $99,999 | 127 (14.9%) | 147 (12.2%) |
| $100,000 to $149,999 | 288 (33.7%) | 42 (3.5%) |
| $150,000 or more | 158 (18.5%) | 21 (1.7%) |
| Total | 854 (100.0%) | 1,208 (100.0%) |
Monthly Housing Cost Tiers in Boyertown borough
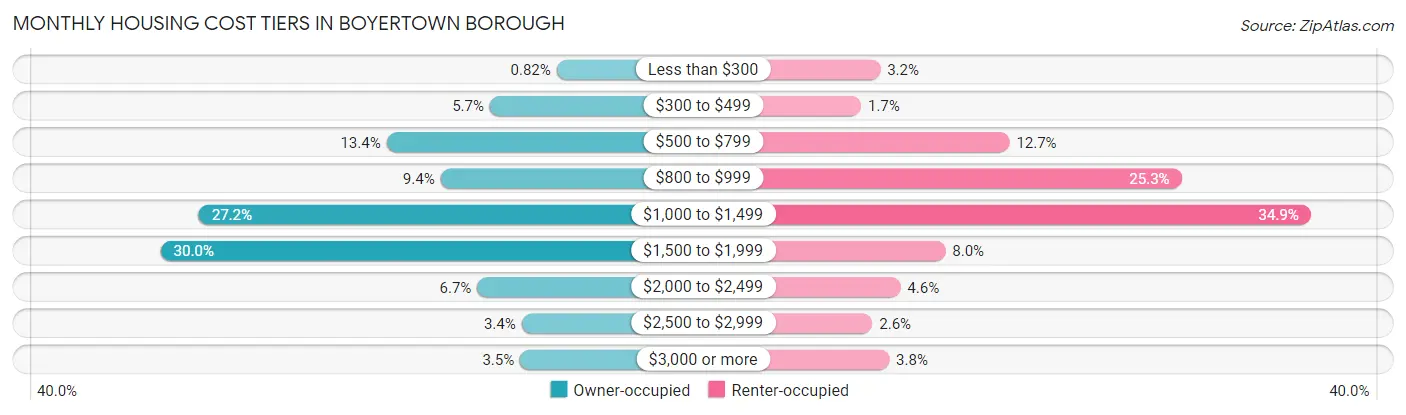
| Monthly Cost | Owner-occupied | Renter-occupied |
| Less than $300 | 7 (0.8%) | 38 (3.2%) |
| $300 to $499 | 49 (5.7%) | 21 (1.7%) |
| $500 to $799 | 114 (13.4%) | 153 (12.7%) |
| $800 to $999 | 80 (9.4%) | 306 (25.3%) |
| $1,000 to $1,499 | 232 (27.2%) | 421 (34.8%) |
| $1,500 to $1,999 | 256 (30.0%) | 96 (8.0%) |
| $2,000 to $2,499 | 57 (6.7%) | 56 (4.6%) |
| $2,500 to $2,999 | 29 (3.4%) | 31 (2.6%) |
| $3,000 or more | 30 (3.5%) | 46 (3.8%) |
| Total | 854 (100.0%) | 1,208 (100.0%) |
Physical Housing Characteristics in Boyertown borough
Housing Structures in Boyertown borough
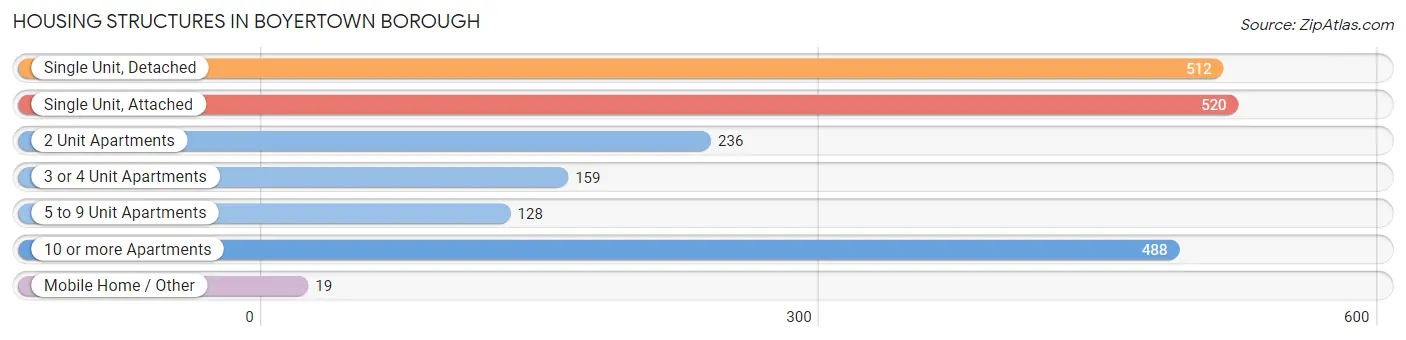
| Structure Type | # Housing Units | % Housing Units |
| Single Unit, Detached | 512 | 24.8% |
| Single Unit, Attached | 520 | 25.2% |
| 2 Unit Apartments | 236 | 11.5% |
| 3 or 4 Unit Apartments | 159 | 7.7% |
| 5 to 9 Unit Apartments | 128 | 6.2% |
| 10 or more Apartments | 488 | 23.7% |
| Mobile Home / Other | 19 | 0.9% |
| Total | 2,062 | 100.0% |
Housing Structures by Occupancy in Boyertown borough
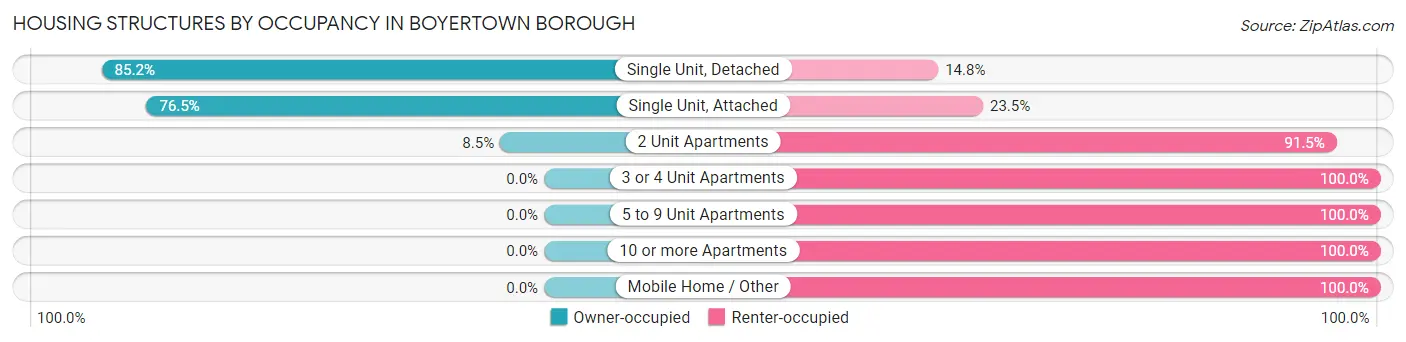
| Structure Type | Owner-occupied | Renter-occupied |
| Single Unit, Detached | 436 (85.2%) | 76 (14.8%) |
| Single Unit, Attached | 398 (76.5%) | 122 (23.5%) |
| 2 Unit Apartments | 20 (8.5%) | 216 (91.5%) |
| 3 or 4 Unit Apartments | 0 (0.0%) | 159 (100.0%) |
| 5 to 9 Unit Apartments | 0 (0.0%) | 128 (100.0%) |
| 10 or more Apartments | 0 (0.0%) | 488 (100.0%) |
| Mobile Home / Other | 0 (0.0%) | 19 (100.0%) |
| Total | 854 (41.4%) | 1,208 (58.6%) |
Housing Structures by Number of Rooms in Boyertown borough
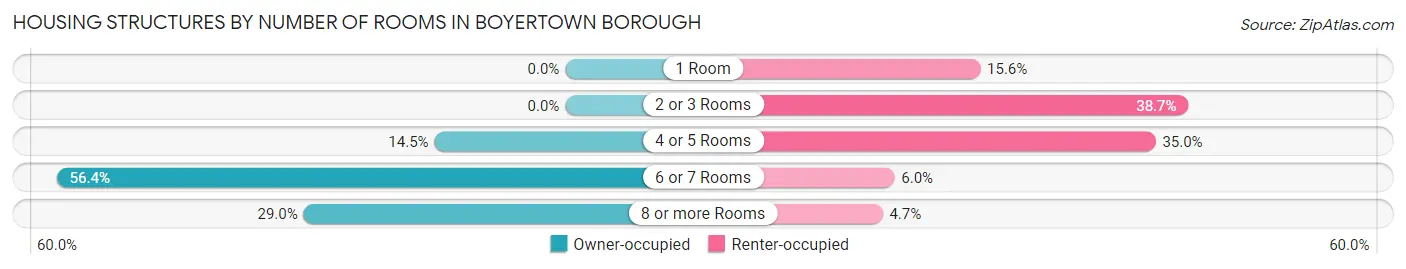
| Number of Rooms | Owner-occupied | Renter-occupied |
| 1 Room | 0 (0.0%) | 188 (15.6%) |
| 2 or 3 Rooms | 0 (0.0%) | 467 (38.7%) |
| 4 or 5 Rooms | 124 (14.5%) | 423 (35.0%) |
| 6 or 7 Rooms | 482 (56.4%) | 73 (6.0%) |
| 8 or more Rooms | 248 (29.0%) | 57 (4.7%) |
| Total | 854 (100.0%) | 1,208 (100.0%) |
Housing Structure by Heating Type in Boyertown borough
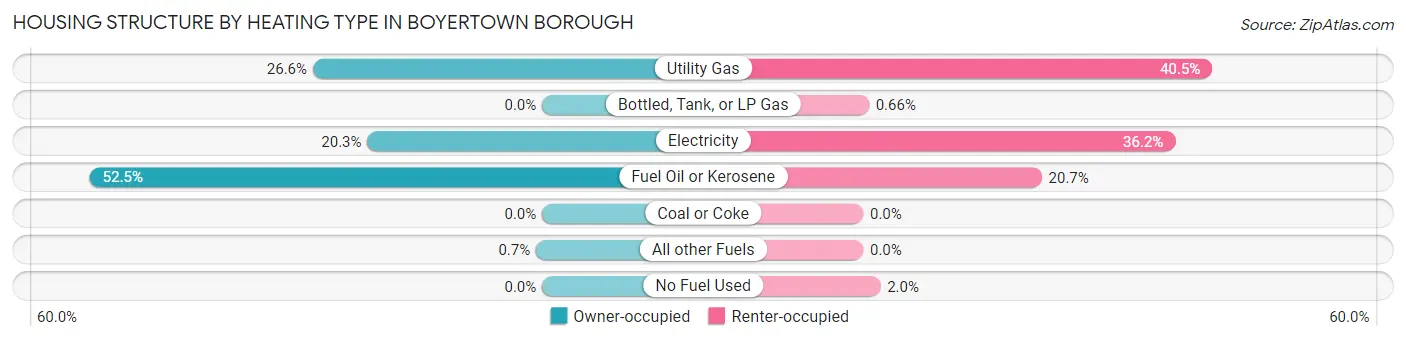
| Heating Type | Owner-occupied | Renter-occupied |
| Utility Gas | 227 (26.6%) | 489 (40.5%) |
| Bottled, Tank, or LP Gas | 0 (0.0%) | 8 (0.7%) |
| Electricity | 173 (20.3%) | 437 (36.2%) |
| Fuel Oil or Kerosene | 448 (52.5%) | 250 (20.7%) |
| Coal or Coke | 0 (0.0%) | 0 (0.0%) |
| All other Fuels | 6 (0.7%) | 0 (0.0%) |
| No Fuel Used | 0 (0.0%) | 24 (2.0%) |
| Total | 854 (100.0%) | 1,208 (100.0%) |
Household Vehicle Usage in Boyertown borough
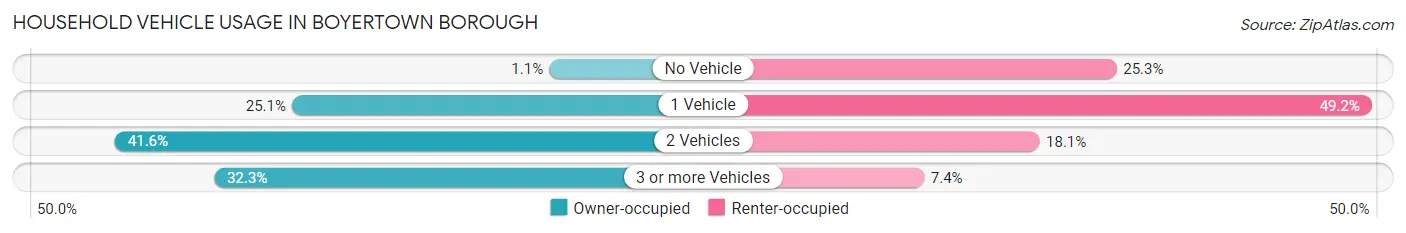
| Vehicles per Household | Owner-occupied | Renter-occupied |
| No Vehicle | 9 (1.1%) | 306 (25.3%) |
| 1 Vehicle | 214 (25.1%) | 594 (49.2%) |
| 2 Vehicles | 355 (41.6%) | 219 (18.1%) |
| 3 or more Vehicles | 276 (32.3%) | 89 (7.4%) |
| Total | 854 (100.0%) | 1,208 (100.0%) |
Real Estate & Mortgages in Boyertown borough
Real Estate and Mortgage Overview in Boyertown borough
| Characteristic | Without Mortgage | With Mortgage |
| Housing Units | 200 | 654 |
| Median Property Value | $208,500 | $183,800 |
| Median Household Income | $50,625 | $128 |
| Monthly Housing Costs | $561 | $30 |
| Real Estate Taxes | $3,656 | $0 |
Property Value by Mortgage Status in Boyertown borough
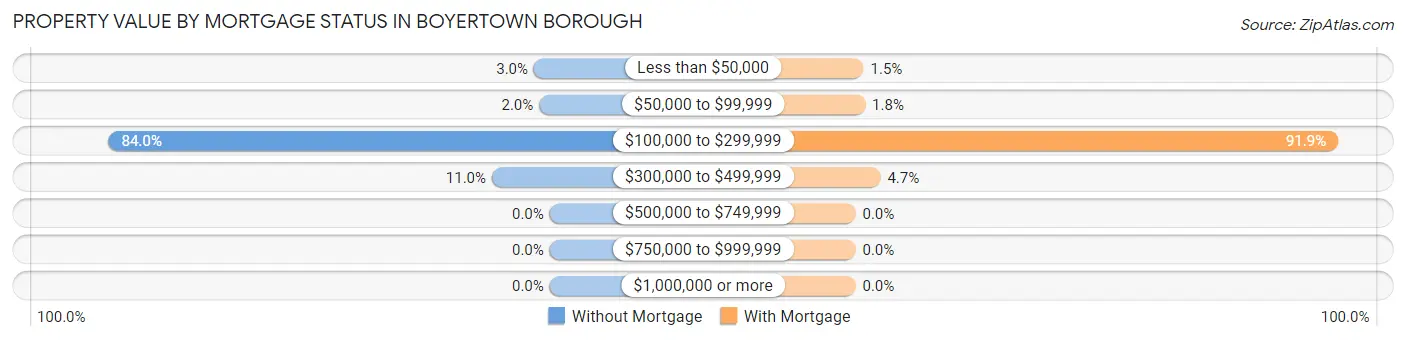
| Property Value | Without Mortgage | With Mortgage |
| Less than $50,000 | 6 (3.0%) | 10 (1.5%) |
| $50,000 to $99,999 | 4 (2.0%) | 12 (1.8%) |
| $100,000 to $299,999 | 168 (84.0%) | 601 (91.9%) |
| $300,000 to $499,999 | 22 (11.0%) | 31 (4.7%) |
| $500,000 to $749,999 | 0 (0.0%) | 0 (0.0%) |
| $750,000 to $999,999 | 0 (0.0%) | 0 (0.0%) |
| $1,000,000 or more | 0 (0.0%) | 0 (0.0%) |
| Total | 200 (100.0%) | 654 (100.0%) |
Household Income by Mortgage Status in Boyertown borough
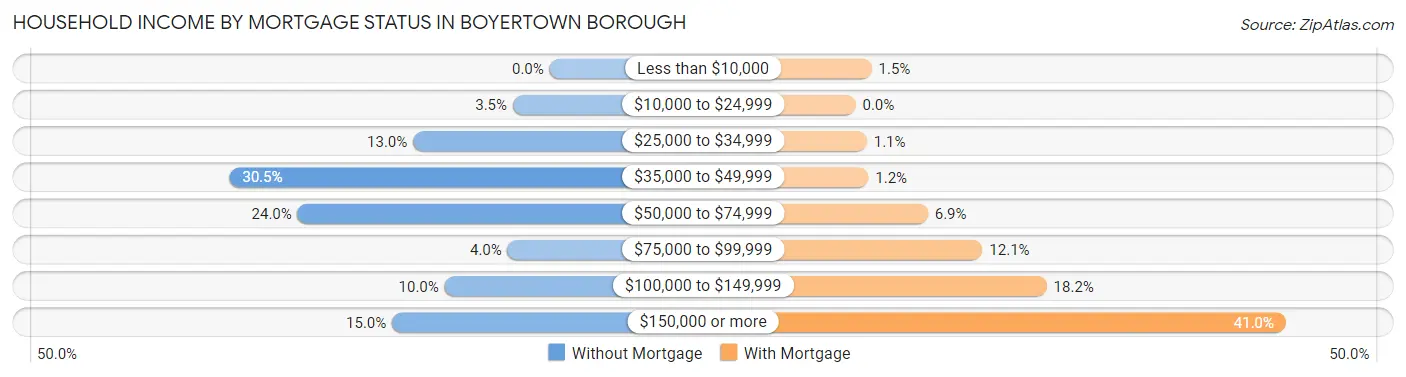
| Household Income | Without Mortgage | With Mortgage |
| Less than $10,000 | 0 (0.0%) | 10 (1.5%) |
| $10,000 to $24,999 | 7 (3.5%) | 0 (0.0%) |
| $25,000 to $34,999 | 26 (13.0%) | 7 (1.1%) |
| $35,000 to $49,999 | 61 (30.5%) | 8 (1.2%) |
| $50,000 to $74,999 | 48 (24.0%) | 45 (6.9%) |
| $75,000 to $99,999 | 8 (4.0%) | 79 (12.1%) |
| $100,000 to $149,999 | 20 (10.0%) | 119 (18.2%) |
| $150,000 or more | 30 (15.0%) | 268 (41.0%) |
| Total | 200 (100.0%) | 654 (100.0%) |
Property Value to Household Income Ratio in Boyertown borough
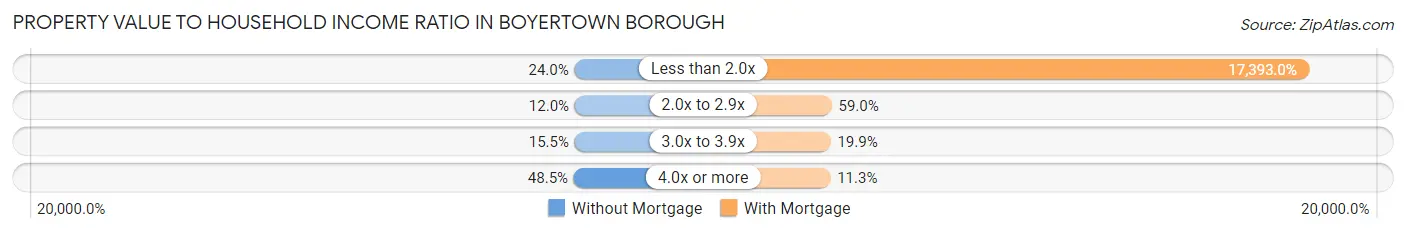
| Value-to-Income Ratio | Without Mortgage | With Mortgage |
| Less than 2.0x | 48 (24.0%) | 113,750 (17,393.0%) |
| 2.0x to 2.9x | 24 (12.0%) | 386 (59.0%) |
| 3.0x to 3.9x | 31 (15.5%) | 130 (19.9%) |
| 4.0x or more | 97 (48.5%) | 74 (11.3%) |
| Total | 200 (100.0%) | 654 (100.0%) |
Real Estate Taxes by Mortgage Status in Boyertown borough
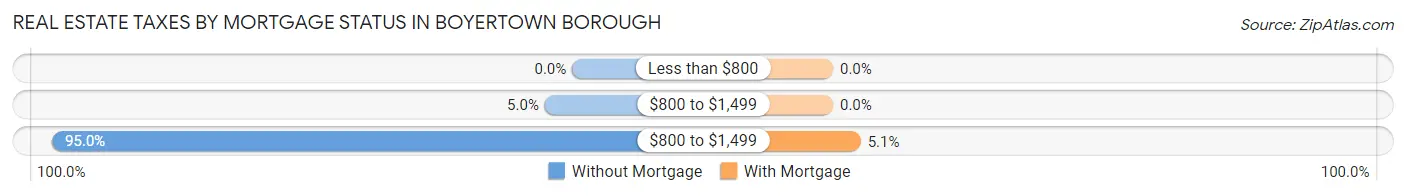
| Property Taxes | Without Mortgage | With Mortgage |
| Less than $800 | 0 (0.0%) | 0 (0.0%) |
| $800 to $1,499 | 10 (5.0%) | 0 (0.0%) |
| $800 to $1,499 | 190 (95.0%) | 33 (5.1%) |
| Total | 200 (100.0%) | 654 (100.0%) |
Health & Disability in Boyertown borough
Health Insurance Coverage by Age in Boyertown borough
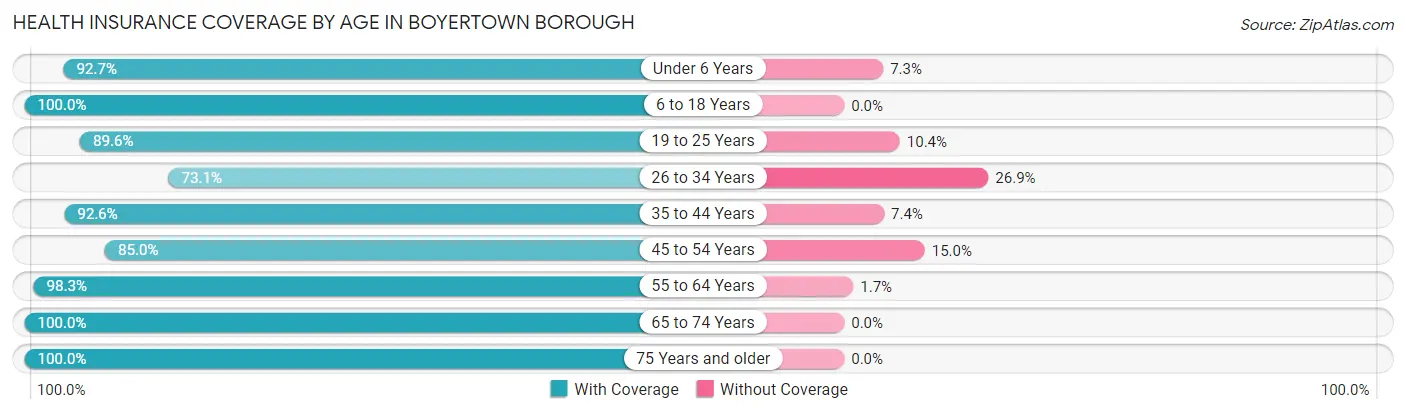
| Age Bracket | With Coverage | Without Coverage |
| Under 6 Years | 294 (92.7%) | 23 (7.3%) |
| 6 to 18 Years | 503 (100.0%) | 0 (0.0%) |
| 19 to 25 Years | 398 (89.6%) | 46 (10.4%) |
| 26 to 34 Years | 441 (73.1%) | 162 (26.9%) |
| 35 to 44 Years | 362 (92.6%) | 29 (7.4%) |
| 45 to 54 Years | 379 (85.0%) | 67 (15.0%) |
| 55 to 64 Years | 525 (98.3%) | 9 (1.7%) |
| 65 to 74 Years | 500 (100.0%) | 0 (0.0%) |
| 75 Years and older | 453 (100.0%) | 0 (0.0%) |
| Total | 3,855 (92.0%) | 336 (8.0%) |
Health Insurance Coverage by Citizenship Status in Boyertown borough
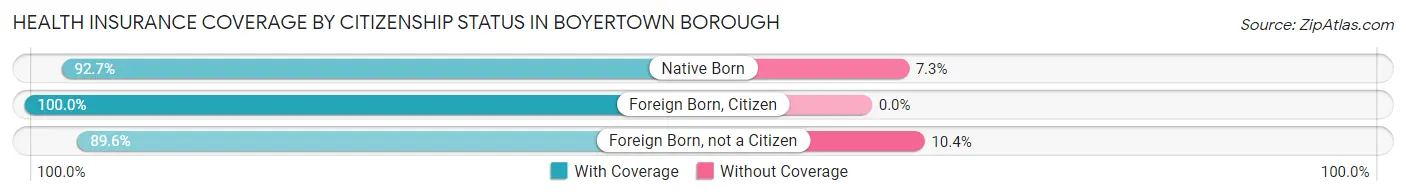
| Citizenship Status | With Coverage | Without Coverage |
| Native Born | 294 (92.7%) | 23 (7.3%) |
| Foreign Born, Citizen | 503 (100.0%) | 0 (0.0%) |
| Foreign Born, not a Citizen | 398 (89.6%) | 46 (10.4%) |
Health Insurance Coverage by Household Income in Boyertown borough
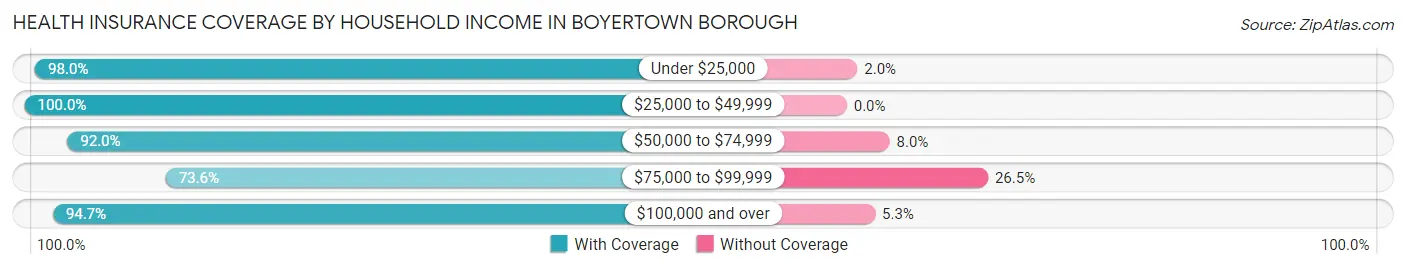
| Household Income | With Coverage | Without Coverage |
| Under $25,000 | 447 (98.0%) | 9 (2.0%) |
| $25,000 to $49,999 | 786 (100.0%) | 0 (0.0%) |
| $50,000 to $74,999 | 631 (92.0%) | 55 (8.0%) |
| $75,000 to $99,999 | 534 (73.6%) | 192 (26.5%) |
| $100,000 and over | 1,430 (94.7%) | 80 (5.3%) |
Public vs Private Health Insurance Coverage by Age in Boyertown borough
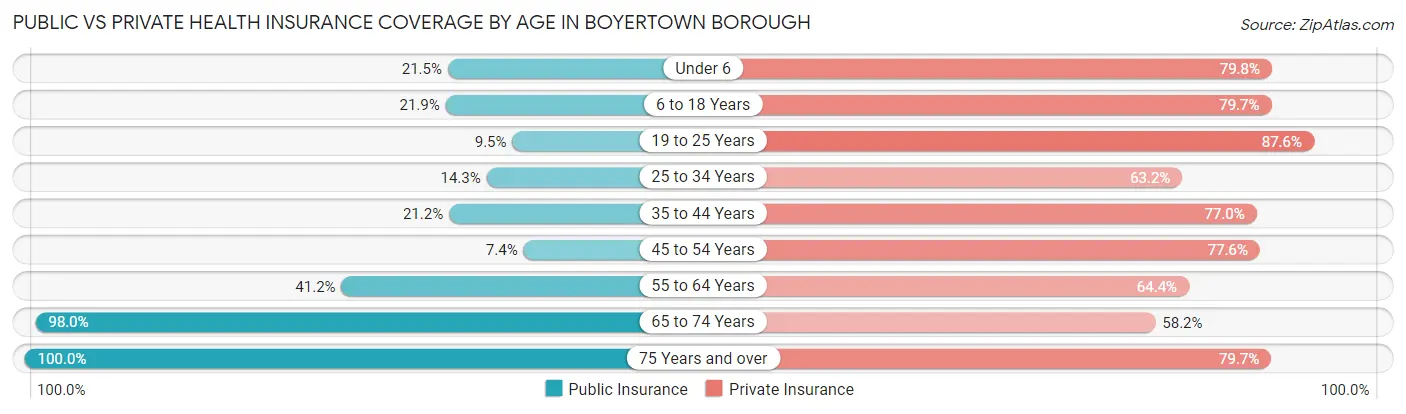
| Age Bracket | Public Insurance | Private Insurance |
| Under 6 | 68 (21.4%) | 253 (79.8%) |
| 6 to 18 Years | 110 (21.9%) | 401 (79.7%) |
| 19 to 25 Years | 42 (9.5%) | 389 (87.6%) |
| 25 to 34 Years | 86 (14.3%) | 381 (63.2%) |
| 35 to 44 Years | 83 (21.2%) | 301 (77.0%) |
| 45 to 54 Years | 33 (7.4%) | 346 (77.6%) |
| 55 to 64 Years | 220 (41.2%) | 344 (64.4%) |
| 65 to 74 Years | 490 (98.0%) | 291 (58.2%) |
| 75 Years and over | 453 (100.0%) | 361 (79.7%) |
| Total | 1,585 (37.8%) | 3,067 (73.2%) |
Disability Status by Sex by Age in Boyertown borough
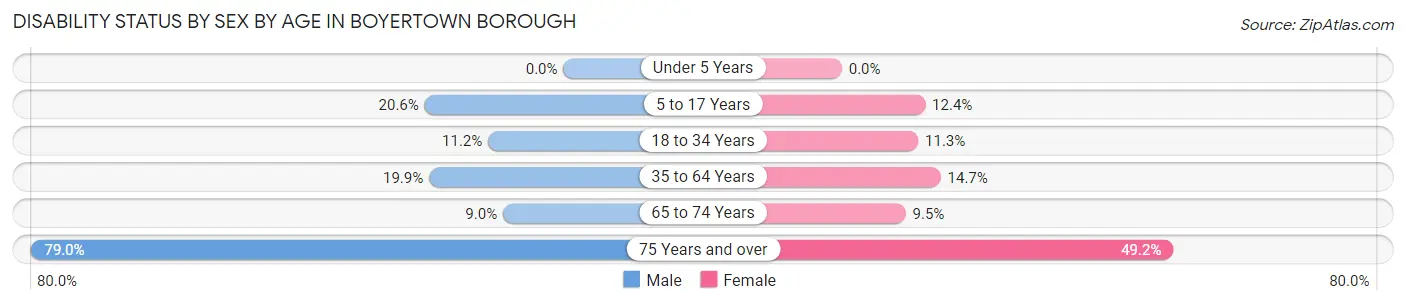
| Age Bracket | Male | Female |
| Under 5 Years | 0 (0.0%) | 0 (0.0%) |
| 5 to 17 Years | 41 (20.6%) | 39 (12.4%) |
| 18 to 34 Years | 69 (11.2%) | 51 (11.3%) |
| 35 to 64 Years | 132 (19.9%) | 104 (14.7%) |
| 65 to 74 Years | 24 (9.0%) | 22 (9.5%) |
| 75 Years and over | 109 (79.0%) | 155 (49.2%) |
Disability Class by Sex by Age in Boyertown borough
Disability Class: Hearing Difficulty
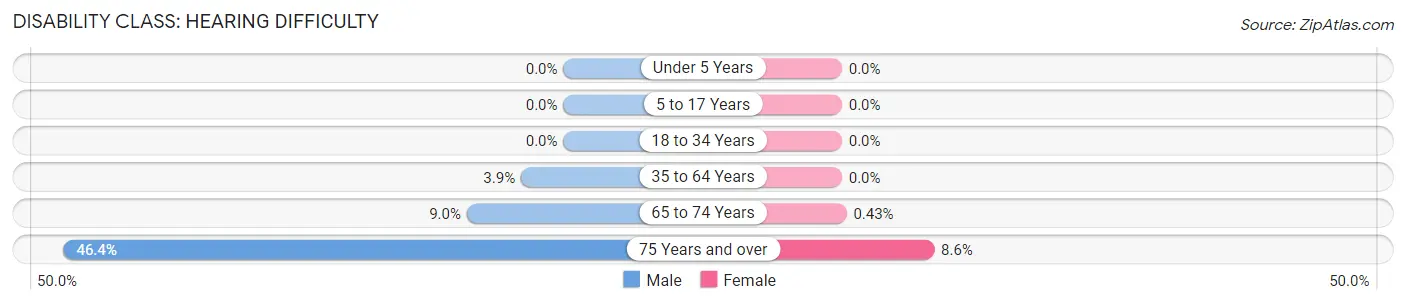
| Age Bracket | Male | Female |
| Under 5 Years | 0 (0.0%) | 0 (0.0%) |
| 5 to 17 Years | 0 (0.0%) | 0 (0.0%) |
| 18 to 34 Years | 0 (0.0%) | 0 (0.0%) |
| 35 to 64 Years | 26 (3.9%) | 0 (0.0%) |
| 65 to 74 Years | 24 (9.0%) | 1 (0.4%) |
| 75 Years and over | 64 (46.4%) | 27 (8.6%) |
Disability Class: Vision Difficulty
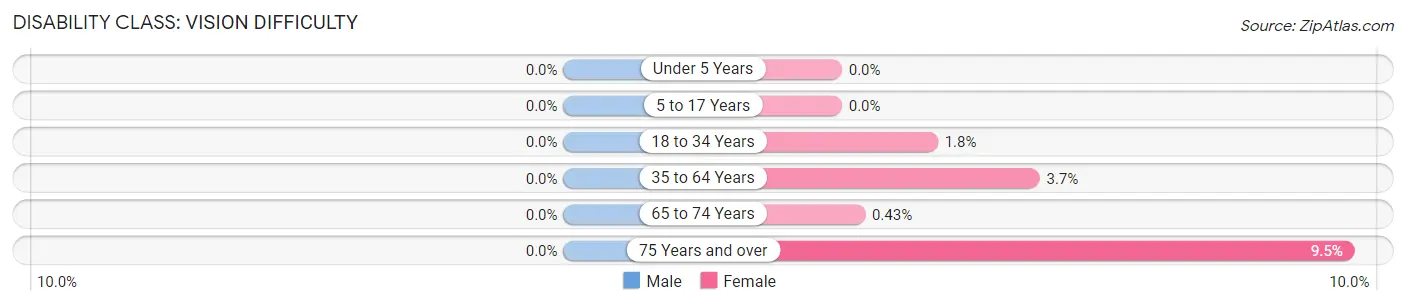
| Age Bracket | Male | Female |
| Under 5 Years | 0 (0.0%) | 0 (0.0%) |
| 5 to 17 Years | 0 (0.0%) | 0 (0.0%) |
| 18 to 34 Years | 0 (0.0%) | 8 (1.8%) |
| 35 to 64 Years | 0 (0.0%) | 26 (3.7%) |
| 65 to 74 Years | 0 (0.0%) | 1 (0.4%) |
| 75 Years and over | 0 (0.0%) | 30 (9.5%) |
Disability Class: Cognitive Difficulty
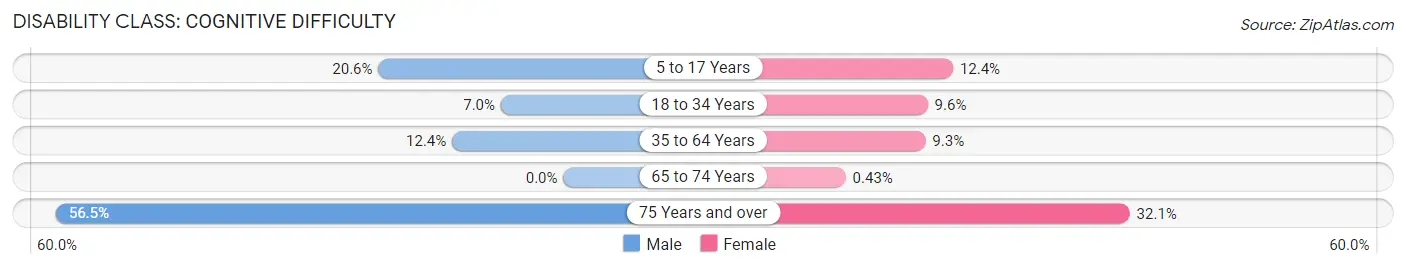
| Age Bracket | Male | Female |
| 5 to 17 Years | 41 (20.6%) | 39 (12.4%) |
| 18 to 34 Years | 43 (7.0%) | 43 (9.6%) |
| 35 to 64 Years | 82 (12.4%) | 66 (9.3%) |
| 65 to 74 Years | 0 (0.0%) | 1 (0.4%) |
| 75 Years and over | 78 (56.5%) | 101 (32.1%) |
Disability Class: Ambulatory Difficulty
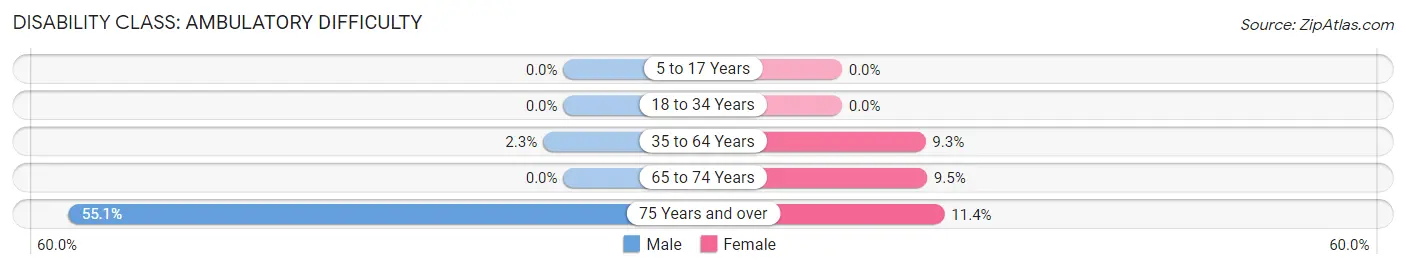
| Age Bracket | Male | Female |
| 5 to 17 Years | 0 (0.0%) | 0 (0.0%) |
| 18 to 34 Years | 0 (0.0%) | 0 (0.0%) |
| 35 to 64 Years | 15 (2.3%) | 66 (9.3%) |
| 65 to 74 Years | 0 (0.0%) | 22 (9.5%) |
| 75 Years and over | 76 (55.1%) | 36 (11.4%) |
Disability Class: Self-Care Difficulty
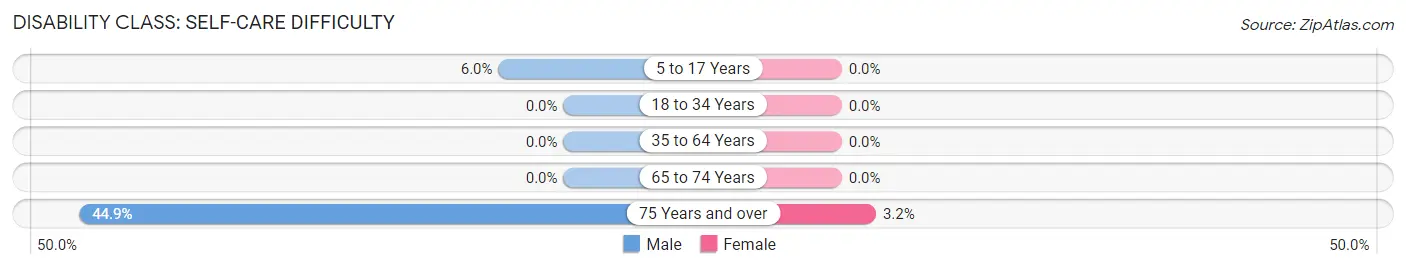
| Age Bracket | Male | Female |
| 5 to 17 Years | 12 (6.0%) | 0 (0.0%) |
| 18 to 34 Years | 0 (0.0%) | 0 (0.0%) |
| 35 to 64 Years | 0 (0.0%) | 0 (0.0%) |
| 65 to 74 Years | 0 (0.0%) | 0 (0.0%) |
| 75 Years and over | 62 (44.9%) | 10 (3.2%) |
Technology Access in Boyertown borough
Computing Device Access in Boyertown borough
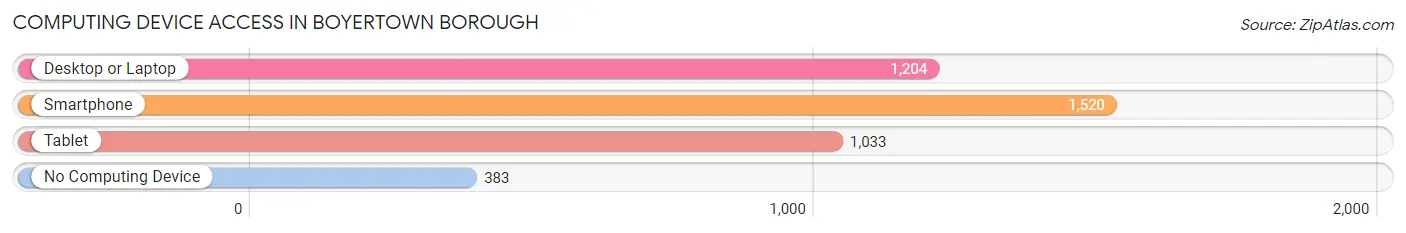
| Device Type | # Households | % Households |
| Desktop or Laptop | 1,204 | 58.4% |
| Smartphone | 1,520 | 73.7% |
| Tablet | 1,033 | 50.1% |
| No Computing Device | 383 | 18.6% |
| Total | 2,062 | 100.0% |
Internet Access in Boyertown borough
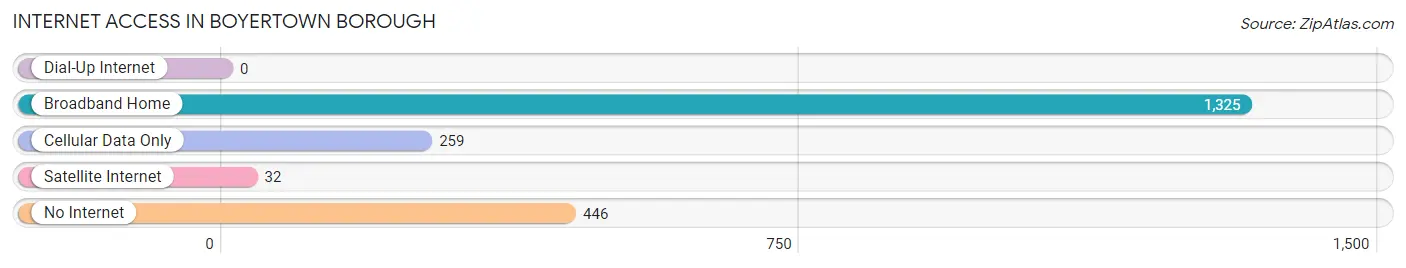
| Internet Type | # Households | % Households |
| Dial-Up Internet | 0 | 0.0% |
| Broadband Home | 1,325 | 64.3% |
| Cellular Data Only | 259 | 12.6% |
| Satellite Internet | 32 | 1.5% |
| No Internet | 446 | 21.6% |
| Total | 2,062 | 100.0% |
Boyertown borough Summary
Boyertown Borough is a small borough located in Berks County, Pennsylvania. It is situated in the southeastern corner of the county, approximately 40 miles northwest of Philadelphia. The borough is bordered by Colebrookdale Township to the north, Douglass Township to the east, Washington Township to the south, and Earl Township to the west. As of the 2010 census, the population of Boyertown was 4,055.
History
The area that is now Boyertown was first settled in 1740 by a group of German immigrants led by John Jacob Schrack. The settlement was originally known as Schrackstown, and was later renamed Boyertown in 1837 in honor of its founder, Jacob Boyer. The borough was officially incorporated in 1873.
Boyertown was an important center of industry in the 19th century. The borough was home to several iron foundries, a tannery, a brickyard, and a number of other factories. The Boyertown Foundry and Machine Company, founded in 1872, was one of the largest employers in the area. The company manufactured a variety of products, including stoves, boilers, and agricultural equipment.
In the early 20th century, Boyertown became a popular tourist destination. The borough was home to several resorts, including the Boyertown Inn, the Boyertown Hotel, and the Boyertown House. The resorts attracted visitors from all over the region, and the borough was known for its picturesque scenery and outdoor activities.
Geography
Boyertown is located at 40°20'N 75°45'W. The borough has a total area of 1.2 square miles, all of which is land. The borough is situated in the southeastern corner of Berks County, approximately 40 miles northwest of Philadelphia. The borough is bordered by Colebrookdale Township to the north, Douglass Township to the east, Washington Township to the south, and Earl Township to the west.
The borough is located in the Piedmont region of Pennsylvania. The terrain is generally flat, with some rolling hills in the northern part of the borough. The borough is drained by the Manatawny Creek, which flows through the center of the borough.
Economy
The economy of Boyertown is largely based on manufacturing and tourism. The borough is home to several factories, including the Boyertown Foundry and Machine Company, which manufactures a variety of products, including stoves, boilers, and agricultural equipment. The borough is also home to several tourist attractions, including the Boyertown Museum of Historic Vehicles, the Boyertown Inn, and the Boyertown House.
Demographics
As of the 2010 census, the population of Boyertown was 4,055. The racial makeup of the borough was 94.3% White, 2.2% African American, 0.3% Native American, 0.7% Asian, 0.1% Pacific Islander, 1.2% from other races, and 1.3% from two or more races. Hispanic or Latino of any race were 3.2% of the population.
The median household income in Boyertown was $50,945, and the median family income was $60,938. The per capita income was $25,945. About 6.2% of families and 8.2% of the population were below the poverty line, including 10.2% of those under age 18 and 6.2% of those age 65 or over.
Common Questions
What is the Total Population of Boyertown borough?
Total Population of Boyertown borough is 4,244.
What is the Total Male Population of Boyertown borough?
Total Male Population of Boyertown borough is 2,077.
What is the Total Female Population of Boyertown borough?
Total Female Population of Boyertown borough is 2,167.
What is the Ratio of Males per 100 Females in Boyertown borough?
There are 95.85 Males per 100 Females in Boyertown borough.
What is the Ratio of Females per 100 Males in Boyertown borough?
There are 104.33 Females per 100 Males in Boyertown borough.
What is the Median Population Age in Boyertown borough?
Median Population Age in Boyertown borough is 38.3 Years.
What is the Average Family Size in Boyertown borough
Average Family Size in Boyertown borough is 2.9 People.
What is the Average Household Size in Boyertown borough
Average Household Size in Boyertown borough is 2.0 People.
What is Per Capita Income in Boyertown borough?
Per Capita income in Boyertown borough is $35,047.
What is the Median Family Income in Boyertown borough?
Median Family Income in Boyertown borough is $80,296.
What is the Median Household income in Boyertown borough?
Median Household Income in Boyertown borough is $52,717.
What is Income or Wage Gap in Boyertown borough?
Income or Wage Gap in Boyertown borough is 42.9%.
Women in Boyertown borough earn 57.1 cents for every dollar earned by a man.
What is Inequality or Gini Index in Boyertown borough?
Inequality or Gini Index in Boyertown borough is 0.41.
How Large is the Labor Force in Boyertown borough?
There are 2,206 People in the Labor Forcein in Boyertown borough.
What is the Percentage of People in the Labor Force in Boyertown borough?
63.0% of People are in the Labor Force in Boyertown borough.
What is the Unemployment Rate in Boyertown borough?
Unemployment Rate in Boyertown borough is 4.2%.