Biglerville borough, PA
Biglerville borough Overview
1,213
TOTAL POPULATION
567
MALE POPULATION
646
FEMALE POPULATION
87.77
MALES / 100 FEMALES
113.93
FEMALES / 100 MALES
35.5
MEDIAN AGE
3.3
AVG FAMILY SIZE
2.4
AVG HOUSEHOLD SIZE
$29,239
PER CAPITA INCOME
$76,944
AVG FAMILY INCOME
$49,634
AVG HOUSEHOLD INCOME
39.2%
WAGE / INCOME GAP [ % ]
60.8¢/ $1
WAGE / INCOME GAP [ $ ]
$14,983
FAMILY INCOME DEFICIT
0.41
INEQUALITY / GINI INDEX
682
LABOR FORCE [ PEOPLE ]
70.4%
PERCENT IN LABOR FORCE
10.0%
UNEMPLOYMENT RATE
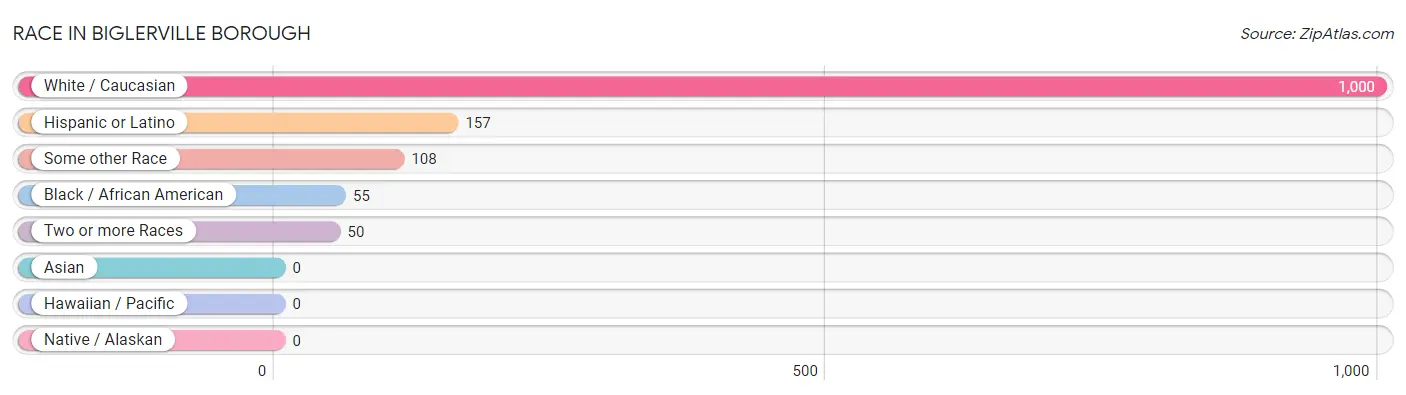
Race in Biglerville borough
The most populous races in Biglerville borough are White / Caucasian (1,000 | 82.4%), Hispanic or Latino (157 | 12.9%), and Some other Race (108 | 8.9%).
| Race | # Population | % Population |
| Asian | 0 | 0.0% |
| Black / African American | 55 | 4.5% |
| Hawaiian / Pacific | 0 | 0.0% |
| Hispanic or Latino | 157 | 12.9% |
| Native / Alaskan | 0 | 0.0% |
| White / Caucasian | 1,000 | 82.4% |
| Two or more Races | 50 | 4.1% |
| Some other Race | 108 | 8.9% |
| Total | 1,213 | 100.0% |
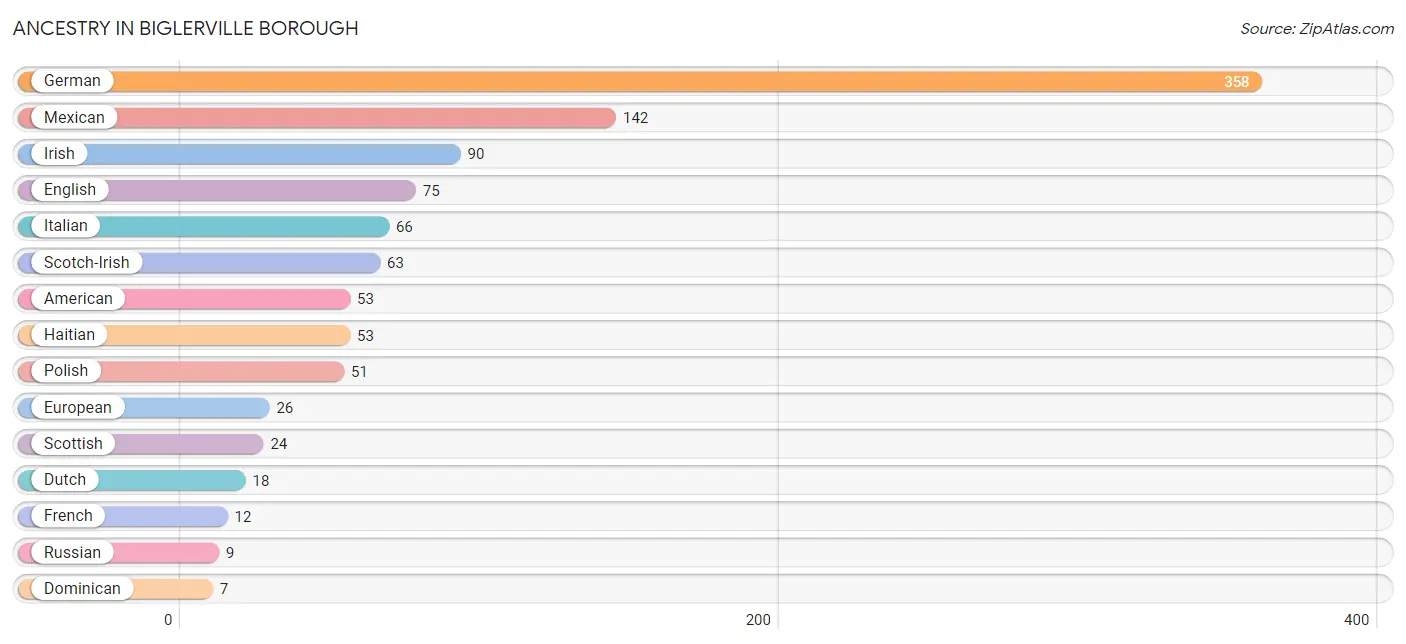
Ancestry in Biglerville borough
The most populous ancestries reported in Biglerville borough are German (358 | 29.5%), Mexican (142 | 11.7%), Irish (90 | 7.4%), English (75 | 6.2%), and Italian (66 | 5.4%), together accounting for 60.3% of all Biglerville borough residents.
| Ancestry | # Population | % Population |
| American | 53 | 4.4% |
| Arab | 4 | 0.3% |
| British | 3 | 0.3% |
| Cape Verdean | 1 | 0.1% |
| Central American | 3 | 0.3% |
| Cherokee | 3 | 0.3% |
| Czech | 6 | 0.5% |
| Dominican | 7 | 0.6% |
| Dutch | 18 | 1.5% |
| Egyptian | 4 | 0.3% |
| English | 75 | 6.2% |
| European | 26 | 2.1% |
| French | 12 | 1.0% |
| German | 358 | 29.5% |
| Greek | 7 | 0.6% |
| Haitian | 53 | 4.4% |
| Honduran | 3 | 0.3% |
| Icelander | 7 | 0.6% |
| Irish | 90 | 7.4% |
| Italian | 66 | 5.4% |
| Mexican | 142 | 11.7% |
| Pennsylvania German | 1 | 0.1% |
| Polish | 51 | 4.2% |
| Puerto Rican | 5 | 0.4% |
| Russian | 9 | 0.7% |
| Scotch-Irish | 63 | 5.2% |
| Scottish | 24 | 2.0% |
| Slavic | 4 | 0.3% |
| Subsaharan African | 1 | 0.1% |
| Ukrainian | 3 | 0.3% |
| Welsh | 7 | 0.6% |
| Yup'ik | 2 | 0.2% | View All 32 Rows |
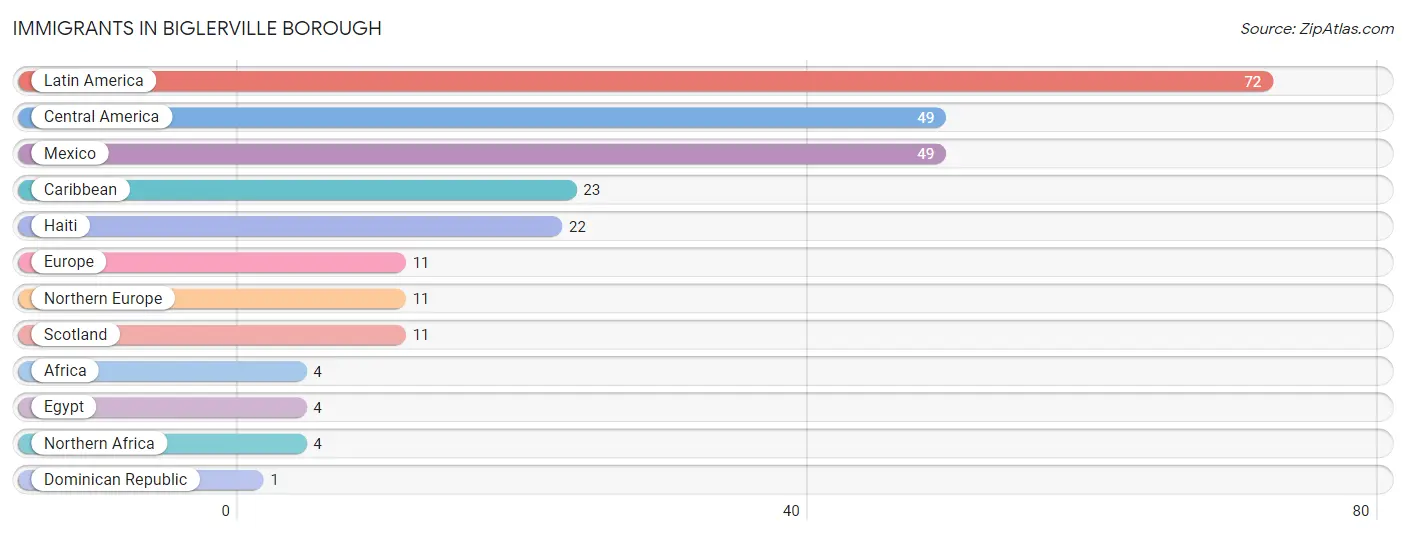
Immigrants in Biglerville borough
The most numerous immigrant groups reported in Biglerville borough came from Latin America (72 | 5.9%), Central America (49 | 4.0%), Mexico (49 | 4.0%), Caribbean (23 | 1.9%), and Haiti (22 | 1.8%), together accounting for 17.7% of all Biglerville borough residents.
| Immigration Origin | # Population | % Population |
| Africa | 4 | 0.3% |
| Caribbean | 23 | 1.9% |
| Central America | 49 | 4.0% |
| Dominican Republic | 1 | 0.1% |
| Egypt | 4 | 0.3% |
| Europe | 11 | 0.9% |
| Haiti | 22 | 1.8% |
| Latin America | 72 | 5.9% |
| Mexico | 49 | 4.0% |
| Northern Africa | 4 | 0.3% |
| Northern Europe | 11 | 0.9% |
| Scotland | 11 | 0.9% | View All 12 Rows |
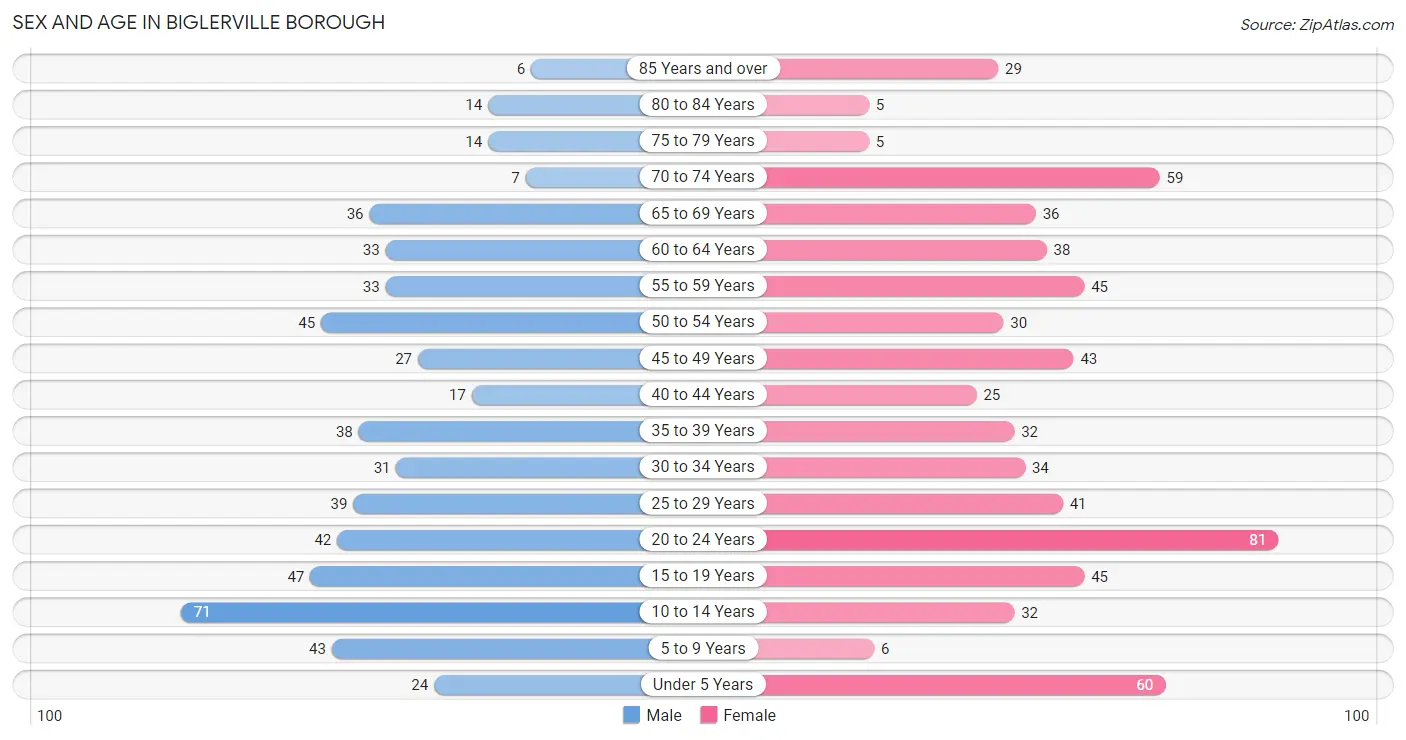
Sex and Age in Biglerville borough
Sex and Age in Biglerville borough
The most populous age groups in Biglerville borough are 10 to 14 Years (71 | 12.5%) for men and 20 to 24 Years (81 | 12.5%) for women.
| Age Bracket | Male | Female |
| Under 5 Years | 24 (4.2%) | 60 (9.3%) |
| 5 to 9 Years | 43 (7.6%) | 6 (0.9%) |
| 10 to 14 Years | 71 (12.5%) | 32 (5.0%) |
| 15 to 19 Years | 47 (8.3%) | 45 (7.0%) |
| 20 to 24 Years | 42 (7.4%) | 81 (12.5%) |
| 25 to 29 Years | 39 (6.9%) | 41 (6.4%) |
| 30 to 34 Years | 31 (5.5%) | 34 (5.3%) |
| 35 to 39 Years | 38 (6.7%) | 32 (5.0%) |
| 40 to 44 Years | 17 (3.0%) | 25 (3.9%) |
| 45 to 49 Years | 27 (4.8%) | 43 (6.7%) |
| 50 to 54 Years | 45 (7.9%) | 30 (4.6%) |
| 55 to 59 Years | 33 (5.8%) | 45 (7.0%) |
| 60 to 64 Years | 33 (5.8%) | 38 (5.9%) |
| 65 to 69 Years | 36 (6.4%) | 36 (5.6%) |
| 70 to 74 Years | 7 (1.2%) | 59 (9.1%) |
| 75 to 79 Years | 14 (2.5%) | 5 (0.8%) |
| 80 to 84 Years | 14 (2.5%) | 5 (0.8%) |
| 85 Years and over | 6 (1.1%) | 29 (4.5%) |
| Total | 567 (100.0%) | 646 (100.0%) |
Families and Households in Biglerville borough
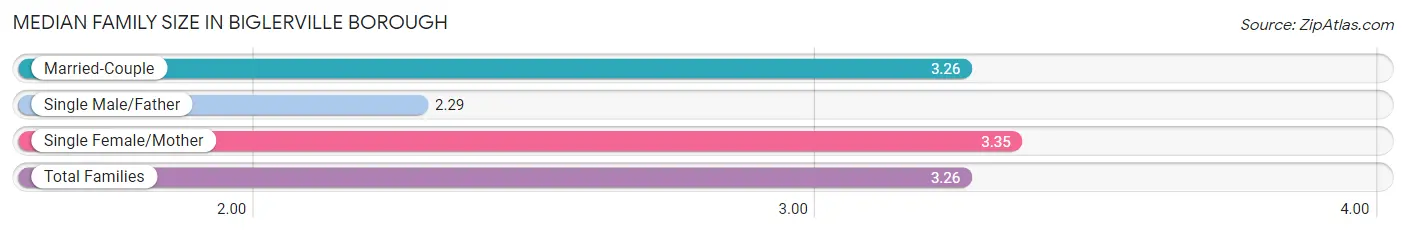
Median Family Size in Biglerville borough
The median family size in Biglerville borough is 3.26 persons per family, with single female/mother families (66 | 22.5%) accounting for the largest median family size of 3.35 persons per family. On the other hand, single male/father families (7 | 2.4%) represent the smallest median family size with 2.29 persons per family.
| Family Type | # Families | Family Size |
| Married-Couple | 221 (75.2%) | 3.26 |
| Single Male/Father | 7 (2.4%) | 2.29 |
| Single Female/Mother | 66 (22.5%) | 3.35 |
| Total Families | 294 (100.0%) | 3.26 |
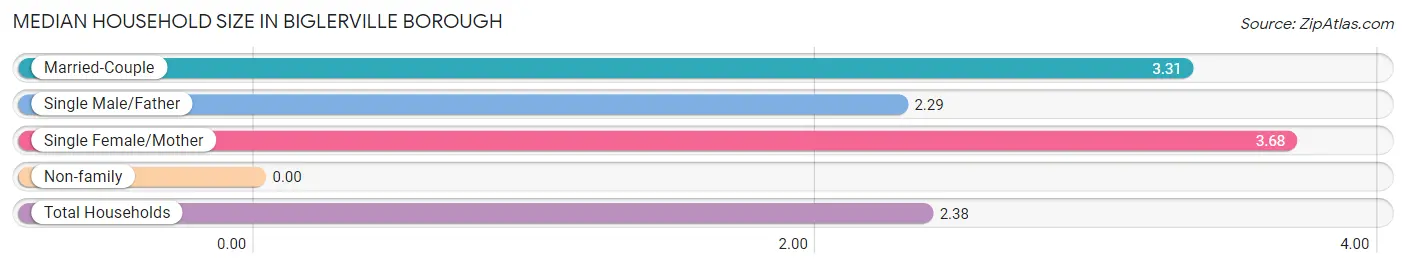
Median Household Size in Biglerville borough
| Household Type | # Households | Household Size |
| Married-Couple | 221 (43.9%) | 3.31 |
| Single Male/Father | 7 (1.4%) | 2.29 |
| Single Female/Mother | 66 (13.1%) | 3.68 |
| Non-family | 210 (41.7%) | - |
| Total Households | 504 (100.0%) | 2.38 |
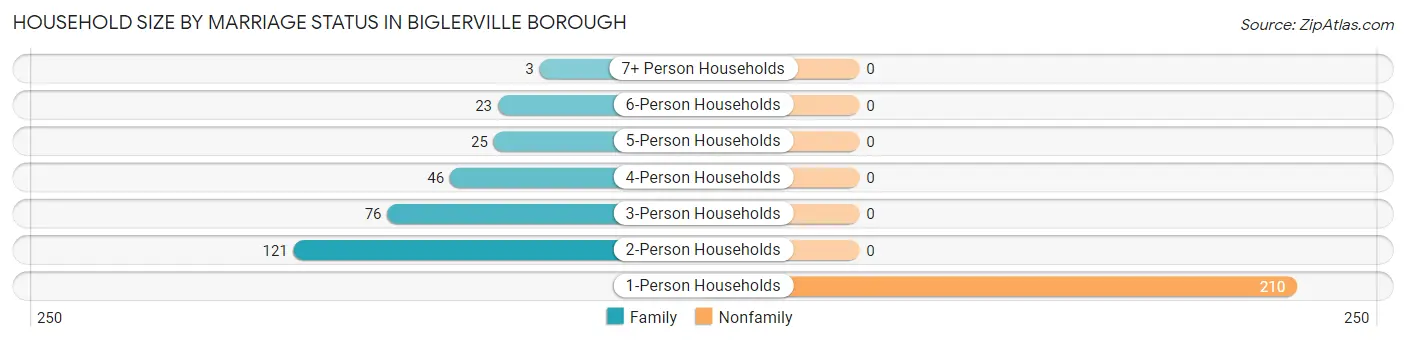
Household Size by Marriage Status in Biglerville borough
Out of a total of 504 households in Biglerville borough, 294 (58.3%) are family households, while 210 (41.7%) are nonfamily households. The most numerous type of family households are 2-person households, comprising 121, and the most common type of nonfamily households are 1-person households, comprising 210.
| Household Size | Family Households | Nonfamily Households |
| 1-Person Households | - | 210 (41.7%) |
| 2-Person Households | 121 (24.0%) | 0 (0.0%) |
| 3-Person Households | 76 (15.1%) | 0 (0.0%) |
| 4-Person Households | 46 (9.1%) | 0 (0.0%) |
| 5-Person Households | 25 (5.0%) | 0 (0.0%) |
| 6-Person Households | 23 (4.6%) | 0 (0.0%) |
| 7+ Person Households | 3 (0.6%) | 0 (0.0%) |
| Total | 294 (58.3%) | 210 (41.7%) |
Female Fertility in Biglerville borough
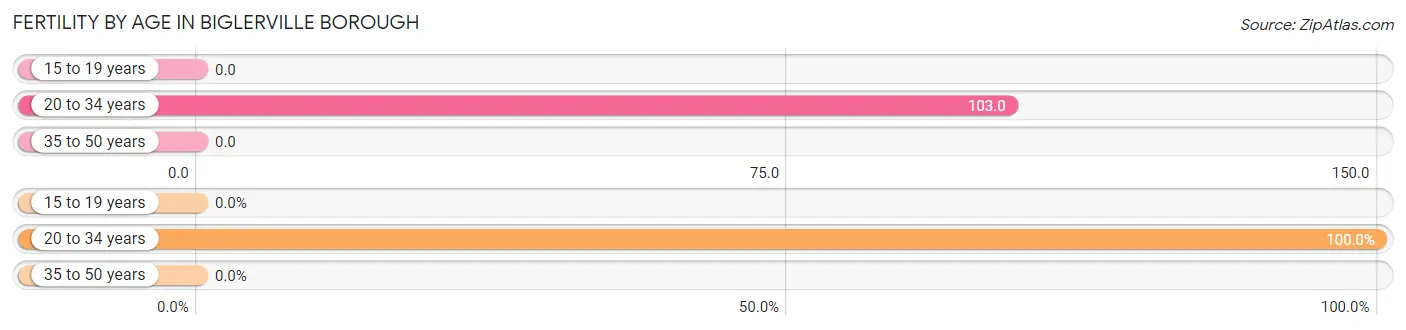
Fertility by Age in Biglerville borough
Average fertility rate in Biglerville borough is 53.0 births per 1,000 women. Women in the age bracket of 20 to 34 years have the highest fertility rate with 103.0 births per 1,000 women. Women in the age bracket of 20 to 34 years acount for 100.0% of all women with births.
| Age Bracket | Women with Births | Births / 1,000 Women |
| 15 to 19 years | 0 (0.0%) | 0.0 |
| 20 to 34 years | 16 (100.0%) | 103.0 |
| 35 to 50 years | 0 (0.0%) | 0.0 |
| Total | 16 (100.0%) | 53.0 |
Fertility by Age by Marriage Status in Biglerville borough
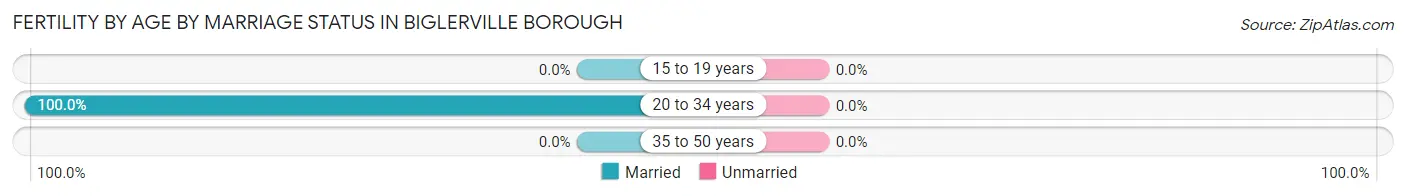
| Age Bracket | Married | Unmarried |
| 15 to 19 years | 0 (0.0%) | 0 (0.0%) |
| 20 to 34 years | 16 (100.0%) | 0 (0.0%) |
| 35 to 50 years | 0 (0.0%) | 0 (0.0%) |
| Total | 16 (100.0%) | 0 (0.0%) |
Fertility by Education in Biglerville borough
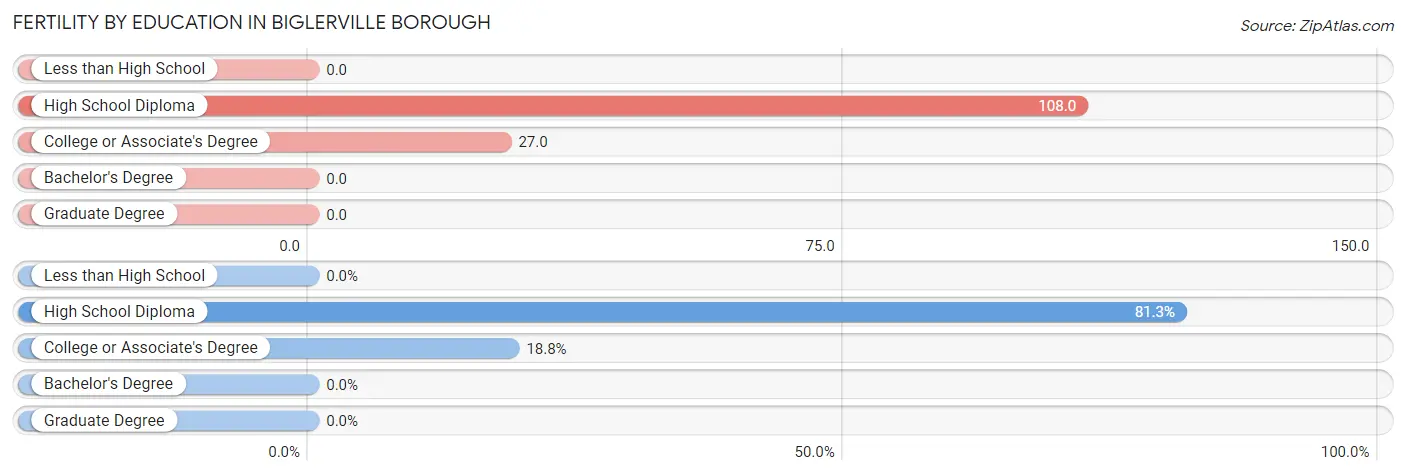
| Educational Attainment | Women with Births | Births / 1,000 Women |
| Less than High School | 0 (0.0%) | 0.0 |
| High School Diploma | 13 (81.2%) | 108.0 |
| College or Associate's Degree | 3 (18.8%) | 27.0 |
| Bachelor's Degree | 0 (0.0%) | 0.0 |
| Graduate Degree | 0 (0.0%) | 0.0 |
| Total | 16 (100.0%) | 53.0 |
Fertility by Education by Marriage Status in Biglerville borough
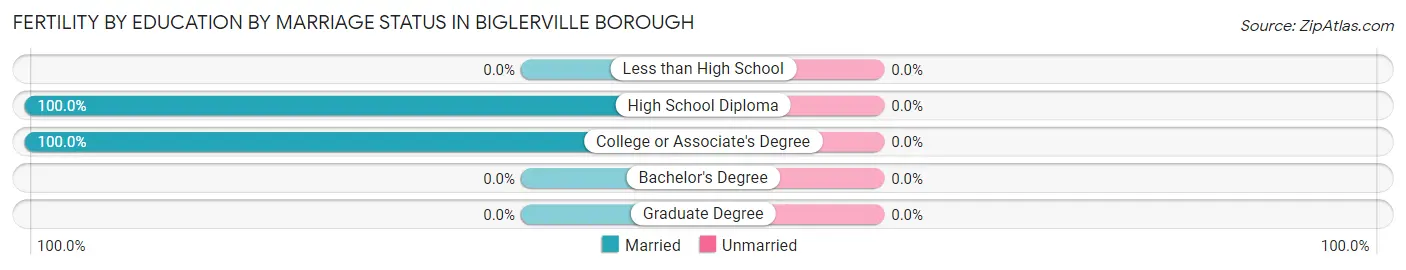
| Educational Attainment | Married | Unmarried |
| Less than High School | 0 (0.0%) | 0 (0.0%) |
| High School Diploma | 13 (100.0%) | 0 (0.0%) |
| College or Associate's Degree | 3 (100.0%) | 0 (0.0%) |
| Bachelor's Degree | 0 (0.0%) | 0 (0.0%) |
| Graduate Degree | 0 (0.0%) | 0 (0.0%) |
| Total | 16 (100.0%) | 0 (0.0%) |
Income in Biglerville borough
Income Overview in Biglerville borough
Per Capita Income in Biglerville borough is $29,239, while median incomes of families and households are $76,944 and $49,634 respectively.
| Characteristic | Number | Measure |
| Per Capita Income | 1,213 | $29,239 |
| Median Family Income | 294 | $76,944 |
| Mean Family Income | 294 | $85,528 |
| Median Household Income | 504 | $49,634 |
| Mean Household Income | 504 | $68,497 |
| Income Deficit | 294 | $14,983 |
| Wage / Income Gap (%) | 1,213 | 39.19% |
| Wage / Income Gap ($) | 1,213 | 60.81¢ per $1 |
| Gini / Inequality Index | 1,213 | 0.41 |
Earnings by Sex in Biglerville borough
Average Earnings in Biglerville borough are $31,667, $42,554 for men and $25,875 for women, a difference of 39.2%.
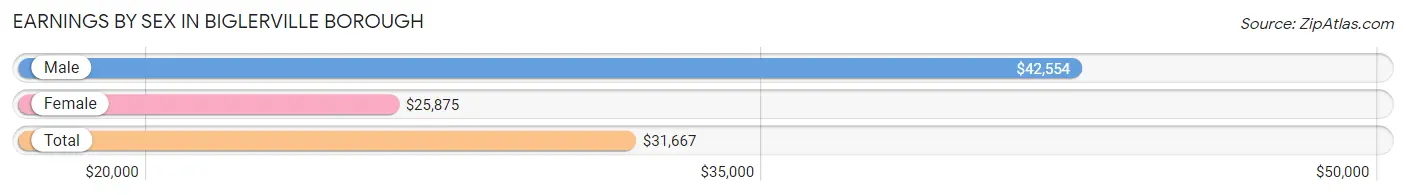
| Sex | Number | Average Earnings |
| Male | 295 (42.5%) | $42,554 |
| Female | 399 (57.5%) | $25,875 |
| Total | 694 (100.0%) | $31,667 |
Earnings by Sex by Income Bracket in Biglerville borough
The most common earnings brackets in Biglerville borough are $75,000 to $99,999 for men (35 | 11.9%) and $30,000 to $34,999 for women (61 | 15.3%).
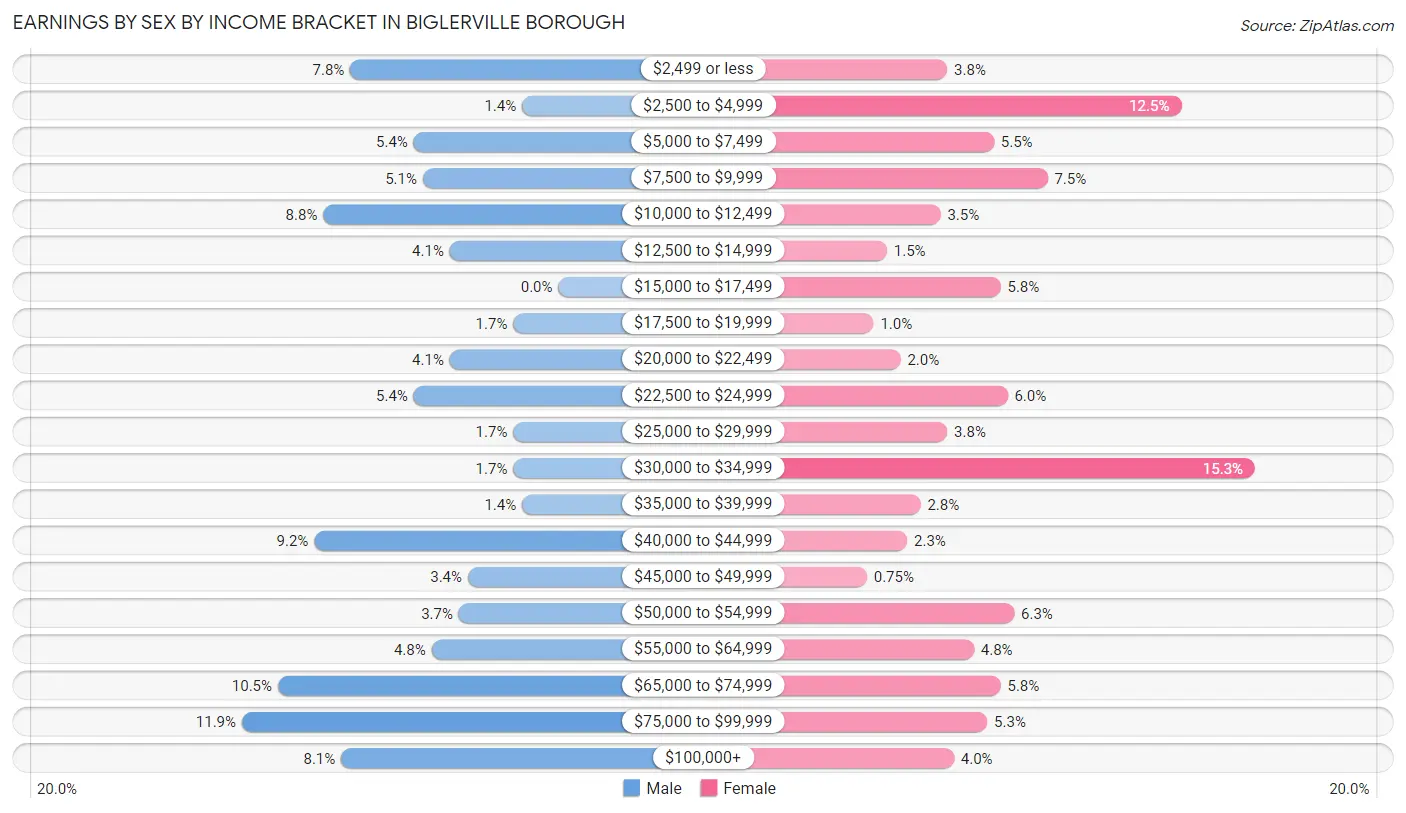
| Income | Male | Female |
| $2,499 or less | 23 (7.8%) | 15 (3.8%) |
| $2,500 to $4,999 | 4 (1.4%) | 50 (12.5%) |
| $5,000 to $7,499 | 16 (5.4%) | 22 (5.5%) |
| $7,500 to $9,999 | 15 (5.1%) | 30 (7.5%) |
| $10,000 to $12,499 | 26 (8.8%) | 14 (3.5%) |
| $12,500 to $14,999 | 12 (4.1%) | 6 (1.5%) |
| $15,000 to $17,499 | 0 (0.0%) | 23 (5.8%) |
| $17,500 to $19,999 | 5 (1.7%) | 4 (1.0%) |
| $20,000 to $22,499 | 12 (4.1%) | 8 (2.0%) |
| $22,500 to $24,999 | 16 (5.4%) | 24 (6.0%) |
| $25,000 to $29,999 | 5 (1.7%) | 15 (3.8%) |
| $30,000 to $34,999 | 5 (1.7%) | 61 (15.3%) |
| $35,000 to $39,999 | 4 (1.4%) | 11 (2.8%) |
| $40,000 to $44,999 | 27 (9.1%) | 9 (2.3%) |
| $45,000 to $49,999 | 10 (3.4%) | 3 (0.7%) |
| $50,000 to $54,999 | 11 (3.7%) | 25 (6.3%) |
| $55,000 to $64,999 | 14 (4.8%) | 19 (4.8%) |
| $65,000 to $74,999 | 31 (10.5%) | 23 (5.8%) |
| $75,000 to $99,999 | 35 (11.9%) | 21 (5.3%) |
| $100,000+ | 24 (8.1%) | 16 (4.0%) |
| Total | 295 (100.0%) | 399 (100.0%) |
Earnings by Sex by Educational Attainment in Biglerville borough
Average earnings in Biglerville borough are $44,457 for men and $25,125 for women, a difference of 43.5%. Men with an educational attainment of bachelor's degree enjoy the highest average annual earnings of $68,636, while those with less than high school education earn the least with $42,989. Women with an educational attainment of bachelor's degree earn the most with the average annual earnings of $70,625, while those with less than high school education have the smallest earnings of $16,705.
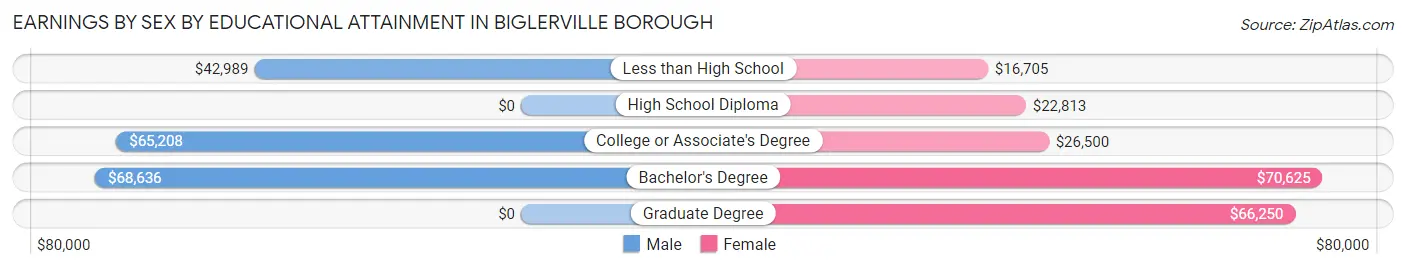
| Educational Attainment | Male Income | Female Income |
| Less than High School | $42,989 | $16,705 |
| High School Diploma | - | - |
| College or Associate's Degree | $65,208 | $26,500 |
| Bachelor's Degree | $68,636 | $70,625 |
| Graduate Degree | - | - |
| Total | $44,457 | $25,125 |
Family Income in Biglerville borough
Family Income Brackets in Biglerville borough
According to the Biglerville borough family income data, there are 78 families falling into the $100,000 to $149,999 income range, which is the most common income bracket and makes up 26.5% of all families. Conversely, the $10,000 to $14,999 income bracket is the least frequent group with only 4 families (1.4%) belonging to this category.
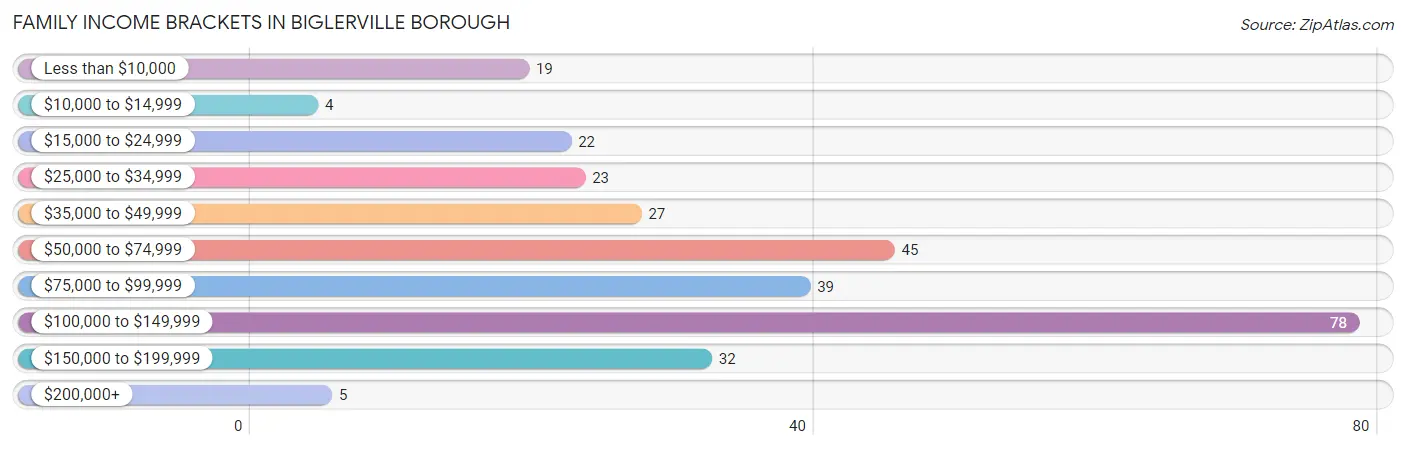
| Income Bracket | # Families | % Families |
| Less than $10,000 | 19 | 6.5% |
| $10,000 to $14,999 | 4 | 1.4% |
| $15,000 to $24,999 | 22 | 7.5% |
| $25,000 to $34,999 | 23 | 7.8% |
| $35,000 to $49,999 | 27 | 9.2% |
| $50,000 to $74,999 | 45 | 15.3% |
| $75,000 to $99,999 | 39 | 13.3% |
| $100,000 to $149,999 | 78 | 26.5% |
| $150,000 to $199,999 | 32 | 10.9% |
| $200,000+ | 5 | 1.7% |
Family Income by Famaliy Size in Biglerville borough
3-person families (85 | 28.9%) account for the highest median family income in Biglerville borough with $105,208 per family, while 3-person families (85 | 28.9%) have the highest median income of $35,069 per family member.
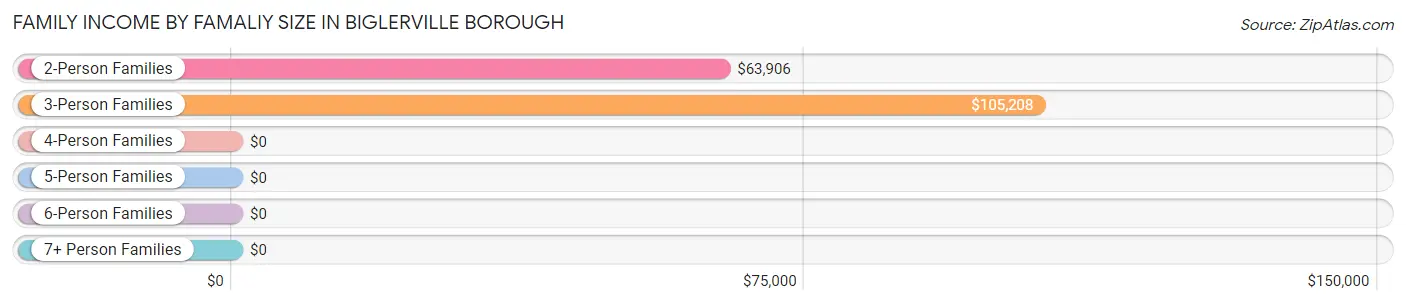
| Income Bracket | # Families | Median Income |
| 2-Person Families | 127 (43.2%) | $63,906 |
| 3-Person Families | 85 (28.9%) | $105,208 |
| 4-Person Families | 35 (11.9%) | $0 |
| 5-Person Families | 28 (9.5%) | $0 |
| 6-Person Families | 16 (5.4%) | $0 |
| 7+ Person Families | 3 (1.0%) | $0 |
| Total | 294 (100.0%) | $76,944 |
Family Income by Number of Earners in Biglerville borough
The median family income in Biglerville borough is $76,944, with families comprising 3+ earners (41) having the highest median family income of $106,458, while families with 1 earner (80) have the lowest median family income of $40,000, accounting for 14.0% and 27.2% of families, respectively.
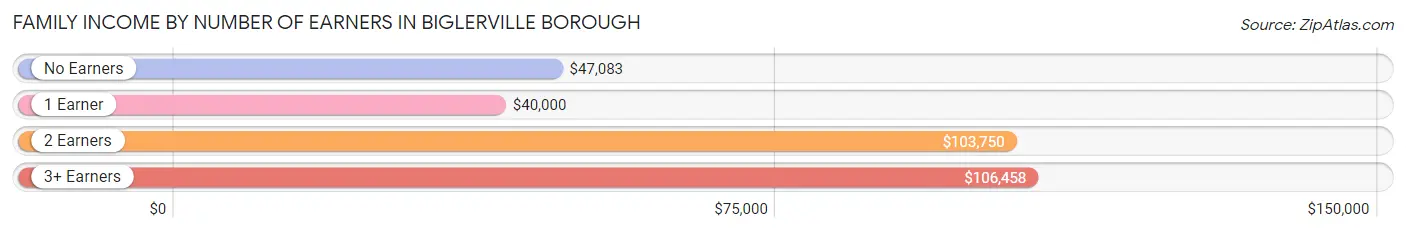
| Number of Earners | # Families | Median Income |
| No Earners | 43 (14.6%) | $47,083 |
| 1 Earner | 80 (27.2%) | $40,000 |
| 2 Earners | 130 (44.2%) | $103,750 |
| 3+ Earners | 41 (14.0%) | $106,458 |
| Total | 294 (100.0%) | $76,944 |
Household Income in Biglerville borough
Household Income Brackets in Biglerville borough
With 97 households falling in the category, the $25,000 to $34,999 income range is the most frequent in Biglerville borough, accounting for 19.3% of all households. In contrast, only 5 households (1.0%) fall into the $200,000+ income bracket, making it the least populous group.
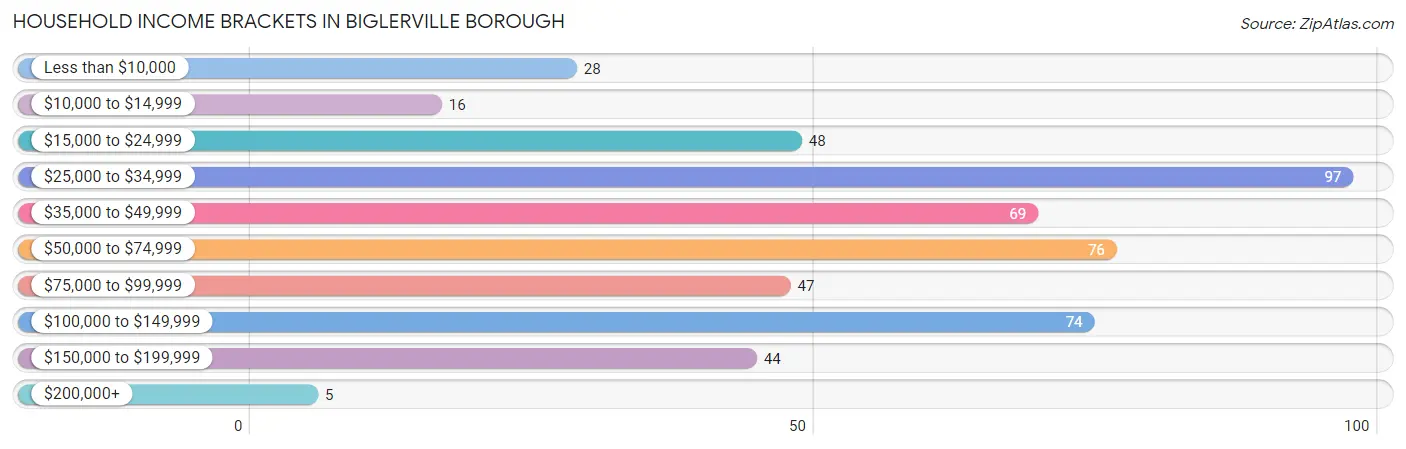
| Income Bracket | # Households | % Households |
| Less than $10,000 | 28 | 5.6% |
| $10,000 to $14,999 | 16 | 3.2% |
| $15,000 to $24,999 | 48 | 9.5% |
| $25,000 to $34,999 | 97 | 19.2% |
| $35,000 to $49,999 | 69 | 13.7% |
| $50,000 to $74,999 | 76 | 15.1% |
| $75,000 to $99,999 | 47 | 9.3% |
| $100,000 to $149,999 | 74 | 14.7% |
| $150,000 to $199,999 | 44 | 8.7% |
| $200,000+ | 5 | 1.0% |
Household Income by Householder Age in Biglerville borough
The median household income in Biglerville borough is $49,634, with the highest median household income of $92,083 found in the 45 to 64 years age bracket for the primary householder. A total of 173 households (34.3%) fall into this category. Meanwhile, the 15 to 24 years age bracket for the primary householder has the lowest median household income of $33,599, with 65 households (12.9%) in this group.
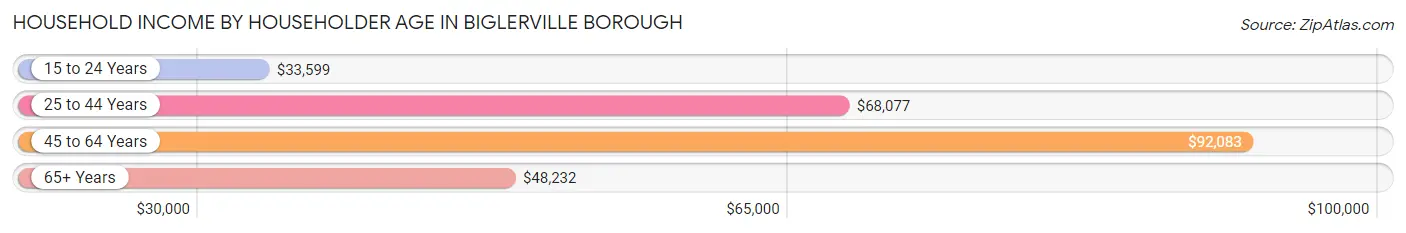
| Income Bracket | # Households | Median Income |
| 15 to 24 Years | 65 (12.9%) | $33,599 |
| 25 to 44 Years | 118 (23.4%) | $68,077 |
| 45 to 64 Years | 173 (34.3%) | $92,083 |
| 65+ Years | 148 (29.4%) | $48,232 |
| Total | 504 (100.0%) | $49,634 |
Poverty in Biglerville borough
Income Below Poverty by Sex and Age in Biglerville borough
With 15.7% poverty level for males and 15.5% for females among the residents of Biglerville borough, 12 to 14 year old males and under 5 year old females are the most vulnerable to poverty, with 26 males (70.3%) and 25 females (43.9%) in their respective age groups living below the poverty level.
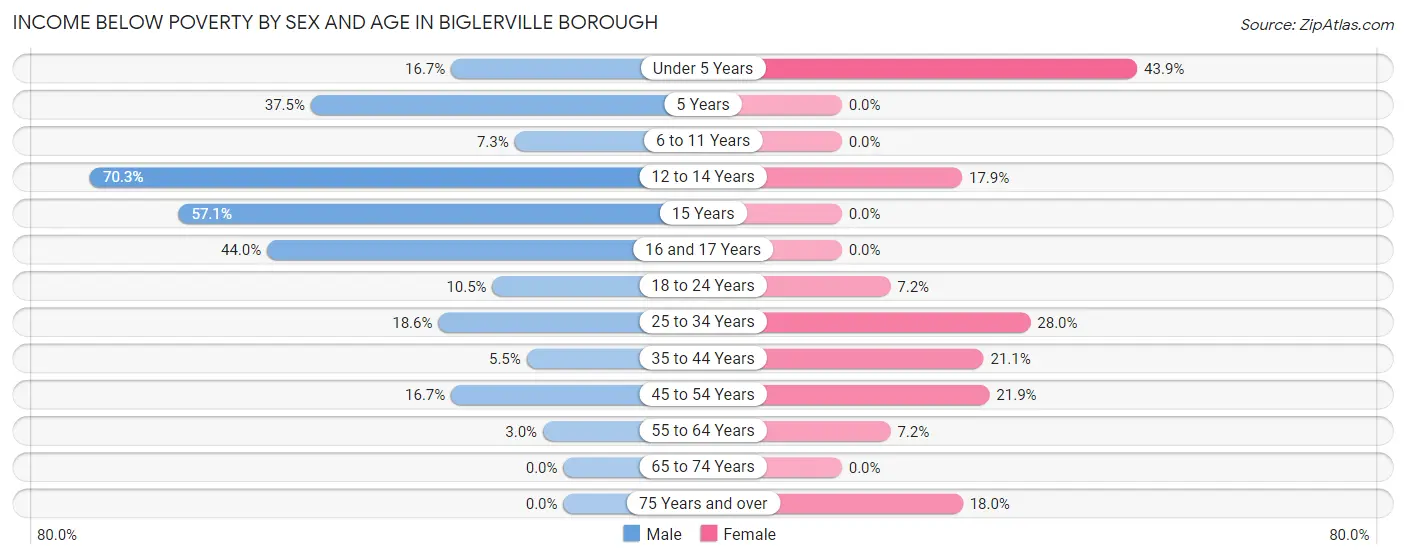
| Age Bracket | Male | Female |
| Under 5 Years | 4 (16.7%) | 25 (43.9%) |
| 5 Years | 3 (37.5%) | 0 (0.0%) |
| 6 to 11 Years | 5 (7.2%) | 0 (0.0%) |
| 12 to 14 Years | 26 (70.3%) | 5 (17.9%) |
| 15 Years | 4 (57.1%) | 0 (0.0%) |
| 16 and 17 Years | 11 (44.0%) | 0 (0.0%) |
| 18 to 24 Years | 6 (10.5%) | 8 (7.2%) |
| 25 to 34 Years | 13 (18.6%) | 21 (28.0%) |
| 35 to 44 Years | 3 (5.4%) | 12 (21.0%) |
| 45 to 54 Years | 12 (16.7%) | 16 (21.9%) |
| 55 to 64 Years | 2 (3.0%) | 6 (7.2%) |
| 65 to 74 Years | 0 (0.0%) | 0 (0.0%) |
| 75 Years and over | 0 (0.0%) | 7 (17.9%) |
| Total | 89 (15.7%) | 100 (15.5%) |
Income Above Poverty by Sex and Age in Biglerville borough
According to the poverty statistics in Biglerville borough, males aged 65 to 74 years and females aged 6 to 11 years are the age groups that are most secure financially, with 100.0% of males and 100.0% of females in these age groups living above the poverty line.
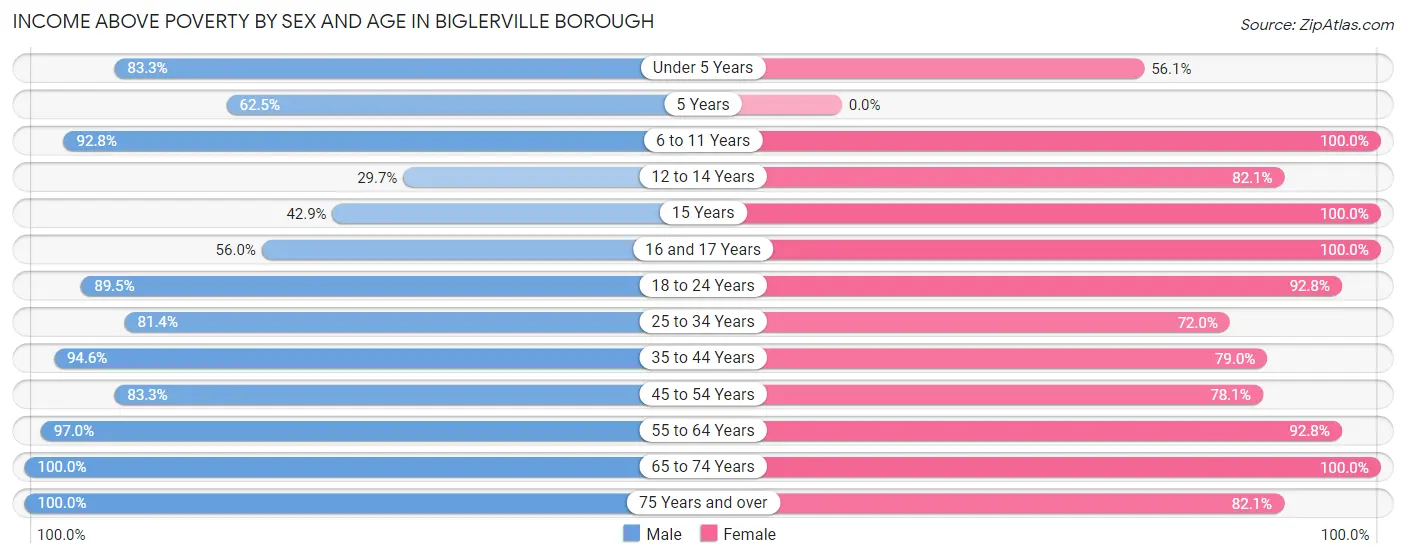
| Age Bracket | Male | Female |
| Under 5 Years | 20 (83.3%) | 32 (56.1%) |
| 5 Years | 5 (62.5%) | 0 (0.0%) |
| 6 to 11 Years | 64 (92.7%) | 10 (100.0%) |
| 12 to 14 Years | 11 (29.7%) | 23 (82.1%) |
| 15 Years | 3 (42.9%) | 1 (100.0%) |
| 16 and 17 Years | 14 (56.0%) | 14 (100.0%) |
| 18 to 24 Years | 51 (89.5%) | 103 (92.8%) |
| 25 to 34 Years | 57 (81.4%) | 54 (72.0%) |
| 35 to 44 Years | 52 (94.6%) | 45 (78.9%) |
| 45 to 54 Years | 60 (83.3%) | 57 (78.1%) |
| 55 to 64 Years | 64 (97.0%) | 77 (92.8%) |
| 65 to 74 Years | 43 (100.0%) | 95 (100.0%) |
| 75 Years and over | 34 (100.0%) | 32 (82.1%) |
| Total | 478 (84.3%) | 543 (84.5%) |
Income Below Poverty Among Married-Couple Families in Biglerville borough
The poverty statistics for married-couple families in Biglerville borough show that 5.9% or 13 of the total 221 families live below the poverty line. Families with 1 or 2 children have the highest poverty rate of 14.0%, comprising of 8 families. On the other hand, families with 5 or more children have the lowest poverty rate of 0.0%, which includes 0 families.
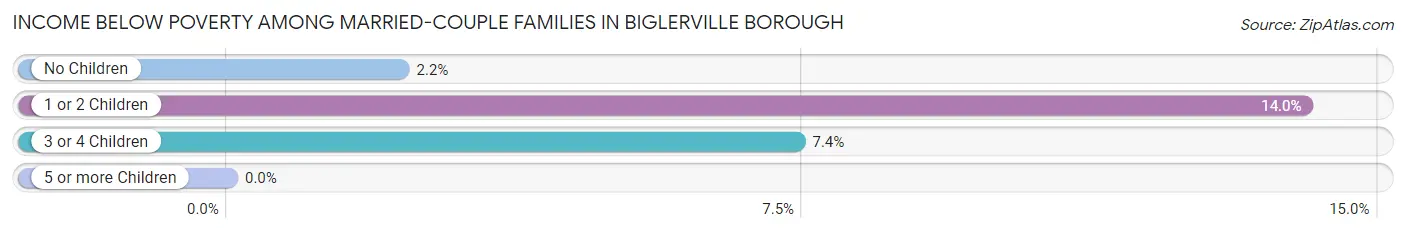
| Children | Above Poverty | Below Poverty |
| No Children | 131 (97.8%) | 3 (2.2%) |
| 1 or 2 Children | 49 (86.0%) | 8 (14.0%) |
| 3 or 4 Children | 25 (92.6%) | 2 (7.4%) |
| 5 or more Children | 3 (100.0%) | 0 (0.0%) |
| Total | 208 (94.1%) | 13 (5.9%) |
Income Below Poverty Among Single-Parent Households in Biglerville borough
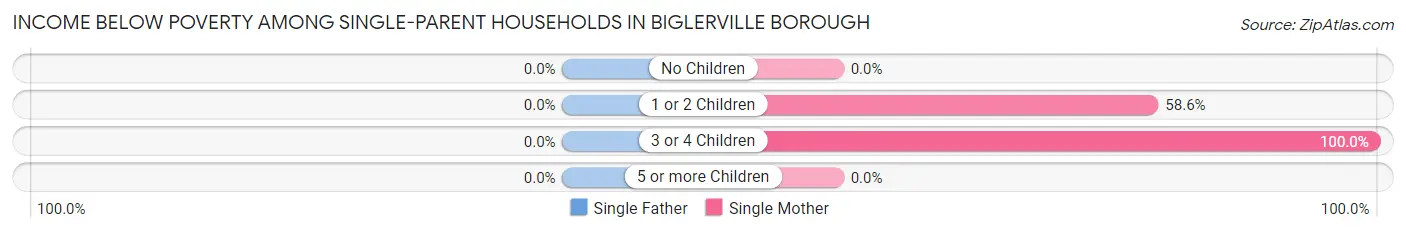
| Children | Single Father | Single Mother |
| No Children | 0 (0.0%) | 0 (0.0%) |
| 1 or 2 Children | 0 (0.0%) | 17 (58.6%) |
| 3 or 4 Children | 0 (0.0%) | 11 (100.0%) |
| 5 or more Children | 0 (0.0%) | 0 (0.0%) |
| Total | 0 (0.0%) | 28 (42.4%) |
Income Below Poverty Among Married-Couple vs Single-Parent Households in Biglerville borough
The poverty data for Biglerville borough shows that 13 of the married-couple family households (5.9%) and 28 of the single-parent households (38.4%) are living below the poverty level. Within the married-couple family households, those with 1 or 2 children have the highest poverty rate, with 8 households (14.0%) falling below the poverty line. Among the single-parent households, those with 3 or 4 children have the highest poverty rate, with 11 household (100.0%) living below poverty.
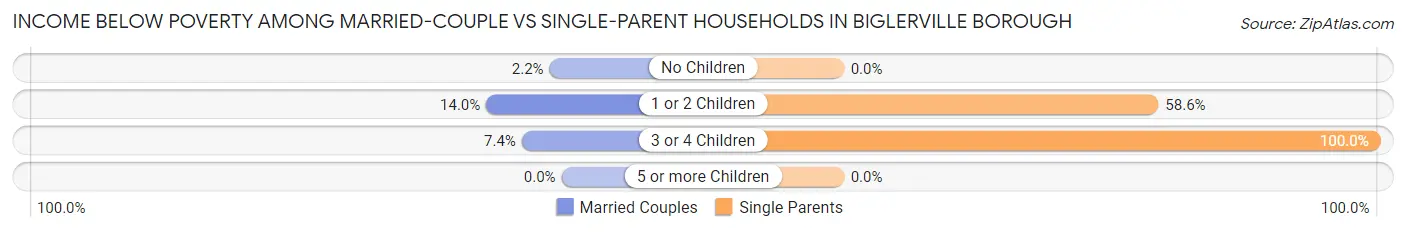
| Children | Married-Couple Families | Single-Parent Households |
| No Children | 3 (2.2%) | 0 (0.0%) |
| 1 or 2 Children | 8 (14.0%) | 17 (58.6%) |
| 3 or 4 Children | 2 (7.4%) | 11 (100.0%) |
| 5 or more Children | 0 (0.0%) | 0 (0.0%) |
| Total | 13 (5.9%) | 28 (38.4%) |
Employment Characteristics in Biglerville borough
Employment by Class of Employer in Biglerville borough
Among the 607 employed individuals in Biglerville borough, private company employees (371 | 61.1%), local government employees (81 | 13.3%), and not-for-profit organizations (72 | 11.9%) make up the most common classes of employment.
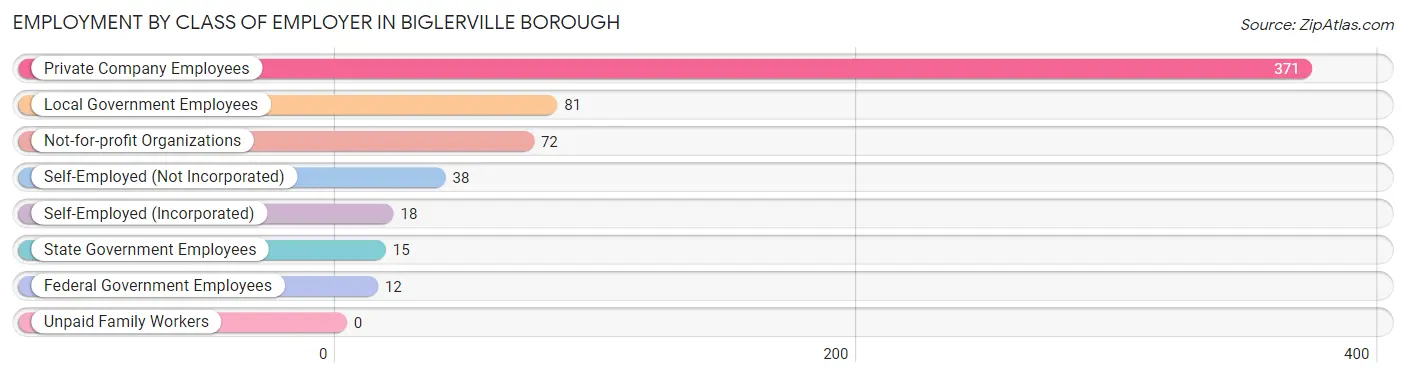
| Employer Class | # Employees | % Employees |
| Private Company Employees | 371 | 61.1% |
| Self-Employed (Incorporated) | 18 | 3.0% |
| Self-Employed (Not Incorporated) | 38 | 6.3% |
| Not-for-profit Organizations | 72 | 11.9% |
| Local Government Employees | 81 | 13.3% |
| State Government Employees | 15 | 2.5% |
| Federal Government Employees | 12 | 2.0% |
| Unpaid Family Workers | 0 | 0.0% |
| Total | 607 | 100.0% |
Employment Status by Age in Biglerville borough
According to the labor force statistics for Biglerville borough, out of the total population over 16 years of age (969), 70.4% or 682 individuals are in the labor force, with 10.0% or 68 of them unemployed. The age group with the highest labor force participation rate is 35 to 44 years, with 94.6% or 106 individuals in the labor force. Within the labor force, the 65 to 74 years age range has the highest percentage of unemployed individuals, with 50.0% or 40 of them being unemployed.
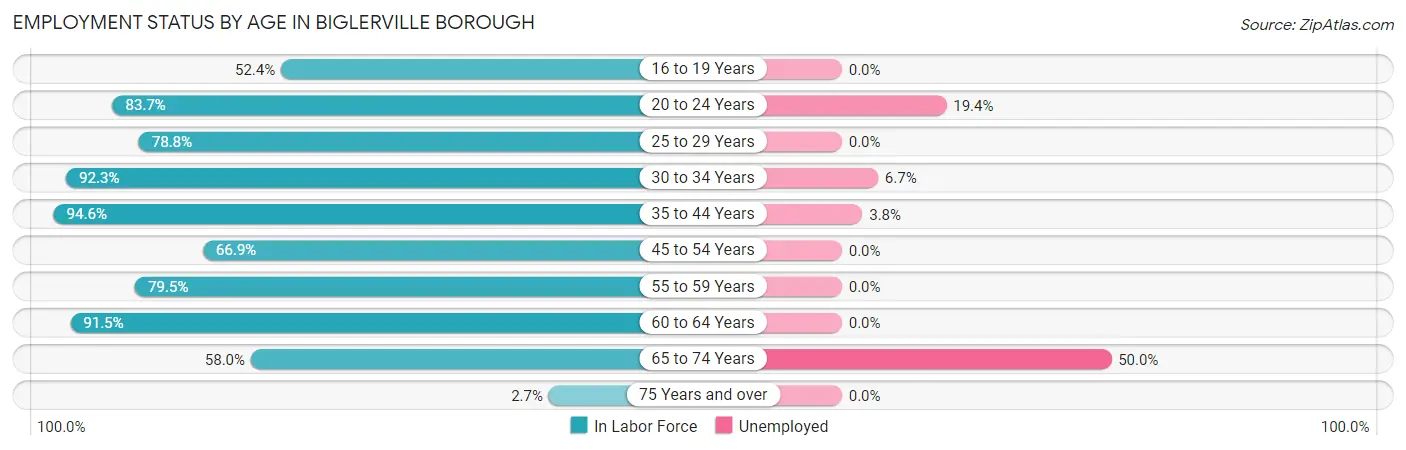
| Age Bracket | In Labor Force | Unemployed |
| 16 to 19 Years | 44 (52.4%) | 0 (0.0%) |
| 20 to 24 Years | 103 (83.7%) | 20 (19.4%) |
| 25 to 29 Years | 63 (78.8%) | 0 (0.0%) |
| 30 to 34 Years | 60 (92.3%) | 4 (6.7%) |
| 35 to 44 Years | 106 (94.6%) | 4 (3.8%) |
| 45 to 54 Years | 97 (66.9%) | 0 (0.0%) |
| 55 to 59 Years | 62 (79.5%) | 0 (0.0%) |
| 60 to 64 Years | 65 (91.5%) | 0 (0.0%) |
| 65 to 74 Years | 80 (58.0%) | 40 (50.0%) |
| 75 Years and over | 2 (2.7%) | 0 (0.0%) |
| Total | 682 (70.4%) | 68 (10.0%) |
Employment Status by Educational Attainment in Biglerville borough
According to labor force statistics for Biglerville borough, 82.2% of individuals (453) out of the total population between 25 and 64 years of age (551) are in the labor force, with 1.8% or 8 of them being unemployed. The group with the highest labor force participation rate are those with the educational attainment of bachelor's degree or higher, with 93.3% or 112 individuals in the labor force. Within the labor force, individuals with high school diploma education have the highest percentage of unemployment, with 4.7% or 8 of them being unemployed.
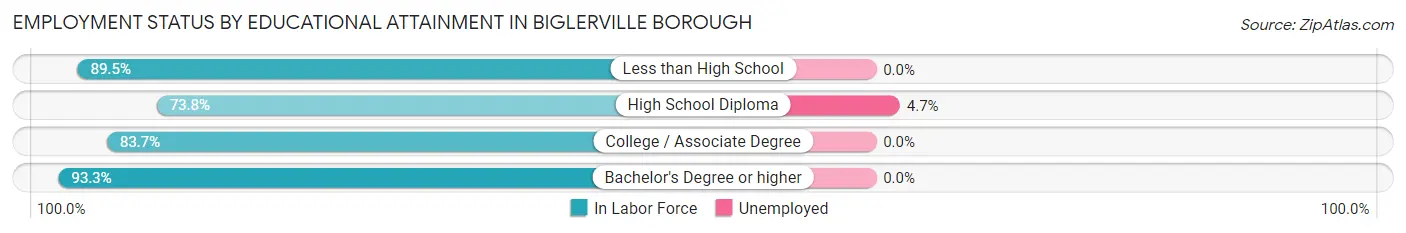
| Educational Attainment | In Labor Force | Unemployed |
| Less than High School | 51 (89.5%) | 0 (0.0%) |
| High School Diploma | 172 (73.8%) | 11 (4.7%) |
| College / Associate Degree | 118 (83.7%) | 0 (0.0%) |
| Bachelor's Degree or higher | 112 (93.3%) | 0 (0.0%) |
| Total | 453 (82.2%) | 10 (1.8%) |
Employment Occupations by Sex in Biglerville borough
Management, Business, Science and Arts Occupations
The most common Management, Business, Science and Arts occupations in Biglerville borough are Community & Social Service (58 | 9.5%), Management (50 | 8.1%), Computers, Engineering & Science (44 | 7.2%), Computers & Mathematics (30 | 4.9%), and Education Instruction & Library (24 | 3.9%).
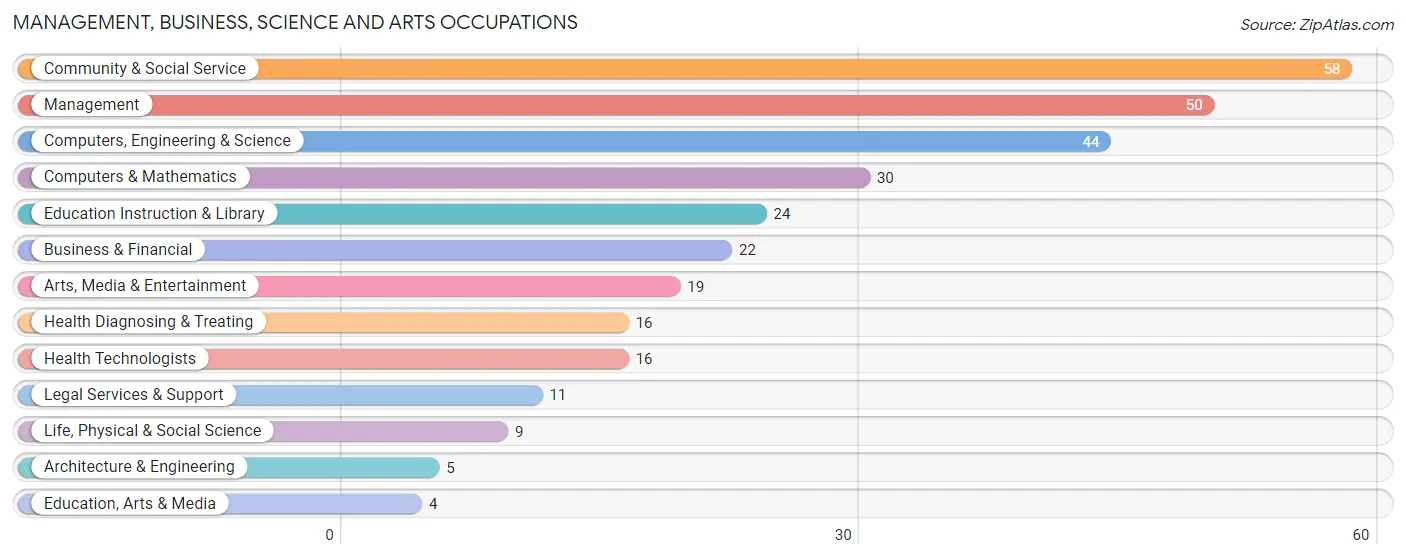
Management, Business, Science and Arts Occupations by Sex
Within the Management, Business, Science and Arts occupations in Biglerville borough, the most male-oriented occupations are Computers & Mathematics (100.0%), Architecture & Engineering (100.0%), and Computers, Engineering & Science (86.4%), while the most female-oriented occupations are Education, Arts & Media (75.0%), Education Instruction & Library (70.8%), and Health Diagnosing & Treating (68.8%).
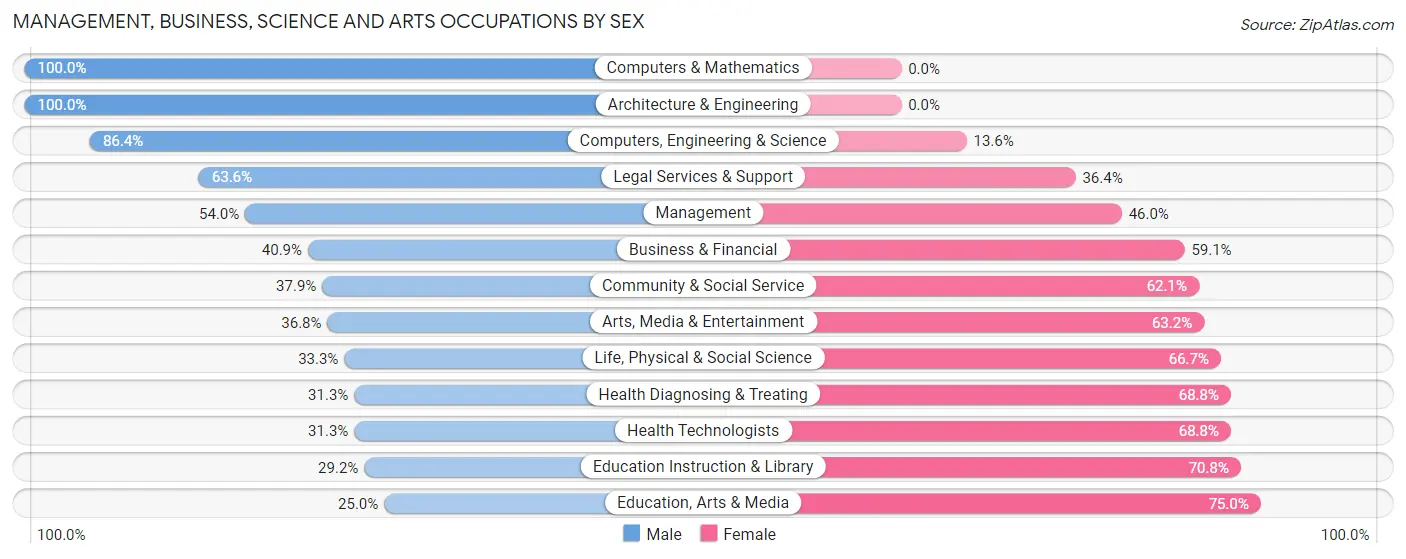
| Occupation | Male | Female |
| Management | 27 (54.0%) | 23 (46.0%) |
| Business & Financial | 9 (40.9%) | 13 (59.1%) |
| Computers, Engineering & Science | 38 (86.4%) | 6 (13.6%) |
| Computers & Mathematics | 30 (100.0%) | 0 (0.0%) |
| Architecture & Engineering | 5 (100.0%) | 0 (0.0%) |
| Life, Physical & Social Science | 3 (33.3%) | 6 (66.7%) |
| Community & Social Service | 22 (37.9%) | 36 (62.1%) |
| Education, Arts & Media | 1 (25.0%) | 3 (75.0%) |
| Legal Services & Support | 7 (63.6%) | 4 (36.4%) |
| Education Instruction & Library | 7 (29.2%) | 17 (70.8%) |
| Arts, Media & Entertainment | 7 (36.8%) | 12 (63.2%) |
| Health Diagnosing & Treating | 5 (31.2%) | 11 (68.8%) |
| Health Technologists | 5 (31.2%) | 11 (68.8%) |
| Total (Category) | 101 (53.2%) | 89 (46.8%) |
| Total (Overall) | 262 (42.7%) | 352 (57.3%) |
Services Occupations
The most common Services occupations in Biglerville borough are Food Preparation & Serving (34 | 5.5%), Cleaning & Maintenance (11 | 1.8%), Healthcare Support (6 | 1.0%), and Personal Care & Service (2 | 0.3%).
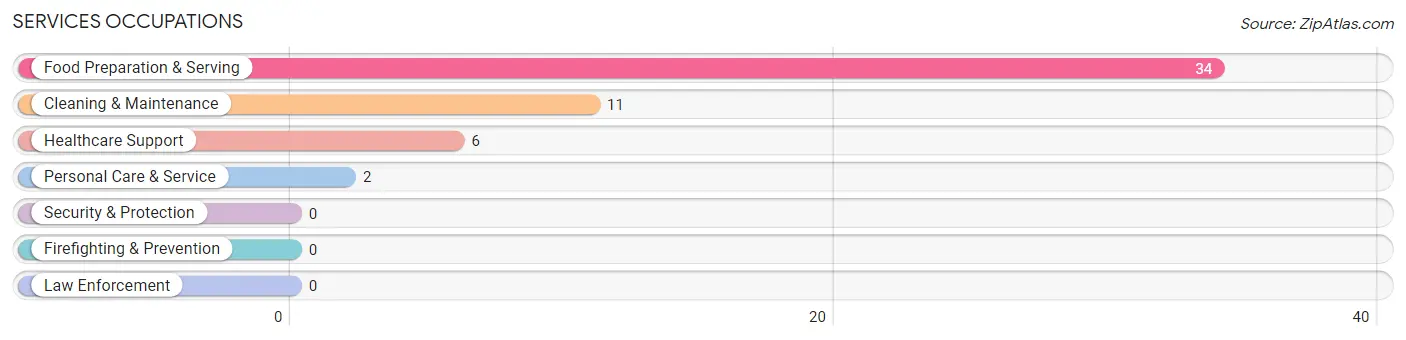
Services Occupations by Sex
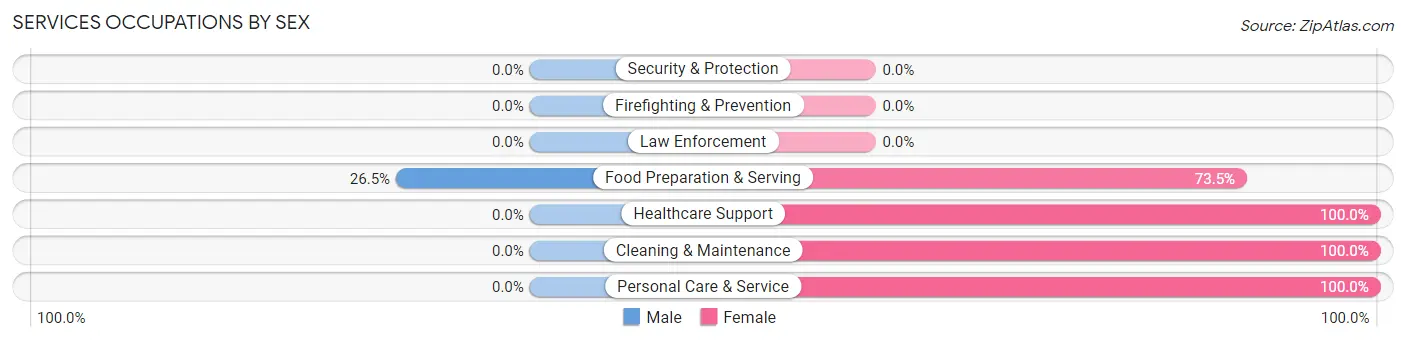
| Occupation | Male | Female |
| Healthcare Support | 0 (0.0%) | 6 (100.0%) |
| Security & Protection | 0 (0.0%) | 0 (0.0%) |
| Firefighting & Prevention | 0 (0.0%) | 0 (0.0%) |
| Law Enforcement | 0 (0.0%) | 0 (0.0%) |
| Food Preparation & Serving | 9 (26.5%) | 25 (73.5%) |
| Cleaning & Maintenance | 0 (0.0%) | 11 (100.0%) |
| Personal Care & Service | 0 (0.0%) | 2 (100.0%) |
| Total (Category) | 9 (17.0%) | 44 (83.0%) |
| Total (Overall) | 262 (42.7%) | 352 (57.3%) |
Sales and Office Occupations
The most common Sales and Office occupations in Biglerville borough are Office & Administration (115 | 18.7%), and Sales & Related (54 | 8.8%).
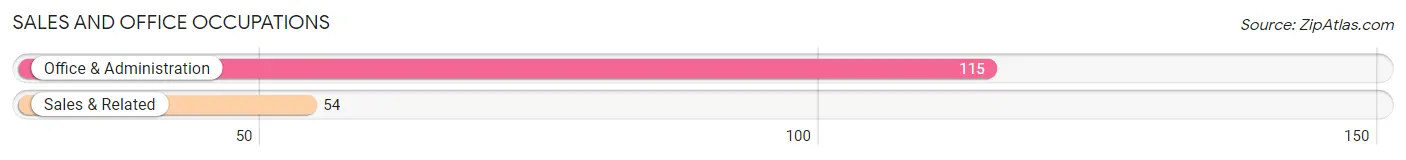
Sales and Office Occupations by Sex
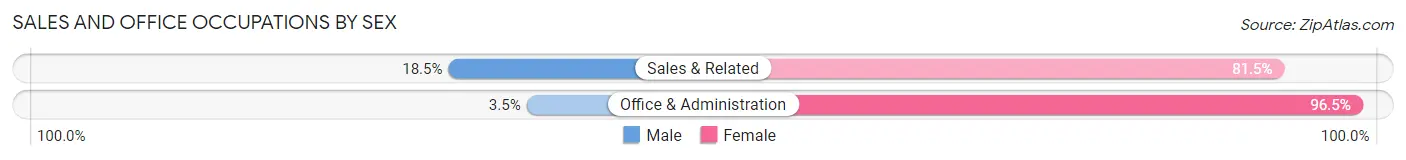
| Occupation | Male | Female |
| Sales & Related | 10 (18.5%) | 44 (81.5%) |
| Office & Administration | 4 (3.5%) | 111 (96.5%) |
| Total (Category) | 14 (8.3%) | 155 (91.7%) |
| Total (Overall) | 262 (42.7%) | 352 (57.3%) |
Natural Resources, Construction and Maintenance Occupations
The most common Natural Resources, Construction and Maintenance occupations in Biglerville borough are Construction & Extraction (27 | 4.4%), and Installation, Maintenance & Repair (6 | 1.0%).
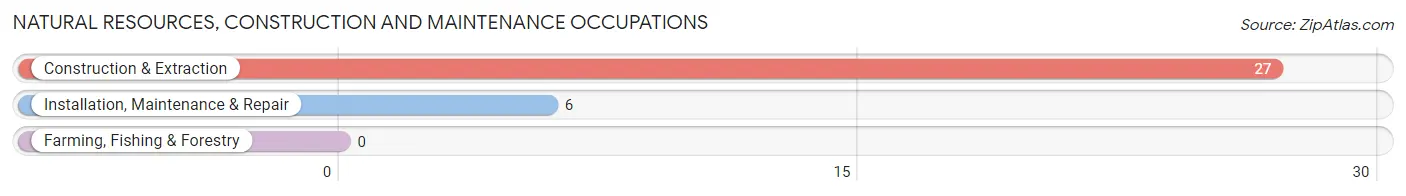
Natural Resources, Construction and Maintenance Occupations by Sex

| Occupation | Male | Female |
| Farming, Fishing & Forestry | 0 (0.0%) | 0 (0.0%) |
| Construction & Extraction | 27 (100.0%) | 0 (0.0%) |
| Installation, Maintenance & Repair | 6 (100.0%) | 0 (0.0%) |
| Total (Category) | 33 (100.0%) | 0 (0.0%) |
| Total (Overall) | 262 (42.7%) | 352 (57.3%) |
Production, Transportation and Moving Occupations
The most common Production, Transportation and Moving occupations in Biglerville borough are Production (77 | 12.5%), Material Moving (58 | 9.5%), and Transportation (34 | 5.5%).
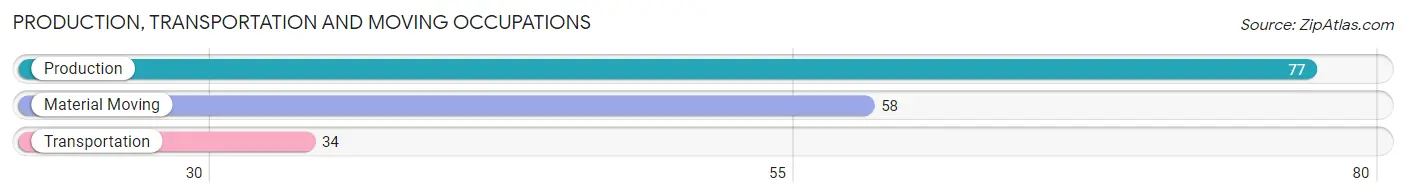
Production, Transportation and Moving Occupations by Sex
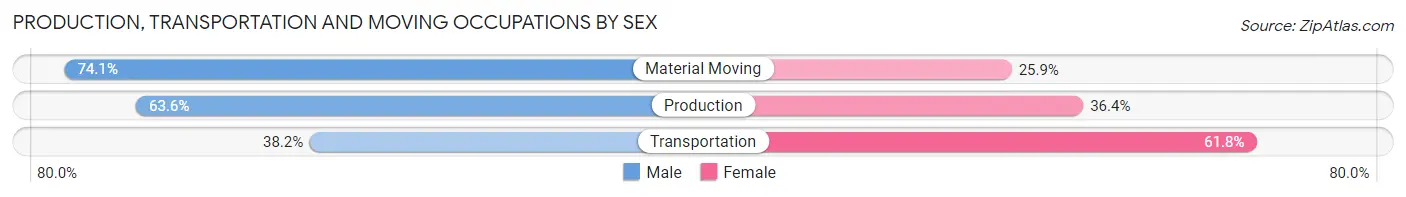
| Occupation | Male | Female |
| Production | 49 (63.6%) | 28 (36.4%) |
| Transportation | 13 (38.2%) | 21 (61.8%) |
| Material Moving | 43 (74.1%) | 15 (25.9%) |
| Total (Category) | 105 (62.1%) | 64 (37.9%) |
| Total (Overall) | 262 (42.7%) | 352 (57.3%) |
Employment Industries by Sex in Biglerville borough
Employment Industries in Biglerville borough
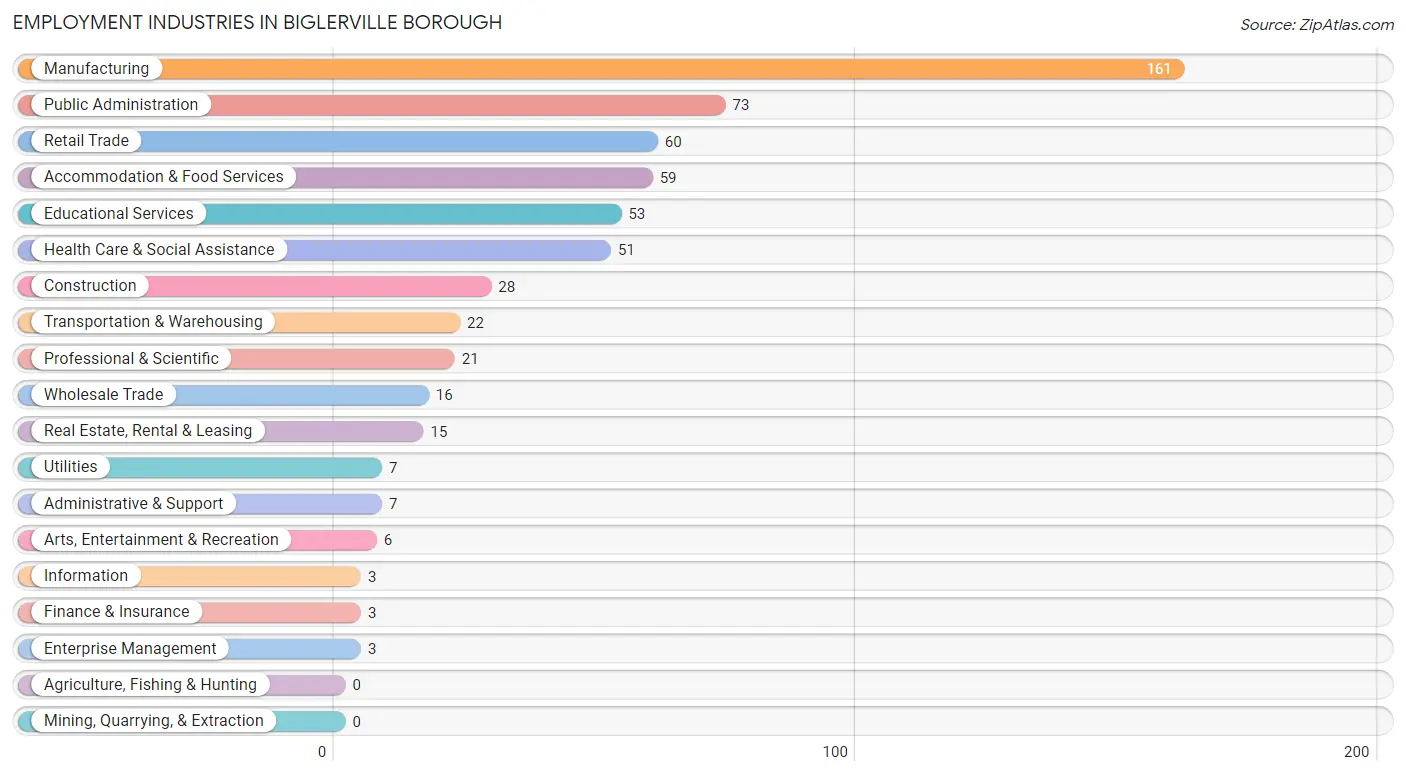
The major employment industries in Biglerville borough include Manufacturing (161 | 26.2%), Public Administration (73 | 11.9%), Retail Trade (60 | 9.8%), Accommodation & Food Services (59 | 9.6%), and Educational Services (53 | 8.6%).
Employment Industries by Sex in Biglerville borough
The Biglerville borough industries that see more men than women are Construction (100.0%), Wholesale Trade (100.0%), and Information (100.0%), whereas the industries that tend to have a higher number of women are Finance & Insurance (100.0%), Enterprise Management (100.0%), and Transportation & Warehousing (90.9%).
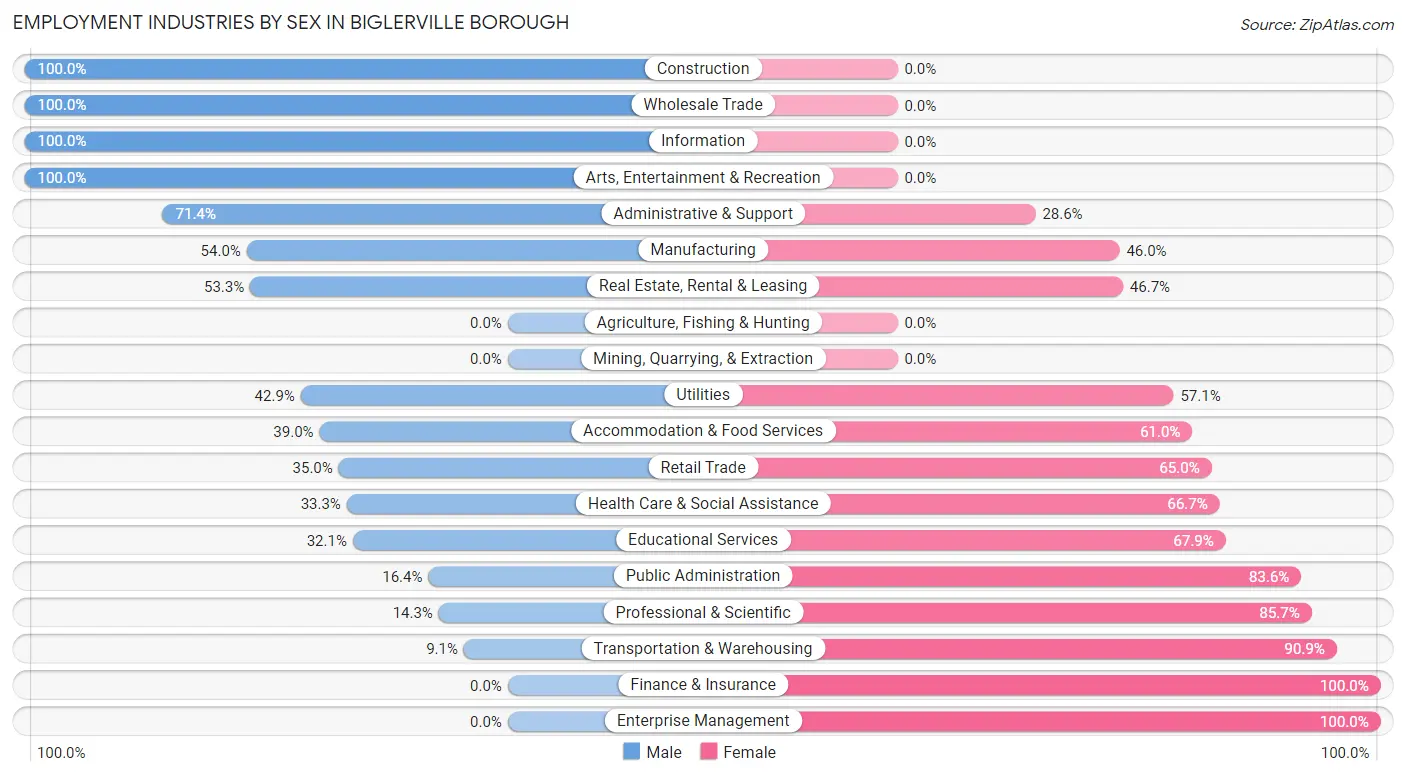
| Industry | Male | Female |
| Agriculture, Fishing & Hunting | 0 (0.0%) | 0 (0.0%) |
| Mining, Quarrying, & Extraction | 0 (0.0%) | 0 (0.0%) |
| Construction | 28 (100.0%) | 0 (0.0%) |
| Manufacturing | 87 (54.0%) | 74 (46.0%) |
| Wholesale Trade | 16 (100.0%) | 0 (0.0%) |
| Retail Trade | 21 (35.0%) | 39 (65.0%) |
| Transportation & Warehousing | 2 (9.1%) | 20 (90.9%) |
| Utilities | 3 (42.9%) | 4 (57.1%) |
| Information | 3 (100.0%) | 0 (0.0%) |
| Finance & Insurance | 0 (0.0%) | 3 (100.0%) |
| Real Estate, Rental & Leasing | 8 (53.3%) | 7 (46.7%) |
| Professional & Scientific | 3 (14.3%) | 18 (85.7%) |
| Enterprise Management | 0 (0.0%) | 3 (100.0%) |
| Administrative & Support | 5 (71.4%) | 2 (28.6%) |
| Educational Services | 17 (32.1%) | 36 (67.9%) |
| Health Care & Social Assistance | 17 (33.3%) | 34 (66.7%) |
| Arts, Entertainment & Recreation | 6 (100.0%) | 0 (0.0%) |
| Accommodation & Food Services | 23 (39.0%) | 36 (61.0%) |
| Public Administration | 12 (16.4%) | 61 (83.6%) |
| Total | 262 (42.7%) | 352 (57.3%) |
Education in Biglerville borough
School Enrollment in Biglerville borough
The most common levels of schooling among the 267 students in Biglerville borough are middle school (88 | 33.0%), high school (83 | 31.1%), and elementary school (31 | 11.6%).
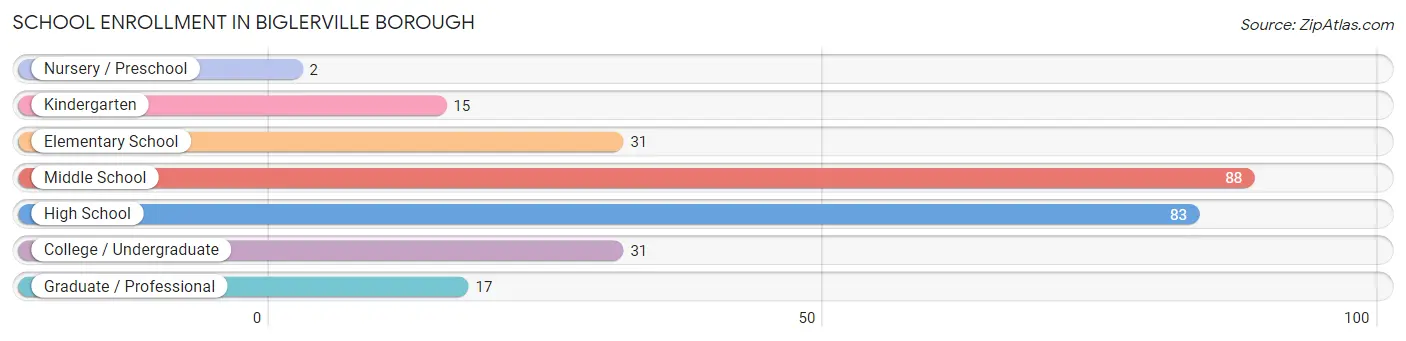
| School Level | # Students | % Students |
| Nursery / Preschool | 2 | 0.7% |
| Kindergarten | 15 | 5.6% |
| Elementary School | 31 | 11.6% |
| Middle School | 88 | 33.0% |
| High School | 83 | 31.1% |
| College / Undergraduate | 31 | 11.6% |
| Graduate / Professional | 17 | 6.4% |
| Total | 267 | 100.0% |
School Enrollment by Age by Funding Source in Biglerville borough
Out of a total of 267 students who are enrolled in schools in Biglerville borough, 26 (9.7%) attend a private institution, while the remaining 241 (90.3%) are enrolled in public schools. The age group of 3 to 4 year olds has the highest likelihood of being enrolled in private schools, with 2 (100.0% in the age bracket) enrolled. Conversely, the age group of 15 to 17 year olds has the lowest likelihood of being enrolled in a private school, with 47 (100.0% in the age bracket) attending a public institution.
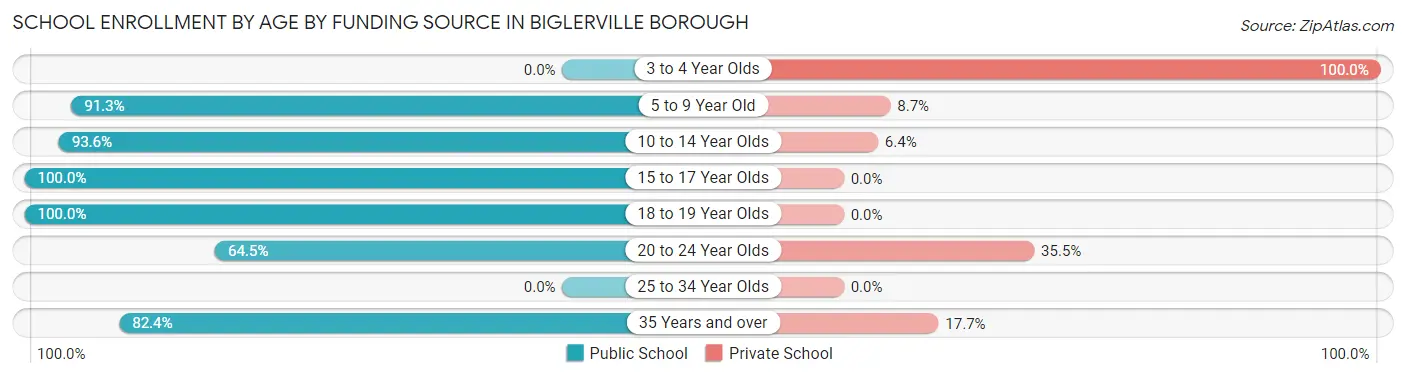
| Age Bracket | Public School | Private School |
| 3 to 4 Year Olds | 0 (0.0%) | 2 (100.0%) |
| 5 to 9 Year Old | 42 (91.3%) | 4 (8.7%) |
| 10 to 14 Year Olds | 88 (93.6%) | 6 (6.4%) |
| 15 to 17 Year Olds | 47 (100.0%) | 0 (0.0%) |
| 18 to 19 Year Olds | 30 (100.0%) | 0 (0.0%) |
| 20 to 24 Year Olds | 20 (64.5%) | 11 (35.5%) |
| 25 to 34 Year Olds | 0 (0.0%) | 0 (0.0%) |
| 35 Years and over | 14 (82.4%) | 3 (17.6%) |
| Total | 241 (90.3%) | 26 (9.7%) |
Educational Attainment by Field of Study in Biglerville borough
Business (34 | 21.7%), education (21 | 13.4%), social sciences (17 | 10.8%), science & technology (13 | 8.3%), and visual & performing arts (12 | 7.6%) are the most common fields of study among 157 individuals in Biglerville borough who have obtained a bachelor's degree or higher.
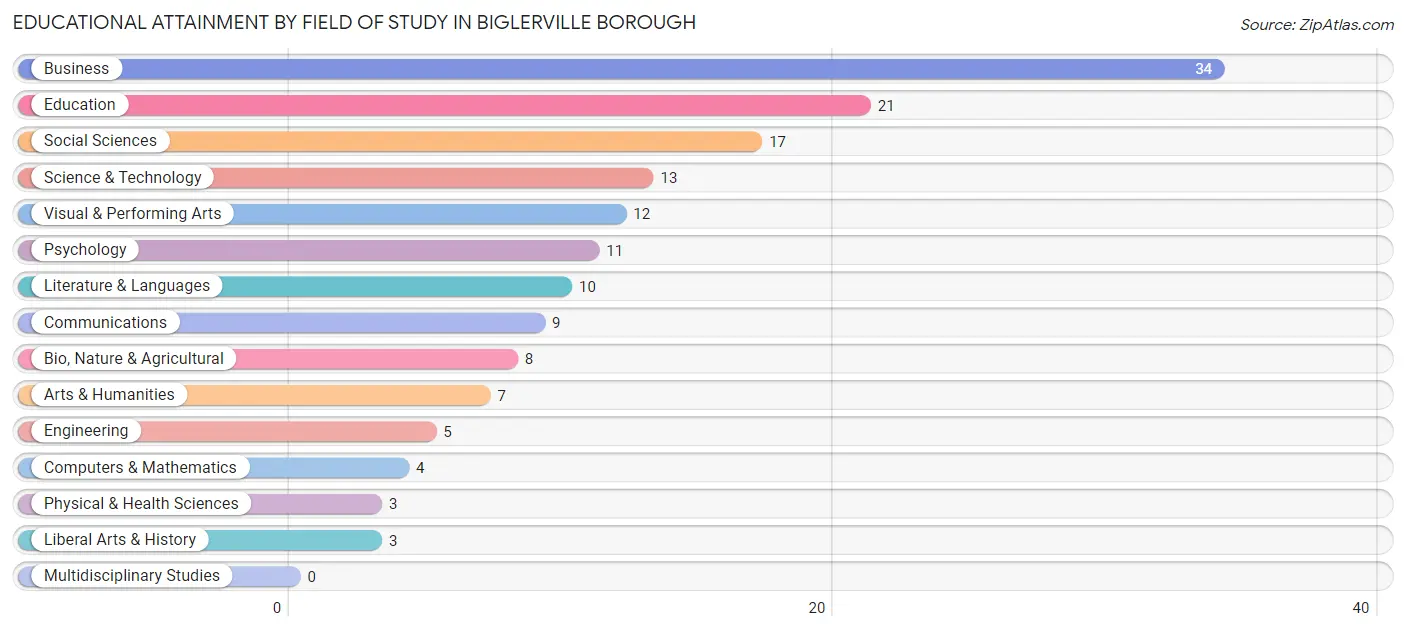
| Field of Study | # Graduates | % Graduates |
| Computers & Mathematics | 4 | 2.5% |
| Bio, Nature & Agricultural | 8 | 5.1% |
| Physical & Health Sciences | 3 | 1.9% |
| Psychology | 11 | 7.0% |
| Social Sciences | 17 | 10.8% |
| Engineering | 5 | 3.2% |
| Multidisciplinary Studies | 0 | 0.0% |
| Science & Technology | 13 | 8.3% |
| Business | 34 | 21.7% |
| Education | 21 | 13.4% |
| Literature & Languages | 10 | 6.4% |
| Liberal Arts & History | 3 | 1.9% |
| Visual & Performing Arts | 12 | 7.6% |
| Communications | 9 | 5.7% |
| Arts & Humanities | 7 | 4.5% |
| Total | 157 | 100.0% |
Transportation & Commute in Biglerville borough
Vehicle Availability by Sex in Biglerville borough
The most prevalent vehicle ownership categories in Biglerville borough are males with 3 vehicles (95, accounting for 36.4%) and females with 3 vehicles (78, making up 27.5%).
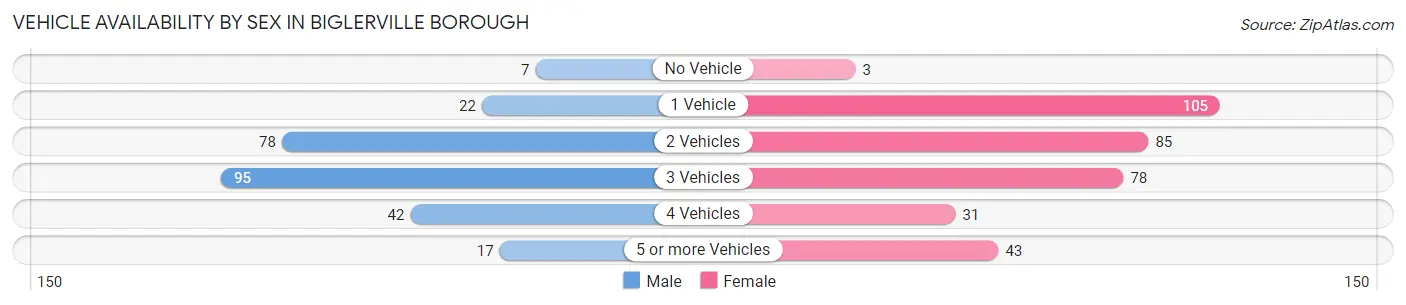
| Vehicles Available | Male | Female |
| No Vehicle | 7 (2.7%) | 3 (0.9%) |
| 1 Vehicle | 22 (8.4%) | 105 (30.4%) |
| 2 Vehicles | 78 (29.9%) | 85 (24.6%) |
| 3 Vehicles | 95 (36.4%) | 78 (22.6%) |
| 4 Vehicles | 42 (16.1%) | 31 (9.0%) |
| 5 or more Vehicles | 17 (6.5%) | 43 (12.5%) |
| Total | 261 (100.0%) | 345 (100.0%) |
Commute Time in Biglerville borough
The most frequently occuring commute durations in Biglerville borough are 30 to 34 minutes (100 commuters, 17.2%), 15 to 19 minutes (85 commuters, 14.6%), and 35 to 39 minutes (75 commuters, 12.9%).
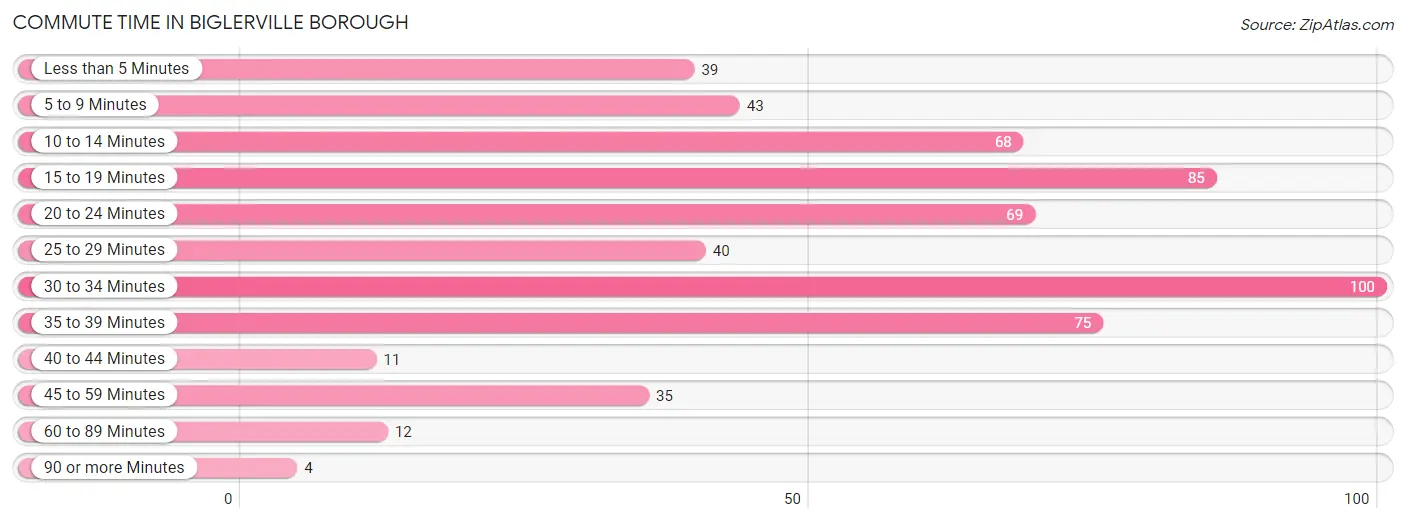
| Commute Time | # Commuters | % Commuters |
| Less than 5 Minutes | 39 | 6.7% |
| 5 to 9 Minutes | 43 | 7.4% |
| 10 to 14 Minutes | 68 | 11.7% |
| 15 to 19 Minutes | 85 | 14.6% |
| 20 to 24 Minutes | 69 | 11.9% |
| 25 to 29 Minutes | 40 | 6.9% |
| 30 to 34 Minutes | 100 | 17.2% |
| 35 to 39 Minutes | 75 | 12.9% |
| 40 to 44 Minutes | 11 | 1.9% |
| 45 to 59 Minutes | 35 | 6.0% |
| 60 to 89 Minutes | 12 | 2.1% |
| 90 or more Minutes | 4 | 0.7% |
Commute Time by Sex in Biglerville borough
The most common commute times in Biglerville borough are 30 to 34 minutes (63 commuters, 25.0%) for males and 15 to 19 minutes (63 commuters, 19.2%) for females.
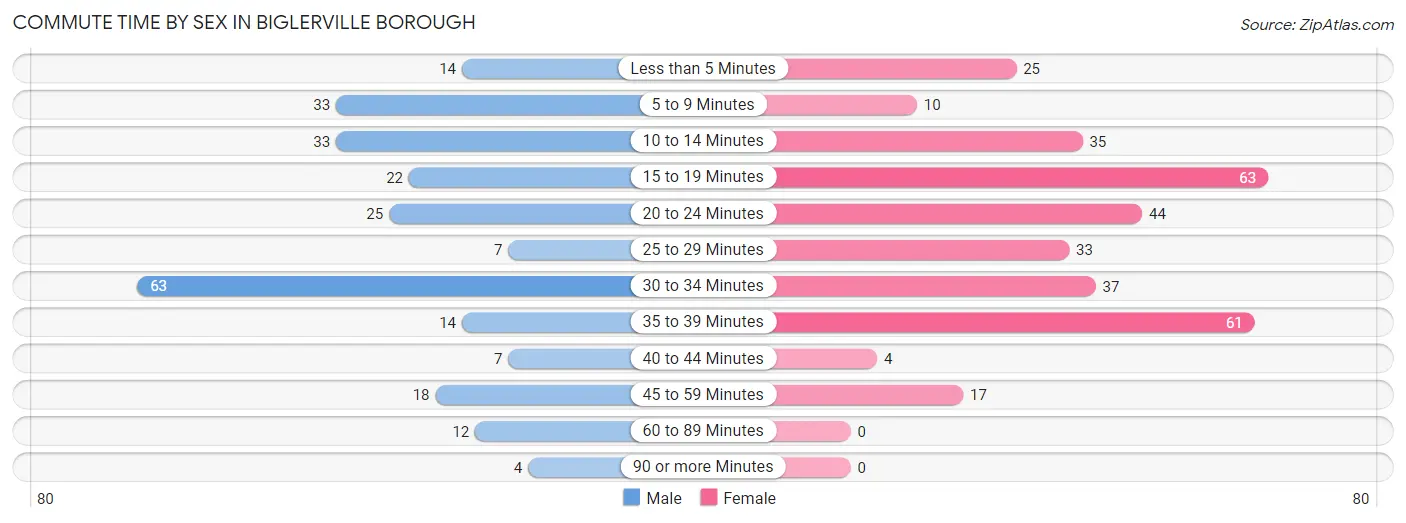
| Commute Time | Male | Female |
| Less than 5 Minutes | 14 (5.6%) | 25 (7.6%) |
| 5 to 9 Minutes | 33 (13.1%) | 10 (3.0%) |
| 10 to 14 Minutes | 33 (13.1%) | 35 (10.6%) |
| 15 to 19 Minutes | 22 (8.7%) | 63 (19.2%) |
| 20 to 24 Minutes | 25 (9.9%) | 44 (13.4%) |
| 25 to 29 Minutes | 7 (2.8%) | 33 (10.0%) |
| 30 to 34 Minutes | 63 (25.0%) | 37 (11.3%) |
| 35 to 39 Minutes | 14 (5.6%) | 61 (18.5%) |
| 40 to 44 Minutes | 7 (2.8%) | 4 (1.2%) |
| 45 to 59 Minutes | 18 (7.1%) | 17 (5.2%) |
| 60 to 89 Minutes | 12 (4.8%) | 0 (0.0%) |
| 90 or more Minutes | 4 (1.6%) | 0 (0.0%) |
Time of Departure to Work by Sex in Biglerville borough
The most frequent times of departure to work in Biglerville borough are 6:00 AM to 6:29 AM (61, 24.2%) for males and 6:00 AM to 6:29 AM (69, 21.0%) for females.
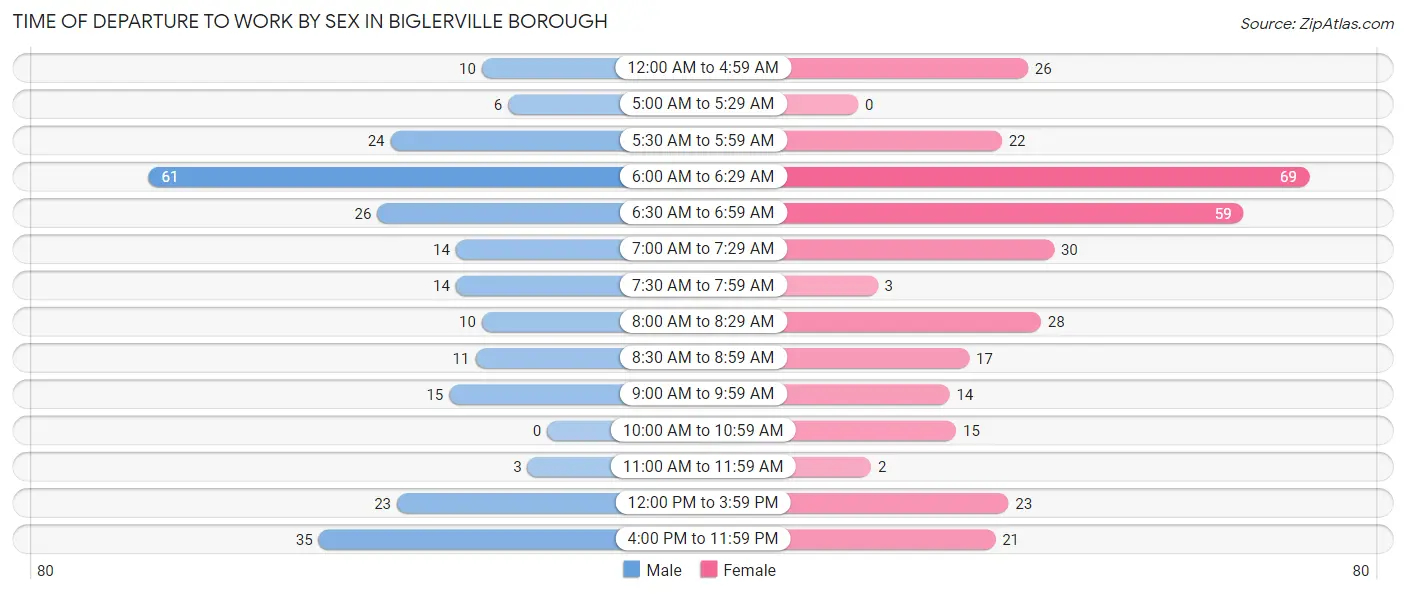
| Time of Departure | Male | Female |
| 12:00 AM to 4:59 AM | 10 (4.0%) | 26 (7.9%) |
| 5:00 AM to 5:29 AM | 6 (2.4%) | 0 (0.0%) |
| 5:30 AM to 5:59 AM | 24 (9.5%) | 22 (6.7%) |
| 6:00 AM to 6:29 AM | 61 (24.2%) | 69 (21.0%) |
| 6:30 AM to 6:59 AM | 26 (10.3%) | 59 (17.9%) |
| 7:00 AM to 7:29 AM | 14 (5.6%) | 30 (9.1%) |
| 7:30 AM to 7:59 AM | 14 (5.6%) | 3 (0.9%) |
| 8:00 AM to 8:29 AM | 10 (4.0%) | 28 (8.5%) |
| 8:30 AM to 8:59 AM | 11 (4.4%) | 17 (5.2%) |
| 9:00 AM to 9:59 AM | 15 (5.9%) | 14 (4.3%) |
| 10:00 AM to 10:59 AM | 0 (0.0%) | 15 (4.6%) |
| 11:00 AM to 11:59 AM | 3 (1.2%) | 2 (0.6%) |
| 12:00 PM to 3:59 PM | 23 (9.1%) | 23 (7.0%) |
| 4:00 PM to 11:59 PM | 35 (13.9%) | 21 (6.4%) |
| Total | 252 (100.0%) | 329 (100.0%) |
Housing Occupancy in Biglerville borough
Occupancy by Ownership in Biglerville borough
Of the total 504 dwellings in Biglerville borough, owner-occupied units account for 310 (61.5%), while renter-occupied units make up 194 (38.5%).
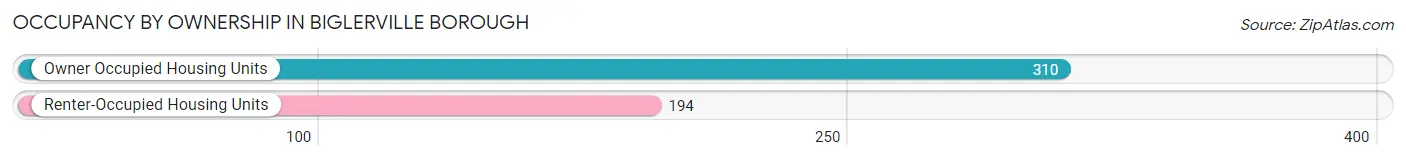
| Occupancy | # Housing Units | % Housing Units |
| Owner Occupied Housing Units | 310 | 61.5% |
| Renter-Occupied Housing Units | 194 | 38.5% |
| Total Occupied Housing Units | 504 | 100.0% |
Occupancy by Household Size in Biglerville borough
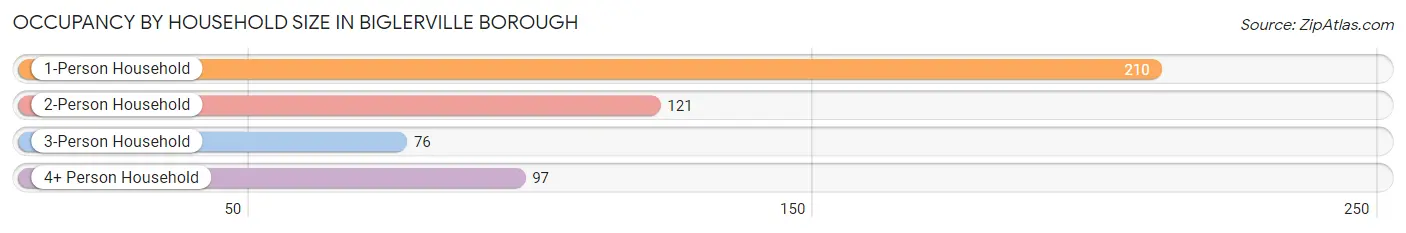
| Household Size | # Housing Units | % Housing Units |
| 1-Person Household | 210 | 41.7% |
| 2-Person Household | 121 | 24.0% |
| 3-Person Household | 76 | 15.1% |
| 4+ Person Household | 97 | 19.3% |
| Total Housing Units | 504 | 100.0% |
Occupancy by Ownership by Household Size in Biglerville borough
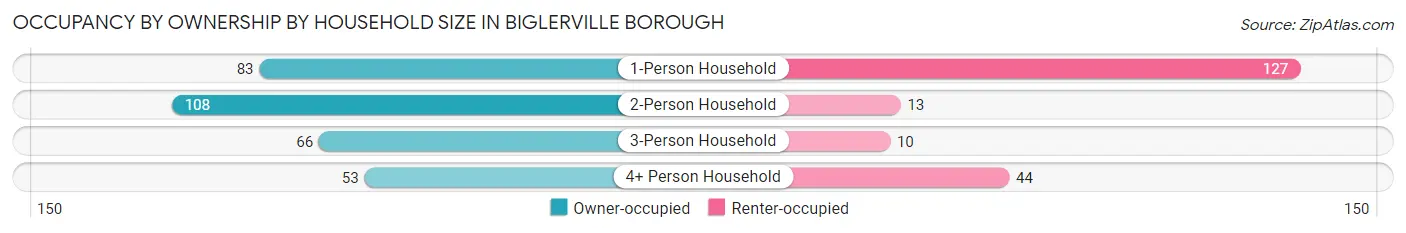
| Household Size | Owner-occupied | Renter-occupied |
| 1-Person Household | 83 (39.5%) | 127 (60.5%) |
| 2-Person Household | 108 (89.3%) | 13 (10.7%) |
| 3-Person Household | 66 (86.8%) | 10 (13.2%) |
| 4+ Person Household | 53 (54.6%) | 44 (45.4%) |
| Total Housing Units | 310 (61.5%) | 194 (38.5%) |
Occupancy by Educational Attainment in Biglerville borough
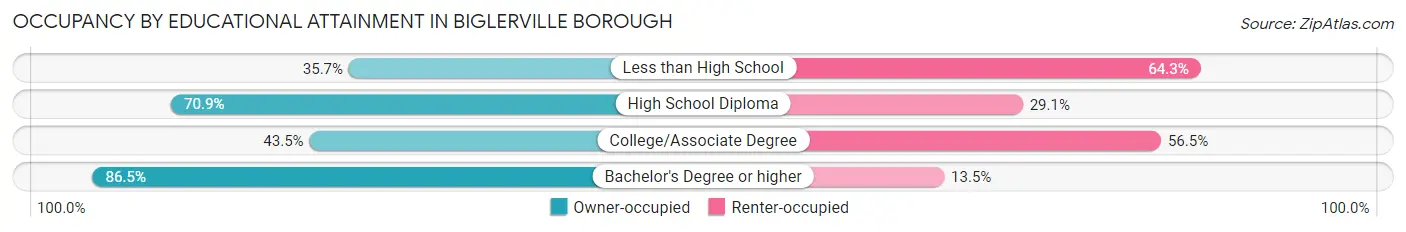
| Household Size | Owner-occupied | Renter-occupied |
| Less than High School | 15 (35.7%) | 27 (64.3%) |
| High School Diploma | 144 (70.9%) | 59 (29.1%) |
| College/Associate Degree | 74 (43.5%) | 96 (56.5%) |
| Bachelor's Degree or higher | 77 (86.5%) | 12 (13.5%) |
Occupancy by Age of Householder in Biglerville borough
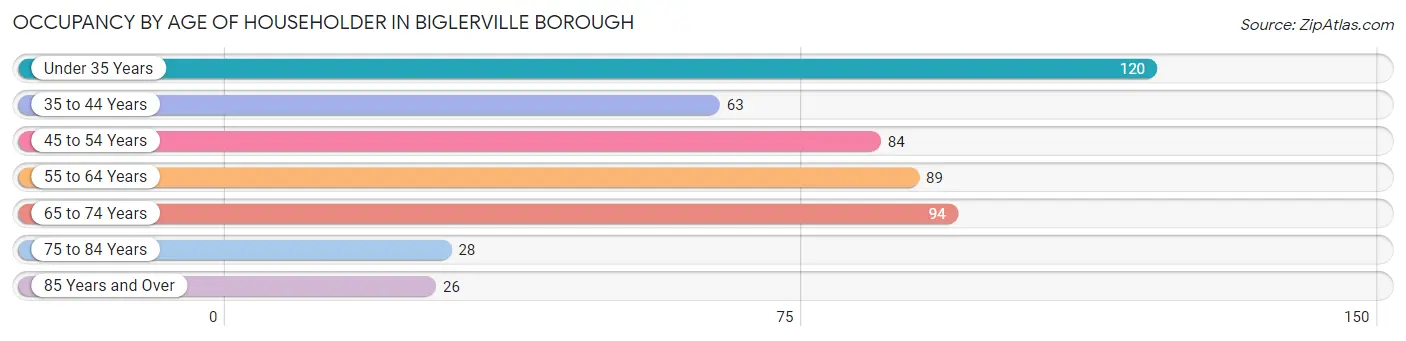
| Age Bracket | # Households | % Households |
| Under 35 Years | 120 | 23.8% |
| 35 to 44 Years | 63 | 12.5% |
| 45 to 54 Years | 84 | 16.7% |
| 55 to 64 Years | 89 | 17.7% |
| 65 to 74 Years | 94 | 18.6% |
| 75 to 84 Years | 28 | 5.6% |
| 85 Years and Over | 26 | 5.2% |
| Total | 504 | 100.0% |
Housing Finances in Biglerville borough
Median Income by Occupancy in Biglerville borough
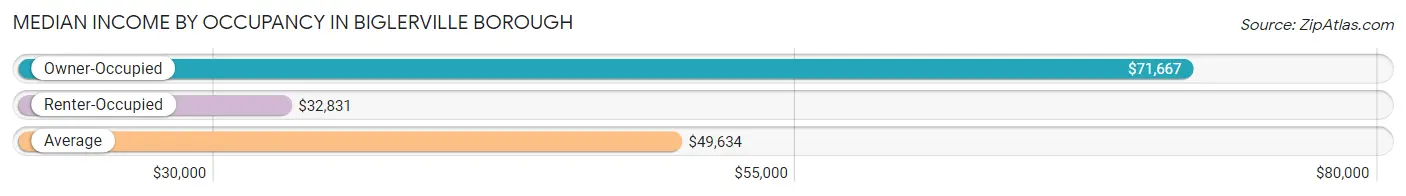
| Occupancy Type | # Households | Median Income |
| Owner-Occupied | 310 (61.5%) | $71,667 |
| Renter-Occupied | 194 (38.5%) | $32,831 |
| Average | 504 (100.0%) | $49,634 |
Occupancy by Householder Income Bracket in Biglerville borough
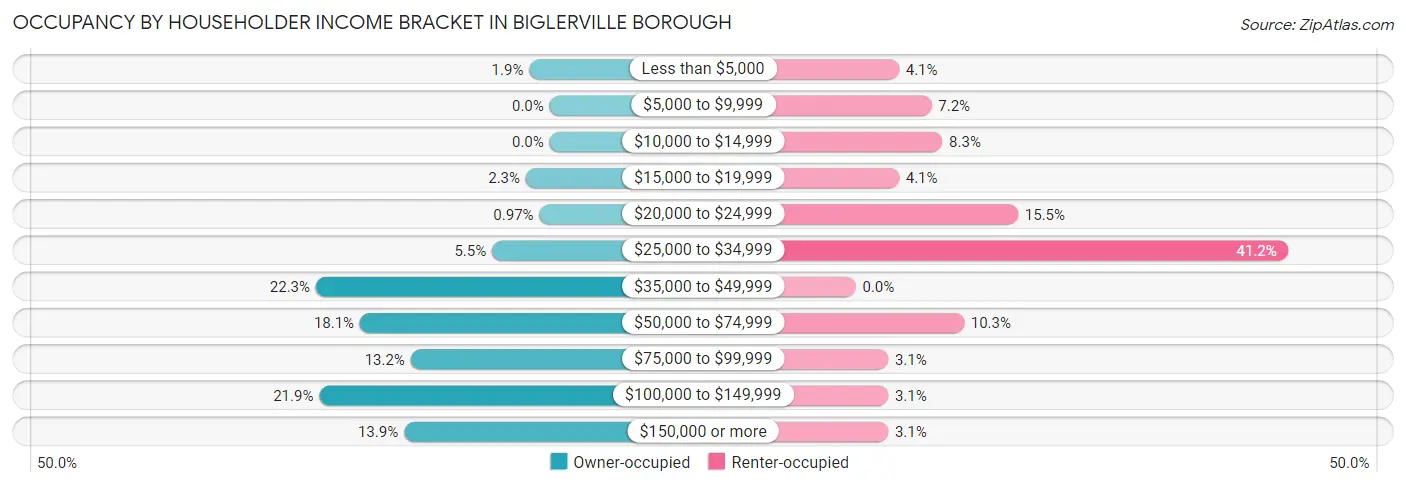
| Income Bracket | Owner-occupied | Renter-occupied |
| Less than $5,000 | 6 (1.9%) | 8 (4.1%) |
| $5,000 to $9,999 | 0 (0.0%) | 14 (7.2%) |
| $10,000 to $14,999 | 0 (0.0%) | 16 (8.3%) |
| $15,000 to $19,999 | 7 (2.3%) | 8 (4.1%) |
| $20,000 to $24,999 | 3 (1.0%) | 30 (15.5%) |
| $25,000 to $34,999 | 17 (5.5%) | 80 (41.2%) |
| $35,000 to $49,999 | 69 (22.3%) | 0 (0.0%) |
| $50,000 to $74,999 | 56 (18.1%) | 20 (10.3%) |
| $75,000 to $99,999 | 41 (13.2%) | 6 (3.1%) |
| $100,000 to $149,999 | 68 (21.9%) | 6 (3.1%) |
| $150,000 or more | 43 (13.9%) | 6 (3.1%) |
| Total | 310 (100.0%) | 194 (100.0%) |
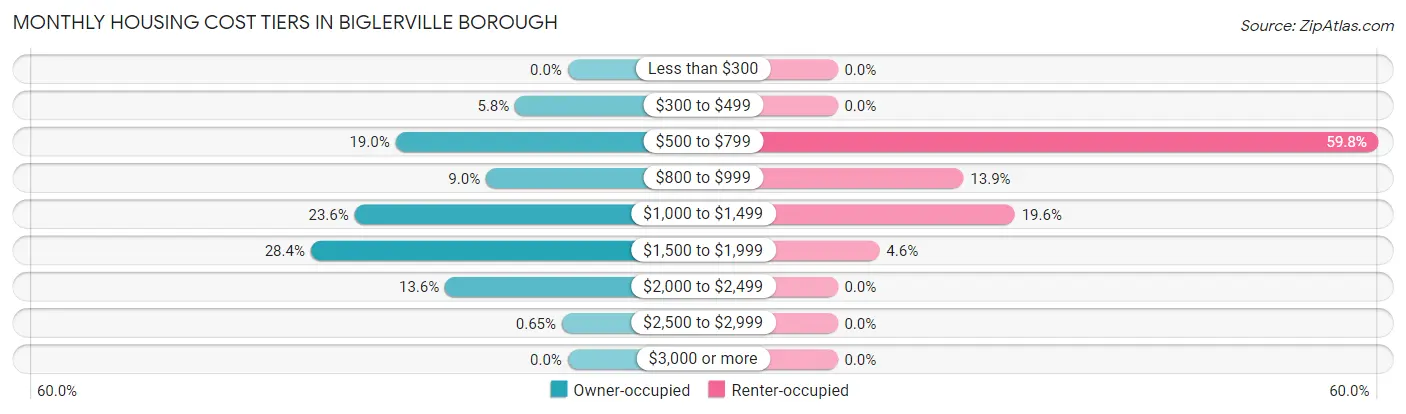
Monthly Housing Cost Tiers in Biglerville borough
| Monthly Cost | Owner-occupied | Renter-occupied |
| Less than $300 | 0 (0.0%) | 0 (0.0%) |
| $300 to $499 | 18 (5.8%) | 0 (0.0%) |
| $500 to $799 | 59 (19.0%) | 116 (59.8%) |
| $800 to $999 | 28 (9.0%) | 27 (13.9%) |
| $1,000 to $1,499 | 73 (23.5%) | 38 (19.6%) |
| $1,500 to $1,999 | 88 (28.4%) | 9 (4.6%) |
| $2,000 to $2,499 | 42 (13.6%) | 0 (0.0%) |
| $2,500 to $2,999 | 2 (0.6%) | 0 (0.0%) |
| $3,000 or more | 0 (0.0%) | 0 (0.0%) |
| Total | 310 (100.0%) | 194 (100.0%) |
Physical Housing Characteristics in Biglerville borough
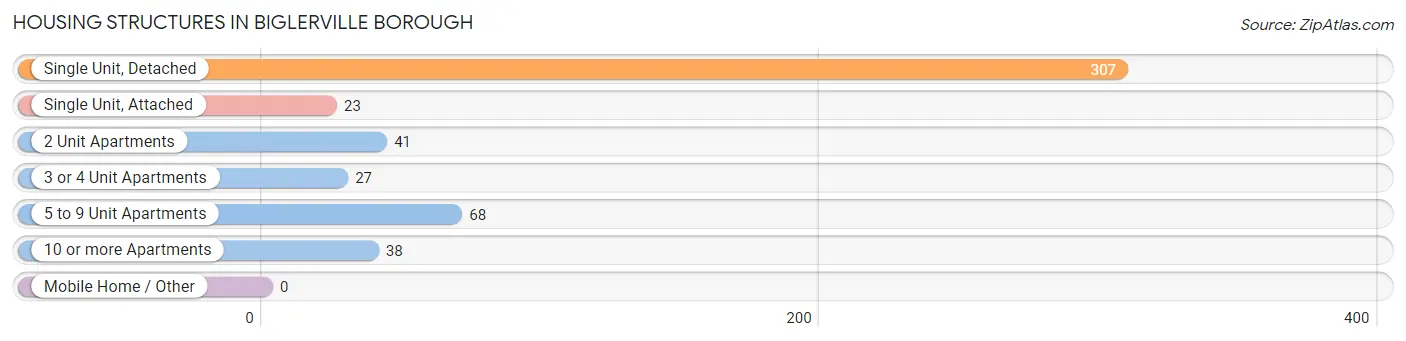
Housing Structures in Biglerville borough
| Structure Type | # Housing Units | % Housing Units |
| Single Unit, Detached | 307 | 60.9% |
| Single Unit, Attached | 23 | 4.6% |
| 2 Unit Apartments | 41 | 8.1% |
| 3 or 4 Unit Apartments | 27 | 5.4% |
| 5 to 9 Unit Apartments | 68 | 13.5% |
| 10 or more Apartments | 38 | 7.5% |
| Mobile Home / Other | 0 | 0.0% |
| Total | 504 | 100.0% |
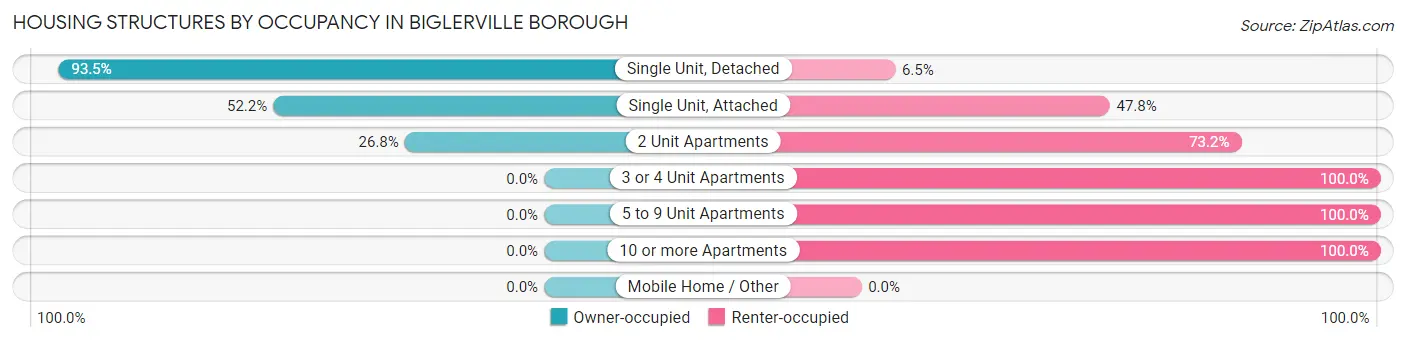
Housing Structures by Occupancy in Biglerville borough
| Structure Type | Owner-occupied | Renter-occupied |
| Single Unit, Detached | 287 (93.5%) | 20 (6.5%) |
| Single Unit, Attached | 12 (52.2%) | 11 (47.8%) |
| 2 Unit Apartments | 11 (26.8%) | 30 (73.2%) |
| 3 or 4 Unit Apartments | 0 (0.0%) | 27 (100.0%) |
| 5 to 9 Unit Apartments | 0 (0.0%) | 68 (100.0%) |
| 10 or more Apartments | 0 (0.0%) | 38 (100.0%) |
| Mobile Home / Other | 0 (0.0%) | 0 (0.0%) |
| Total | 310 (61.5%) | 194 (38.5%) |
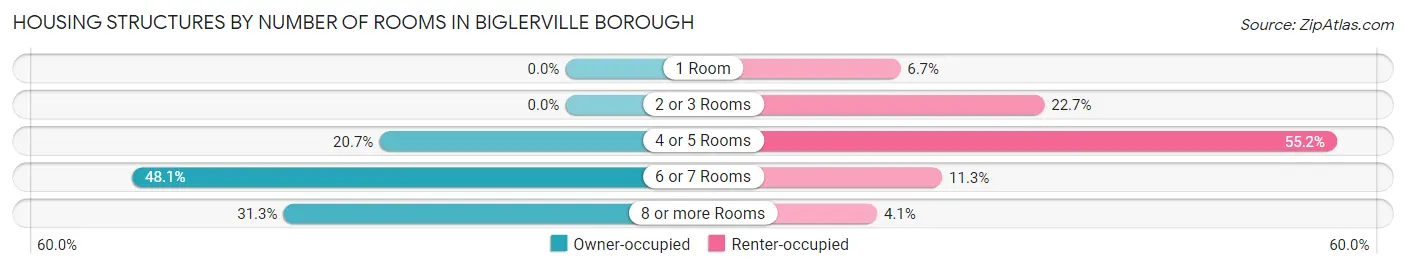
Housing Structures by Number of Rooms in Biglerville borough
| Number of Rooms | Owner-occupied | Renter-occupied |
| 1 Room | 0 (0.0%) | 13 (6.7%) |
| 2 or 3 Rooms | 0 (0.0%) | 44 (22.7%) |
| 4 or 5 Rooms | 64 (20.6%) | 107 (55.1%) |
| 6 or 7 Rooms | 149 (48.1%) | 22 (11.3%) |
| 8 or more Rooms | 97 (31.3%) | 8 (4.1%) |
| Total | 310 (100.0%) | 194 (100.0%) |
Housing Structure by Heating Type in Biglerville borough
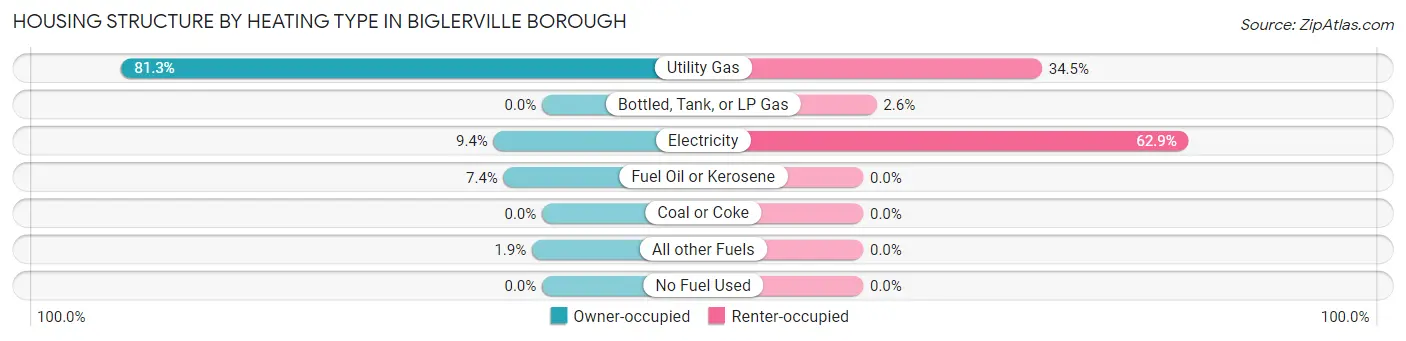
| Heating Type | Owner-occupied | Renter-occupied |
| Utility Gas | 252 (81.3%) | 67 (34.5%) |
| Bottled, Tank, or LP Gas | 0 (0.0%) | 5 (2.6%) |
| Electricity | 29 (9.3%) | 122 (62.9%) |
| Fuel Oil or Kerosene | 23 (7.4%) | 0 (0.0%) |
| Coal or Coke | 0 (0.0%) | 0 (0.0%) |
| All other Fuels | 6 (1.9%) | 0 (0.0%) |
| No Fuel Used | 0 (0.0%) | 0 (0.0%) |
| Total | 310 (100.0%) | 194 (100.0%) |
Household Vehicle Usage in Biglerville borough
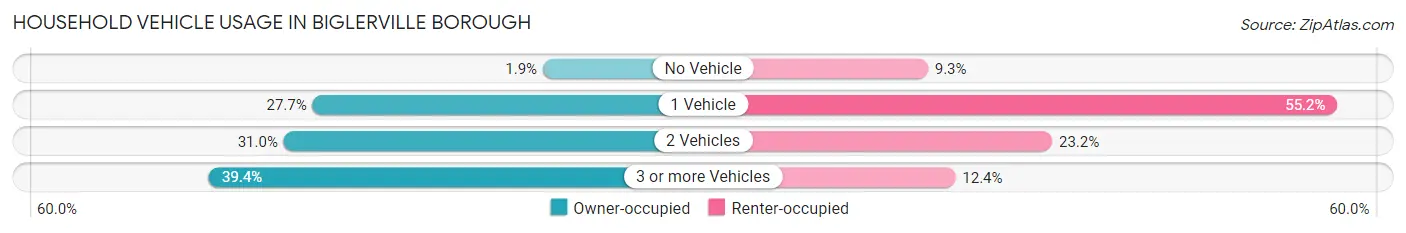
| Vehicles per Household | Owner-occupied | Renter-occupied |
| No Vehicle | 6 (1.9%) | 18 (9.3%) |
| 1 Vehicle | 86 (27.7%) | 107 (55.1%) |
| 2 Vehicles | 96 (31.0%) | 45 (23.2%) |
| 3 or more Vehicles | 122 (39.4%) | 24 (12.4%) |
| Total | 310 (100.0%) | 194 (100.0%) |
Real Estate & Mortgages in Biglerville borough
Real Estate and Mortgage Overview in Biglerville borough
| Characteristic | Without Mortgage | With Mortgage |
| Housing Units | 88 | 222 |
| Median Property Value | $176,600 | $205,200 |
| Median Household Income | $49,583 | $40 |
| Monthly Housing Costs | $644 | $0 |
| Real Estate Taxes | $2,974 | $4 |
Property Value by Mortgage Status in Biglerville borough
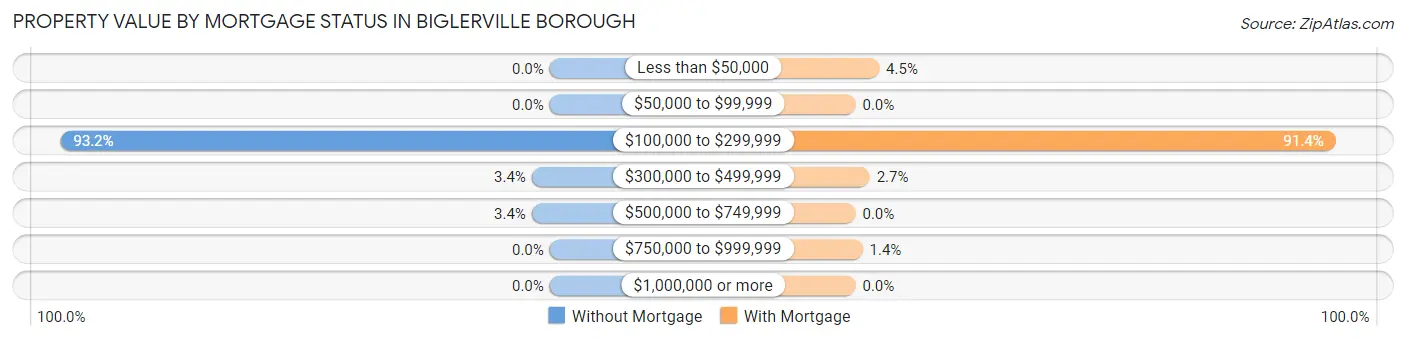
| Property Value | Without Mortgage | With Mortgage |
| Less than $50,000 | 0 (0.0%) | 10 (4.5%) |
| $50,000 to $99,999 | 0 (0.0%) | 0 (0.0%) |
| $100,000 to $299,999 | 82 (93.2%) | 203 (91.4%) |
| $300,000 to $499,999 | 3 (3.4%) | 6 (2.7%) |
| $500,000 to $749,999 | 3 (3.4%) | 0 (0.0%) |
| $750,000 to $999,999 | 0 (0.0%) | 3 (1.3%) |
| $1,000,000 or more | 0 (0.0%) | 0 (0.0%) |
| Total | 88 (100.0%) | 222 (100.0%) |
Household Income by Mortgage Status in Biglerville borough
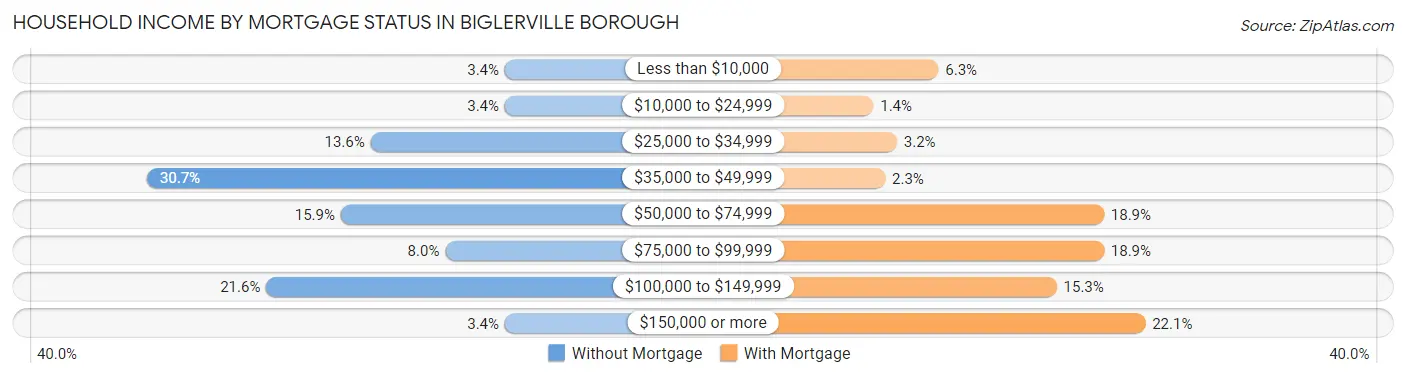
| Household Income | Without Mortgage | With Mortgage |
| Less than $10,000 | 3 (3.4%) | 14 (6.3%) |
| $10,000 to $24,999 | 3 (3.4%) | 3 (1.3%) |
| $25,000 to $34,999 | 12 (13.6%) | 7 (3.2%) |
| $35,000 to $49,999 | 27 (30.7%) | 5 (2.2%) |
| $50,000 to $74,999 | 14 (15.9%) | 42 (18.9%) |
| $75,000 to $99,999 | 7 (8.0%) | 42 (18.9%) |
| $100,000 to $149,999 | 19 (21.6%) | 34 (15.3%) |
| $150,000 or more | 3 (3.4%) | 49 (22.1%) |
| Total | 88 (100.0%) | 222 (100.0%) |
Property Value to Household Income Ratio in Biglerville borough
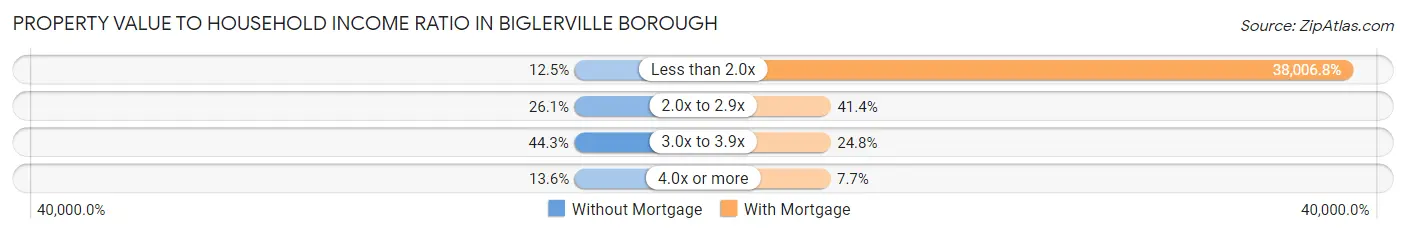
| Value-to-Income Ratio | Without Mortgage | With Mortgage |
| Less than 2.0x | 11 (12.5%) | 84,375 (38,006.8%) |
| 2.0x to 2.9x | 23 (26.1%) | 92 (41.4%) |
| 3.0x to 3.9x | 39 (44.3%) | 55 (24.8%) |
| 4.0x or more | 12 (13.6%) | 17 (7.7%) |
| Total | 88 (100.0%) | 222 (100.0%) |
Real Estate Taxes by Mortgage Status in Biglerville borough
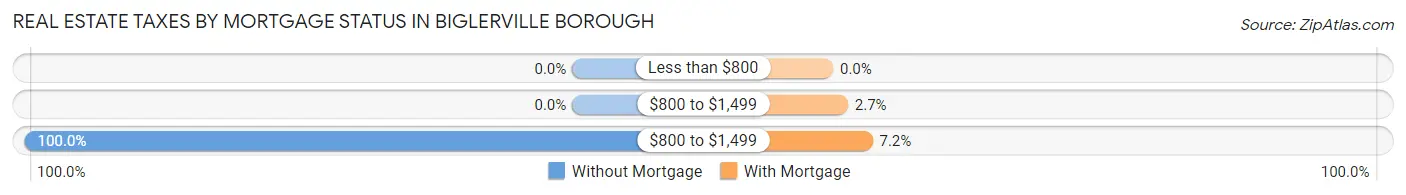
| Property Taxes | Without Mortgage | With Mortgage |
| Less than $800 | 0 (0.0%) | 0 (0.0%) |
| $800 to $1,499 | 0 (0.0%) | 6 (2.7%) |
| $800 to $1,499 | 88 (100.0%) | 16 (7.2%) |
| Total | 88 (100.0%) | 222 (100.0%) |
Health & Disability in Biglerville borough
Health Insurance Coverage by Age in Biglerville borough
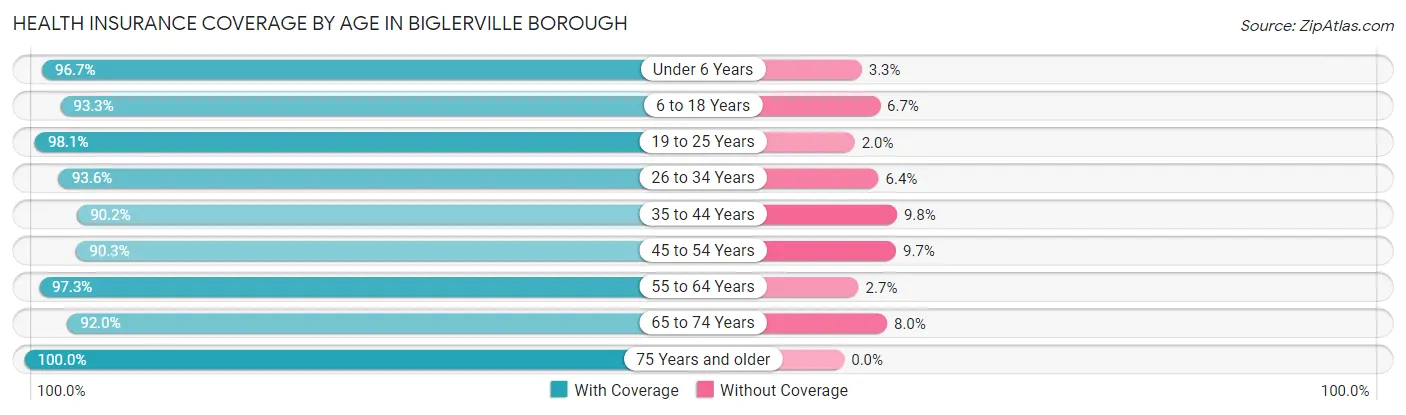
| Age Bracket | With Coverage | Without Coverage |
| Under 6 Years | 89 (96.7%) | 3 (3.3%) |
| 6 to 18 Years | 210 (93.3%) | 15 (6.7%) |
| 19 to 25 Years | 151 (98.1%) | 3 (1.9%) |
| 26 to 34 Years | 117 (93.6%) | 8 (6.4%) |
| 35 to 44 Years | 101 (90.2%) | 11 (9.8%) |
| 45 to 54 Years | 131 (90.3%) | 14 (9.7%) |
| 55 to 64 Years | 145 (97.3%) | 4 (2.7%) |
| 65 to 74 Years | 127 (92.0%) | 11 (8.0%) |
| 75 Years and older | 73 (100.0%) | 0 (0.0%) |
| Total | 1,144 (94.3%) | 69 (5.7%) |
Health Insurance Coverage by Citizenship Status in Biglerville borough
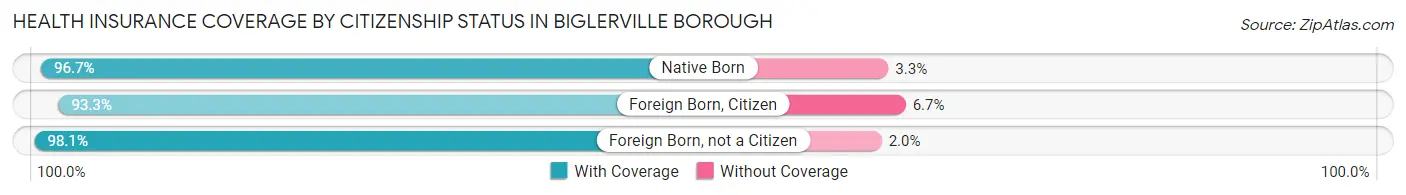
| Citizenship Status | With Coverage | Without Coverage |
| Native Born | 89 (96.7%) | 3 (3.3%) |
| Foreign Born, Citizen | 210 (93.3%) | 15 (6.7%) |
| Foreign Born, not a Citizen | 151 (98.1%) | 3 (1.9%) |
Health Insurance Coverage by Household Income in Biglerville borough
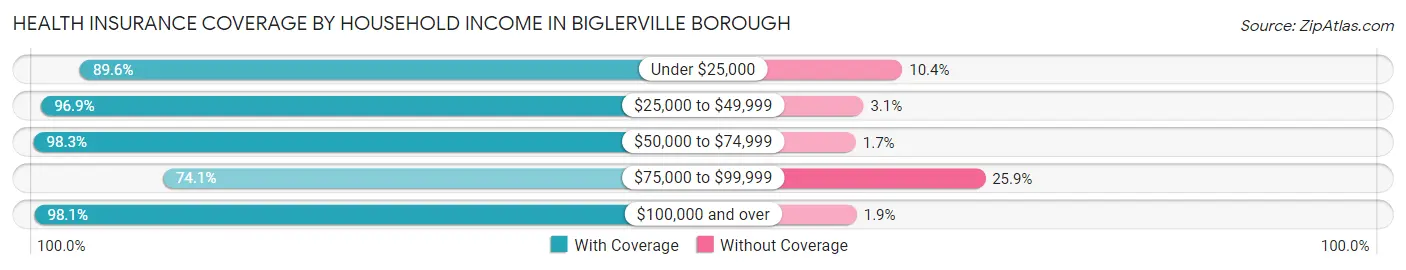
| Household Income | With Coverage | Without Coverage |
| Under $25,000 | 181 (89.6%) | 21 (10.4%) |
| $25,000 to $49,999 | 279 (96.9%) | 9 (3.1%) |
| $50,000 to $74,999 | 173 (98.3%) | 3 (1.7%) |
| $75,000 to $99,999 | 80 (74.1%) | 28 (25.9%) |
| $100,000 and over | 419 (98.1%) | 8 (1.9%) |
Public vs Private Health Insurance Coverage by Age in Biglerville borough
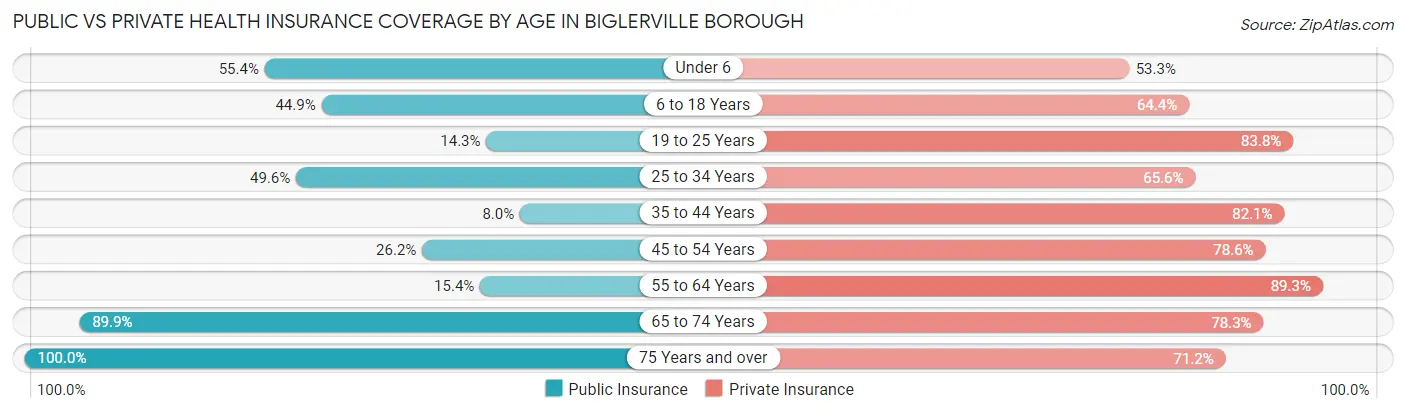
| Age Bracket | Public Insurance | Private Insurance |
| Under 6 | 51 (55.4%) | 49 (53.3%) |
| 6 to 18 Years | 101 (44.9%) | 145 (64.4%) |
| 19 to 25 Years | 22 (14.3%) | 129 (83.8%) |
| 25 to 34 Years | 62 (49.6%) | 82 (65.6%) |
| 35 to 44 Years | 9 (8.0%) | 92 (82.1%) |
| 45 to 54 Years | 38 (26.2%) | 114 (78.6%) |
| 55 to 64 Years | 23 (15.4%) | 133 (89.3%) |
| 65 to 74 Years | 124 (89.9%) | 108 (78.3%) |
| 75 Years and over | 73 (100.0%) | 52 (71.2%) |
| Total | 503 (41.5%) | 904 (74.5%) |
Disability Status by Sex by Age in Biglerville borough
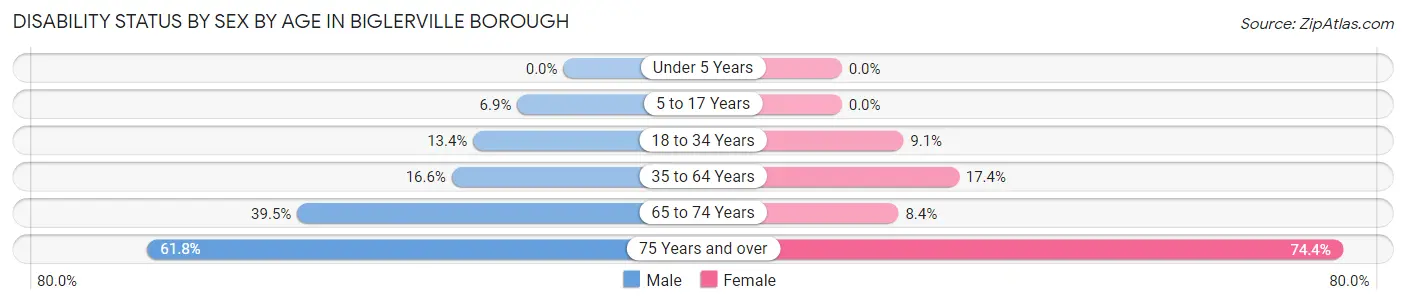
| Age Bracket | Male | Female |
| Under 5 Years | 0 (0.0%) | 0 (0.0%) |
| 5 to 17 Years | 10 (6.9%) | 0 (0.0%) |
| 18 to 34 Years | 17 (13.4%) | 17 (9.1%) |
| 35 to 64 Years | 32 (16.6%) | 37 (17.4%) |
| 65 to 74 Years | 17 (39.5%) | 8 (8.4%) |
| 75 Years and over | 21 (61.8%) | 29 (74.4%) |
Disability Class by Sex by Age in Biglerville borough
Disability Class: Hearing Difficulty
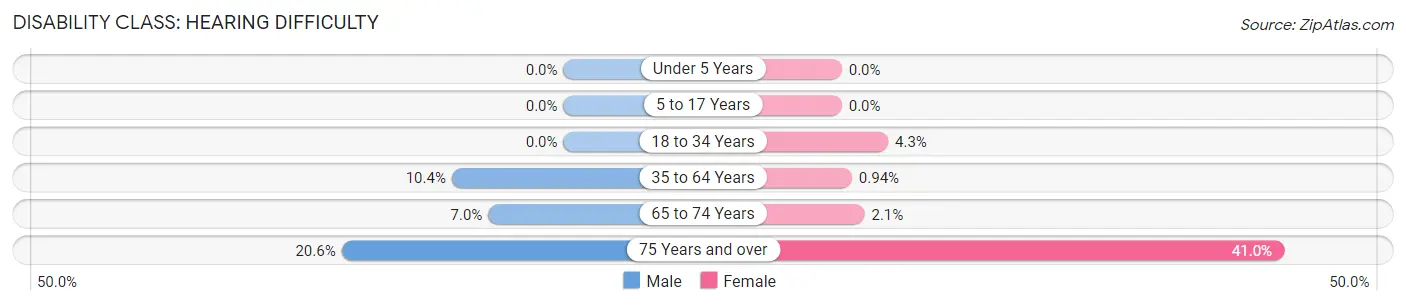
| Age Bracket | Male | Female |
| Under 5 Years | 0 (0.0%) | 0 (0.0%) |
| 5 to 17 Years | 0 (0.0%) | 0 (0.0%) |
| 18 to 34 Years | 0 (0.0%) | 8 (4.3%) |
| 35 to 64 Years | 20 (10.4%) | 2 (0.9%) |
| 65 to 74 Years | 3 (7.0%) | 2 (2.1%) |
| 75 Years and over | 7 (20.6%) | 16 (41.0%) |
Disability Class: Vision Difficulty
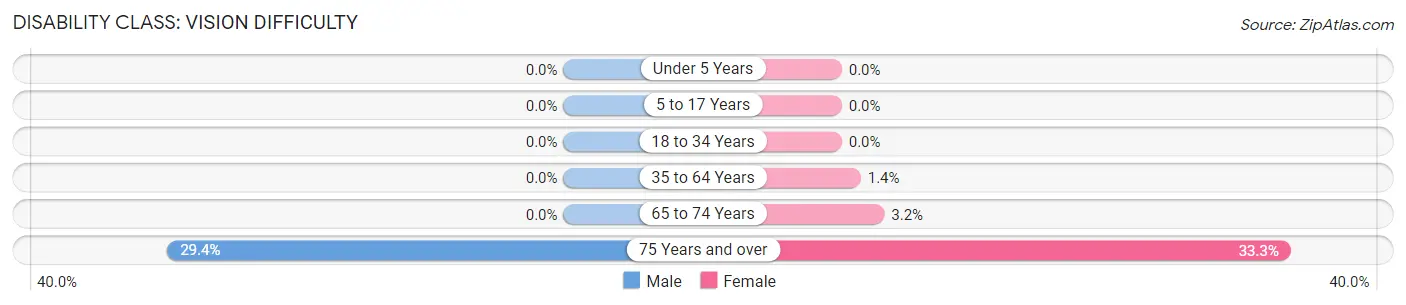
| Age Bracket | Male | Female |
| Under 5 Years | 0 (0.0%) | 0 (0.0%) |
| 5 to 17 Years | 0 (0.0%) | 0 (0.0%) |
| 18 to 34 Years | 0 (0.0%) | 0 (0.0%) |
| 35 to 64 Years | 0 (0.0%) | 3 (1.4%) |
| 65 to 74 Years | 0 (0.0%) | 3 (3.2%) |
| 75 Years and over | 10 (29.4%) | 13 (33.3%) |
Disability Class: Cognitive Difficulty
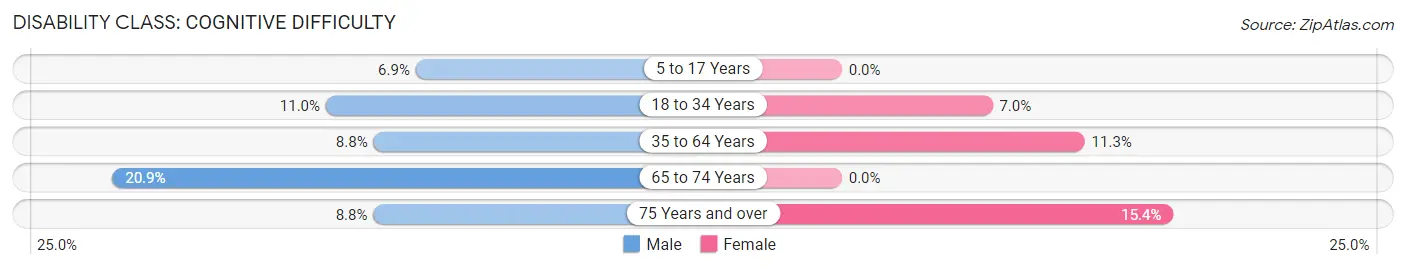
| Age Bracket | Male | Female |
| 5 to 17 Years | 10 (6.9%) | 0 (0.0%) |
| 18 to 34 Years | 14 (11.0%) | 13 (7.0%) |
| 35 to 64 Years | 17 (8.8%) | 24 (11.3%) |
| 65 to 74 Years | 9 (20.9%) | 0 (0.0%) |
| 75 Years and over | 3 (8.8%) | 6 (15.4%) |
Disability Class: Ambulatory Difficulty
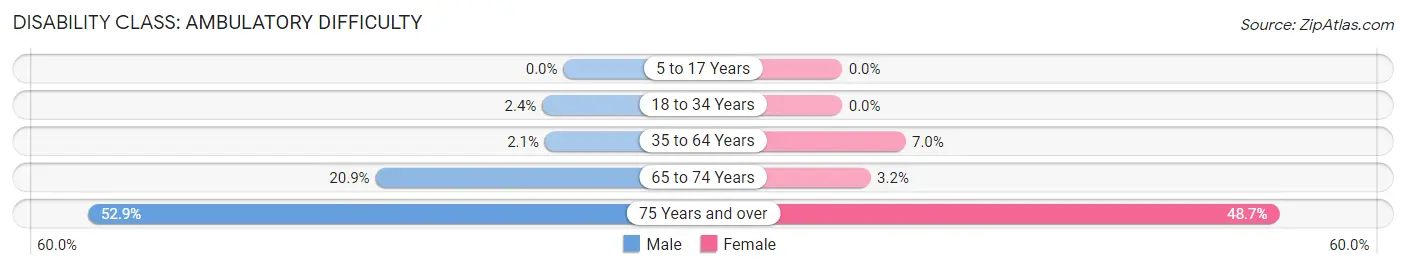
| Age Bracket | Male | Female |
| 5 to 17 Years | 0 (0.0%) | 0 (0.0%) |
| 18 to 34 Years | 3 (2.4%) | 0 (0.0%) |
| 35 to 64 Years | 4 (2.1%) | 15 (7.0%) |
| 65 to 74 Years | 9 (20.9%) | 3 (3.2%) |
| 75 Years and over | 18 (52.9%) | 19 (48.7%) |
Disability Class: Self-Care Difficulty
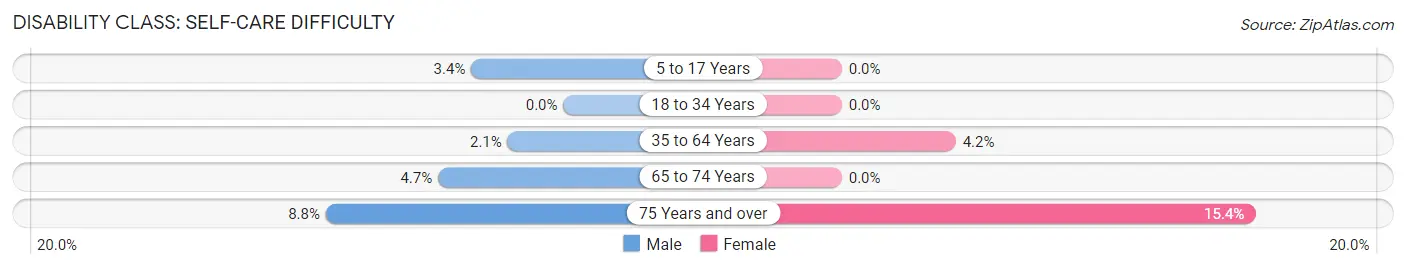
| Age Bracket | Male | Female |
| 5 to 17 Years | 5 (3.4%) | 0 (0.0%) |
| 18 to 34 Years | 0 (0.0%) | 0 (0.0%) |
| 35 to 64 Years | 4 (2.1%) | 9 (4.2%) |
| 65 to 74 Years | 2 (4.6%) | 0 (0.0%) |
| 75 Years and over | 3 (8.8%) | 6 (15.4%) |
Technology Access in Biglerville borough
Computing Device Access in Biglerville borough
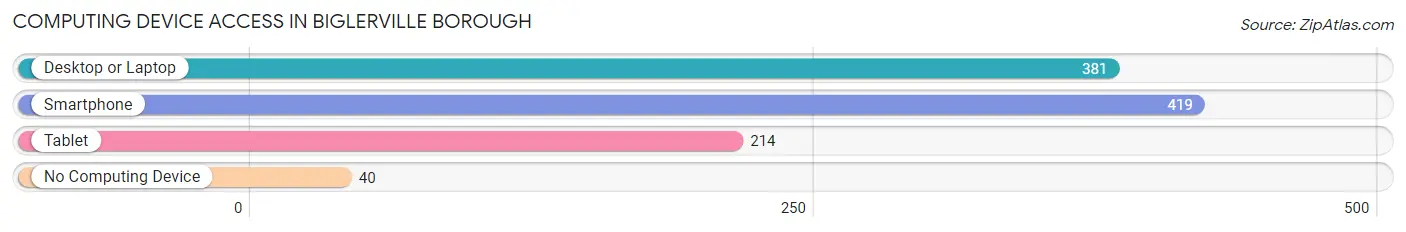
| Device Type | # Households | % Households |
| Desktop or Laptop | 381 | 75.6% |
| Smartphone | 419 | 83.1% |
| Tablet | 214 | 42.5% |
| No Computing Device | 40 | 7.9% |
| Total | 504 | 100.0% |
Internet Access in Biglerville borough
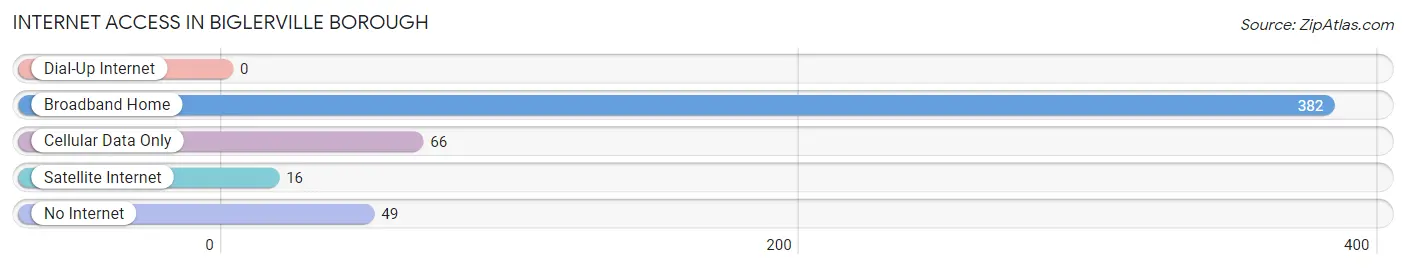
| Internet Type | # Households | % Households |
| Dial-Up Internet | 0 | 0.0% |
| Broadband Home | 382 | 75.8% |
| Cellular Data Only | 66 | 13.1% |
| Satellite Internet | 16 | 3.2% |
| No Internet | 49 | 9.7% |
| Total | 504 | 100.0% |
Biglerville borough Summary
Brief History
Biglerville Borough is a small borough located in Adams County, Pennsylvania. It is situated in the south-central part of the state, approximately 10 miles east of Gettysburg. The borough was founded in 1872 and was named after the Biglerville family, who were among the first settlers in the area. The Biglerville family owned a large tract of land in the area and the town was named after them.
The borough was originally a farming community, but in the late 19th century, it began to develop into a small industrial center. The first industry to locate in the borough was a sawmill, which was followed by a brickyard and a tannery. The borough also had a number of small businesses, including a general store, a blacksmith shop, and a hotel.
In the early 20th century, Biglerville Borough experienced a period of growth and development. The borough was incorporated in 1921 and the population grew from 1,000 to over 2,000 by the mid-1920s. The borough also saw the construction of a number of new buildings, including a post office, a bank, and a movie theater.
Geography
Biglerville Borough is located in Adams County, Pennsylvania. It is situated in the south-central part of the state, approximately 10 miles east of Gettysburg. The borough is bordered by the townships of Hamiltonban, Straban, and Mount Pleasant. The borough is situated in a rural area and is surrounded by rolling hills and farmland.
The borough covers an area of 1.2 square miles and has a population of 2,072 as of the 2010 census. The borough is served by the Biglerville School District and is home to Biglerville High School.
Economy
Biglerville Borough has a diverse economy. The borough is home to a number of small businesses, including a general store, a blacksmith shop, and a hotel. The borough also has a number of manufacturing and industrial businesses, including a sawmill, a brickyard, and a tannery.
The borough is also home to a number of agricultural businesses, including dairy farms, fruit orchards, and vegetable farms. The borough is also home to a number of wineries and breweries, which attract tourists from all over the region.
Demographics
As of the 2010 census, the population of Biglerville Borough was 2,072. The racial makeup of the borough was 95.3% White, 1.2% African American, 0.4% Native American, 0.7% Asian, 0.1% Pacific Islander, 0.7% from other races, and 1.6% from two or more races. Hispanic or Latino of any race were 2.2% of the population.
The median household income in the borough was $45,938 and the median family income was $51,938. The per capita income in the borough was $20,938. About 8.3% of families and 10.2% of the population were below the poverty line, including 14.2% of those under age 18 and 6.2% of those age 65 or over.
Common Questions
What is the Total Population of Biglerville borough?
Total Population of Biglerville borough is 1,213.
What is the Total Male Population of Biglerville borough?
Total Male Population of Biglerville borough is 567.
What is the Total Female Population of Biglerville borough?
Total Female Population of Biglerville borough is 646.
What is the Ratio of Males per 100 Females in Biglerville borough?
There are 87.77 Males per 100 Females in Biglerville borough.
What is the Ratio of Females per 100 Males in Biglerville borough?
There are 113.93 Females per 100 Males in Biglerville borough.
What is the Median Population Age in Biglerville borough?
Median Population Age in Biglerville borough is 35.5 Years.
What is the Average Family Size in Biglerville borough
Average Family Size in Biglerville borough is 3.3 People.
What is the Average Household Size in Biglerville borough
Average Household Size in Biglerville borough is 2.4 People.
What is Per Capita Income in Biglerville borough?
Per Capita income in Biglerville borough is $29,239.
What is the Median Family Income in Biglerville borough?
Median Family Income in Biglerville borough is $76,944.
What is the Median Household income in Biglerville borough?
Median Household Income in Biglerville borough is $49,634.
What is Income or Wage Gap in Biglerville borough?
Income or Wage Gap in Biglerville borough is 39.2%.
Women in Biglerville borough earn 60.8 cents for every dollar earned by a man.
What is Family Income Deficit in Biglerville borough?
Family Income Deficit in Biglerville borough is $14,983.
Families that are below poverty line in Biglerville borough earn $14,983 less on average than the poverty threshold level.
What is Inequality or Gini Index in Biglerville borough?
Inequality or Gini Index in Biglerville borough is 0.41.
How Large is the Labor Force in Biglerville borough?
There are 682 People in the Labor Forcein in Biglerville borough.
What is the Percentage of People in the Labor Force in Biglerville borough?
70.4% of People are in the Labor Force in Biglerville borough.
What is the Unemployment Rate in Biglerville borough?
Unemployment Rate in Biglerville borough is 10.0%.