Big Run borough, PA
Big Run borough Overview
536
TOTAL POPULATION
248
MALE POPULATION
288
FEMALE POPULATION
86.11
MALES / 100 FEMALES
116.13
FEMALES / 100 MALES
40.1
MEDIAN AGE
2.6
AVG FAMILY SIZE
2.4
AVG HOUSEHOLD SIZE
$25,230
PER CAPITA INCOME
$60,500
AVG FAMILY INCOME
$49,375
AVG HOUSEHOLD INCOME
50.2%
WAGE / INCOME GAP [ % ]
49.8¢/ $1
WAGE / INCOME GAP [ $ ]
0.38
INEQUALITY / GINI INDEX
255
LABOR FORCE [ PEOPLE ]
58.0%
PERCENT IN LABOR FORCE
6.3%
UNEMPLOYMENT RATE
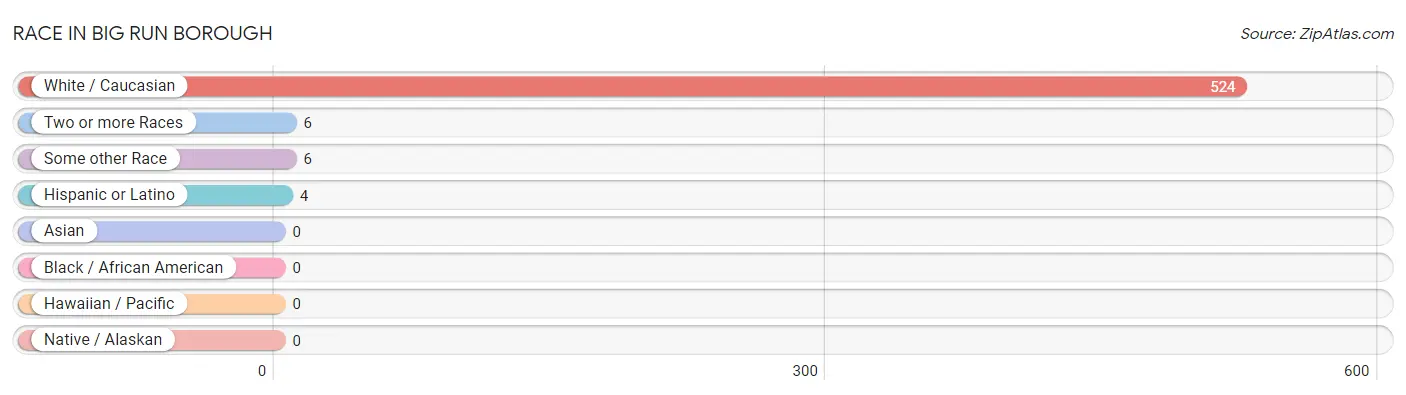
Race in Big Run borough
The most populous races in Big Run borough are White / Caucasian (524 | 97.8%), Two or more Races (6 | 1.1%), and Some other Race (6 | 1.1%).
| Race | # Population | % Population |
| Asian | 0 | 0.0% |
| Black / African American | 0 | 0.0% |
| Hawaiian / Pacific | 0 | 0.0% |
| Hispanic or Latino | 4 | 0.7% |
| Native / Alaskan | 0 | 0.0% |
| White / Caucasian | 524 | 97.8% |
| Two or more Races | 6 | 1.1% |
| Some other Race | 6 | 1.1% |
| Total | 536 | 100.0% |
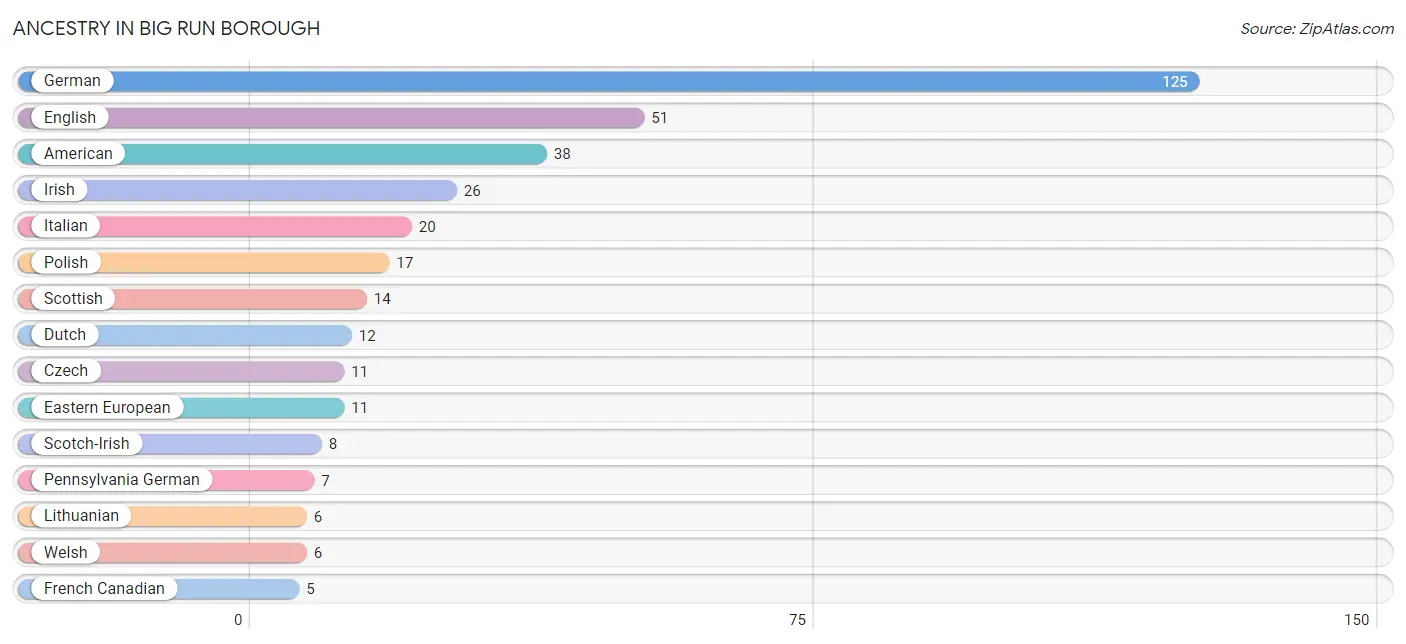
Ancestry in Big Run borough
The most populous ancestries reported in Big Run borough are German (125 | 23.3%), English (51 | 9.5%), American (38 | 7.1%), Irish (26 | 4.9%), and Italian (20 | 3.7%), together accounting for 48.5% of all Big Run borough residents.
| Ancestry | # Population | % Population |
| American | 38 | 7.1% |
| Czech | 11 | 2.1% |
| Dutch | 12 | 2.2% |
| Eastern European | 11 | 2.1% |
| English | 51 | 9.5% |
| European | 4 | 0.7% |
| French | 2 | 0.4% |
| French American Indian | 2 | 0.4% |
| French Canadian | 5 | 0.9% |
| German | 125 | 23.3% |
| Irish | 26 | 4.9% |
| Italian | 20 | 3.7% |
| Lithuanian | 6 | 1.1% |
| Mexican | 4 | 0.7% |
| Norwegian | 2 | 0.4% |
| Pennsylvania German | 7 | 1.3% |
| Polish | 17 | 3.2% |
| Scotch-Irish | 8 | 1.5% |
| Scottish | 14 | 2.6% |
| Swedish | 2 | 0.4% |
| Welsh | 6 | 1.1% | View All 21 Rows |
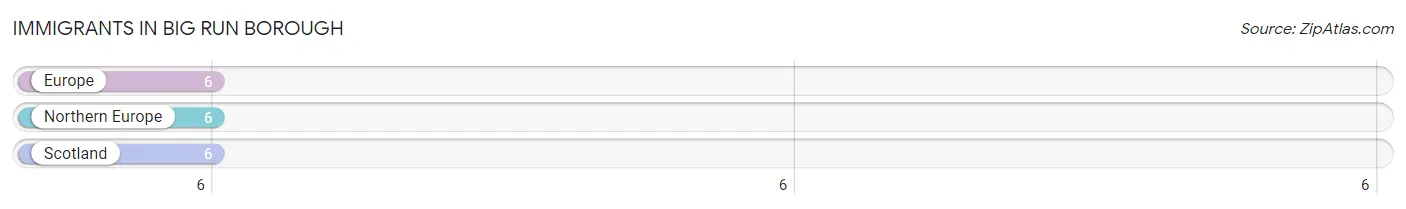
Immigrants in Big Run borough
The most numerous immigrant groups reported in Big Run borough came from Europe (6 | 1.1%), Northern Europe (6 | 1.1%), and Scotland (6 | 1.1%), together accounting for 3.4% of all Big Run borough residents.
| Immigration Origin | # Population | % Population |
| Europe | 6 | 1.1% |
| Northern Europe | 6 | 1.1% |
| Scotland | 6 | 1.1% | View All 3 Rows |
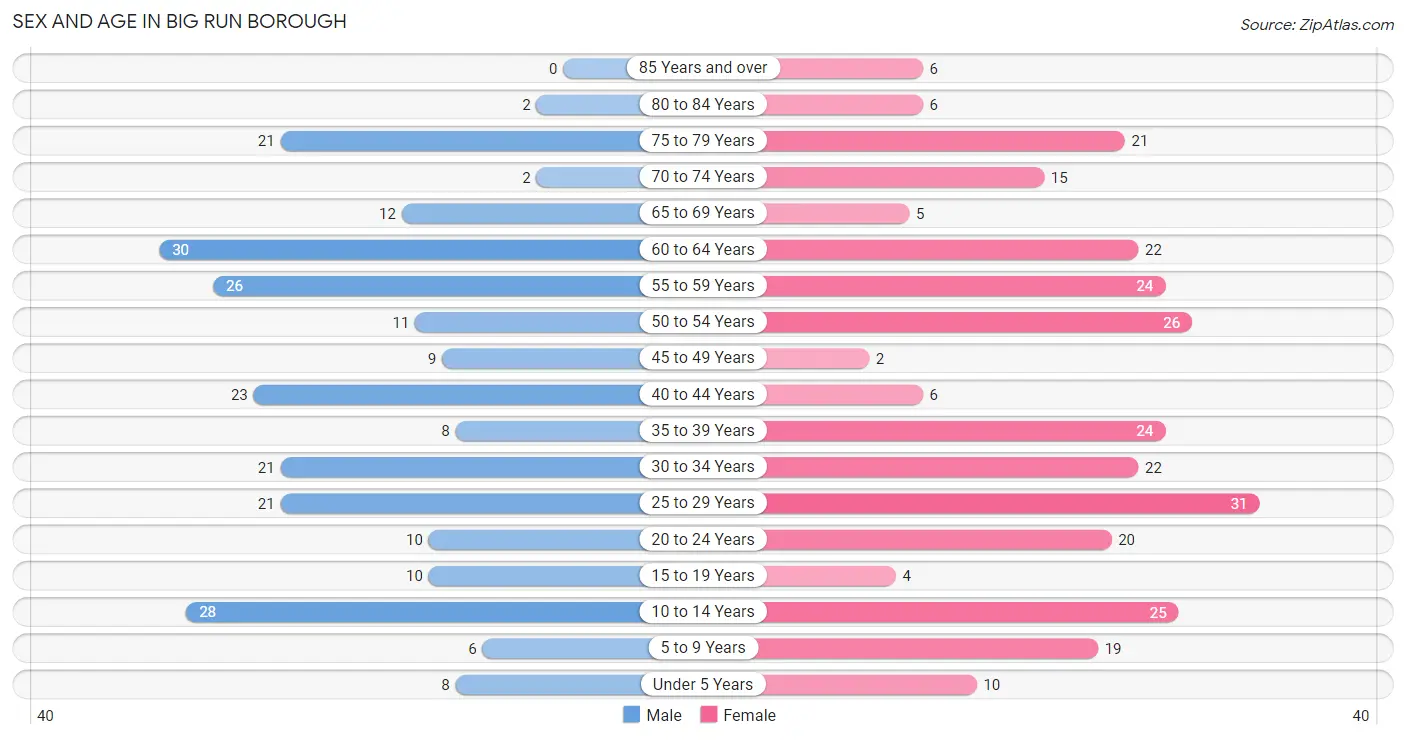
Sex and Age in Big Run borough
Sex and Age in Big Run borough
The most populous age groups in Big Run borough are 60 to 64 Years (30 | 12.1%) for men and 25 to 29 Years (31 | 10.8%) for women.
| Age Bracket | Male | Female |
| Under 5 Years | 8 (3.2%) | 10 (3.5%) |
| 5 to 9 Years | 6 (2.4%) | 19 (6.6%) |
| 10 to 14 Years | 28 (11.3%) | 25 (8.7%) |
| 15 to 19 Years | 10 (4.0%) | 4 (1.4%) |
| 20 to 24 Years | 10 (4.0%) | 20 (6.9%) |
| 25 to 29 Years | 21 (8.5%) | 31 (10.8%) |
| 30 to 34 Years | 21 (8.5%) | 22 (7.6%) |
| 35 to 39 Years | 8 (3.2%) | 24 (8.3%) |
| 40 to 44 Years | 23 (9.3%) | 6 (2.1%) |
| 45 to 49 Years | 9 (3.6%) | 2 (0.7%) |
| 50 to 54 Years | 11 (4.4%) | 26 (9.0%) |
| 55 to 59 Years | 26 (10.5%) | 24 (8.3%) |
| 60 to 64 Years | 30 (12.1%) | 22 (7.6%) |
| 65 to 69 Years | 12 (4.8%) | 5 (1.7%) |
| 70 to 74 Years | 2 (0.8%) | 15 (5.2%) |
| 75 to 79 Years | 21 (8.5%) | 21 (7.3%) |
| 80 to 84 Years | 2 (0.8%) | 6 (2.1%) |
| 85 Years and over | 0 (0.0%) | 6 (2.1%) |
| Total | 248 (100.0%) | 288 (100.0%) |
Families and Households in Big Run borough
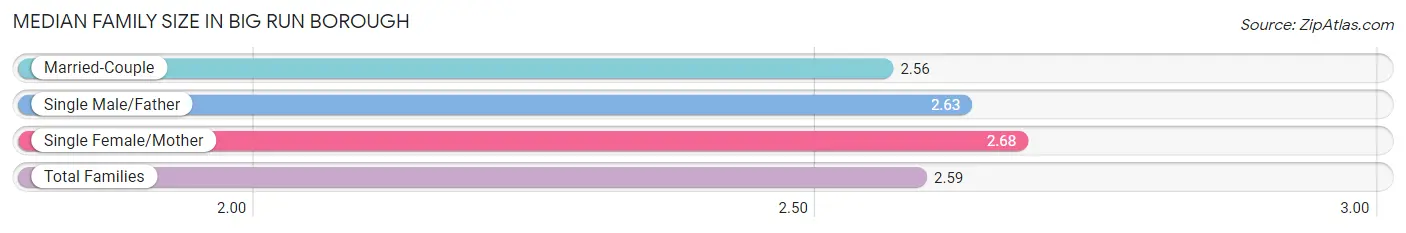
Median Family Size in Big Run borough
The median family size in Big Run borough is 2.59 persons per family, with single female/mother families (19 | 12.8%) accounting for the largest median family size of 2.68 persons per family. On the other hand, married-couple families (102 | 68.9%) represent the smallest median family size with 2.56 persons per family.
| Family Type | # Families | Family Size |
| Married-Couple | 102 (68.9%) | 2.56 |
| Single Male/Father | 27 (18.2%) | 2.63 |
| Single Female/Mother | 19 (12.8%) | 2.68 |
| Total Families | 148 (100.0%) | 2.59 |
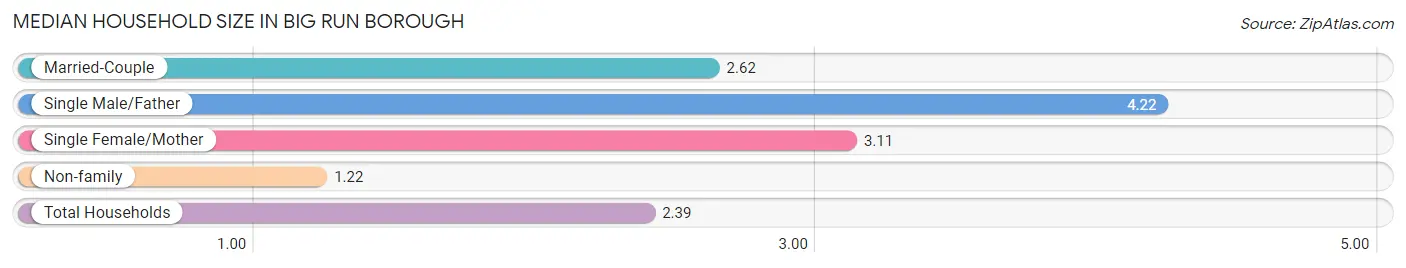
Median Household Size in Big Run borough
The median household size in Big Run borough is 2.39 persons per household, with single male/father households (27 | 12.2%) accounting for the largest median household size of 4.22 persons per household. non-family households (73 | 33.0%) represent the smallest median household size with 1.22 persons per household.
| Household Type | # Households | Household Size |
| Married-Couple | 102 (46.2%) | 2.62 |
| Single Male/Father | 27 (12.2%) | 4.22 |
| Single Female/Mother | 19 (8.6%) | 3.11 |
| Non-family | 73 (33.0%) | 1.22 |
| Total Households | 221 (100.0%) | 2.39 |
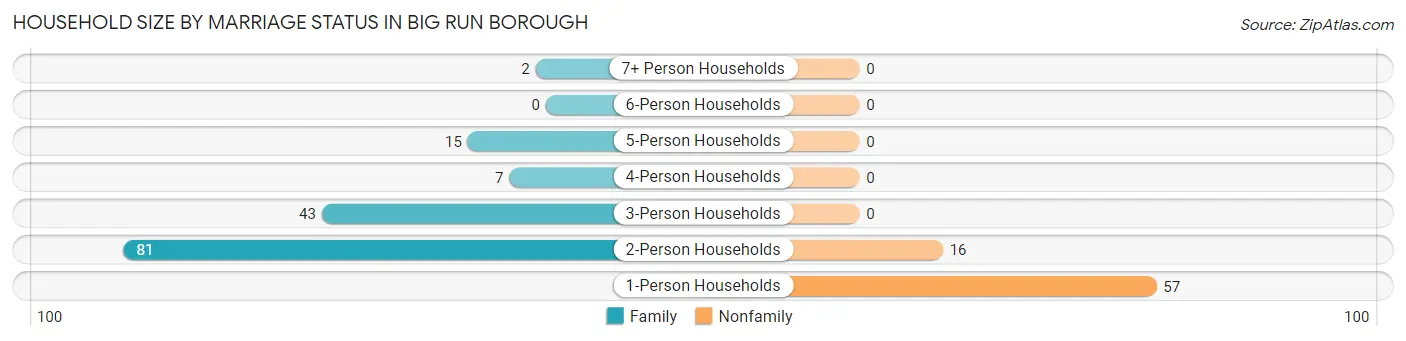
Household Size by Marriage Status in Big Run borough
Out of a total of 221 households in Big Run borough, 148 (67.0%) are family households, while 73 (33.0%) are nonfamily households. The most numerous type of family households are 2-person households, comprising 81, and the most common type of nonfamily households are 1-person households, comprising 57.
| Household Size | Family Households | Nonfamily Households |
| 1-Person Households | - | 57 (25.8%) |
| 2-Person Households | 81 (36.6%) | 16 (7.2%) |
| 3-Person Households | 43 (19.5%) | 0 (0.0%) |
| 4-Person Households | 7 (3.2%) | 0 (0.0%) |
| 5-Person Households | 15 (6.8%) | 0 (0.0%) |
| 6-Person Households | 0 (0.0%) | 0 (0.0%) |
| 7+ Person Households | 2 (0.9%) | 0 (0.0%) |
| Total | 148 (67.0%) | 73 (33.0%) |
Female Fertility in Big Run borough
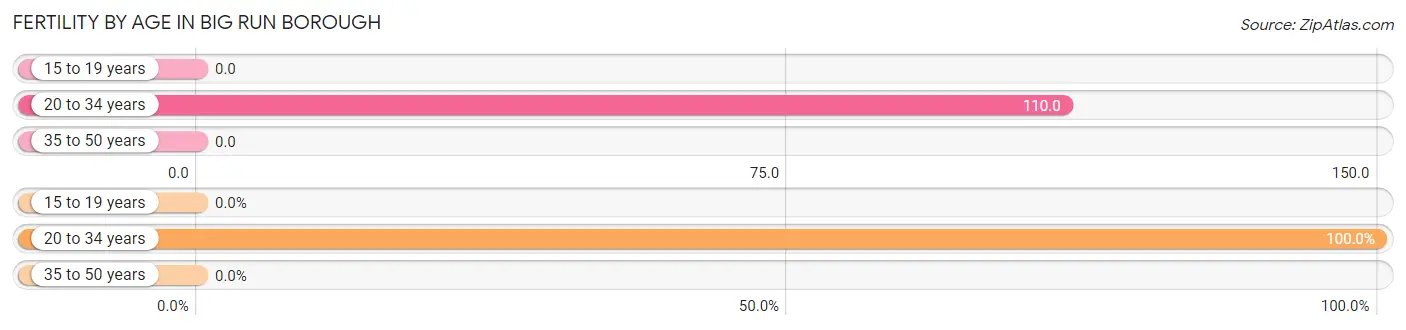
Fertility by Age in Big Run borough
Average fertility rate in Big Run borough is 73.0 births per 1,000 women. Women in the age bracket of 20 to 34 years have the highest fertility rate with 110.0 births per 1,000 women. Women in the age bracket of 20 to 34 years acount for 100.0% of all women with births.
| Age Bracket | Women with Births | Births / 1,000 Women |
| 15 to 19 years | 0 (0.0%) | 0.0 |
| 20 to 34 years | 8 (100.0%) | 110.0 |
| 35 to 50 years | 0 (0.0%) | 0.0 |
| Total | 8 (100.0%) | 73.0 |
Fertility by Age by Marriage Status in Big Run borough
25.0% of women with births (8) in Big Run borough are married. The highest percentage of unmarried women with births falls into 20 to 34 years age bracket with 75.0% of them unmarried at the time of birth, while the lowest percentage of unmarried women with births belong to 20 to 34 years age bracket with 75.0% of them unmarried.
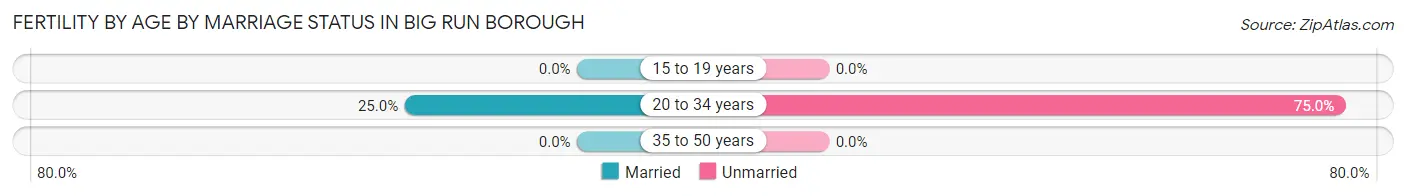
| Age Bracket | Married | Unmarried |
| 15 to 19 years | 0 (0.0%) | 0 (0.0%) |
| 20 to 34 years | 2 (25.0%) | 6 (75.0%) |
| 35 to 50 years | 0 (0.0%) | 0 (0.0%) |
| Total | 2 (25.0%) | 6 (75.0%) |
Fertility by Education in Big Run borough
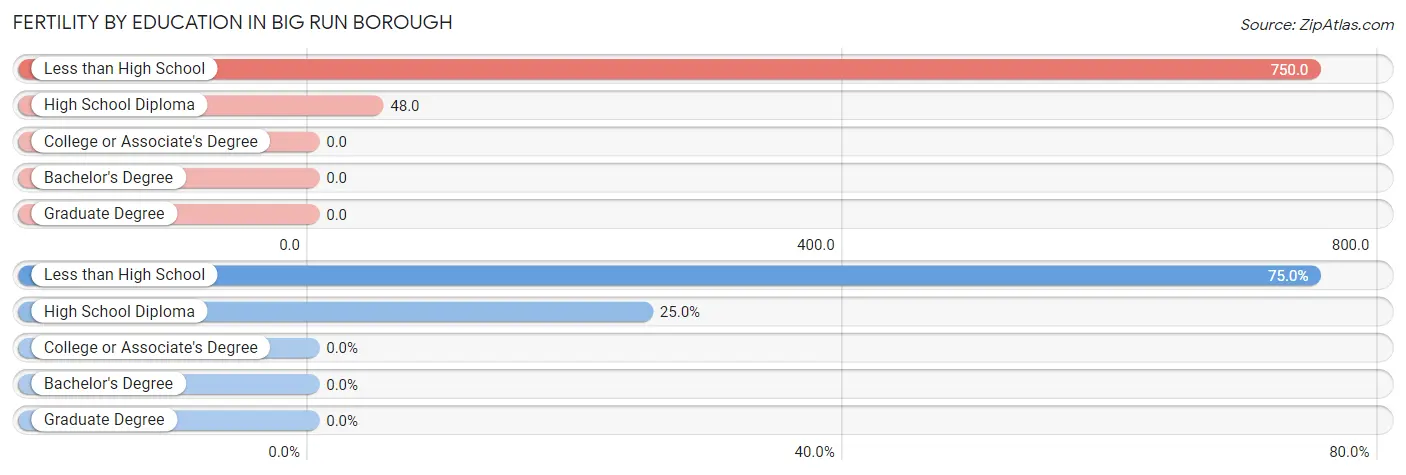
| Educational Attainment | Women with Births | Births / 1,000 Women |
| Less than High School | 6 (75.0%) | 750.0 |
| High School Diploma | 2 (25.0%) | 48.0 |
| College or Associate's Degree | 0 (0.0%) | 0.0 |
| Bachelor's Degree | 0 (0.0%) | 0.0 |
| Graduate Degree | 0 (0.0%) | 0.0 |
| Total | 8 (100.0%) | 73.0 |
Fertility by Education by Marriage Status in Big Run borough
75.0% of women with births in Big Run borough are unmarried. Women with the educational attainment of high school diploma are most likely to be married with 100.0% of them married at childbirth, while women with the educational attainment of less than high school are least likely to be married with 100.0% of them unmarried at childbirth.
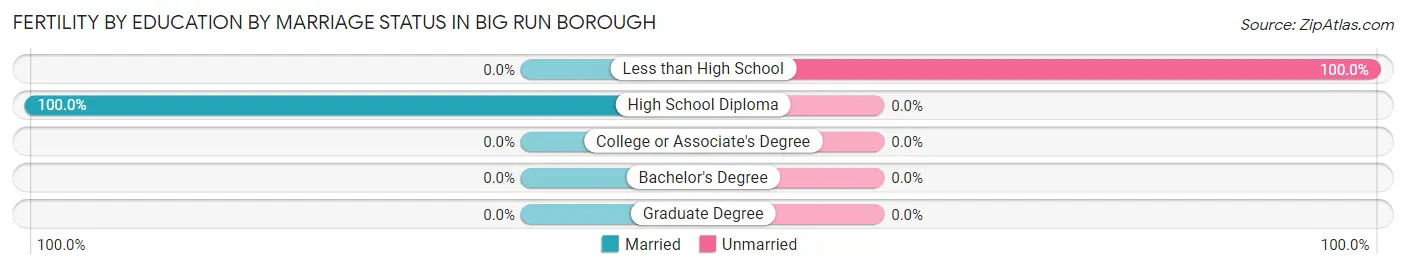
| Educational Attainment | Married | Unmarried |
| Less than High School | 0 (0.0%) | 6 (100.0%) |
| High School Diploma | 2 (100.0%) | 0 (0.0%) |
| College or Associate's Degree | 0 (0.0%) | 0 (0.0%) |
| Bachelor's Degree | 0 (0.0%) | 0 (0.0%) |
| Graduate Degree | 0 (0.0%) | 0 (0.0%) |
| Total | 2 (25.0%) | 6 (75.0%) |
Income in Big Run borough
Income Overview in Big Run borough
Per Capita Income in Big Run borough is $25,230, while median incomes of families and households are $60,500 and $49,375 respectively.
| Characteristic | Number | Measure |
| Per Capita Income | 536 | $25,230 |
| Median Family Income | 148 | $60,500 |
| Mean Family Income | 148 | $63,422 |
| Median Household Income | 221 | $49,375 |
| Mean Household Income | 221 | $57,740 |
| Income Deficit | 148 | $0 |
| Wage / Income Gap (%) | 536 | 50.24% |
| Wage / Income Gap ($) | 536 | 49.76¢ per $1 |
| Gini / Inequality Index | 536 | 0.38 |
Earnings by Sex in Big Run borough
Average Earnings in Big Run borough are $26,250, $43,750 for men and $21,771 for women, a difference of 50.2%.
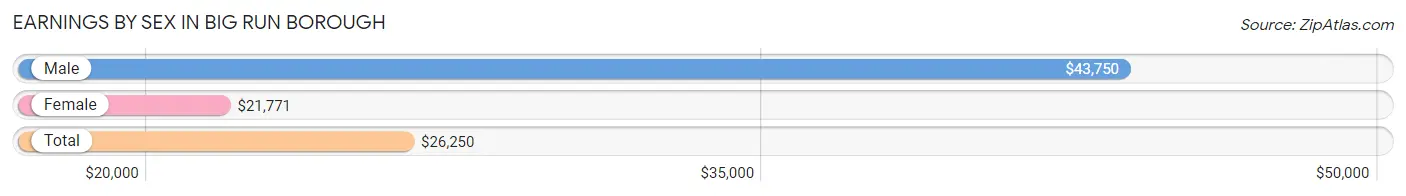
| Sex | Number | Average Earnings |
| Male | 144 (51.6%) | $43,750 |
| Female | 135 (48.4%) | $21,771 |
| Total | 279 (100.0%) | $26,250 |
Earnings by Sex by Income Bracket in Big Run borough
The most common earnings brackets in Big Run borough are $75,000 to $99,999 for men (31 | 21.5%) and $40,000 to $44,999 for women (23 | 17.0%).
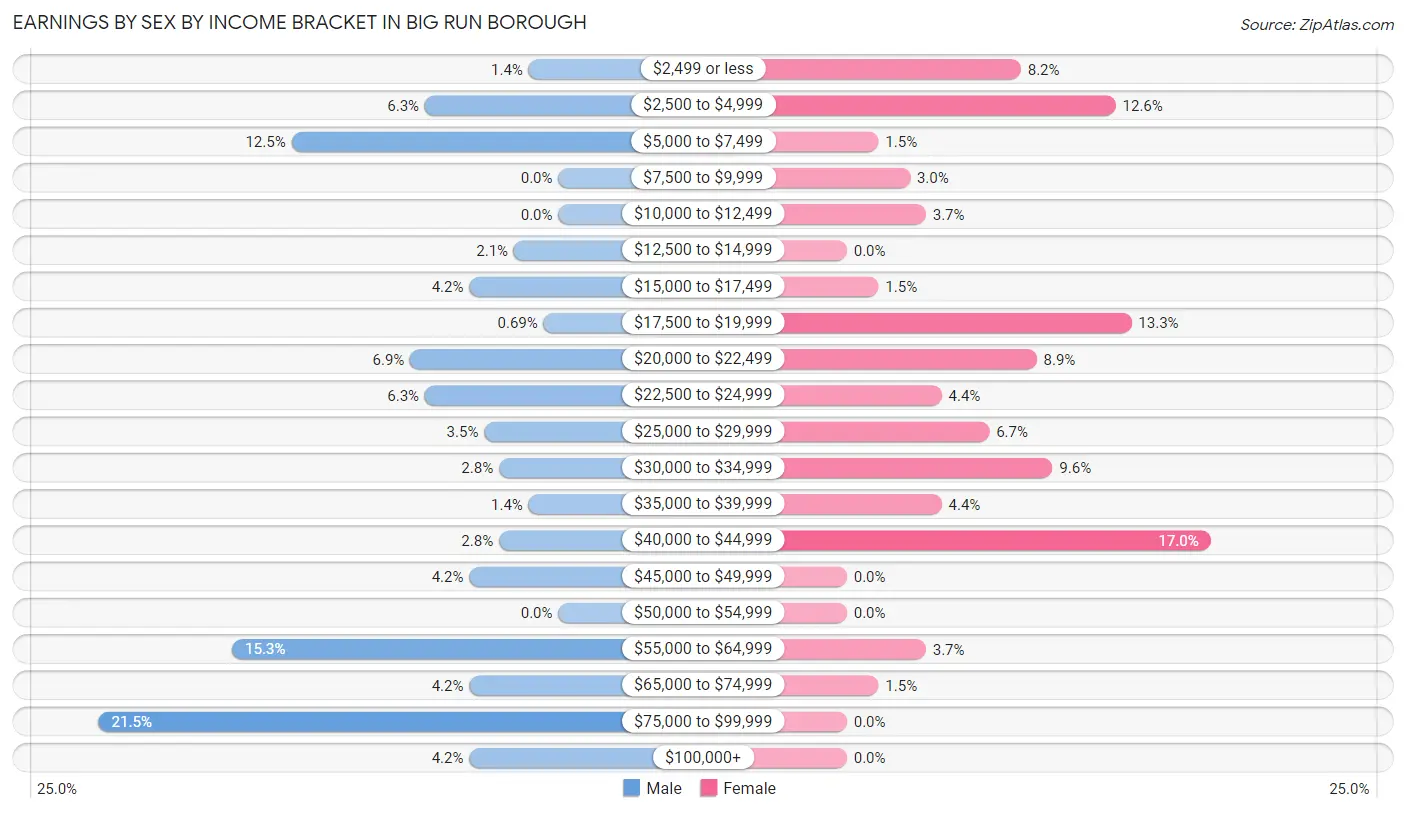
| Income | Male | Female |
| $2,499 or less | 2 (1.4%) | 11 (8.2%) |
| $2,500 to $4,999 | 9 (6.2%) | 17 (12.6%) |
| $5,000 to $7,499 | 18 (12.5%) | 2 (1.5%) |
| $7,500 to $9,999 | 0 (0.0%) | 4 (3.0%) |
| $10,000 to $12,499 | 0 (0.0%) | 5 (3.7%) |
| $12,500 to $14,999 | 3 (2.1%) | 0 (0.0%) |
| $15,000 to $17,499 | 6 (4.2%) | 2 (1.5%) |
| $17,500 to $19,999 | 1 (0.7%) | 18 (13.3%) |
| $20,000 to $22,499 | 10 (6.9%) | 12 (8.9%) |
| $22,500 to $24,999 | 9 (6.2%) | 6 (4.4%) |
| $25,000 to $29,999 | 5 (3.5%) | 9 (6.7%) |
| $30,000 to $34,999 | 4 (2.8%) | 13 (9.6%) |
| $35,000 to $39,999 | 2 (1.4%) | 6 (4.4%) |
| $40,000 to $44,999 | 4 (2.8%) | 23 (17.0%) |
| $45,000 to $49,999 | 6 (4.2%) | 0 (0.0%) |
| $50,000 to $54,999 | 0 (0.0%) | 0 (0.0%) |
| $55,000 to $64,999 | 22 (15.3%) | 5 (3.7%) |
| $65,000 to $74,999 | 6 (4.2%) | 2 (1.5%) |
| $75,000 to $99,999 | 31 (21.5%) | 0 (0.0%) |
| $100,000+ | 6 (4.2%) | 0 (0.0%) |
| Total | 144 (100.0%) | 135 (100.0%) |
Earnings by Sex by Educational Attainment in Big Run borough
Average earnings in Big Run borough are $47,083 for men and $22,917 for women, a difference of 51.3%. Men with an educational attainment of high school diploma enjoy the highest average annual earnings of $46,875, while those with high school diploma education earn the least with $46,875. Women with an educational attainment of bachelor's degree earn the most with the average annual earnings of $40,625, while those with high school diploma education have the smallest earnings of $21,250.
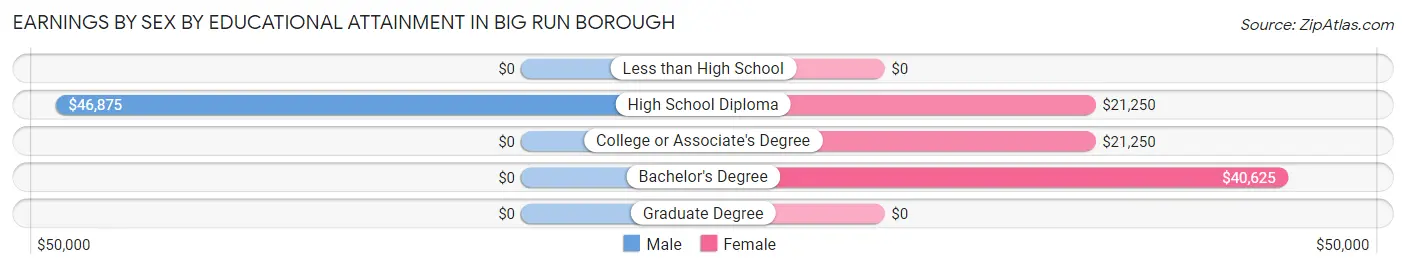
| Educational Attainment | Male Income | Female Income |
| Less than High School | - | - |
| High School Diploma | $46,875 | $21,250 |
| College or Associate's Degree | - | - |
| Bachelor's Degree | - | - |
| Graduate Degree | - | - |
| Total | $47,083 | $22,917 |
Family Income in Big Run borough
Family Income Brackets in Big Run borough
According to the Big Run borough family income data, there are 36 families falling into the $75,000 to $99,999 income range, which is the most common income bracket and makes up 24.3% of all families.
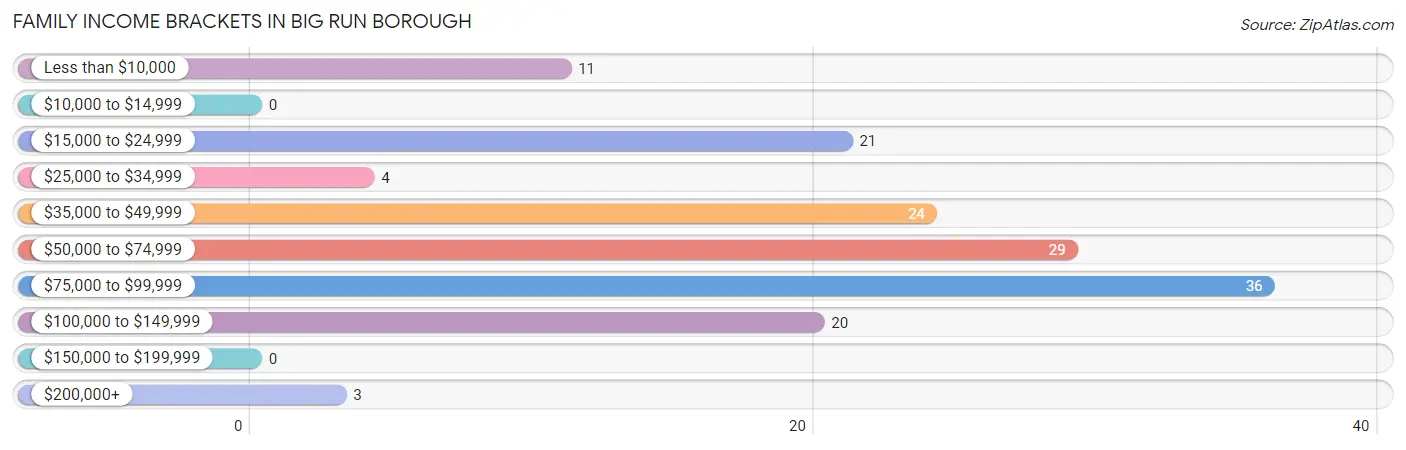
| Income Bracket | # Families | % Families |
| Less than $10,000 | 11 | 7.4% |
| $10,000 to $14,999 | 0 | 0.0% |
| $15,000 to $24,999 | 21 | 14.2% |
| $25,000 to $34,999 | 4 | 2.7% |
| $35,000 to $49,999 | 24 | 16.2% |
| $50,000 to $74,999 | 29 | 19.6% |
| $75,000 to $99,999 | 36 | 24.3% |
| $100,000 to $149,999 | 20 | 13.5% |
| $150,000 to $199,999 | 0 | 0.0% |
| $200,000+ | 3 | 2.0% |
Family Income by Famaliy Size in Big Run borough
3-person families (26 | 17.6%) account for the highest median family income in Big Run borough with $78,750 per family, while 2-person families (106 | 71.6%) have the highest median income of $28,750 per family member.
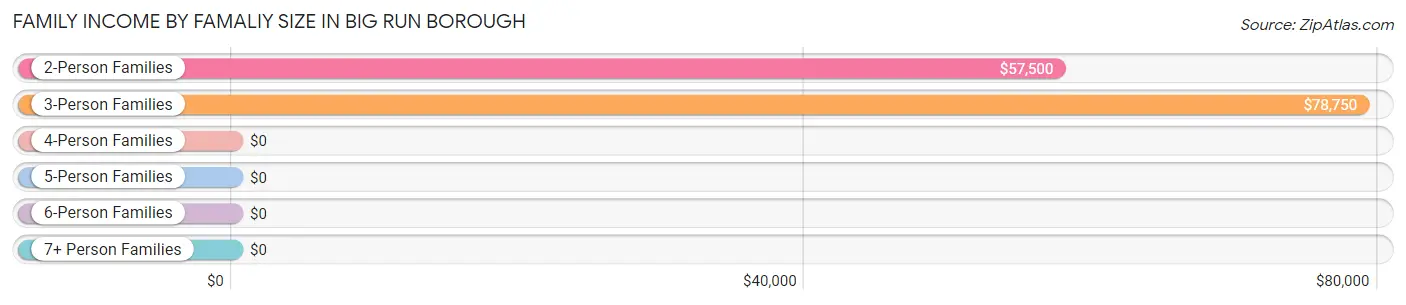
| Income Bracket | # Families | Median Income |
| 2-Person Families | 106 (71.6%) | $57,500 |
| 3-Person Families | 26 (17.6%) | $78,750 |
| 4-Person Families | 10 (6.8%) | $0 |
| 5-Person Families | 4 (2.7%) | $0 |
| 6-Person Families | 0 (0.0%) | $0 |
| 7+ Person Families | 2 (1.3%) | $0 |
| Total | 148 (100.0%) | $60,500 |
Family Income by Number of Earners in Big Run borough
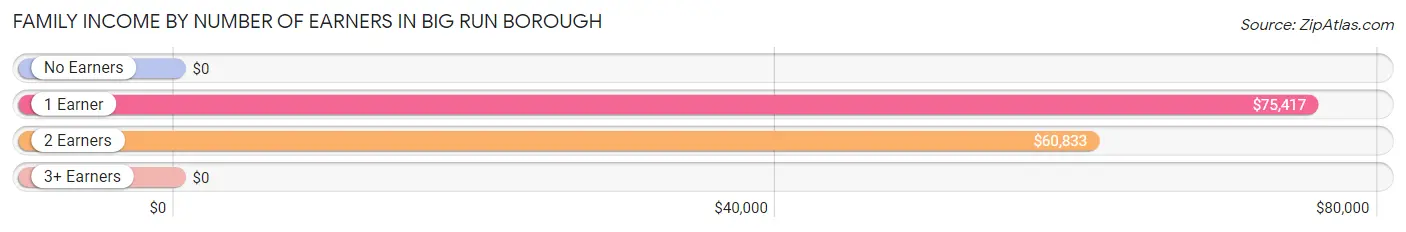
| Number of Earners | # Families | Median Income |
| No Earners | 24 (16.2%) | $0 |
| 1 Earner | 66 (44.6%) | $75,417 |
| 2 Earners | 54 (36.5%) | $60,833 |
| 3+ Earners | 4 (2.7%) | $0 |
| Total | 148 (100.0%) | $60,500 |
Household Income in Big Run borough
Household Income Brackets in Big Run borough
With 48 households falling in the category, the $15,000 to $24,999 income range is the most frequent in Big Run borough, accounting for 21.7% of all households.
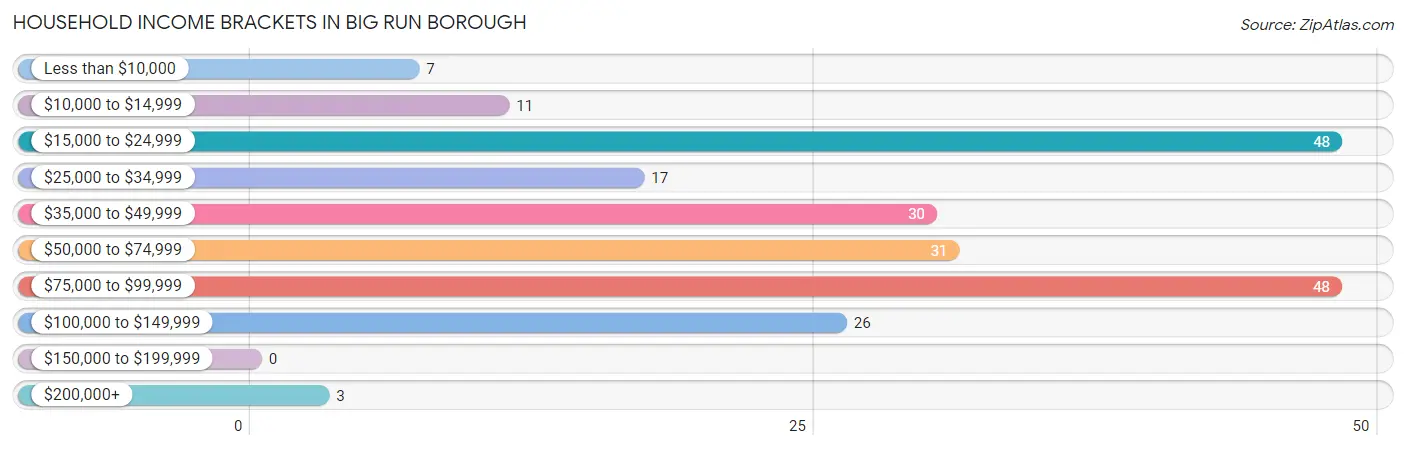
| Income Bracket | # Households | % Households |
| Less than $10,000 | 7 | 3.2% |
| $10,000 to $14,999 | 11 | 5.0% |
| $15,000 to $24,999 | 48 | 21.7% |
| $25,000 to $34,999 | 17 | 7.7% |
| $35,000 to $49,999 | 30 | 13.6% |
| $50,000 to $74,999 | 31 | 14.0% |
| $75,000 to $99,999 | 48 | 21.7% |
| $100,000 to $149,999 | 26 | 11.8% |
| $150,000 to $199,999 | 0 | 0.0% |
| $200,000+ | 3 | 1.4% |
Household Income by Householder Age in Big Run borough
The median household income in Big Run borough is $49,375, with the highest median household income of $75,096 found in the 45 to 64 years age bracket for the primary householder. A total of 91 households (41.2%) fall into this category. Meanwhile, the 15 to 24 years age bracket for the primary householder has the lowest median household income of $0, with 11 households (5.0%) in this group.
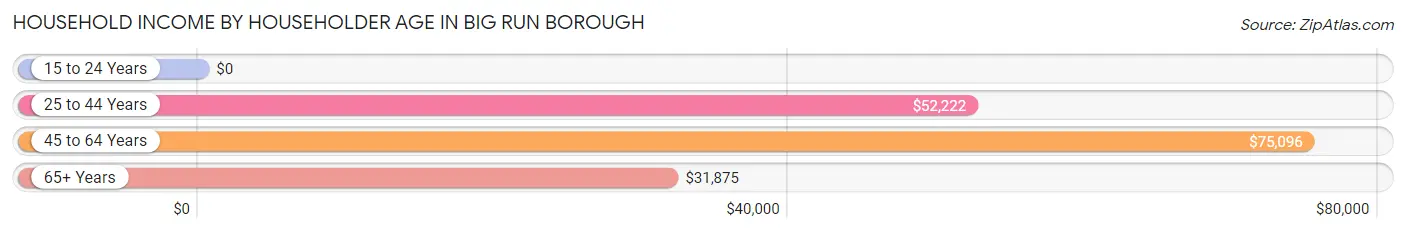
| Income Bracket | # Households | Median Income |
| 15 to 24 Years | 11 (5.0%) | $0 |
| 25 to 44 Years | 62 (28.1%) | $52,222 |
| 45 to 64 Years | 91 (41.2%) | $75,096 |
| 65+ Years | 57 (25.8%) | $31,875 |
| Total | 221 (100.0%) | $49,375 |
Poverty in Big Run borough
Income Below Poverty by Sex and Age in Big Run borough
With 23.3% poverty level for males and 25.2% for females among the residents of Big Run borough, 18 to 24 year old males and 16 and 17 year old females are the most vulnerable to poverty, with 10 males (83.3%) and 2 females (100.0%) in their respective age groups living below the poverty level.
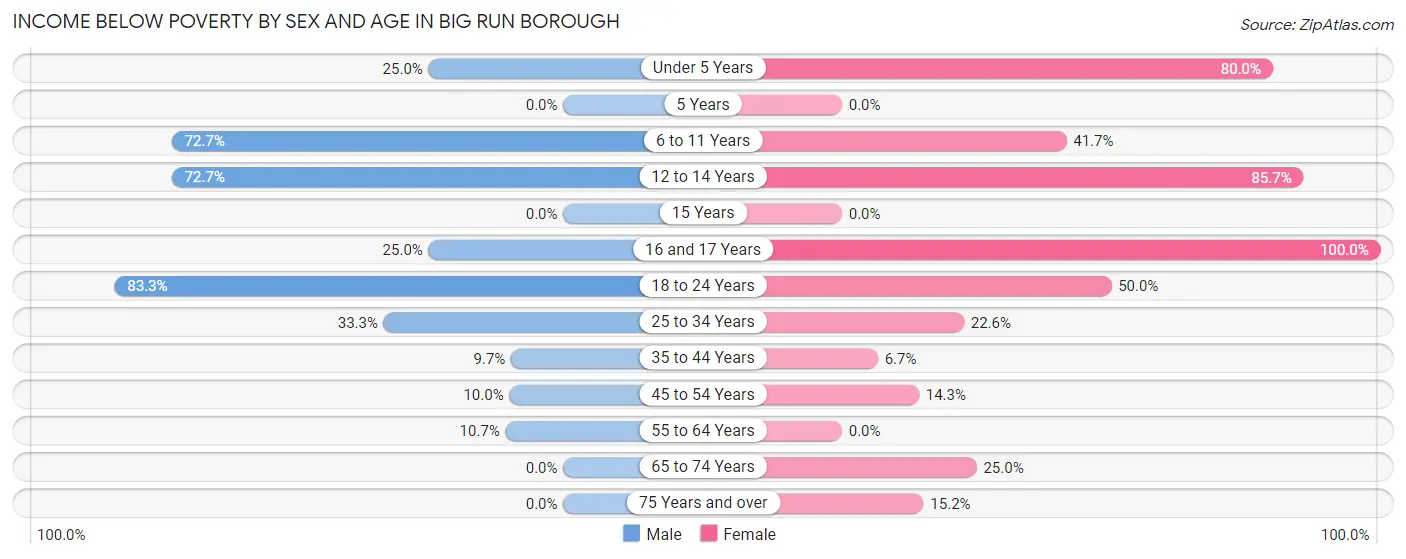
| Age Bracket | Male | Female |
| Under 5 Years | 2 (25.0%) | 8 (80.0%) |
| 5 Years | 0 (0.0%) | 0 (0.0%) |
| 6 to 11 Years | 8 (72.7%) | 10 (41.7%) |
| 12 to 14 Years | 8 (72.7%) | 12 (85.7%) |
| 15 Years | 0 (0.0%) | 0 (0.0%) |
| 16 and 17 Years | 2 (25.0%) | 2 (100.0%) |
| 18 to 24 Years | 10 (83.3%) | 11 (50.0%) |
| 25 to 34 Years | 14 (33.3%) | 12 (22.6%) |
| 35 to 44 Years | 3 (9.7%) | 2 (6.7%) |
| 45 to 54 Years | 2 (10.0%) | 4 (14.3%) |
| 55 to 64 Years | 6 (10.7%) | 0 (0.0%) |
| 65 to 74 Years | 0 (0.0%) | 5 (25.0%) |
| 75 Years and over | 0 (0.0%) | 5 (15.1%) |
| Total | 55 (23.3%) | 71 (25.2%) |
Income Above Poverty by Sex and Age in Big Run borough
According to the poverty statistics in Big Run borough, males aged 65 to 74 years and females aged 55 to 64 years are the age groups that are most secure financially, with 100.0% of males and 100.0% of females in these age groups living above the poverty line.
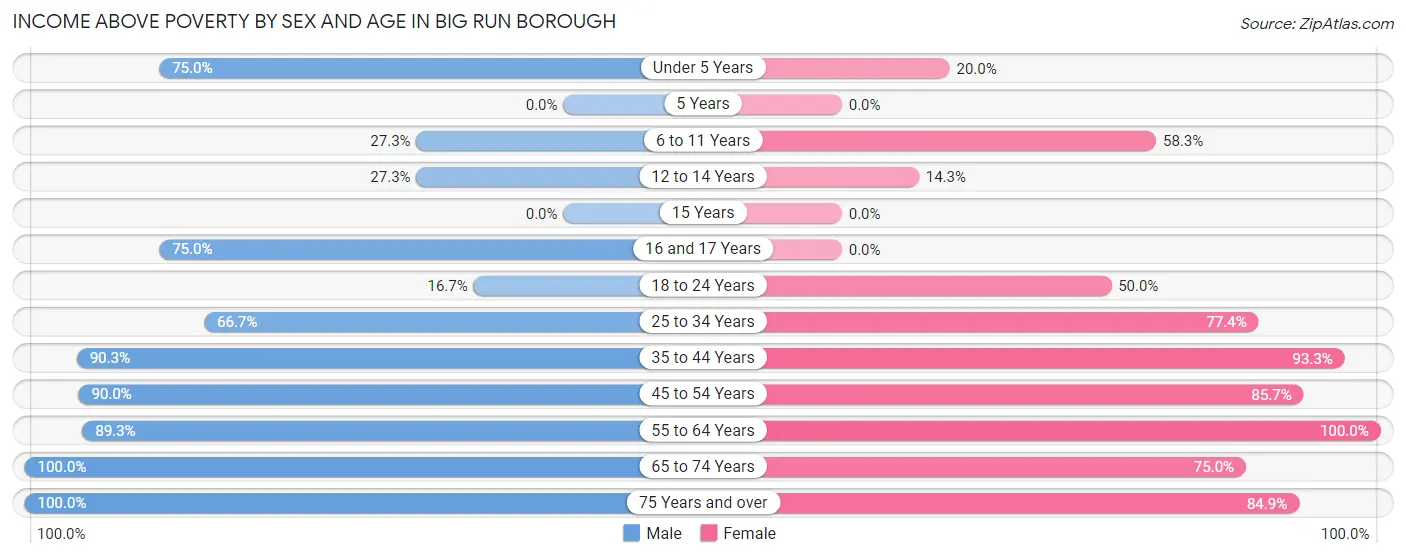
| Age Bracket | Male | Female |
| Under 5 Years | 6 (75.0%) | 2 (20.0%) |
| 5 Years | 0 (0.0%) | 0 (0.0%) |
| 6 to 11 Years | 3 (27.3%) | 14 (58.3%) |
| 12 to 14 Years | 3 (27.3%) | 2 (14.3%) |
| 15 Years | 0 (0.0%) | 0 (0.0%) |
| 16 and 17 Years | 6 (75.0%) | 0 (0.0%) |
| 18 to 24 Years | 2 (16.7%) | 11 (50.0%) |
| 25 to 34 Years | 28 (66.7%) | 41 (77.4%) |
| 35 to 44 Years | 28 (90.3%) | 28 (93.3%) |
| 45 to 54 Years | 18 (90.0%) | 24 (85.7%) |
| 55 to 64 Years | 50 (89.3%) | 46 (100.0%) |
| 65 to 74 Years | 14 (100.0%) | 15 (75.0%) |
| 75 Years and over | 23 (100.0%) | 28 (84.9%) |
| Total | 181 (76.7%) | 211 (74.8%) |
Income Below Poverty Among Married-Couple Families in Big Run borough
The poverty statistics for married-couple families in Big Run borough show that 6.9% or 7 of the total 102 families live below the poverty line. Families with 3 or 4 children have the highest poverty rate of 50.0%, comprising of 2 families. On the other hand, families with no children have the lowest poverty rate of 0.0%, which includes 0 families.
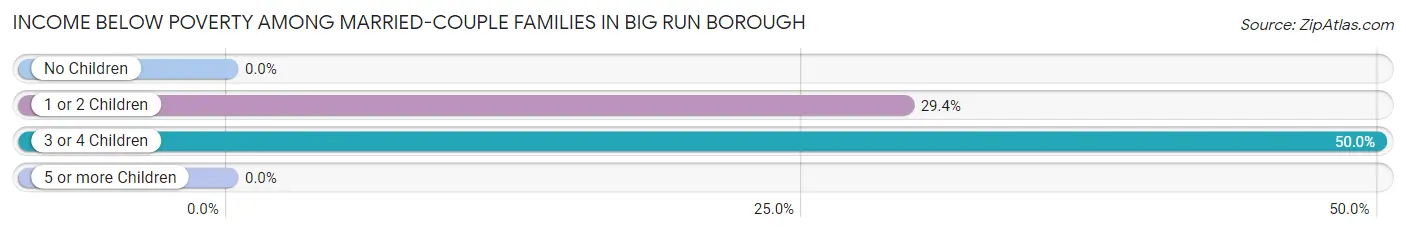
| Children | Above Poverty | Below Poverty |
| No Children | 81 (100.0%) | 0 (0.0%) |
| 1 or 2 Children | 12 (70.6%) | 5 (29.4%) |
| 3 or 4 Children | 2 (50.0%) | 2 (50.0%) |
| 5 or more Children | 0 (0.0%) | 0 (0.0%) |
| Total | 95 (93.1%) | 7 (6.9%) |
Income Below Poverty Among Single-Parent Households in Big Run borough
According to the poverty data in Big Run borough, 25.9% or 7 single-father households and 42.1% or 8 single-mother households are living below the poverty line. Among single-father households, those with 3 or 4 children have the highest poverty rate, with 5 households (100.0%) experiencing poverty. Likewise, among single-mother households, those with 1 or 2 children have the highest poverty rate, with 6 households (100.0%) falling below the poverty line.
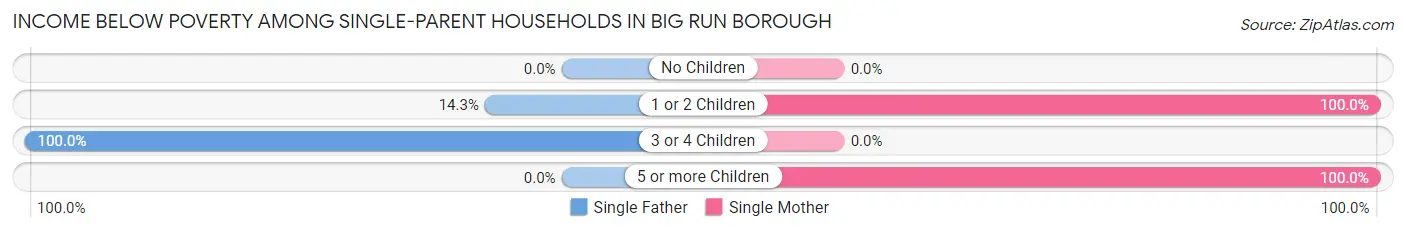
| Children | Single Father | Single Mother |
| No Children | 0 (0.0%) | 0 (0.0%) |
| 1 or 2 Children | 2 (14.3%) | 6 (100.0%) |
| 3 or 4 Children | 5 (100.0%) | 0 (0.0%) |
| 5 or more Children | 0 (0.0%) | 2 (100.0%) |
| Total | 7 (25.9%) | 8 (42.1%) |
Income Below Poverty Among Married-Couple vs Single-Parent Households in Big Run borough
The poverty data for Big Run borough shows that 7 of the married-couple family households (6.9%) and 15 of the single-parent households (32.6%) are living below the poverty level. Within the married-couple family households, those with 3 or 4 children have the highest poverty rate, with 2 households (50.0%) falling below the poverty line. Among the single-parent households, those with 3 or 4 children have the highest poverty rate, with 5 household (100.0%) living below poverty.
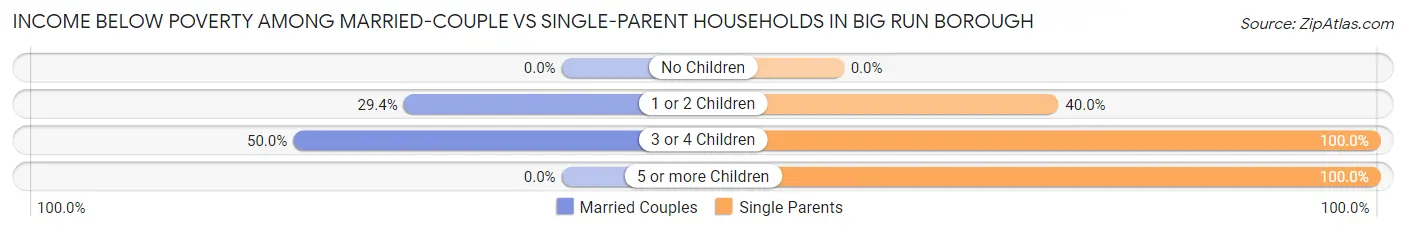
| Children | Married-Couple Families | Single-Parent Households |
| No Children | 0 (0.0%) | 0 (0.0%) |
| 1 or 2 Children | 5 (29.4%) | 8 (40.0%) |
| 3 or 4 Children | 2 (50.0%) | 5 (100.0%) |
| 5 or more Children | 0 (0.0%) | 2 (100.0%) |
| Total | 7 (6.9%) | 15 (32.6%) |
Employment Characteristics in Big Run borough
Employment by Class of Employer in Big Run borough
Among the 239 employed individuals in Big Run borough, private company employees (158 | 66.1%), not-for-profit organizations (29 | 12.1%), and state government employees (21 | 8.8%) make up the most common classes of employment.
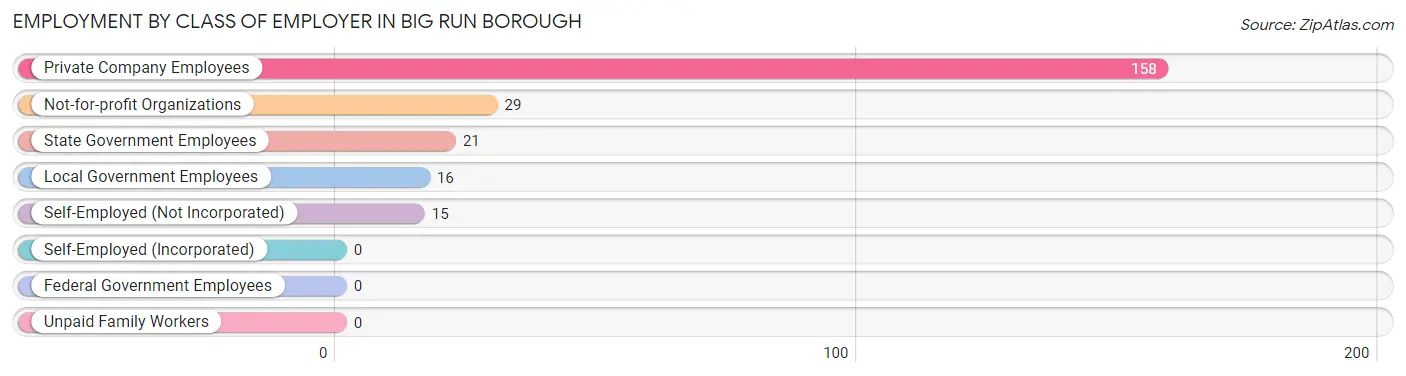
| Employer Class | # Employees | % Employees |
| Private Company Employees | 158 | 66.1% |
| Self-Employed (Incorporated) | 0 | 0.0% |
| Self-Employed (Not Incorporated) | 15 | 6.3% |
| Not-for-profit Organizations | 29 | 12.1% |
| Local Government Employees | 16 | 6.7% |
| State Government Employees | 21 | 8.8% |
| Federal Government Employees | 0 | 0.0% |
| Unpaid Family Workers | 0 | 0.0% |
| Total | 239 | 100.0% |
Employment Status by Age in Big Run borough
According to the labor force statistics for Big Run borough, out of the total population over 16 years of age (440), 58.0% or 255 individuals are in the labor force, with 6.3% or 16 of them unemployed. The age group with the highest labor force participation rate is 55 to 59 years, with 96.0% or 48 individuals in the labor force. Within the labor force, the 75 years and over age range has the highest percentage of unemployed individuals, with 100.0% or 2 of them being unemployed.
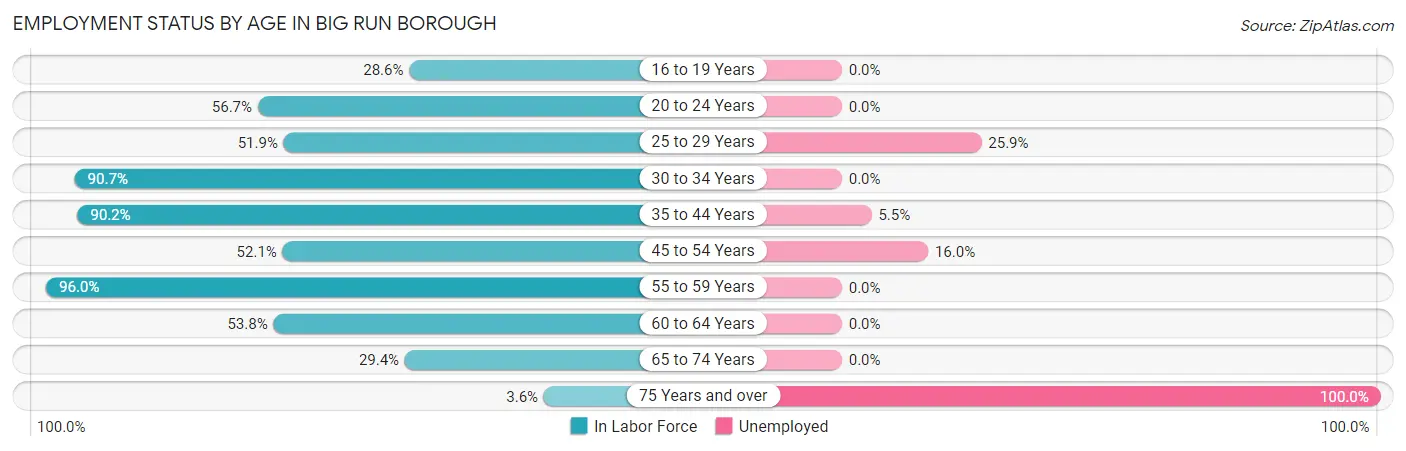
| Age Bracket | In Labor Force | Unemployed |
| 16 to 19 Years | 4 (28.6%) | 0 (0.0%) |
| 20 to 24 Years | 17 (56.7%) | 0 (0.0%) |
| 25 to 29 Years | 27 (51.9%) | 7 (25.9%) |
| 30 to 34 Years | 39 (90.7%) | 0 (0.0%) |
| 35 to 44 Years | 55 (90.2%) | 3 (5.5%) |
| 45 to 54 Years | 25 (52.1%) | 4 (16.0%) |
| 55 to 59 Years | 48 (96.0%) | 0 (0.0%) |
| 60 to 64 Years | 28 (53.8%) | 0 (0.0%) |
| 65 to 74 Years | 10 (29.4%) | 0 (0.0%) |
| 75 Years and over | 2 (3.6%) | 2 (100.0%) |
| Total | 255 (58.0%) | 16 (6.3%) |
Employment Status by Educational Attainment in Big Run borough
According to labor force statistics for Big Run borough, 72.5% of individuals (222) out of the total population between 25 and 64 years of age (306) are in the labor force, with 6.3% or 14 of them being unemployed. The group with the highest labor force participation rate are those with the educational attainment of bachelor's degree or higher, with 88.6% or 31 individuals in the labor force. Within the labor force, individuals with high school diploma education have the highest percentage of unemployment, with 10.5% or 14 of them being unemployed.
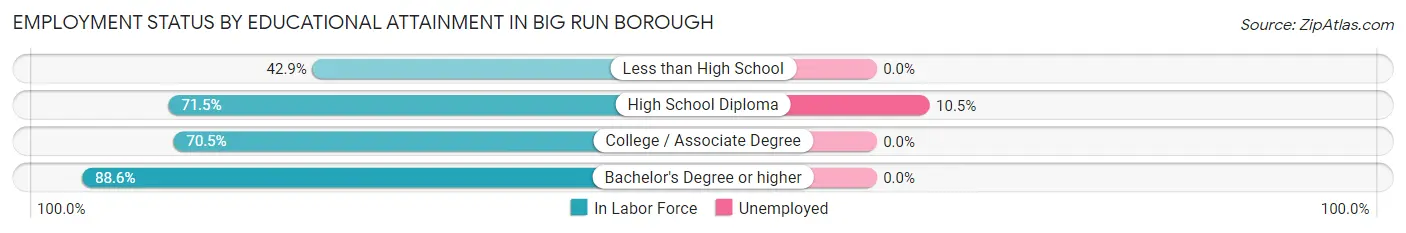
| Educational Attainment | In Labor Force | Unemployed |
| Less than High School | 3 (42.9%) | 0 (0.0%) |
| High School Diploma | 133 (71.5%) | 20 (10.5%) |
| College / Associate Degree | 55 (70.5%) | 0 (0.0%) |
| Bachelor's Degree or higher | 31 (88.6%) | 0 (0.0%) |
| Total | 222 (72.5%) | 19 (6.3%) |
Employment Occupations by Sex in Big Run borough
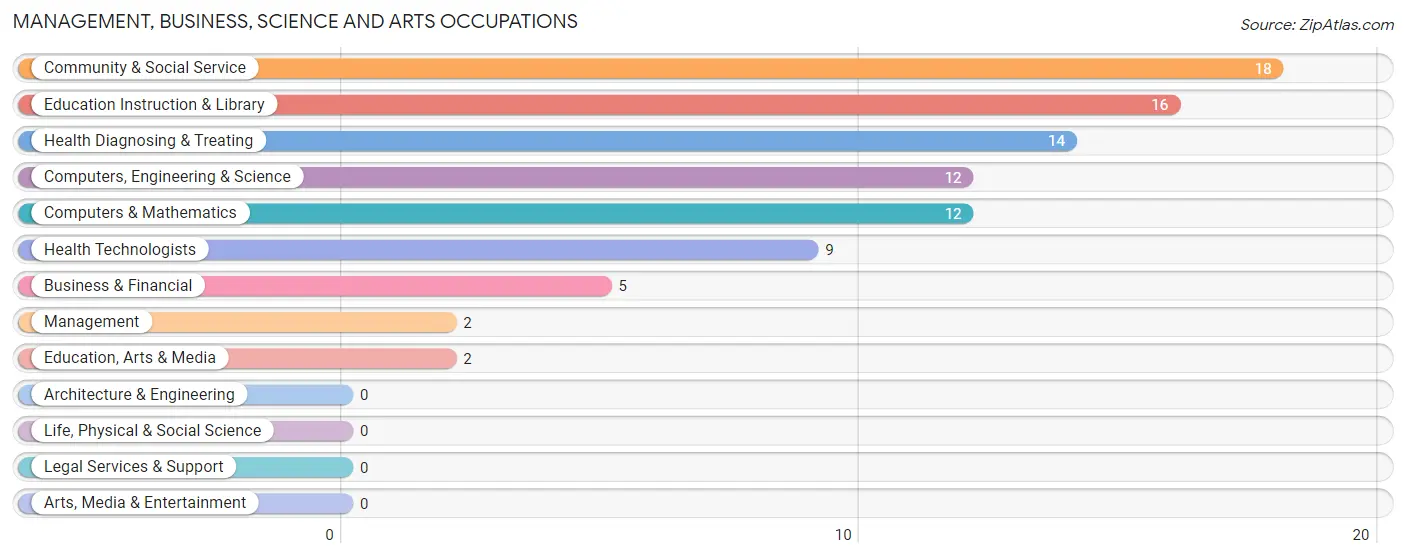
Management, Business, Science and Arts Occupations
The most common Management, Business, Science and Arts occupations in Big Run borough are Community & Social Service (18 | 7.5%), Education Instruction & Library (16 | 6.7%), Health Diagnosing & Treating (14 | 5.9%), Computers, Engineering & Science (12 | 5.0%), and Computers & Mathematics (12 | 5.0%).
Management, Business, Science and Arts Occupations by Sex
Within the Management, Business, Science and Arts occupations in Big Run borough, the most male-oriented occupations are Management (100.0%), Computers, Engineering & Science (100.0%), and Computers & Mathematics (100.0%), while the most female-oriented occupations are Business & Financial (100.0%), Community & Social Service (100.0%), and Education, Arts & Media (100.0%).
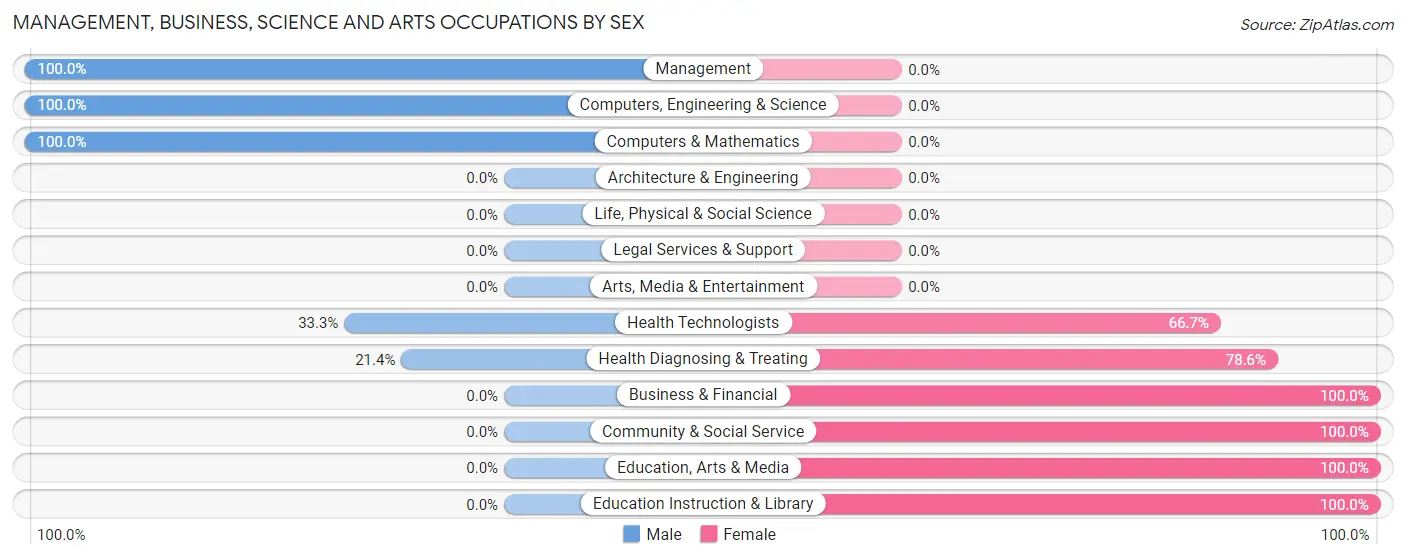
| Occupation | Male | Female |
| Management | 2 (100.0%) | 0 (0.0%) |
| Business & Financial | 0 (0.0%) | 5 (100.0%) |
| Computers, Engineering & Science | 12 (100.0%) | 0 (0.0%) |
| Computers & Mathematics | 12 (100.0%) | 0 (0.0%) |
| Architecture & Engineering | 0 (0.0%) | 0 (0.0%) |
| Life, Physical & Social Science | 0 (0.0%) | 0 (0.0%) |
| Community & Social Service | 0 (0.0%) | 18 (100.0%) |
| Education, Arts & Media | 0 (0.0%) | 2 (100.0%) |
| Legal Services & Support | 0 (0.0%) | 0 (0.0%) |
| Education Instruction & Library | 0 (0.0%) | 16 (100.0%) |
| Arts, Media & Entertainment | 0 (0.0%) | 0 (0.0%) |
| Health Diagnosing & Treating | 3 (21.4%) | 11 (78.6%) |
| Health Technologists | 3 (33.3%) | 6 (66.7%) |
| Total (Category) | 17 (33.3%) | 34 (66.7%) |
| Total (Overall) | 137 (57.3%) | 102 (42.7%) |
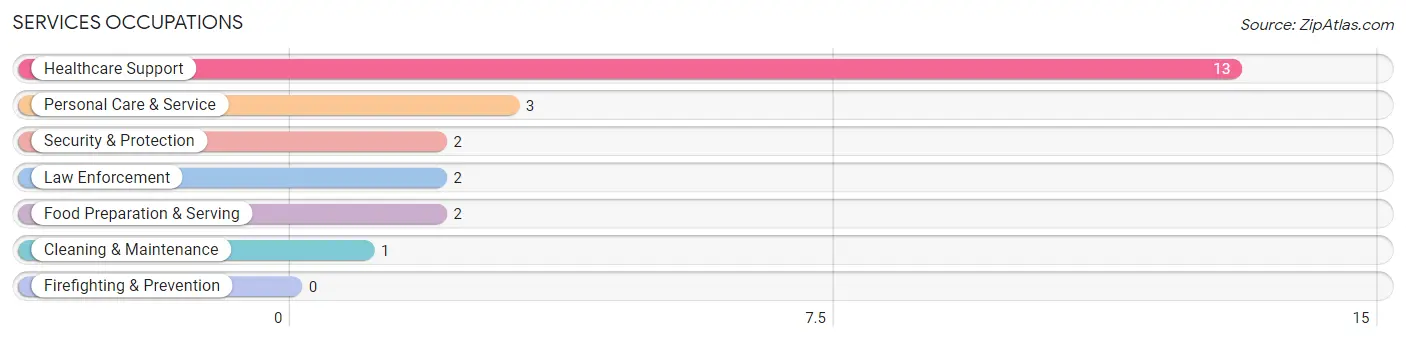
Services Occupations
The most common Services occupations in Big Run borough are Healthcare Support (13 | 5.4%), Personal Care & Service (3 | 1.3%), Security & Protection (2 | 0.8%), Law Enforcement (2 | 0.8%), and Food Preparation & Serving (2 | 0.8%).
Services Occupations by Sex
Within the Services occupations in Big Run borough, the most male-oriented occupations are Security & Protection (100.0%), and Law Enforcement (100.0%), while the most female-oriented occupations are Healthcare Support (100.0%), Food Preparation & Serving (100.0%), and Cleaning & Maintenance (100.0%).
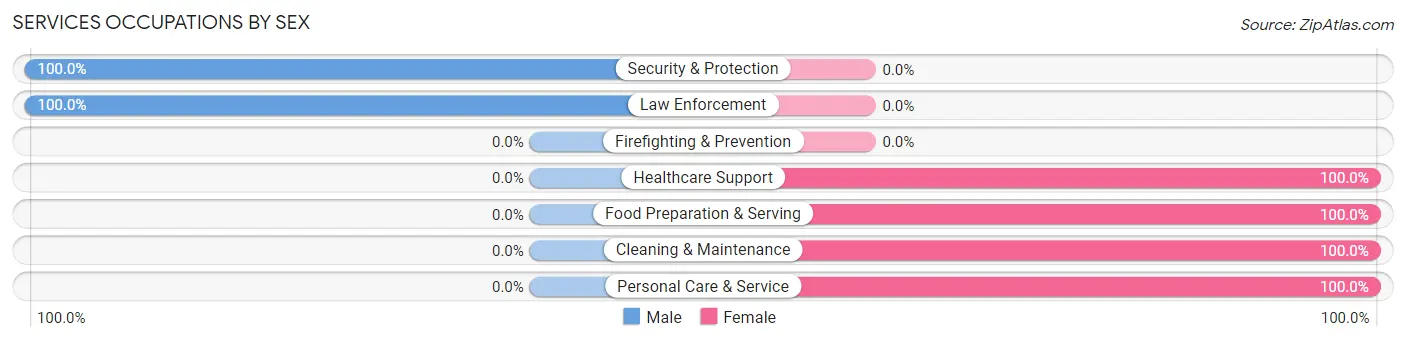
| Occupation | Male | Female |
| Healthcare Support | 0 (0.0%) | 13 (100.0%) |
| Security & Protection | 2 (100.0%) | 0 (0.0%) |
| Firefighting & Prevention | 0 (0.0%) | 0 (0.0%) |
| Law Enforcement | 2 (100.0%) | 0 (0.0%) |
| Food Preparation & Serving | 0 (0.0%) | 2 (100.0%) |
| Cleaning & Maintenance | 0 (0.0%) | 1 (100.0%) |
| Personal Care & Service | 0 (0.0%) | 3 (100.0%) |
| Total (Category) | 2 (9.5%) | 19 (90.5%) |
| Total (Overall) | 137 (57.3%) | 102 (42.7%) |
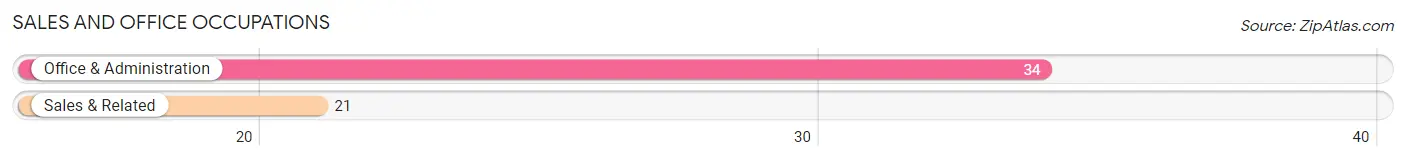
Sales and Office Occupations
The most common Sales and Office occupations in Big Run borough are Office & Administration (34 | 14.2%), and Sales & Related (21 | 8.8%).
Sales and Office Occupations by Sex
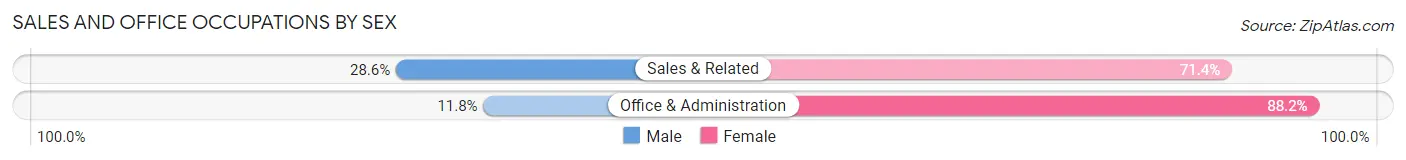
| Occupation | Male | Female |
| Sales & Related | 6 (28.6%) | 15 (71.4%) |
| Office & Administration | 4 (11.8%) | 30 (88.2%) |
| Total (Category) | 10 (18.2%) | 45 (81.8%) |
| Total (Overall) | 137 (57.3%) | 102 (42.7%) |
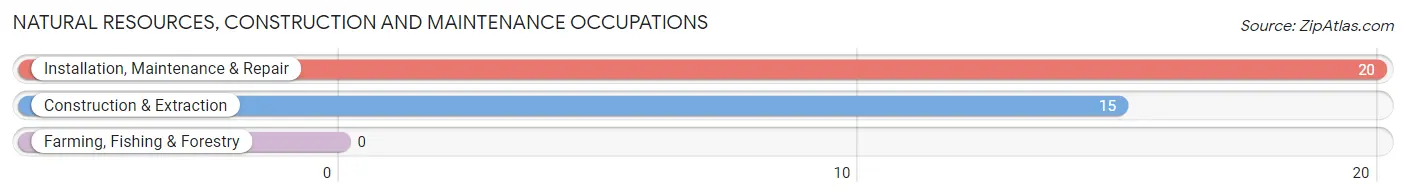
Natural Resources, Construction and Maintenance Occupations
The most common Natural Resources, Construction and Maintenance occupations in Big Run borough are Installation, Maintenance & Repair (20 | 8.4%), and Construction & Extraction (15 | 6.3%).
Natural Resources, Construction and Maintenance Occupations by Sex
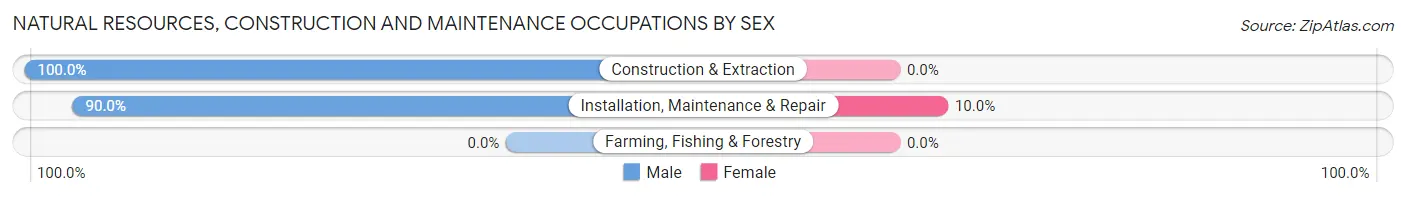
| Occupation | Male | Female |
| Farming, Fishing & Forestry | 0 (0.0%) | 0 (0.0%) |
| Construction & Extraction | 15 (100.0%) | 0 (0.0%) |
| Installation, Maintenance & Repair | 18 (90.0%) | 2 (10.0%) |
| Total (Category) | 33 (94.3%) | 2 (5.7%) |
| Total (Overall) | 137 (57.3%) | 102 (42.7%) |
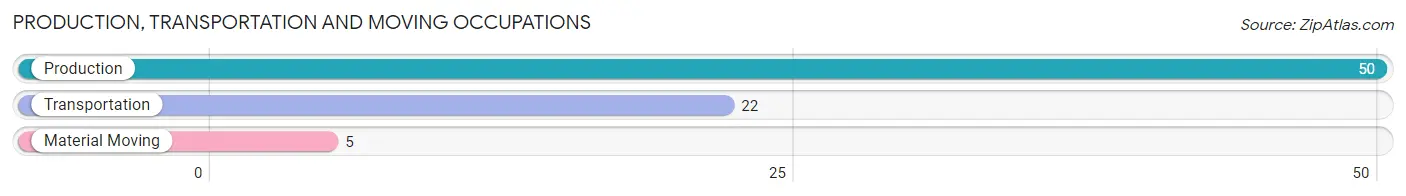
Production, Transportation and Moving Occupations
The most common Production, Transportation and Moving occupations in Big Run borough are Production (50 | 20.9%), Transportation (22 | 9.2%), and Material Moving (5 | 2.1%).
Production, Transportation and Moving Occupations by Sex
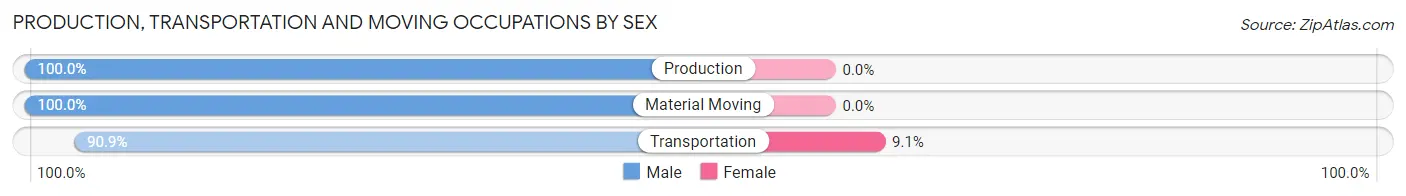
| Occupation | Male | Female |
| Production | 50 (100.0%) | 0 (0.0%) |
| Transportation | 20 (90.9%) | 2 (9.1%) |
| Material Moving | 5 (100.0%) | 0 (0.0%) |
| Total (Category) | 75 (97.4%) | 2 (2.6%) |
| Total (Overall) | 137 (57.3%) | 102 (42.7%) |
Employment Industries by Sex in Big Run borough
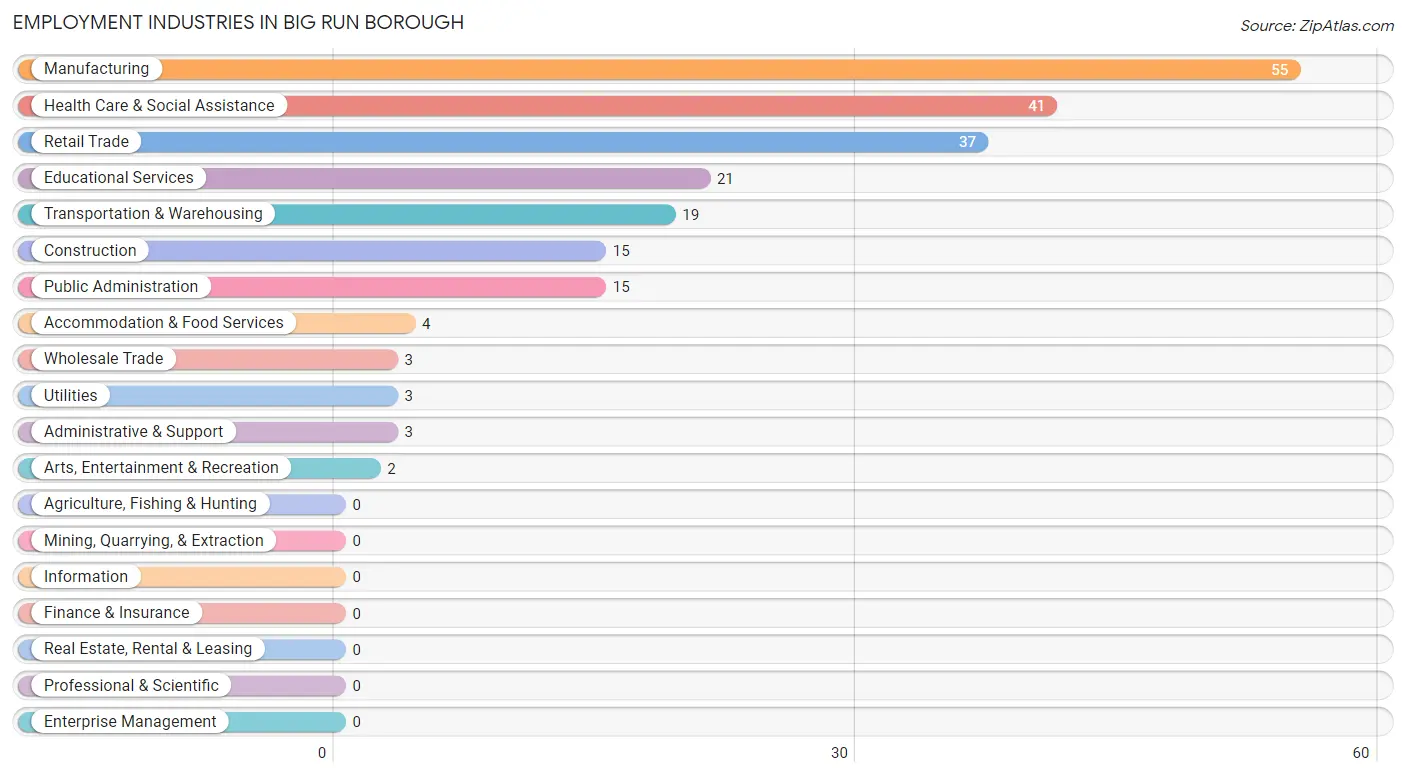
Employment Industries in Big Run borough
The major employment industries in Big Run borough include Manufacturing (55 | 23.0%), Health Care & Social Assistance (41 | 17.2%), Retail Trade (37 | 15.5%), Educational Services (21 | 8.8%), and Transportation & Warehousing (19 | 8.0%).
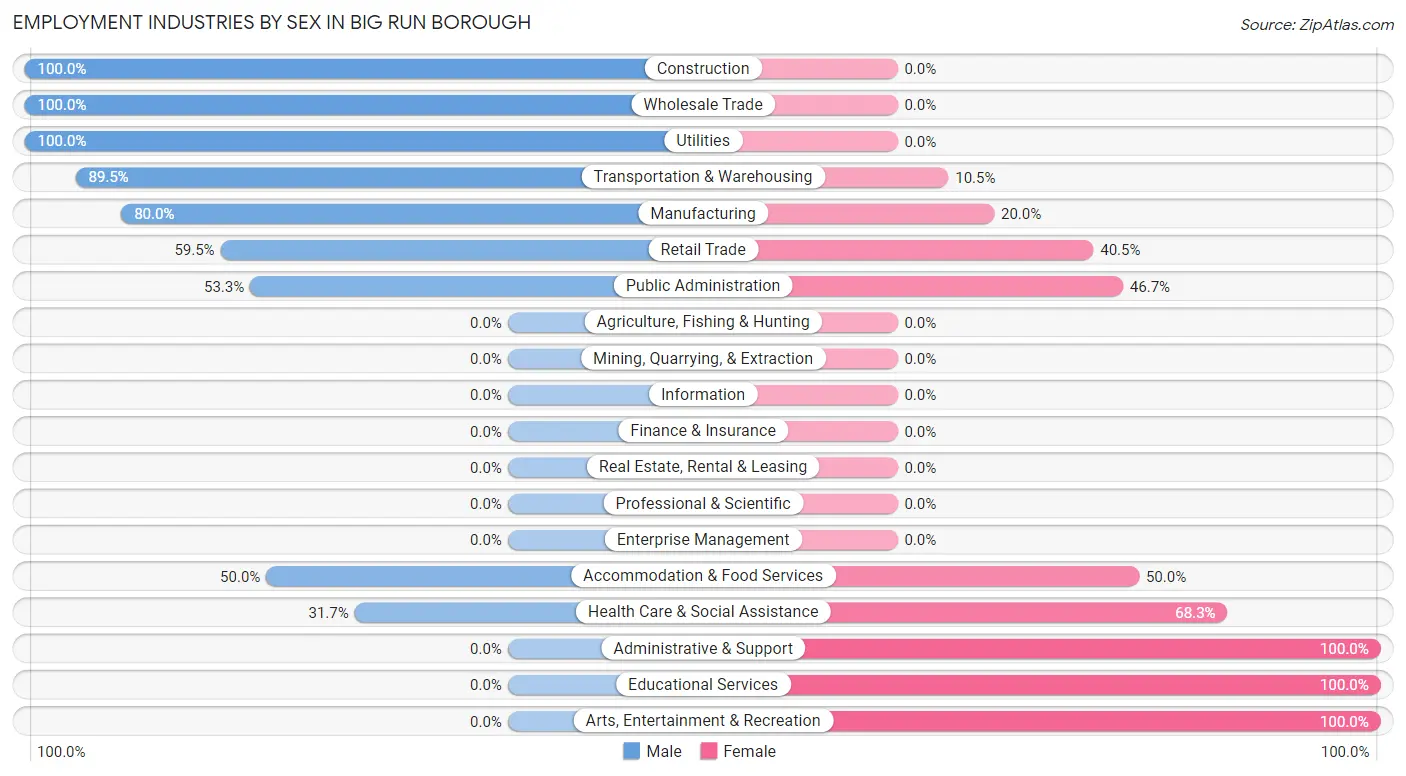
Employment Industries by Sex in Big Run borough
The Big Run borough industries that see more men than women are Construction (100.0%), Wholesale Trade (100.0%), and Utilities (100.0%), whereas the industries that tend to have a higher number of women are Administrative & Support (100.0%), Educational Services (100.0%), and Arts, Entertainment & Recreation (100.0%).
| Industry | Male | Female |
| Agriculture, Fishing & Hunting | 0 (0.0%) | 0 (0.0%) |
| Mining, Quarrying, & Extraction | 0 (0.0%) | 0 (0.0%) |
| Construction | 15 (100.0%) | 0 (0.0%) |
| Manufacturing | 44 (80.0%) | 11 (20.0%) |
| Wholesale Trade | 3 (100.0%) | 0 (0.0%) |
| Retail Trade | 22 (59.5%) | 15 (40.5%) |
| Transportation & Warehousing | 17 (89.5%) | 2 (10.5%) |
| Utilities | 3 (100.0%) | 0 (0.0%) |
| Information | 0 (0.0%) | 0 (0.0%) |
| Finance & Insurance | 0 (0.0%) | 0 (0.0%) |
| Real Estate, Rental & Leasing | 0 (0.0%) | 0 (0.0%) |
| Professional & Scientific | 0 (0.0%) | 0 (0.0%) |
| Enterprise Management | 0 (0.0%) | 0 (0.0%) |
| Administrative & Support | 0 (0.0%) | 3 (100.0%) |
| Educational Services | 0 (0.0%) | 21 (100.0%) |
| Health Care & Social Assistance | 13 (31.7%) | 28 (68.3%) |
| Arts, Entertainment & Recreation | 0 (0.0%) | 2 (100.0%) |
| Accommodation & Food Services | 2 (50.0%) | 2 (50.0%) |
| Public Administration | 8 (53.3%) | 7 (46.7%) |
| Total | 137 (57.3%) | 102 (42.7%) |
Education in Big Run borough
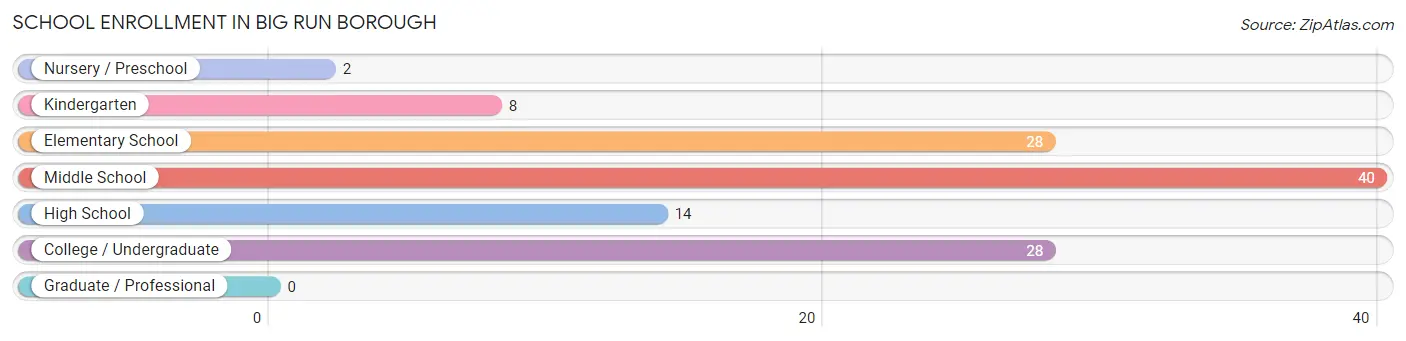
School Enrollment in Big Run borough
The most common levels of schooling among the 120 students in Big Run borough are middle school (40 | 33.3%), elementary school (28 | 23.3%), and college / undergraduate (28 | 23.3%).
| School Level | # Students | % Students |
| Nursery / Preschool | 2 | 1.7% |
| Kindergarten | 8 | 6.7% |
| Elementary School | 28 | 23.3% |
| Middle School | 40 | 33.3% |
| High School | 14 | 11.7% |
| College / Undergraduate | 28 | 23.3% |
| Graduate / Professional | 0 | 0.0% |
| Total | 120 | 100.0% |
School Enrollment by Age by Funding Source in Big Run borough
Out of a total of 120 students who are enrolled in schools in Big Run borough, 22 (18.3%) attend a private institution, while the remaining 98 (81.7%) are enrolled in public schools. The age group of 20 to 24 year olds has the highest likelihood of being enrolled in private schools, with 5 (71.4% in the age bracket) enrolled. Conversely, the age group of 3 to 4 year olds has the lowest likelihood of being enrolled in a private school, with 2 (100.0% in the age bracket) attending a public institution.
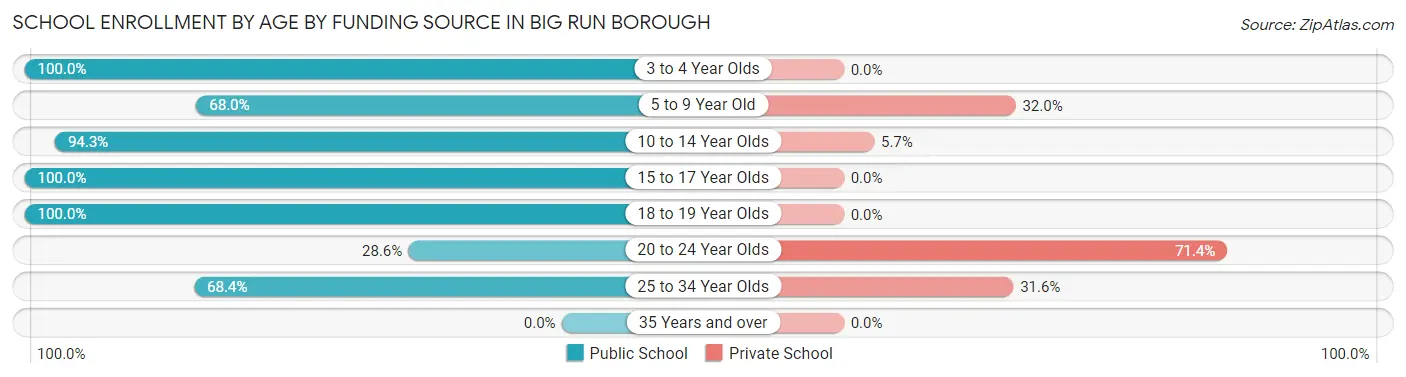
| Age Bracket | Public School | Private School |
| 3 to 4 Year Olds | 2 (100.0%) | 0 (0.0%) |
| 5 to 9 Year Old | 17 (68.0%) | 8 (32.0%) |
| 10 to 14 Year Olds | 50 (94.3%) | 3 (5.7%) |
| 15 to 17 Year Olds | 10 (100.0%) | 0 (0.0%) |
| 18 to 19 Year Olds | 4 (100.0%) | 0 (0.0%) |
| 20 to 24 Year Olds | 2 (28.6%) | 5 (71.4%) |
| 25 to 34 Year Olds | 13 (68.4%) | 6 (31.6%) |
| 35 Years and over | 0 (0.0%) | 0 (0.0%) |
| Total | 98 (81.7%) | 22 (18.3%) |
Educational Attainment by Field of Study in Big Run borough
Computers & mathematics (10 | 23.8%), visual & performing arts (8 | 19.1%), science & technology (6 | 14.3%), education (5 | 11.9%), and bio, nature & agricultural (3 | 7.1%) are the most common fields of study among 42 individuals in Big Run borough who have obtained a bachelor's degree or higher.
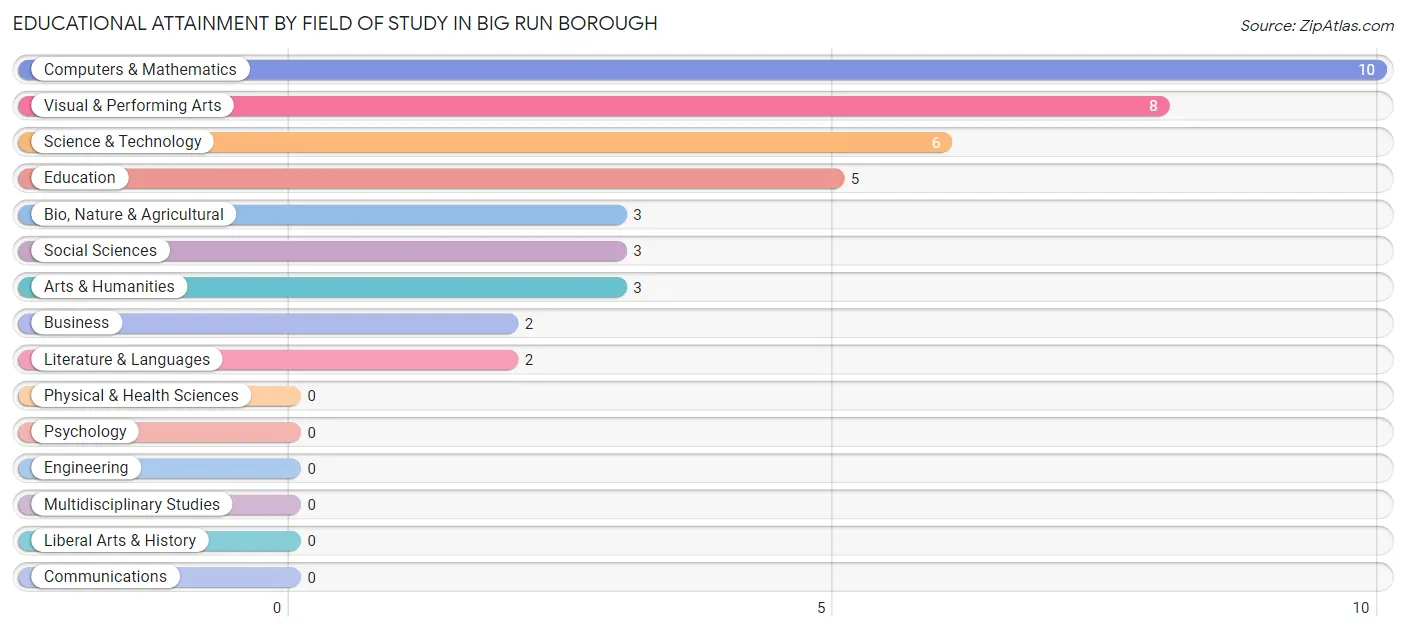
| Field of Study | # Graduates | % Graduates |
| Computers & Mathematics | 10 | 23.8% |
| Bio, Nature & Agricultural | 3 | 7.1% |
| Physical & Health Sciences | 0 | 0.0% |
| Psychology | 0 | 0.0% |
| Social Sciences | 3 | 7.1% |
| Engineering | 0 | 0.0% |
| Multidisciplinary Studies | 0 | 0.0% |
| Science & Technology | 6 | 14.3% |
| Business | 2 | 4.8% |
| Education | 5 | 11.9% |
| Literature & Languages | 2 | 4.8% |
| Liberal Arts & History | 0 | 0.0% |
| Visual & Performing Arts | 8 | 19.1% |
| Communications | 0 | 0.0% |
| Arts & Humanities | 3 | 7.1% |
| Total | 42 | 100.0% |
Transportation & Commute in Big Run borough
Vehicle Availability by Sex in Big Run borough
The most prevalent vehicle ownership categories in Big Run borough are males with 2 vehicles (78, accounting for 56.9%) and females with 2 vehicles (71, making up 76.5%).
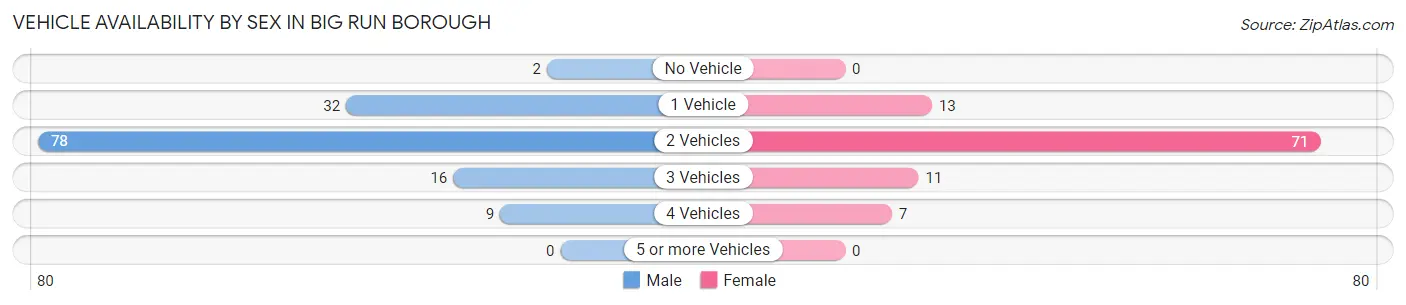
| Vehicles Available | Male | Female |
| No Vehicle | 2 (1.5%) | 0 (0.0%) |
| 1 Vehicle | 32 (23.4%) | 13 (12.8%) |
| 2 Vehicles | 78 (56.9%) | 71 (69.6%) |
| 3 Vehicles | 16 (11.7%) | 11 (10.8%) |
| 4 Vehicles | 9 (6.6%) | 7 (6.9%) |
| 5 or more Vehicles | 0 (0.0%) | 0 (0.0%) |
| Total | 137 (100.0%) | 102 (100.0%) |
Commute Time in Big Run borough
The most frequently occuring commute durations in Big Run borough are 15 to 19 minutes (46 commuters, 19.7%), 5 to 9 minutes (35 commuters, 15.0%), and 10 to 14 minutes (29 commuters, 12.4%).
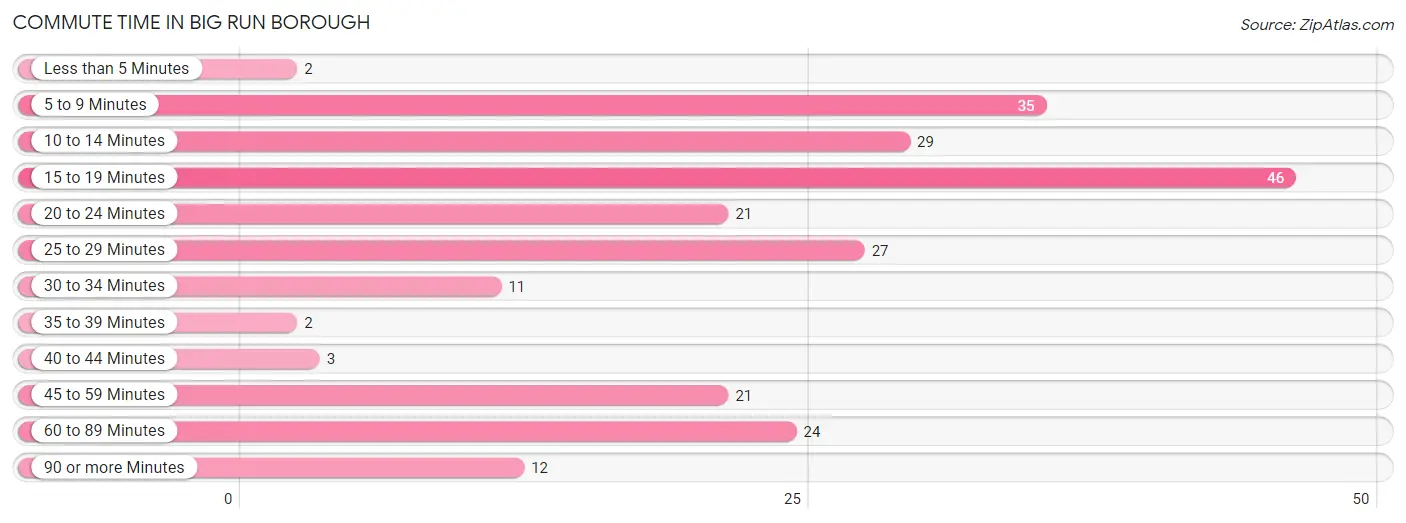
| Commute Time | # Commuters | % Commuters |
| Less than 5 Minutes | 2 | 0.9% |
| 5 to 9 Minutes | 35 | 15.0% |
| 10 to 14 Minutes | 29 | 12.4% |
| 15 to 19 Minutes | 46 | 19.7% |
| 20 to 24 Minutes | 21 | 9.0% |
| 25 to 29 Minutes | 27 | 11.6% |
| 30 to 34 Minutes | 11 | 4.7% |
| 35 to 39 Minutes | 2 | 0.9% |
| 40 to 44 Minutes | 3 | 1.3% |
| 45 to 59 Minutes | 21 | 9.0% |
| 60 to 89 Minutes | 24 | 10.3% |
| 90 or more Minutes | 12 | 5.1% |
Commute Time by Sex in Big Run borough
The most common commute times in Big Run borough are 5 to 9 minutes (22 commuters, 16.8%) for males and 15 to 19 minutes (24 commuters, 23.5%) for females.
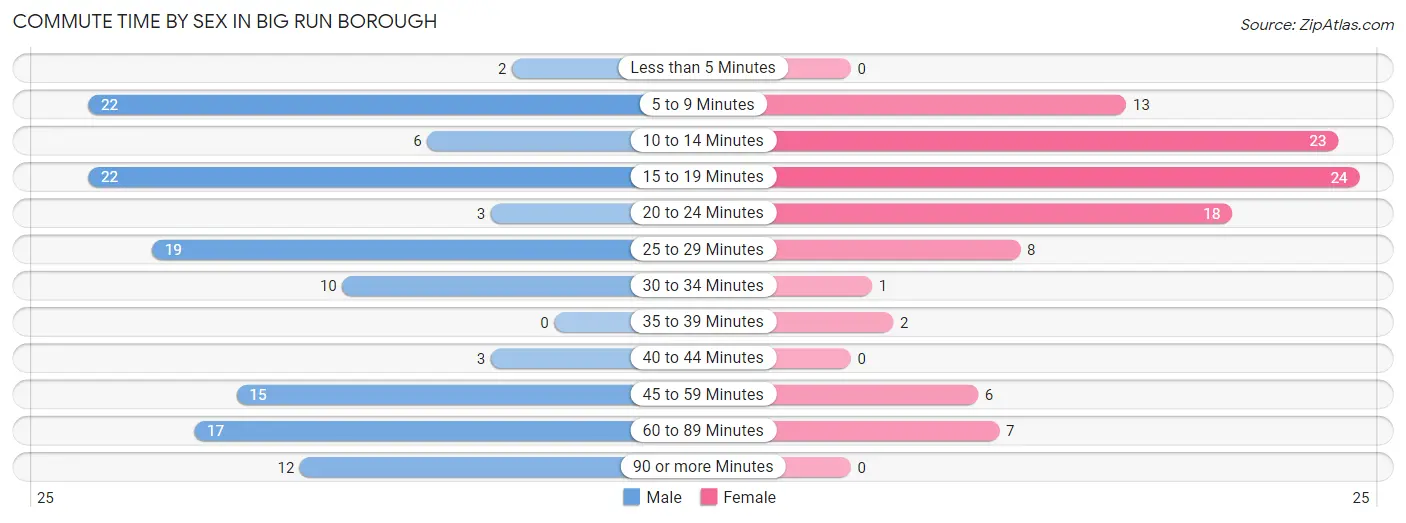
| Commute Time | Male | Female |
| Less than 5 Minutes | 2 (1.5%) | 0 (0.0%) |
| 5 to 9 Minutes | 22 (16.8%) | 13 (12.8%) |
| 10 to 14 Minutes | 6 (4.6%) | 23 (22.6%) |
| 15 to 19 Minutes | 22 (16.8%) | 24 (23.5%) |
| 20 to 24 Minutes | 3 (2.3%) | 18 (17.6%) |
| 25 to 29 Minutes | 19 (14.5%) | 8 (7.8%) |
| 30 to 34 Minutes | 10 (7.6%) | 1 (1.0%) |
| 35 to 39 Minutes | 0 (0.0%) | 2 (2.0%) |
| 40 to 44 Minutes | 3 (2.3%) | 0 (0.0%) |
| 45 to 59 Minutes | 15 (11.5%) | 6 (5.9%) |
| 60 to 89 Minutes | 17 (13.0%) | 7 (6.9%) |
| 90 or more Minutes | 12 (9.2%) | 0 (0.0%) |
Time of Departure to Work by Sex in Big Run borough
The most frequent times of departure to work in Big Run borough are 5:30 AM to 5:59 AM (28, 21.4%) for males and 7:30 AM to 7:59 AM (23, 22.6%) for females.
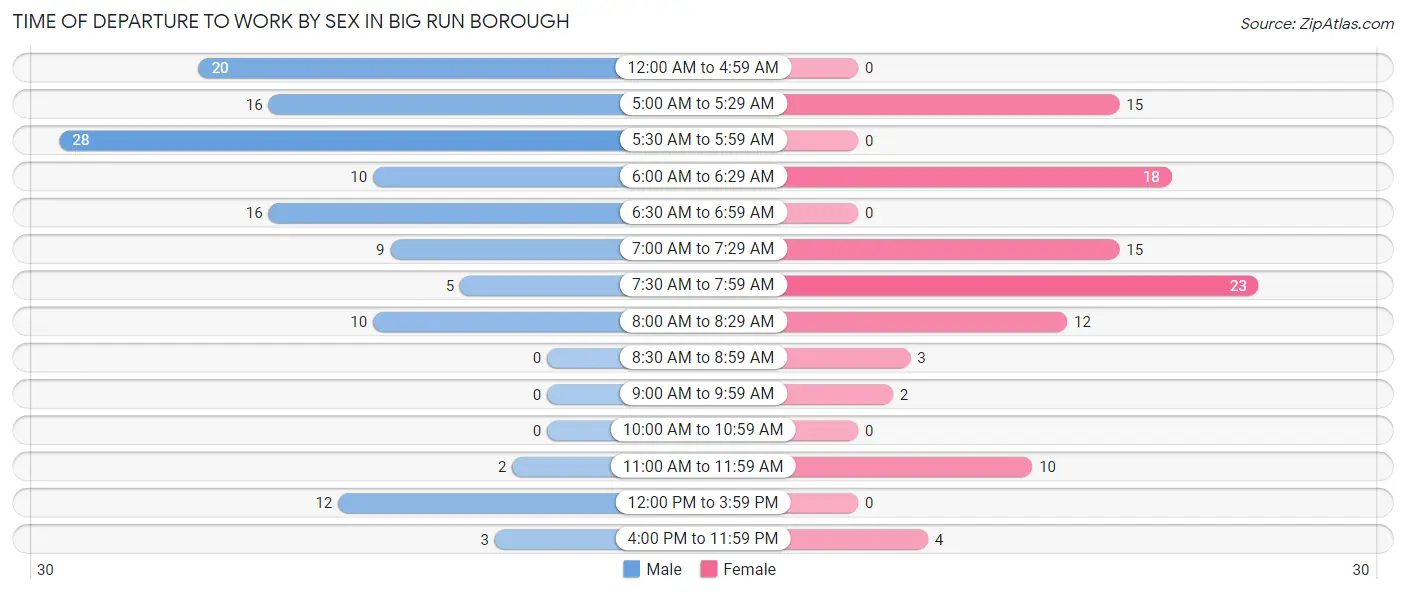
| Time of Departure | Male | Female |
| 12:00 AM to 4:59 AM | 20 (15.3%) | 0 (0.0%) |
| 5:00 AM to 5:29 AM | 16 (12.2%) | 15 (14.7%) |
| 5:30 AM to 5:59 AM | 28 (21.4%) | 0 (0.0%) |
| 6:00 AM to 6:29 AM | 10 (7.6%) | 18 (17.6%) |
| 6:30 AM to 6:59 AM | 16 (12.2%) | 0 (0.0%) |
| 7:00 AM to 7:29 AM | 9 (6.9%) | 15 (14.7%) |
| 7:30 AM to 7:59 AM | 5 (3.8%) | 23 (22.6%) |
| 8:00 AM to 8:29 AM | 10 (7.6%) | 12 (11.8%) |
| 8:30 AM to 8:59 AM | 0 (0.0%) | 3 (2.9%) |
| 9:00 AM to 9:59 AM | 0 (0.0%) | 2 (2.0%) |
| 10:00 AM to 10:59 AM | 0 (0.0%) | 0 (0.0%) |
| 11:00 AM to 11:59 AM | 2 (1.5%) | 10 (9.8%) |
| 12:00 PM to 3:59 PM | 12 (9.2%) | 0 (0.0%) |
| 4:00 PM to 11:59 PM | 3 (2.3%) | 4 (3.9%) |
| Total | 131 (100.0%) | 102 (100.0%) |
Housing Occupancy in Big Run borough
Occupancy by Ownership in Big Run borough
Of the total 221 dwellings in Big Run borough, owner-occupied units account for 158 (71.5%), while renter-occupied units make up 63 (28.5%).
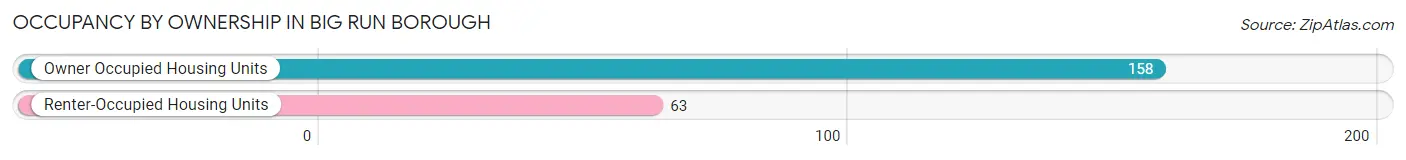
| Occupancy | # Housing Units | % Housing Units |
| Owner Occupied Housing Units | 158 | 71.5% |
| Renter-Occupied Housing Units | 63 | 28.5% |
| Total Occupied Housing Units | 221 | 100.0% |
Occupancy by Household Size in Big Run borough
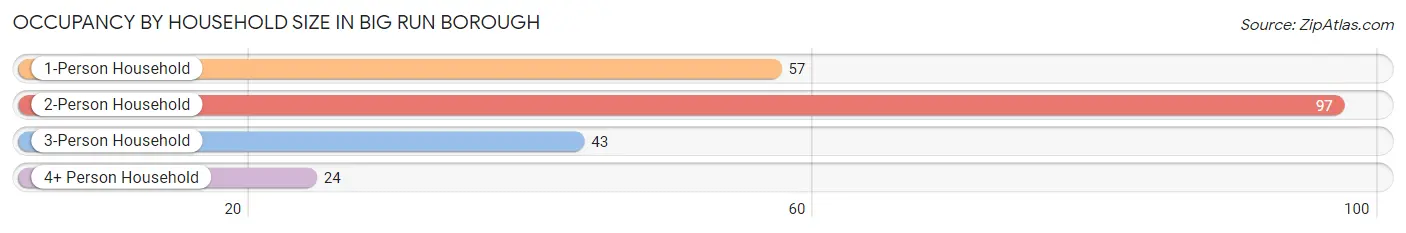
| Household Size | # Housing Units | % Housing Units |
| 1-Person Household | 57 | 25.8% |
| 2-Person Household | 97 | 43.9% |
| 3-Person Household | 43 | 19.5% |
| 4+ Person Household | 24 | 10.9% |
| Total Housing Units | 221 | 100.0% |
Occupancy by Ownership by Household Size in Big Run borough
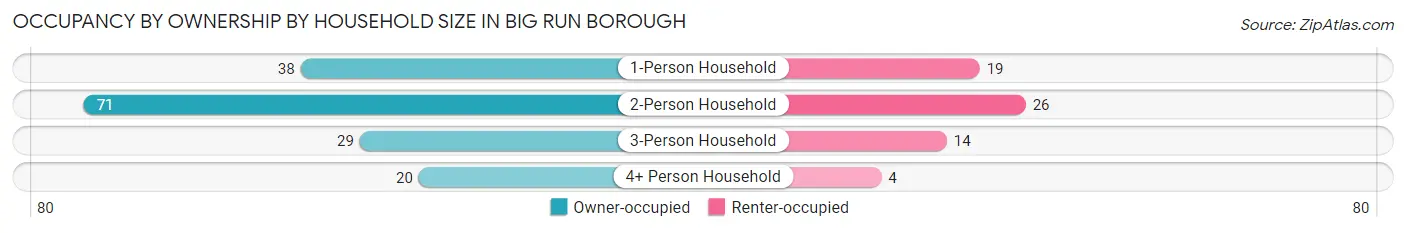
| Household Size | Owner-occupied | Renter-occupied |
| 1-Person Household | 38 (66.7%) | 19 (33.3%) |
| 2-Person Household | 71 (73.2%) | 26 (26.8%) |
| 3-Person Household | 29 (67.4%) | 14 (32.6%) |
| 4+ Person Household | 20 (83.3%) | 4 (16.7%) |
| Total Housing Units | 158 (71.5%) | 63 (28.5%) |
Occupancy by Educational Attainment in Big Run borough
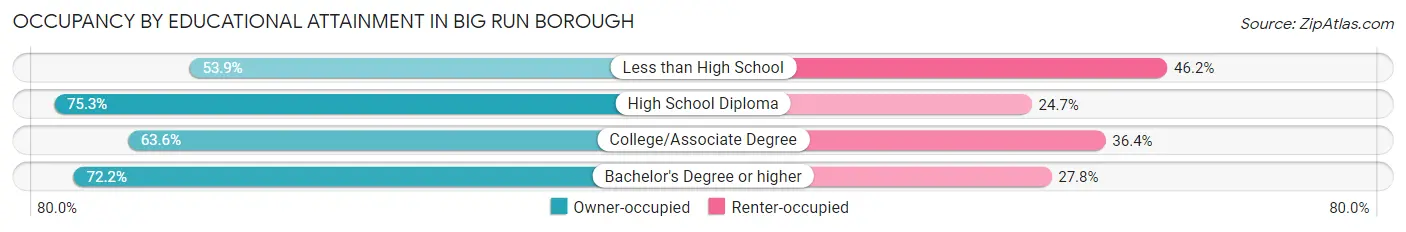
| Household Size | Owner-occupied | Renter-occupied |
| Less than High School | 7 (53.8%) | 6 (46.2%) |
| High School Diploma | 110 (75.3%) | 36 (24.7%) |
| College/Associate Degree | 28 (63.6%) | 16 (36.4%) |
| Bachelor's Degree or higher | 13 (72.2%) | 5 (27.8%) |
Occupancy by Age of Householder in Big Run borough
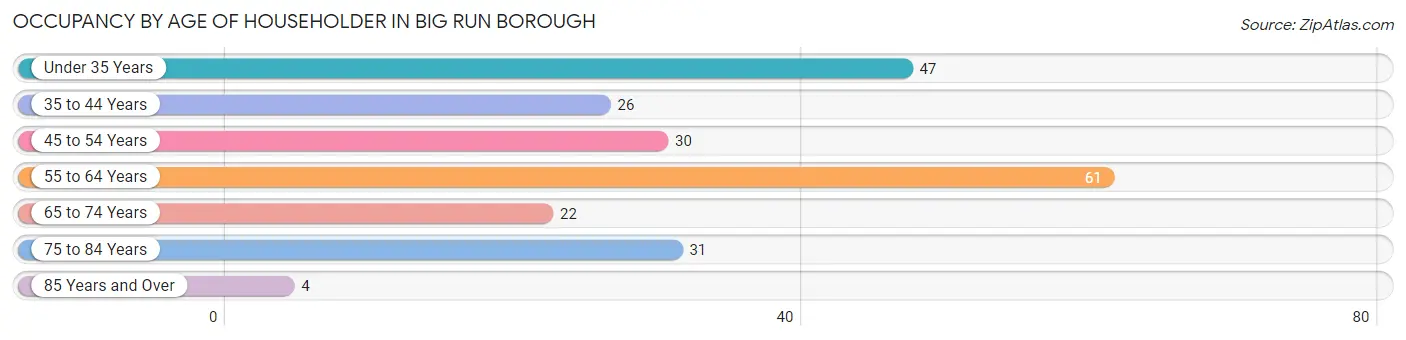
| Age Bracket | # Households | % Households |
| Under 35 Years | 47 | 21.3% |
| 35 to 44 Years | 26 | 11.8% |
| 45 to 54 Years | 30 | 13.6% |
| 55 to 64 Years | 61 | 27.6% |
| 65 to 74 Years | 22 | 10.0% |
| 75 to 84 Years | 31 | 14.0% |
| 85 Years and Over | 4 | 1.8% |
| Total | 221 | 100.0% |
Housing Finances in Big Run borough
Median Income by Occupancy in Big Run borough
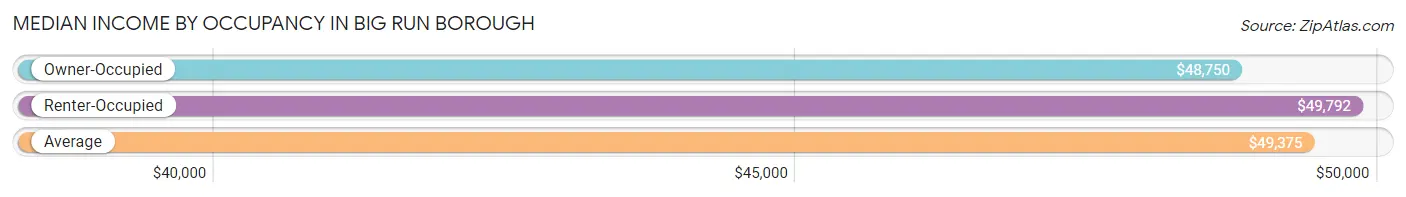
| Occupancy Type | # Households | Median Income |
| Owner-Occupied | 158 (71.5%) | $48,750 |
| Renter-Occupied | 63 (28.5%) | $49,792 |
| Average | 221 (100.0%) | $49,375 |
Occupancy by Householder Income Bracket in Big Run borough
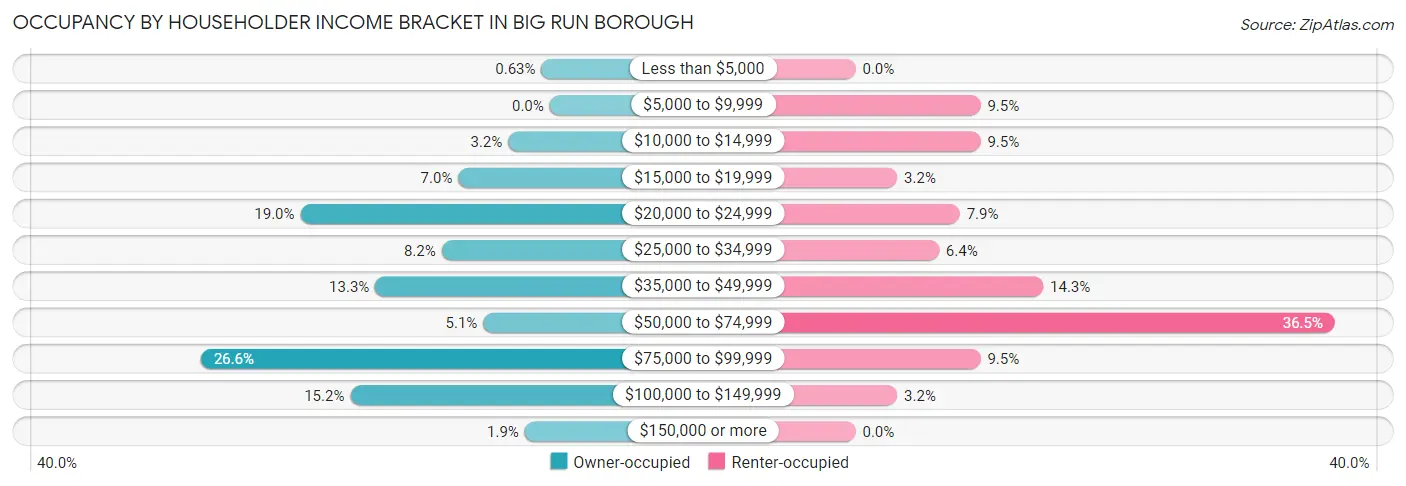
| Income Bracket | Owner-occupied | Renter-occupied |
| Less than $5,000 | 1 (0.6%) | 0 (0.0%) |
| $5,000 to $9,999 | 0 (0.0%) | 6 (9.5%) |
| $10,000 to $14,999 | 5 (3.2%) | 6 (9.5%) |
| $15,000 to $19,999 | 11 (7.0%) | 2 (3.2%) |
| $20,000 to $24,999 | 30 (19.0%) | 5 (7.9%) |
| $25,000 to $34,999 | 13 (8.2%) | 4 (6.4%) |
| $35,000 to $49,999 | 21 (13.3%) | 9 (14.3%) |
| $50,000 to $74,999 | 8 (5.1%) | 23 (36.5%) |
| $75,000 to $99,999 | 42 (26.6%) | 6 (9.5%) |
| $100,000 to $149,999 | 24 (15.2%) | 2 (3.2%) |
| $150,000 or more | 3 (1.9%) | 0 (0.0%) |
| Total | 158 (100.0%) | 63 (100.0%) |
Monthly Housing Cost Tiers in Big Run borough
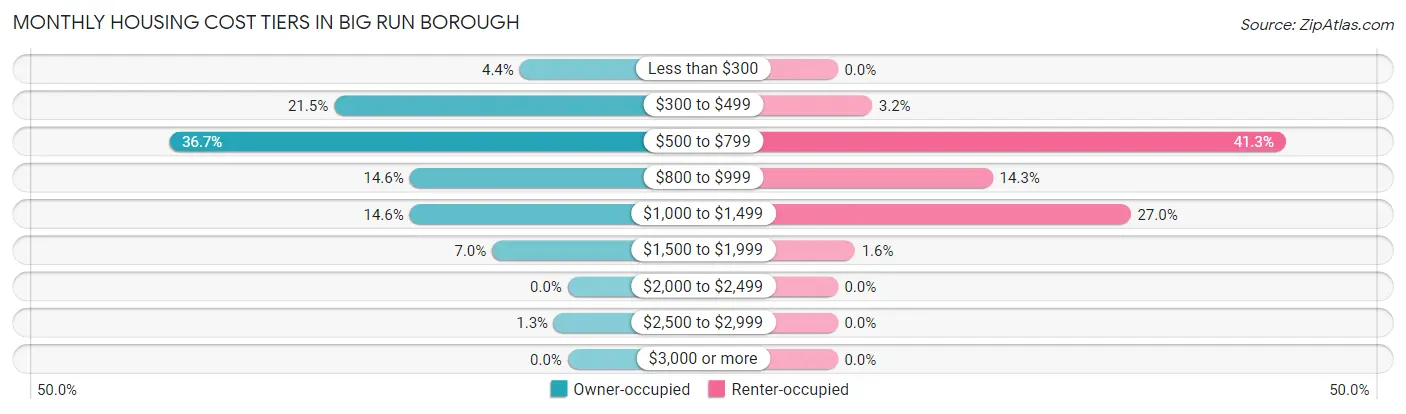
| Monthly Cost | Owner-occupied | Renter-occupied |
| Less than $300 | 7 (4.4%) | 0 (0.0%) |
| $300 to $499 | 34 (21.5%) | 2 (3.2%) |
| $500 to $799 | 58 (36.7%) | 26 (41.3%) |
| $800 to $999 | 23 (14.6%) | 9 (14.3%) |
| $1,000 to $1,499 | 23 (14.6%) | 17 (27.0%) |
| $1,500 to $1,999 | 11 (7.0%) | 1 (1.6%) |
| $2,000 to $2,499 | 0 (0.0%) | 0 (0.0%) |
| $2,500 to $2,999 | 2 (1.3%) | 0 (0.0%) |
| $3,000 or more | 0 (0.0%) | 0 (0.0%) |
| Total | 158 (100.0%) | 63 (100.0%) |
Physical Housing Characteristics in Big Run borough
Housing Structures in Big Run borough
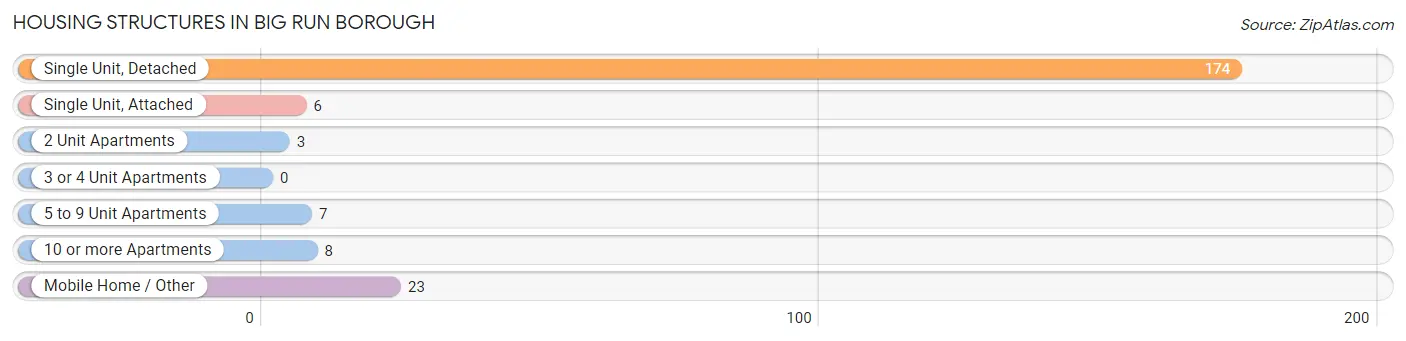
| Structure Type | # Housing Units | % Housing Units |
| Single Unit, Detached | 174 | 78.7% |
| Single Unit, Attached | 6 | 2.7% |
| 2 Unit Apartments | 3 | 1.4% |
| 3 or 4 Unit Apartments | 0 | 0.0% |
| 5 to 9 Unit Apartments | 7 | 3.2% |
| 10 or more Apartments | 8 | 3.6% |
| Mobile Home / Other | 23 | 10.4% |
| Total | 221 | 100.0% |
Housing Structures by Occupancy in Big Run borough
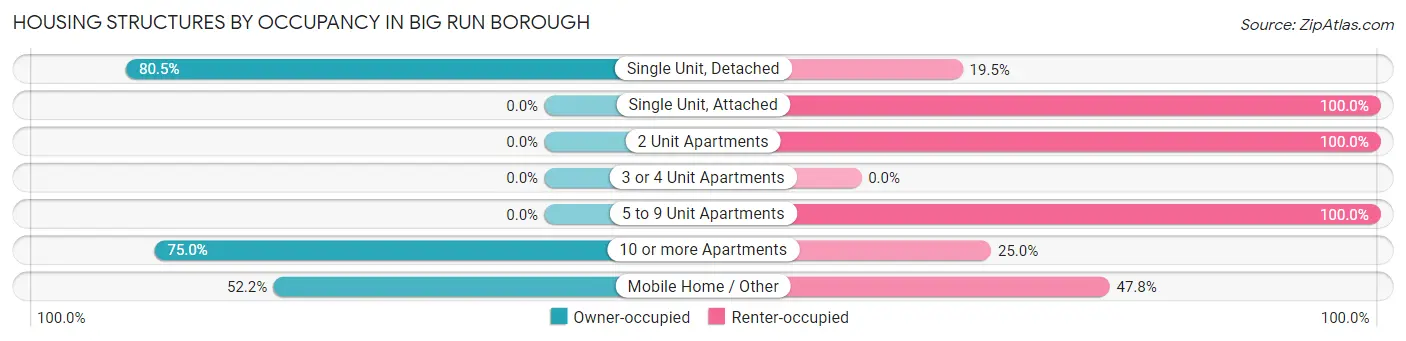
| Structure Type | Owner-occupied | Renter-occupied |
| Single Unit, Detached | 140 (80.5%) | 34 (19.5%) |
| Single Unit, Attached | 0 (0.0%) | 6 (100.0%) |
| 2 Unit Apartments | 0 (0.0%) | 3 (100.0%) |
| 3 or 4 Unit Apartments | 0 (0.0%) | 0 (0.0%) |
| 5 to 9 Unit Apartments | 0 (0.0%) | 7 (100.0%) |
| 10 or more Apartments | 6 (75.0%) | 2 (25.0%) |
| Mobile Home / Other | 12 (52.2%) | 11 (47.8%) |
| Total | 158 (71.5%) | 63 (28.5%) |
Housing Structures by Number of Rooms in Big Run borough
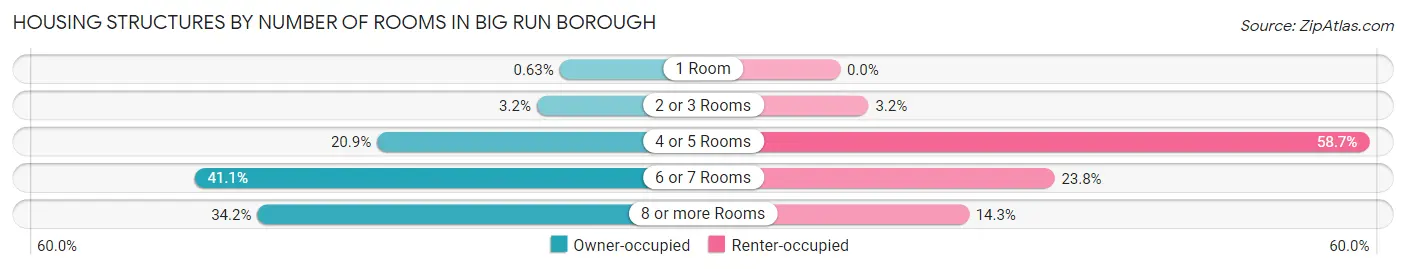
| Number of Rooms | Owner-occupied | Renter-occupied |
| 1 Room | 1 (0.6%) | 0 (0.0%) |
| 2 or 3 Rooms | 5 (3.2%) | 2 (3.2%) |
| 4 or 5 Rooms | 33 (20.9%) | 37 (58.7%) |
| 6 or 7 Rooms | 65 (41.1%) | 15 (23.8%) |
| 8 or more Rooms | 54 (34.2%) | 9 (14.3%) |
| Total | 158 (100.0%) | 63 (100.0%) |
Housing Structure by Heating Type in Big Run borough
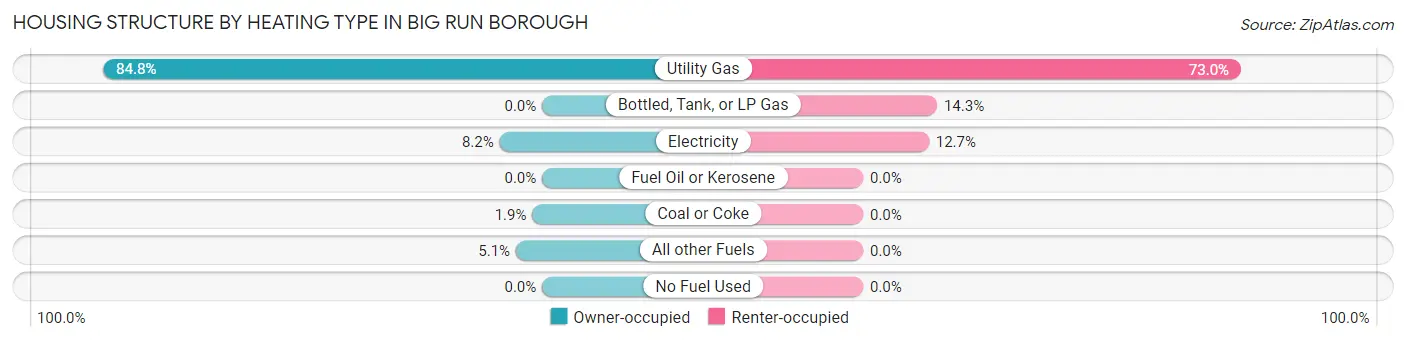
| Heating Type | Owner-occupied | Renter-occupied |
| Utility Gas | 134 (84.8%) | 46 (73.0%) |
| Bottled, Tank, or LP Gas | 0 (0.0%) | 9 (14.3%) |
| Electricity | 13 (8.2%) | 8 (12.7%) |
| Fuel Oil or Kerosene | 0 (0.0%) | 0 (0.0%) |
| Coal or Coke | 3 (1.9%) | 0 (0.0%) |
| All other Fuels | 8 (5.1%) | 0 (0.0%) |
| No Fuel Used | 0 (0.0%) | 0 (0.0%) |
| Total | 158 (100.0%) | 63 (100.0%) |
Household Vehicle Usage in Big Run borough
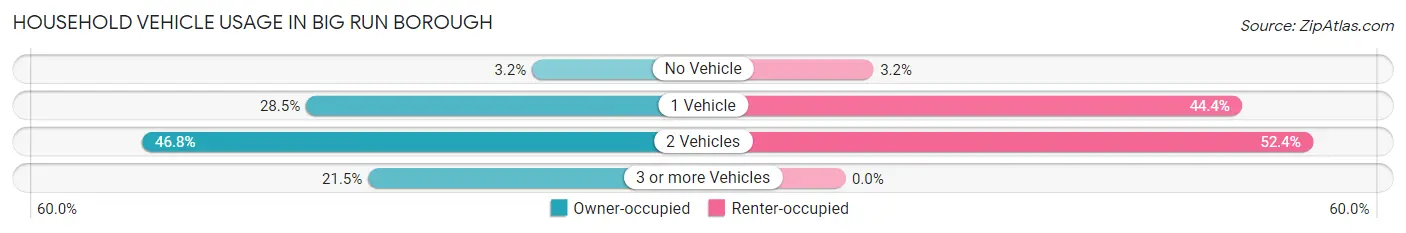
| Vehicles per Household | Owner-occupied | Renter-occupied |
| No Vehicle | 5 (3.2%) | 2 (3.2%) |
| 1 Vehicle | 45 (28.5%) | 28 (44.4%) |
| 2 Vehicles | 74 (46.8%) | 33 (52.4%) |
| 3 or more Vehicles | 34 (21.5%) | 0 (0.0%) |
| Total | 158 (100.0%) | 63 (100.0%) |
Real Estate & Mortgages in Big Run borough
Real Estate and Mortgage Overview in Big Run borough
| Characteristic | Without Mortgage | With Mortgage |
| Housing Units | 85 | 73 |
| Median Property Value | $98,300 | $94,700 |
| Median Household Income | $38,750 | $0 |
| Monthly Housing Costs | $514 | $0 |
| Real Estate Taxes | $1,462 | $3 |
Property Value by Mortgage Status in Big Run borough
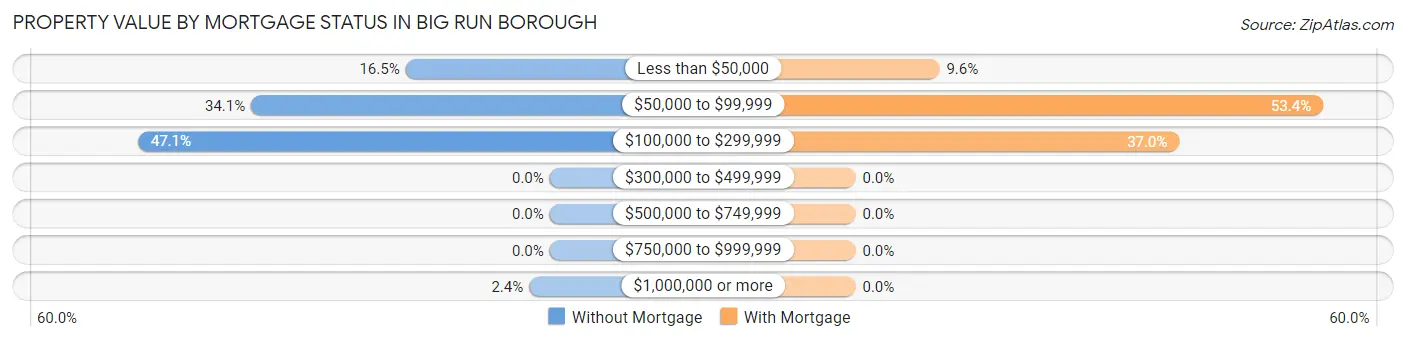
| Property Value | Without Mortgage | With Mortgage |
| Less than $50,000 | 14 (16.5%) | 7 (9.6%) |
| $50,000 to $99,999 | 29 (34.1%) | 39 (53.4%) |
| $100,000 to $299,999 | 40 (47.1%) | 27 (37.0%) |
| $300,000 to $499,999 | 0 (0.0%) | 0 (0.0%) |
| $500,000 to $749,999 | 0 (0.0%) | 0 (0.0%) |
| $750,000 to $999,999 | 0 (0.0%) | 0 (0.0%) |
| $1,000,000 or more | 2 (2.4%) | 0 (0.0%) |
| Total | 85 (100.0%) | 73 (100.0%) |
Household Income by Mortgage Status in Big Run borough
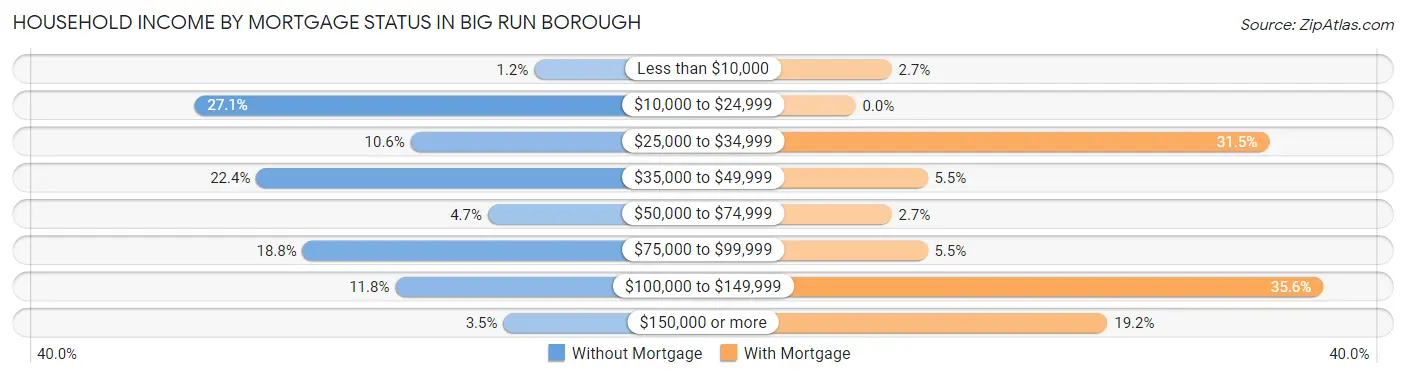
| Household Income | Without Mortgage | With Mortgage |
| Less than $10,000 | 1 (1.2%) | 2 (2.7%) |
| $10,000 to $24,999 | 23 (27.1%) | 0 (0.0%) |
| $25,000 to $34,999 | 9 (10.6%) | 23 (31.5%) |
| $35,000 to $49,999 | 19 (22.4%) | 4 (5.5%) |
| $50,000 to $74,999 | 4 (4.7%) | 2 (2.7%) |
| $75,000 to $99,999 | 16 (18.8%) | 4 (5.5%) |
| $100,000 to $149,999 | 10 (11.8%) | 26 (35.6%) |
| $150,000 or more | 3 (3.5%) | 14 (19.2%) |
| Total | 85 (100.0%) | 73 (100.0%) |
Property Value to Household Income Ratio in Big Run borough
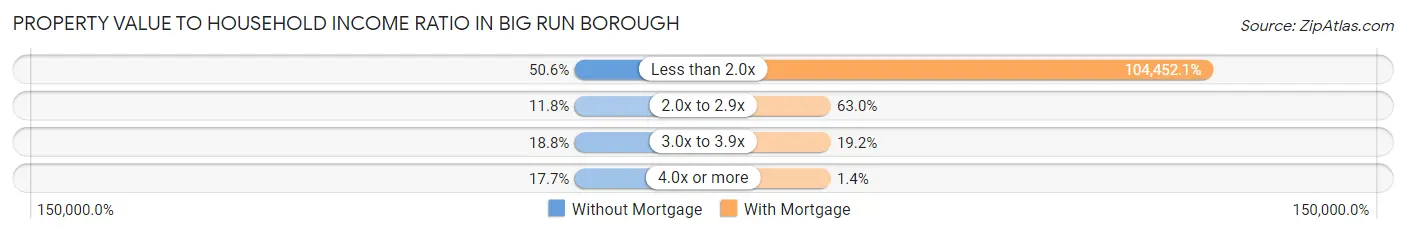
| Value-to-Income Ratio | Without Mortgage | With Mortgage |
| Less than 2.0x | 43 (50.6%) | 76,250 (104,452.1%) |
| 2.0x to 2.9x | 10 (11.8%) | 46 (63.0%) |
| 3.0x to 3.9x | 16 (18.8%) | 14 (19.2%) |
| 4.0x or more | 15 (17.6%) | 1 (1.4%) |
| Total | 85 (100.0%) | 73 (100.0%) |
Real Estate Taxes by Mortgage Status in Big Run borough
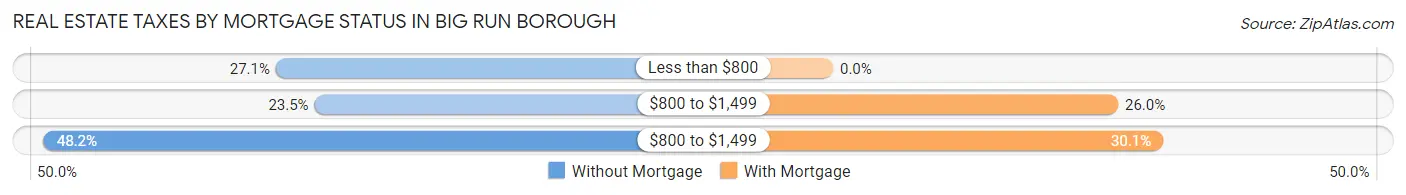
| Property Taxes | Without Mortgage | With Mortgage |
| Less than $800 | 23 (27.1%) | 0 (0.0%) |
| $800 to $1,499 | 20 (23.5%) | 19 (26.0%) |
| $800 to $1,499 | 41 (48.2%) | 22 (30.1%) |
| Total | 85 (100.0%) | 73 (100.0%) |
Health & Disability in Big Run borough
Health Insurance Coverage by Age in Big Run borough
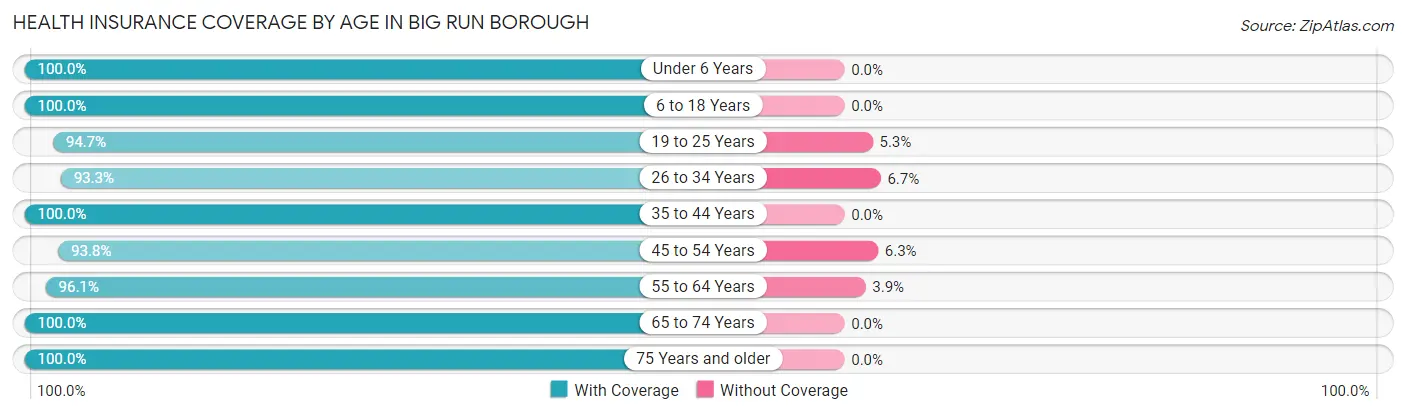
| Age Bracket | With Coverage | Without Coverage |
| Under 6 Years | 18 (100.0%) | 0 (0.0%) |
| 6 to 18 Years | 90 (100.0%) | 0 (0.0%) |
| 19 to 25 Years | 36 (94.7%) | 2 (5.3%) |
| 26 to 34 Years | 83 (93.3%) | 6 (6.7%) |
| 35 to 44 Years | 61 (100.0%) | 0 (0.0%) |
| 45 to 54 Years | 45 (93.8%) | 3 (6.2%) |
| 55 to 64 Years | 98 (96.1%) | 4 (3.9%) |
| 65 to 74 Years | 34 (100.0%) | 0 (0.0%) |
| 75 Years and older | 56 (100.0%) | 0 (0.0%) |
| Total | 521 (97.2%) | 15 (2.8%) |
Health Insurance Coverage by Citizenship Status in Big Run borough
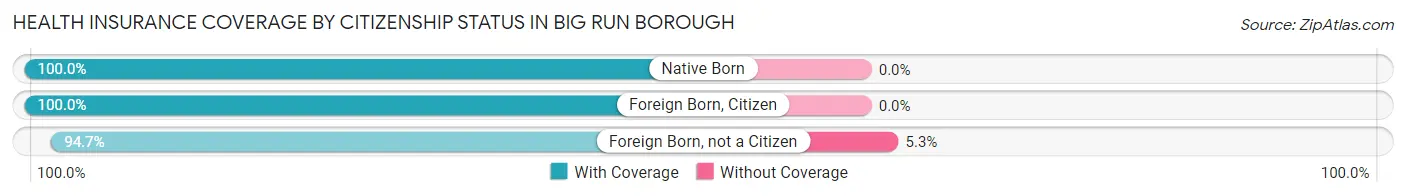
| Citizenship Status | With Coverage | Without Coverage |
| Native Born | 18 (100.0%) | 0 (0.0%) |
| Foreign Born, Citizen | 90 (100.0%) | 0 (0.0%) |
| Foreign Born, not a Citizen | 36 (94.7%) | 2 (5.3%) |
Health Insurance Coverage by Household Income in Big Run borough
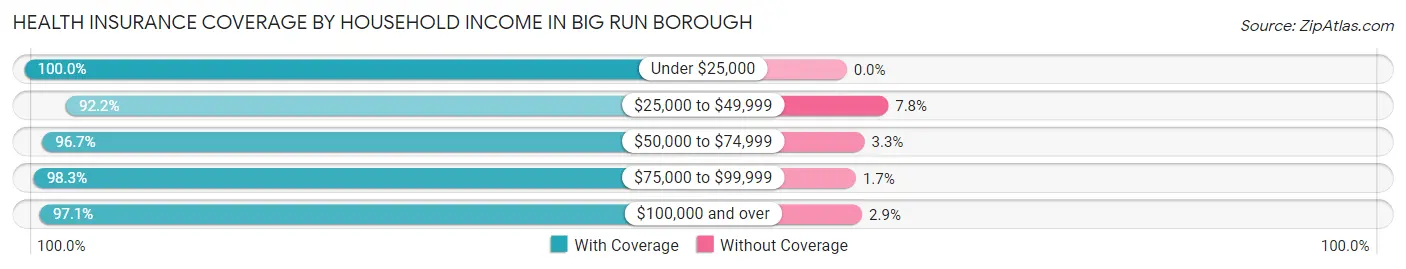
| Household Income | With Coverage | Without Coverage |
| Under $25,000 | 146 (100.0%) | 0 (0.0%) |
| $25,000 to $49,999 | 95 (92.2%) | 8 (7.8%) |
| $50,000 to $74,999 | 58 (96.7%) | 2 (3.3%) |
| $75,000 to $99,999 | 114 (98.3%) | 2 (1.7%) |
| $100,000 and over | 101 (97.1%) | 3 (2.9%) |
Public vs Private Health Insurance Coverage by Age in Big Run borough
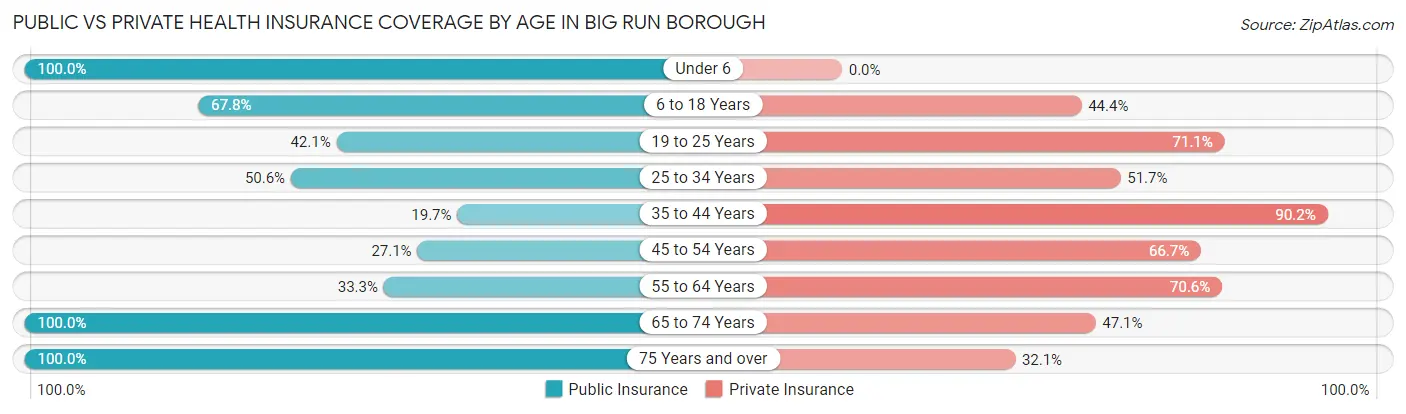
| Age Bracket | Public Insurance | Private Insurance |
| Under 6 | 18 (100.0%) | 0 (0.0%) |
| 6 to 18 Years | 61 (67.8%) | 40 (44.4%) |
| 19 to 25 Years | 16 (42.1%) | 27 (71.1%) |
| 25 to 34 Years | 45 (50.6%) | 46 (51.7%) |
| 35 to 44 Years | 12 (19.7%) | 55 (90.2%) |
| 45 to 54 Years | 13 (27.1%) | 32 (66.7%) |
| 55 to 64 Years | 34 (33.3%) | 72 (70.6%) |
| 65 to 74 Years | 34 (100.0%) | 16 (47.1%) |
| 75 Years and over | 56 (100.0%) | 18 (32.1%) |
| Total | 289 (53.9%) | 306 (57.1%) |
Disability Status by Sex by Age in Big Run borough
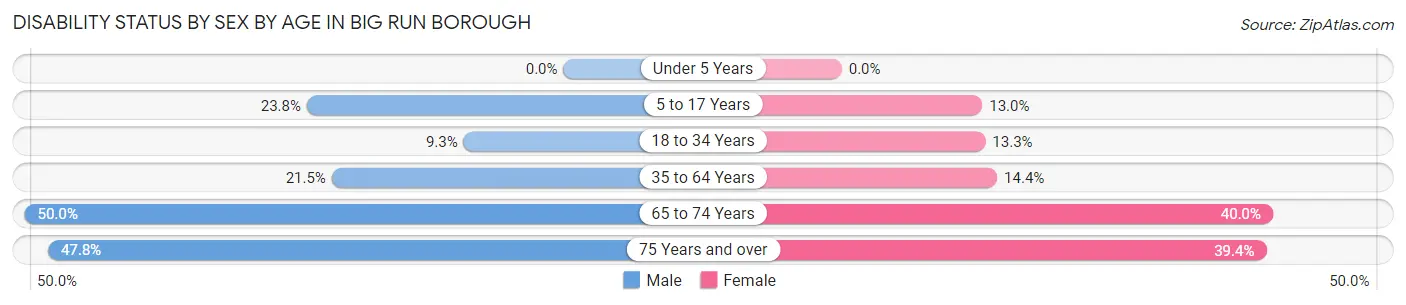
| Age Bracket | Male | Female |
| Under 5 Years | 0 (0.0%) | 0 (0.0%) |
| 5 to 17 Years | 10 (23.8%) | 6 (13.0%) |
| 18 to 34 Years | 5 (9.3%) | 10 (13.3%) |
| 35 to 64 Years | 23 (21.5%) | 15 (14.4%) |
| 65 to 74 Years | 7 (50.0%) | 8 (40.0%) |
| 75 Years and over | 11 (47.8%) | 13 (39.4%) |
Disability Class by Sex by Age in Big Run borough
Disability Class: Hearing Difficulty
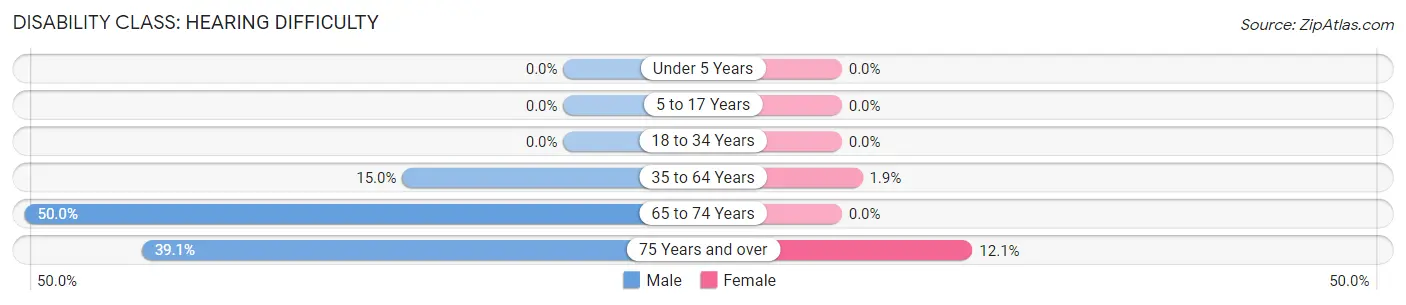
| Age Bracket | Male | Female |
| Under 5 Years | 0 (0.0%) | 0 (0.0%) |
| 5 to 17 Years | 0 (0.0%) | 0 (0.0%) |
| 18 to 34 Years | 0 (0.0%) | 0 (0.0%) |
| 35 to 64 Years | 16 (14.9%) | 2 (1.9%) |
| 65 to 74 Years | 7 (50.0%) | 0 (0.0%) |
| 75 Years and over | 9 (39.1%) | 4 (12.1%) |
Disability Class: Vision Difficulty
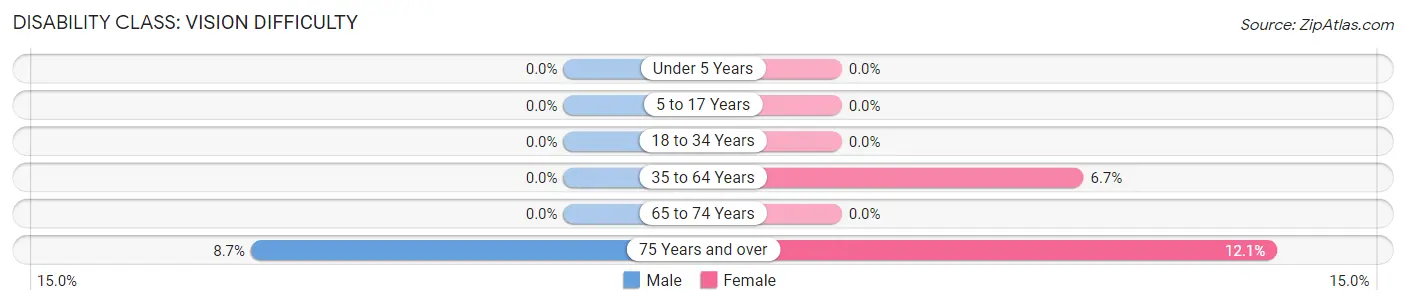
| Age Bracket | Male | Female |
| Under 5 Years | 0 (0.0%) | 0 (0.0%) |
| 5 to 17 Years | 0 (0.0%) | 0 (0.0%) |
| 18 to 34 Years | 0 (0.0%) | 0 (0.0%) |
| 35 to 64 Years | 0 (0.0%) | 7 (6.7%) |
| 65 to 74 Years | 0 (0.0%) | 0 (0.0%) |
| 75 Years and over | 2 (8.7%) | 4 (12.1%) |
Disability Class: Cognitive Difficulty
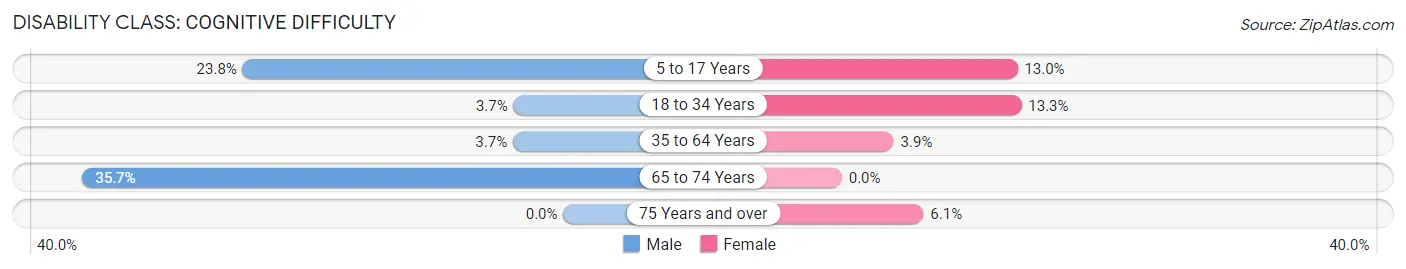
| Age Bracket | Male | Female |
| 5 to 17 Years | 10 (23.8%) | 6 (13.0%) |
| 18 to 34 Years | 2 (3.7%) | 10 (13.3%) |
| 35 to 64 Years | 4 (3.7%) | 4 (3.8%) |
| 65 to 74 Years | 5 (35.7%) | 0 (0.0%) |
| 75 Years and over | 0 (0.0%) | 2 (6.1%) |
Disability Class: Ambulatory Difficulty
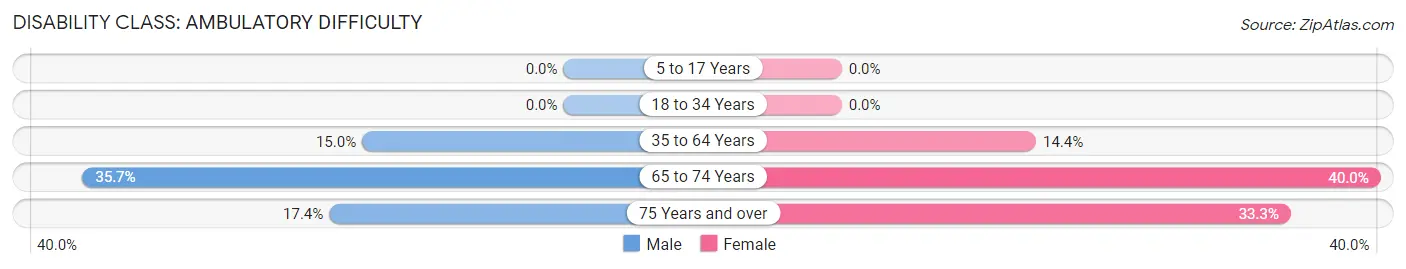
| Age Bracket | Male | Female |
| 5 to 17 Years | 0 (0.0%) | 0 (0.0%) |
| 18 to 34 Years | 0 (0.0%) | 0 (0.0%) |
| 35 to 64 Years | 16 (14.9%) | 15 (14.4%) |
| 65 to 74 Years | 5 (35.7%) | 8 (40.0%) |
| 75 Years and over | 4 (17.4%) | 11 (33.3%) |
Disability Class: Self-Care Difficulty
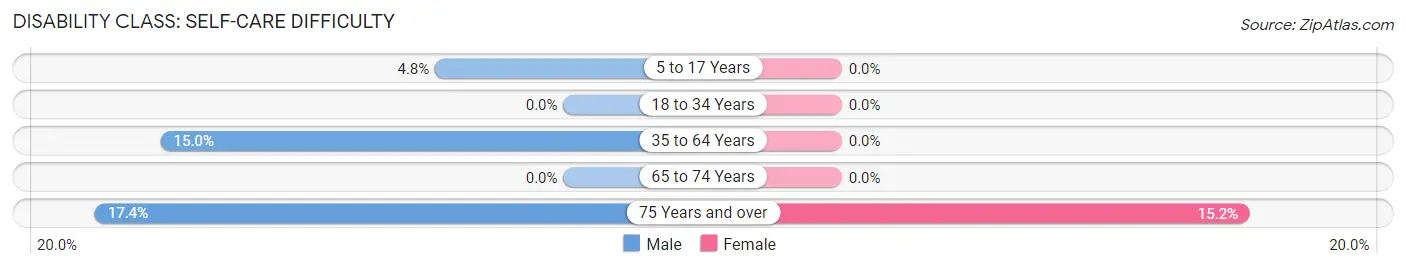
| Age Bracket | Male | Female |
| 5 to 17 Years | 2 (4.8%) | 0 (0.0%) |
| 18 to 34 Years | 0 (0.0%) | 0 (0.0%) |
| 35 to 64 Years | 16 (14.9%) | 0 (0.0%) |
| 65 to 74 Years | 0 (0.0%) | 0 (0.0%) |
| 75 Years and over | 4 (17.4%) | 5 (15.1%) |
Technology Access in Big Run borough
Computing Device Access in Big Run borough
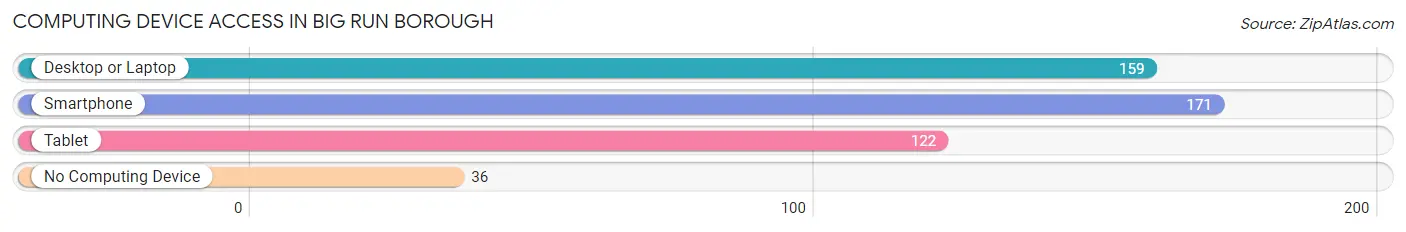
| Device Type | # Households | % Households |
| Desktop or Laptop | 159 | 72.0% |
| Smartphone | 171 | 77.4% |
| Tablet | 122 | 55.2% |
| No Computing Device | 36 | 16.3% |
| Total | 221 | 100.0% |
Internet Access in Big Run borough
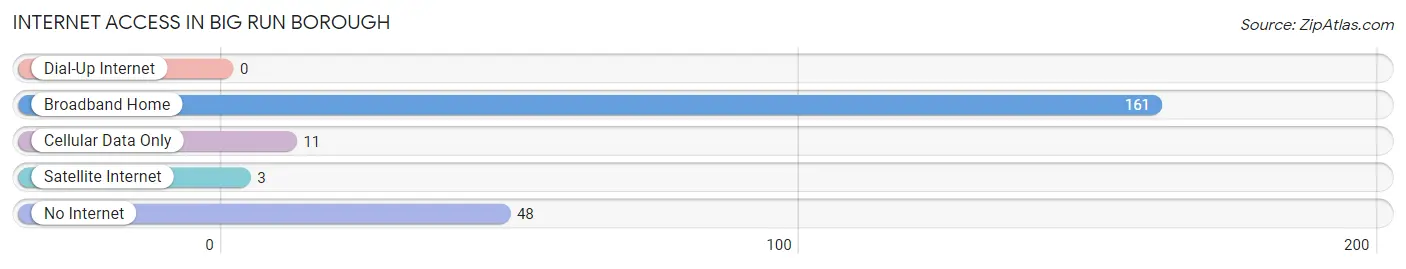
| Internet Type | # Households | % Households |
| Dial-Up Internet | 0 | 0.0% |
| Broadband Home | 161 | 72.9% |
| Cellular Data Only | 11 | 5.0% |
| Satellite Internet | 3 | 1.4% |
| No Internet | 48 | 21.7% |
| Total | 221 | 100.0% |
Big Run borough Summary
Big Run Borough is a small borough located in Jefferson County, Pennsylvania. It is situated in the foothills of the Allegheny Mountains and is part of the larger city of Punxsutawney. The borough has a population of just over 500 people and covers an area of 0.3 square miles.
History
Big Run Borough was founded in 1876 and was originally known as Big Run Station. The name was changed to Big Run Borough in 1883. The borough was named after the nearby Big Run Creek, which was named for the large number of fish that could be found in the creek.
The first settlers in the area were of German descent and they established a small farming community. The first post office was established in 1877 and the first school was built in 1881.
The borough was incorporated in 1883 and the first mayor was elected in 1884. The first fire company was established in 1885 and the first church was built in 1886.
Geography
Big Run Borough is located in the foothills of the Allegheny Mountains in Jefferson County, Pennsylvania. It is situated at an elevation of 1,845 feet and covers an area of 0.3 square miles. The borough is bordered by the townships of Bell, Rose, and Washington.
The climate in Big Run Borough is humid continental, with cold winters and warm summers. The average annual temperature is 48°F and the average annual precipitation is 40 inches.
Economy
The economy of Big Run Borough is largely based on agriculture and tourism. The borough is home to several small farms that produce a variety of crops, including corn, soybeans, and hay. The borough also has several small businesses, including a grocery store, a hardware store, and a restaurant.
Tourism is an important part of the economy of Big Run Borough. The borough is home to several attractions, including the Big Run Creek, which is a popular spot for fishing and canoeing. The borough also has several parks and trails, as well as a golf course.
Demographics
As of the 2010 census, the population of Big Run Borough was 514 people. The racial makeup of the borough was 97.3% White, 0.6% African American, 0.2% Native American, 0.4% Asian, and 1.5% from other races. The median household income was $37,500 and the median family income was $41,250.
The population of Big Run Borough is largely made up of families. The median age of the population is 43.7 years and the majority of the population is married. The borough has a low crime rate and a high rate of homeownership.
Conclusion
Big Run Borough is a small borough located in Jefferson County, Pennsylvania. It is situated in the foothills of the Allegheny Mountains and is part of the larger city of Punxsutawney. The borough has a population of just over 500 people and covers an area of 0.3 square miles. The economy of Big Run Borough is largely based on agriculture and tourism. The population of Big Run Borough is largely made up of families and the median age of the population is 43.7 years. The borough has a low crime rate and a high rate of homeownership.
Common Questions
What is the Total Population of Big Run borough?
Total Population of Big Run borough is 536.
What is the Total Male Population of Big Run borough?
Total Male Population of Big Run borough is 248.
What is the Total Female Population of Big Run borough?
Total Female Population of Big Run borough is 288.
What is the Ratio of Males per 100 Females in Big Run borough?
There are 86.11 Males per 100 Females in Big Run borough.
What is the Ratio of Females per 100 Males in Big Run borough?
There are 116.13 Females per 100 Males in Big Run borough.
What is the Median Population Age in Big Run borough?
Median Population Age in Big Run borough is 40.1 Years.
What is the Average Family Size in Big Run borough
Average Family Size in Big Run borough is 2.6 People.
What is the Average Household Size in Big Run borough
Average Household Size in Big Run borough is 2.4 People.
What is Per Capita Income in Big Run borough?
Per Capita income in Big Run borough is $25,230.
What is the Median Family Income in Big Run borough?
Median Family Income in Big Run borough is $60,500.
What is the Median Household income in Big Run borough?
Median Household Income in Big Run borough is $49,375.
What is Income or Wage Gap in Big Run borough?
Income or Wage Gap in Big Run borough is 50.2%.
Women in Big Run borough earn 49.8 cents for every dollar earned by a man.
What is Inequality or Gini Index in Big Run borough?
Inequality or Gini Index in Big Run borough is 0.38.
How Large is the Labor Force in Big Run borough?
There are 255 People in the Labor Forcein in Big Run borough.
What is the Percentage of People in the Labor Force in Big Run borough?
58.0% of People are in the Labor Force in Big Run borough.
What is the Unemployment Rate in Big Run borough?
Unemployment Rate in Big Run borough is 6.3%.