Bear Rocks, PA
Bear Rocks Map
Bear Rocks Overview
1,057
TOTAL POPULATION
535
MALE POPULATION
522
FEMALE POPULATION
102.49
MALES / 100 FEMALES
97.57
FEMALES / 100 MALES
57.2
MEDIAN AGE
2.2
AVG FAMILY SIZE
2.0
AVG HOUSEHOLD SIZE
$37,312
PER CAPITA INCOME
$77,200
AVG FAMILY INCOME
$64,325
AVG HOUSEHOLD INCOME
50.0%
WAGE / INCOME GAP [ % ]
50.0¢/ $1
WAGE / INCOME GAP [ $ ]
0.30
INEQUALITY / GINI INDEX
574
LABOR FORCE [ PEOPLE ]
56.2%
PERCENT IN LABOR FORCE
10.6%
UNEMPLOYMENT RATE
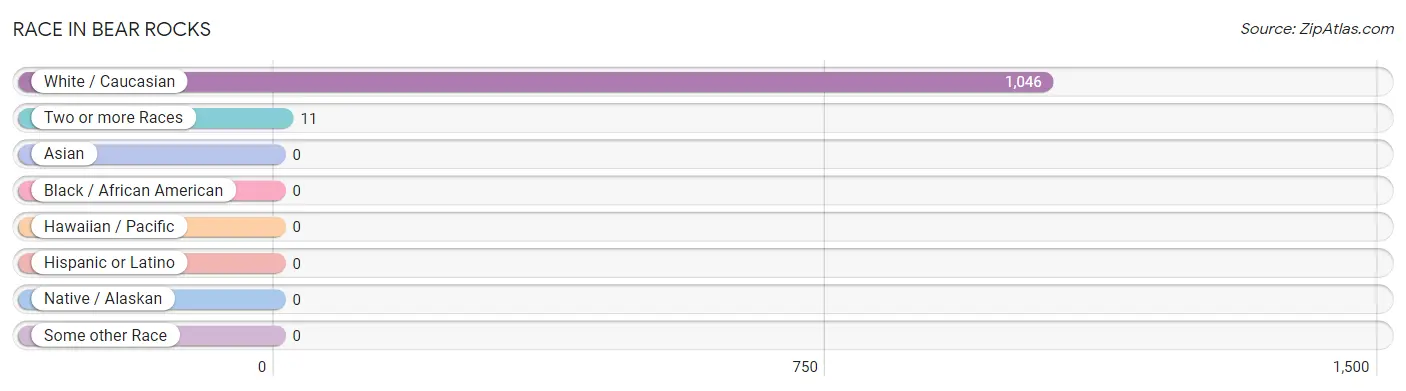
Race in Bear Rocks
The most populous races in Bear Rocks are White / Caucasian (1,046 | 99.0%), and Two or more Races (11 | 1.0%).
| Race | # Population | % Population |
| Asian | 0 | 0.0% |
| Black / African American | 0 | 0.0% |
| Hawaiian / Pacific | 0 | 0.0% |
| Hispanic or Latino | 0 | 0.0% |
| Native / Alaskan | 0 | 0.0% |
| White / Caucasian | 1,046 | 99.0% |
| Two or more Races | 11 | 1.0% |
| Some other Race | 0 | 0.0% |
| Total | 1,057 | 100.0% |
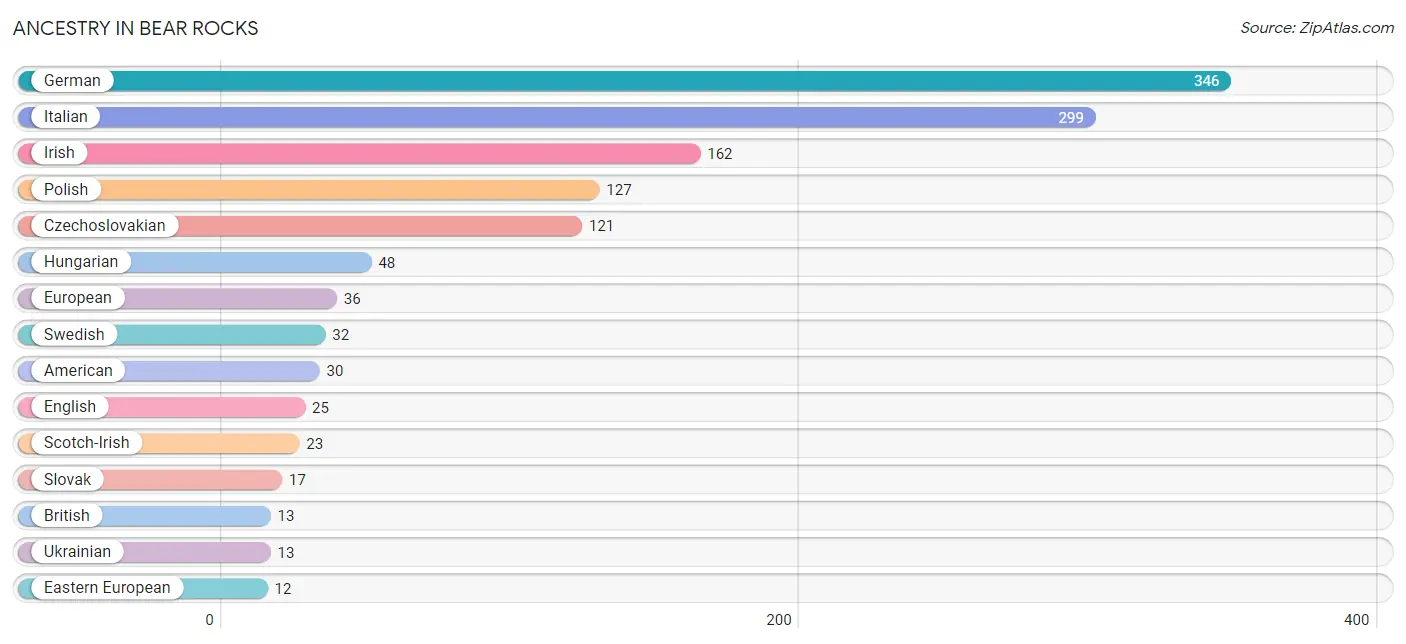
Ancestry in Bear Rocks
The most populous ancestries reported in Bear Rocks are German (346 | 32.7%), Italian (299 | 28.3%), Irish (162 | 15.3%), Polish (127 | 12.0%), and Czechoslovakian (121 | 11.5%), together accounting for 99.8% of all Bear Rocks residents.
| Ancestry | # Population | % Population |
| American | 30 | 2.8% |
| Austrian | 7 | 0.7% |
| British | 13 | 1.2% |
| Czechoslovakian | 121 | 11.5% |
| Dutch | 7 | 0.7% |
| Eastern European | 12 | 1.1% |
| English | 25 | 2.4% |
| European | 36 | 3.4% |
| German | 346 | 32.7% |
| Hungarian | 48 | 4.5% |
| Irish | 162 | 15.3% |
| Italian | 299 | 28.3% |
| Pennsylvania German | 8 | 0.8% |
| Polish | 127 | 12.0% |
| Scotch-Irish | 23 | 2.2% |
| Serbian | 8 | 0.8% |
| Slovak | 17 | 1.6% |
| Slovene | 9 | 0.9% |
| Swedish | 32 | 3.0% |
| Ukrainian | 13 | 1.2% | View All 20 Rows |
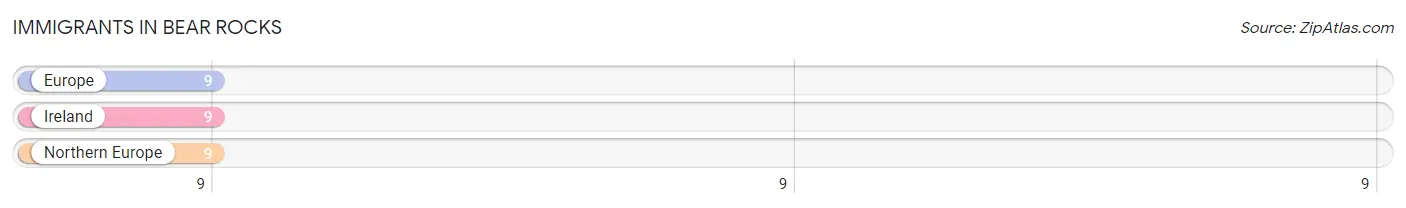
Immigrants in Bear Rocks
The most numerous immigrant groups reported in Bear Rocks came from Europe (9 | 0.9%), Ireland (9 | 0.9%), and Northern Europe (9 | 0.9%), together accounting for 2.6% of all Bear Rocks residents.
| Immigration Origin | # Population | % Population |
| Europe | 9 | 0.9% |
| Ireland | 9 | 0.9% |
| Northern Europe | 9 | 0.9% | View All 3 Rows |
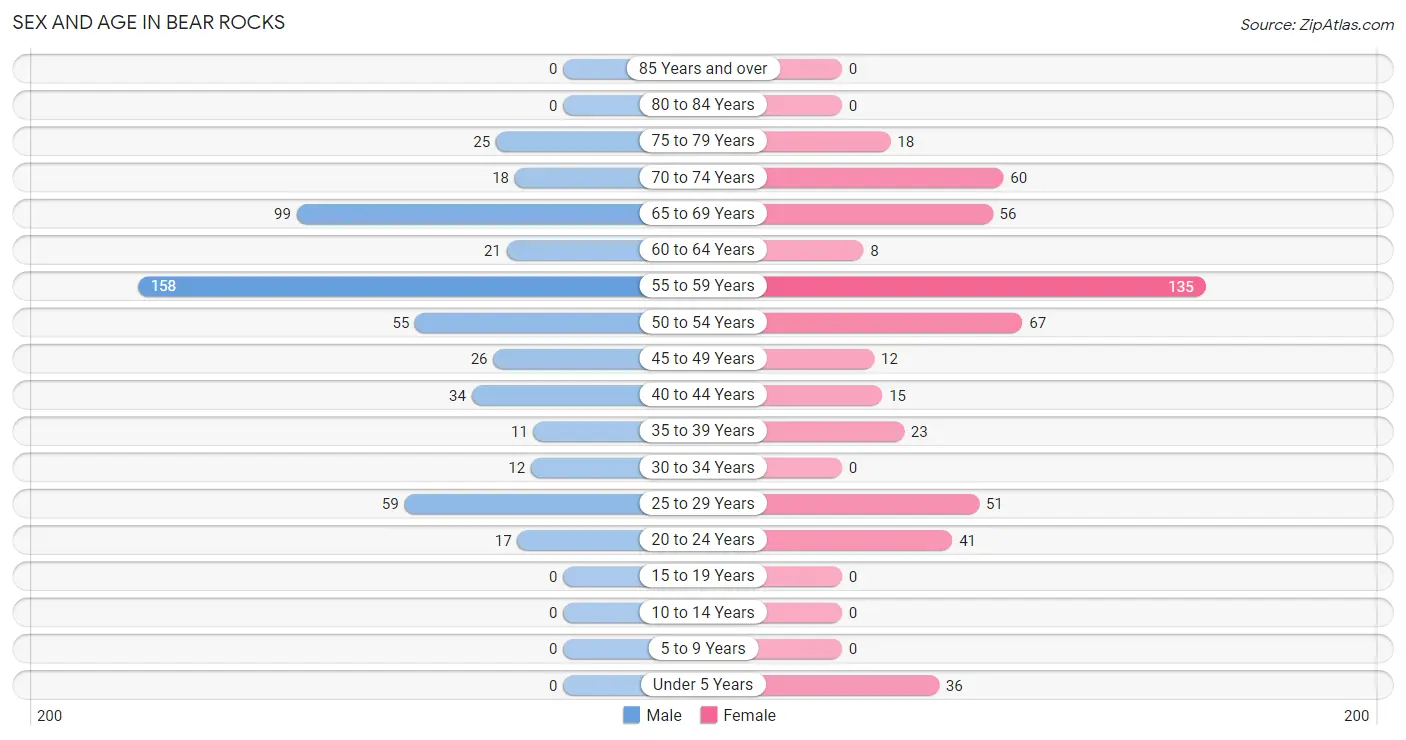
Sex and Age in Bear Rocks
Sex and Age in Bear Rocks
The most populous age groups in Bear Rocks are 55 to 59 Years (158 | 29.5%) for men and 55 to 59 Years (135 | 25.9%) for women.
| Age Bracket | Male | Female |
| Under 5 Years | 0 (0.0%) | 36 (6.9%) |
| 5 to 9 Years | 0 (0.0%) | 0 (0.0%) |
| 10 to 14 Years | 0 (0.0%) | 0 (0.0%) |
| 15 to 19 Years | 0 (0.0%) | 0 (0.0%) |
| 20 to 24 Years | 17 (3.2%) | 41 (7.9%) |
| 25 to 29 Years | 59 (11.0%) | 51 (9.8%) |
| 30 to 34 Years | 12 (2.2%) | 0 (0.0%) |
| 35 to 39 Years | 11 (2.1%) | 23 (4.4%) |
| 40 to 44 Years | 34 (6.4%) | 15 (2.9%) |
| 45 to 49 Years | 26 (4.9%) | 12 (2.3%) |
| 50 to 54 Years | 55 (10.3%) | 67 (12.8%) |
| 55 to 59 Years | 158 (29.5%) | 135 (25.9%) |
| 60 to 64 Years | 21 (3.9%) | 8 (1.5%) |
| 65 to 69 Years | 99 (18.5%) | 56 (10.7%) |
| 70 to 74 Years | 18 (3.4%) | 60 (11.5%) |
| 75 to 79 Years | 25 (4.7%) | 18 (3.5%) |
| 80 to 84 Years | 0 (0.0%) | 0 (0.0%) |
| 85 Years and over | 0 (0.0%) | 0 (0.0%) |
| Total | 535 (100.0%) | 522 (100.0%) |
Families and Households in Bear Rocks
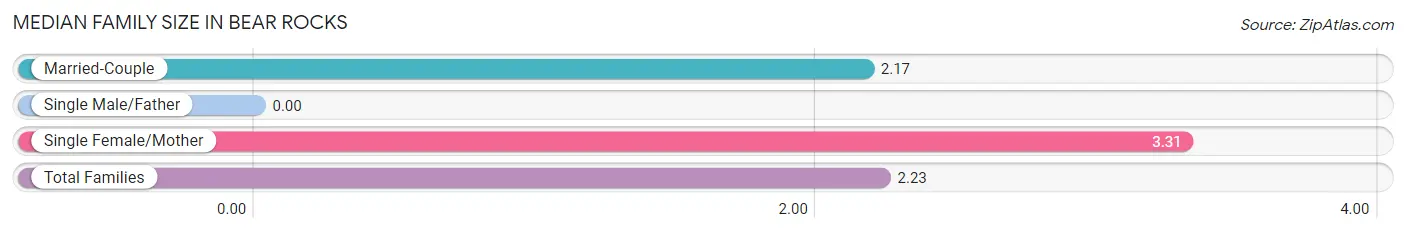
Median Family Size in Bear Rocks
| Family Type | # Families | Family Size |
| Married-Couple | 237 (94.8%) | 2.17 |
| Single Male/Father | 0 (0.0%) | - |
| Single Female/Mother | 13 (5.2%) | 3.31 |
| Total Families | 250 (100.0%) | 2.23 |
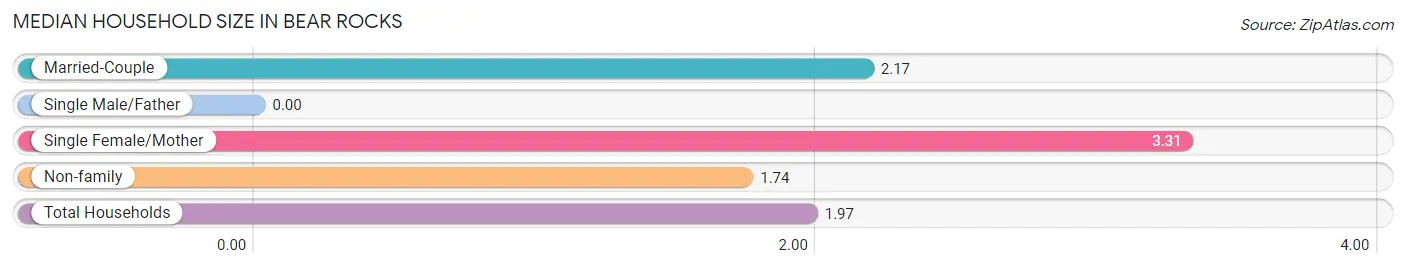
Median Household Size in Bear Rocks
| Household Type | # Households | Household Size |
| Married-Couple | 237 (44.2%) | 2.17 |
| Single Male/Father | 0 (0.0%) | - |
| Single Female/Mother | 13 (2.4%) | 3.31 |
| Non-family | 286 (53.4%) | 1.74 |
| Total Households | 536 (100.0%) | 1.97 |
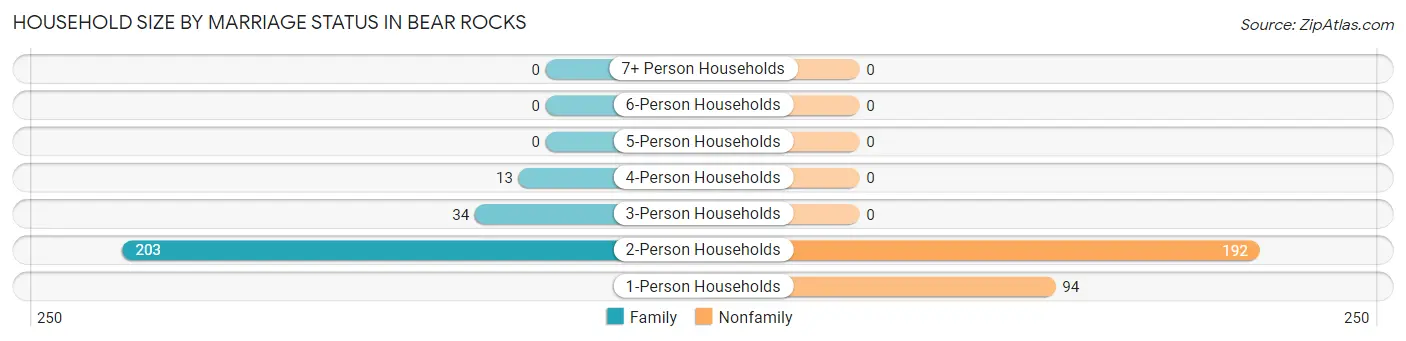
Household Size by Marriage Status in Bear Rocks
Out of a total of 536 households in Bear Rocks, 250 (46.6%) are family households, while 286 (53.4%) are nonfamily households. The most numerous type of family households are 2-person households, comprising 203, and the most common type of nonfamily households are 2-person households, comprising 192.
| Household Size | Family Households | Nonfamily Households |
| 1-Person Households | - | 94 (17.5%) |
| 2-Person Households | 203 (37.9%) | 192 (35.8%) |
| 3-Person Households | 34 (6.3%) | 0 (0.0%) |
| 4-Person Households | 13 (2.4%) | 0 (0.0%) |
| 5-Person Households | 0 (0.0%) | 0 (0.0%) |
| 6-Person Households | 0 (0.0%) | 0 (0.0%) |
| 7+ Person Households | 0 (0.0%) | 0 (0.0%) |
| Total | 250 (46.6%) | 286 (53.4%) |
Female Fertility in Bear Rocks
Fertility by Age in Bear Rocks
Average fertility rate in Bear Rocks is 254.0 births per 1,000 women. Women in the age bracket of 35 to 50 years have the highest fertility rate with 460.0 births per 1,000 women. Women in the age bracket of 35 to 50 years acount for 63.9% of all women with births.
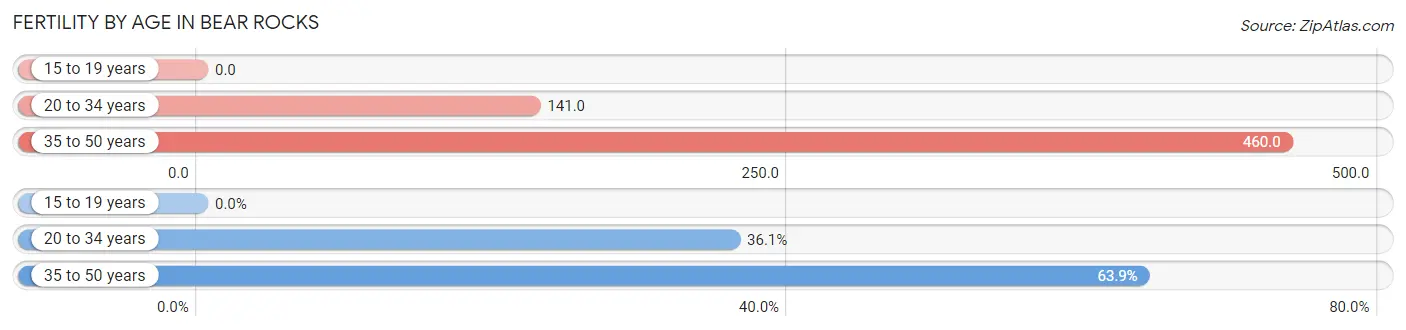
| Age Bracket | Women with Births | Births / 1,000 Women |
| 15 to 19 years | 0 (0.0%) | 0.0 |
| 20 to 34 years | 13 (36.1%) | 141.0 |
| 35 to 50 years | 23 (63.9%) | 460.0 |
| Total | 36 (100.0%) | 254.0 |
Fertility by Age by Marriage Status in Bear Rocks
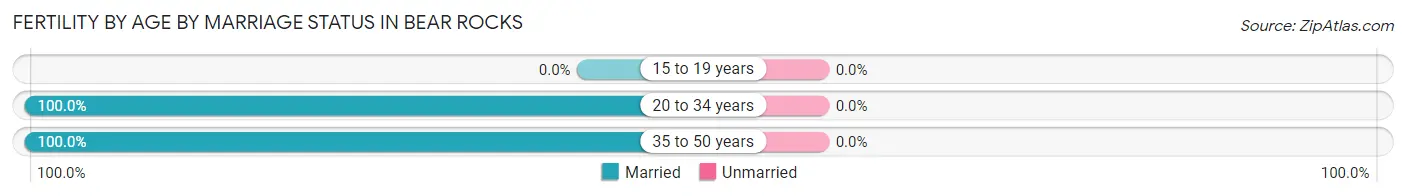
| Age Bracket | Married | Unmarried |
| 15 to 19 years | 0 (0.0%) | 0 (0.0%) |
| 20 to 34 years | 13 (100.0%) | 0 (0.0%) |
| 35 to 50 years | 23 (100.0%) | 0 (0.0%) |
| Total | 36 (100.0%) | 0 (0.0%) |
Fertility by Education in Bear Rocks
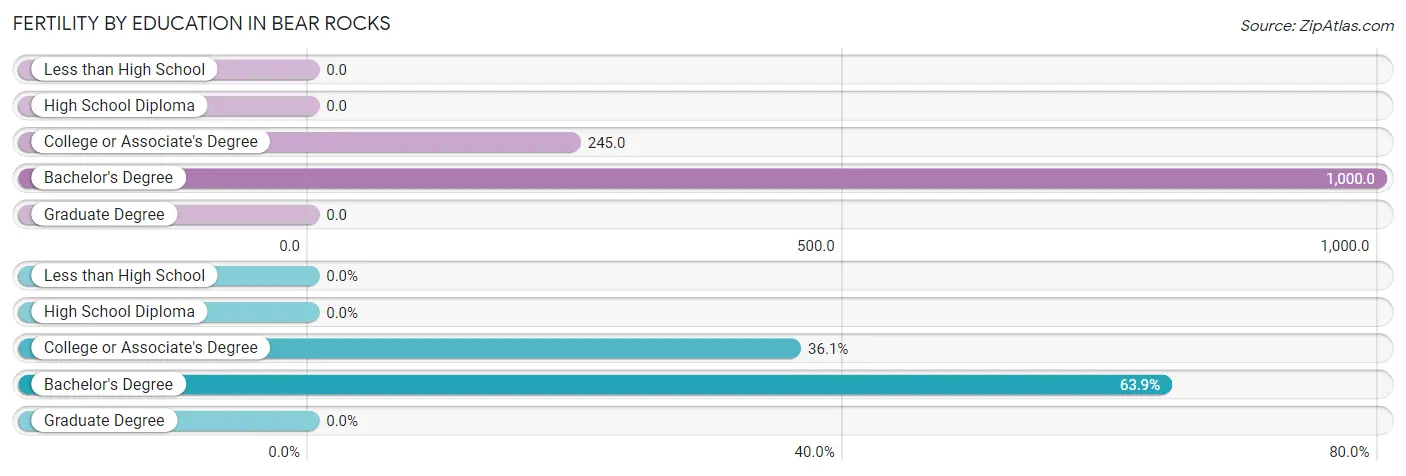
| Educational Attainment | Women with Births | Births / 1,000 Women |
| Less than High School | 0 (0.0%) | 0.0 |
| High School Diploma | 0 (0.0%) | 0.0 |
| College or Associate's Degree | 13 (36.1%) | 245.0 |
| Bachelor's Degree | 23 (63.9%) | 1,000.0 |
| Graduate Degree | 0 (0.0%) | 0.0 |
| Total | 36 (100.0%) | 254.0 |
Fertility by Education by Marriage Status in Bear Rocks
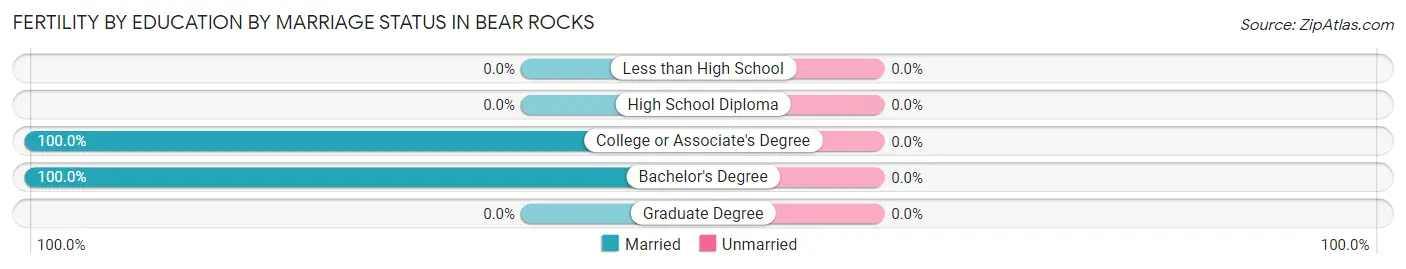
| Educational Attainment | Married | Unmarried |
| Less than High School | 0 (0.0%) | 0 (0.0%) |
| High School Diploma | 0 (0.0%) | 0 (0.0%) |
| College or Associate's Degree | 13 (100.0%) | 0 (0.0%) |
| Bachelor's Degree | 23 (100.0%) | 0 (0.0%) |
| Graduate Degree | 0 (0.0%) | 0 (0.0%) |
| Total | 36 (100.0%) | 0 (0.0%) |
Income in Bear Rocks
Income Overview in Bear Rocks
Per Capita Income in Bear Rocks is $37,312, while median incomes of families and households are $77,200 and $64,325 respectively.
| Characteristic | Number | Measure |
| Per Capita Income | 1,057 | $37,312 |
| Median Family Income | 250 | $77,200 |
| Mean Family Income | 250 | $94,418 |
| Median Household Income | 536 | $64,325 |
| Mean Household Income | 536 | $72,907 |
| Income Deficit | 250 | $0 |
| Wage / Income Gap (%) | 1,057 | 50.02% |
| Wage / Income Gap ($) | 1,057 | 49.98¢ per $1 |
| Gini / Inequality Index | 1,057 | 0.30 |
Earnings by Sex in Bear Rocks
Average Earnings in Bear Rocks are $44,375, $57,845 for men and $28,913 for women, a difference of 50.0%.
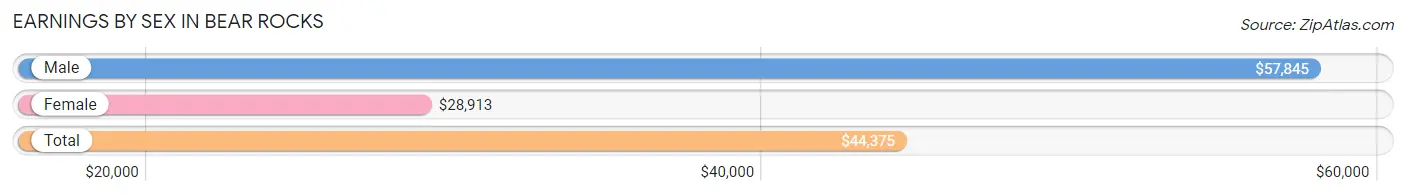
| Sex | Number | Average Earnings |
| Male | 258 (47.4%) | $57,845 |
| Female | 286 (52.6%) | $28,913 |
| Total | 544 (100.0%) | $44,375 |
Earnings by Sex by Income Bracket in Bear Rocks
The most common earnings brackets in Bear Rocks are $100,000+ for men (57 | 22.1%) and $25,000 to $29,999 for women (115 | 40.2%).
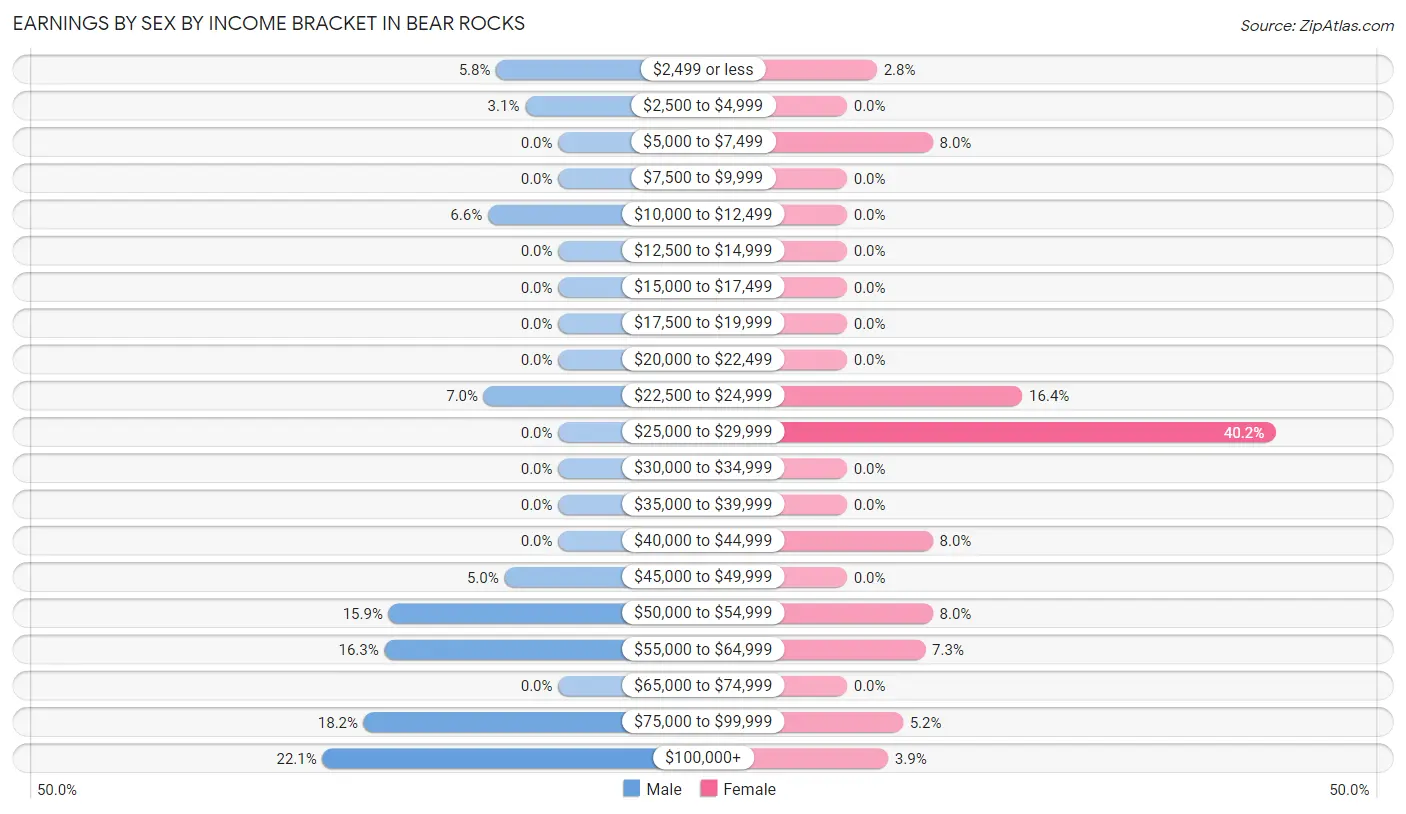
| Income | Male | Female |
| $2,499 or less | 15 (5.8%) | 8 (2.8%) |
| $2,500 to $4,999 | 8 (3.1%) | 0 (0.0%) |
| $5,000 to $7,499 | 0 (0.0%) | 23 (8.0%) |
| $7,500 to $9,999 | 0 (0.0%) | 0 (0.0%) |
| $10,000 to $12,499 | 17 (6.6%) | 0 (0.0%) |
| $12,500 to $14,999 | 0 (0.0%) | 0 (0.0%) |
| $15,000 to $17,499 | 0 (0.0%) | 0 (0.0%) |
| $17,500 to $19,999 | 0 (0.0%) | 0 (0.0%) |
| $20,000 to $22,499 | 0 (0.0%) | 0 (0.0%) |
| $22,500 to $24,999 | 18 (7.0%) | 47 (16.4%) |
| $25,000 to $29,999 | 0 (0.0%) | 115 (40.2%) |
| $30,000 to $34,999 | 0 (0.0%) | 0 (0.0%) |
| $35,000 to $39,999 | 0 (0.0%) | 0 (0.0%) |
| $40,000 to $44,999 | 0 (0.0%) | 23 (8.0%) |
| $45,000 to $49,999 | 13 (5.0%) | 0 (0.0%) |
| $50,000 to $54,999 | 41 (15.9%) | 23 (8.0%) |
| $55,000 to $64,999 | 42 (16.3%) | 21 (7.3%) |
| $65,000 to $74,999 | 0 (0.0%) | 0 (0.0%) |
| $75,000 to $99,999 | 47 (18.2%) | 15 (5.2%) |
| $100,000+ | 57 (22.1%) | 11 (3.8%) |
| Total | 258 (100.0%) | 286 (100.0%) |
Earnings by Sex by Educational Attainment in Bear Rocks
Average earnings in Bear Rocks are $58,578 for men and $29,359 for women, a difference of 49.9%. Men with an educational attainment of high school diploma enjoy the highest average annual earnings of $76,641, while those with high school diploma education earn the least with $76,641. Women with an educational attainment of college or associate's degree earn the most with the average annual earnings of $28,957, while those with college or associate's degree education have the smallest earnings of $28,957.
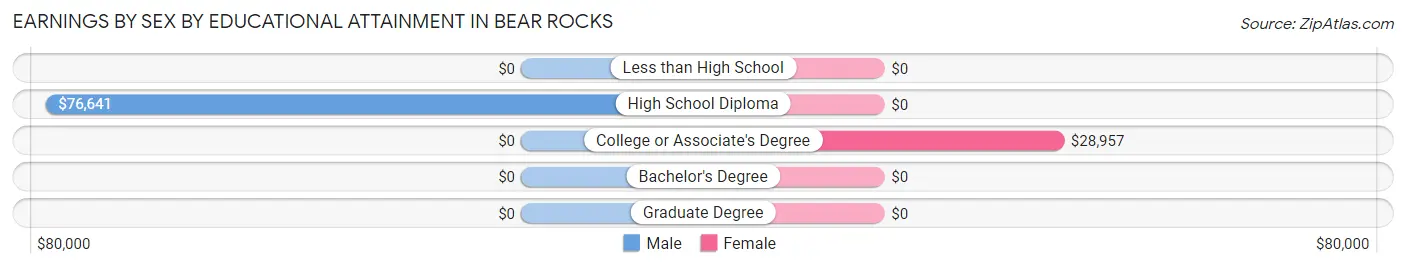
| Educational Attainment | Male Income | Female Income |
| Less than High School | - | - |
| High School Diploma | $76,641 | $0 |
| College or Associate's Degree | - | - |
| Bachelor's Degree | - | - |
| Graduate Degree | - | - |
| Total | $58,578 | $29,359 |
Family Income in Bear Rocks
Family Income Brackets in Bear Rocks
According to the Bear Rocks family income data, there are 89 families falling into the $100,000 to $149,999 income range, which is the most common income bracket and makes up 35.6% of all families.
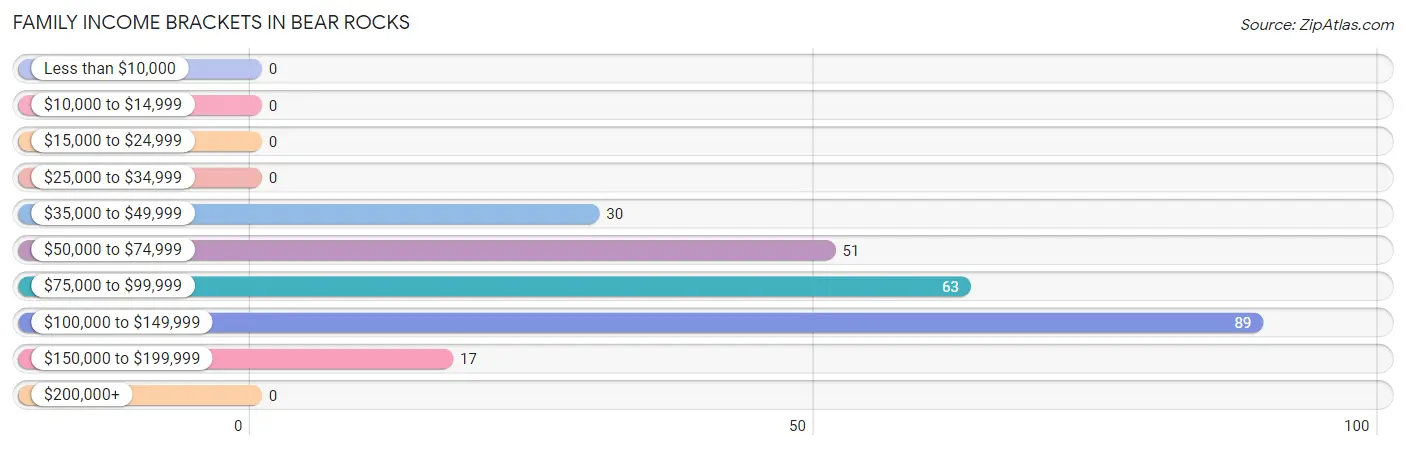
| Income Bracket | # Families | % Families |
| Less than $10,000 | 0 | 0.0% |
| $10,000 to $14,999 | 0 | 0.0% |
| $15,000 to $24,999 | 0 | 0.0% |
| $25,000 to $34,999 | 0 | 0.0% |
| $35,000 to $49,999 | 30 | 12.0% |
| $50,000 to $74,999 | 51 | 20.4% |
| $75,000 to $99,999 | 63 | 25.2% |
| $100,000 to $149,999 | 89 | 35.6% |
| $150,000 to $199,999 | 17 | 6.8% |
| $200,000+ | 0 | 0.0% |
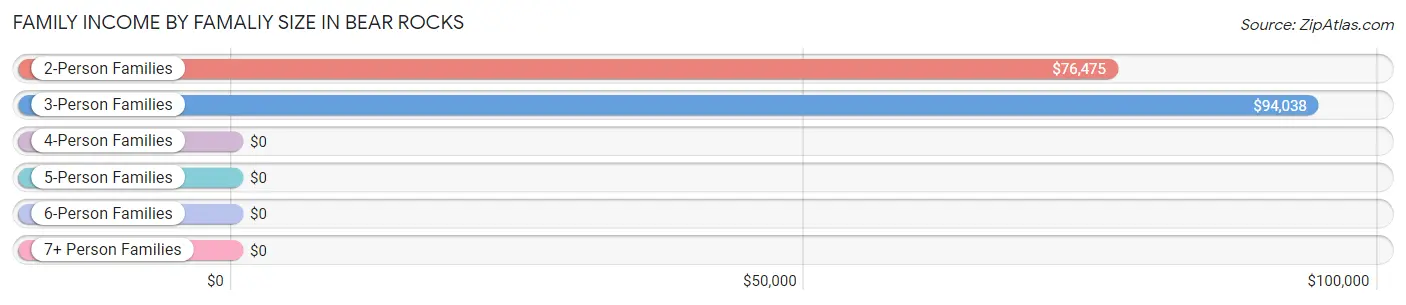
Family Income by Famaliy Size in Bear Rocks
3-person families (34 | 13.6%) account for the highest median family income in Bear Rocks with $94,038 per family, while 2-person families (203 | 81.2%) have the highest median income of $38,238 per family member.
| Income Bracket | # Families | Median Income |
| 2-Person Families | 203 (81.2%) | $76,475 |
| 3-Person Families | 34 (13.6%) | $94,038 |
| 4-Person Families | 13 (5.2%) | $0 |
| 5-Person Families | 0 (0.0%) | $0 |
| 6-Person Families | 0 (0.0%) | $0 |
| 7+ Person Families | 0 (0.0%) | $0 |
| Total | 250 (100.0%) | $77,200 |
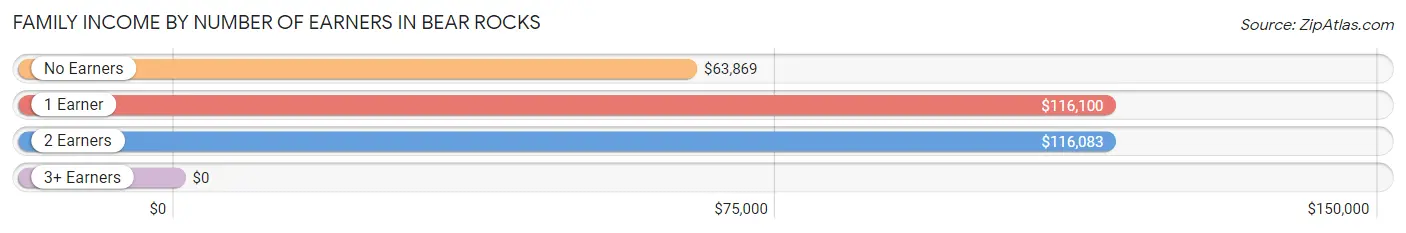
Family Income by Number of Earners in Bear Rocks
| Number of Earners | # Families | Median Income |
| No Earners | 106 (42.4%) | $63,869 |
| 1 Earner | 54 (21.6%) | $116,100 |
| 2 Earners | 77 (30.8%) | $116,083 |
| 3+ Earners | 13 (5.2%) | $0 |
| Total | 250 (100.0%) | $77,200 |
Household Income in Bear Rocks
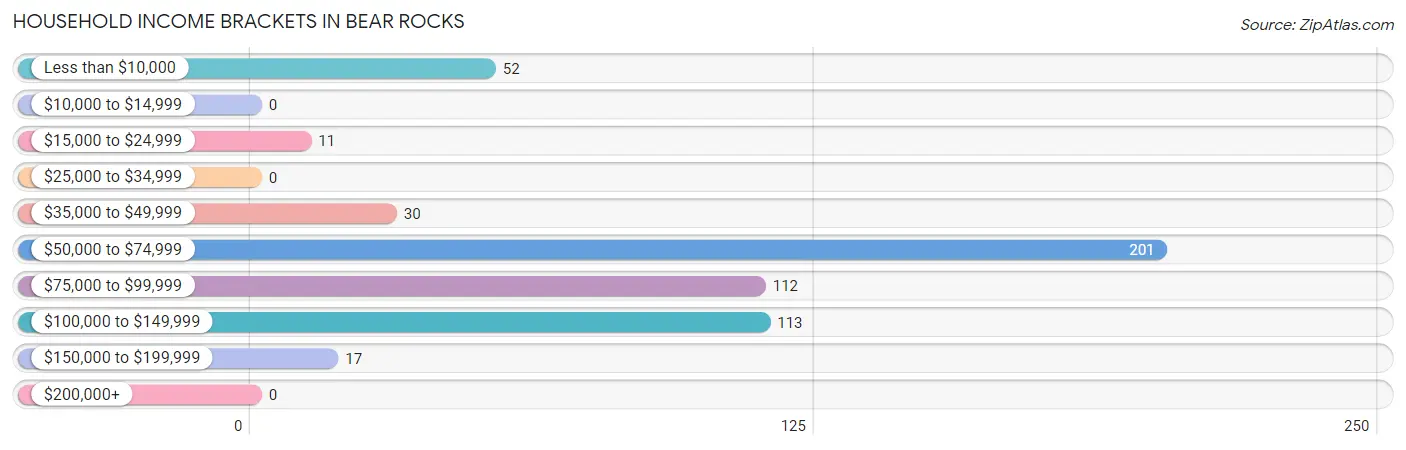
Household Income Brackets in Bear Rocks
With 201 households falling in the category, the $50,000 to $74,999 income range is the most frequent in Bear Rocks, accounting for 37.5% of all households.
| Income Bracket | # Households | % Households |
| Less than $10,000 | 52 | 9.7% |
| $10,000 to $14,999 | 0 | 0.0% |
| $15,000 to $24,999 | 11 | 2.1% |
| $25,000 to $34,999 | 0 | 0.0% |
| $35,000 to $49,999 | 30 | 5.6% |
| $50,000 to $74,999 | 201 | 37.5% |
| $75,000 to $99,999 | 112 | 20.9% |
| $100,000 to $149,999 | 113 | 21.1% |
| $150,000 to $199,999 | 17 | 3.2% |
| $200,000+ | 0 | 0.0% |
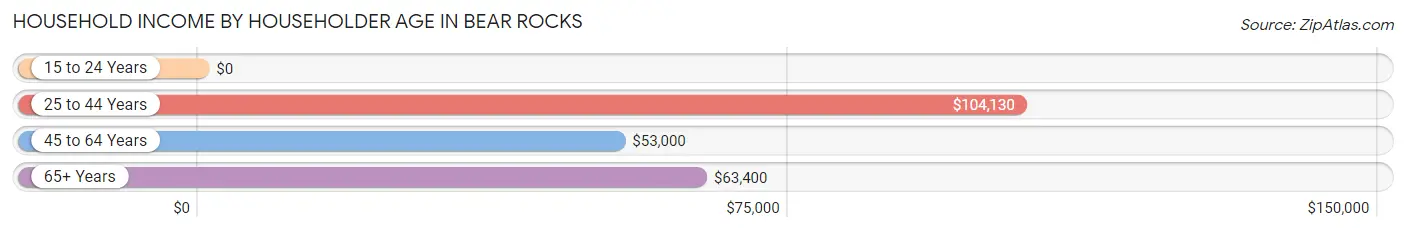
Household Income by Householder Age in Bear Rocks
The median household income in Bear Rocks is $64,325, with the highest median household income of $104,130 found in the 25 to 44 years age bracket for the primary householder. A total of 110 households (20.5%) fall into this category.
| Income Bracket | # Households | Median Income |
| 15 to 24 Years | 0 (0.0%) | $0 |
| 25 to 44 Years | 110 (20.5%) | $104,130 |
| 45 to 64 Years | 262 (48.9%) | $53,000 |
| 65+ Years | 164 (30.6%) | $63,400 |
| Total | 536 (100.0%) | $64,325 |
Poverty in Bear Rocks
Income Below Poverty by Sex and Age in Bear Rocks
With 8.0% poverty level for males and 8.5% for females among the residents of Bear Rocks, 35 to 44 year old males and 45 to 54 year old females are the most vulnerable to poverty, with 11 males (24.4%) and 22 females (27.9%) in their respective age groups living below the poverty level.
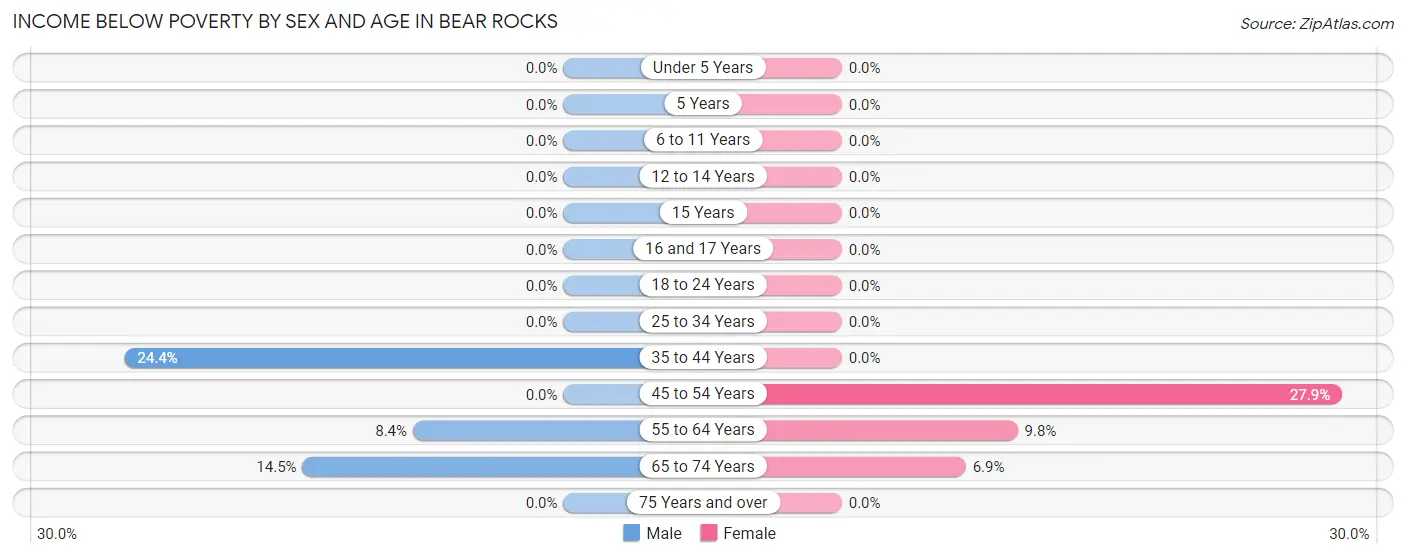
| Age Bracket | Male | Female |
| Under 5 Years | 0 (0.0%) | 0 (0.0%) |
| 5 Years | 0 (0.0%) | 0 (0.0%) |
| 6 to 11 Years | 0 (0.0%) | 0 (0.0%) |
| 12 to 14 Years | 0 (0.0%) | 0 (0.0%) |
| 15 Years | 0 (0.0%) | 0 (0.0%) |
| 16 and 17 Years | 0 (0.0%) | 0 (0.0%) |
| 18 to 24 Years | 0 (0.0%) | 0 (0.0%) |
| 25 to 34 Years | 0 (0.0%) | 0 (0.0%) |
| 35 to 44 Years | 11 (24.4%) | 0 (0.0%) |
| 45 to 54 Years | 0 (0.0%) | 22 (27.9%) |
| 55 to 64 Years | 15 (8.4%) | 14 (9.8%) |
| 65 to 74 Years | 17 (14.5%) | 8 (6.9%) |
| 75 Years and over | 0 (0.0%) | 0 (0.0%) |
| Total | 43 (8.0%) | 44 (8.5%) |
Income Above Poverty by Sex and Age in Bear Rocks
According to the poverty statistics in Bear Rocks, males aged 18 to 24 years and females aged under 5 years are the age groups that are most secure financially, with 100.0% of males and 100.0% of females in these age groups living above the poverty line.
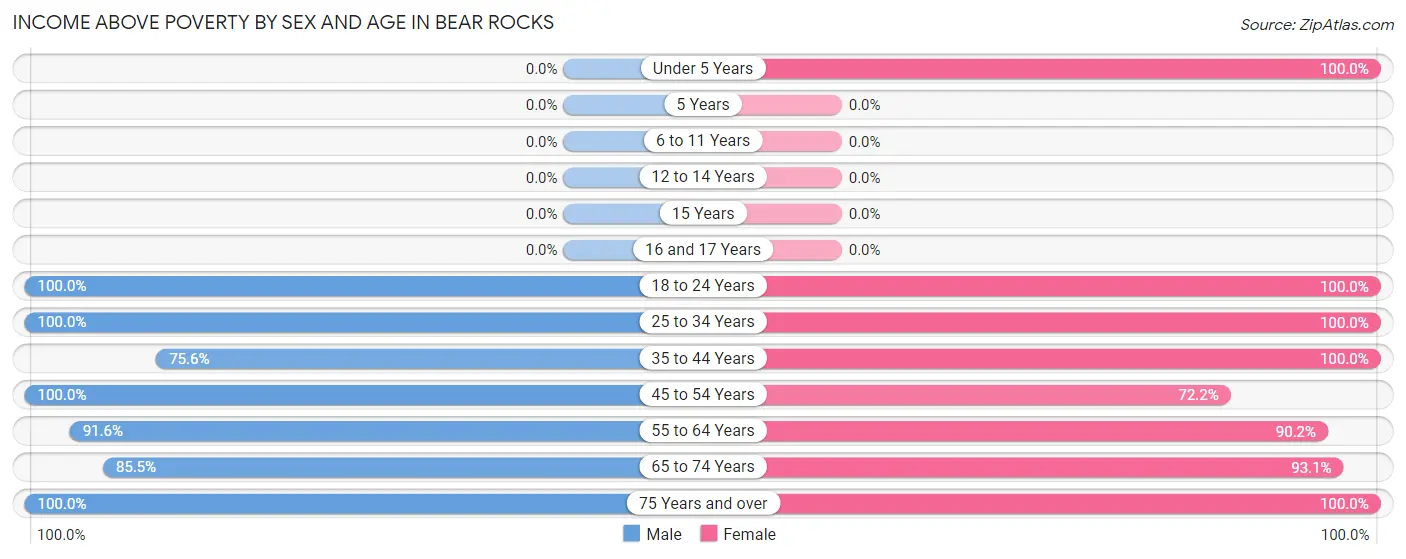
| Age Bracket | Male | Female |
| Under 5 Years | 0 (0.0%) | 36 (100.0%) |
| 5 Years | 0 (0.0%) | 0 (0.0%) |
| 6 to 11 Years | 0 (0.0%) | 0 (0.0%) |
| 12 to 14 Years | 0 (0.0%) | 0 (0.0%) |
| 15 Years | 0 (0.0%) | 0 (0.0%) |
| 16 and 17 Years | 0 (0.0%) | 0 (0.0%) |
| 18 to 24 Years | 17 (100.0%) | 41 (100.0%) |
| 25 to 34 Years | 71 (100.0%) | 51 (100.0%) |
| 35 to 44 Years | 34 (75.6%) | 38 (100.0%) |
| 45 to 54 Years | 81 (100.0%) | 57 (72.2%) |
| 55 to 64 Years | 164 (91.6%) | 129 (90.2%) |
| 65 to 74 Years | 100 (85.5%) | 108 (93.1%) |
| 75 Years and over | 25 (100.0%) | 17 (100.0%) |
| Total | 492 (92.0%) | 477 (91.5%) |
Income Below Poverty Among Married-Couple Families in Bear Rocks
| Children | Above Poverty | Below Poverty |
| No Children | 212 (100.0%) | 0 (0.0%) |
| 1 or 2 Children | 25 (100.0%) | 0 (0.0%) |
| 3 or 4 Children | 0 (0.0%) | 0 (0.0%) |
| 5 or more Children | 0 (0.0%) | 0 (0.0%) |
| Total | 237 (100.0%) | 0 (0.0%) |
Income Below Poverty Among Single-Parent Households in Bear Rocks
| Children | Single Father | Single Mother |
| No Children | 0 (0.0%) | 0 (0.0%) |
| 1 or 2 Children | 0 (0.0%) | 0 (0.0%) |
| 3 or 4 Children | 0 (0.0%) | 0 (0.0%) |
| 5 or more Children | 0 (0.0%) | 0 (0.0%) |
| Total | 0 (0.0%) | 0 (0.0%) |
Income Below Poverty Among Married-Couple vs Single-Parent Households in Bear Rocks
| Children | Married-Couple Families | Single-Parent Households |
| No Children | 0 (0.0%) | 0 (0.0%) |
| 1 or 2 Children | 0 (0.0%) | 0 (0.0%) |
| 3 or 4 Children | 0 (0.0%) | 0 (0.0%) |
| 5 or more Children | 0 (0.0%) | 0 (0.0%) |
| Total | 0 (0.0%) | 0 (0.0%) |
Employment Characteristics in Bear Rocks
Employment by Class of Employer in Bear Rocks
Among the 513 employed individuals in Bear Rocks, private company employees (395 | 77.0%), not-for-profit organizations (48 | 9.4%), and self-employed (not incorporated) (35 | 6.8%) make up the most common classes of employment.
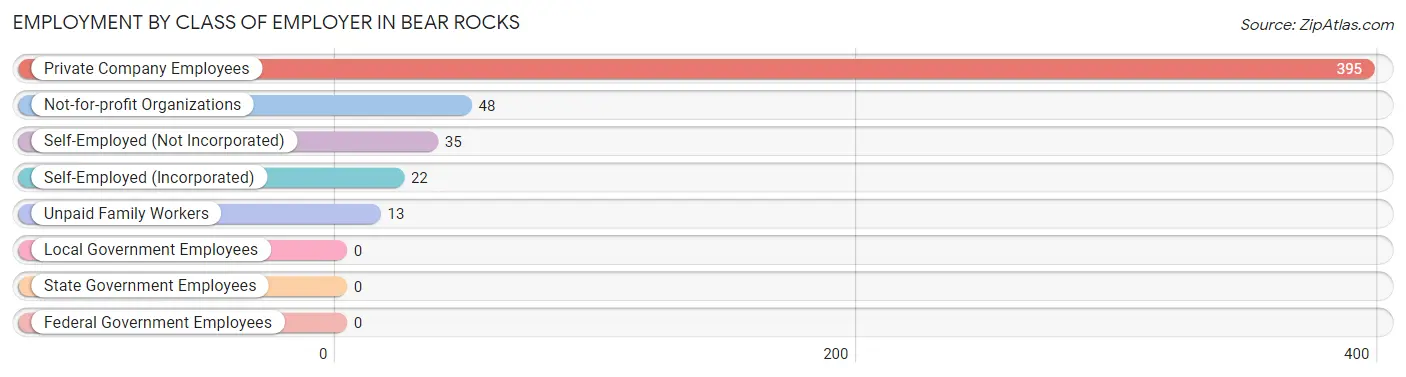
| Employer Class | # Employees | % Employees |
| Private Company Employees | 395 | 77.0% |
| Self-Employed (Incorporated) | 22 | 4.3% |
| Self-Employed (Not Incorporated) | 35 | 6.8% |
| Not-for-profit Organizations | 48 | 9.4% |
| Local Government Employees | 0 | 0.0% |
| State Government Employees | 0 | 0.0% |
| Federal Government Employees | 0 | 0.0% |
| Unpaid Family Workers | 13 | 2.5% |
| Total | 513 | 100.0% |
Employment Status by Age in Bear Rocks
According to the labor force statistics for Bear Rocks, out of the total population over 16 years of age (1,021), 56.2% or 574 individuals are in the labor force, with 10.6% or 61 of them unemployed. The age group with the highest labor force participation rate is 20 to 24 years, with 100.0% or 58 individuals in the labor force. Within the labor force, the 65 to 74 years age range has the highest percentage of unemployed individuals, with 50.0% or 7 of them being unemployed.
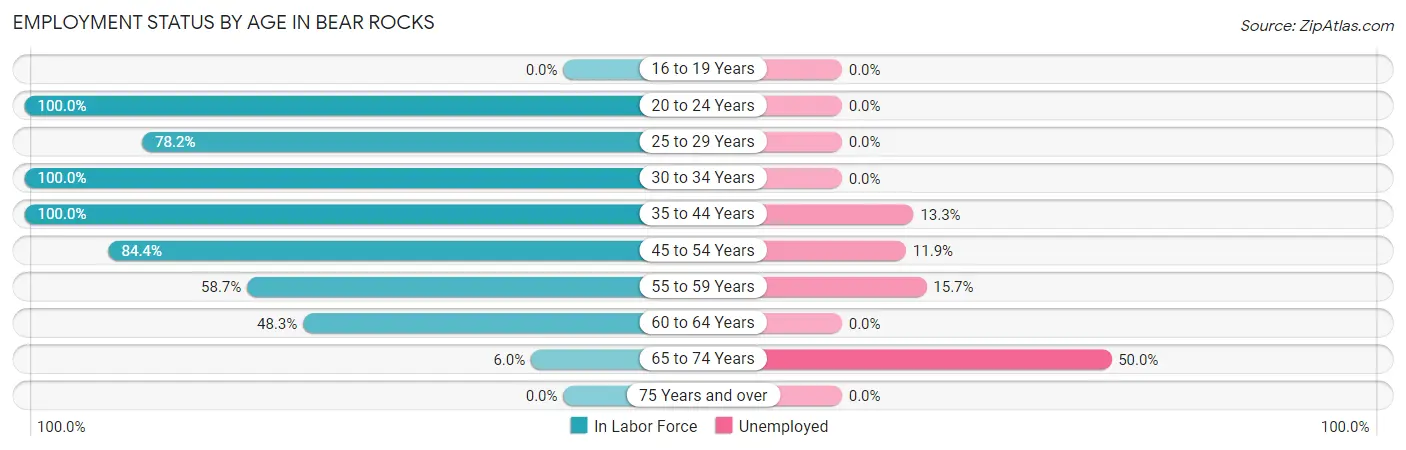
| Age Bracket | In Labor Force | Unemployed |
| 16 to 19 Years | 0 (0.0%) | 0 (0.0%) |
| 20 to 24 Years | 58 (100.0%) | 0 (0.0%) |
| 25 to 29 Years | 86 (78.2%) | 0 (0.0%) |
| 30 to 34 Years | 12 (100.0%) | 0 (0.0%) |
| 35 to 44 Years | 83 (100.0%) | 11 (13.3%) |
| 45 to 54 Years | 135 (84.4%) | 16 (11.9%) |
| 55 to 59 Years | 172 (58.7%) | 27 (15.7%) |
| 60 to 64 Years | 14 (48.3%) | 0 (0.0%) |
| 65 to 74 Years | 14 (6.0%) | 7 (50.0%) |
| 75 Years and over | 0 (0.0%) | 0 (0.0%) |
| Total | 574 (56.2%) | 61 (10.6%) |
Employment Status by Educational Attainment in Bear Rocks
According to labor force statistics for Bear Rocks, 73.1% of individuals (502) out of the total population between 25 and 64 years of age (687) are in the labor force, with 10.8% or 54 of them being unemployed. The group with the highest labor force participation rate are those with the educational attainment of less than high school, with 100.0% or 47 individuals in the labor force. Within the labor force, individuals with high school diploma education have the highest percentage of unemployment, with 24.9% or 43 of them being unemployed.
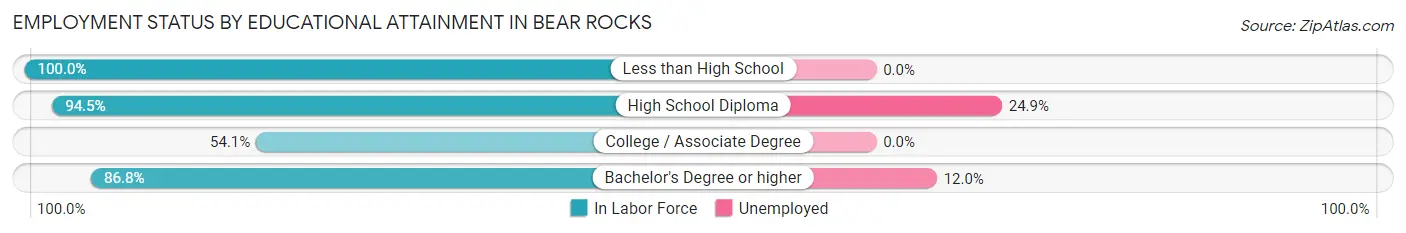
| Educational Attainment | In Labor Force | Unemployed |
| Less than High School | 47 (100.0%) | 0 (0.0%) |
| High School Diploma | 173 (94.5%) | 46 (24.9%) |
| College / Associate Degree | 190 (54.1%) | 0 (0.0%) |
| Bachelor's Degree or higher | 92 (86.8%) | 13 (12.0%) |
| Total | 502 (73.1%) | 74 (10.8%) |
Employment Occupations by Sex in Bear Rocks
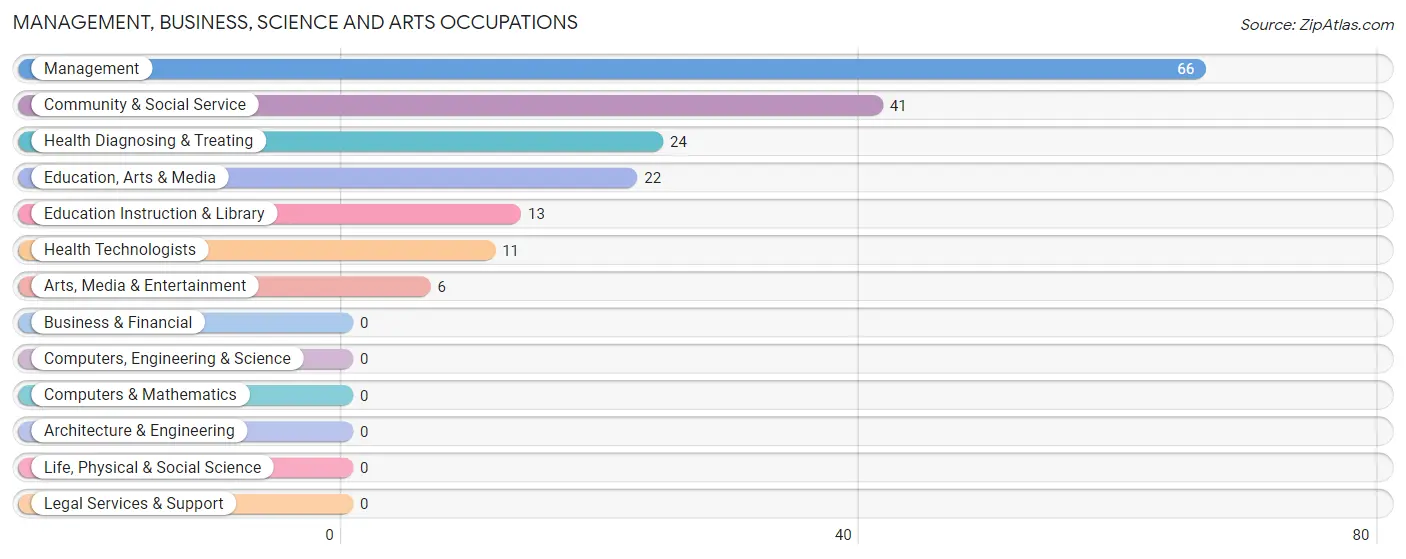
Management, Business, Science and Arts Occupations
The most common Management, Business, Science and Arts occupations in Bear Rocks are Management (66 | 12.9%), Community & Social Service (41 | 8.0%), Health Diagnosing & Treating (24 | 4.7%), Education, Arts & Media (22 | 4.3%), and Education Instruction & Library (13 | 2.5%).
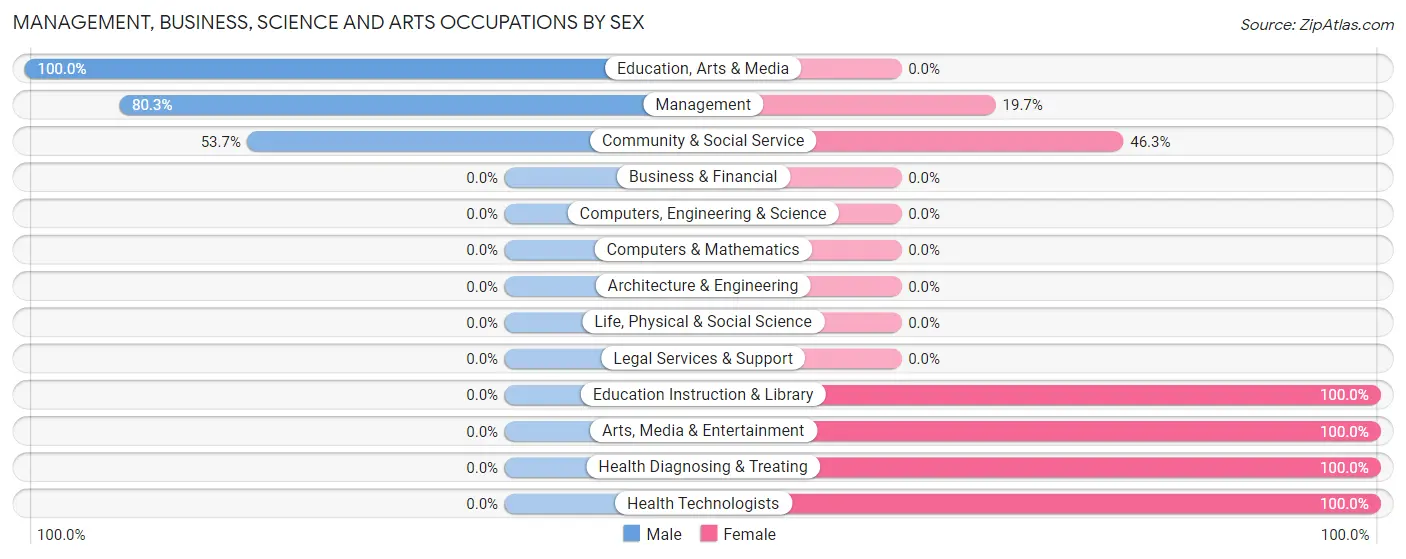
Management, Business, Science and Arts Occupations by Sex
Within the Management, Business, Science and Arts occupations in Bear Rocks, the most male-oriented occupations are Education, Arts & Media (100.0%), Management (80.3%), and Community & Social Service (53.7%), while the most female-oriented occupations are Education Instruction & Library (100.0%), Arts, Media & Entertainment (100.0%), and Health Diagnosing & Treating (100.0%).
| Occupation | Male | Female |
| Management | 53 (80.3%) | 13 (19.7%) |
| Business & Financial | 0 (0.0%) | 0 (0.0%) |
| Computers, Engineering & Science | 0 (0.0%) | 0 (0.0%) |
| Computers & Mathematics | 0 (0.0%) | 0 (0.0%) |
| Architecture & Engineering | 0 (0.0%) | 0 (0.0%) |
| Life, Physical & Social Science | 0 (0.0%) | 0 (0.0%) |
| Community & Social Service | 22 (53.7%) | 19 (46.3%) |
| Education, Arts & Media | 22 (100.0%) | 0 (0.0%) |
| Legal Services & Support | 0 (0.0%) | 0 (0.0%) |
| Education Instruction & Library | 0 (0.0%) | 13 (100.0%) |
| Arts, Media & Entertainment | 0 (0.0%) | 6 (100.0%) |
| Health Diagnosing & Treating | 0 (0.0%) | 24 (100.0%) |
| Health Technologists | 0 (0.0%) | 11 (100.0%) |
| Total (Category) | 75 (57.3%) | 56 (42.7%) |
| Total (Overall) | 243 (47.4%) | 270 (52.6%) |
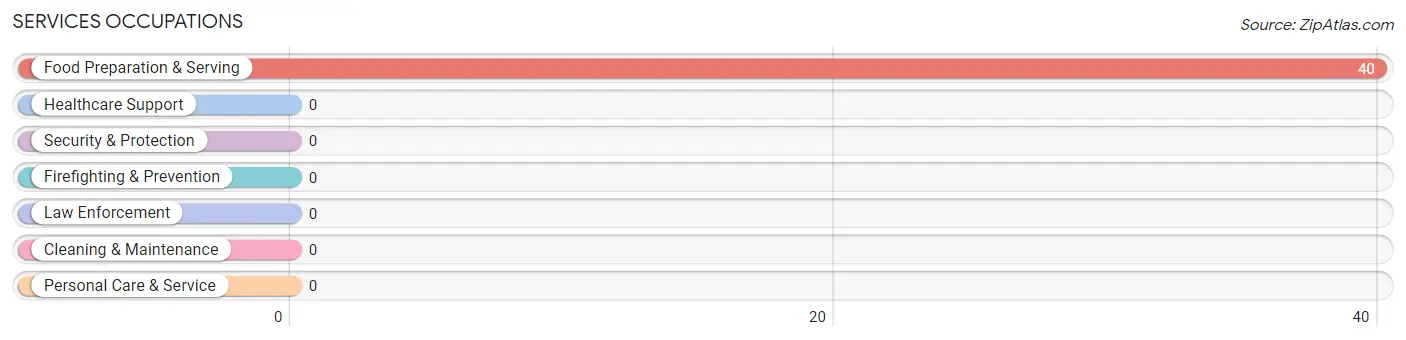
Services Occupations
The most common Services occupations in Bear Rocks are , and Food Preparation & Serving (40 | 7.8%).
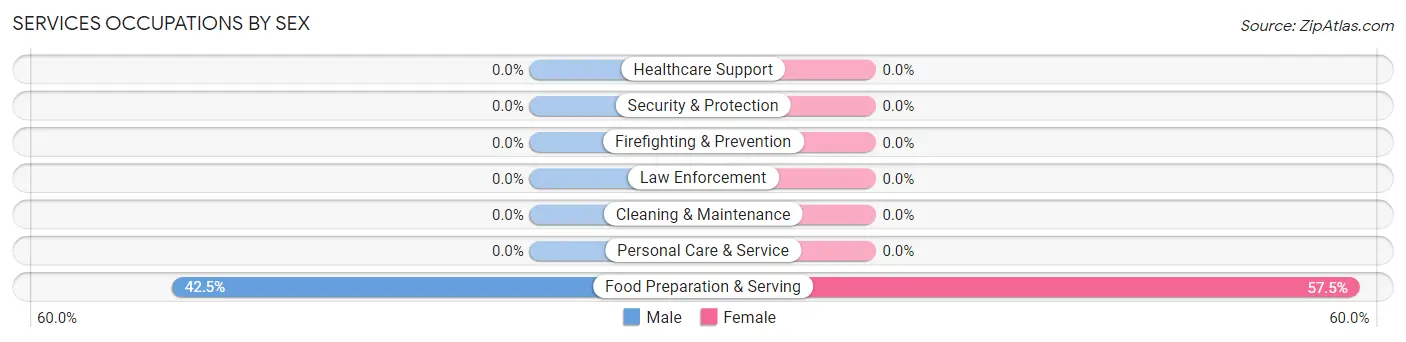
Services Occupations by Sex
| Occupation | Male | Female |
| Healthcare Support | 0 (0.0%) | 0 (0.0%) |
| Security & Protection | 0 (0.0%) | 0 (0.0%) |
| Firefighting & Prevention | 0 (0.0%) | 0 (0.0%) |
| Law Enforcement | 0 (0.0%) | 0 (0.0%) |
| Food Preparation & Serving | 17 (42.5%) | 23 (57.5%) |
| Cleaning & Maintenance | 0 (0.0%) | 0 (0.0%) |
| Personal Care & Service | 0 (0.0%) | 0 (0.0%) |
| Total (Category) | 17 (42.5%) | 23 (57.5%) |
| Total (Overall) | 243 (47.4%) | 270 (52.6%) |
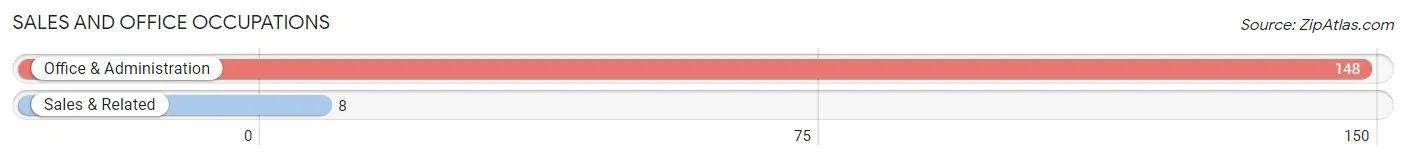
Sales and Office Occupations
The most common Sales and Office occupations in Bear Rocks are Office & Administration (148 | 28.8%), and Sales & Related (8 | 1.6%).
Sales and Office Occupations by Sex
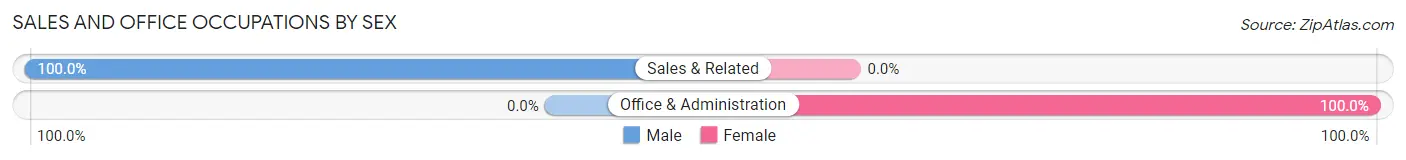
| Occupation | Male | Female |
| Sales & Related | 8 (100.0%) | 0 (0.0%) |
| Office & Administration | 0 (0.0%) | 148 (100.0%) |
| Total (Category) | 8 (5.1%) | 148 (94.9%) |
| Total (Overall) | 243 (47.4%) | 270 (52.6%) |
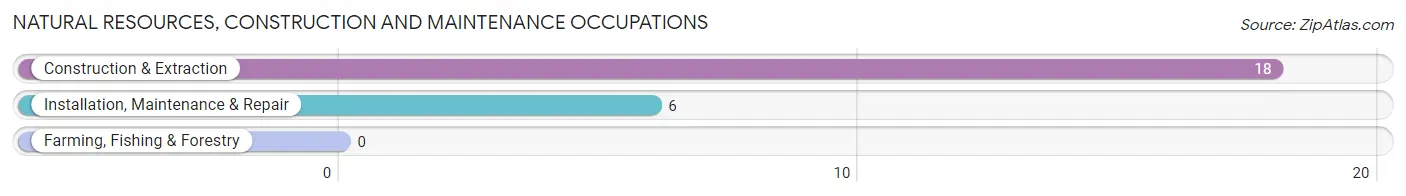
Natural Resources, Construction and Maintenance Occupations
The most common Natural Resources, Construction and Maintenance occupations in Bear Rocks are Construction & Extraction (18 | 3.5%), and Installation, Maintenance & Repair (6 | 1.2%).
Natural Resources, Construction and Maintenance Occupations by Sex
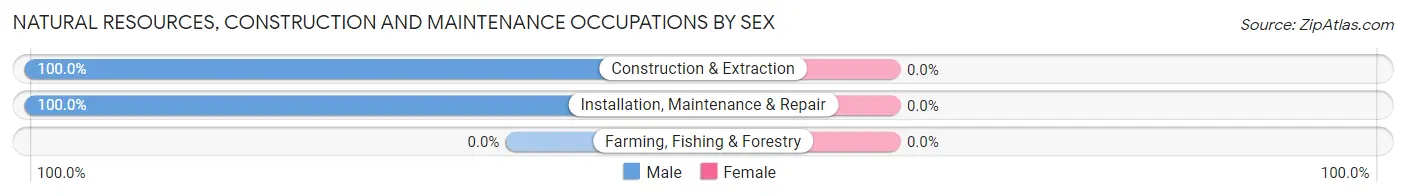
| Occupation | Male | Female |
| Farming, Fishing & Forestry | 0 (0.0%) | 0 (0.0%) |
| Construction & Extraction | 18 (100.0%) | 0 (0.0%) |
| Installation, Maintenance & Repair | 6 (100.0%) | 0 (0.0%) |
| Total (Category) | 24 (100.0%) | 0 (0.0%) |
| Total (Overall) | 243 (47.4%) | 270 (52.6%) |
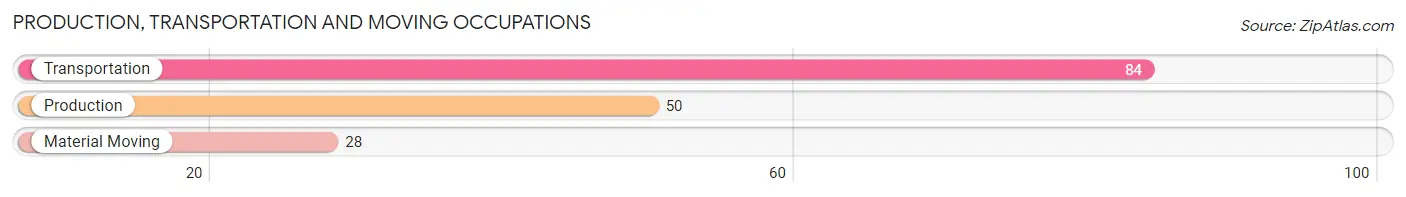
Production, Transportation and Moving Occupations
The most common Production, Transportation and Moving occupations in Bear Rocks are Transportation (84 | 16.4%), Production (50 | 9.8%), and Material Moving (28 | 5.5%).
Production, Transportation and Moving Occupations by Sex
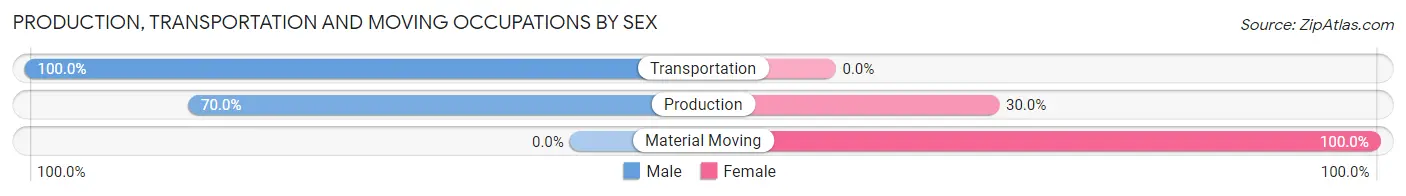
| Occupation | Male | Female |
| Production | 35 (70.0%) | 15 (30.0%) |
| Transportation | 84 (100.0%) | 0 (0.0%) |
| Material Moving | 0 (0.0%) | 28 (100.0%) |
| Total (Category) | 119 (73.5%) | 43 (26.5%) |
| Total (Overall) | 243 (47.4%) | 270 (52.6%) |
Employment Industries by Sex in Bear Rocks
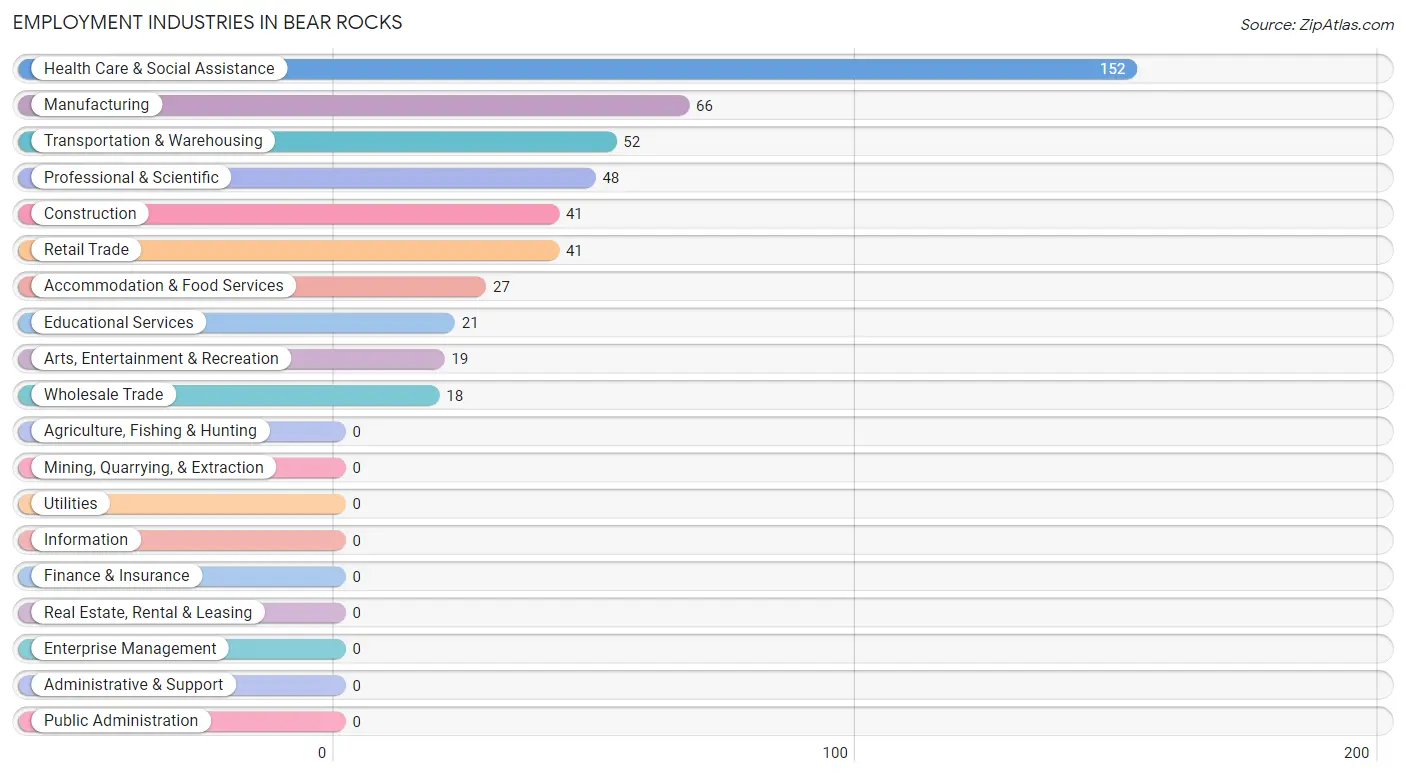
Employment Industries in Bear Rocks
The major employment industries in Bear Rocks include Health Care & Social Assistance (152 | 29.6%), Manufacturing (66 | 12.9%), Transportation & Warehousing (52 | 10.1%), Professional & Scientific (48 | 9.4%), and Construction (41 | 8.0%).
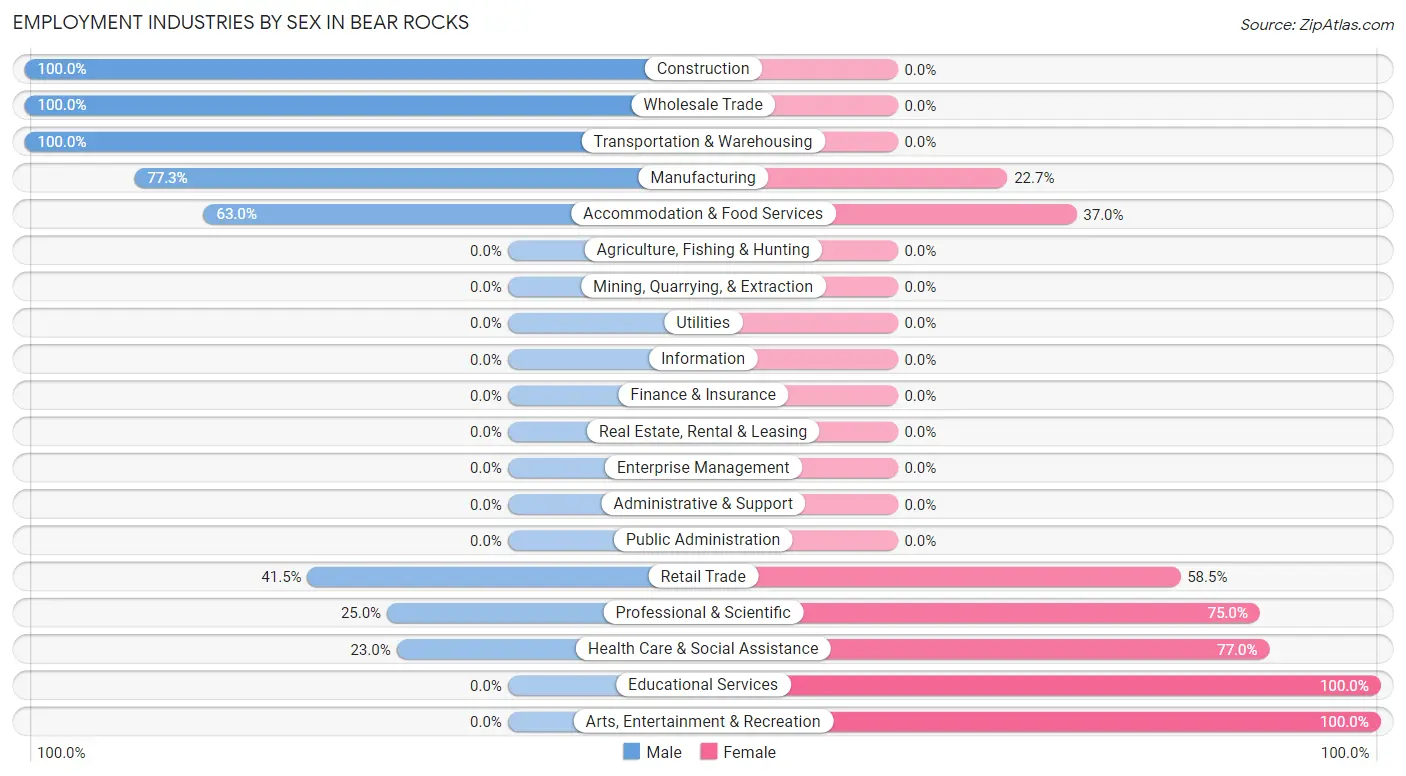
Employment Industries by Sex in Bear Rocks
The Bear Rocks industries that see more men than women are Construction (100.0%), Wholesale Trade (100.0%), and Transportation & Warehousing (100.0%), whereas the industries that tend to have a higher number of women are Educational Services (100.0%), Arts, Entertainment & Recreation (100.0%), and Health Care & Social Assistance (77.0%).
| Industry | Male | Female |
| Agriculture, Fishing & Hunting | 0 (0.0%) | 0 (0.0%) |
| Mining, Quarrying, & Extraction | 0 (0.0%) | 0 (0.0%) |
| Construction | 41 (100.0%) | 0 (0.0%) |
| Manufacturing | 51 (77.3%) | 15 (22.7%) |
| Wholesale Trade | 18 (100.0%) | 0 (0.0%) |
| Retail Trade | 17 (41.5%) | 24 (58.5%) |
| Transportation & Warehousing | 52 (100.0%) | 0 (0.0%) |
| Utilities | 0 (0.0%) | 0 (0.0%) |
| Information | 0 (0.0%) | 0 (0.0%) |
| Finance & Insurance | 0 (0.0%) | 0 (0.0%) |
| Real Estate, Rental & Leasing | 0 (0.0%) | 0 (0.0%) |
| Professional & Scientific | 12 (25.0%) | 36 (75.0%) |
| Enterprise Management | 0 (0.0%) | 0 (0.0%) |
| Administrative & Support | 0 (0.0%) | 0 (0.0%) |
| Educational Services | 0 (0.0%) | 21 (100.0%) |
| Health Care & Social Assistance | 35 (23.0%) | 117 (77.0%) |
| Arts, Entertainment & Recreation | 0 (0.0%) | 19 (100.0%) |
| Accommodation & Food Services | 17 (63.0%) | 10 (37.0%) |
| Public Administration | 0 (0.0%) | 0 (0.0%) |
| Total | 243 (47.4%) | 270 (52.6%) |
Education in Bear Rocks
School Enrollment in Bear Rocks
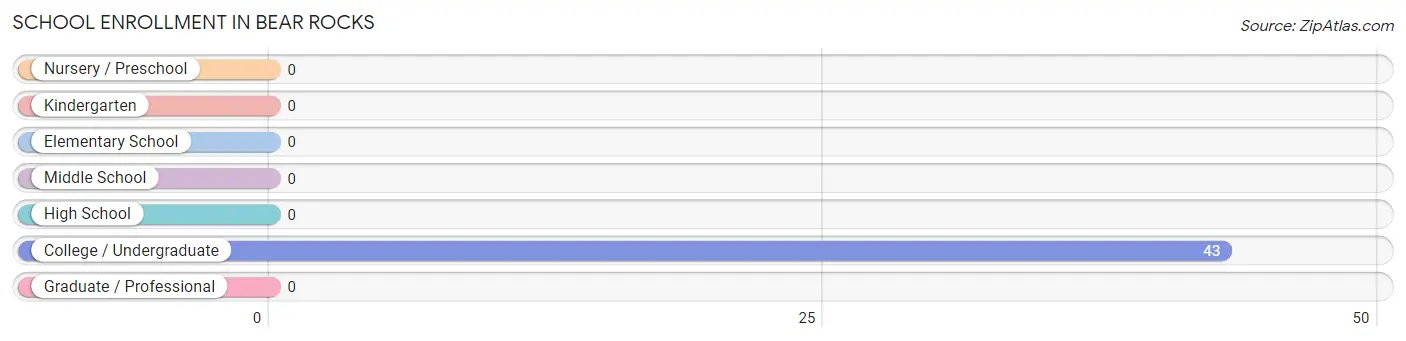
| School Level | # Students | % Students |
| Nursery / Preschool | 0 | 0.0% |
| Kindergarten | 0 | 0.0% |
| Elementary School | 0 | 0.0% |
| Middle School | 0 | 0.0% |
| High School | 0 | 0.0% |
| College / Undergraduate | 43 | 100.0% |
| Graduate / Professional | 0 | 0.0% |
| Total | 43 | 100.0% |
School Enrollment by Age by Funding Source in Bear Rocks
Out of a total of 43 students who are enrolled in schools in Bear Rocks, 13 (30.2%) attend a private institution, while the remaining 30 (69.8%) are enrolled in public schools. The age group of 20 to 24 year olds has the highest likelihood of being enrolled in private schools, with 13 (43.3% in the age bracket) enrolled. Conversely, the age group of 35 years and over has the lowest likelihood of being enrolled in a private school, with 13 (100.0% in the age bracket) attending a public institution.
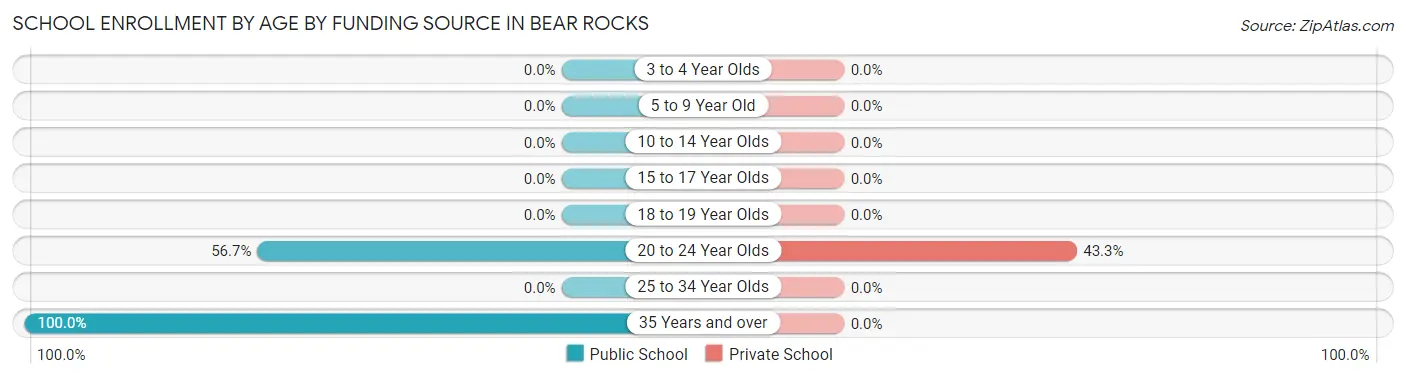
| Age Bracket | Public School | Private School |
| 3 to 4 Year Olds | 0 (0.0%) | 0 (0.0%) |
| 5 to 9 Year Old | 0 (0.0%) | 0 (0.0%) |
| 10 to 14 Year Olds | 0 (0.0%) | 0 (0.0%) |
| 15 to 17 Year Olds | 0 (0.0%) | 0 (0.0%) |
| 18 to 19 Year Olds | 0 (0.0%) | 0 (0.0%) |
| 20 to 24 Year Olds | 17 (56.7%) | 13 (43.3%) |
| 25 to 34 Year Olds | 0 (0.0%) | 0 (0.0%) |
| 35 Years and over | 13 (100.0%) | 0 (0.0%) |
| Total | 30 (69.8%) | 13 (30.2%) |
Educational Attainment by Field of Study in Bear Rocks
Business (53 | 30.3%), communications (36 | 20.6%), science & technology (25 | 14.3%), engineering (21 | 12.0%), and literature & languages (13 | 7.4%) are the most common fields of study among 175 individuals in Bear Rocks who have obtained a bachelor's degree or higher.
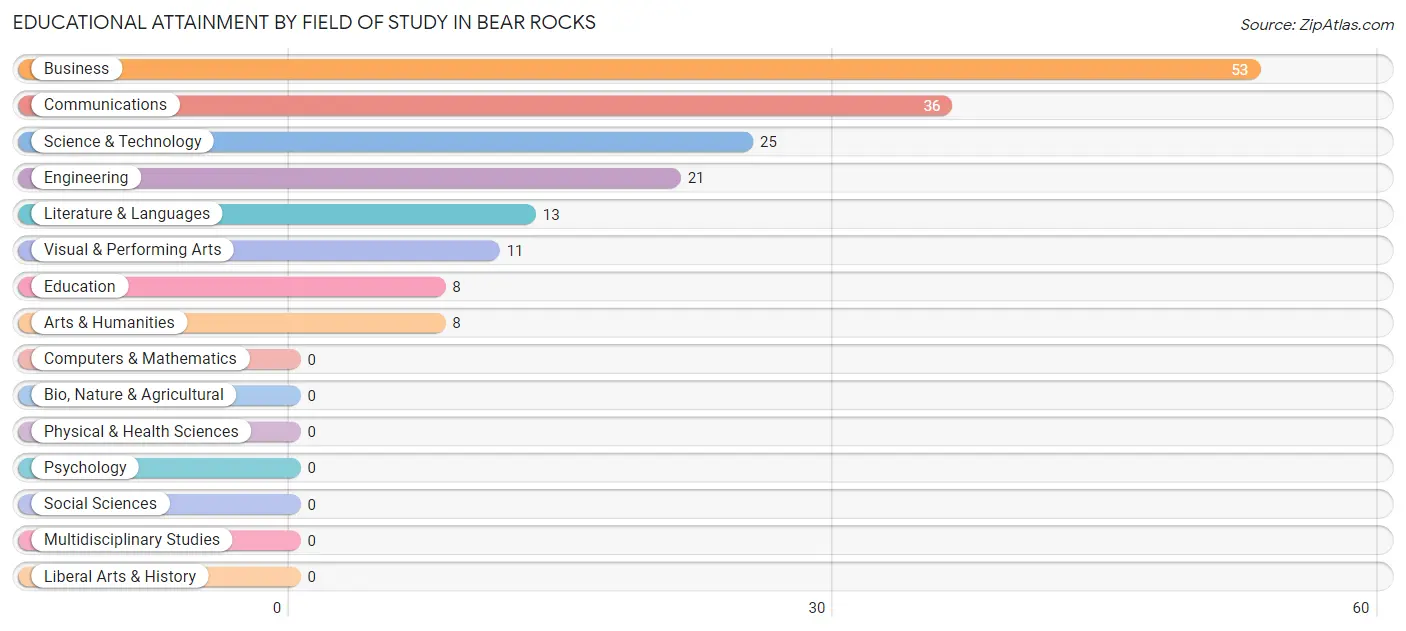
| Field of Study | # Graduates | % Graduates |
| Computers & Mathematics | 0 | 0.0% |
| Bio, Nature & Agricultural | 0 | 0.0% |
| Physical & Health Sciences | 0 | 0.0% |
| Psychology | 0 | 0.0% |
| Social Sciences | 0 | 0.0% |
| Engineering | 21 | 12.0% |
| Multidisciplinary Studies | 0 | 0.0% |
| Science & Technology | 25 | 14.3% |
| Business | 53 | 30.3% |
| Education | 8 | 4.6% |
| Literature & Languages | 13 | 7.4% |
| Liberal Arts & History | 0 | 0.0% |
| Visual & Performing Arts | 11 | 6.3% |
| Communications | 36 | 20.6% |
| Arts & Humanities | 8 | 4.6% |
| Total | 175 | 100.0% |
Transportation & Commute in Bear Rocks
Vehicle Availability by Sex in Bear Rocks
The most prevalent vehicle ownership categories in Bear Rocks are males with 2 vehicles (166, accounting for 68.3%) and females with 2 vehicles (231, making up 61.5%).
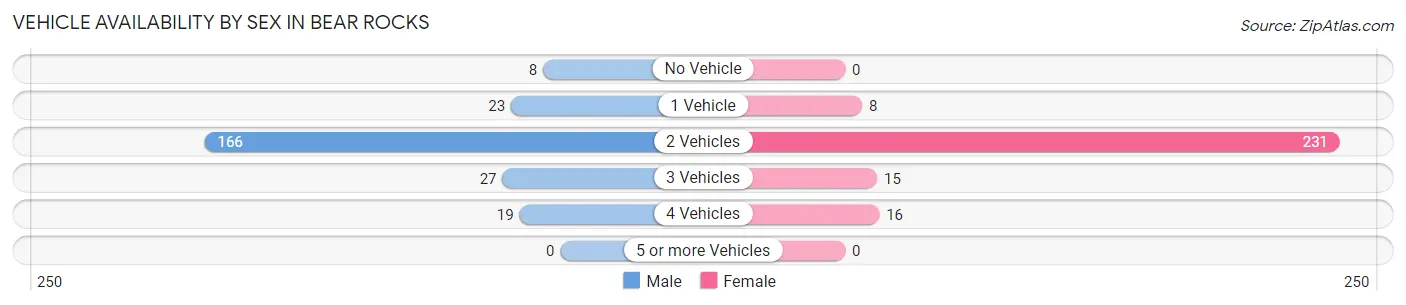
| Vehicles Available | Male | Female |
| No Vehicle | 8 (3.3%) | 0 (0.0%) |
| 1 Vehicle | 23 (9.5%) | 8 (3.0%) |
| 2 Vehicles | 166 (68.3%) | 231 (85.6%) |
| 3 Vehicles | 27 (11.1%) | 15 (5.6%) |
| 4 Vehicles | 19 (7.8%) | 16 (5.9%) |
| 5 or more Vehicles | 0 (0.0%) | 0 (0.0%) |
| Total | 243 (100.0%) | 270 (100.0%) |
Commute Time in Bear Rocks
The most frequently occuring commute durations in Bear Rocks are 25 to 29 minutes (138 commuters, 30.7%), 30 to 34 minutes (65 commuters, 14.4%), and 40 to 44 minutes (61 commuters, 13.6%).
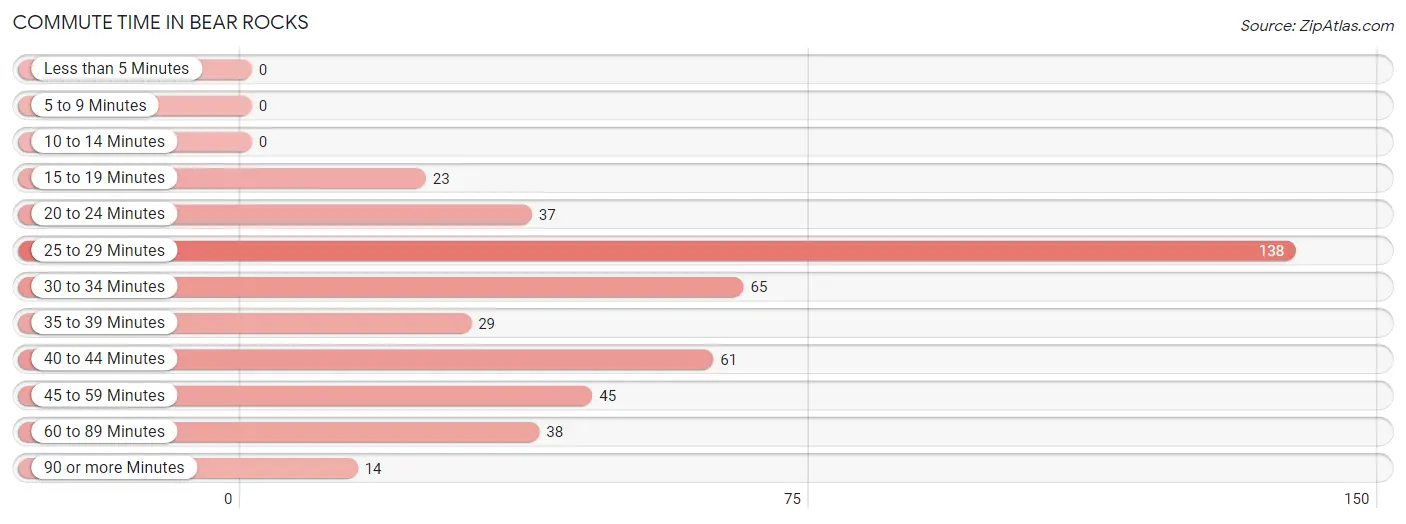
| Commute Time | # Commuters | % Commuters |
| Less than 5 Minutes | 0 | 0.0% |
| 5 to 9 Minutes | 0 | 0.0% |
| 10 to 14 Minutes | 0 | 0.0% |
| 15 to 19 Minutes | 23 | 5.1% |
| 20 to 24 Minutes | 37 | 8.2% |
| 25 to 29 Minutes | 138 | 30.7% |
| 30 to 34 Minutes | 65 | 14.4% |
| 35 to 39 Minutes | 29 | 6.4% |
| 40 to 44 Minutes | 61 | 13.6% |
| 45 to 59 Minutes | 45 | 10.0% |
| 60 to 89 Minutes | 38 | 8.4% |
| 90 or more Minutes | 14 | 3.1% |
Commute Time by Sex in Bear Rocks
The most common commute times in Bear Rocks are 45 to 59 minutes (45 commuters, 21.5%) for males and 25 to 29 minutes (125 commuters, 51.9%) for females.
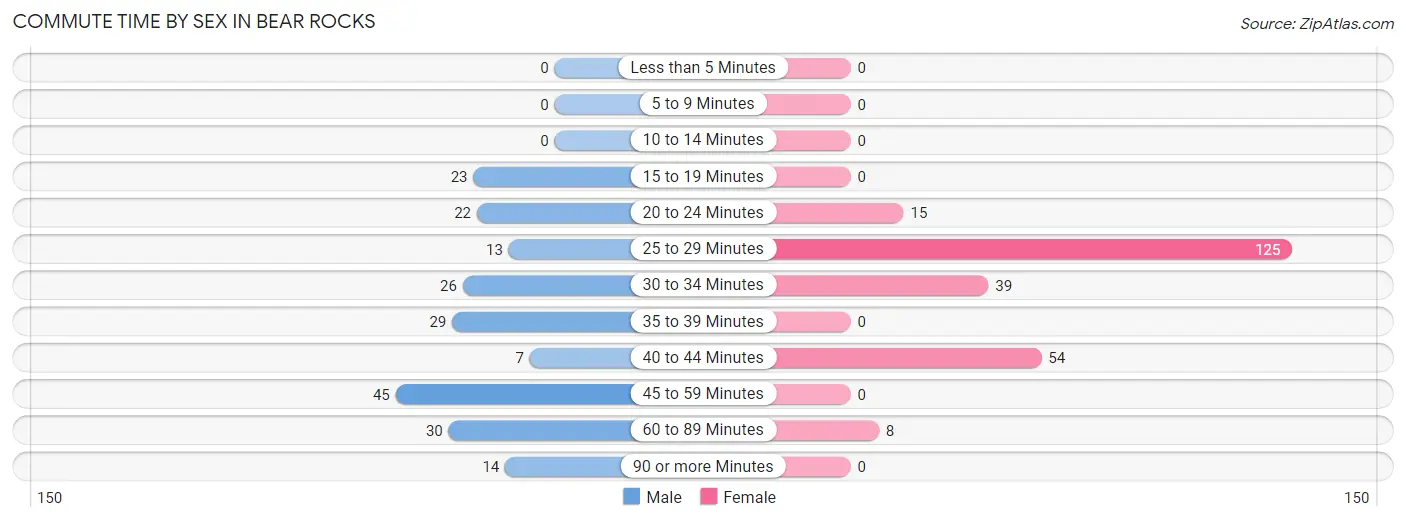
| Commute Time | Male | Female |
| Less than 5 Minutes | 0 (0.0%) | 0 (0.0%) |
| 5 to 9 Minutes | 0 (0.0%) | 0 (0.0%) |
| 10 to 14 Minutes | 0 (0.0%) | 0 (0.0%) |
| 15 to 19 Minutes | 23 (11.0%) | 0 (0.0%) |
| 20 to 24 Minutes | 22 (10.5%) | 15 (6.2%) |
| 25 to 29 Minutes | 13 (6.2%) | 125 (51.9%) |
| 30 to 34 Minutes | 26 (12.4%) | 39 (16.2%) |
| 35 to 39 Minutes | 29 (13.9%) | 0 (0.0%) |
| 40 to 44 Minutes | 7 (3.4%) | 54 (22.4%) |
| 45 to 59 Minutes | 45 (21.5%) | 0 (0.0%) |
| 60 to 89 Minutes | 30 (14.3%) | 8 (3.3%) |
| 90 or more Minutes | 14 (6.7%) | 0 (0.0%) |
Time of Departure to Work by Sex in Bear Rocks
The most frequent times of departure to work in Bear Rocks are 5:00 AM to 5:29 AM (55, 26.3%) for males and 7:00 AM to 7:29 AM (140, 58.1%) for females.
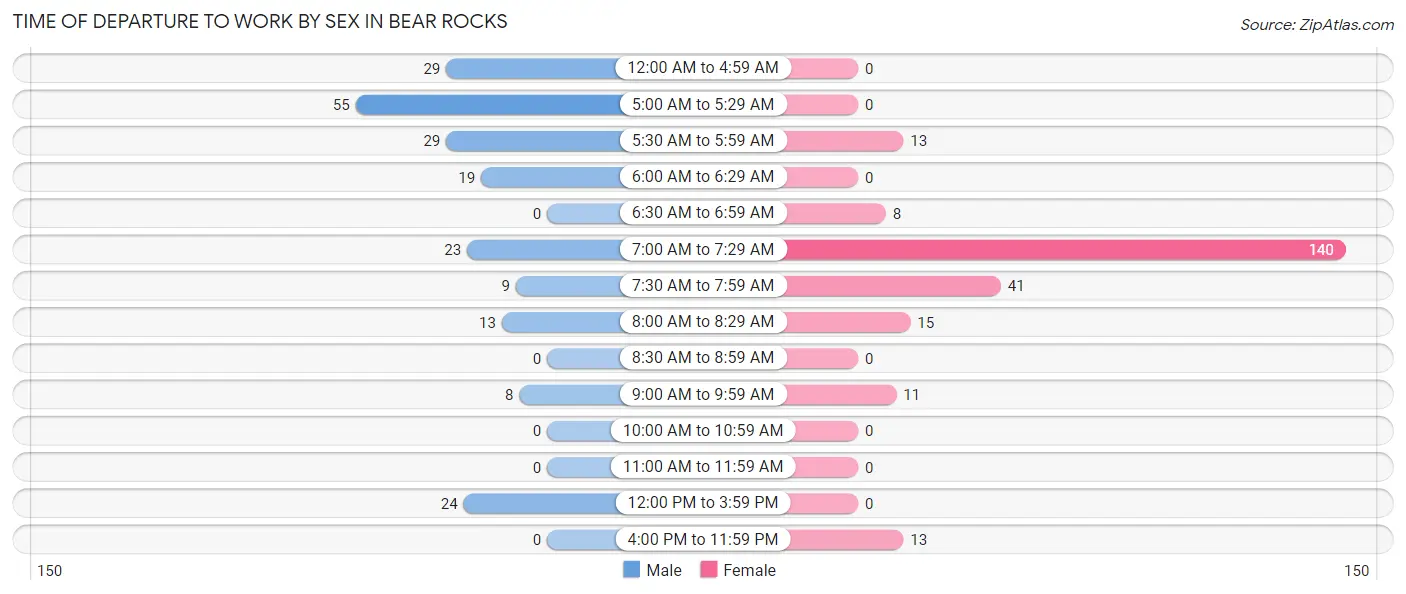
| Time of Departure | Male | Female |
| 12:00 AM to 4:59 AM | 29 (13.9%) | 0 (0.0%) |
| 5:00 AM to 5:29 AM | 55 (26.3%) | 0 (0.0%) |
| 5:30 AM to 5:59 AM | 29 (13.9%) | 13 (5.4%) |
| 6:00 AM to 6:29 AM | 19 (9.1%) | 0 (0.0%) |
| 6:30 AM to 6:59 AM | 0 (0.0%) | 8 (3.3%) |
| 7:00 AM to 7:29 AM | 23 (11.0%) | 140 (58.1%) |
| 7:30 AM to 7:59 AM | 9 (4.3%) | 41 (17.0%) |
| 8:00 AM to 8:29 AM | 13 (6.2%) | 15 (6.2%) |
| 8:30 AM to 8:59 AM | 0 (0.0%) | 0 (0.0%) |
| 9:00 AM to 9:59 AM | 8 (3.8%) | 11 (4.6%) |
| 10:00 AM to 10:59 AM | 0 (0.0%) | 0 (0.0%) |
| 11:00 AM to 11:59 AM | 0 (0.0%) | 0 (0.0%) |
| 12:00 PM to 3:59 PM | 24 (11.5%) | 0 (0.0%) |
| 4:00 PM to 11:59 PM | 0 (0.0%) | 13 (5.4%) |
| Total | 209 (100.0%) | 241 (100.0%) |
Housing Occupancy in Bear Rocks
Occupancy by Ownership in Bear Rocks
Of the total 536 dwellings in Bear Rocks, owner-occupied units account for 509 (95.0%), while renter-occupied units make up 27 (5.0%).
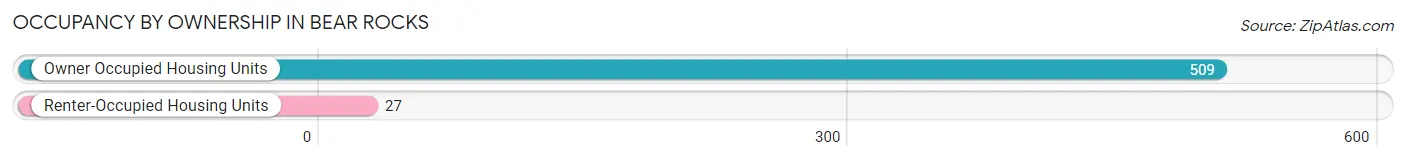
| Occupancy | # Housing Units | % Housing Units |
| Owner Occupied Housing Units | 509 | 95.0% |
| Renter-Occupied Housing Units | 27 | 5.0% |
| Total Occupied Housing Units | 536 | 100.0% |
Occupancy by Household Size in Bear Rocks
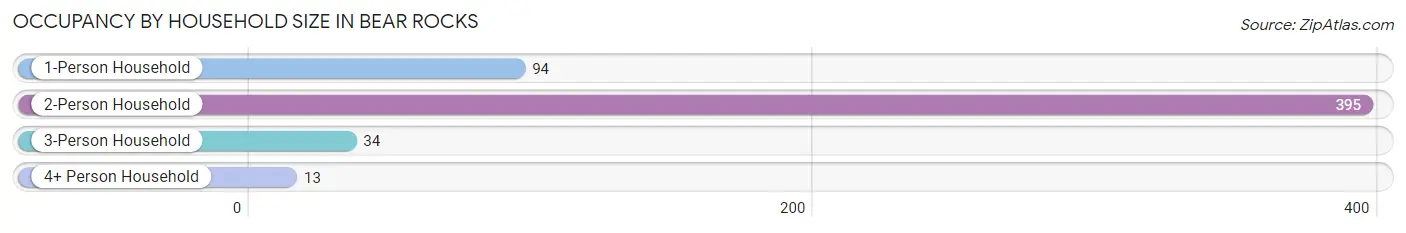
| Household Size | # Housing Units | % Housing Units |
| 1-Person Household | 94 | 17.5% |
| 2-Person Household | 395 | 73.7% |
| 3-Person Household | 34 | 6.3% |
| 4+ Person Household | 13 | 2.4% |
| Total Housing Units | 536 | 100.0% |
Occupancy by Ownership by Household Size in Bear Rocks
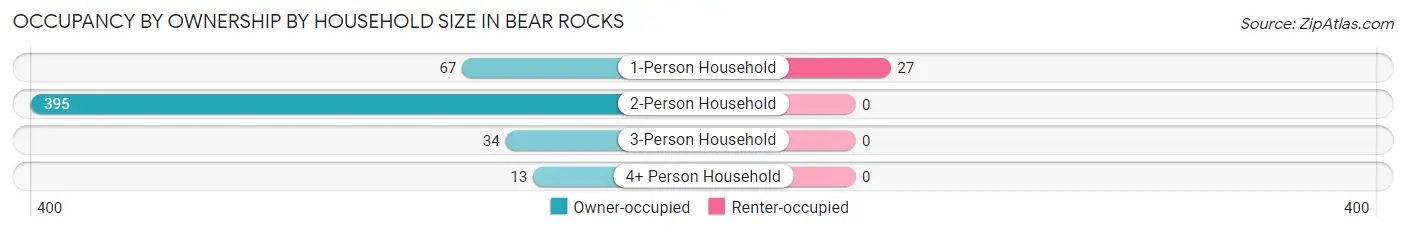
| Household Size | Owner-occupied | Renter-occupied |
| 1-Person Household | 67 (71.3%) | 27 (28.7%) |
| 2-Person Household | 395 (100.0%) | 0 (0.0%) |
| 3-Person Household | 34 (100.0%) | 0 (0.0%) |
| 4+ Person Household | 13 (100.0%) | 0 (0.0%) |
| Total Housing Units | 509 (95.0%) | 27 (5.0%) |
Occupancy by Educational Attainment in Bear Rocks
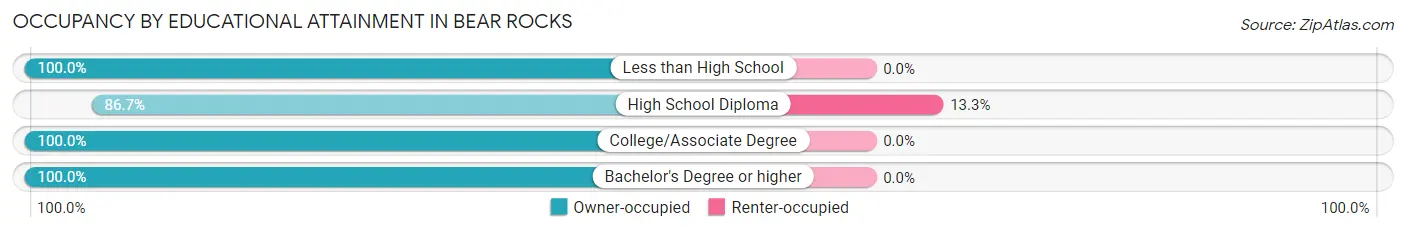
| Household Size | Owner-occupied | Renter-occupied |
| Less than High School | 38 (100.0%) | 0 (0.0%) |
| High School Diploma | 176 (86.7%) | 27 (13.3%) |
| College/Associate Degree | 200 (100.0%) | 0 (0.0%) |
| Bachelor's Degree or higher | 95 (100.0%) | 0 (0.0%) |
Occupancy by Age of Householder in Bear Rocks
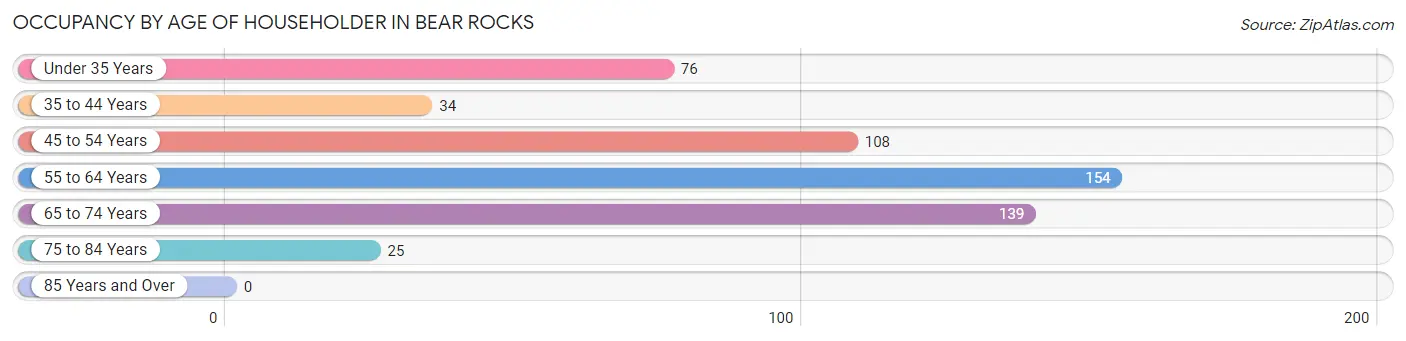
| Age Bracket | # Households | % Households |
| Under 35 Years | 76 | 14.2% |
| 35 to 44 Years | 34 | 6.3% |
| 45 to 54 Years | 108 | 20.2% |
| 55 to 64 Years | 154 | 28.7% |
| 65 to 74 Years | 139 | 25.9% |
| 75 to 84 Years | 25 | 4.7% |
| 85 Years and Over | 0 | 0.0% |
| Total | 536 | 100.0% |
Housing Finances in Bear Rocks
Median Income by Occupancy in Bear Rocks
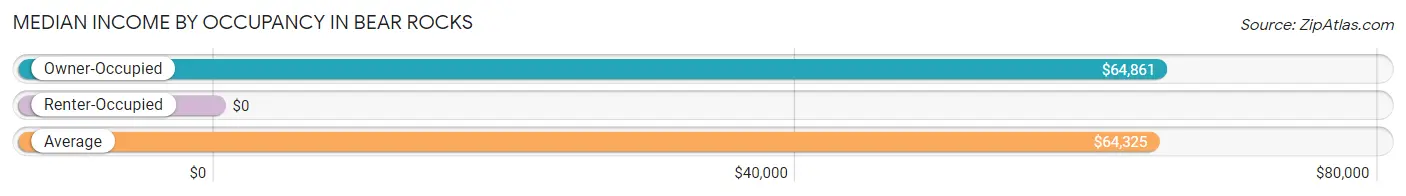
| Occupancy Type | # Households | Median Income |
| Owner-Occupied | 509 (95.0%) | $64,861 |
| Renter-Occupied | 27 (5.0%) | $0 |
| Average | 536 (100.0%) | $64,325 |
Occupancy by Householder Income Bracket in Bear Rocks
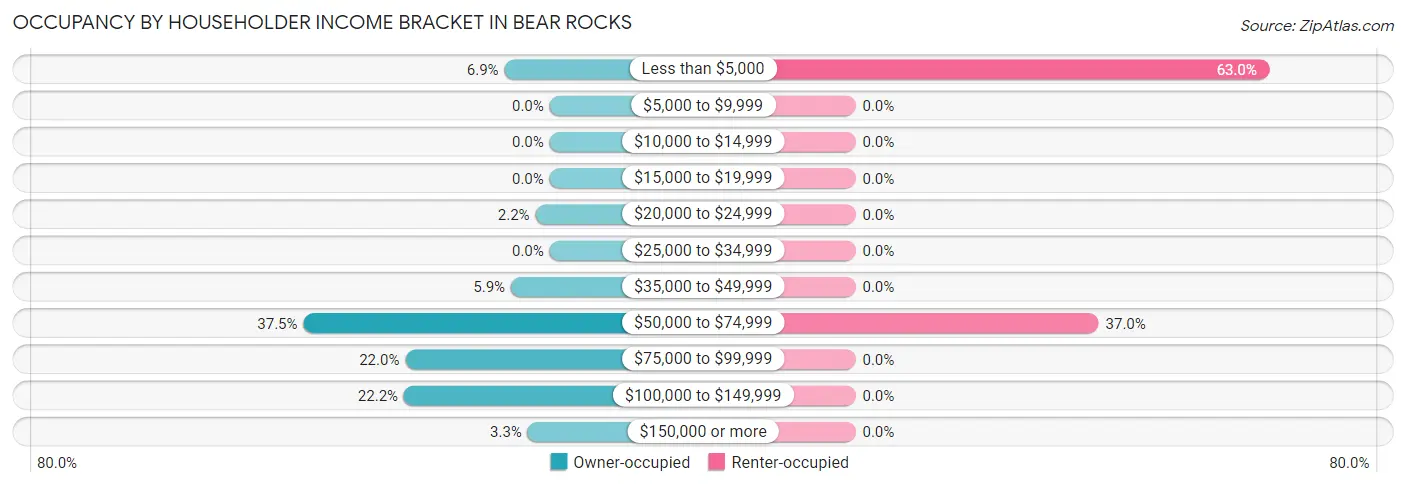
| Income Bracket | Owner-occupied | Renter-occupied |
| Less than $5,000 | 35 (6.9%) | 17 (63.0%) |
| $5,000 to $9,999 | 0 (0.0%) | 0 (0.0%) |
| $10,000 to $14,999 | 0 (0.0%) | 0 (0.0%) |
| $15,000 to $19,999 | 0 (0.0%) | 0 (0.0%) |
| $20,000 to $24,999 | 11 (2.2%) | 0 (0.0%) |
| $25,000 to $34,999 | 0 (0.0%) | 0 (0.0%) |
| $35,000 to $49,999 | 30 (5.9%) | 0 (0.0%) |
| $50,000 to $74,999 | 191 (37.5%) | 10 (37.0%) |
| $75,000 to $99,999 | 112 (22.0%) | 0 (0.0%) |
| $100,000 to $149,999 | 113 (22.2%) | 0 (0.0%) |
| $150,000 or more | 17 (3.3%) | 0 (0.0%) |
| Total | 509 (100.0%) | 27 (100.0%) |
Monthly Housing Cost Tiers in Bear Rocks
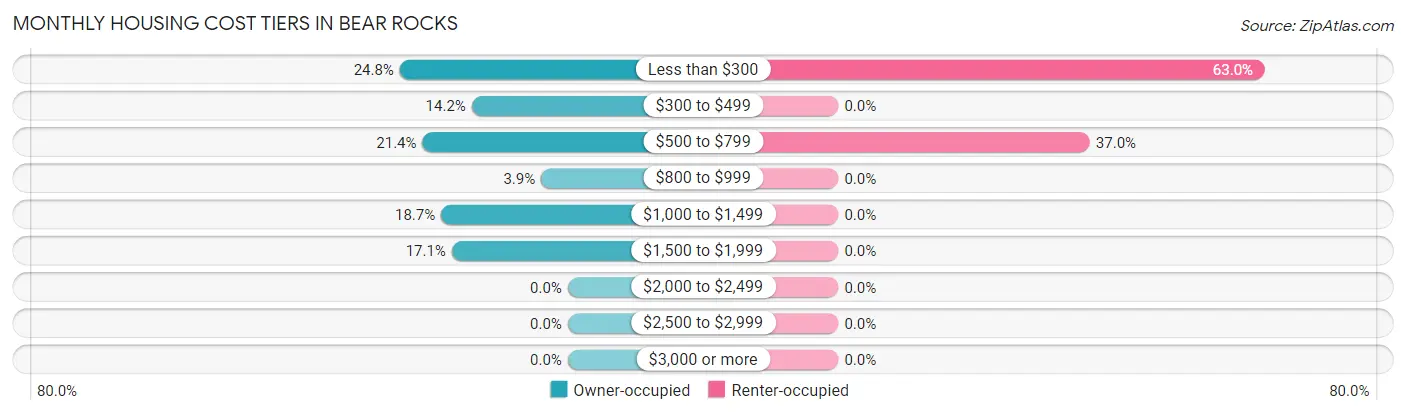
| Monthly Cost | Owner-occupied | Renter-occupied |
| Less than $300 | 126 (24.7%) | 17 (63.0%) |
| $300 to $499 | 72 (14.1%) | 0 (0.0%) |
| $500 to $799 | 109 (21.4%) | 10 (37.0%) |
| $800 to $999 | 20 (3.9%) | 0 (0.0%) |
| $1,000 to $1,499 | 95 (18.7%) | 0 (0.0%) |
| $1,500 to $1,999 | 87 (17.1%) | 0 (0.0%) |
| $2,000 to $2,499 | 0 (0.0%) | 0 (0.0%) |
| $2,500 to $2,999 | 0 (0.0%) | 0 (0.0%) |
| $3,000 or more | 0 (0.0%) | 0 (0.0%) |
| Total | 509 (100.0%) | 27 (100.0%) |
Physical Housing Characteristics in Bear Rocks
Housing Structures in Bear Rocks
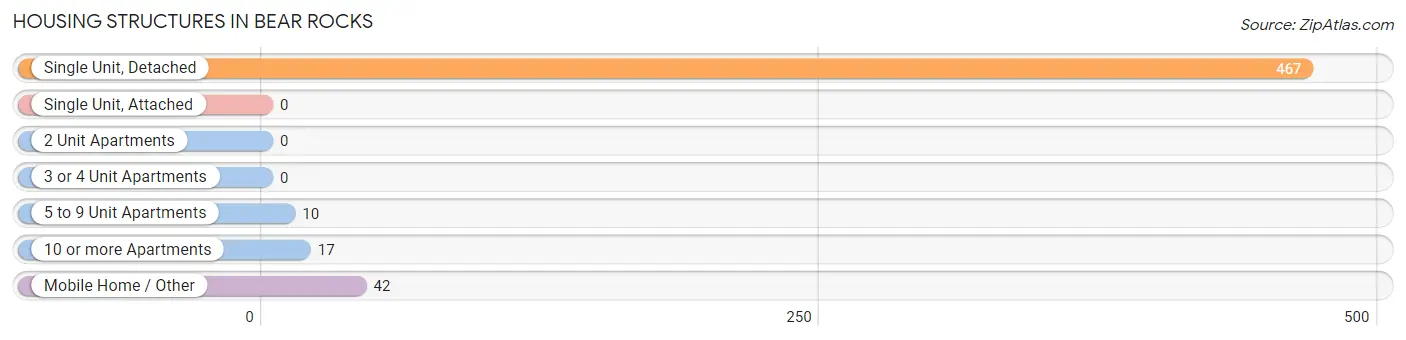
| Structure Type | # Housing Units | % Housing Units |
| Single Unit, Detached | 467 | 87.1% |
| Single Unit, Attached | 0 | 0.0% |
| 2 Unit Apartments | 0 | 0.0% |
| 3 or 4 Unit Apartments | 0 | 0.0% |
| 5 to 9 Unit Apartments | 10 | 1.9% |
| 10 or more Apartments | 17 | 3.2% |
| Mobile Home / Other | 42 | 7.8% |
| Total | 536 | 100.0% |
Housing Structures by Occupancy in Bear Rocks
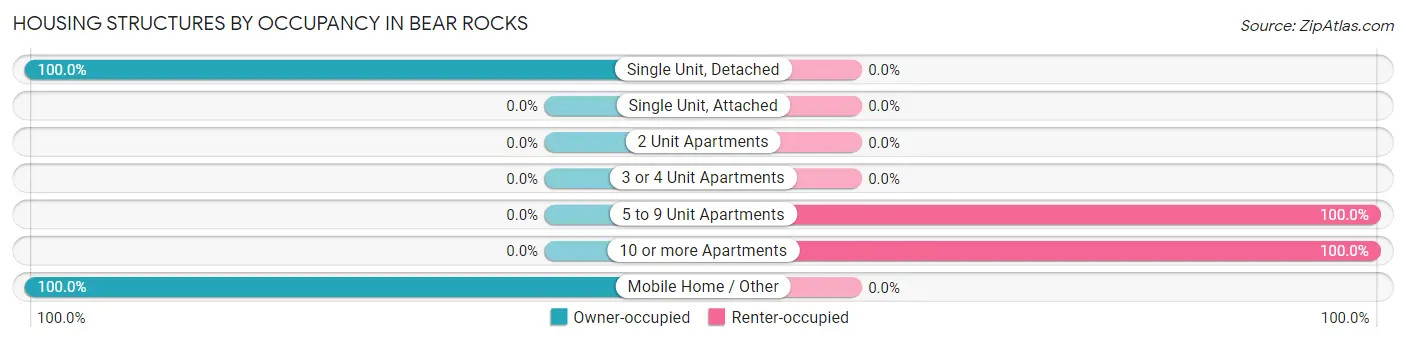
| Structure Type | Owner-occupied | Renter-occupied |
| Single Unit, Detached | 467 (100.0%) | 0 (0.0%) |
| Single Unit, Attached | 0 (0.0%) | 0 (0.0%) |
| 2 Unit Apartments | 0 (0.0%) | 0 (0.0%) |
| 3 or 4 Unit Apartments | 0 (0.0%) | 0 (0.0%) |
| 5 to 9 Unit Apartments | 0 (0.0%) | 10 (100.0%) |
| 10 or more Apartments | 0 (0.0%) | 17 (100.0%) |
| Mobile Home / Other | 42 (100.0%) | 0 (0.0%) |
| Total | 509 (95.0%) | 27 (5.0%) |
Housing Structures by Number of Rooms in Bear Rocks
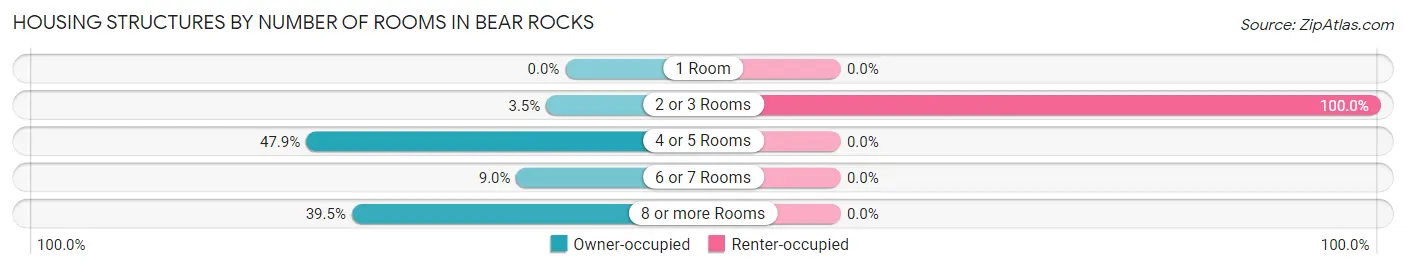
| Number of Rooms | Owner-occupied | Renter-occupied |
| 1 Room | 0 (0.0%) | 0 (0.0%) |
| 2 or 3 Rooms | 18 (3.5%) | 27 (100.0%) |
| 4 or 5 Rooms | 244 (47.9%) | 0 (0.0%) |
| 6 or 7 Rooms | 46 (9.0%) | 0 (0.0%) |
| 8 or more Rooms | 201 (39.5%) | 0 (0.0%) |
| Total | 509 (100.0%) | 27 (100.0%) |
Housing Structure by Heating Type in Bear Rocks
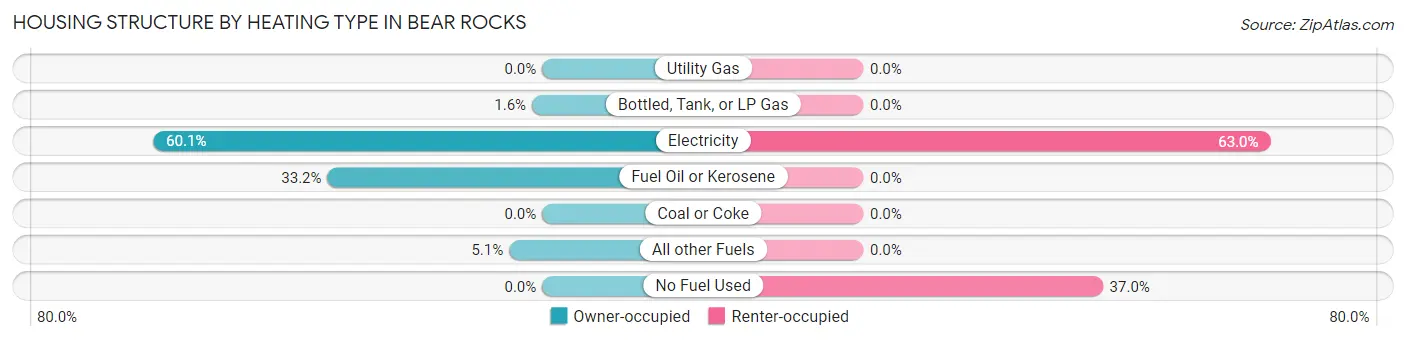
| Heating Type | Owner-occupied | Renter-occupied |
| Utility Gas | 0 (0.0%) | 0 (0.0%) |
| Bottled, Tank, or LP Gas | 8 (1.6%) | 0 (0.0%) |
| Electricity | 306 (60.1%) | 17 (63.0%) |
| Fuel Oil or Kerosene | 169 (33.2%) | 0 (0.0%) |
| Coal or Coke | 0 (0.0%) | 0 (0.0%) |
| All other Fuels | 26 (5.1%) | 0 (0.0%) |
| No Fuel Used | 0 (0.0%) | 10 (37.0%) |
| Total | 509 (100.0%) | 27 (100.0%) |
Household Vehicle Usage in Bear Rocks
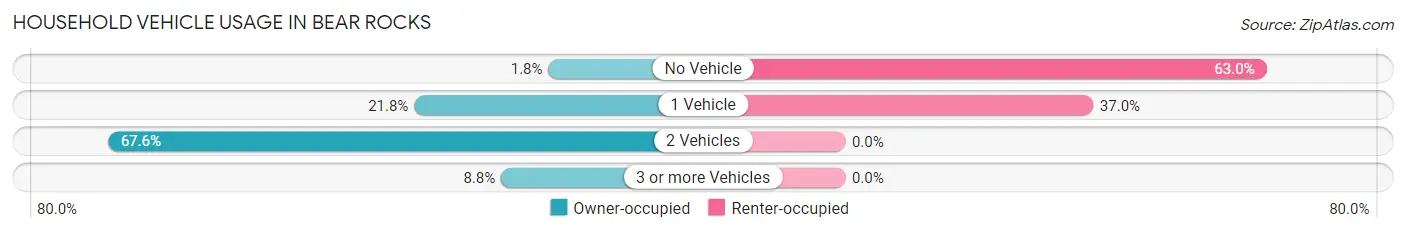
| Vehicles per Household | Owner-occupied | Renter-occupied |
| No Vehicle | 9 (1.8%) | 17 (63.0%) |
| 1 Vehicle | 111 (21.8%) | 10 (37.0%) |
| 2 Vehicles | 344 (67.6%) | 0 (0.0%) |
| 3 or more Vehicles | 45 (8.8%) | 0 (0.0%) |
| Total | 509 (100.0%) | 27 (100.0%) |
Real Estate & Mortgages in Bear Rocks
Real Estate and Mortgage Overview in Bear Rocks
| Characteristic | Without Mortgage | With Mortgage |
| Housing Units | 295 | 214 |
| Median Property Value | - | - |
| Median Household Income | $52,414 | $11 |
| Monthly Housing Costs | $421 | $0 |
| Real Estate Taxes | $1,846 | $41 |
Property Value by Mortgage Status in Bear Rocks
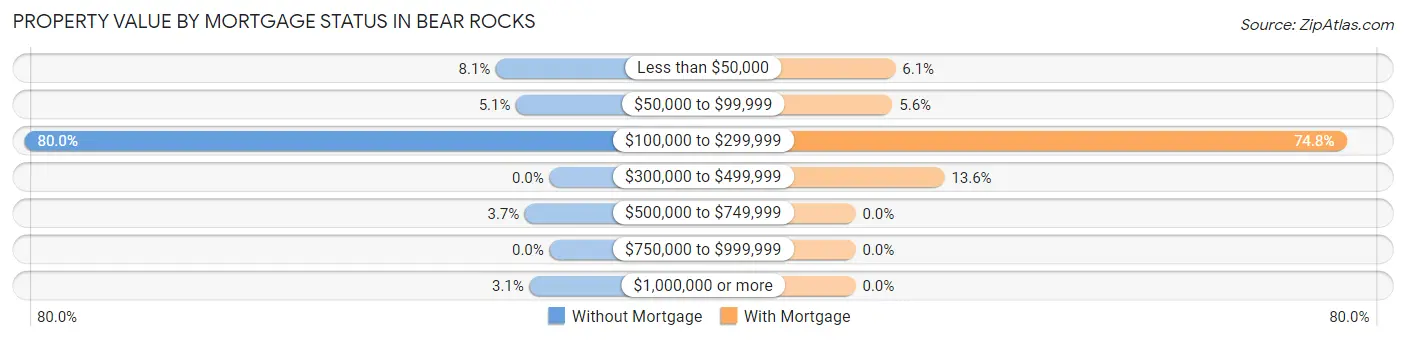
| Property Value | Without Mortgage | With Mortgage |
| Less than $50,000 | 24 (8.1%) | 13 (6.1%) |
| $50,000 to $99,999 | 15 (5.1%) | 12 (5.6%) |
| $100,000 to $299,999 | 236 (80.0%) | 160 (74.8%) |
| $300,000 to $499,999 | 0 (0.0%) | 29 (13.6%) |
| $500,000 to $749,999 | 11 (3.7%) | 0 (0.0%) |
| $750,000 to $999,999 | 0 (0.0%) | 0 (0.0%) |
| $1,000,000 or more | 9 (3.0%) | 0 (0.0%) |
| Total | 295 (100.0%) | 214 (100.0%) |
Household Income by Mortgage Status in Bear Rocks
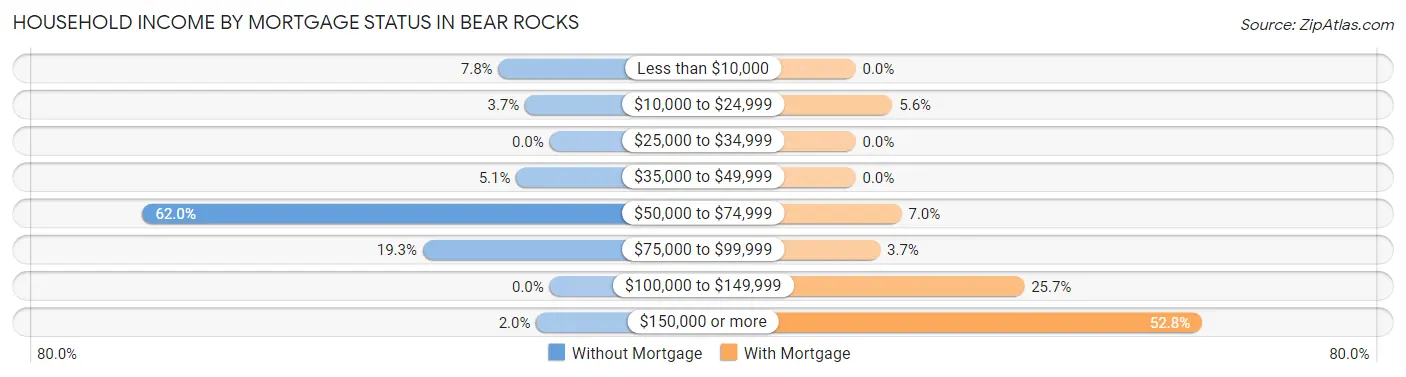
| Household Income | Without Mortgage | With Mortgage |
| Less than $10,000 | 23 (7.8%) | 0 (0.0%) |
| $10,000 to $24,999 | 11 (3.7%) | 12 (5.6%) |
| $25,000 to $34,999 | 0 (0.0%) | 0 (0.0%) |
| $35,000 to $49,999 | 15 (5.1%) | 0 (0.0%) |
| $50,000 to $74,999 | 183 (62.0%) | 15 (7.0%) |
| $75,000 to $99,999 | 57 (19.3%) | 8 (3.7%) |
| $100,000 to $149,999 | 0 (0.0%) | 55 (25.7%) |
| $150,000 or more | 6 (2.0%) | 113 (52.8%) |
| Total | 295 (100.0%) | 214 (100.0%) |
Property Value to Household Income Ratio in Bear Rocks
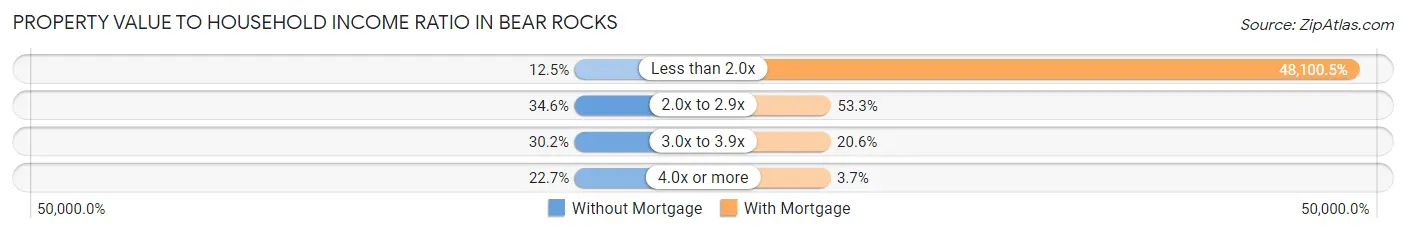
| Value-to-Income Ratio | Without Mortgage | With Mortgage |
| Less than 2.0x | 37 (12.5%) | 102,935 (48,100.5%) |
| 2.0x to 2.9x | 102 (34.6%) | 114 (53.3%) |
| 3.0x to 3.9x | 89 (30.2%) | 44 (20.6%) |
| 4.0x or more | 67 (22.7%) | 8 (3.7%) |
| Total | 295 (100.0%) | 214 (100.0%) |
Real Estate Taxes by Mortgage Status in Bear Rocks
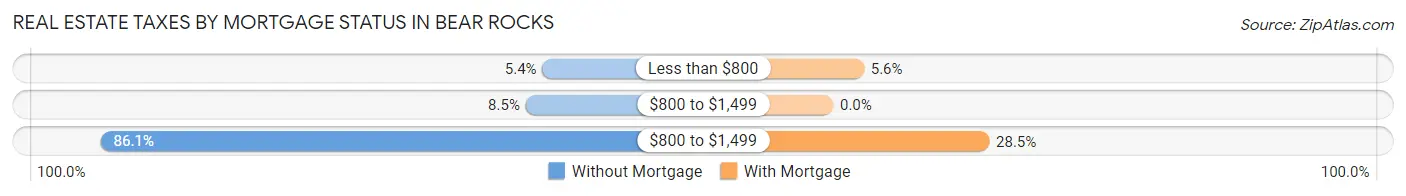
| Property Taxes | Without Mortgage | With Mortgage |
| Less than $800 | 16 (5.4%) | 12 (5.6%) |
| $800 to $1,499 | 25 (8.5%) | 0 (0.0%) |
| $800 to $1,499 | 254 (86.1%) | 61 (28.5%) |
| Total | 295 (100.0%) | 214 (100.0%) |
Health & Disability in Bear Rocks
Health Insurance Coverage by Age in Bear Rocks
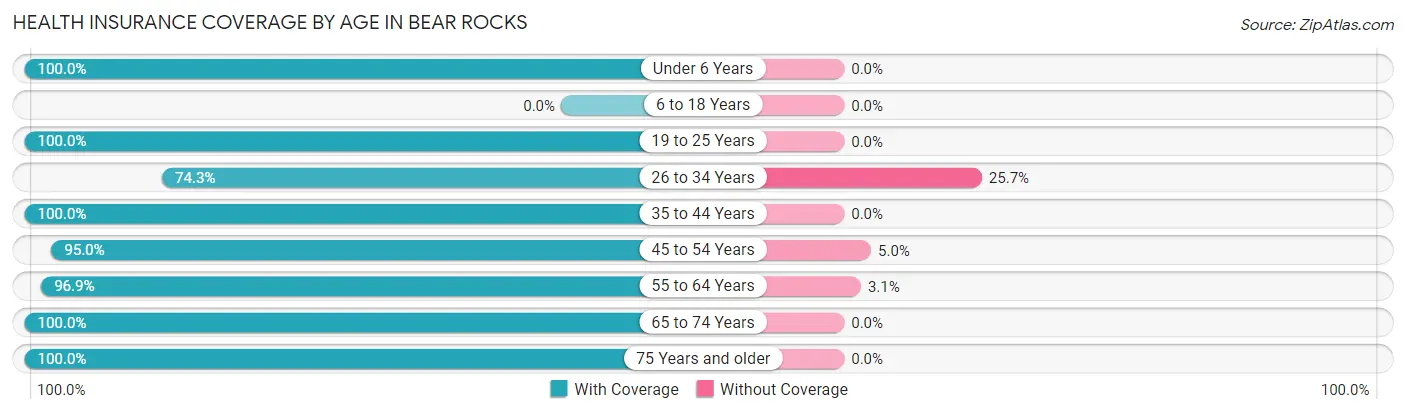
| Age Bracket | With Coverage | Without Coverage |
| Under 6 Years | 36 (100.0%) | 0 (0.0%) |
| 6 to 18 Years | 0 (0.0%) | 0 (0.0%) |
| 19 to 25 Years | 67 (100.0%) | 0 (0.0%) |
| 26 to 34 Years | 84 (74.3%) | 29 (25.7%) |
| 35 to 44 Years | 83 (100.0%) | 0 (0.0%) |
| 45 to 54 Years | 152 (95.0%) | 8 (5.0%) |
| 55 to 64 Years | 312 (96.9%) | 10 (3.1%) |
| 65 to 74 Years | 233 (100.0%) | 0 (0.0%) |
| 75 Years and older | 42 (100.0%) | 0 (0.0%) |
| Total | 1,009 (95.6%) | 47 (4.4%) |
Health Insurance Coverage by Citizenship Status in Bear Rocks
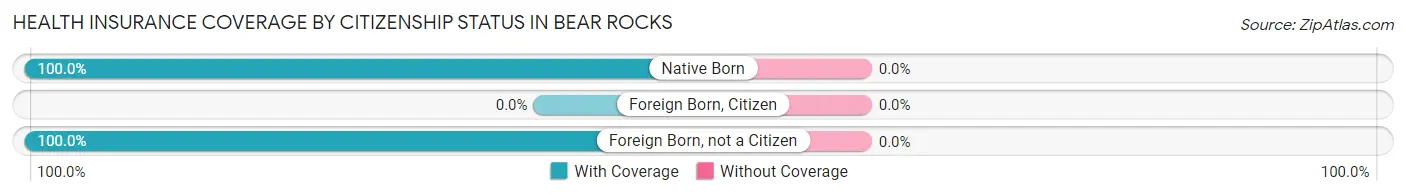
| Citizenship Status | With Coverage | Without Coverage |
| Native Born | 36 (100.0%) | 0 (0.0%) |
| Foreign Born, Citizen | 0 (0.0%) | 0 (0.0%) |
| Foreign Born, not a Citizen | 67 (100.0%) | 0 (0.0%) |
Health Insurance Coverage by Household Income in Bear Rocks
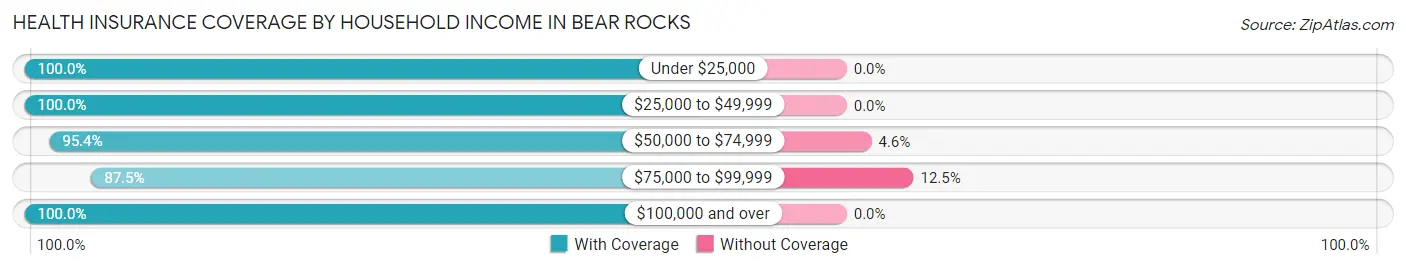
| Household Income | With Coverage | Without Coverage |
| Under $25,000 | 73 (100.0%) | 0 (0.0%) |
| $25,000 to $49,999 | 59 (100.0%) | 0 (0.0%) |
| $50,000 to $74,999 | 371 (95.4%) | 18 (4.6%) |
| $75,000 to $99,999 | 203 (87.5%) | 29 (12.5%) |
| $100,000 and over | 301 (100.0%) | 0 (0.0%) |
Public vs Private Health Insurance Coverage by Age in Bear Rocks
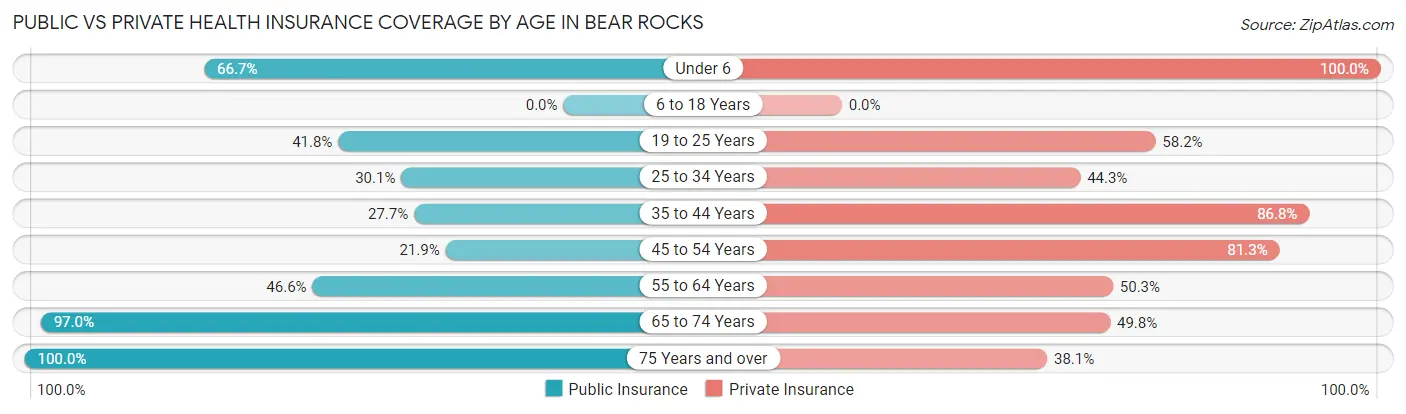
| Age Bracket | Public Insurance | Private Insurance |
| Under 6 | 24 (66.7%) | 36 (100.0%) |
| 6 to 18 Years | 0 (0.0%) | 0 (0.0%) |
| 19 to 25 Years | 28 (41.8%) | 39 (58.2%) |
| 25 to 34 Years | 34 (30.1%) | 50 (44.3%) |
| 35 to 44 Years | 23 (27.7%) | 72 (86.8%) |
| 45 to 54 Years | 35 (21.9%) | 130 (81.2%) |
| 55 to 64 Years | 150 (46.6%) | 162 (50.3%) |
| 65 to 74 Years | 226 (97.0%) | 116 (49.8%) |
| 75 Years and over | 42 (100.0%) | 16 (38.1%) |
| Total | 562 (53.2%) | 621 (58.8%) |
Disability Status by Sex by Age in Bear Rocks
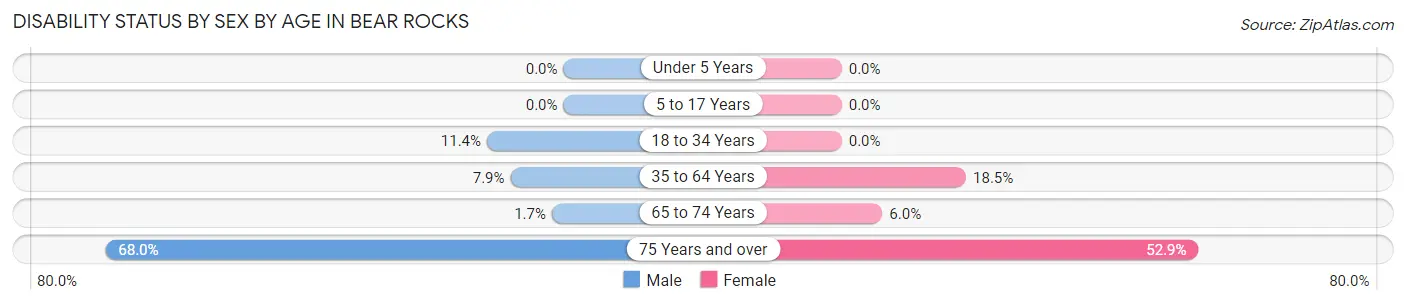
| Age Bracket | Male | Female |
| Under 5 Years | 0 (0.0%) | 0 (0.0%) |
| 5 to 17 Years | 0 (0.0%) | 0 (0.0%) |
| 18 to 34 Years | 10 (11.4%) | 0 (0.0%) |
| 35 to 64 Years | 24 (7.9%) | 48 (18.5%) |
| 65 to 74 Years | 2 (1.7%) | 7 (6.0%) |
| 75 Years and over | 17 (68.0%) | 9 (52.9%) |
Disability Class by Sex by Age in Bear Rocks
Disability Class: Hearing Difficulty
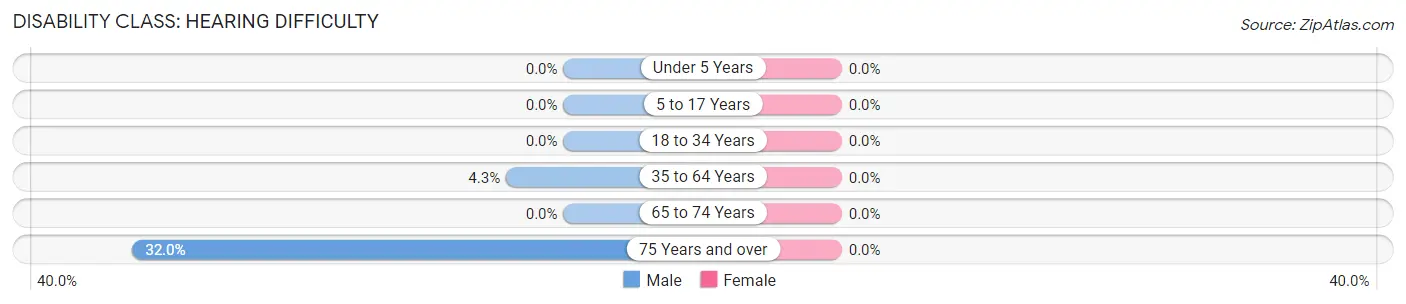
| Age Bracket | Male | Female |
| Under 5 Years | 0 (0.0%) | 0 (0.0%) |
| 5 to 17 Years | 0 (0.0%) | 0 (0.0%) |
| 18 to 34 Years | 0 (0.0%) | 0 (0.0%) |
| 35 to 64 Years | 13 (4.3%) | 0 (0.0%) |
| 65 to 74 Years | 0 (0.0%) | 0 (0.0%) |
| 75 Years and over | 8 (32.0%) | 0 (0.0%) |
Disability Class: Vision Difficulty
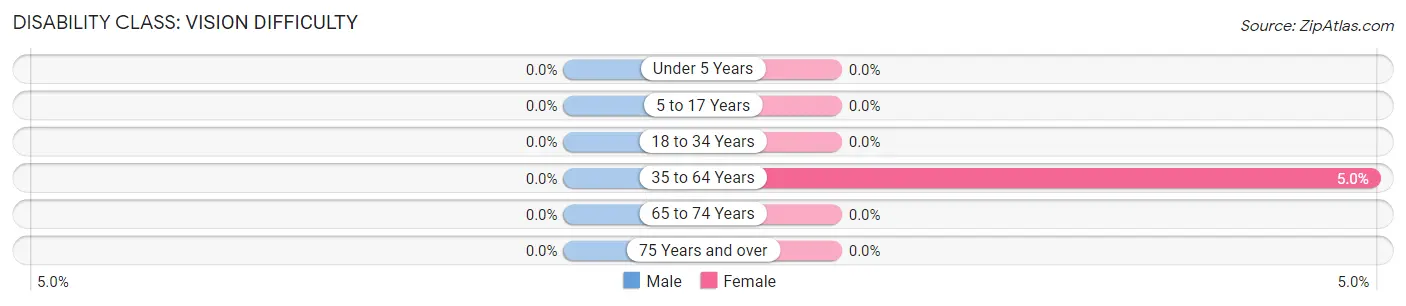
| Age Bracket | Male | Female |
| Under 5 Years | 0 (0.0%) | 0 (0.0%) |
| 5 to 17 Years | 0 (0.0%) | 0 (0.0%) |
| 18 to 34 Years | 0 (0.0%) | 0 (0.0%) |
| 35 to 64 Years | 0 (0.0%) | 13 (5.0%) |
| 65 to 74 Years | 0 (0.0%) | 0 (0.0%) |
| 75 Years and over | 0 (0.0%) | 0 (0.0%) |
Disability Class: Cognitive Difficulty
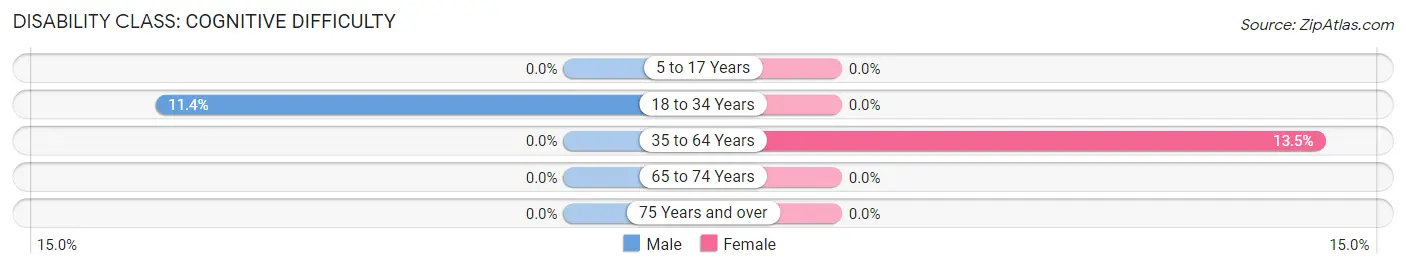
| Age Bracket | Male | Female |
| 5 to 17 Years | 0 (0.0%) | 0 (0.0%) |
| 18 to 34 Years | 10 (11.4%) | 0 (0.0%) |
| 35 to 64 Years | 0 (0.0%) | 35 (13.5%) |
| 65 to 74 Years | 0 (0.0%) | 0 (0.0%) |
| 75 Years and over | 0 (0.0%) | 0 (0.0%) |
Disability Class: Ambulatory Difficulty
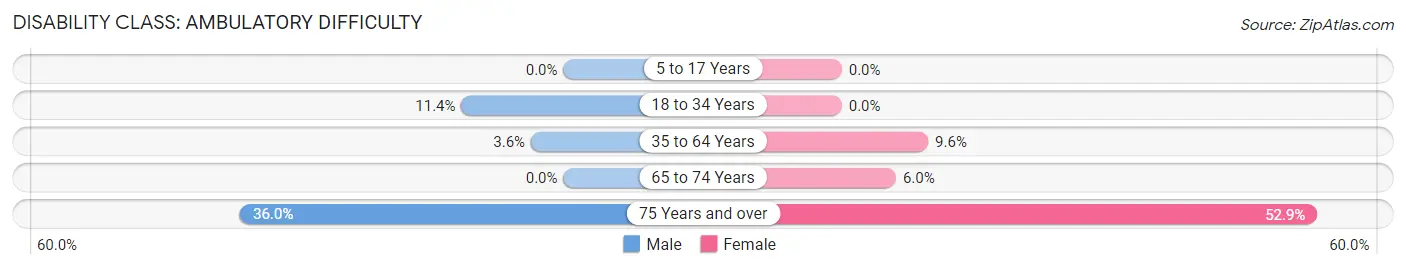
| Age Bracket | Male | Female |
| 5 to 17 Years | 0 (0.0%) | 0 (0.0%) |
| 18 to 34 Years | 10 (11.4%) | 0 (0.0%) |
| 35 to 64 Years | 11 (3.6%) | 25 (9.6%) |
| 65 to 74 Years | 0 (0.0%) | 7 (6.0%) |
| 75 Years and over | 9 (36.0%) | 9 (52.9%) |
Disability Class: Self-Care Difficulty
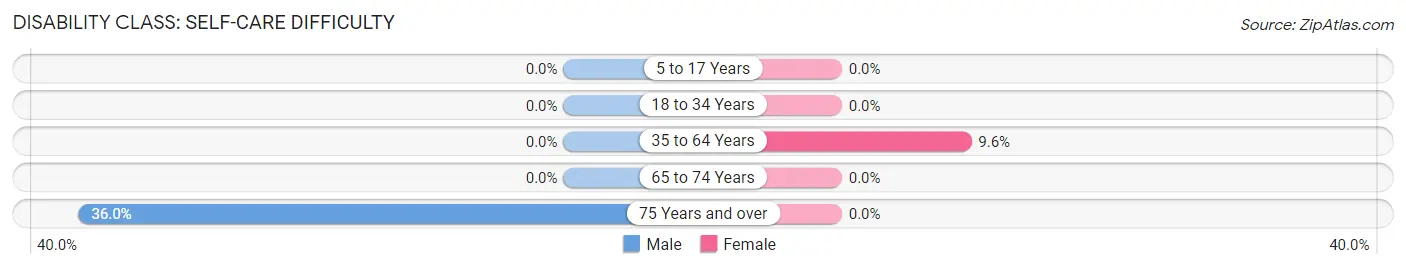
| Age Bracket | Male | Female |
| 5 to 17 Years | 0 (0.0%) | 0 (0.0%) |
| 18 to 34 Years | 0 (0.0%) | 0 (0.0%) |
| 35 to 64 Years | 0 (0.0%) | 25 (9.6%) |
| 65 to 74 Years | 0 (0.0%) | 0 (0.0%) |
| 75 Years and over | 9 (36.0%) | 0 (0.0%) |
Technology Access in Bear Rocks
Computing Device Access in Bear Rocks
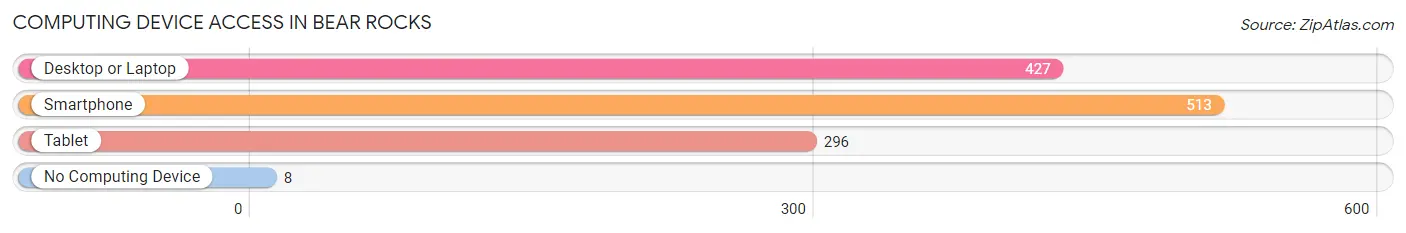
| Device Type | # Households | % Households |
| Desktop or Laptop | 427 | 79.7% |
| Smartphone | 513 | 95.7% |
| Tablet | 296 | 55.2% |
| No Computing Device | 8 | 1.5% |
| Total | 536 | 100.0% |
Internet Access in Bear Rocks
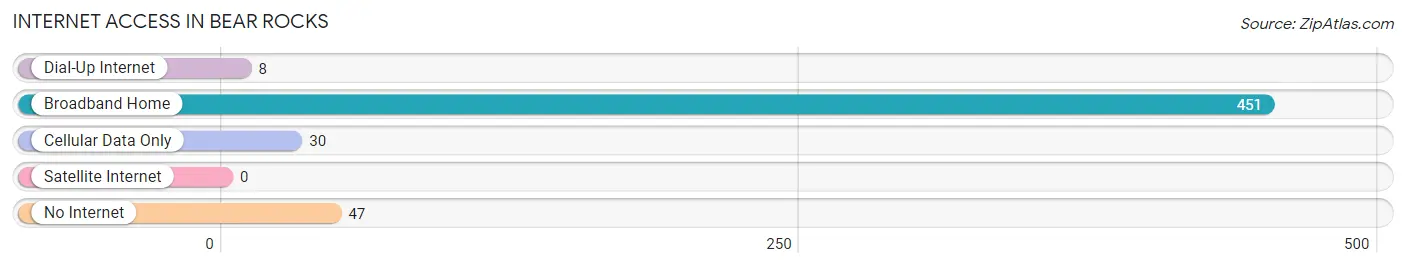
| Internet Type | # Households | % Households |
| Dial-Up Internet | 8 | 1.5% |
| Broadband Home | 451 | 84.1% |
| Cellular Data Only | 30 | 5.6% |
| Satellite Internet | 0 | 0.0% |
| No Internet | 47 | 8.8% |
| Total | 536 | 100.0% |
Bear Rocks Summary
Rock Rocks, Pennsylvania is a small borough located in the Allegheny Mountains of Pennsylvania. It is situated in the northern part of the state, about an hour and a half from Pittsburgh. The borough is home to a population of just over 1,000 people, and is known for its picturesque views of the surrounding mountains and valleys.
Geography
Rock Rocks is located in the Allegheny Mountains of Pennsylvania, in the northern part of the state. The borough is situated in a valley, surrounded by mountains on all sides. The highest peak in the area is Mount Davis, which stands at 3,213 feet. The borough is located in a rural area, and is surrounded by forests and farmland. The nearest major city is Pittsburgh, which is about an hour and a half away.
Climate
Rock Rocks has a humid continental climate, with cold winters and warm summers. The average temperature in the winter is around 25 degrees Fahrenheit, and the average temperature in the summer is around 75 degrees Fahrenheit. The area receives an average of 40 inches of precipitation per year, with most of it falling in the form of snow in the winter months.
Economy
The economy of Rock Rocks is largely based on tourism and agriculture. The borough is home to several small businesses, including restaurants, shops, and lodging. The area is also home to several farms, which produce a variety of crops, including corn, wheat, and hay. The area is also home to several wineries, which produce a variety of wines.
Demographics
As of the 2010 census, the population of Rock Rocks was 1,072. The population is predominantly white, with a small percentage of African Americans and Hispanics. The median household income in the borough is $45,000, and the median age is 44. The majority of the population is married, and the majority of households are families.
Conclusion
Rock Rocks, Pennsylvania is a small borough located in the Allegheny Mountains of Pennsylvania. It is home to a population of just over 1,000 people, and is known for its picturesque views of the surrounding mountains and valleys. The economy of the borough is largely based on tourism and agriculture, and the population is predominantly white. The area is also home to several wineries, which produce a variety of wines.
Common Questions
What is the Total Population of Bear Rocks?
Total Population of Bear Rocks is 1,057.
What is the Total Male Population of Bear Rocks?
Total Male Population of Bear Rocks is 535.
What is the Total Female Population of Bear Rocks?
Total Female Population of Bear Rocks is 522.
What is the Ratio of Males per 100 Females in Bear Rocks?
There are 102.49 Males per 100 Females in Bear Rocks.
What is the Ratio of Females per 100 Males in Bear Rocks?
There are 97.57 Females per 100 Males in Bear Rocks.
What is the Median Population Age in Bear Rocks?
Median Population Age in Bear Rocks is 57.2 Years.
What is the Average Family Size in Bear Rocks
Average Family Size in Bear Rocks is 2.2 People.
What is the Average Household Size in Bear Rocks
Average Household Size in Bear Rocks is 2.0 People.
What is Per Capita Income in Bear Rocks?
Per Capita income in Bear Rocks is $37,312.
What is the Median Family Income in Bear Rocks?
Median Family Income in Bear Rocks is $77,200.
What is the Median Household income in Bear Rocks?
Median Household Income in Bear Rocks is $64,325.
What is Income or Wage Gap in Bear Rocks?
Income or Wage Gap in Bear Rocks is 50.0%.
Women in Bear Rocks earn 50.0 cents for every dollar earned by a man.
What is Inequality or Gini Index in Bear Rocks?
Inequality or Gini Index in Bear Rocks is 0.30.
How Large is the Labor Force in Bear Rocks?
There are 574 People in the Labor Forcein in Bear Rocks.
What is the Percentage of People in the Labor Force in Bear Rocks?
56.2% of People are in the Labor Force in Bear Rocks.
What is the Unemployment Rate in Bear Rocks?
Unemployment Rate in Bear Rocks is 10.6%.