Zip Codes with the Highest Percentage of Population Employed in Health Diagnosing & Treating in Columbus, OH
RELATED REPORTS & OPTIONS
Health Diagnosing & Treating
Columbus
Compare Zip Codes
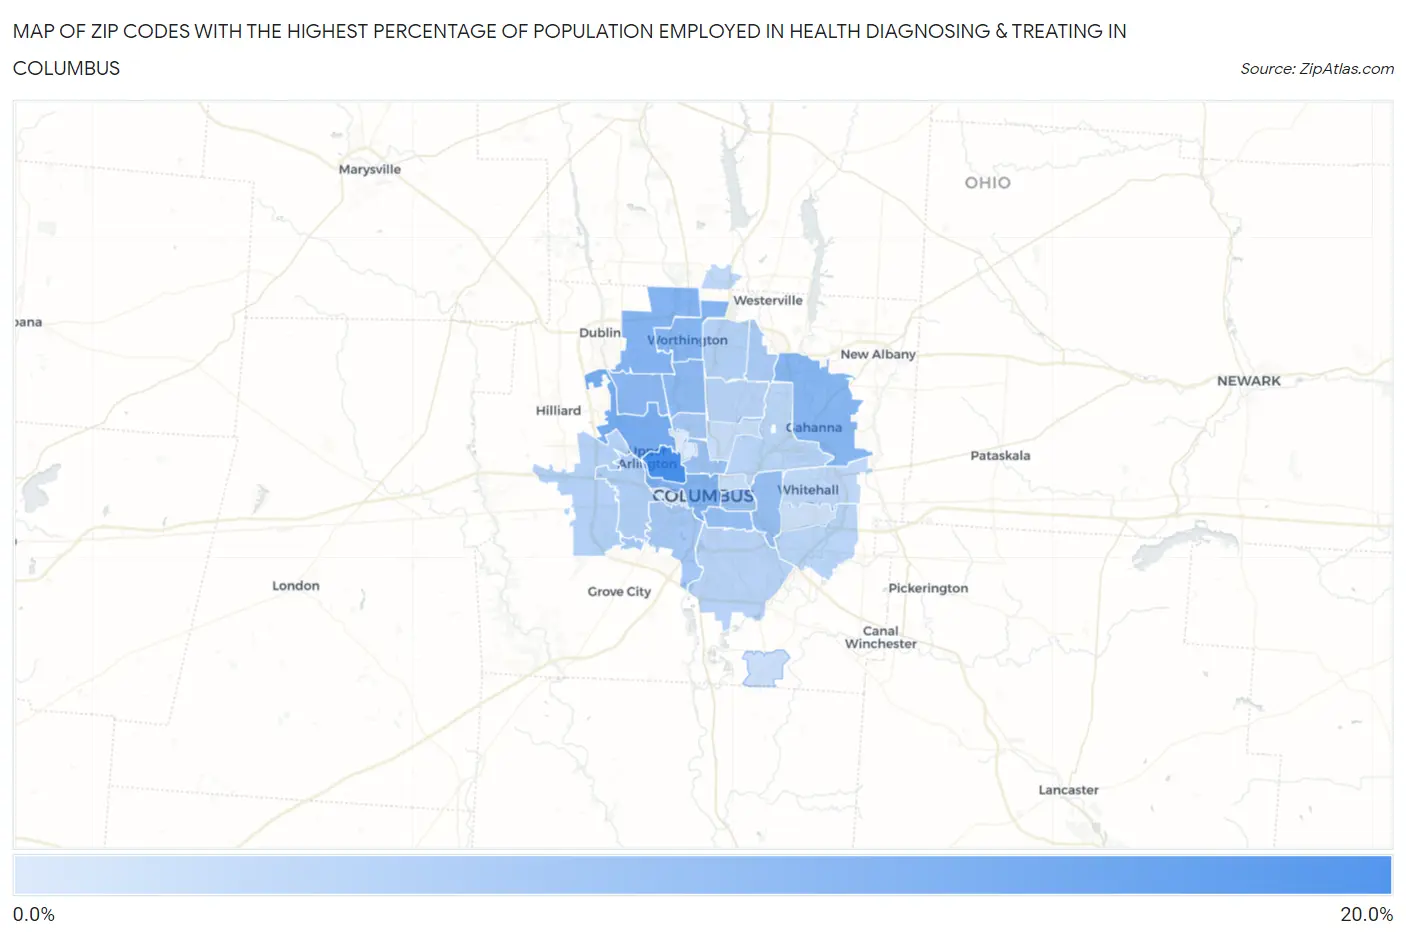
Map of Zip Codes with the Highest Percentage of Population Employed in Health Diagnosing & Treating in Columbus
0.0%
20.0%
Zip Codes with the Highest Percentage of Population Employed in Health Diagnosing & Treating in Columbus, OH
| Zip Code | % Employed | vs State | vs National | |
| 1. | 43212 | 15.5% | 7.2%(+8.30)#37 | 6.2%(+9.21)#1,048 |
| 2. | 43221 | 10.5% | 7.2%(+3.38)#137 | 6.2%(+4.29)#3,274 |
| 3. | 43215 | 9.6% | 7.2%(+2.40)#194 | 6.2%(+3.31)#4,464 |
| 4. | 43235 | 9.2% | 7.2%(+2.04)#220 | 6.2%(+2.95)#5,028 |
| 5. | 43230 | 9.2% | 7.2%(+2.02)#222 | 6.2%(+2.92)#5,077 |
| 6. | 43085 | 9.0% | 7.2%(+1.87)#236 | 6.2%(+2.78)#5,341 |
| 7. | 43220 | 8.6% | 7.2%(+1.41)#276 | 6.2%(+2.31)#6,222 |
| 8. | 43214 | 8.4% | 7.2%(+1.21)#304 | 6.2%(+2.12)#6,607 |
| 9. | 43206 | 7.7% | 7.2%(+0.538)#372 | 6.2%(+1.45)#8,283 |
| 10. | 43209 | 7.5% | 7.2%(+0.384)#387 | 6.2%(+1.29)#8,698 |
| 11. | 43201 | 7.4% | 7.2%(+0.268)#404 | 6.2%(+1.18)#9,056 |
| 12. | 43205 | 7.1% | 7.2%(-0.053)#454 | 6.2%(+0.853)#10,045 |
| 13. | 43223 | 6.2% | 7.2%(-0.966)#586 | 6.2%(-0.059)#13,209 |
| 14. | 43202 | 6.2% | 7.2%(-0.996)#590 | 6.2%(-0.089)#13,320 |
| 15. | 43231 | 5.8% | 7.2%(-1.34)#642 | 6.2%(-0.430)#14,547 |
| 16. | 43204 | 5.2% | 7.2%(-1.98)#724 | 6.2%(-1.08)#17,051 |
| 17. | 43229 | 4.9% | 7.2%(-2.21)#755 | 6.2%(-1.30)#17,924 |
| 18. | 43228 | 4.9% | 7.2%(-2.24)#762 | 6.2%(-1.34)#18,065 |
| 19. | 43207 | 4.6% | 7.2%(-2.53)#802 | 6.2%(-1.63)#19,175 |
| 20. | 43224 | 4.5% | 7.2%(-2.70)#829 | 6.2%(-1.79)#19,814 |
| 21. | 43232 | 4.4% | 7.2%(-2.75)#840 | 6.2%(-1.84)#20,001 |
| 22. | 43219 | 4.3% | 7.2%(-2.87)#855 | 6.2%(-1.96)#20,411 |
| 23. | 43213 | 3.8% | 7.2%(-3.34)#903 | 6.2%(-2.43)#21,954 |
| 24. | 43240 | 3.8% | 7.2%(-3.36)#908 | 6.2%(-2.45)#22,011 |
| 25. | 43211 | 3.1% | 7.2%(-4.03)#958 | 6.2%(-3.12)#23,977 |
| 26. | 43203 | 2.9% | 7.2%(-4.22)#977 | 6.2%(-3.31)#24,495 |
| 27. | 43227 | 2.7% | 7.2%(-4.43)#992 | 6.2%(-3.52)#24,994 |
| 28. | 43217 | 2.6% | 7.2%(-4.56)#1,004 | 6.2%(-3.65)#25,299 |
| 29. | 43210 | 1.2% | 7.2%(-5.92)#1,062 | 6.2%(-5.02)#27,558 |
| 30. | 43222 | 1.2% | 7.2%(-5.96)#1,064 | 6.2%(-5.05)#27,601 |
1
Common Questions
What are the Top 10 Zip Codes with the Highest Percentage of Population Employed in Health Diagnosing & Treating in Columbus, OH?
Top 10 Zip Codes with the Highest Percentage of Population Employed in Health Diagnosing & Treating in Columbus, OH are:
What zip code has the Highest Percentage of Population Employed in Health Diagnosing & Treating in Columbus, OH?
43212 has the Highest Percentage of Population Employed in Health Diagnosing & Treating in Columbus, OH with 15.5%.
What is the Percentage of Population Employed in Health Diagnosing & Treating in Columbus, OH?
Percentage of Population Employed in Health Diagnosing & Treating in Columbus is 6.5%.
What is the Percentage of Population Employed in Health Diagnosing & Treating in Ohio?
Percentage of Population Employed in Health Diagnosing & Treating in Ohio is 7.2%.
What is the Percentage of Population Employed in Health Diagnosing & Treating in the United States?
Percentage of Population Employed in Health Diagnosing & Treating in the United States is 6.2%.