Zip Codes with the Highest Percentage of Population Employed in Health Diagnosing & Treating in Lorain, OH
RELATED REPORTS & OPTIONS
Health Diagnosing & Treating
Lorain
Compare Zip Codes
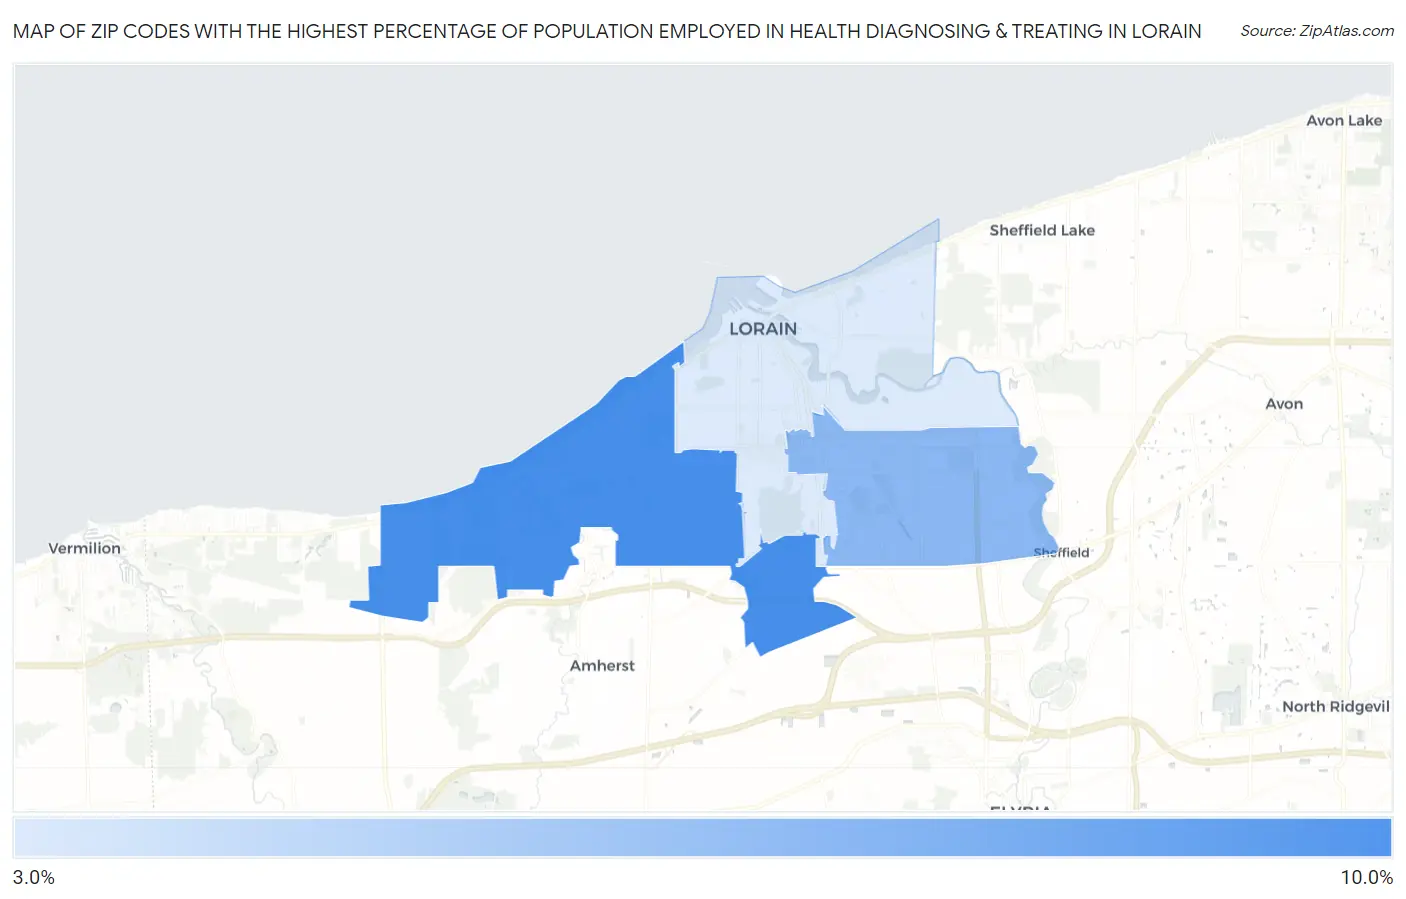
Map of Zip Codes with the Highest Percentage of Population Employed in Health Diagnosing & Treating in Lorain
0.0%
10.0%
Zip Codes with the Highest Percentage of Population Employed in Health Diagnosing & Treating in Lorain, OH
| Zip Code | % Employed | vs State | vs National | |
| 1. | 44053 | 8.1% | 7.2%(+0.911)#333 | 6.2%(+1.82)#7,347 |
| 2. | 44055 | 6.1% | 7.2%(-1.05)#598 | 6.2%(-0.144)#13,525 |
| 3. | 44052 | 3.7% | 7.2%(-3.41)#910 | 6.2%(-2.50)#22,154 |
1
Common Questions
What are the Top Zip Codes with the Highest Percentage of Population Employed in Health Diagnosing & Treating in Lorain, OH?
Top Zip Codes with the Highest Percentage of Population Employed in Health Diagnosing & Treating in Lorain, OH are:
What zip code has the Highest Percentage of Population Employed in Health Diagnosing & Treating in Lorain, OH?
44053 has the Highest Percentage of Population Employed in Health Diagnosing & Treating in Lorain, OH with 8.1%.
What is the Percentage of Population Employed in Health Diagnosing & Treating in Lorain, OH?
Percentage of Population Employed in Health Diagnosing & Treating in Lorain is 5.9%.
What is the Percentage of Population Employed in Health Diagnosing & Treating in Ohio?
Percentage of Population Employed in Health Diagnosing & Treating in Ohio is 7.2%.
What is the Percentage of Population Employed in Health Diagnosing & Treating in the United States?
Percentage of Population Employed in Health Diagnosing & Treating in the United States is 6.2%.