Zip Codes with the Highest Percentage of Population with a Degree in Communications in Columbus, OH

RELATED REPORTS & OPTIONS

Communications
Population
Families and Households
Female Fertility
Female Fertility (Unmarried)
Race (Community Size)
Race (Percentage)
Ancestry (Community Size)
AfghanAfricanAlbanianAlsatianAmericanApacheArabArgentineanArmenianAustralianAustrianBahamianBangladeshiBarbadianBasqueBelgianBelizeanBhutaneseBlackfeetBolivianBrazilianBritishBritish West IndianBulgarianBurmeseCambodianCanadianCape VerdeanCarpatho RusynCelticCentral AmericanCentral American IndianCherokeeChileanChippewaChoctawColombianCosta RicanCreeCreekCroatianCrowCubanCzechCzechoslovakianDanishDelawareDominicanDutchDutch West IndianEastern EuropeanEcuadorianEgyptianEnglishEstonianEthiopianEuropeanFilipinoFinnishFrenchFrench American IndianFrench CanadianGermanGerman RussianGhanaianGreekGuamanian / ChamorroGuatemalanGuyaneseHaitianHonduranHungarianIcelanderIndian (Asian)IndonesianInupiatIranianIraqiIrishIroquoisIsraeliItalianJamaicanJapaneseJordanianKenyanKoreanLaotianLatvianLebaneseLiberianLithuanianLumbeeLuxembourgerMacedonianMalaysianMalteseMexicanMexican American IndianMongolianMoroccanNative HawaiianNavajoNew ZealanderNicaraguanNigerianNorthern EuropeanNorwegianPakistaniPalestinianPanamanianParaguayanPennsylvania GermanPeruvianPolishPortuguesePuerto RicanRomanianRussianSalvadoranSamoanScandinavianScotch-IrishScottishSeminoleSenegaleseSerbianSierra LeoneanSiouxSlavicSlovakSloveneSomaliSouth AfricanSouth AmericanSouth American IndianSpaniardSpanishSri LankanSubsaharan AfricanSudaneseSwedishSwissSyrianThaiTrinidadian and TobagonianTurkishUgandanUkrainianUruguayanVenezuelanVietnameseWelshWest IndianYaquiYugoslavianZimbabwean
Ancestry (Percentage)
AfghanAfricanAlbanianAlsatianAmericanApacheArabArgentineanArmenianAustralianAustrianBahamianBangladeshiBarbadianBasqueBelgianBelizeanBhutaneseBlackfeetBolivianBrazilianBritishBritish West IndianBulgarianBurmeseCambodianCanadianCape VerdeanCarpatho RusynCelticCentral AmericanCentral American IndianCherokeeChileanChippewaChoctawColombianCosta RicanCreeCreekCroatianCrowCubanCzechCzechoslovakianDanishDelawareDominicanDutchDutch West IndianEastern EuropeanEcuadorianEgyptianEnglishEstonianEthiopianEuropeanFilipinoFinnishFrenchFrench American IndianFrench CanadianGermanGerman RussianGhanaianGreekGuamanian / ChamorroGuatemalanGuyaneseHaitianHonduranHungarianIcelanderIndian (Asian)IndonesianInupiatIranianIraqiIrishIroquoisIsraeliItalianJamaicanJapaneseJordanianKenyanKoreanLaotianLatvianLebaneseLiberianLithuanianLumbeeLuxembourgerMacedonianMalaysianMalteseMexicanMexican American IndianMongolianMoroccanNative HawaiianNavajoNew ZealanderNicaraguanNigerianNorthern EuropeanNorwegianPakistaniPalestinianPanamanianParaguayanPennsylvania GermanPeruvianPolishPortuguesePuerto RicanRomanianRussianSalvadoranSamoanScandinavianScotch-IrishScottishSeminoleSenegaleseSerbianSierra LeoneanSiouxSlavicSlovakSloveneSomaliSouth AfricanSouth AmericanSouth American IndianSpaniardSpanishSri LankanSubsaharan AfricanSudaneseSwedishSwissSyrianThaiTrinidadian and TobagonianTurkishUgandanUkrainianUruguayanVenezuelanVietnameseWelshWest IndianYaquiYugoslavianZimbabwean
Immigrant Origin (Total)
AfghanistanAfricaAlbaniaArgentinaArmeniaAsiaAustraliaBahamasBangladeshBarbadosBelarusBelgiumBelizeBosnia and HerzegovinaBrazilBulgariaBurma / MyanmarCambodiaCameroonCanadaCaribbeanCentral AmericaChileChinaColombiaCongoCosta RicaCubaCzechoslovakiaDominican RepublicEastern AfricaEastern AsiaEastern EuropeEcuadorEgyptEl SalvadorEnglandEritreaEthiopiaEuropeFranceGermanyGhanaGreeceGuatemalaGuyanaHaitiHondurasHong KongHungaryIndiaIndonesiaIranIraqIrelandIsraelItalyJamaicaJapanJordanKazakhstanKenyaKoreaKuwaitLaosLatin AmericaLatviaLebanonLiberiaLithuaniaMalaysiaMexicoMiddle AfricaMoroccoNepalNetherlandsNigeriaNorth MacedoniaNorthern AfricaNorthern EuropeOceaniaPakistanPanamaPeruPhilippinesPolandRomaniaRussiaSaudi ArabiaScotlandSenegalSerbiaSierra LeoneSingaporeSomaliaSouth AfricaSouth AmericaSouth Central AsiaSouth Eastern AsiaSouthern EuropeSpainSri LankaSudanSwitzerlandSyriaTaiwanThailandTrinidad and TobagoTurkeyUgandaUkraineUruguayUzbekistanVenezuelaVietnamWestern AfricaWestern AsiaWestern EuropeZaireZimbabwe
Immigrant Origin (Percentage)
AfghanistanAfricaAlbaniaArgentinaArmeniaAsiaAustraliaBahamasBangladeshBarbadosBelarusBelgiumBelizeBosnia and HerzegovinaBrazilBulgariaBurma / MyanmarCambodiaCameroonCanadaCaribbeanCentral AmericaChileChinaColombiaCongoCosta RicaCubaCzechoslovakiaDominican RepublicEastern AfricaEastern AsiaEastern EuropeEcuadorEgyptEl SalvadorEnglandEritreaEthiopiaEuropeFranceGermanyGhanaGreeceGuatemalaGuyanaHaitiHondurasHong KongHungaryIndiaIndonesiaIranIraqIrelandIsraelItalyJamaicaJapanJordanKazakhstanKenyaKoreaKuwaitLaosLatin AmericaLatviaLebanonLiberiaLithuaniaMalaysiaMexicoMiddle AfricaMoroccoNepalNetherlandsNigeriaNorth MacedoniaNorthern AfricaNorthern EuropeOceaniaPakistanPanamaPeruPhilippinesPolandRomaniaRussiaSaudi ArabiaScotlandSenegalSerbiaSierra LeoneSingaporeSomaliaSouth AfricaSouth AmericaSouth Central AsiaSouth Eastern AsiaSouthern EuropeSpainSri LankaSudanSwitzerlandSyriaTaiwanThailandTrinidad and TobagoTurkeyUgandaUkraineUruguayUzbekistanVenezuelaVietnamWestern AfricaWestern AsiaWestern EuropeZaireZimbabwe
Income
Income (Families)
Income (Households)
Poverty
Poverty (Families)
Unemployment
Employment Occupations
Employment Industries
Employer Class
Commute Time
Commute Means
School Enrollment
Education by Degree Field
Occupancy
Finances
Physical Characteristics
Columbus
Compare Zip Codes
Comparison Subject

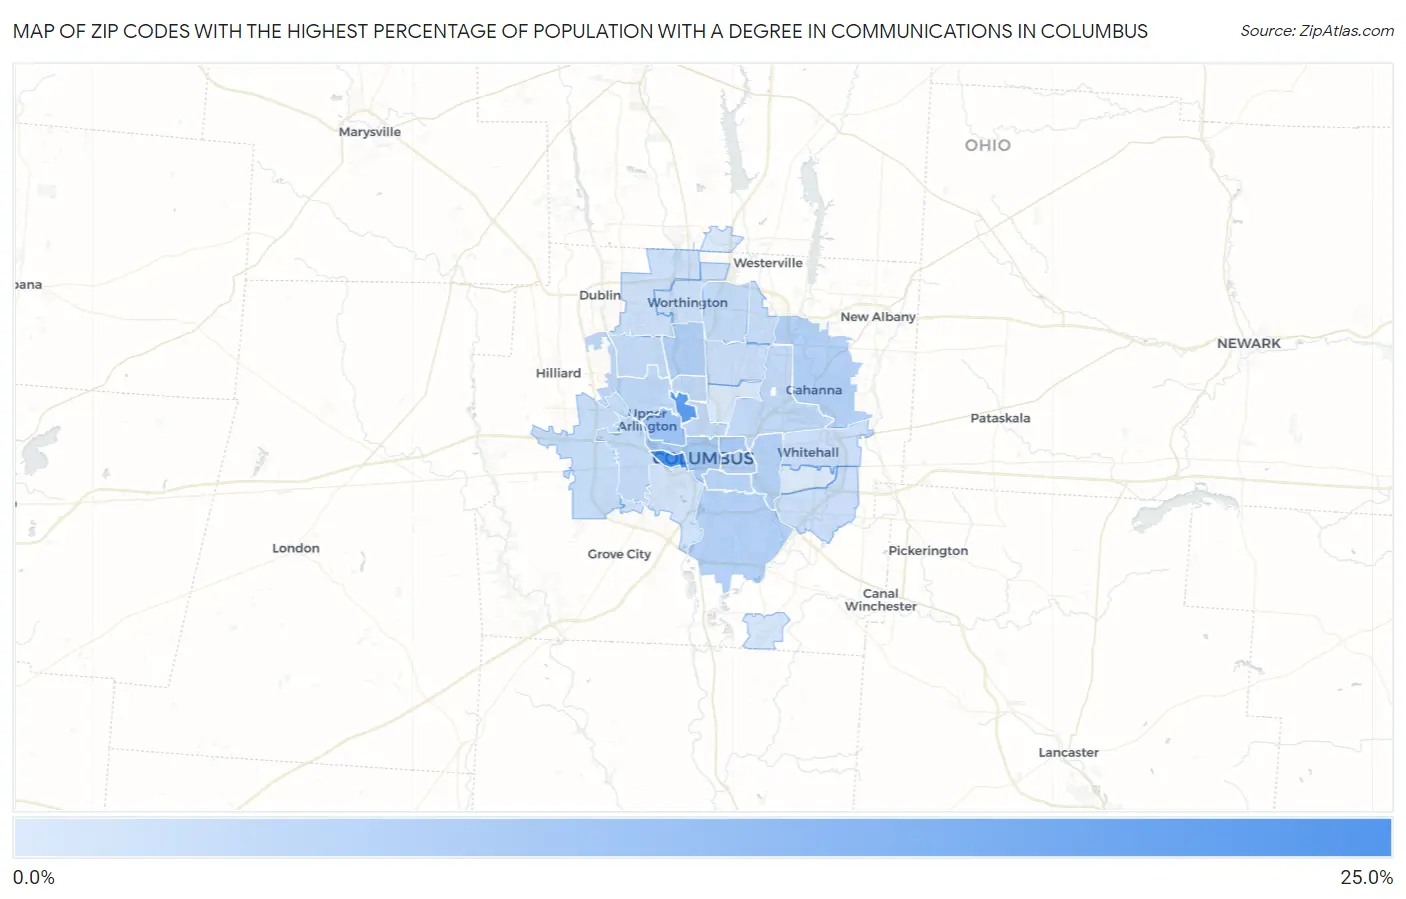
Map of Zip Codes with the Highest Percentage of Population with a Degree in Communications in Columbus

0.0%
25.0%
Zip Codes with the Highest Percentage of Population with a Degree in Communications in Columbus Map

Zip Codes with the Highest Percentage of Population with a Degree in Communications in Columbus, OH

Zip Code % Graduates vs State vs National
1.4322220.1%4.3%(+15.8)#144.1%(+16.0)#326
2.4321017.4%4.3%(+13.1)#204.1%(+13.3)#422
3.432129.5%4.3%(+5.16)#634.1%(+5.33)#1,277
4.432158.3%4.3%(+4.03)#784.1%(+4.21)#1,701
5.432038.1%4.3%(+3.83)#834.1%(+4.00)#1,803
6.432147.3%4.3%(+2.96)#1064.1%(+3.13)#2,374
7.432077.0%4.3%(+2.71)#1134.1%(+2.88)#2,596
8.432306.9%4.3%(+2.58)#1184.1%(+2.75)#2,714
9.432096.8%4.3%(+2.45)#1224.1%(+2.62)#2,840
10.432056.8%4.3%(+2.44)#1234.1%(+2.62)#2,849
11.432066.0%4.3%(+1.71)#1614.1%(+1.88)#3,750
12.432215.5%4.3%(+1.16)#1964.1%(+1.33)#4,705
13.432015.4%4.3%(+1.12)#2004.1%(+1.30)#4,784
14.432195.3%4.3%(+0.995)#2134.1%(+1.17)#5,041
15.432025.2%4.3%(+0.890)#2234.1%(+1.06)#5,257
16.432295.2%4.3%(+0.852)#2284.1%(+1.03)#5,334
17.432045.1%4.3%(+0.765)#2374.1%(+0.939)#5,522
18.432205.0%4.3%(+0.691)#2454.1%(+0.864)#5,707
19.432284.8%4.3%(+0.465)#2664.1%(+0.639)#6,242
20.432314.4%4.3%(+0.118)#2984.1%(+0.292)#7,180
21.432134.4%4.3%(+0.052)#3034.1%(+0.225)#7,370
22.432324.3%4.3%(-0.049)#3204.1%(+0.125)#7,693
23.432244.2%4.3%(-0.097)#3274.1%(+0.076)#7,858
24.430854.1%4.3%(-0.183)#3444.1%(-0.009)#8,137
25.432354.0%4.3%(-0.300)#3554.1%(-0.127)#8,539
26.432233.5%4.3%(-0.848)#4344.1%(-0.674)#10,465
27.432173.0%4.3%(-1.31)#5014.1%(-1.14)#12,186
28.432112.4%4.3%(-1.89)#5734.1%(-1.72)#14,433
29.432402.4%4.3%(-1.94)#5794.1%(-1.77)#14,586
30.432272.2%4.3%(-2.08)#5924.1%(-1.91)#15,090

Common Questions

What are the Top 10 Zip Codes with the Highest Percentage of Population with a Degree in Communications in Columbus, OH?
Top 10 Zip Codes with the Highest Percentage of Population with a Degree in Communications in Columbus, OH are:
#1
20.1%
#2
17.4%
#3
9.5%
#4
8.3%
#5
8.1%
#6
7.3%
#7
7.0%
#8
6.9%
#9
6.8%
#10
6.8%
What zip code has the Highest Percentage of Population with a Degree in Communications in Columbus, OH?
43222 has the Highest Percentage of Population with a Degree in Communications in Columbus, OH with 20.1%.
What is the Percentage of Population with a Degree in Communications in Columbus, OH?
Percentage of Population with a Degree in Communications in Columbus is 5.8%.
What is the Percentage of Population with a Degree in Communications in Ohio?
Percentage of Population with a Degree in Communications in Ohio is 4.3%.
What is the Percentage of Population with a Degree in Communications in the United States?
Percentage of Population with a Degree in Communications in the United States is 4.1%.