Zip Codes with the Highest Percentage of Population Employed in Health Diagnosing & Treating in Youngstown, OH
RELATED REPORTS & OPTIONS
Health Diagnosing & Treating
Youngstown
Compare Zip Codes
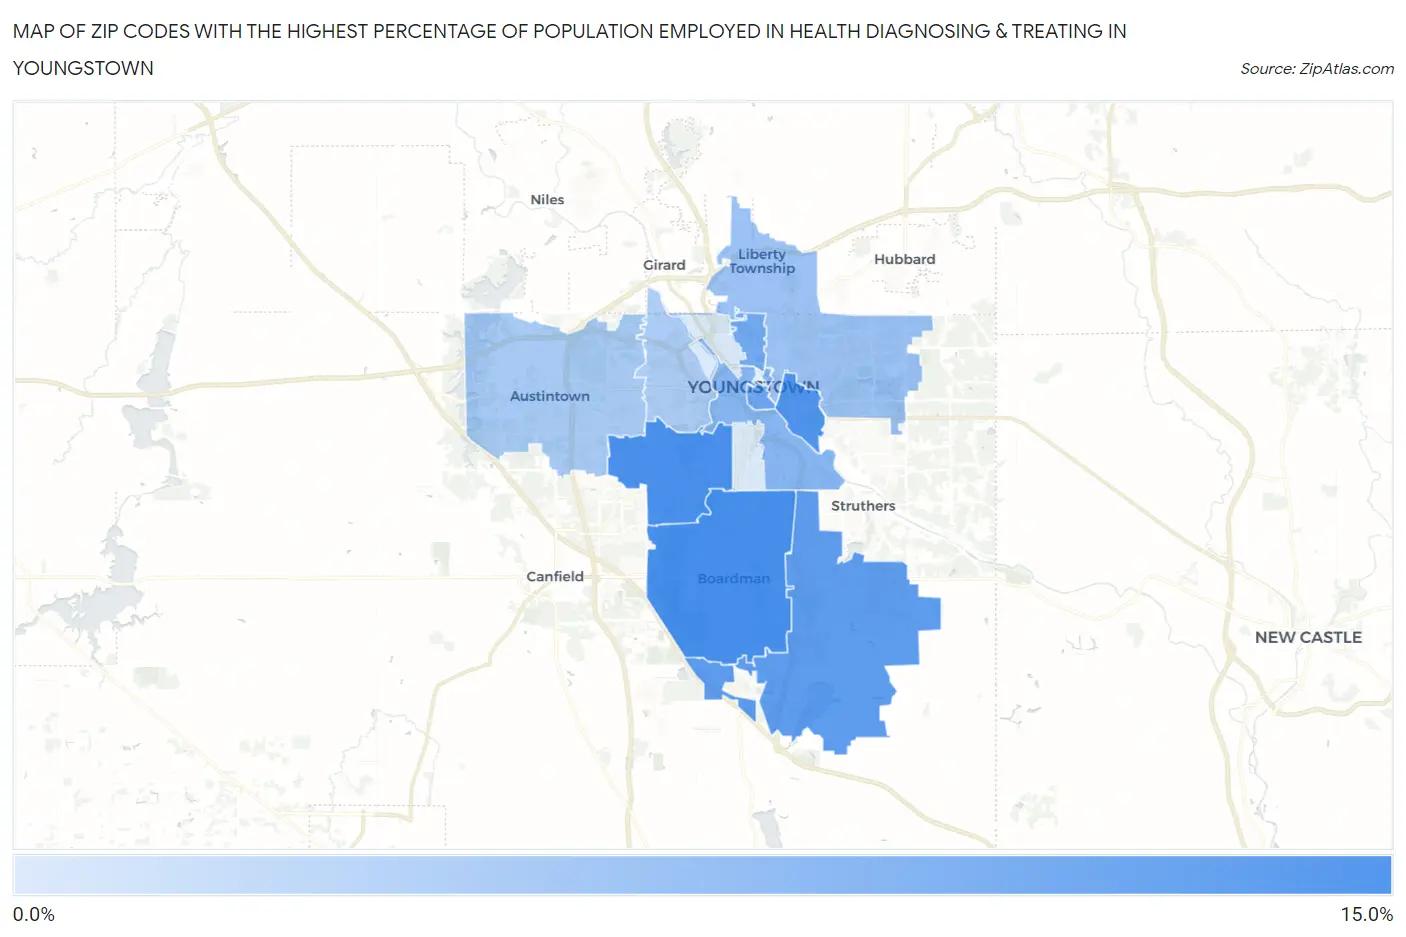
Map of Zip Codes with the Highest Percentage of Population Employed in Health Diagnosing & Treating in Youngstown
0.0%
15.0%
Zip Codes with the Highest Percentage of Population Employed in Health Diagnosing & Treating in Youngstown, OH
| Zip Code | % Employed | vs State | vs National | |
| 1. | 44512 | 10.2% | 7.2%(+3.09)#151 | 6.2%(+4.00)#3,594 |
| 2. | 44511 | 10.1% | 7.2%(+2.98)#158 | 6.2%(+3.88)#3,726 |
| 3. | 44506 | 9.6% | 7.2%(+2.49)#186 | 6.2%(+3.39)#4,341 |
| 4. | 44514 | 8.8% | 7.2%(+1.63)#258 | 6.2%(+2.54)#5,767 |
| 5. | 44503 | 8.0% | 7.2%(+0.877)#334 | 6.2%(+1.78)#7,421 |
| 6. | 44504 | 7.6% | 7.2%(+0.446)#380 | 6.2%(+1.35)#8,523 |
| 7. | 44502 | 6.2% | 7.2%(-0.921)#582 | 6.2%(-0.014)#13,040 |
| 8. | 44505 | 5.0% | 7.2%(-2.13)#741 | 6.2%(-1.23)#17,623 |
| 9. | 44515 | 4.3% | 7.2%(-2.82)#847 | 6.2%(-1.92)#20,245 |
| 10. | 44509 | 4.1% | 7.2%(-3.02)#875 | 6.2%(-2.12)#20,960 |
| 11. | 44510 | 1.3% | 7.2%(-5.82)#1,058 | 6.2%(-4.92)#27,415 |
| 12. | 44507 | 1.3% | 7.2%(-5.85)#1,059 | 6.2%(-4.94)#27,458 |
1
Common Questions
What are the Top 10 Zip Codes with the Highest Percentage of Population Employed in Health Diagnosing & Treating in Youngstown, OH?
Top 10 Zip Codes with the Highest Percentage of Population Employed in Health Diagnosing & Treating in Youngstown, OH are:
What zip code has the Highest Percentage of Population Employed in Health Diagnosing & Treating in Youngstown, OH?
44512 has the Highest Percentage of Population Employed in Health Diagnosing & Treating in Youngstown, OH with 10.2%.
What is the Percentage of Population Employed in Health Diagnosing & Treating in Youngstown, OH?
Percentage of Population Employed in Health Diagnosing & Treating in Youngstown is 6.0%.
What is the Percentage of Population Employed in Health Diagnosing & Treating in Ohio?
Percentage of Population Employed in Health Diagnosing & Treating in Ohio is 7.2%.
What is the Percentage of Population Employed in Health Diagnosing & Treating in the United States?
Percentage of Population Employed in Health Diagnosing & Treating in the United States is 6.2%.