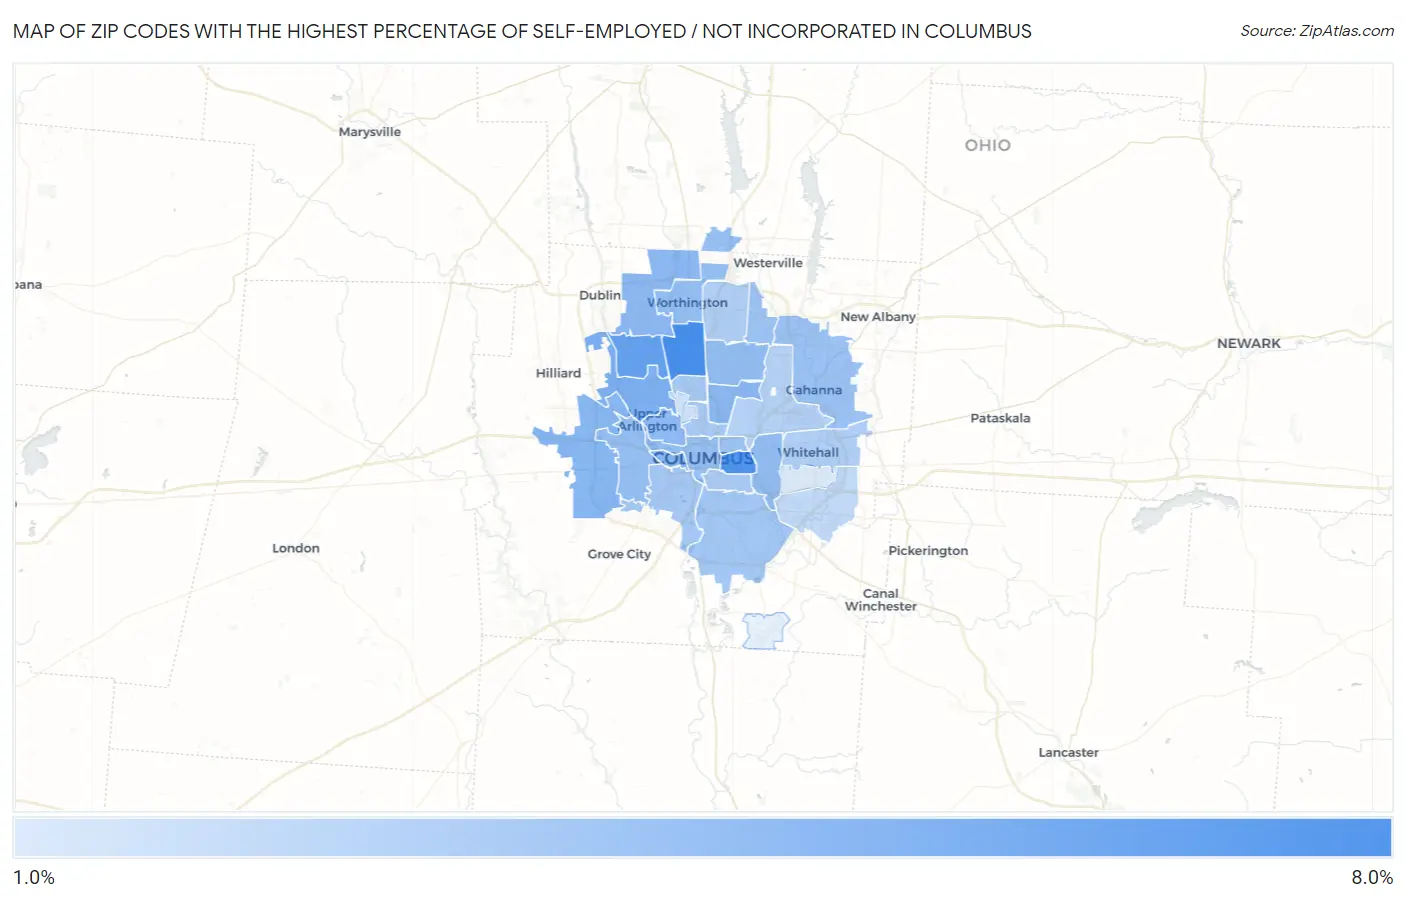
Zip Codes with the Highest Percentage of Self-Employed / Not Incorporated in Columbus, OH
RELATED REPORTS & OPTIONS
Self-Employed / Not Incorporated
Columbus
Compare Zip Codes
Map of Zip Codes with the Highest Percentage of Self-Employed / Not Incorporated in Columbus
0.0%
8.0%
Zip Codes with the Highest Percentage of Self-Employed / Not Incorporated in Columbus, OH
| Zip Code | % Self-Employed / Not Incorporated | vs State | vs National | |
| 1. | 43214 | 7.3% | 4.8%(+2.48)#267 | 5.8%(+1.49)#12,275 |
| 2. | 43205 | 6.9% | 4.8%(+2.08)#298 | 5.8%(+1.09)#13,299 |
| 3. | 43220 | 6.2% | 4.8%(+1.41)#350 | 5.8%(+0.416)#15,315 |
| 4. | 43221 | 5.3% | 4.8%(+0.471)#474 | 5.8%(-0.520)#18,539 |
| 5. | 43222 | 5.0% | 4.8%(+0.193)#528 | 5.8%(-0.799)#19,604 |
| 6. | 43228 | 5.0% | 4.8%(+0.132)#541 | 5.8%(-0.860)#19,824 |
| 7. | 43211 | 4.9% | 4.8%(+0.027)#560 | 5.8%(-0.964)#20,222 |
| 8. | 43235 | 4.8% | 4.8%(-0.017)#570 | 5.8%(-1.01)#20,390 |
| 9. | 43212 | 4.7% | 4.8%(-0.105)#587 | 5.8%(-1.10)#20,710 |
| 10. | 43224 | 4.6% | 4.8%(-0.270)#618 | 5.8%(-1.26)#21,343 |
| 11. | 43209 | 4.5% | 4.8%(-0.325)#630 | 5.8%(-1.32)#21,586 |
| 12. | 43085 | 4.5% | 4.8%(-0.344)#635 | 5.8%(-1.34)#21,651 |
| 13. | 43204 | 4.5% | 4.8%(-0.371)#645 | 5.8%(-1.36)#21,766 |
| 14. | 43240 | 4.4% | 4.8%(-0.443)#662 | 5.8%(-1.43)#22,031 |
| 15. | 43215 | 4.3% | 4.8%(-0.476)#670 | 5.8%(-1.47)#22,139 |
| 16. | 43203 | 4.3% | 4.8%(-0.558)#684 | 5.8%(-1.55)#22,450 |
| 17. | 43230 | 4.3% | 4.8%(-0.574)#688 | 5.8%(-1.56)#22,502 |
| 18. | 43231 | 4.1% | 4.8%(-0.708)#715 | 5.8%(-1.70)#22,987 |
| 19. | 43207 | 3.9% | 4.8%(-0.915)#749 | 5.8%(-1.91)#23,703 |
| 20. | 43223 | 3.8% | 4.8%(-0.974)#764 | 5.8%(-1.97)#23,890 |
| 21. | 43202 | 3.8% | 4.8%(-1.05)#777 | 5.8%(-2.04)#24,150 |
| 22. | 43201 | 3.7% | 4.8%(-1.11)#789 | 5.8%(-2.10)#24,359 |
| 23. | 43206 | 3.7% | 4.8%(-1.15)#796 | 5.8%(-2.15)#24,496 |
| 24. | 43213 | 3.5% | 4.8%(-1.36)#830 | 5.8%(-2.36)#25,115 |
| 25. | 43229 | 3.5% | 4.8%(-1.37)#834 | 5.8%(-2.36)#25,139 |
| 26. | 43219 | 3.3% | 4.8%(-1.50)#865 | 5.8%(-2.50)#25,552 |
| 27. | 43232 | 2.9% | 4.8%(-1.95)#917 | 5.8%(-2.94)#26,669 |
| 28. | 43210 | 2.4% | 4.8%(-2.45)#983 | 5.8%(-3.44)#27,616 |
| 29. | 43227 | 1.9% | 4.8%(-2.92)#1,022 | 5.8%(-3.91)#28,360 |
1
Common Questions
What are the Top 10 Zip Codes with the Highest Percentage of Self-Employed / Not Incorporated in Columbus, OH?
Top 10 Zip Codes with the Highest Percentage of Self-Employed / Not Incorporated in Columbus, OH are:
What zip code has the Highest Percentage of Self-Employed / Not Incorporated in Columbus, OH?
43214 has the Highest Percentage of Self-Employed / Not Incorporated in Columbus, OH with 7.3%.
What is the Percentage of Self-Employed / Not Incorporated in Columbus, OH?
Percentage of Self-Employed / Not Incorporated in Columbus is 4.1%.
What is the Percentage of Self-Employed / Not Incorporated in Ohio?
Percentage of Self-Employed / Not Incorporated in Ohio is 4.8%.
What is the Percentage of Self-Employed / Not Incorporated in the United States?
Percentage of Self-Employed / Not Incorporated in the United States is 5.8%.