Zip Codes with the Highest Percentage of Population Employed in Community & Social Service in Columbus, OH

RELATED REPORTS & OPTIONS

Community & Social Service
Population
Families and Households
Female Fertility
Female Fertility (Unmarried)
Race (Community Size)
Race (Percentage)
Ancestry (Community Size)
AfghanAfricanAlbanianAlsatianAmericanApacheArabArgentineanArmenianAustralianAustrianBahamianBangladeshiBarbadianBasqueBelgianBelizeanBhutaneseBlackfeetBolivianBrazilianBritishBritish West IndianBulgarianBurmeseCambodianCanadianCape VerdeanCarpatho RusynCelticCentral AmericanCentral American IndianCherokeeChileanChippewaChoctawColombianCosta RicanCreeCreekCroatianCrowCubanCzechCzechoslovakianDanishDelawareDominicanDutchDutch West IndianEastern EuropeanEcuadorianEgyptianEnglishEstonianEthiopianEuropeanFilipinoFinnishFrenchFrench American IndianFrench CanadianGermanGerman RussianGhanaianGreekGuamanian / ChamorroGuatemalanGuyaneseHaitianHonduranHungarianIcelanderIndian (Asian)IndonesianInupiatIranianIraqiIrishIroquoisIsraeliItalianJamaicanJapaneseJordanianKenyanKoreanLaotianLatvianLebaneseLiberianLithuanianLumbeeLuxembourgerMacedonianMalaysianMalteseMexicanMexican American IndianMongolianMoroccanNative HawaiianNavajoNew ZealanderNicaraguanNigerianNorthern EuropeanNorwegianPakistaniPalestinianPanamanianParaguayanPennsylvania GermanPeruvianPolishPortuguesePuerto RicanRomanianRussianSalvadoranSamoanScandinavianScotch-IrishScottishSeminoleSenegaleseSerbianSierra LeoneanSiouxSlavicSlovakSloveneSomaliSouth AfricanSouth AmericanSouth American IndianSpaniardSpanishSri LankanSubsaharan AfricanSudaneseSwedishSwissSyrianThaiTrinidadian and TobagonianTurkishUgandanUkrainianUruguayanVenezuelanVietnameseWelshWest IndianYaquiYugoslavianZimbabwean
Ancestry (Percentage)
AfghanAfricanAlbanianAlsatianAmericanApacheArabArgentineanArmenianAustralianAustrianBahamianBangladeshiBarbadianBasqueBelgianBelizeanBhutaneseBlackfeetBolivianBrazilianBritishBritish West IndianBulgarianBurmeseCambodianCanadianCape VerdeanCarpatho RusynCelticCentral AmericanCentral American IndianCherokeeChileanChippewaChoctawColombianCosta RicanCreeCreekCroatianCrowCubanCzechCzechoslovakianDanishDelawareDominicanDutchDutch West IndianEastern EuropeanEcuadorianEgyptianEnglishEstonianEthiopianEuropeanFilipinoFinnishFrenchFrench American IndianFrench CanadianGermanGerman RussianGhanaianGreekGuamanian / ChamorroGuatemalanGuyaneseHaitianHonduranHungarianIcelanderIndian (Asian)IndonesianInupiatIranianIraqiIrishIroquoisIsraeliItalianJamaicanJapaneseJordanianKenyanKoreanLaotianLatvianLebaneseLiberianLithuanianLumbeeLuxembourgerMacedonianMalaysianMalteseMexicanMexican American IndianMongolianMoroccanNative HawaiianNavajoNew ZealanderNicaraguanNigerianNorthern EuropeanNorwegianPakistaniPalestinianPanamanianParaguayanPennsylvania GermanPeruvianPolishPortuguesePuerto RicanRomanianRussianSalvadoranSamoanScandinavianScotch-IrishScottishSeminoleSenegaleseSerbianSierra LeoneanSiouxSlavicSlovakSloveneSomaliSouth AfricanSouth AmericanSouth American IndianSpaniardSpanishSri LankanSubsaharan AfricanSudaneseSwedishSwissSyrianThaiTrinidadian and TobagonianTurkishUgandanUkrainianUruguayanVenezuelanVietnameseWelshWest IndianYaquiYugoslavianZimbabwean
Immigrant Origin (Total)
AfghanistanAfricaAlbaniaArgentinaArmeniaAsiaAustraliaBahamasBangladeshBarbadosBelarusBelgiumBelizeBosnia and HerzegovinaBrazilBulgariaBurma / MyanmarCambodiaCameroonCanadaCaribbeanCentral AmericaChileChinaColombiaCongoCosta RicaCubaCzechoslovakiaDominican RepublicEastern AfricaEastern AsiaEastern EuropeEcuadorEgyptEl SalvadorEnglandEritreaEthiopiaEuropeFranceGermanyGhanaGreeceGuatemalaGuyanaHaitiHondurasHong KongHungaryIndiaIndonesiaIranIraqIrelandIsraelItalyJamaicaJapanJordanKazakhstanKenyaKoreaKuwaitLaosLatin AmericaLatviaLebanonLiberiaLithuaniaMalaysiaMexicoMiddle AfricaMoroccoNepalNetherlandsNigeriaNorth MacedoniaNorthern AfricaNorthern EuropeOceaniaPakistanPanamaPeruPhilippinesPolandRomaniaRussiaSaudi ArabiaScotlandSenegalSerbiaSierra LeoneSingaporeSomaliaSouth AfricaSouth AmericaSouth Central AsiaSouth Eastern AsiaSouthern EuropeSpainSri LankaSudanSwitzerlandSyriaTaiwanThailandTrinidad and TobagoTurkeyUgandaUkraineUruguayUzbekistanVenezuelaVietnamWestern AfricaWestern AsiaWestern EuropeZaireZimbabwe
Immigrant Origin (Percentage)
AfghanistanAfricaAlbaniaArgentinaArmeniaAsiaAustraliaBahamasBangladeshBarbadosBelarusBelgiumBelizeBosnia and HerzegovinaBrazilBulgariaBurma / MyanmarCambodiaCameroonCanadaCaribbeanCentral AmericaChileChinaColombiaCongoCosta RicaCubaCzechoslovakiaDominican RepublicEastern AfricaEastern AsiaEastern EuropeEcuadorEgyptEl SalvadorEnglandEritreaEthiopiaEuropeFranceGermanyGhanaGreeceGuatemalaGuyanaHaitiHondurasHong KongHungaryIndiaIndonesiaIranIraqIrelandIsraelItalyJamaicaJapanJordanKazakhstanKenyaKoreaKuwaitLaosLatin AmericaLatviaLebanonLiberiaLithuaniaMalaysiaMexicoMiddle AfricaMoroccoNepalNetherlandsNigeriaNorth MacedoniaNorthern AfricaNorthern EuropeOceaniaPakistanPanamaPeruPhilippinesPolandRomaniaRussiaSaudi ArabiaScotlandSenegalSerbiaSierra LeoneSingaporeSomaliaSouth AfricaSouth AmericaSouth Central AsiaSouth Eastern AsiaSouthern EuropeSpainSri LankaSudanSwitzerlandSyriaTaiwanThailandTrinidad and TobagoTurkeyUgandaUkraineUruguayUzbekistanVenezuelaVietnamWestern AfricaWestern AsiaWestern EuropeZaireZimbabwe
Income
Income (Families)
Income (Households)
Poverty
Poverty (Families)
Unemployment
Employment Occupations
Employment Industries
Employer Class
Commute Time
Commute Means
School Enrollment
Education by Degree Field
Occupancy
Finances
Physical Characteristics
Columbus
Compare Zip Codes
Comparison Subject

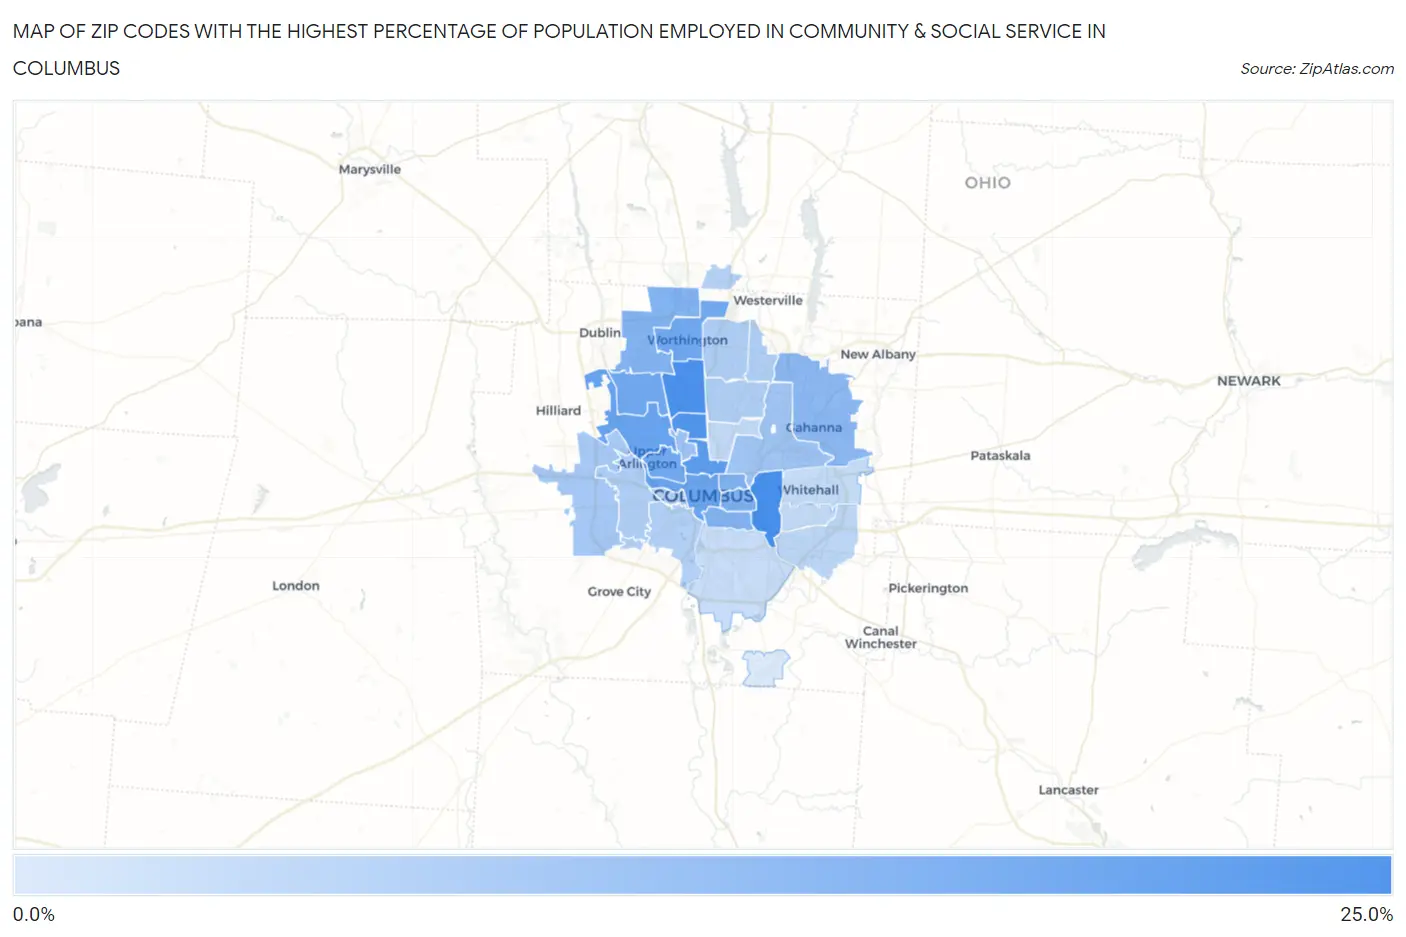
Map of Zip Codes with the Highest Percentage of Population Employed in Community & Social Service in Columbus

0.0%
25.0%
Zip Codes with the Highest Percentage of Population Employed in Community & Social Service  in Columbus Map

Zip Codes with the Highest Percentage of Population Employed in Community & Social Service in Columbus, OH

Zip Code % Employed vs State vs National
1.4320921.2%10.0%(+11.3)#2811.2%(+9.99)#1,660
2.4321420.5%10.0%(+10.5)#3411.2%(+9.27)#1,874
3.4320219.6%10.0%(+9.62)#4111.2%(+8.36)#2,171
4.4320118.2%10.0%(+8.19)#5411.2%(+6.94)#2,745
5.4322116.8%10.0%(+6.85)#7211.2%(+5.59)#3,512
6.4321516.2%10.0%(+6.26)#8111.2%(+5.00)#3,894
7.4321215.6%10.0%(+5.64)#9511.2%(+4.38)#4,415
8.4308515.6%10.0%(+5.61)#9611.2%(+4.35)#4,434
9.4322015.5%10.0%(+5.55)#9811.2%(+4.29)#4,497
10.4320313.8%10.0%(+3.88)#13711.2%(+2.62)#6,291
11.4320513.7%10.0%(+3.72)#14111.2%(+2.46)#6,506
12.4320613.5%10.0%(+3.57)#14411.2%(+2.31)#6,716
13.4323513.4%10.0%(+3.49)#14711.2%(+2.23)#6,829
14.4323012.4%10.0%(+2.44)#20211.2%(+1.18)#8,599
15.4321010.3%10.0%(+0.334)#34811.2%(-0.925)#13,389
16.432199.7%10.0%(-0.254)#39111.2%(-1.51)#14,862
17.432289.2%10.0%(-0.781)#44911.2%(-2.04)#16,339
18.432298.1%10.0%(-1.87)#56311.2%(-3.13)#19,327
19.432048.0%10.0%(-1.91)#56811.2%(-3.17)#19,445
20.432228.0%10.0%(-1.94)#57511.2%(-3.20)#19,504
21.432317.9%10.0%(-2.06)#59911.2%(-3.32)#19,900
22.432247.7%10.0%(-2.28)#61611.2%(-3.54)#20,454
23.432237.5%10.0%(-2.43)#63311.2%(-3.69)#20,818
24.432407.2%10.0%(-2.75)#67511.2%(-4.01)#21,621
25.432326.5%10.0%(-3.47)#76511.2%(-4.73)#23,298
26.432275.7%10.0%(-4.26)#85211.2%(-5.52)#24,982
27.432115.7%10.0%(-4.30)#85511.2%(-5.56)#25,063
28.432135.3%10.0%(-4.62)#88411.2%(-5.88)#25,657
29.432075.1%10.0%(-4.84)#90011.2%(-6.10)#26,011
30.432172.7%10.0%(-7.25)#1,04211.2%(-8.51)#28,765

Common Questions

What are the Top 10 Zip Codes with the Highest Percentage of Population Employed in Community & Social Service in Columbus, OH?
Top 10 Zip Codes with the Highest Percentage of Population Employed in Community & Social Service in Columbus, OH are:
#1
21.2%
#2
20.5%
#3
19.6%
#4
18.2%
#5
16.8%
#6
16.2%
#7
15.6%
#8
15.6%
#9
15.5%
#10
13.8%
What zip code has the Highest Percentage of Population Employed in Community & Social Service in Columbus, OH?
43209 has the Highest Percentage of Population Employed in Community & Social Service in Columbus, OH with 21.2%.
What is the Percentage of Population Employed in Community & Social Service in Columbus, OH?
Percentage of Population Employed in Community & Social Service in Columbus is 11.1%.
What is the Percentage of Population Employed in Community & Social Service in Ohio?
Percentage of Population Employed in Community & Social Service in Ohio is 10.0%.
What is the Percentage of Population Employed in Community & Social Service in the United States?
Percentage of Population Employed in Community & Social Service in the United States is 11.2%.