Zip Codes with the Highest Percentage of Population Employed in Office & Administration in Columbus, OH
RELATED REPORTS & OPTIONS
Office & Administration
Columbus
Compare Zip Codes
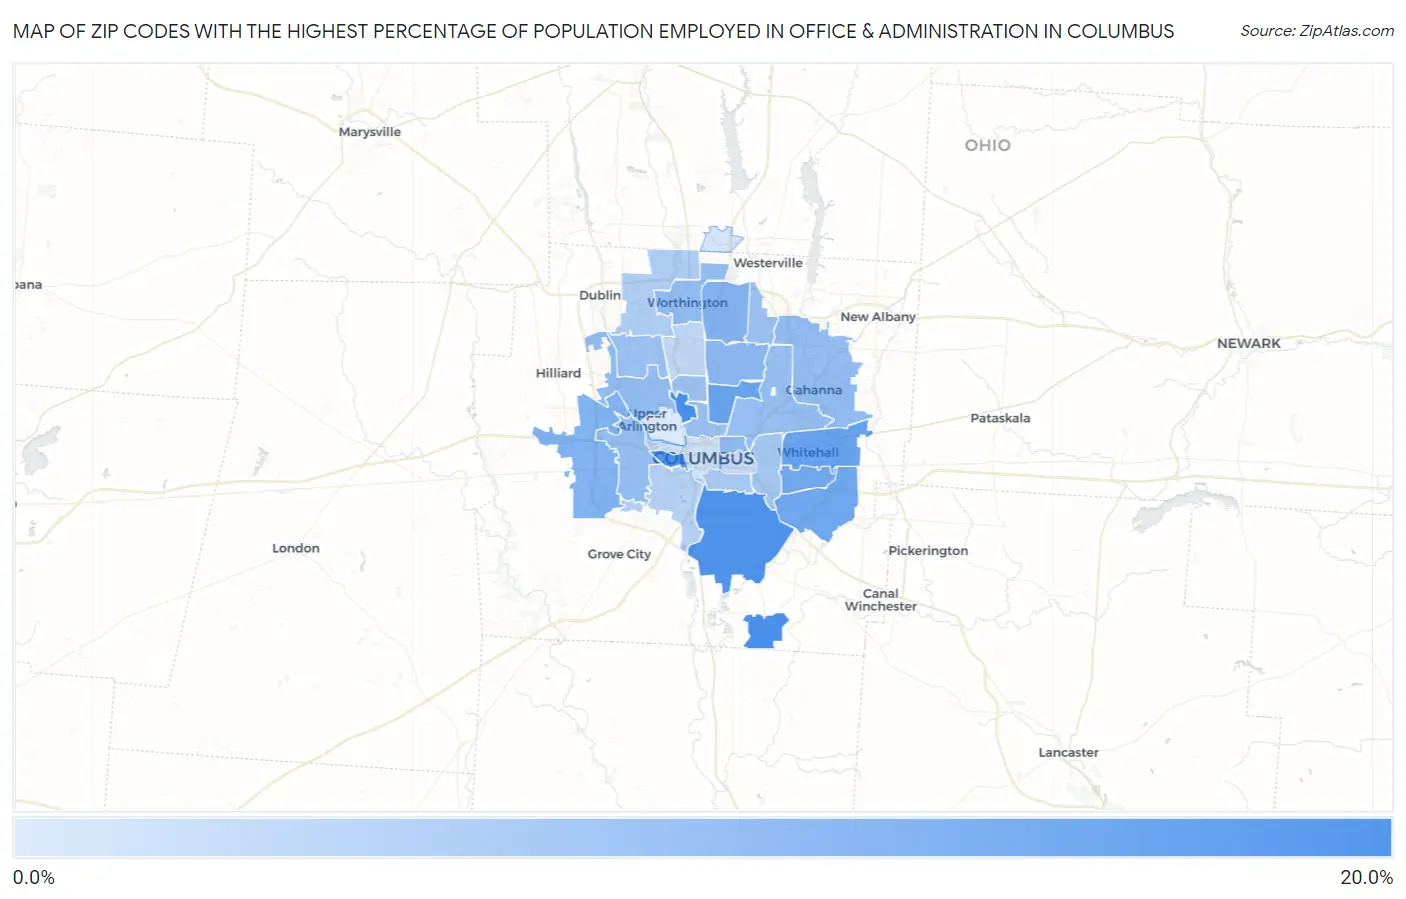
Map of Zip Codes with the Highest Percentage of Population Employed in Office & Administration in Columbus
0.0%
20.0%
Zip Codes with the Highest Percentage of Population Employed in Office & Administration in Columbus, OH
| Zip Code | % Employed | vs State | vs National | |
| 1. | 43210 | 17.5% | 11.3%(+6.28)#97 | 10.9%(+6.68)#2,565 |
| 2. | 43217 | 17.3% | 11.3%(+6.09)#101 | 10.9%(+6.49)#2,676 |
| 3. | 43222 | 17.0% | 11.3%(+5.71)#111 | 10.9%(+6.11)#2,864 |
| 4. | 43207 | 16.9% | 11.3%(+5.67)#112 | 10.9%(+6.07)#2,885 |
| 5. | 43213 | 15.1% | 11.3%(+3.80)#181 | 10.9%(+4.20)#4,478 |
| 6. | 43211 | 14.9% | 11.3%(+3.60)#188 | 10.9%(+4.00)#4,766 |
| 7. | 43232 | 14.3% | 11.3%(+3.05)#213 | 10.9%(+3.45)#5,504 |
| 8. | 43227 | 14.1% | 11.3%(+2.81)#235 | 10.9%(+3.21)#5,901 |
| 9. | 43228 | 13.1% | 11.3%(+1.86)#305 | 10.9%(+2.26)#7,784 |
| 10. | 43229 | 12.9% | 11.3%(+1.60)#329 | 10.9%(+2.00)#8,415 |
| 11. | 43224 | 12.2% | 11.3%(+0.976)#389 | 10.9%(+1.38)#10,050 |
| 12. | 43203 | 11.8% | 11.3%(+0.520)#443 | 10.9%(+0.920)#11,409 |
| 13. | 43230 | 11.7% | 11.3%(+0.441)#449 | 10.9%(+0.841)#11,627 |
| 14. | 43085 | 11.6% | 11.3%(+0.390)#462 | 10.9%(+0.790)#11,803 |
| 15. | 43221 | 11.6% | 11.3%(+0.327)#473 | 10.9%(+0.727)#11,991 |
| 16. | 43204 | 11.5% | 11.3%(+0.218)#482 | 10.9%(+0.618)#12,311 |
| 17. | 43219 | 11.4% | 11.3%(+0.094)#498 | 10.9%(+0.494)#12,718 |
| 18. | 43220 | 11.2% | 11.3%(-0.078)#539 | 10.9%(+0.322)#13,277 |
| 19. | 43202 | 11.0% | 11.3%(-0.249)#558 | 10.9%(+0.151)#13,816 |
| 20. | 43201 | 10.9% | 11.3%(-0.337)#567 | 10.9%(+0.063)#14,101 |
| 21. | 43231 | 10.9% | 11.3%(-0.394)#580 | 10.9%(+0.006)#14,323 |
| 22. | 43209 | 10.3% | 11.3%(-0.981)#660 | 10.9%(-0.581)#16,246 |
| 23. | 43206 | 9.9% | 11.3%(-1.40)#712 | 10.9%(-0.999)#17,587 |
| 24. | 43235 | 9.6% | 11.3%(-1.62)#732 | 10.9%(-1.22)#18,296 |
| 25. | 43223 | 9.1% | 11.3%(-2.19)#790 | 10.9%(-1.79)#20,083 |
| 26. | 43214 | 8.2% | 11.3%(-3.06)#874 | 10.9%(-2.66)#22,546 |
| 27. | 43205 | 7.7% | 11.3%(-3.53)#905 | 10.9%(-3.13)#23,644 |
| 28. | 43215 | 7.2% | 11.3%(-4.01)#946 | 10.9%(-3.61)#24,729 |
| 29. | 43240 | 6.8% | 11.3%(-4.48)#984 | 10.9%(-4.08)#25,606 |
| 30. | 43212 | 6.2% | 11.3%(-5.07)#1,008 | 10.9%(-4.67)#26,569 |
1
Common Questions
What are the Top 10 Zip Codes with the Highest Percentage of Population Employed in Office & Administration in Columbus, OH?
Top 10 Zip Codes with the Highest Percentage of Population Employed in Office & Administration in Columbus, OH are:
What zip code has the Highest Percentage of Population Employed in Office & Administration in Columbus, OH?
43210 has the Highest Percentage of Population Employed in Office & Administration in Columbus, OH with 17.5%.
What is the Percentage of Population Employed in Office & Administration in Columbus, OH?
Percentage of Population Employed in Office & Administration in Columbus is 11.9%.
What is the Percentage of Population Employed in Office & Administration in Ohio?
Percentage of Population Employed in Office & Administration in Ohio is 11.3%.
What is the Percentage of Population Employed in Office & Administration in the United States?
Percentage of Population Employed in Office & Administration in the United States is 10.9%.