Zip Codes with the Highest Percentage of Not-for-profit Organizations in Columbus, OH

RELATED REPORTS & OPTIONS

Not-for-profit Organizations
Population
Families and Households
Female Fertility
Female Fertility (Unmarried)
Race (Community Size)
Race (Percentage)
Ancestry (Community Size)
AfghanAfricanAlbanianAlsatianAmericanApacheArabArgentineanArmenianAustralianAustrianBahamianBangladeshiBarbadianBasqueBelgianBelizeanBhutaneseBlackfeetBolivianBrazilianBritishBritish West IndianBulgarianBurmeseCambodianCanadianCape VerdeanCarpatho RusynCelticCentral AmericanCentral American IndianCherokeeChileanChippewaChoctawColombianCosta RicanCreeCreekCroatianCrowCubanCzechCzechoslovakianDanishDelawareDominicanDutchDutch West IndianEastern EuropeanEcuadorianEgyptianEnglishEstonianEthiopianEuropeanFilipinoFinnishFrenchFrench American IndianFrench CanadianGermanGerman RussianGhanaianGreekGuamanian / ChamorroGuatemalanGuyaneseHaitianHonduranHungarianIcelanderIndian (Asian)IndonesianInupiatIranianIraqiIrishIroquoisIsraeliItalianJamaicanJapaneseJordanianKenyanKoreanLaotianLatvianLebaneseLiberianLithuanianLumbeeLuxembourgerMacedonianMalaysianMalteseMexicanMexican American IndianMongolianMoroccanNative HawaiianNavajoNew ZealanderNicaraguanNigerianNorthern EuropeanNorwegianPakistaniPalestinianPanamanianParaguayanPennsylvania GermanPeruvianPolishPortuguesePuerto RicanRomanianRussianSalvadoranSamoanScandinavianScotch-IrishScottishSeminoleSenegaleseSerbianSierra LeoneanSiouxSlavicSlovakSloveneSomaliSouth AfricanSouth AmericanSouth American IndianSpaniardSpanishSri LankanSubsaharan AfricanSudaneseSwedishSwissSyrianThaiTrinidadian and TobagonianTurkishUgandanUkrainianUruguayanVenezuelanVietnameseWelshWest IndianYaquiYugoslavianZimbabwean
Ancestry (Percentage)
AfghanAfricanAlbanianAlsatianAmericanApacheArabArgentineanArmenianAustralianAustrianBahamianBangladeshiBarbadianBasqueBelgianBelizeanBhutaneseBlackfeetBolivianBrazilianBritishBritish West IndianBulgarianBurmeseCambodianCanadianCape VerdeanCarpatho RusynCelticCentral AmericanCentral American IndianCherokeeChileanChippewaChoctawColombianCosta RicanCreeCreekCroatianCrowCubanCzechCzechoslovakianDanishDelawareDominicanDutchDutch West IndianEastern EuropeanEcuadorianEgyptianEnglishEstonianEthiopianEuropeanFilipinoFinnishFrenchFrench American IndianFrench CanadianGermanGerman RussianGhanaianGreekGuamanian / ChamorroGuatemalanGuyaneseHaitianHonduranHungarianIcelanderIndian (Asian)IndonesianInupiatIranianIraqiIrishIroquoisIsraeliItalianJamaicanJapaneseJordanianKenyanKoreanLaotianLatvianLebaneseLiberianLithuanianLumbeeLuxembourgerMacedonianMalaysianMalteseMexicanMexican American IndianMongolianMoroccanNative HawaiianNavajoNew ZealanderNicaraguanNigerianNorthern EuropeanNorwegianPakistaniPalestinianPanamanianParaguayanPennsylvania GermanPeruvianPolishPortuguesePuerto RicanRomanianRussianSalvadoranSamoanScandinavianScotch-IrishScottishSeminoleSenegaleseSerbianSierra LeoneanSiouxSlavicSlovakSloveneSomaliSouth AfricanSouth AmericanSouth American IndianSpaniardSpanishSri LankanSubsaharan AfricanSudaneseSwedishSwissSyrianThaiTrinidadian and TobagonianTurkishUgandanUkrainianUruguayanVenezuelanVietnameseWelshWest IndianYaquiYugoslavianZimbabwean
Immigrant Origin (Total)
AfghanistanAfricaAlbaniaArgentinaArmeniaAsiaAustraliaBahamasBangladeshBarbadosBelarusBelgiumBelizeBosnia and HerzegovinaBrazilBulgariaBurma / MyanmarCambodiaCameroonCanadaCaribbeanCentral AmericaChileChinaColombiaCongoCosta RicaCubaCzechoslovakiaDominican RepublicEastern AfricaEastern AsiaEastern EuropeEcuadorEgyptEl SalvadorEnglandEritreaEthiopiaEuropeFranceGermanyGhanaGreeceGuatemalaGuyanaHaitiHondurasHong KongHungaryIndiaIndonesiaIranIraqIrelandIsraelItalyJamaicaJapanJordanKazakhstanKenyaKoreaKuwaitLaosLatin AmericaLatviaLebanonLiberiaLithuaniaMalaysiaMexicoMiddle AfricaMoroccoNepalNetherlandsNigeriaNorth MacedoniaNorthern AfricaNorthern EuropeOceaniaPakistanPanamaPeruPhilippinesPolandRomaniaRussiaSaudi ArabiaScotlandSenegalSerbiaSierra LeoneSingaporeSomaliaSouth AfricaSouth AmericaSouth Central AsiaSouth Eastern AsiaSouthern EuropeSpainSri LankaSudanSwitzerlandSyriaTaiwanThailandTrinidad and TobagoTurkeyUgandaUkraineUruguayUzbekistanVenezuelaVietnamWestern AfricaWestern AsiaWestern EuropeZaireZimbabwe
Immigrant Origin (Percentage)
AfghanistanAfricaAlbaniaArgentinaArmeniaAsiaAustraliaBahamasBangladeshBarbadosBelarusBelgiumBelizeBosnia and HerzegovinaBrazilBulgariaBurma / MyanmarCambodiaCameroonCanadaCaribbeanCentral AmericaChileChinaColombiaCongoCosta RicaCubaCzechoslovakiaDominican RepublicEastern AfricaEastern AsiaEastern EuropeEcuadorEgyptEl SalvadorEnglandEritreaEthiopiaEuropeFranceGermanyGhanaGreeceGuatemalaGuyanaHaitiHondurasHong KongHungaryIndiaIndonesiaIranIraqIrelandIsraelItalyJamaicaJapanJordanKazakhstanKenyaKoreaKuwaitLaosLatin AmericaLatviaLebanonLiberiaLithuaniaMalaysiaMexicoMiddle AfricaMoroccoNepalNetherlandsNigeriaNorth MacedoniaNorthern AfricaNorthern EuropeOceaniaPakistanPanamaPeruPhilippinesPolandRomaniaRussiaSaudi ArabiaScotlandSenegalSerbiaSierra LeoneSingaporeSomaliaSouth AfricaSouth AmericaSouth Central AsiaSouth Eastern AsiaSouthern EuropeSpainSri LankaSudanSwitzerlandSyriaTaiwanThailandTrinidad and TobagoTurkeyUgandaUkraineUruguayUzbekistanVenezuelaVietnamWestern AfricaWestern AsiaWestern EuropeZaireZimbabwe
Income
Income (Families)
Income (Households)
Poverty
Poverty (Families)
Unemployment
Employment Occupations
Employment Industries
Employer Class
Commute Time
Commute Means
School Enrollment
Education by Degree Field
Occupancy
Finances
Physical Characteristics
Columbus
Compare Zip Codes
Comparison Subject

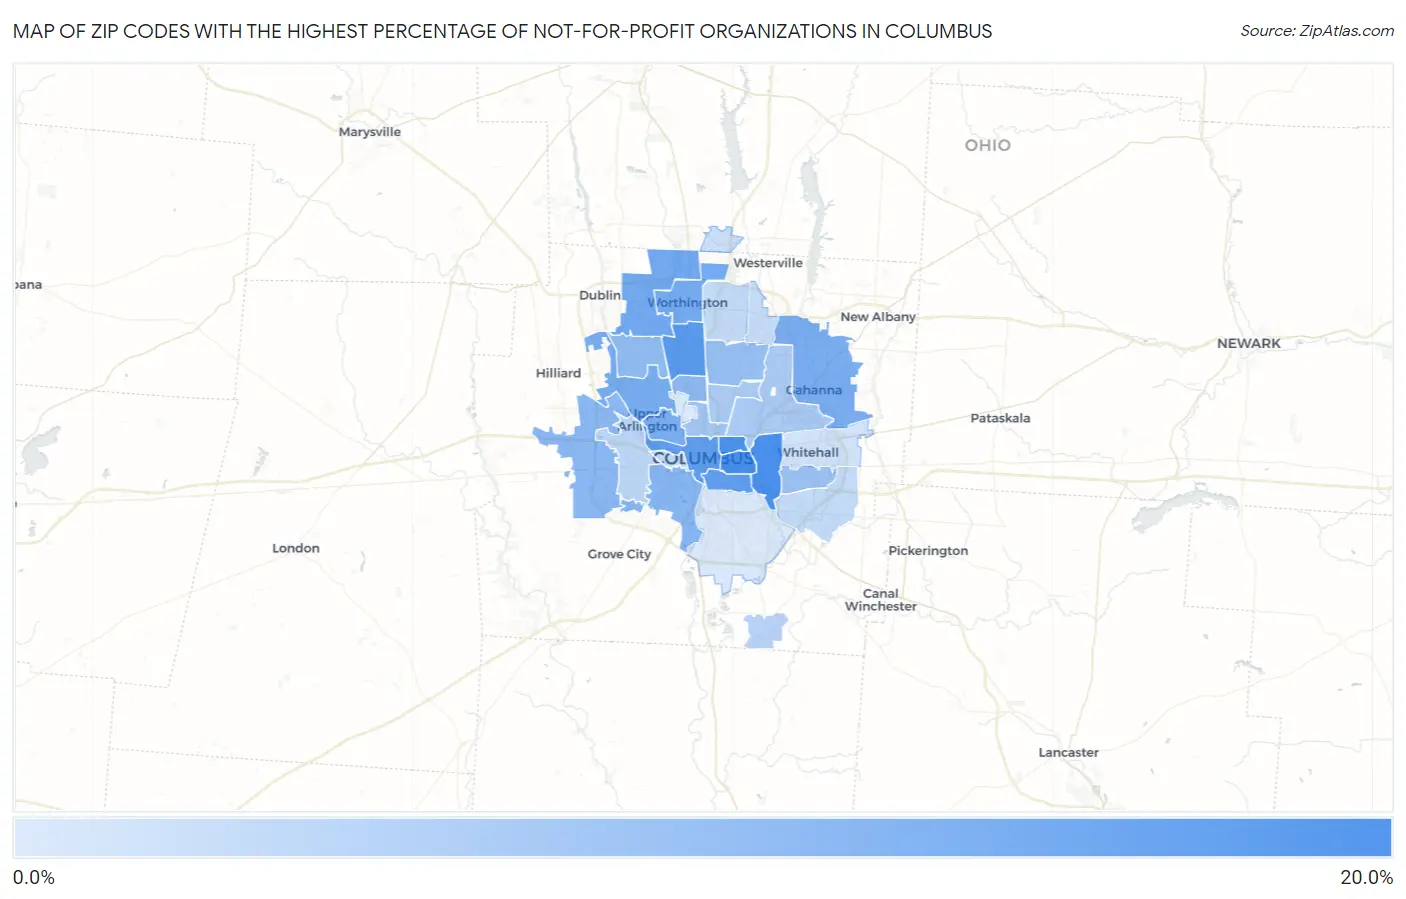
Map of Zip Codes with the Highest Percentage of Not-for-profit Organizations in Columbus

0.0%
20.0%
Zip Codes with the Highest Percentage of Not-for-profit Organizations in Columbus Map

Zip Codes with the Highest Percentage of Not-for-profit Organizations in Columbus, OH

Zip Code % Employed in Not-for-profit vs State vs National
1.4320515.1%9.8%(+5.26)#868.4%(+6.66)#2,881
2.4320914.9%9.8%(+5.09)#908.4%(+6.49)#2,978
3.4320314.8%9.8%(+4.93)#938.4%(+6.33)#3,076
4.4321414.1%9.8%(+4.25)#1058.4%(+5.65)#3,509
5.4320613.5%9.8%(+3.63)#1318.4%(+5.03)#4,030
6.4321513.4%9.8%(+3.54)#1458.4%(+4.94)#4,131
7.4323512.3%9.8%(+2.41)#2078.4%(+3.81)#5,309
8.4308512.0%9.8%(+2.17)#2248.4%(+3.58)#5,614
9.4322111.9%9.8%(+2.01)#2278.4%(+3.41)#5,819
10.4323011.8%9.8%(+1.96)#2328.4%(+3.36)#5,886
11.4321211.7%9.8%(+1.85)#2418.4%(+3.26)#6,043
12.4322310.8%9.8%(+0.963)#3108.4%(+2.37)#7,359
13.4322810.7%9.8%(+0.820)#3228.4%(+2.22)#7,622
14.4320210.3%9.8%(+0.485)#3438.4%(+1.89)#8,237
15.4322010.3%9.8%(+0.466)#3498.4%(+1.87)#8,270
16.432249.9%9.8%(+0.019)#3958.4%(+1.42)#9,168
17.432279.6%9.8%(-0.237)#4228.4%(+1.17)#9,710
18.432019.1%9.8%(-0.764)#4918.4%(+0.638)#10,880
19.432198.7%9.8%(-1.17)#5308.4%(+0.235)#11,856
20.432118.5%9.8%(-1.38)#5578.4%(+0.021)#12,373
21.432177.7%9.8%(-2.12)#6398.4%(-0.718)#14,397
22.432047.5%9.8%(-2.35)#6708.4%(-0.948)#15,075
23.432227.1%9.8%(-2.76)#7158.4%(-1.35)#16,303
24.432327.0%9.8%(-2.80)#7208.4%(-1.40)#16,434
25.432297.0%9.8%(-2.84)#7268.4%(-1.44)#16,563
26.432316.8%9.8%(-3.09)#7568.4%(-1.68)#17,277
27.432406.6%9.8%(-3.22)#7688.4%(-1.82)#17,666
28.432136.2%9.8%(-3.67)#8188.4%(-2.26)#18,950
29.432075.5%9.8%(-4.31)#8868.4%(-2.91)#20,842
30.432105.4%9.8%(-4.40)#8968.4%(-3.00)#21,087

Common Questions

What are the Top 10 Zip Codes with the Highest Percentage of Not-for-profit Organizations in Columbus, OH?
Top 10 Zip Codes with the Highest Percentage of Not-for-profit Organizations in Columbus, OH are:
#1
15.1%
#2
14.9%
#3
14.8%
#4
14.1%
#5
13.5%
#6
13.4%
#7
12.3%
#8
12.0%
#9
11.9%
#10
11.8%
What zip code has the Highest Percentage of Not-for-profit Organizations in Columbus, OH?
43205 has the Highest Percentage of Not-for-profit Organizations in Columbus, OH with 15.1%.
What is the Percentage of Not-for-profit Organizations in Columbus, OH?
Percentage of Not-for-profit Organizations in Columbus is 9.7%.
What is the Percentage of Not-for-profit Organizations in Ohio?
Percentage of Not-for-profit Organizations in Ohio is 9.8%.
What is the Percentage of Not-for-profit Organizations in the United States?
Percentage of Not-for-profit Organizations in the United States is 8.4%.