Zip Codes with the Highest Percentage of Population Employed in Health Diagnosing & Treating in Mansfield, OH
RELATED REPORTS & OPTIONS
Health Diagnosing & Treating
Mansfield
Compare Zip Codes
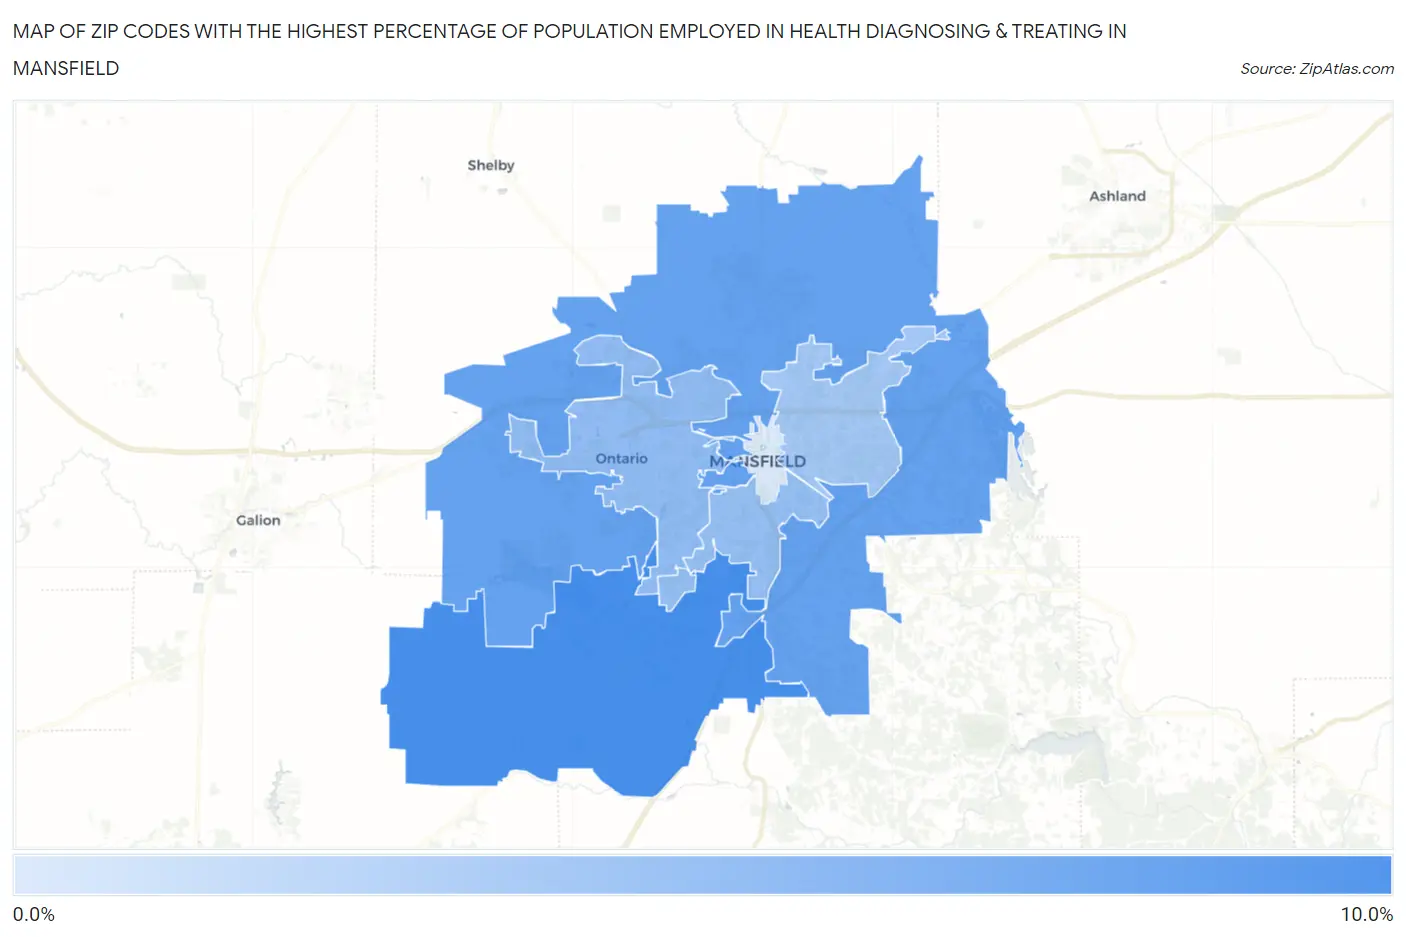
Map of Zip Codes with the Highest Percentage of Population Employed in Health Diagnosing & Treating in Mansfield
0.0%
10.0%
Zip Codes with the Highest Percentage of Population Employed in Health Diagnosing & Treating in Mansfield, OH
| Zip Code | % Employed | vs State | vs National | |
| 1. | 44904 | 9.7% | 7.2%(+2.56)#182 | 6.2%(+3.47)#4,238 |
| 2. | 44903 | 8.0% | 7.2%(+0.830)#338 | 6.2%(+1.74)#7,550 |
| 3. | 44906 | 5.5% | 7.2%(-1.69)#683 | 6.2%(-0.781)#15,919 |
| 4. | 44907 | 5.2% | 7.2%(-1.95)#718 | 6.2%(-1.04)#16,918 |
| 5. | 44905 | 4.4% | 7.2%(-2.75)#837 | 6.2%(-1.84)#19,987 |
| 6. | 44902 | 1.1% | 7.2%(-6.01)#1,066 | 6.2%(-5.10)#27,656 |
1
Common Questions
What are the Top 5 Zip Codes with the Highest Percentage of Population Employed in Health Diagnosing & Treating in Mansfield, OH?
Top 5 Zip Codes with the Highest Percentage of Population Employed in Health Diagnosing & Treating in Mansfield, OH are:
What zip code has the Highest Percentage of Population Employed in Health Diagnosing & Treating in Mansfield, OH?
44904 has the Highest Percentage of Population Employed in Health Diagnosing & Treating in Mansfield, OH with 9.7%.
What is the Percentage of Population Employed in Health Diagnosing & Treating in Mansfield, OH?
Percentage of Population Employed in Health Diagnosing & Treating in Mansfield is 5.3%.
What is the Percentage of Population Employed in Health Diagnosing & Treating in Ohio?
Percentage of Population Employed in Health Diagnosing & Treating in Ohio is 7.2%.
What is the Percentage of Population Employed in Health Diagnosing & Treating in the United States?
Percentage of Population Employed in Health Diagnosing & Treating in the United States is 6.2%.