Zip Codes with the Highest Percentage of Population Employed in Security & Protection in Columbus, OH
RELATED REPORTS & OPTIONS
Security & Protection
Columbus
Compare Zip Codes
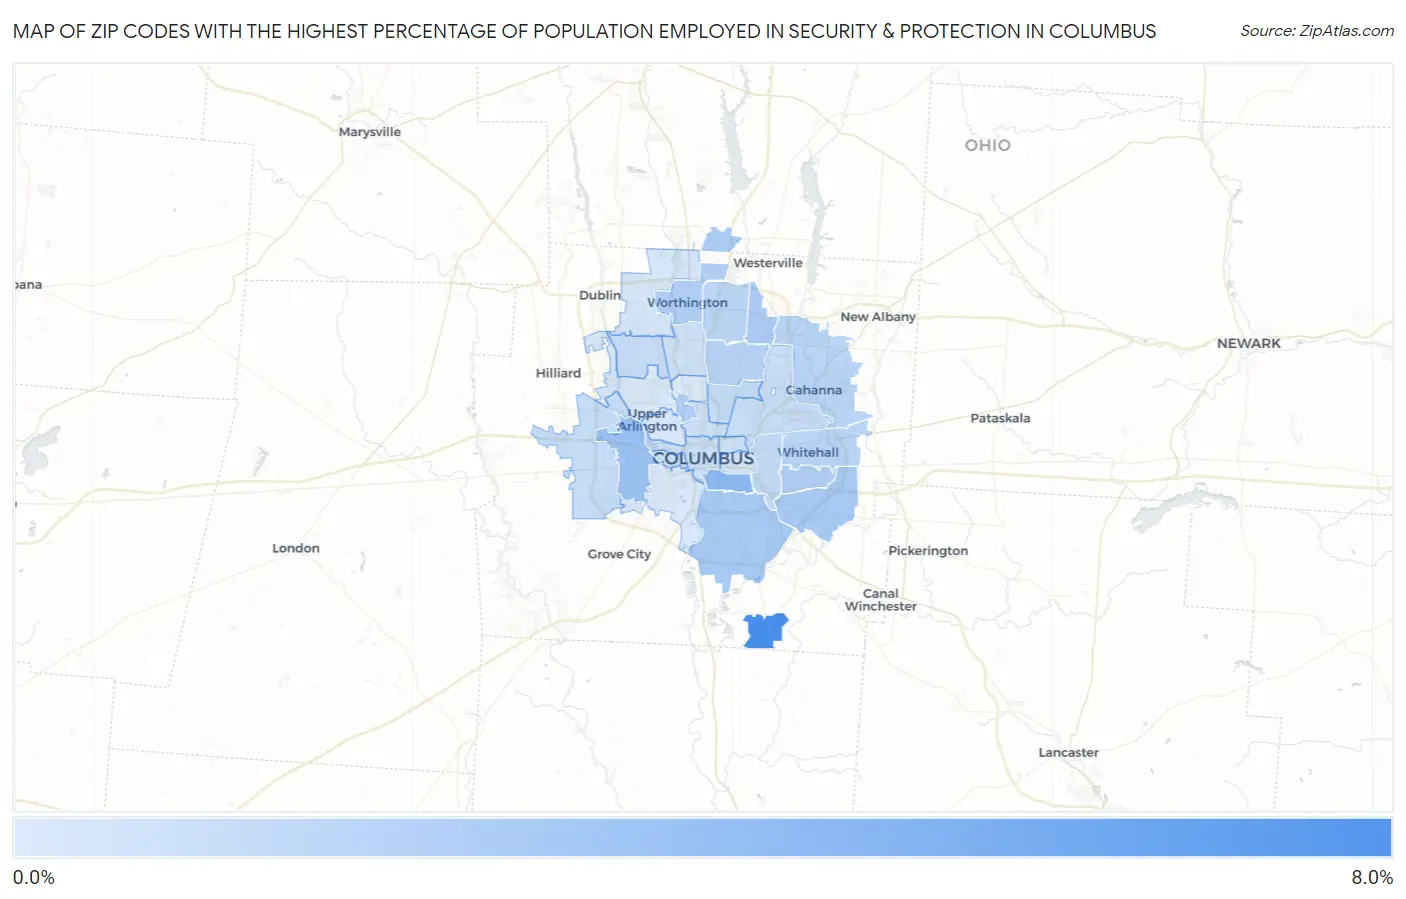
Map of Zip Codes with the Highest Percentage of Population Employed in Security & Protection in Columbus
0.0%
8.0%
Zip Codes with the Highest Percentage of Population Employed in Security & Protection in Columbus, OH
| Zip Code | % Employed | vs State | vs National | |
| 1. | 43217 | 6.1% | 1.9%(+4.17)#34 | 2.1%(+3.93)#2,027 |
| 2. | 43206 | 3.4% | 1.9%(+1.53)#133 | 2.1%(+1.29)#5,823 |
| 3. | 43204 | 2.8% | 1.9%(+0.939)#216 | 2.1%(+0.701)#7,871 |
| 4. | 43207 | 2.3% | 1.9%(+0.437)#309 | 2.1%(+0.199)#10,340 |
| 5. | 43232 | 2.3% | 1.9%(+0.420)#315 | 2.1%(+0.182)#10,457 |
| 6. | 43240 | 2.2% | 1.9%(+0.282)#351 | 2.1%(+0.044)#11,305 |
| 7. | 43231 | 2.2% | 1.9%(+0.267)#356 | 2.1%(+0.029)#11,384 |
| 8. | 43210 | 2.1% | 1.9%(+0.189)#375 | 2.1%(-0.050)#11,913 |
| 9. | 43227 | 2.0% | 1.9%(+0.106)#397 | 2.1%(-0.132)#12,454 |
| 10. | 43085 | 2.0% | 1.9%(+0.053)#417 | 2.1%(-0.185)#12,795 |
| 11. | 43224 | 1.8% | 1.9%(-0.147)#468 | 2.1%(-0.386)#14,206 |
| 12. | 43213 | 1.6% | 1.9%(-0.261)#504 | 2.1%(-0.499)#15,037 |
| 13. | 43230 | 1.6% | 1.9%(-0.277)#512 | 2.1%(-0.515)#15,162 |
| 14. | 43229 | 1.6% | 1.9%(-0.297)#516 | 2.1%(-0.535)#15,310 |
| 15. | 43209 | 1.4% | 1.9%(-0.547)#607 | 2.1%(-0.785)#17,224 |
| 16. | 43228 | 1.3% | 1.9%(-0.644)#635 | 2.1%(-0.883)#18,023 |
| 17. | 43211 | 1.2% | 1.9%(-0.696)#663 | 2.1%(-0.935)#18,400 |
| 18. | 43219 | 1.2% | 1.9%(-0.740)#675 | 2.1%(-0.978)#18,746 |
| 19. | 43220 | 1.1% | 1.9%(-0.776)#691 | 2.1%(-1.01)#19,030 |
| 20. | 43215 | 1.0% | 1.9%(-0.905)#737 | 2.1%(-1.14)#19,993 |
| 21. | 43203 | 0.94% | 1.9%(-0.965)#756 | 2.1%(-1.20)#20,471 |
| 22. | 43222 | 0.93% | 1.9%(-0.982)#762 | 2.1%(-1.22)#20,593 |
| 23. | 43201 | 0.92% | 1.9%(-0.991)#767 | 2.1%(-1.23)#20,656 |
| 24. | 43214 | 0.91% | 1.9%(-0.997)#768 | 2.1%(-1.24)#20,706 |
| 25. | 43205 | 0.65% | 1.9%(-1.26)#836 | 2.1%(-1.49)#22,357 |
| 26. | 43235 | 0.61% | 1.9%(-1.30)#852 | 2.1%(-1.54)#22,590 |
| 27. | 43212 | 0.57% | 1.9%(-1.34)#858 | 2.1%(-1.58)#22,850 |
| 28. | 43221 | 0.56% | 1.9%(-1.35)#859 | 2.1%(-1.58)#22,865 |
| 29. | 43223 | 0.49% | 1.9%(-1.42)#875 | 2.1%(-1.66)#23,298 |
| 30. | 43202 | 0.38% | 1.9%(-1.53)#895 | 2.1%(-1.77)#23,823 |
1
Common Questions
What are the Top 10 Zip Codes with the Highest Percentage of Population Employed in Security & Protection in Columbus, OH?
Top 10 Zip Codes with the Highest Percentage of Population Employed in Security & Protection in Columbus, OH are:
What zip code has the Highest Percentage of Population Employed in Security & Protection in Columbus, OH?
43217 has the Highest Percentage of Population Employed in Security & Protection in Columbus, OH with 6.1%.
What is the Percentage of Population Employed in Security & Protection in Columbus, OH?
Percentage of Population Employed in Security & Protection in Columbus is 1.7%.
What is the Percentage of Population Employed in Security & Protection in Ohio?
Percentage of Population Employed in Security & Protection in Ohio is 1.9%.
What is the Percentage of Population Employed in Security & Protection in the United States?
Percentage of Population Employed in Security & Protection in the United States is 2.1%.